Embed Size (px)
Citation preview
Ageonomics™ Understanding and managing the risks of our ageing workforce
1
Aon | AGRC Ageonomics™ Practice
Proprietary & Confidential
How are American’s Aging?
• 70% - country is “a little or not at
all prepared”
• 10%- feel seniors are “very
prepared” to age well
• 59%- country is heading in the
wrong direction
Intro
Aon | AGRC Ageonomics™ Practice
Proprietary & Confidential
Top Worries About Aging
• 72% - Losing their memory
• 71% - Being in poor health
• 71% - Not having financial
security
Intro
Aon | AGRC Ageonomics™ Practice
Proprietary & Confidential
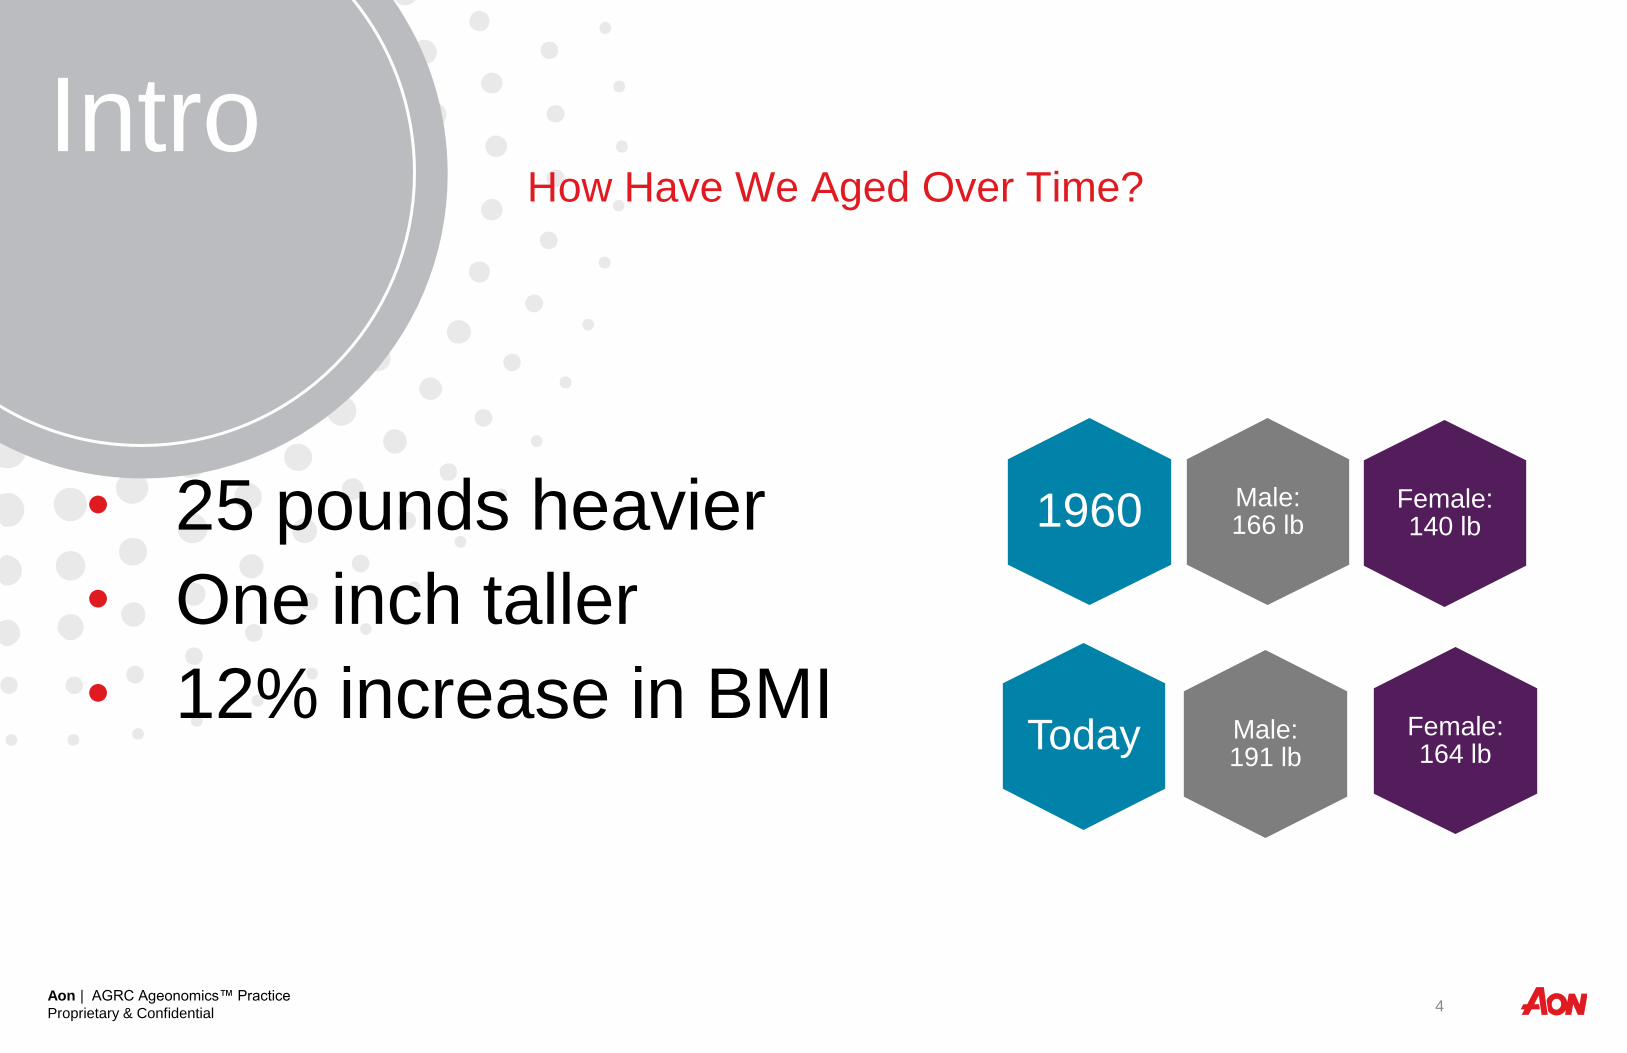
How Have We Aged Over Time?
• 25 pounds heavier
• One inch taller
• 12% increase in BMI
Intro
4
Male: 166 lb 1960 Female:
140 lb
Today Female: 164 lb
Male: 191 lb
The Changing Workforce
Risk Managers Must Grapple With the Changes in Our Population Health
Workforce
Observations
from Aon’s
Database
5
Aon | AGRC Ageonomics™ Practice
Proprietary & Confidential
Broad
Traits
Managing Life
Chronic
Disease
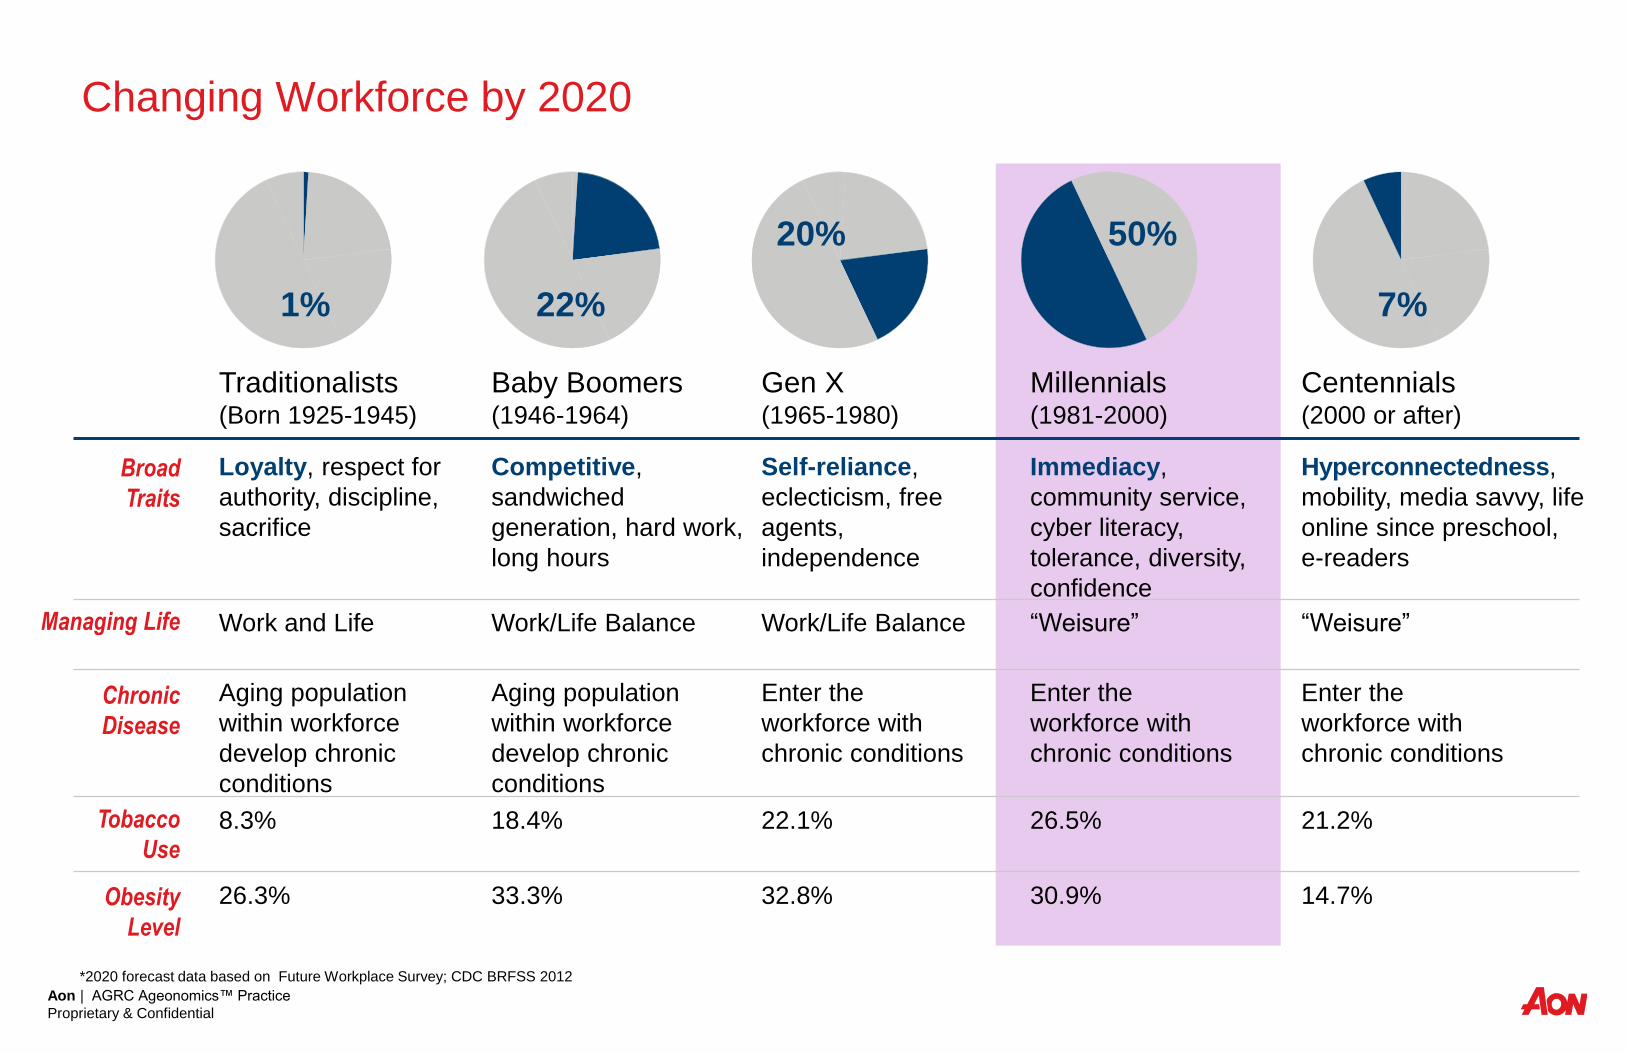
Changing Workforce by 2020
*2020 forecast data based on Future Workplace Survey; CDC BRFSS 2012
Tobacco
Use
Obesity
Level
Traditionalists (Born 1925-1945)
Loyalty, respect for
authority, discipline,
sacrifice
Work and Life
Aging population
within workforce
develop chronic
conditions
1%
Baby Boomers (1946-1964)
Competitive,
sandwiched
generation, hard work,
long hours
Work/Life Balance
Aging population
within workforce
develop chronic
conditions
22%
Gen X (1965-1980)
Self-reliance,
eclecticism, free
agents,
independence
Work/Life Balance
Enter the
workforce with
chronic conditions
20%
Millennials (1981-2000)
Immediacy,
community service,
cyber literacy,
tolerance, diversity,
confidence
“Weisure”
Enter the
workforce with
chronic conditions
50%
Centennials (2000 or after)
Hyperconnectedness,
mobility, media savvy, life
online since preschool,
e-readers
“Weisure”
Enter the
workforce with
chronic conditions
7%
8.3% 18.4% 22.1% 26.5% 21.2%
26.3% 33.3% 32.8% 30.9% 14.7%
Aon | AGRC Ageonomics™ Practice
Proprietary & Confidential
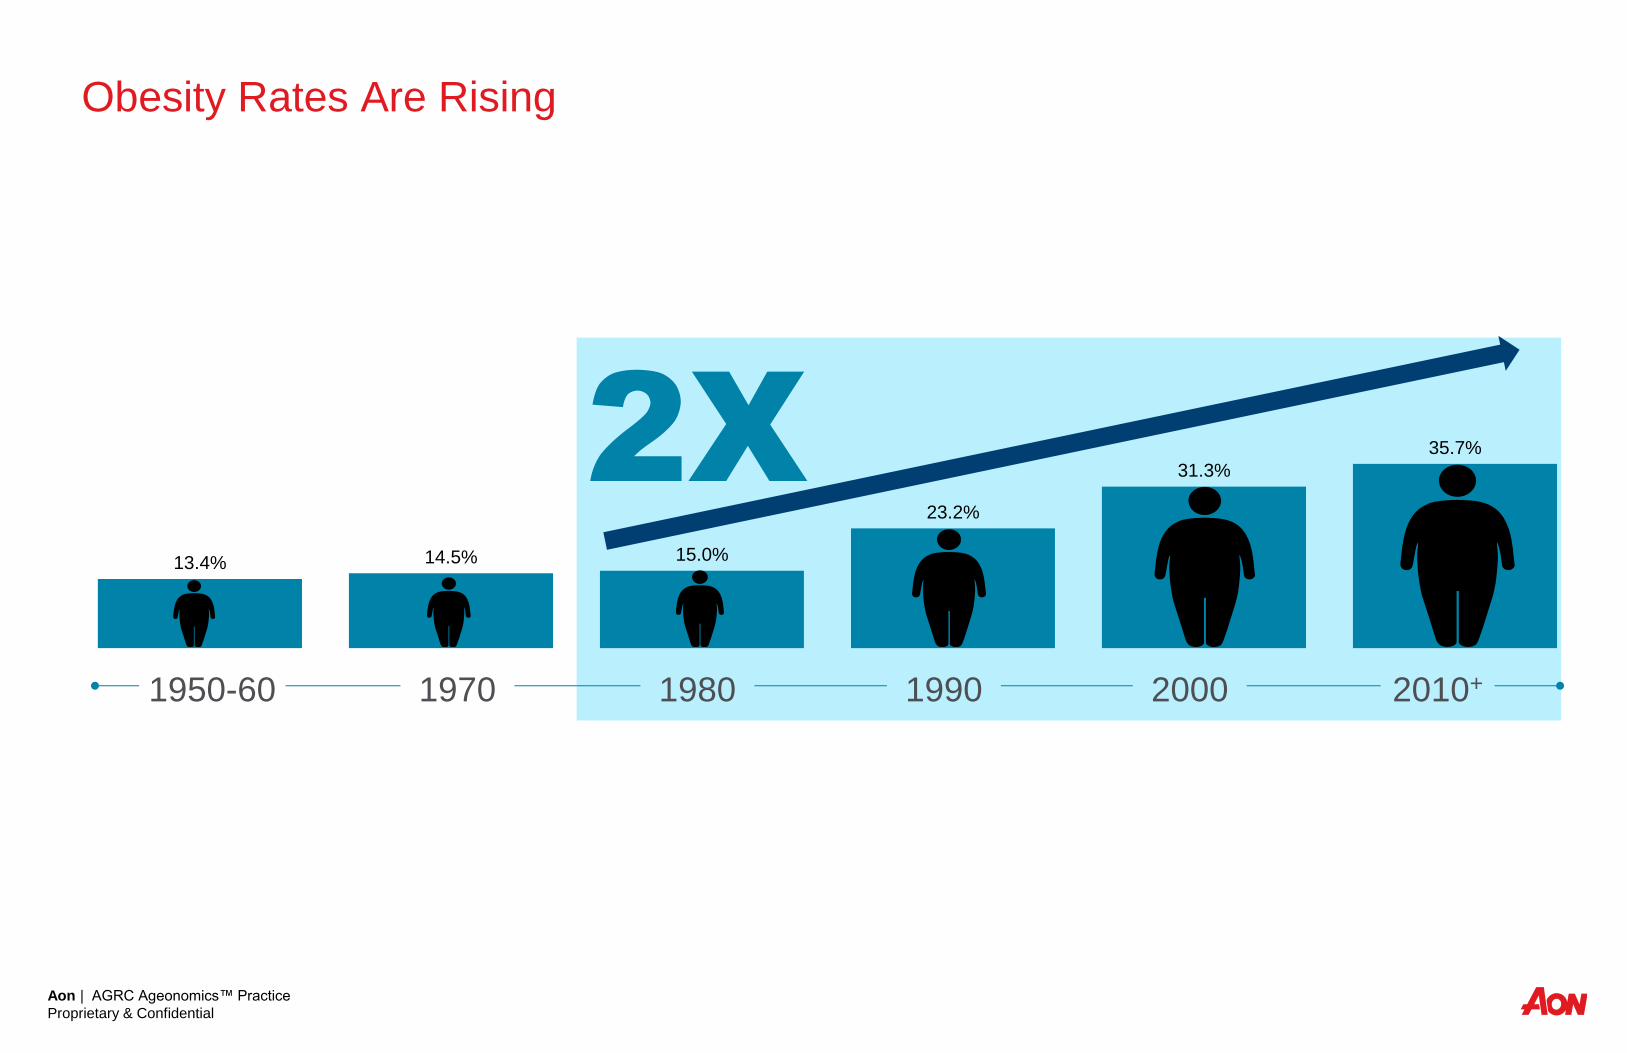
2X 13.4% 14.5% 15.0%
23.2%
31.3%
35.7%
1950-60 1970 1980 1990 2000 2010+
Obesity Rates Are Rising
Aon | AGRC Ageonomics™ Practice
Proprietary & Confidential
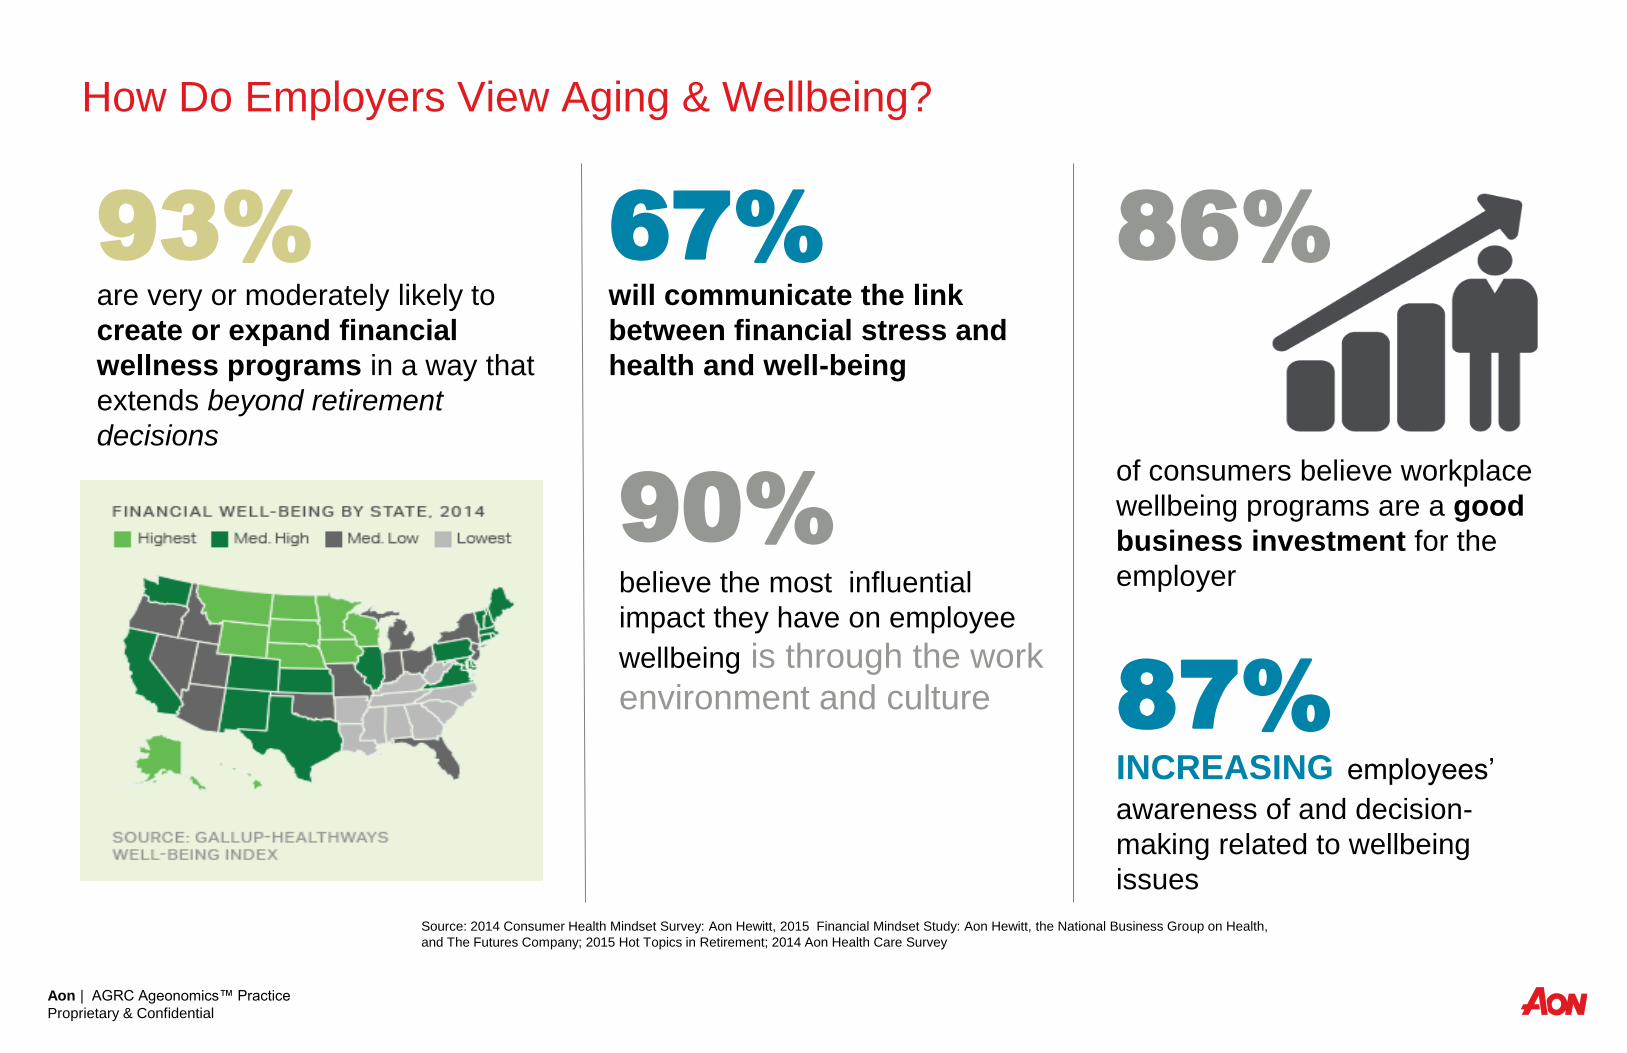
How Do Employers View Aging & Wellbeing?
Source: 2014 Consumer Health Mindset Survey: Aon Hewitt, 2015 Financial Mindset Study: Aon Hewitt, the National Business Group on Health,
and The Futures Company; 2015 Hot Topics in Retirement; 2014 Aon Health Care Survey
will communicate the link
between financial stress and
health and well-being
67% are very or moderately likely to
create or expand financial
wellness programs in a way that
extends beyond retirement
decisions
93% 86%
of consumers believe workplace
wellbeing programs are a good
business investment for the
employer
87% INCREASING employees’
awareness of and decision-
making related to wellbeing
issues
90% believe the most influential
impact they have on employee
wellbeing is through the work
environment and culture
Aon | AGRC Ageonomics™ Practice
Proprietary & Confidential
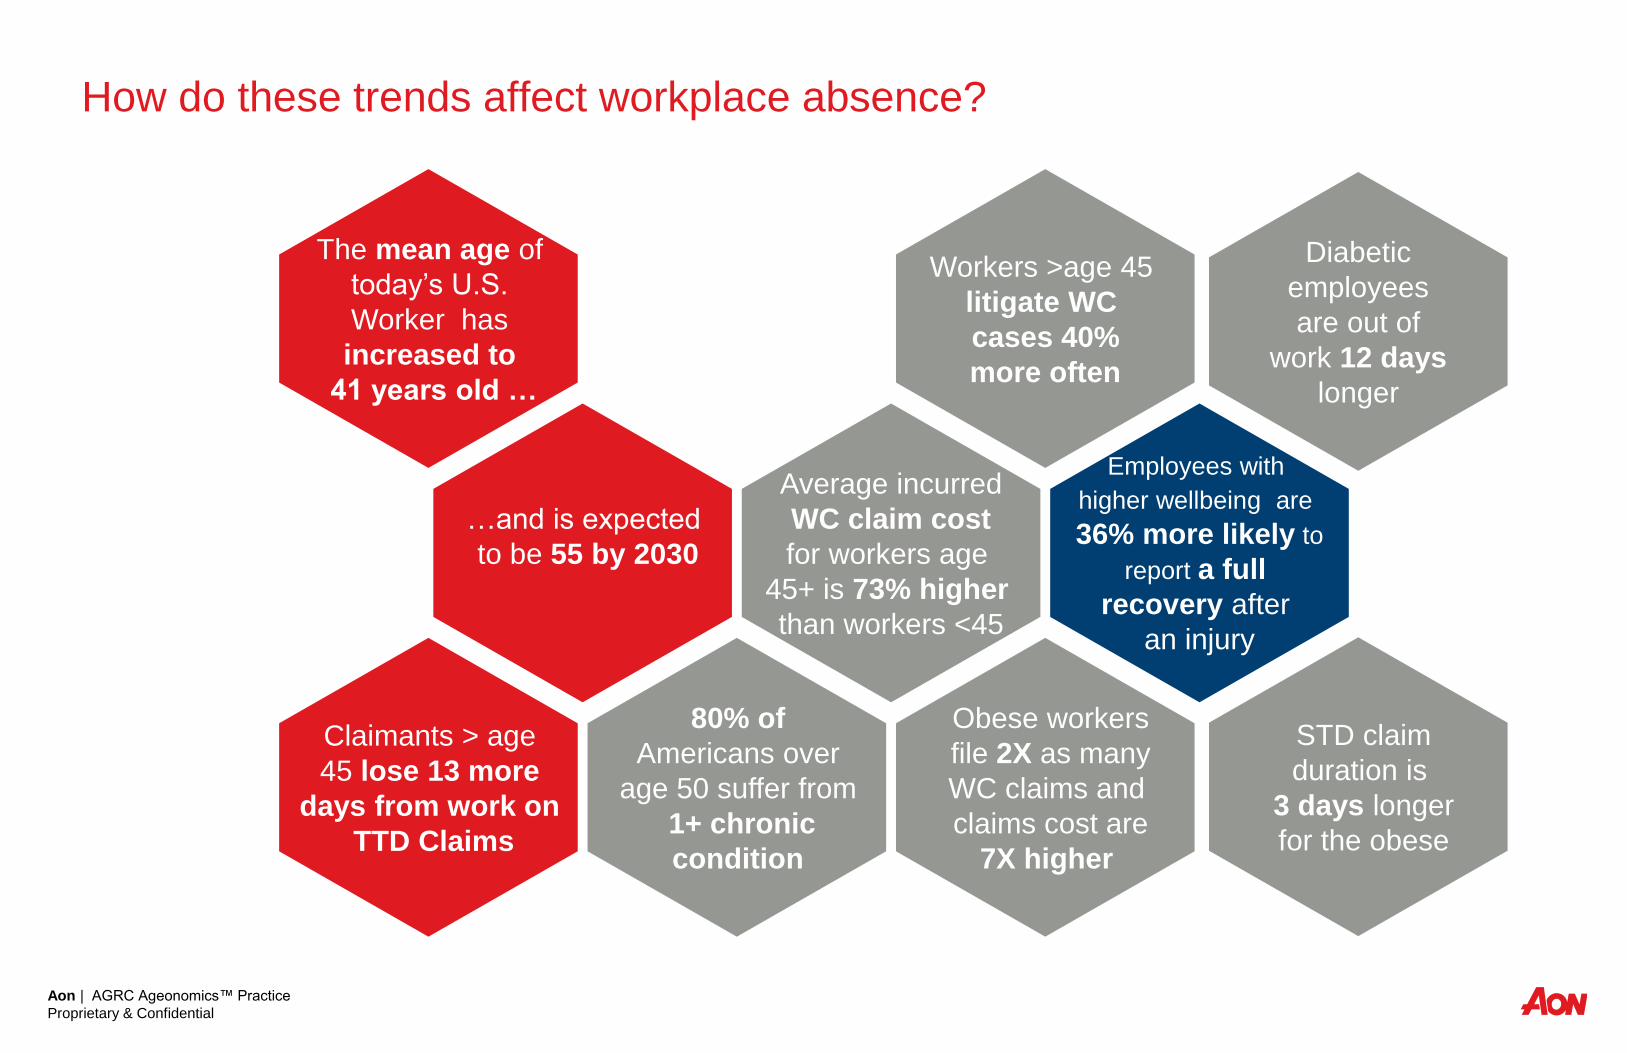
How do these trends affect workplace absence?
…and is expected
to be 55 by 2030
Average incurred
WC claim cost
for workers age
45+ is 73% higher
than workers <45
Employees with
higher wellbeing are
36% more likely to
report a full
recovery after
an injury
The mean age of
today’s U.S.
Worker has
increased to
41 years old …
Workers >age 45
litigate WC
cases 40%
more often
Claimants > age
45 lose 13 more
days from work on
TTD Claims
80% of
Americans over
age 50 suffer from
1+ chronic
condition
Obese workers
file 2X as many
WC claims and
claims cost are
7X higher
STD claim
duration is
3 days longer
for the obese
Diabetic
employees
are out of
work 12 days
longer
Aon | AGRC Ageonomics™ Practice
Proprietary & Confidential
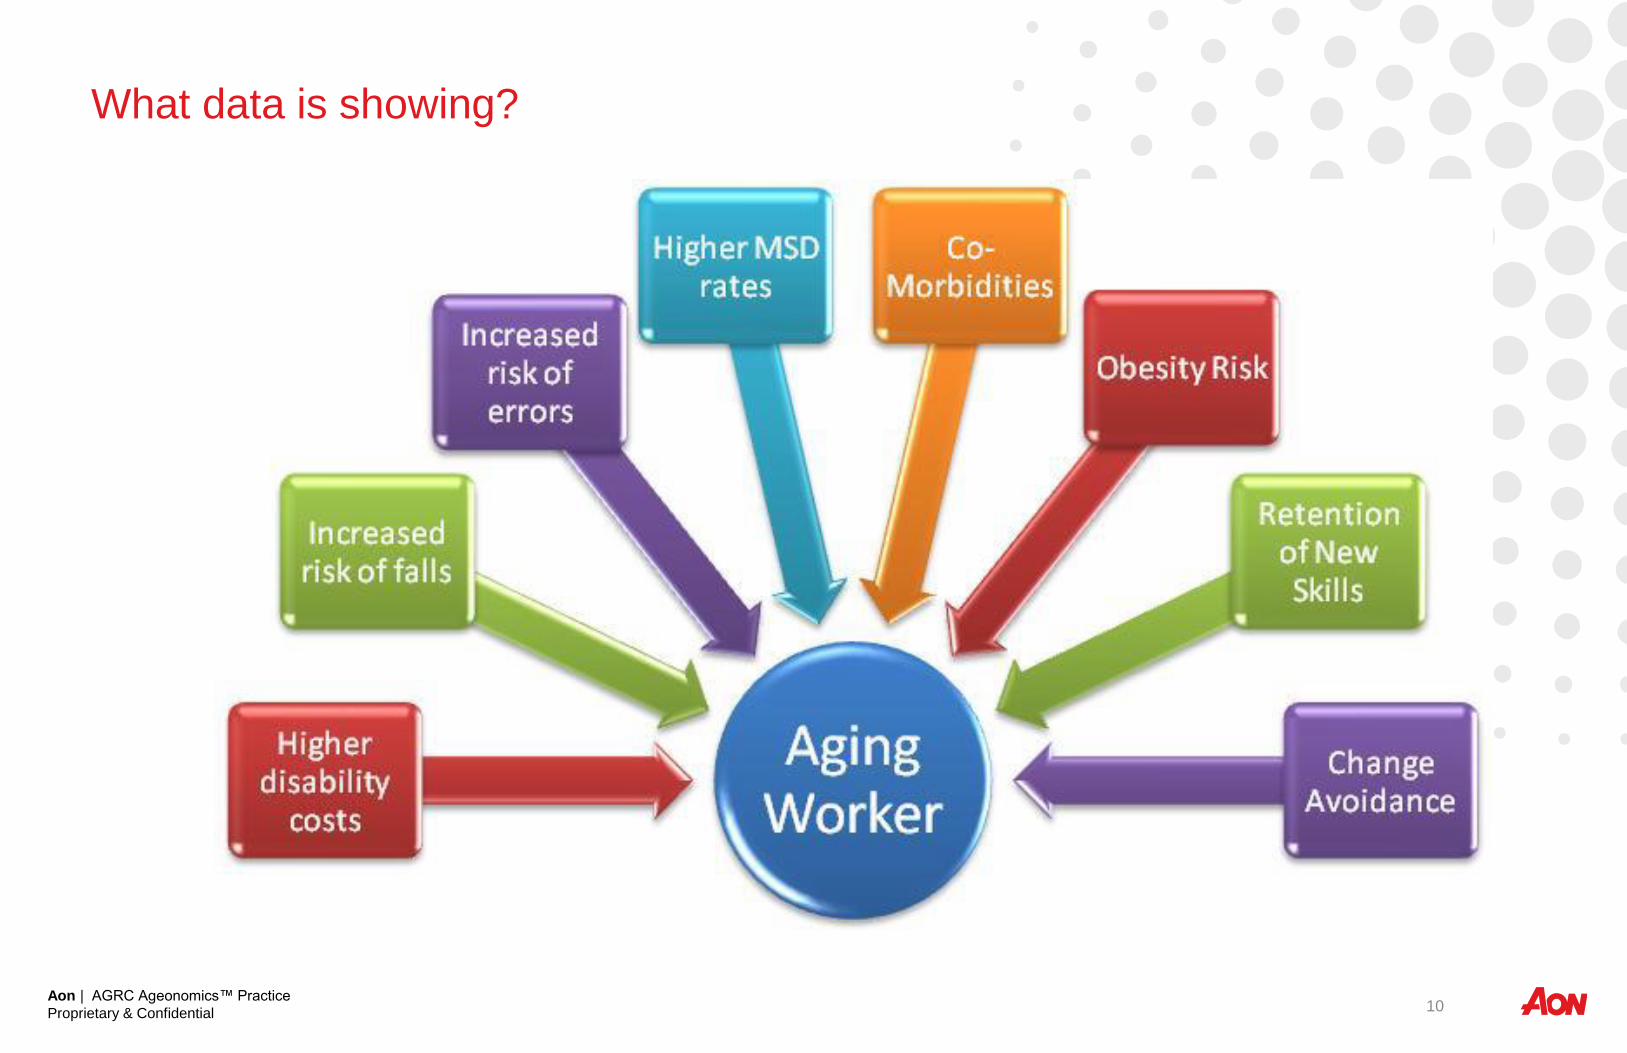
What data is showing?
10
Aon | AGRC Ageonomics™ Practice
Proprietary & Confidential
Ideas to Manage this Risk
How to Manage
This Risk
11
Aon | AGRC Ageonomics™ Practice
Proprietary & Confidential
Leadership Interviews Program Inventory Review &
Assessment
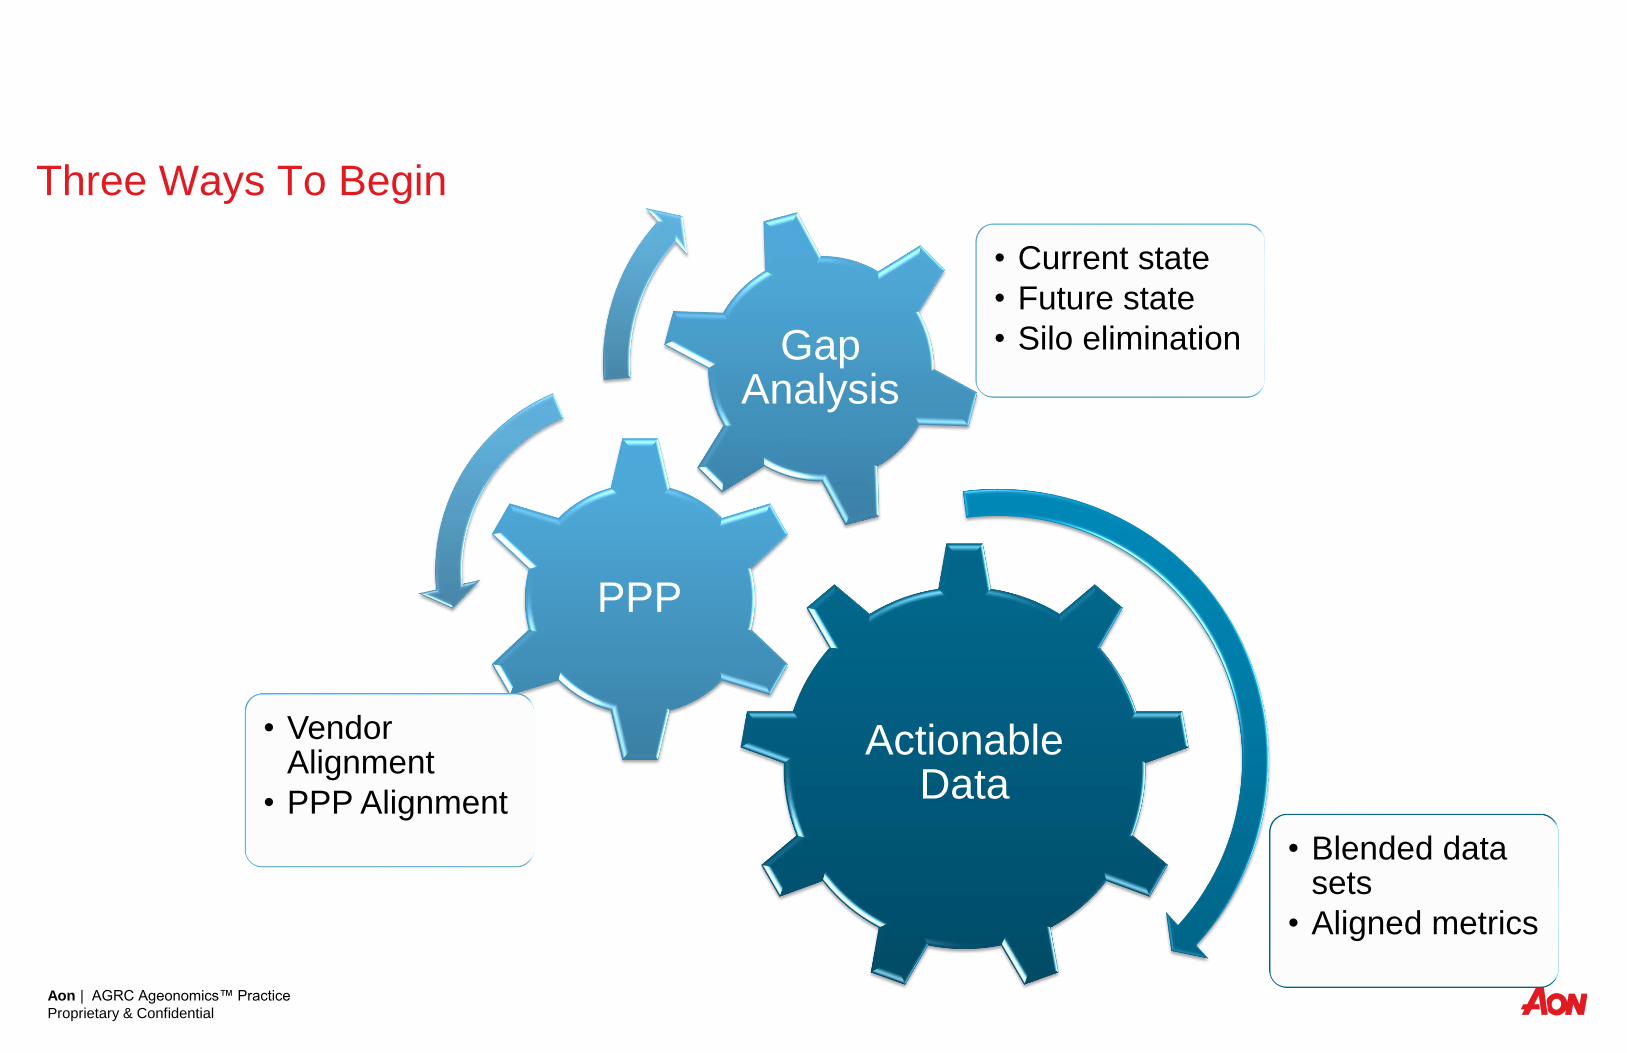
Three Ways To Begin
Actionable Data
• Blended data sets
• Aligned metrics
PPP
• Vendor Alignment
• PPP Alignment
Gap Analysis
• Current state
• Future state
• Silo elimination
Aon | AGRC Ageonomics™ Practice
Proprietary & Confidential
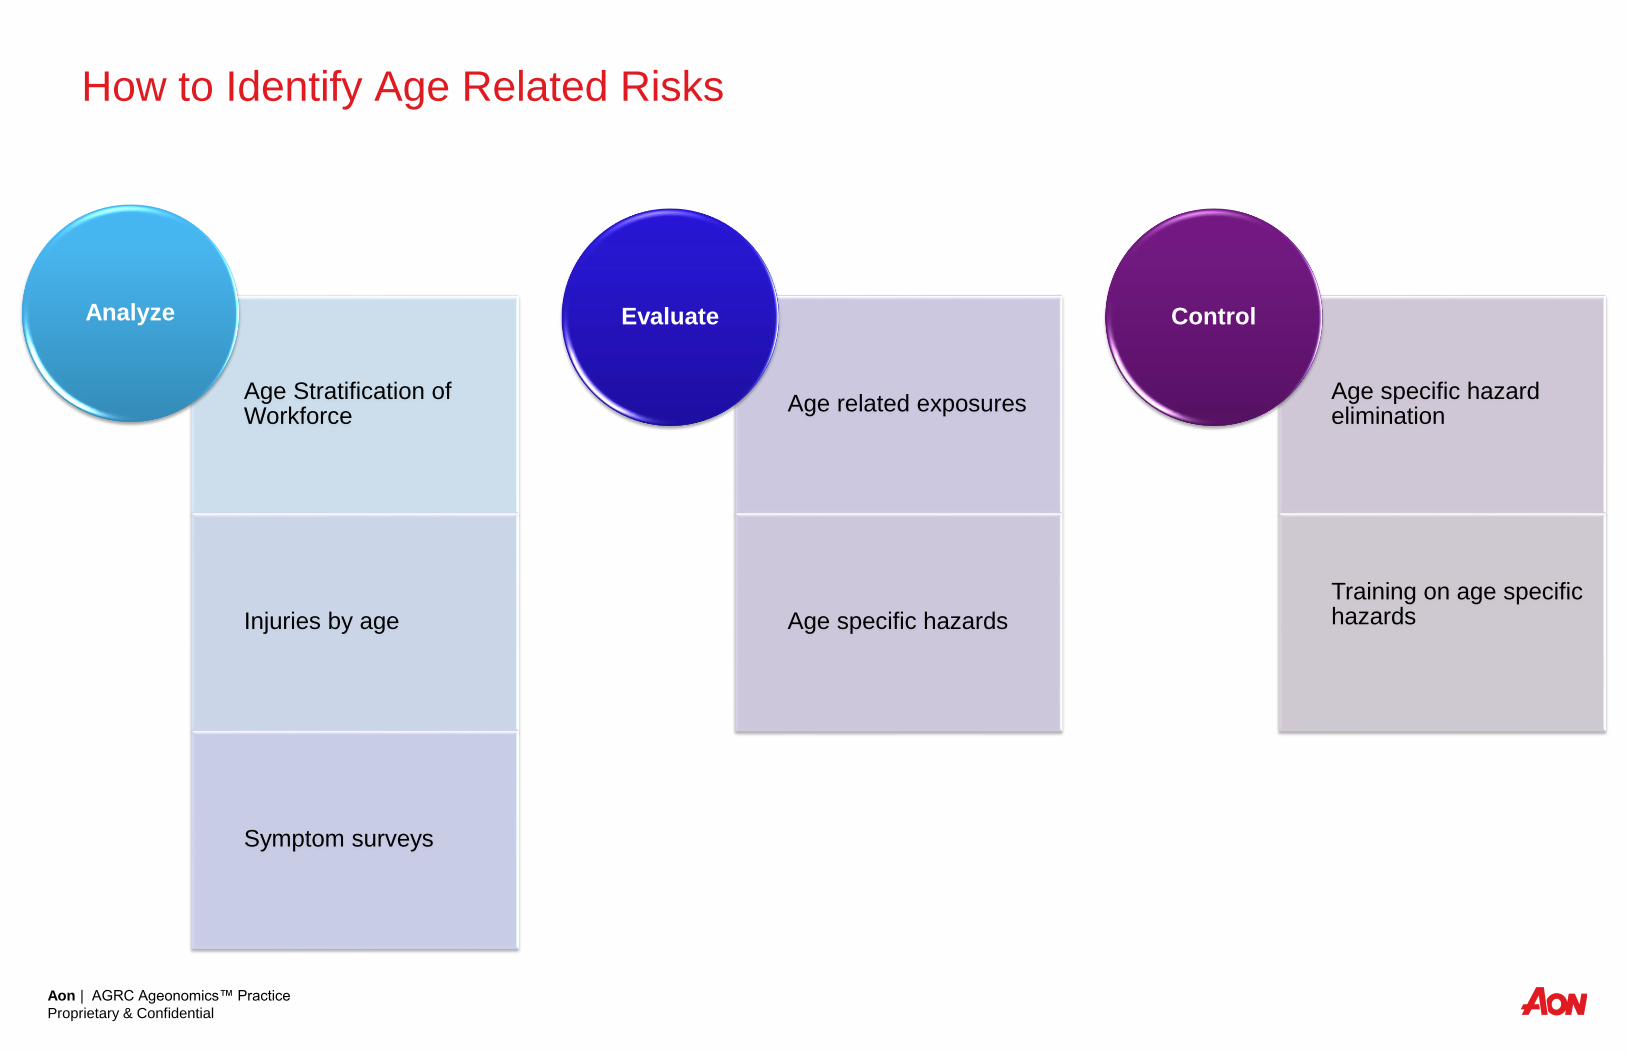
How to Identify Age Related Risks
Age Stratification of Workforce
Injuries by age
Symptom surveys
Analyze
Age related exposures
Age specific hazards
Evaluate
Age specific hazard elimination
Training on age specific hazards
Control
Aon | AGRC Ageonomics™ Practice
Proprietary & Confidential
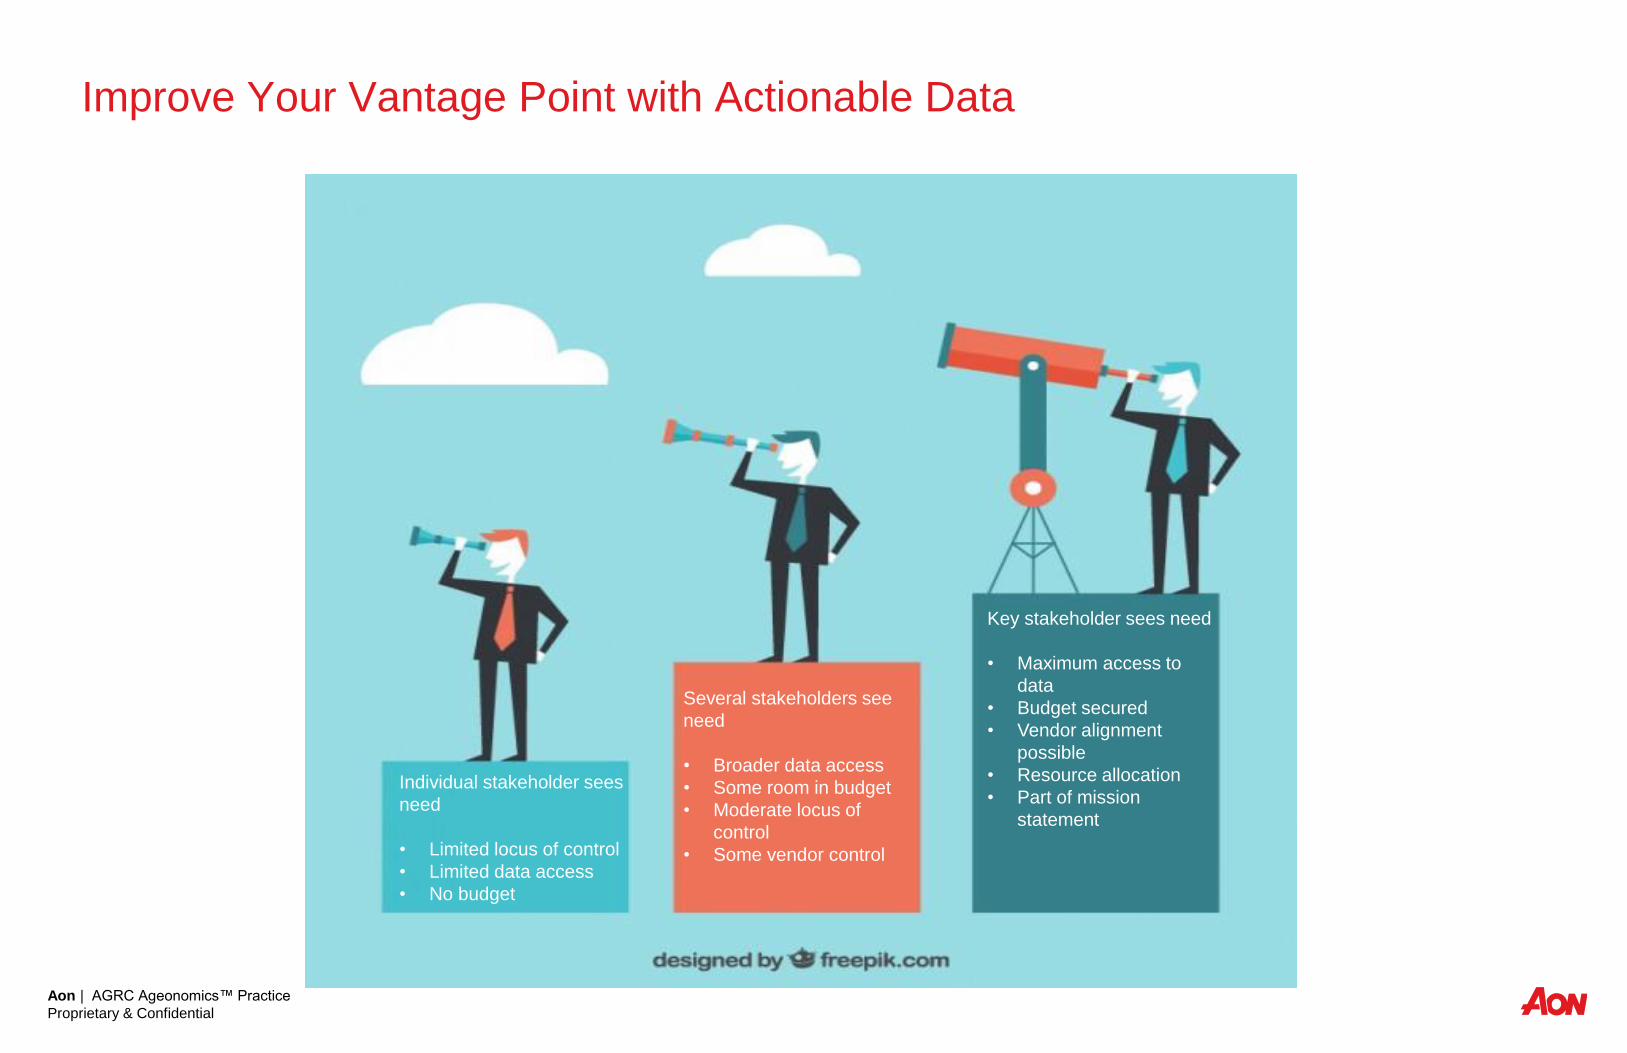
Improve Your Vantage Point with Actionable Data
Individual stakeholder sees
need
• Limited locus of control
• Limited data access
• No budget
Several stakeholders see
need
• Broader data access
• Some room in budget
• Moderate locus of
control
• Some vendor control
Key stakeholder sees need
• Maximum access to
data
• Budget secured
• Vendor alignment
possible
• Resource allocation
• Part of mission
statement
Aon | AGRC Ageonomics™ Practice
Proprietary & Confidential
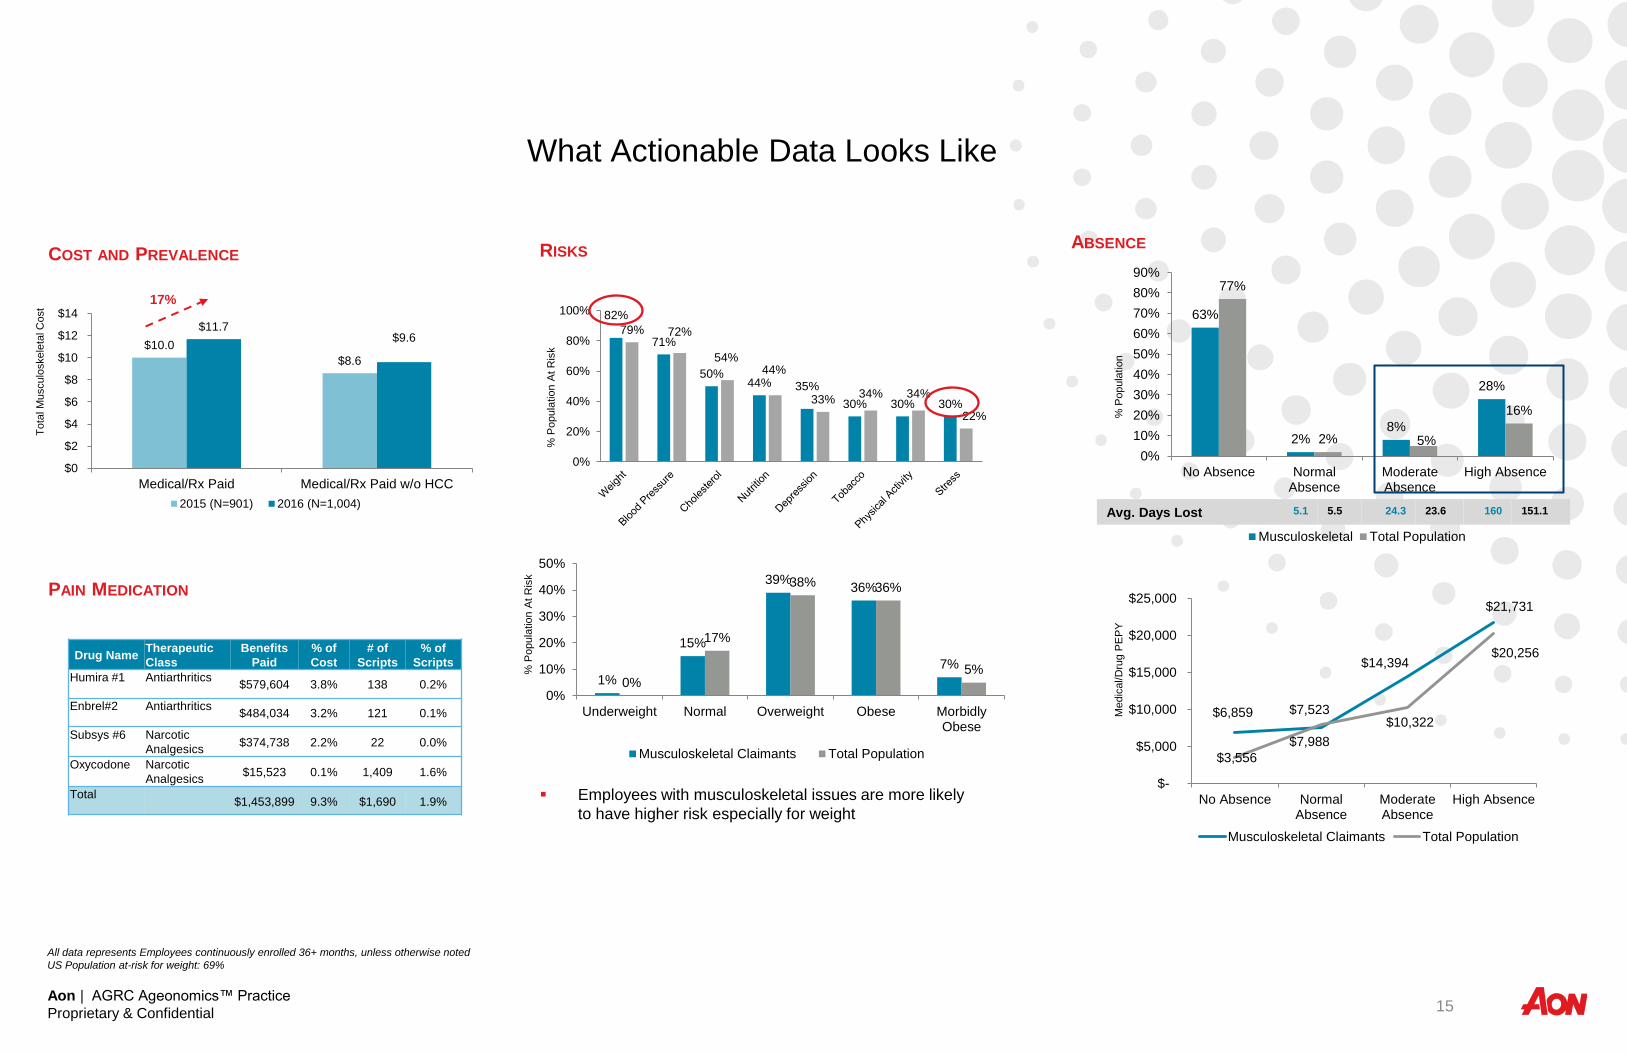
Avg. Days Lost 5.1 5.5 24.3 23.6 160 151.1
RISKS
Employees with musculoskeletal issues are more likely
to have higher risk especially for weight
COST AND PREVALENCE
PAIN MEDICATION
Drug Name Therapeutic
Class
Benefits
Paid
% of
Cost
# of
Scripts
% of
Scripts
Humira #1 Antiarthritics $579,604 3.8% 138 0.2%
Enbrel#2 Antiarthritics $484,034 3.2% 121 0.1%
Subsys #6 Narcotic
Analgesics $374,738 2.2% 22 0.0%
Oxycodone Narcotic
Analgesics $15,523 0.1% 1,409 1.6%
Total $1,453,899 9.3% $1,690 1.9%
What Actionable Data Looks Like
ABSENCE
63%
2% 8%
28%
77%
2% 5%
16%
0%
10%
20%
30%
40%
50%
60%
70%
80%
90%
No Absence NormalAbsence
ModerateAbsence
High Absence
Musculoskeletal Total Population
% P
opula
tio
n
Medic
al/D
rug P
EP
Y
$6,859 $7,523
$14,394
$21,731
$3,556
$7,988
$10,322
$20,256
$-
$5,000
$10,000
$15,000
$20,000
$25,000
No Absence NormalAbsence
ModerateAbsence
High Absence
Musculoskeletal Claimants Total Population
1%
15%
39% 36%
7%
0%
17%
38% 36%
5%
0%
10%
20%
30%
40%
50%
Underweight Normal Overweight Obese MorbidlyObese
Musculoskeletal Claimants Total Population
$10.0
$8.6
$11.7 $9.6
$0
$2
$4
$6
$8
$10
$12
$14
Medical/Rx Paid Medical/Rx Paid w/o HCC
2015 (N=901) 2016 (N=1,004)
To
tal M
usculo
skele
tal C
ost
% P
opula
tio
n A
t R
isk
% P
opula
tio
n A
t R
isk
17% 82%
71%
50% 44% 35%
30% 30% 30%
79% 72%
54% 44%
33% 34% 34%
22%
0%
20%
40%
60%
80%
100%
All data represents Employees continuously enrolled 36+ months, unless otherwise noted
US Population at-risk for weight: 69%
15
Aon | AGRC Ageonomics™ Practice
Proprietary & Confidential
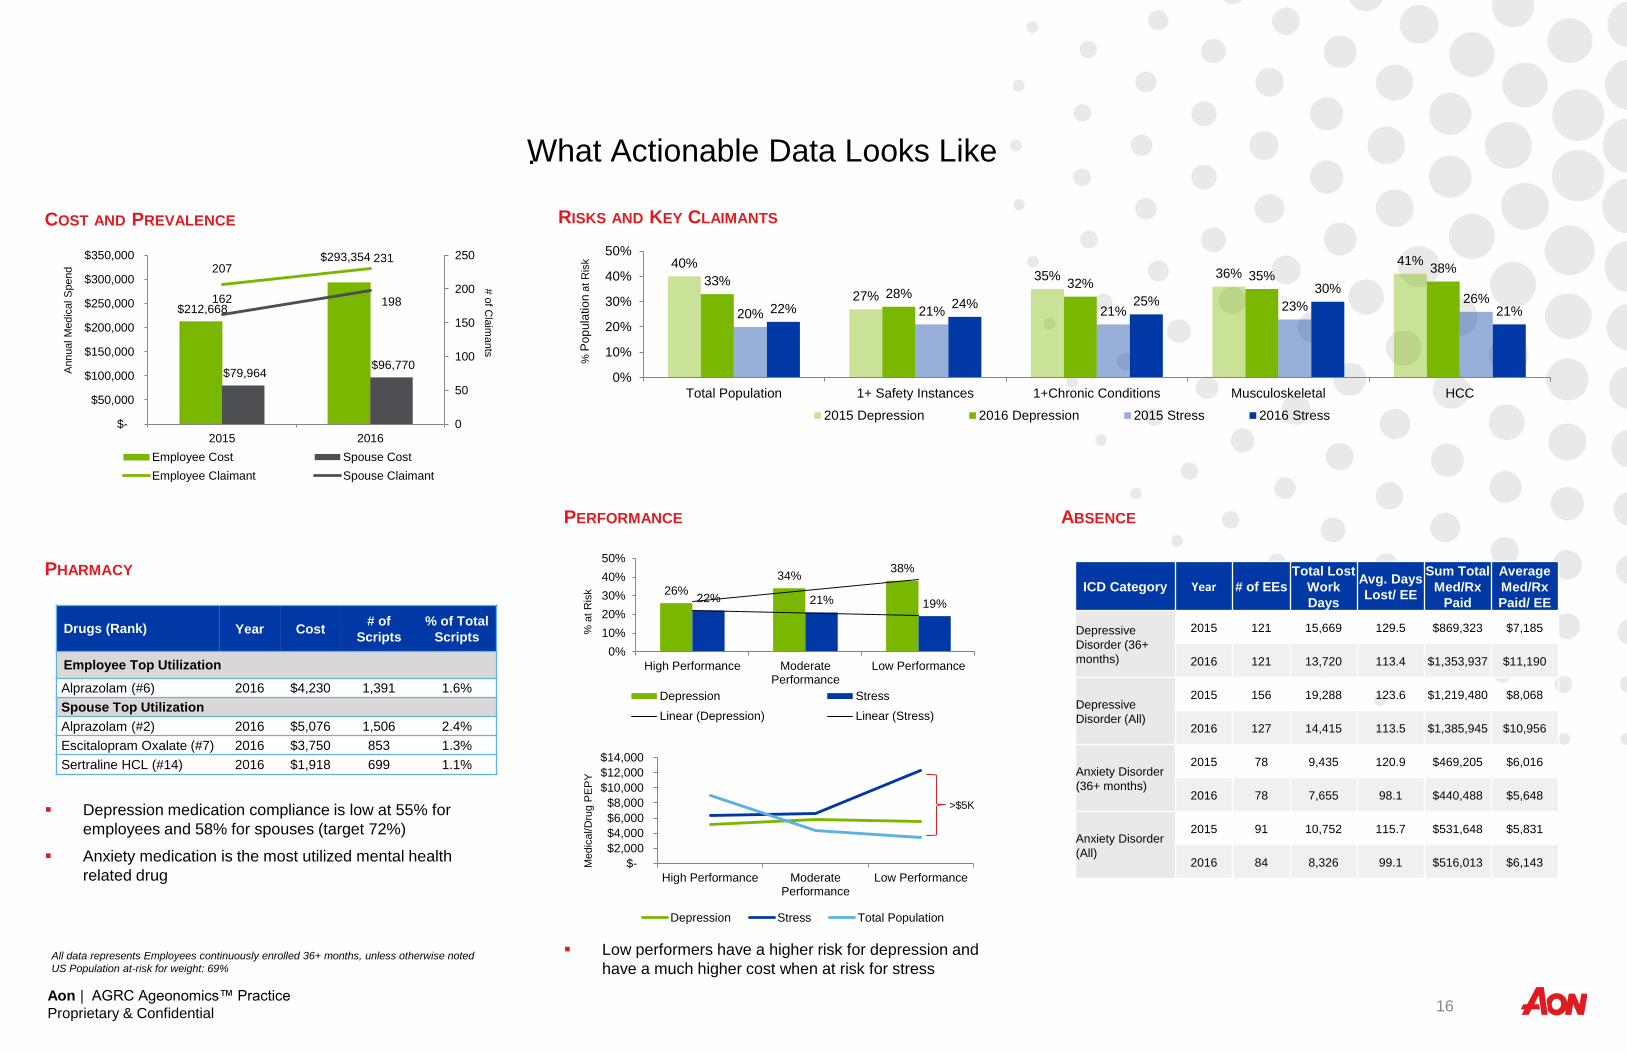
COST AND PREVALENCE
PHARMACY
Depression medication compliance is low at 55% for
employees and 58% for spouses (target 72%)
Anxiety medication is the most utilized mental health
related drug
RISKS AND KEY CLAIMANTS
PERFORMANCE
Low performers have a higher risk for depression and
have a much higher cost when at risk for stress
.
% P
op
ula
tio
n a
t R
isk
40%
27%
35% 36% 41%
33% 28%
32% 35%
38%
20% 21% 21% 23% 26%
22% 24% 25% 30%
21%
0%
10%
20%
30%
40%
50%
Total Population 1+ Safety Instances 1+Chronic Conditions Musculoskeletal HCC
2015 Depression 2016 Depression 2015 Stress 2016 Stress
Medic
al/D
rug P
EP
Y
% a
t R
isk
>$5K
26%
34% 38%
22% 21% 19%
0%
10%
20%
30%
40%
50%
High Performance ModeratePerformance
Low Performance
Depression Stress
Linear (Depression) Linear (Stress)
$-
$2,000
$4,000
$6,000
$8,000
$10,000
$12,000
$14,000
High Performance ModeratePerformance
Low Performance
Depression Stress Total Population
Drugs (Rank) Year Cost # of
Scripts
% of Total
Scripts
Employee Top Utilization
Alprazolam (#6) 2016 $4,230 1,391 1.6%
Spouse Top Utilization
Alprazolam (#2) 2016 $5,076 1,506 2.4%
Escitalopram Oxalate (#7) 2016 $3,750 853 1.3%
Sertraline HCL (#14) 2016 $1,918 699 1.1%
$212,668
$293,354
$79,964 $96,770
207 231
162 198
0
50
100
150
200
250
$-
$50,000
$100,000
$150,000
$200,000
$250,000
$300,000
$350,000
2015 2016
Employee Cost Spouse Cost
Employee Claimant Spouse Claimant
# o
f Cla
imants
Annual M
edic
al S
pend
ICD Category Year # of EEs Total Lost
Work
Days
Avg. Days
Lost/ EE
Sum Total
Med/Rx
Paid
Average
Med/Rx
Paid/ EE
Depressive
Disorder (36+
months)
2015 121 15,669 129.5 $869,323 $7,185
2016 121 13,720 113.4 $1,353,937 $11,190
Depressive
Disorder (All)
2015 156 19,288 123.6 $1,219,480 $8,068
2016 127 14,415 113.5 $1,385,945 $10,956
Anxiety Disorder
(36+ months)
2015 78 9,435 120.9 $469,205 $6,016
2016 78 7,655 98.1 $440,488 $5,648
Anxiety Disorder
(All)
2015 91 10,752 115.7 $531,648 $5,831
2016 84 8,326 99.1 $516,013 $6,143
All data represents Employees continuously enrolled 36+ months, unless otherwise noted
US Population at-risk for weight: 69%
ABSENCE
16
What Actionable Data Looks Like
Aon | AGRC Ageonomics™ Practice
Proprietary & Confidential
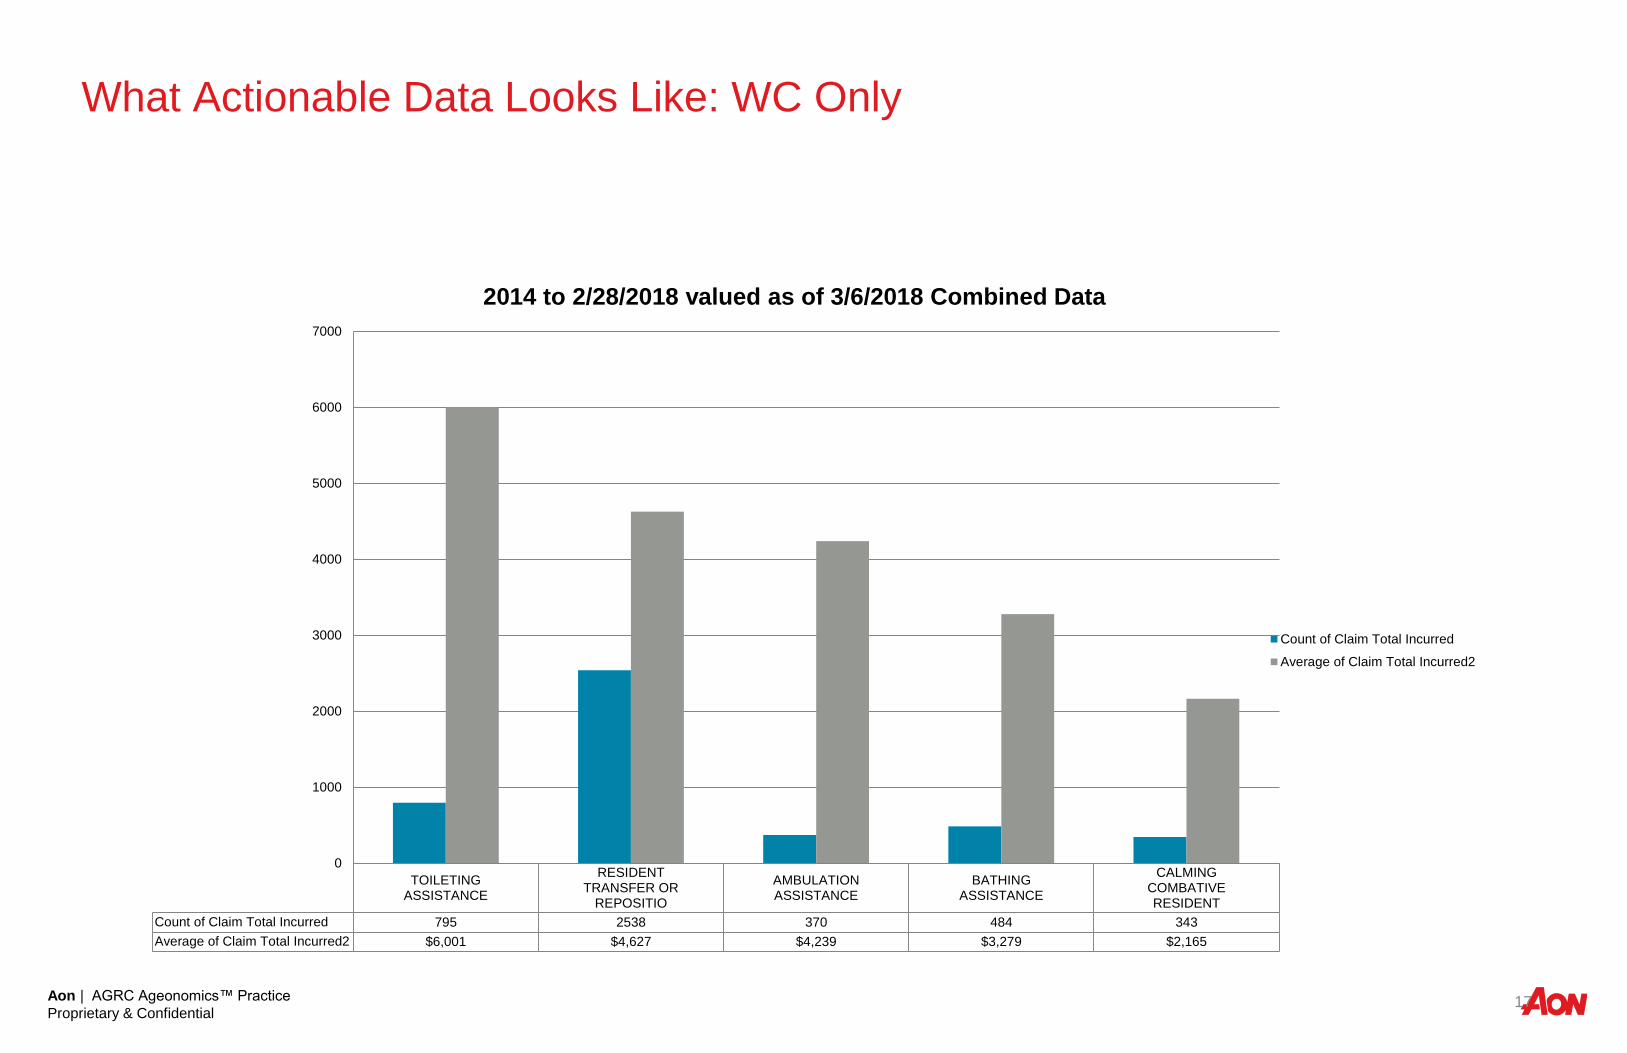
What Actionable Data Looks Like: WC Only
17
TOILETINGASSISTANCE
RESIDENTTRANSFER OR
REPOSITIO
AMBULATIONASSISTANCE
BATHINGASSISTANCE
CALMINGCOMBATIVERESIDENT
Count of Claim Total Incurred 795 2538 370 484 343
Average of Claim Total Incurred2 $6,001 $4,627 $4,239 $3,279 $2,165
0
1000
2000
3000
4000
5000
6000
7000
2014 to 2/28/2018 valued as of 3/6/2018 Combined Data
Count of Claim Total Incurred
Average of Claim Total Incurred2
Aon | AGRC Ageonomics™ Practice
Proprietary & Confidential
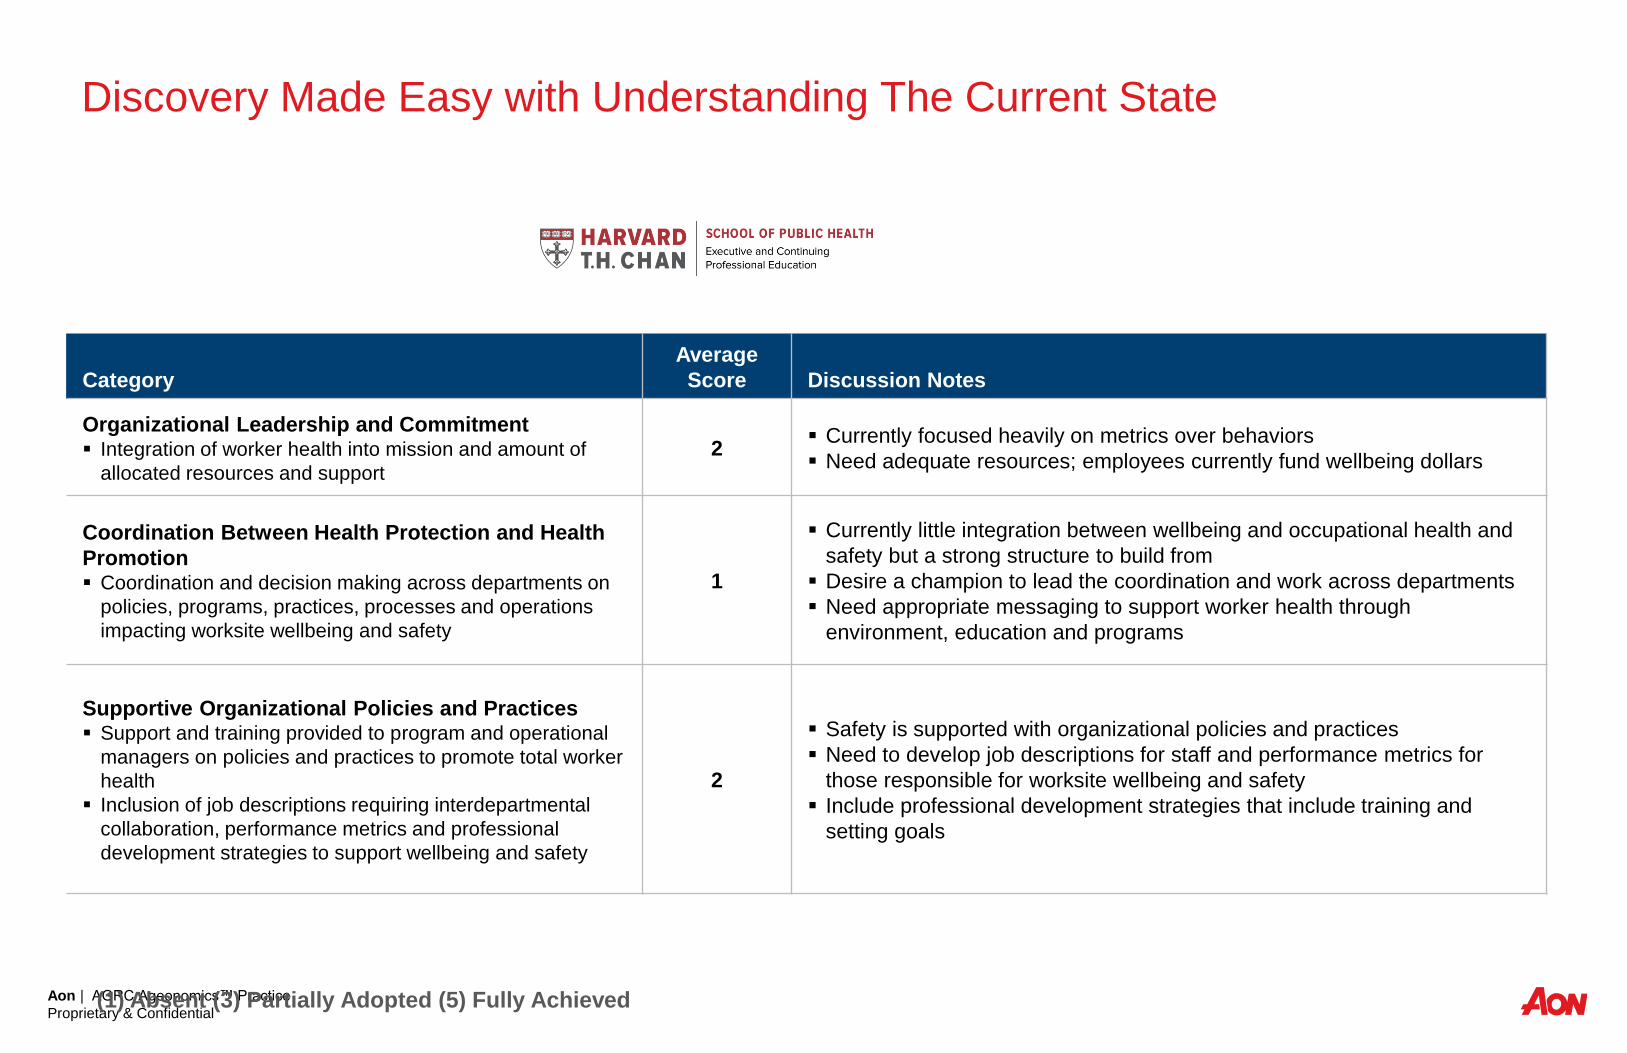
Discovery Made Easy with Understanding The Current State
Category
Average
Score Discussion Notes
Organizational Leadership and Commitment Integration of worker health into mission and amount of
allocated resources and support
2 Currently focused heavily on metrics over behaviors
Need adequate resources; employees currently fund wellbeing dollars
Coordination Between Health Protection and Health
Promotion Coordination and decision making across departments on
policies, programs, practices, processes and operations
impacting worksite wellbeing and safety
1
Currently little integration between wellbeing and occupational health and
safety but a strong structure to build from
Desire a champion to lead the coordination and work across departments
Need appropriate messaging to support worker health through
environment, education and programs
Supportive Organizational Policies and Practices Support and training provided to program and operational
managers on policies and practices to promote total worker
health
Inclusion of job descriptions requiring interdepartmental
collaboration, performance metrics and professional
development strategies to support wellbeing and safety
2
Safety is supported with organizational policies and practices
Need to develop job descriptions for staff and performance metrics for
those responsible for worksite wellbeing and safety
Include professional development strategies that include training and
setting goals
(1) Absent (3) Partially Adopted (5) Fully Achieved
Aon | AGRC Ageonomics™ Practice
Proprietary & Confidential
Current State Team Integration - Obstacles and Considerations
Internal reporting structures often operate in silos:
– Risk Management
– Insurance
– Claims
– Safety
– Human Resources
– Health and Benefits
– Operations
– Finance
– Legal
• Leadership support is required to support an integrated culture and improve outcomes.
19
Aon | AGRC Ageonomics™ Practice
Proprietary & Confidential
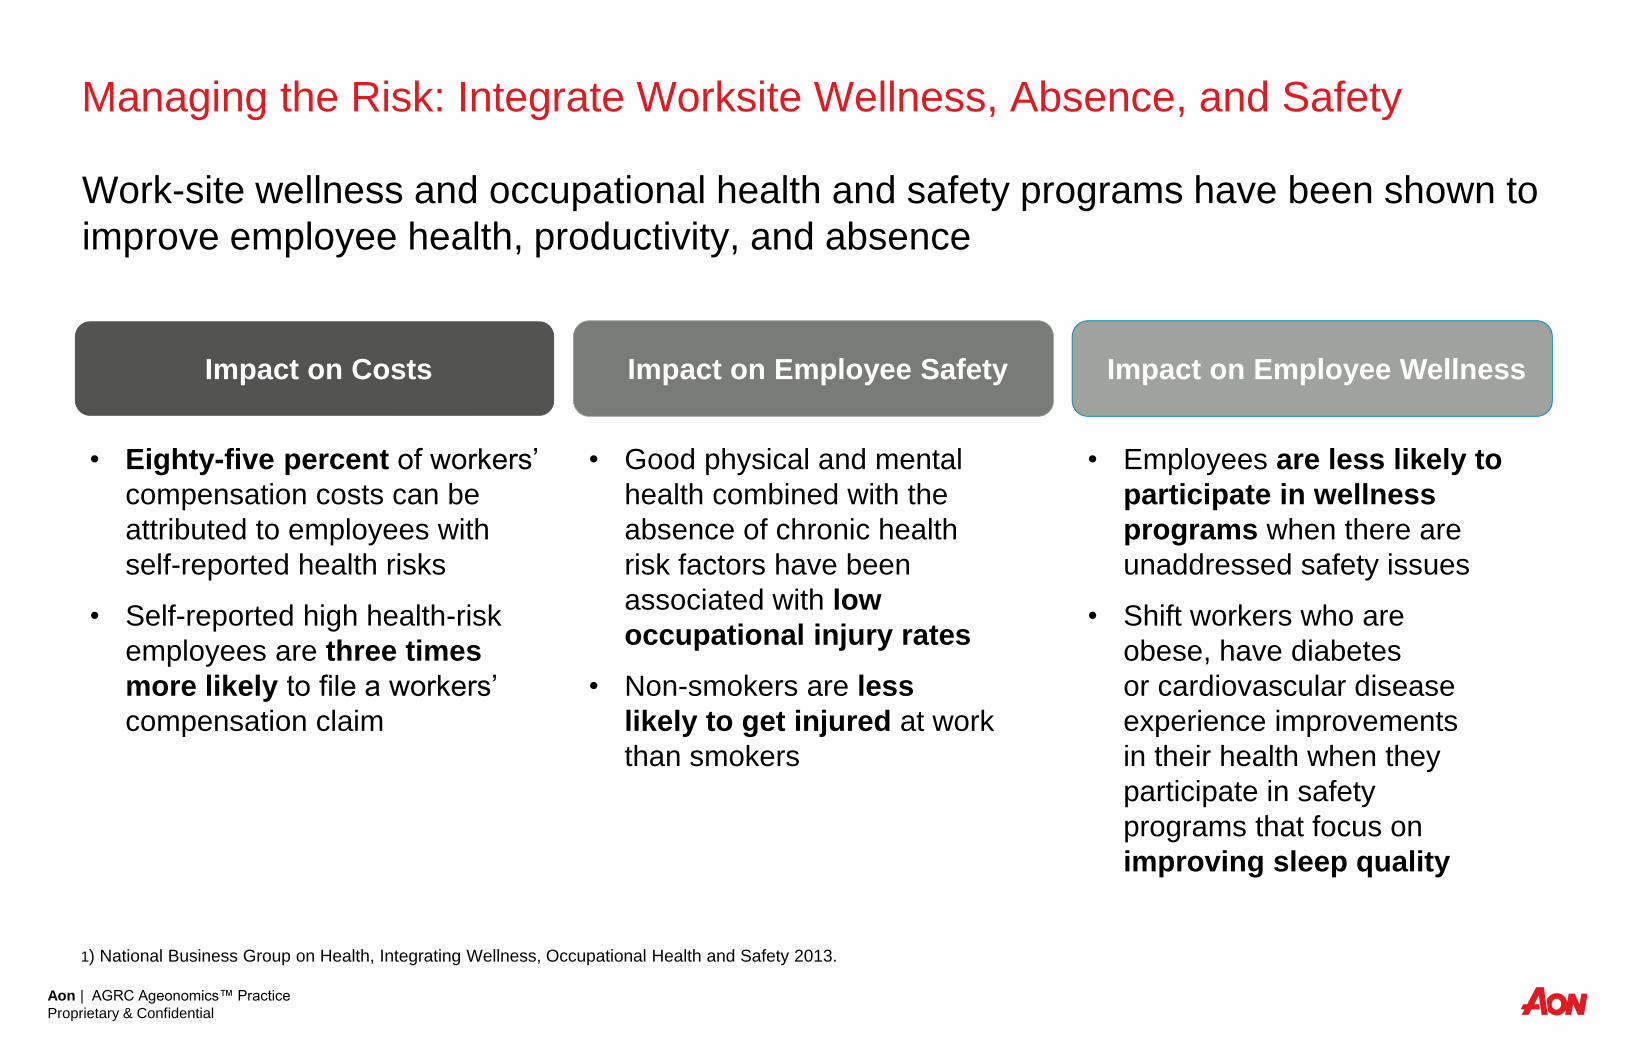
Managing the Risk: Integrate Worksite Wellness, Absence, and Safety
Work-site wellness and occupational health and safety programs have been shown to
improve employee health, productivity, and absence
1) National Business Group on Health, Integrating Wellness, Occupational Health and Safety 2013.
Impact on Costs
• Eighty-five percent of workers’
compensation costs can be
attributed to employees with
self-reported health risks
• Self-reported high health-risk
employees are three times
more likely to file a workers’
compensation claim
Impact on Employee Safety
• Good physical and mental
health combined with the
absence of chronic health
risk factors have been
associated with low
occupational injury rates
• Non-smokers are less
likely to get injured at work
than smokers
Impact on Employee Wellness
• Employees are less likely to
participate in wellness
programs when there are
unaddressed safety issues
• Shift workers who are
obese, have diabetes
or cardiovascular disease
experience improvements
in their health when they
participate in safety
programs that focus on
improving sleep quality
Aon | AGRC Ageonomics™ Practice
Proprietary & Confidential
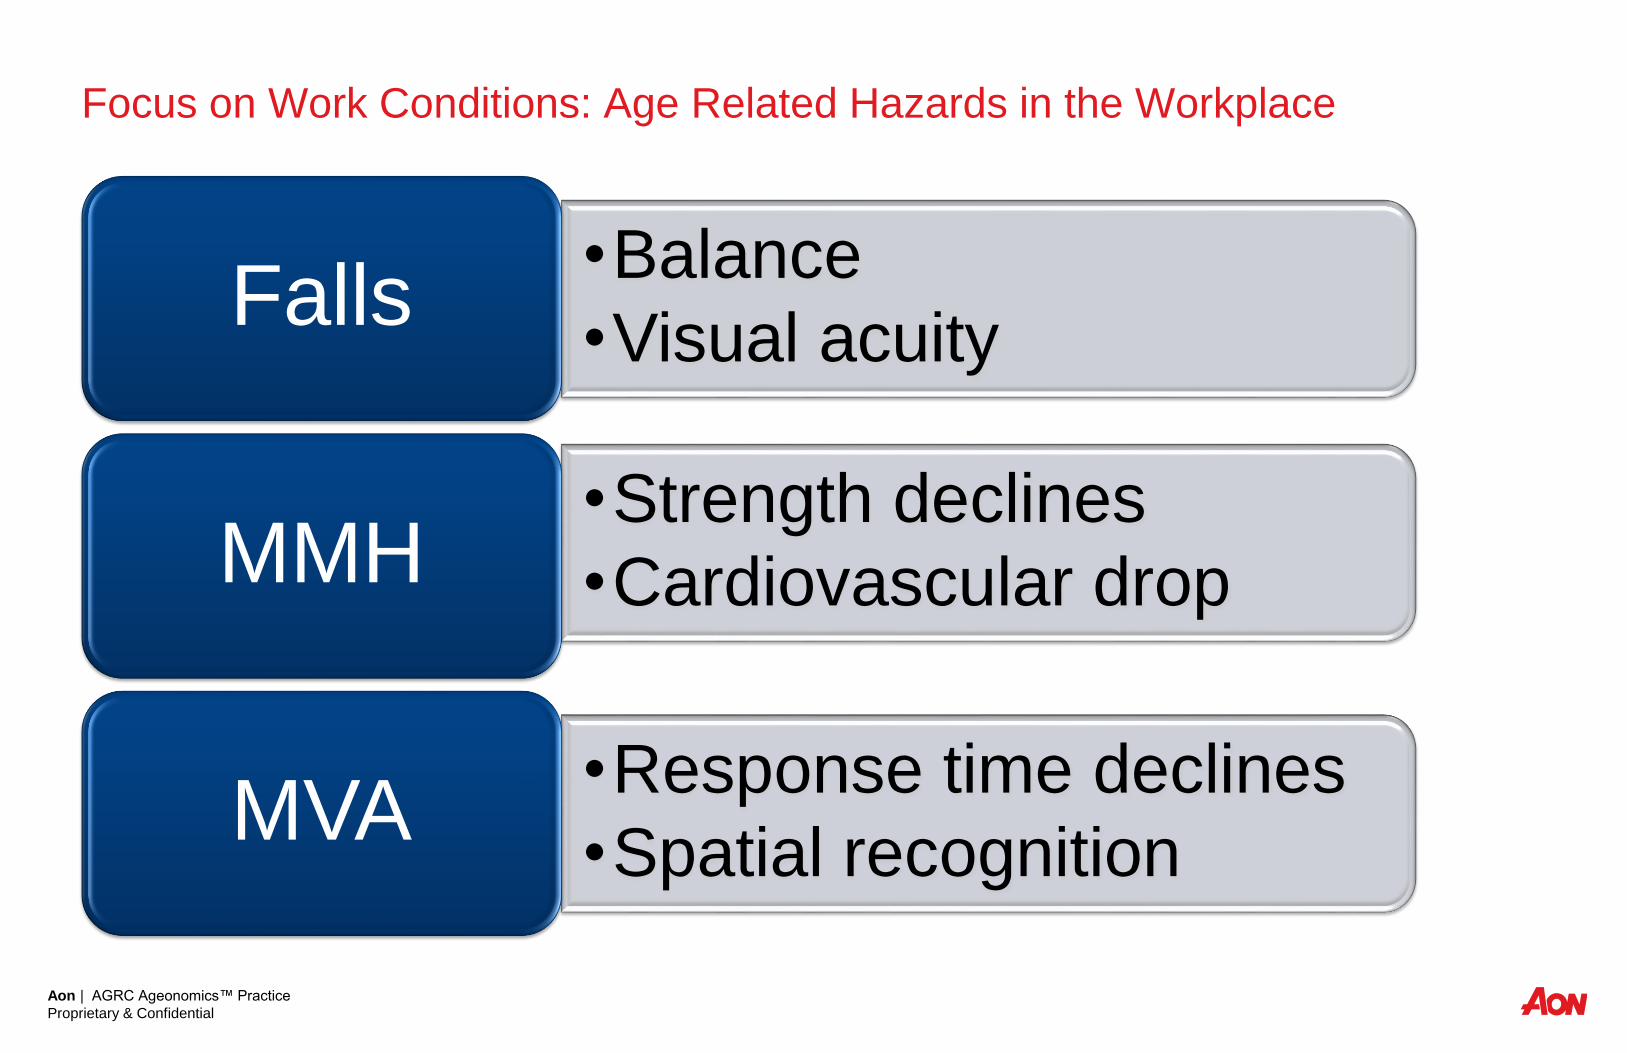
Focus on Work Conditions: Age Related Hazards in the Workplace
Ageonomics
101
21
•Balance
•Visual acuity Falls
•Strength declines
•Cardiovascular drop MMH
•Response time declines
•Spatial recognition MVA
Aon | AGRC Ageonomics™ Practice
Proprietary & Confidential
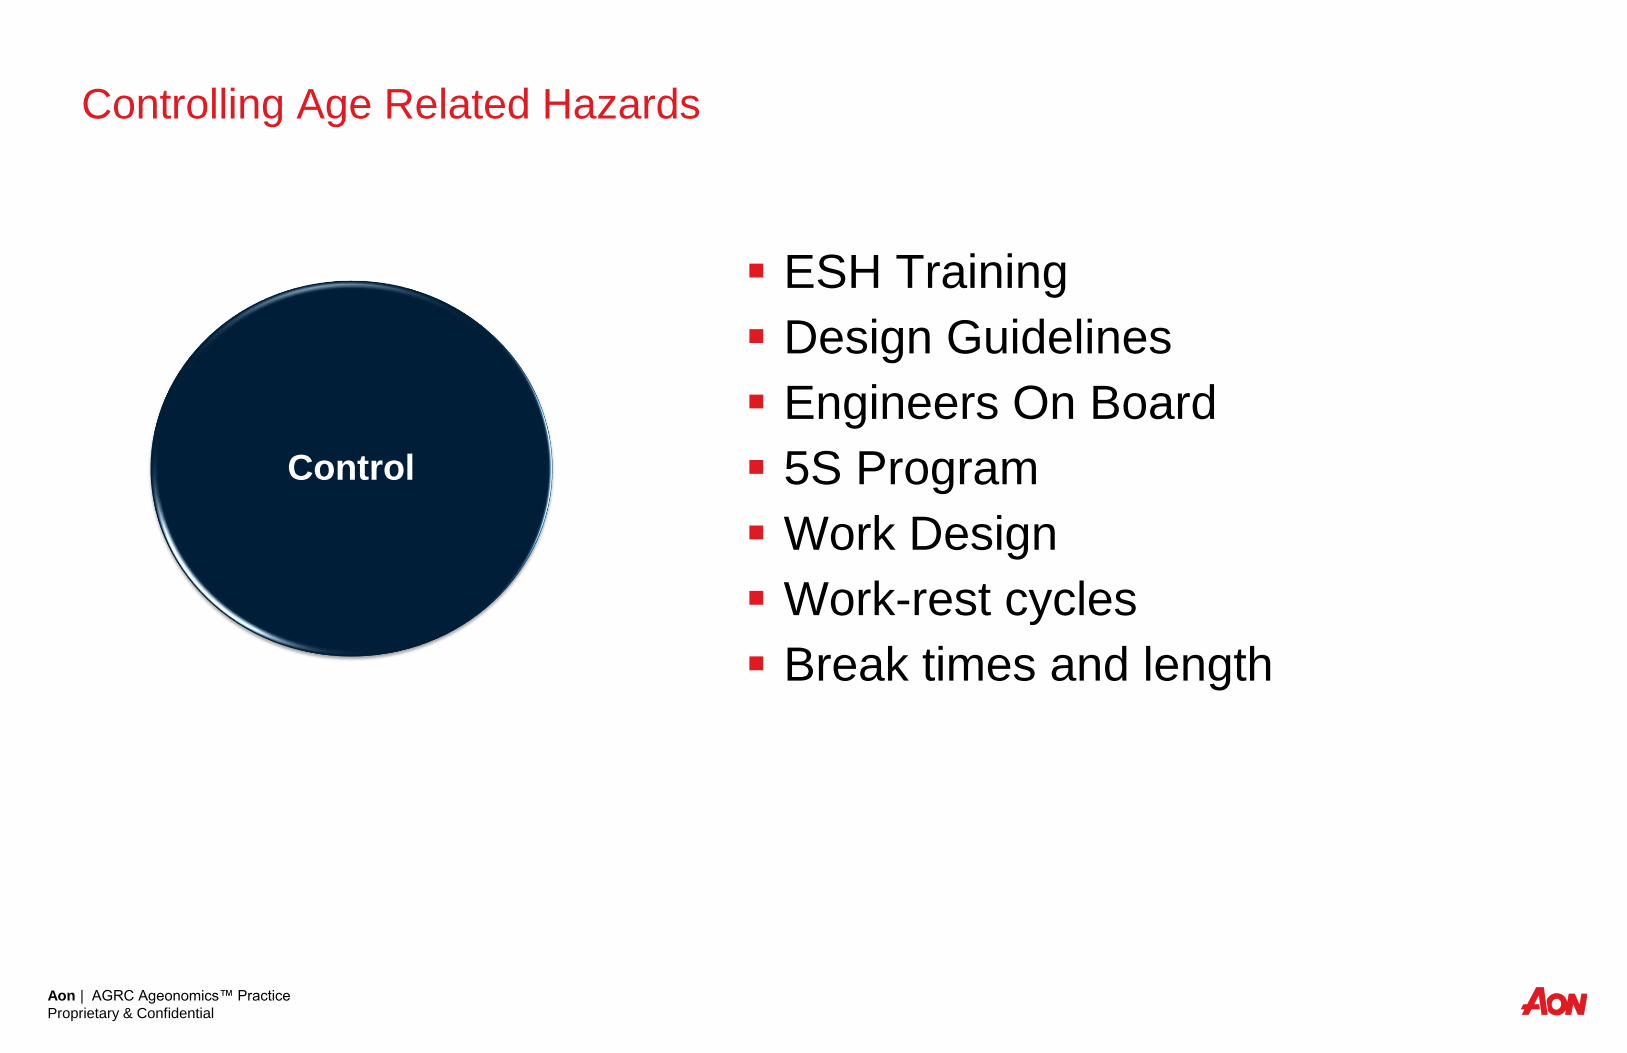
Controlling Age Related Hazards
ESH Training
Design Guidelines
Engineers On Board
5S Program
Work Design
Work-rest cycles
Break times and length
Control
Aon | AGRC Ageonomics™ Practice
Proprietary & Confidential
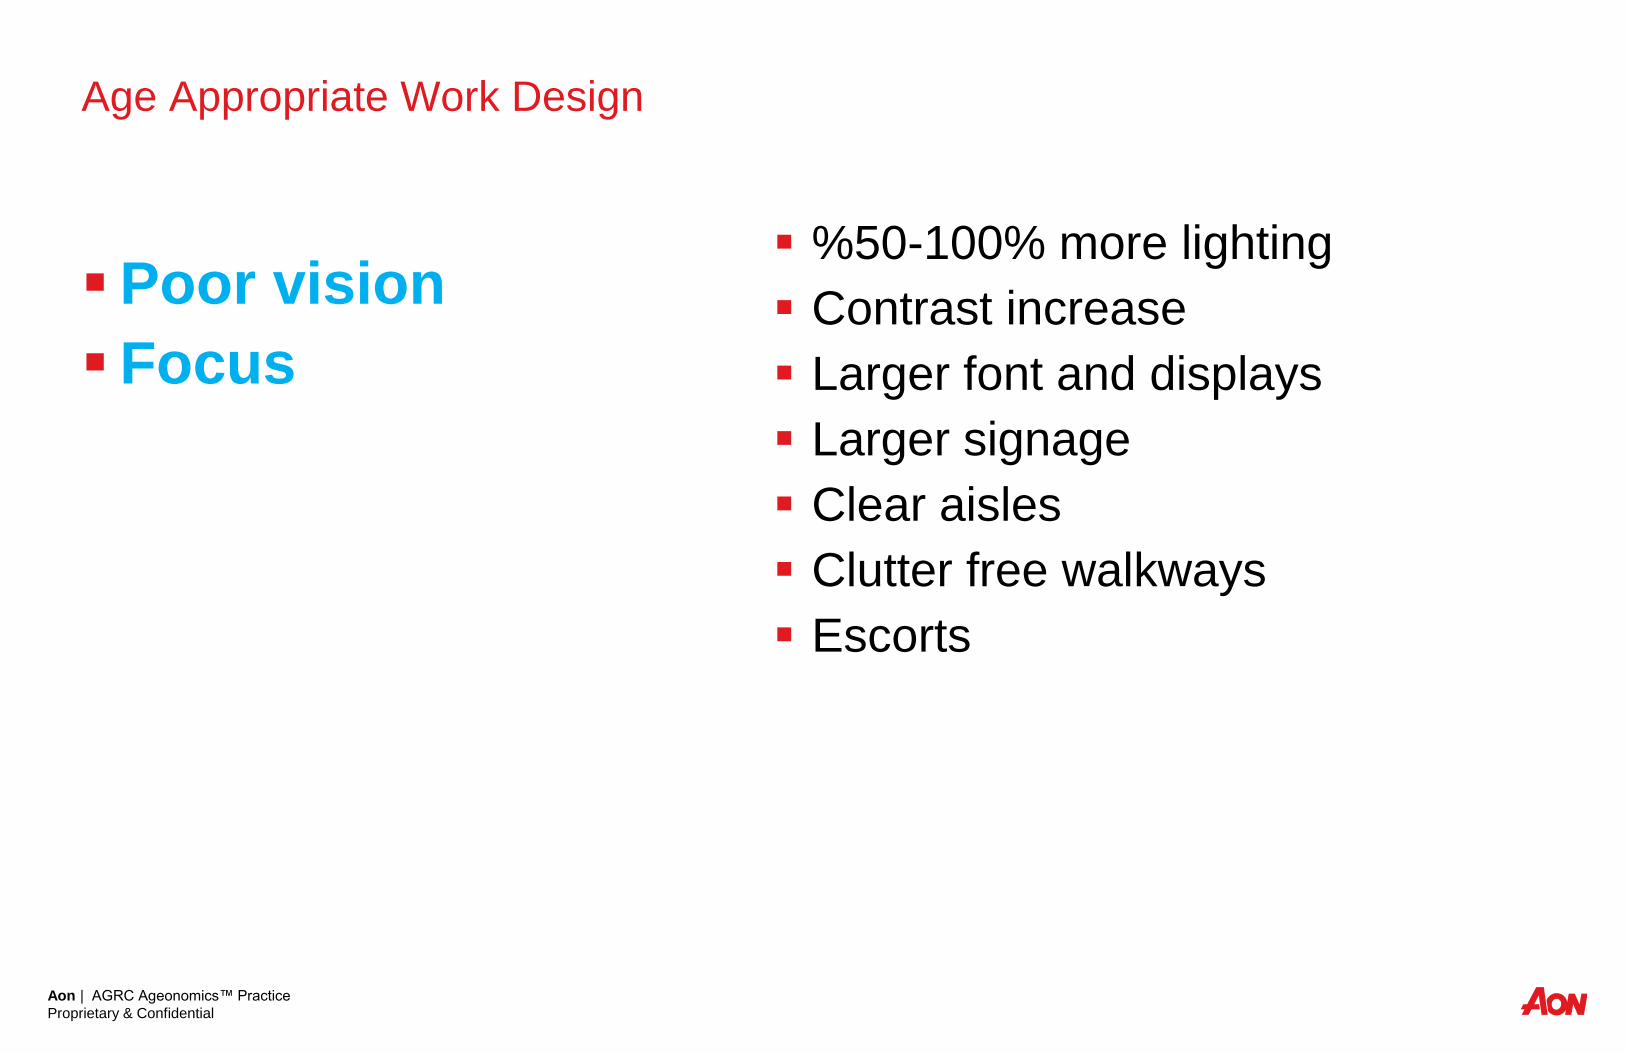
Age Appropriate Work Design
Poor vision
Focus
%50-100% more lighting
Contrast increase
Larger font and displays
Larger signage
Clear aisles
Clutter free walkways
Escorts
Aon | AGRC Ageonomics™ Practice
Proprietary & Confidential
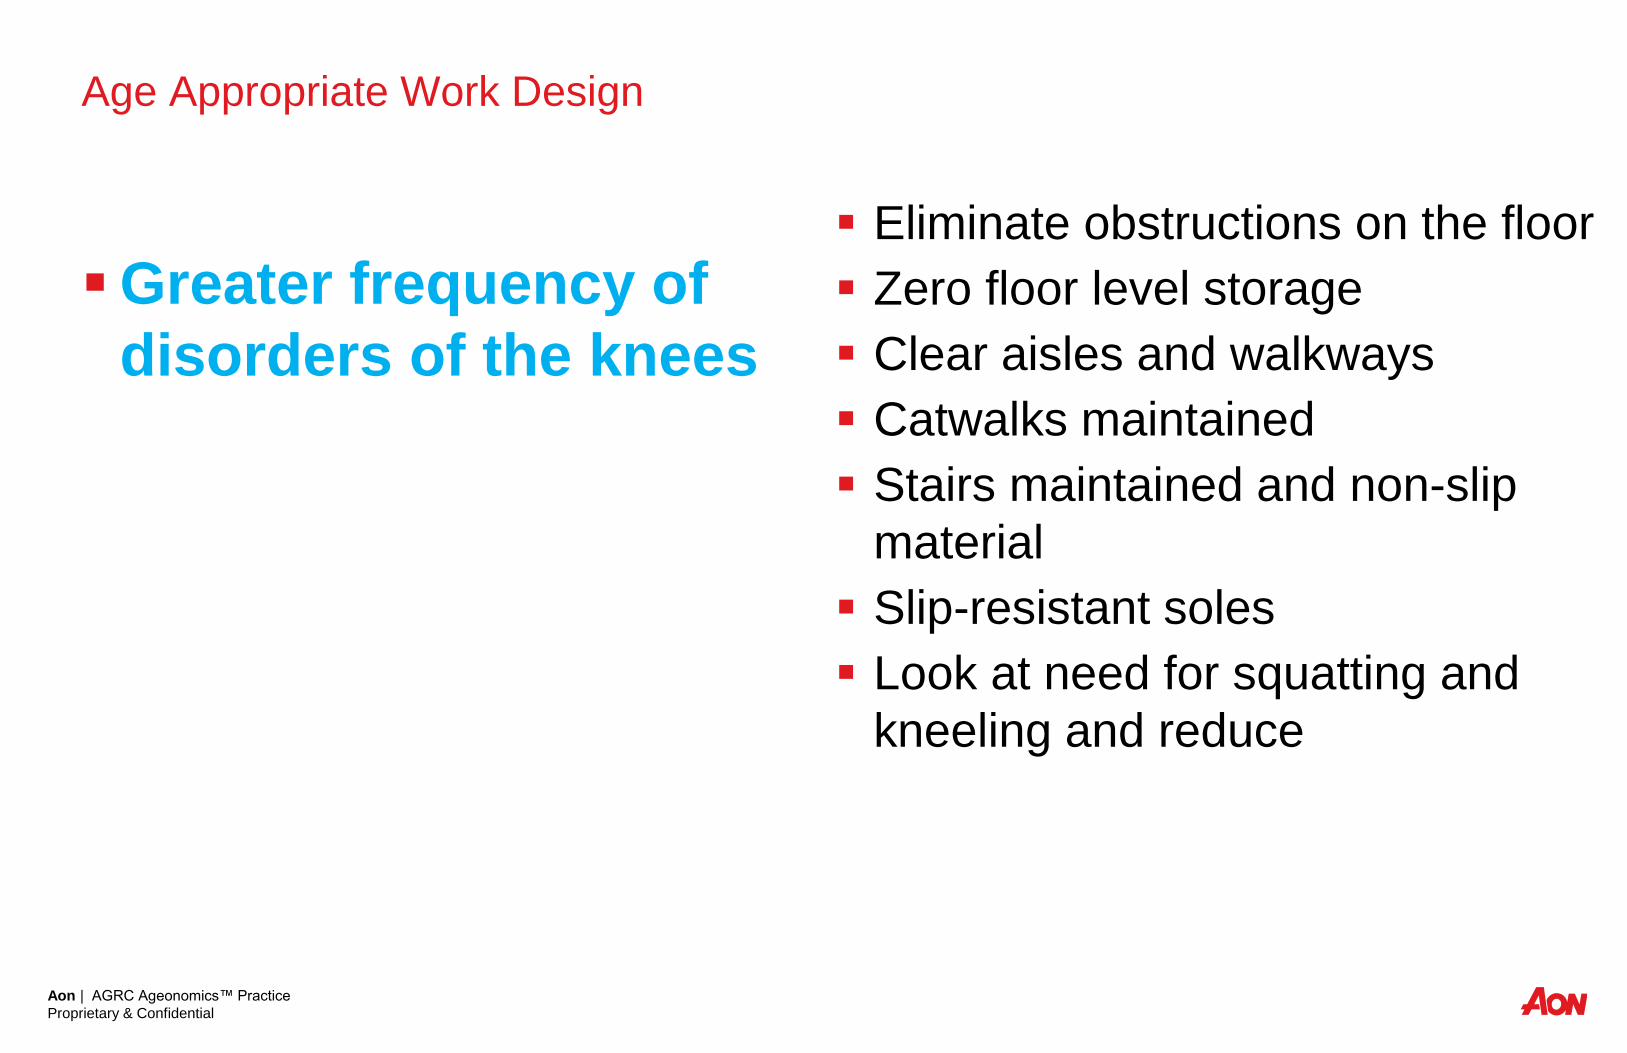
Age Appropriate Work Design
Greater frequency of
disorders of the knees
Eliminate obstructions on the floor
Zero floor level storage
Clear aisles and walkways
Catwalks maintained
Stairs maintained and non-slip
material
Slip-resistant soles
Look at need for squatting and
kneeling and reduce
Aon | AGRC Ageonomics™ Practice
Proprietary & Confidential
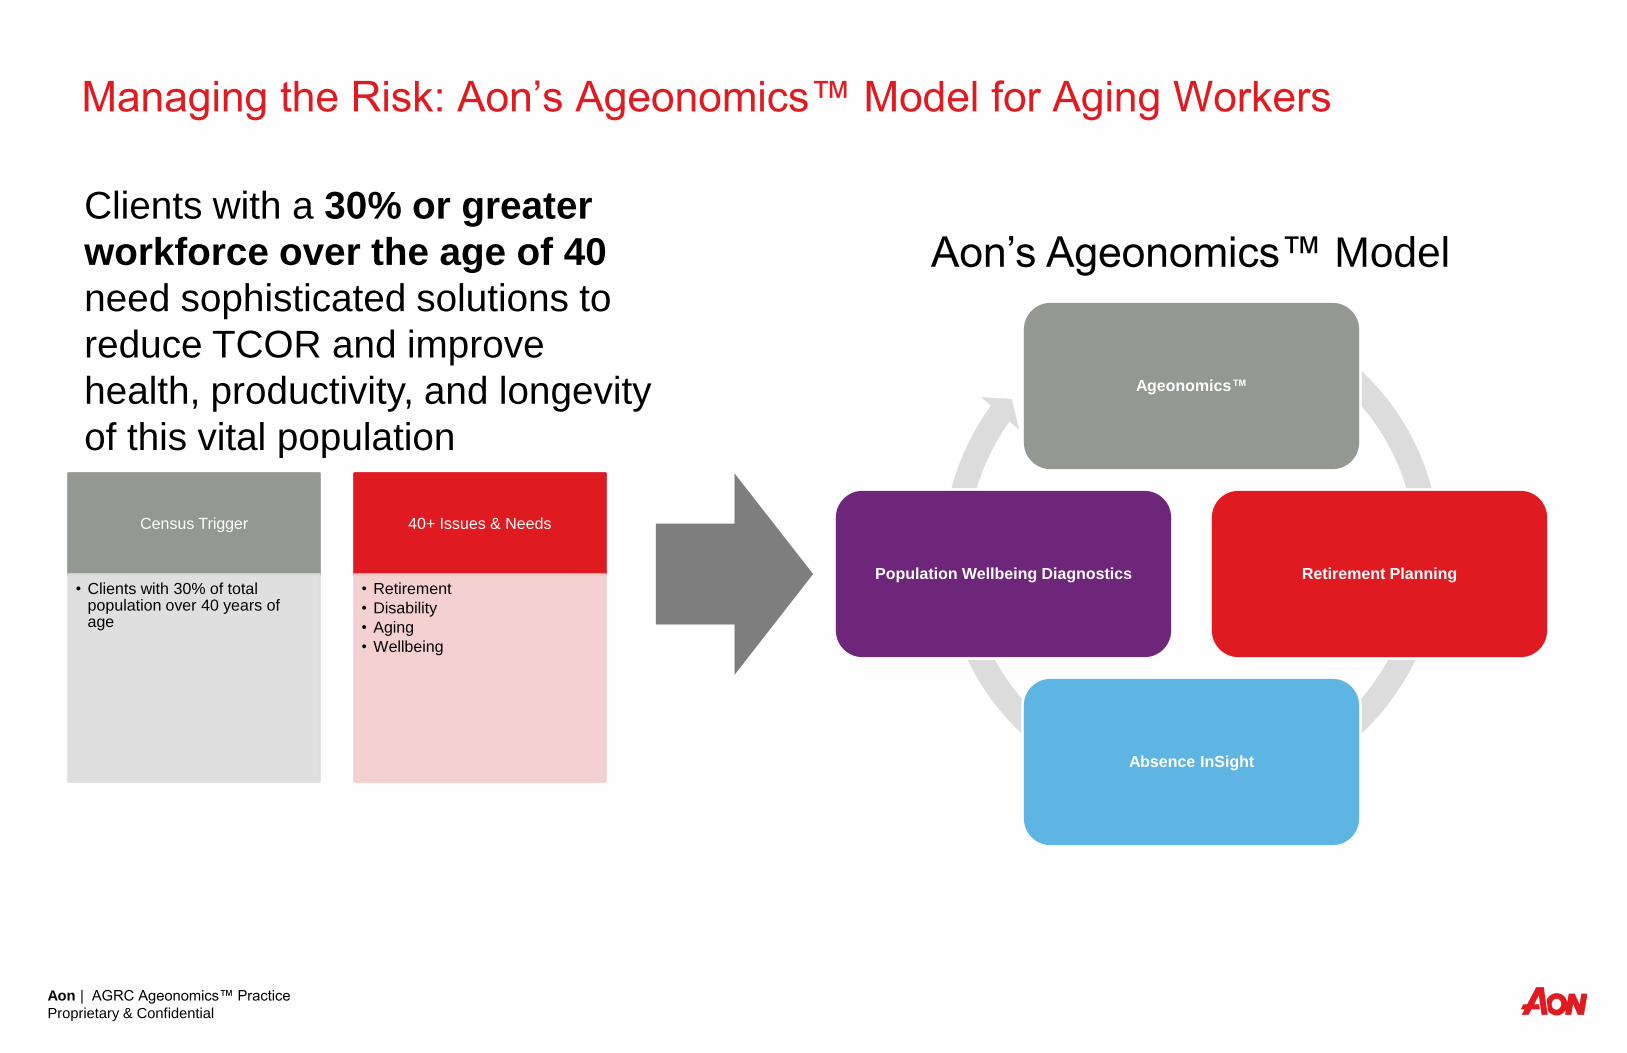
Managing the Risk: Aon’s Ageonomics™ Model for Aging Workers
Census Trigger
• Clients with 30% of total population over 40 years of age
40+ Issues & Needs
• Retirement
• Disability
• Aging
• Wellbeing
Ageonomics™
Retirement Planning
Absence InSight
Population Wellbeing Diagnostics
Clients with a 30% or greater
workforce over the age of 40
need sophisticated solutions to
reduce TCOR and improve
health, productivity, and longevity
of this vital population
Aon’s Ageonomics™ Model
Aon | AGRC Ageonomics™ Practice
Proprietary & Confidential
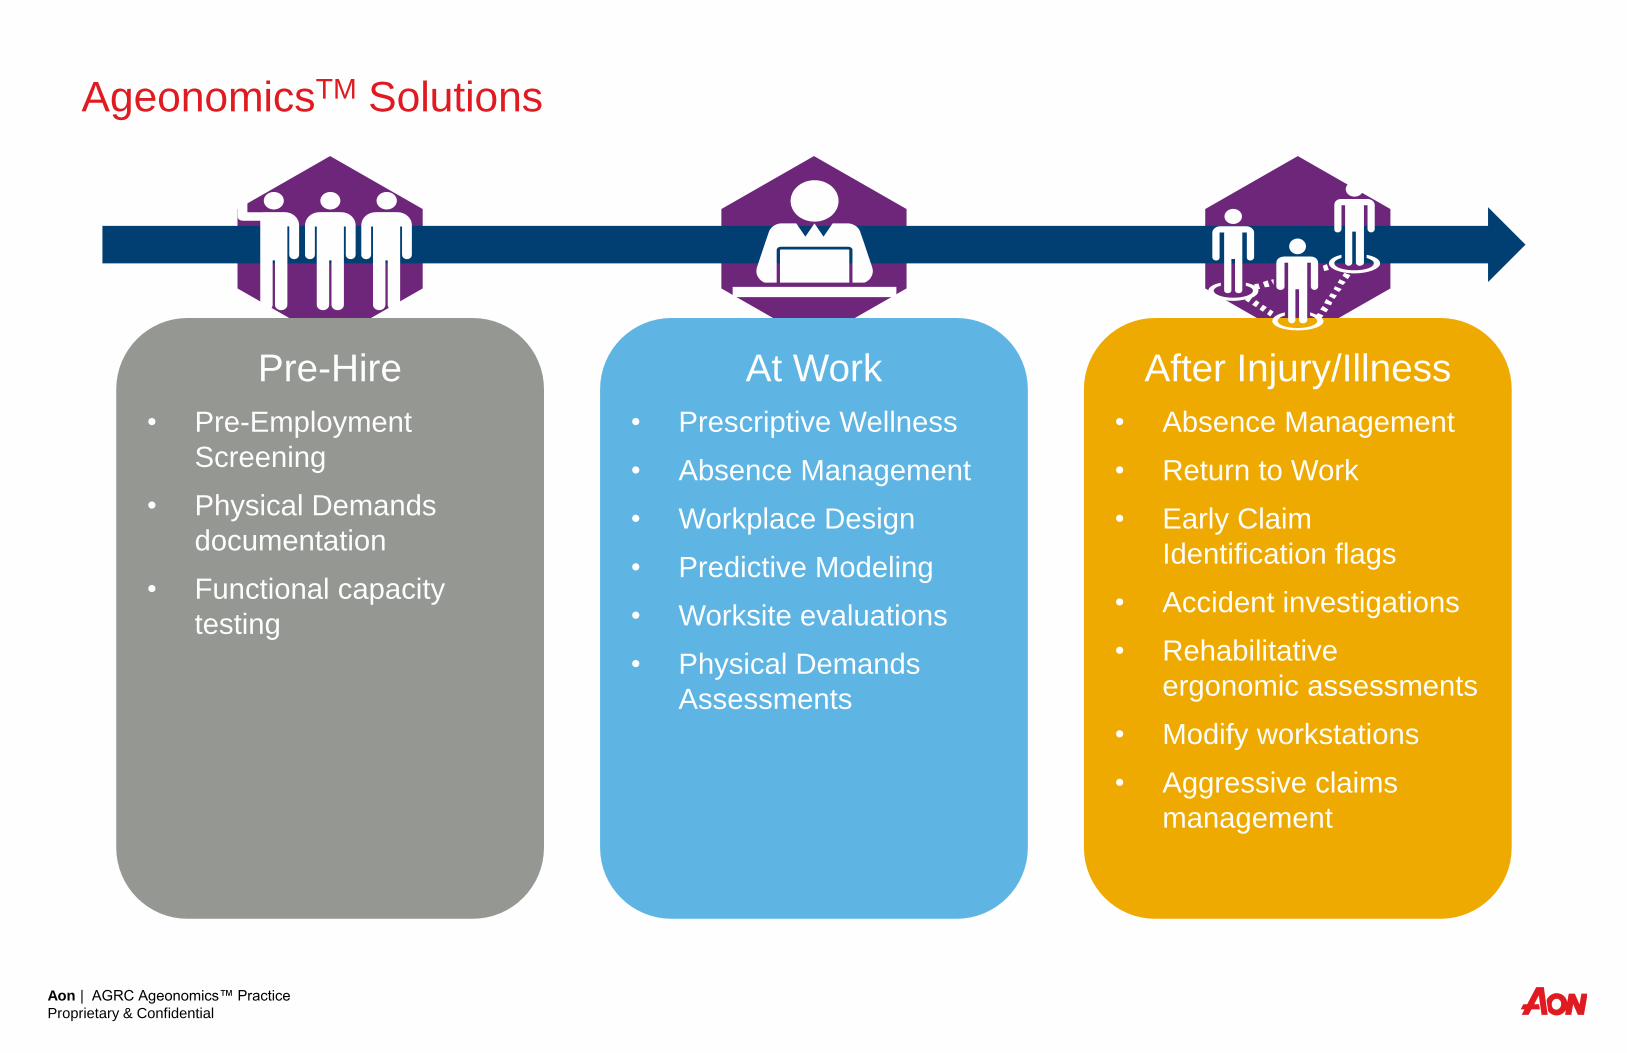
AgeonomicsTM Solutions
Pre-Hire:
Pre-Employment Screening
Physical Demands documentation
Functional capacity testing
At Work:
Prescriptive Wellness
Absence Mgmt
Workplace Design
Predictive Modeling
Worksite evaluations
Physical Demands Assessments
After Injury/Illness
Absence Mgmt
Return to Work
Early Claim Identification flags
Accident investigations
Rehabilitative ergonomic assessments
Modify workstations
Aggressive claims mgmt
Pre-Hire
• Pre-Employment
Screening
• Physical Demands
documentation
• Functional capacity
testing
At Work
• Prescriptive Wellness
• Absence Management
• Workplace Design
• Predictive Modeling
• Worksite evaluations
• Physical Demands
Assessments
After Injury/Illness
• Absence Management
• Return to Work
• Early Claim
Identification flags
• Accident investigations
• Rehabilitative
ergonomic assessments
• Modify workstations
• Aggressive claims
management
Aon | AGRC Ageonomics™ Practice
Proprietary & Confidential
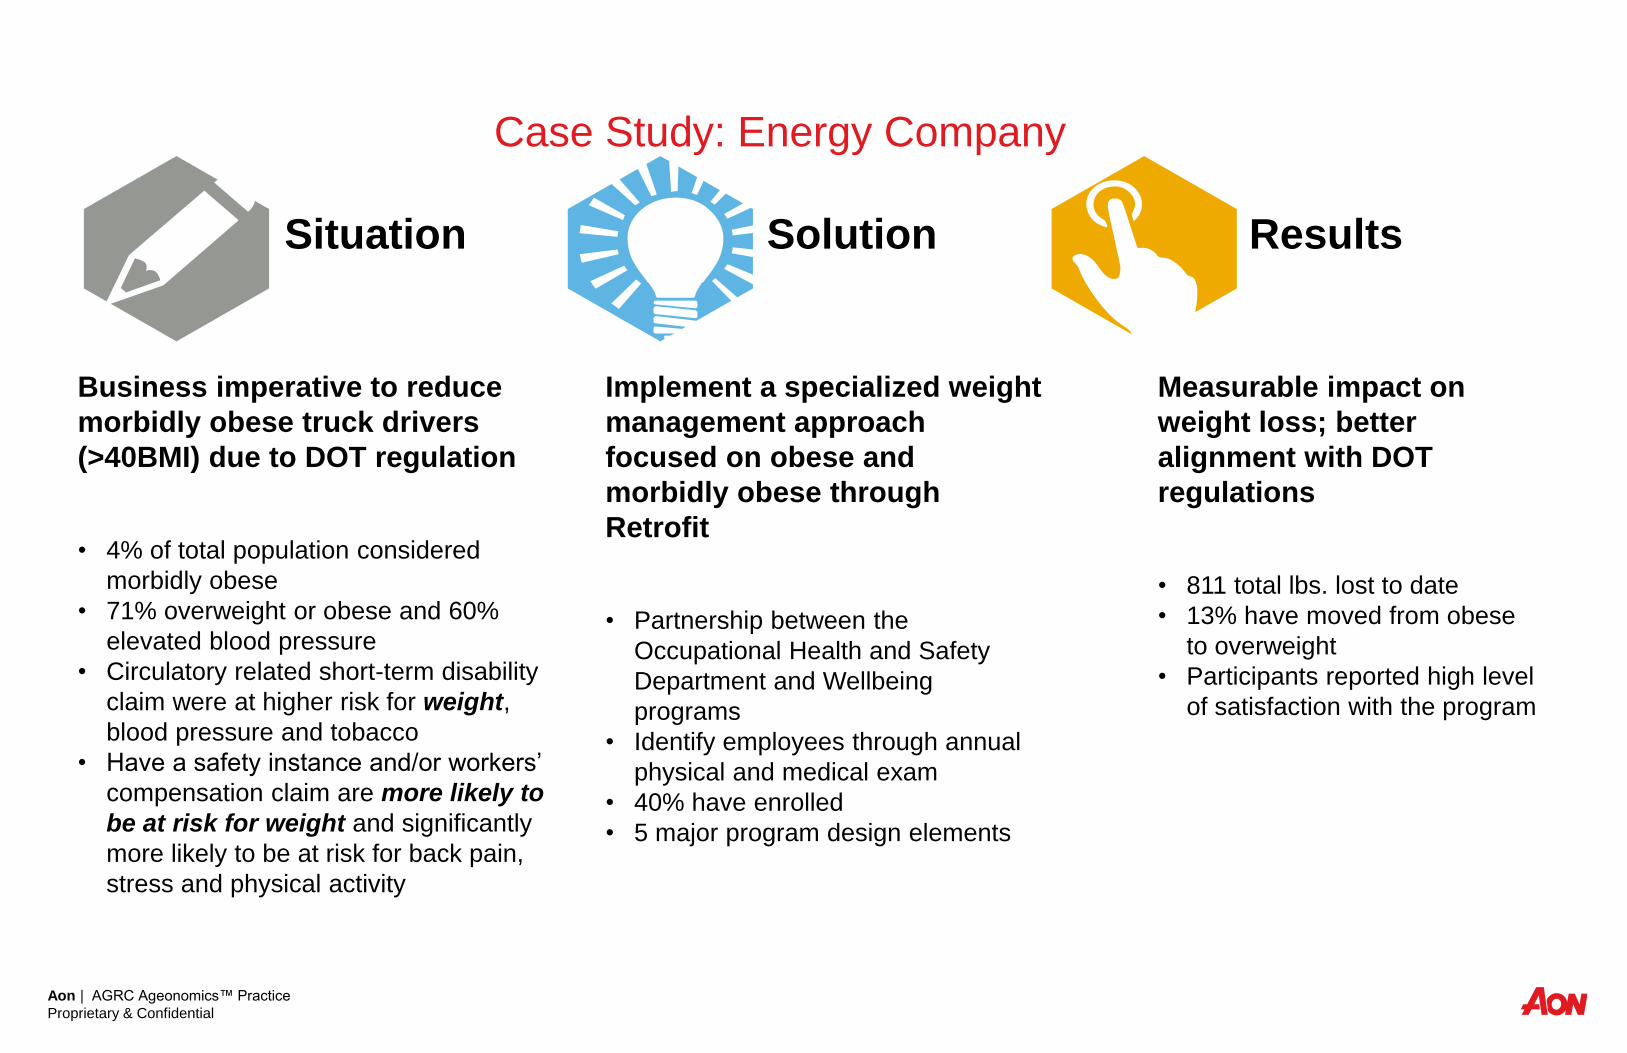
Case Study: Energy Company
Business imperative to reduce
morbidly obese truck drivers
(>40BMI) due to DOT regulation
• 4% of total population considered
morbidly obese
• 71% overweight or obese and 60%
elevated blood pressure
• Circulatory related short-term disability
claim were at higher risk for weight,
blood pressure and tobacco
• Have a safety instance and/or workers’
compensation claim are more likely to
be at risk for weight and significantly
more likely to be at risk for back pain,
stress and physical activity
Implement a specialized weight
management approach
focused on obese and
morbidly obese through
Retrofit
• Partnership between the
Occupational Health and Safety
Department and Wellbeing
programs
• Identify employees through annual
physical and medical exam
• 40% have enrolled
• 5 major program design elements
Measurable impact on
weight loss; better
alignment with DOT
regulations
• 811 total lbs. lost to date
• 13% have moved from obese
to overweight
• Participants reported high level
of satisfaction with the program
Situation Solution Results
Aon | AGRC Ageonomics™ Practice
Proprietary & Confidential
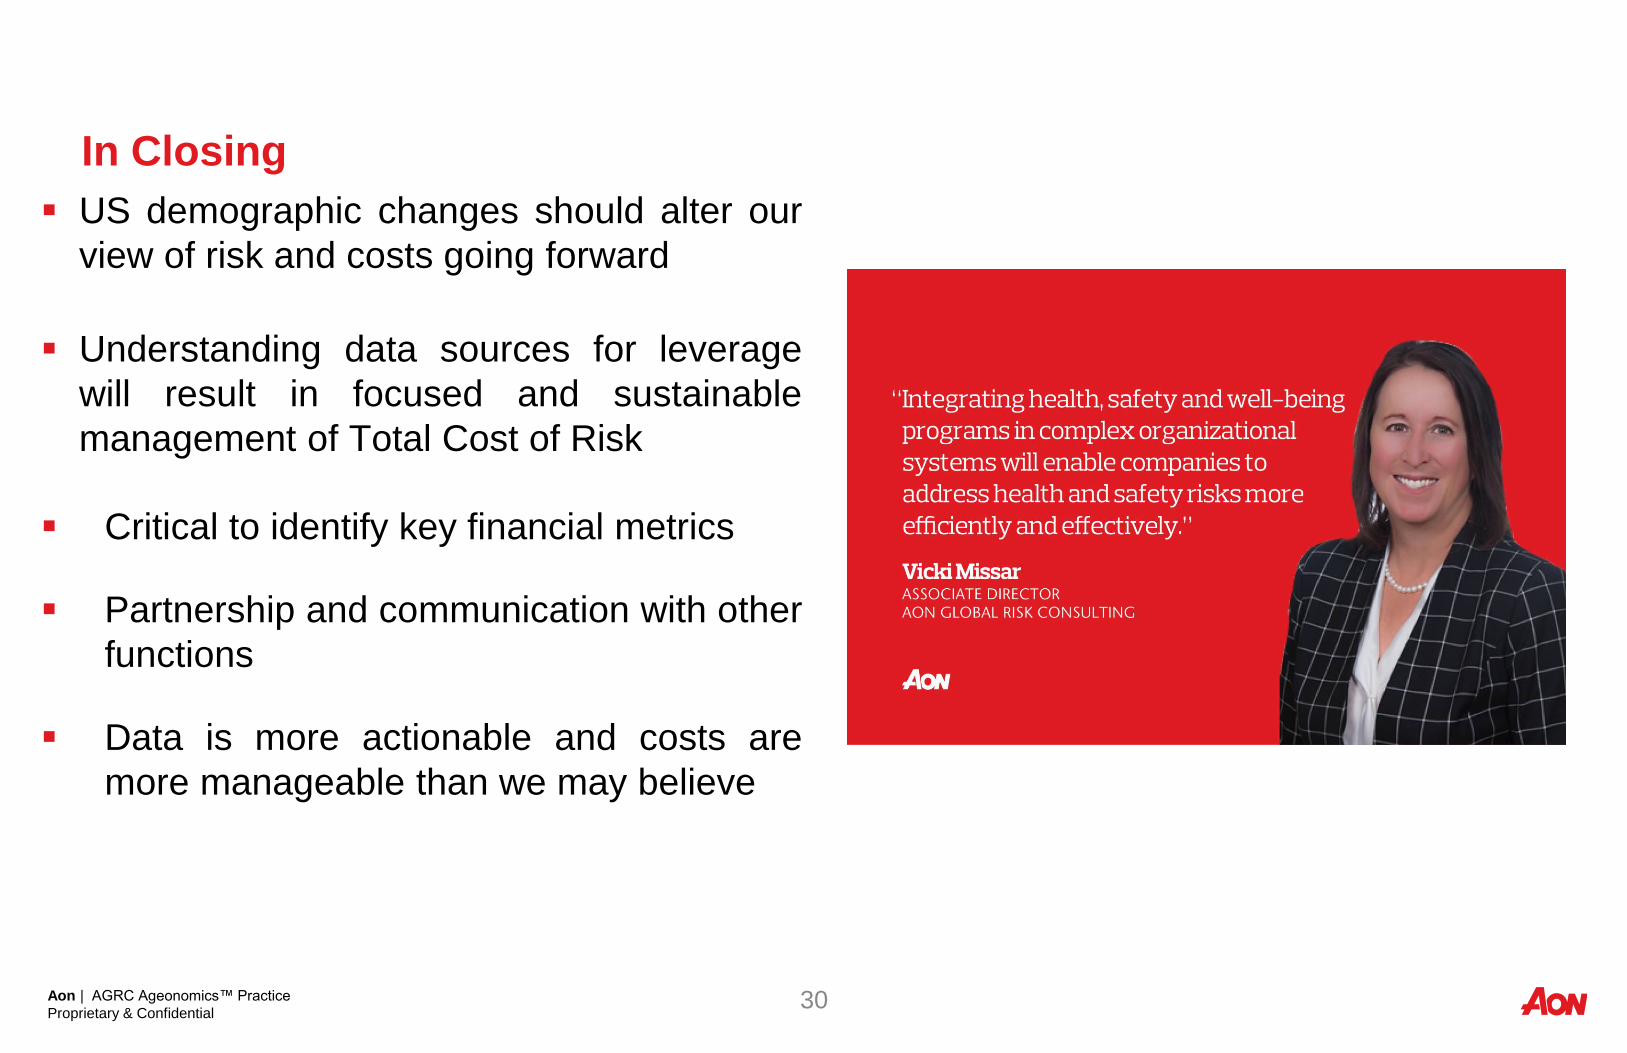
US demographic changes should alter our
view of risk and costs going forward
Understanding data sources for leverage
will result in focused and sustainable
management of Total Cost of Risk
Critical to identify key financial metrics
Partnership and communication with other
functions
Data is more actionable and costs are
more manageable than we may believe
In Closing
30