Embed Size (px)
Citation preview

1
Agent Network Accelerator Survey: India Country Report 2015
August, 2015
Contributing Authors: Aakash Mehrotra and Denny George
With Special Thanks To: Mike McCaffrey, Leena A.M Anthony, and Dorieke Kuijpers

2
Through the financial support of the Bill & Melinda Gates Foundation, MicroSave is conducting a four-year research project in the following eight focus countries as
part of the Agent Network Accelerator (ANA) Project:
Research findings are disseminated through The Helix Institute of Digital Finance. Helix is a world-class institution providing operational training for
digital finance practitioners.
Bangladesh India Indonesia Pakistan
Kenya Nigeria Tanzania Uganda
Africa Asia
Project Description

3
The research focuses on operational determinants of success in agent network management, specifically:
Focus Of Research
Quality of Provider Support
Agent & Agency
Demographics
Core Agency Operations
Liquidity Management
Business Model Viability

4
India Overview
Agent networks in India are still nascent and differ from most other countries in that their proliferation has been driven primarily by government policy (as opposed to business considerations).
This has led to an extremely high proportion of agents in rural areas, agents conducting transactions for government programs like PMJDY, and some of the agents being paid a monthly salary.
India is a country with 1.2 billion people, 28 states, 100+ Agent Network Managers (ANMs), five major telecoms, 27 public sector banks, 23 private banks, and 100+ rural and cooperative banks participating in delivery of Digital Financial Services (DFS).
These factors have led to significant variations in the models providers have used to generate revenue, and build agent networks. Therefore while overall country metrics for India may be roughly compared to other nations, it must be clearly understood that these metrics often mask large variations across multiple dimensions, many of which are presented and explained in this report.
5
DFS/Financial Inclusion (FI) Timeline India
November 2005 : Reserve Bank of India (RBI) advised banks to provide “no frills” accounts and expand banking outreach to larger sections of population.
January 2006: Banks allowed to use services of NGOs, SHGs, MFIs as business correspondents to extend banking services.
April 2006 : 1 district in each state identified by SLBC for 100% FI.
2007: 6 million new accounts added and 2.6 million SHGs linked to banks touching 40 million households.
2007-08: Two funds created by GoI: 1) Financial Inclusion Fund, 2) Financial Inclusion Technology Fund worth $ 125 million each.
August 2010: Unique Identification Development Authority of India (UIDAI) based Aadhaar project initiated to provide ‘identity infrastructure’ for financial inclusion.
2011: Swabhimaan scheme launched to cover more than 74,000 villages with a population over 2,000 with banking facilities. Number of bank accounts increased by approx. 100 million in 2011-2013.
September 2010: RBI allowed for–profit companies excluding NBFCs to act as BC.
August 2014: Pradhan Mantri Jan Dhan Yojana (PMJDY) launched with the aim of linking every household with banking facilities. Phase II of PMJDY launched in 2015.
2015: 120 million accounts opened under PMJDY. 100% household gets financially included.
December 2013: The Committee on Comprehensive Financial Services for Small Businesses and Low Income Households (Chairperson: Dr. Nachiket Mor) submitted its final report.
April 2014: RBI released draft guidelines for licensing of ‘payment banks’ or ‘differentiated banks’.
2005 2006 2007-2008 2010 2011-2012 2014-2015 2013
6
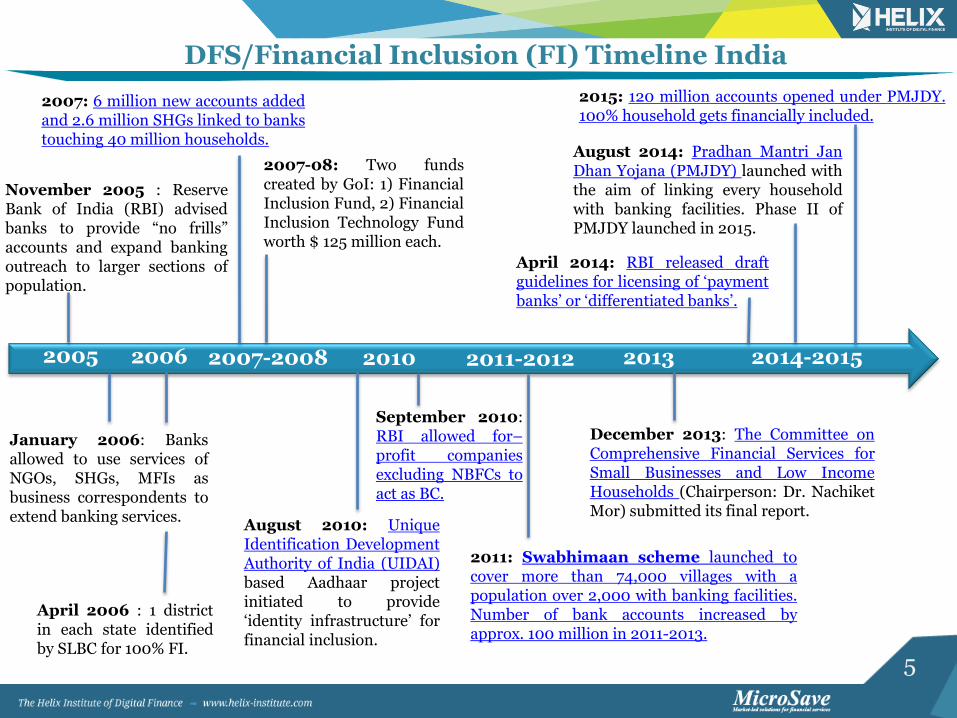
There Are Three Major Agent Network Models In India
Banks Directly Manage Agent Networks
Specialised ANMs (BCNMs)* Manage Agent
Networks
MNOs Manage Agent Networks
Banks
Agents
• Product ownership • Agent network
establishment and day to day management
• Agent remuneration
• Liquidity management
• Customer and agent support
• Monitoring and supervision
• Customer acquisition
• Transaction facilitation
• Last mile customer support
Banks
• Product ownership • Remuneration to
BCNMs • Liquidity management • Customer support • Monitoring and
supervision of BCNMs
BCNMs
• Agent network establishment and day to day management
• Marketing and promotion
• Agent remuneration • Liquidity management • Customer and agent
support • Monitoring and
supervision of agents
• Customer acquisition • Transaction facilitation • Last mile customer
support
Banks
• Product ownership • Remuneration to MNOs • Monitoring and
supervision of MNOs
MNOs
• Working with banks to assist in product design
• Agent network establishment and day to day management
• Marketing and promotion
• Agent remuneration • Liquidity management • Customer and agent
support • Monitoring and
supervision of agents
• Customer acquisition • Transaction facilitation • Last mile customer
support
Agents Agents * BCNM= Business Correspondent Network Manager

7
Agent and Agency Demographics
8
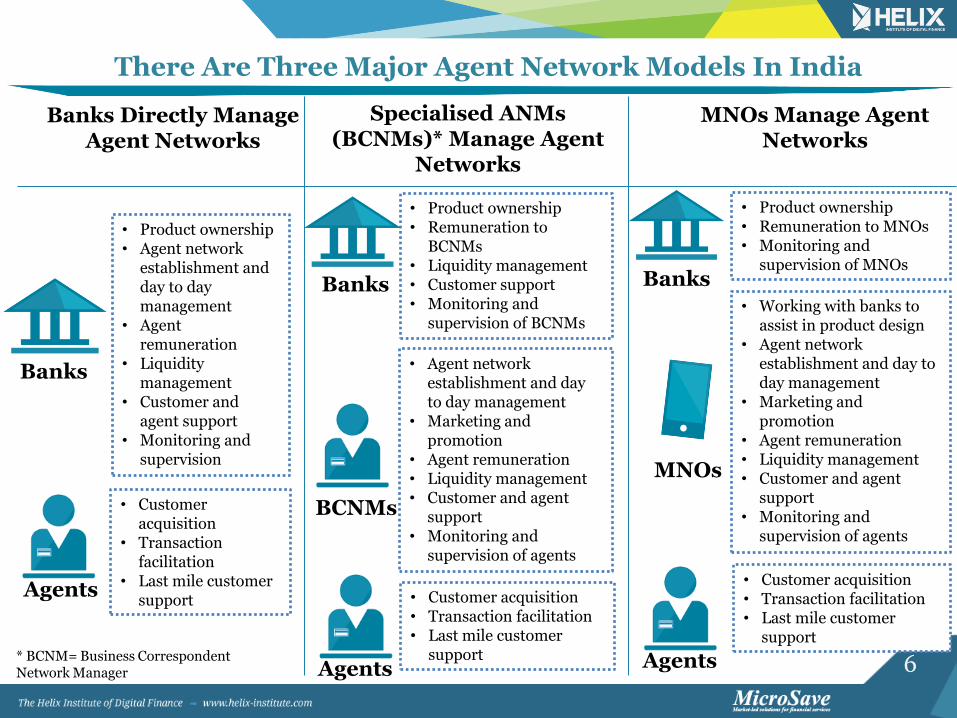
205 8%
404 15%
2073 77%
Achieved Sample*
Metro
Other Urban
Rural
Total Sample Size
Agent Network Model Exclusivity
BCNM Directly
Linked To Bank
Non-Dedicated
MNO Non-
Exclusive Exclusive Dedicated
Dedication
Sample Profile**
The Research Is Based On 2,682 Nationally Representative Agent Interviews*
*Only those agents that conduct at least one transaction per month (active agents) were interviewed as part of the ANA survey. **This table summarises agent demographics. Due to the different structure in urban and rural definitions and the sampling methodology adopted in India, please be cautious while comparing it with earlier surveys of Helix. The details are provided in Appendix 1
2, 682 463 17%
1,730 65%
489 18%
2,393 89%
289 11%
1,786 67%
896 33%
59
75
131
160
160
164
168
180
224
244
253
375
489
0 200 400 600
Assam
Delhi
Orissa
Karnataka
Tamil Nadu
Andhra Pradesh
Gujarat
Rajasthan
Maharashtra
Madhya Pradesh
West Bengal
Bihar
Uttar Pradesh Data was collected between January and March 2015.
Number of Respondents
9
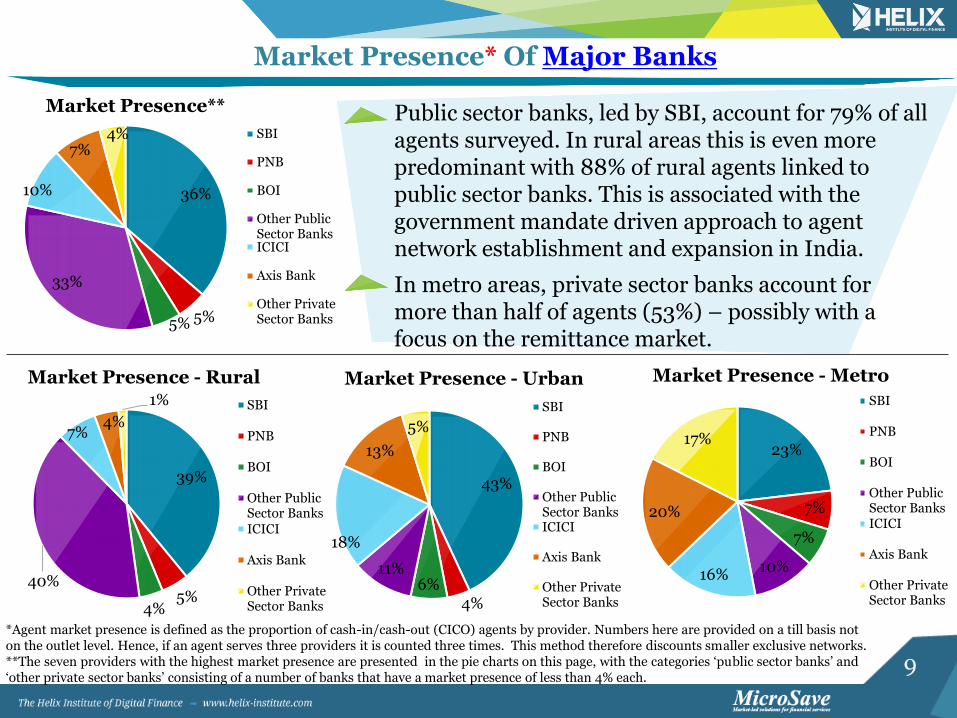
*Agent market presence is defined as the proportion of cash-in/cash-out (CICO) agents by provider. Numbers here are provided on a till basis not on the outlet level. Hence, if an agent serves three providers it is counted three times. This method therefore discounts smaller exclusive networks. **The seven providers with the highest market presence are presented in the pie charts on this page, with the categories ‘public sector banks’ and ‘other private sector banks’ consisting of a number of banks that have a market presence of less than 4% each.
Market Presence* Of Major Banks
Public sector banks, led by SBI, account for 79% of all agents surveyed. In rural areas this is even more predominant with 88% of rural agents linked to public sector banks. This is associated with the government mandate driven approach to agent network establishment and expansion in India.
36%
5% 5%
33%
10%
7% 4%
Market Presence**
SBI
PNB
BOI
Other PublicSector BanksICICI
Axis Bank
Other PrivateSector Banks
39%
5% 4%
40%
7% 4%
1%
Market Presence - Rural
SBI
PNB
BOI
Other PublicSector BanksICICI
Axis Bank
Other PrivateSector Banks
43%
4% 6%
11%
18%
13%
5%
Market Presence - Urban
SBI
PNB
BOI
Other PublicSector BanksICICI
Axis Bank
Other PrivateSector Banks
23%
7%
7%
10% 16%
20%
17%
Market Presence - Metro
SBI
PNB
BOI
Other PublicSector BanksICICI
Axis Bank
Other PrivateSector Banks
In metro areas, private sector banks account for more than half of agents (53%) – possibly with a focus on the remittance market.

10
89% 87%
71%
44%
34% 28%
0%
10%
20%
30%
40%
50%
60%
70%
80%
90%
100%
Exclusivity
% o
f R
es
po
nd
en
ts
Exclusivity In ANA Countries
India Kenya Uganda
Bangladesh Pakistan Tanzania
70% 67%
44%
36%
23%
4%
0%
10%
20%
30%
40%
50%
60%
70%
80%
90%
100%
Dedication
% o
f R
es
po
nd
en
ts
Dedication In ANA Countries
Tanzania India Uganda
Kenya Pakistan Bangladesh
Extent Of Exclusivity And Dedication Is High
Both exclusivity and dedication are extremely high compared to most other countries. The confluence of these factors makes business model viability difficult.
Exclusivity is lower at 65% in metro areas, potentially due to the highly competitive domestic remittance market.
Only 35% agents in metro areas were found to be dedicated.
11
Most Agents In Business For Less Than Two Years
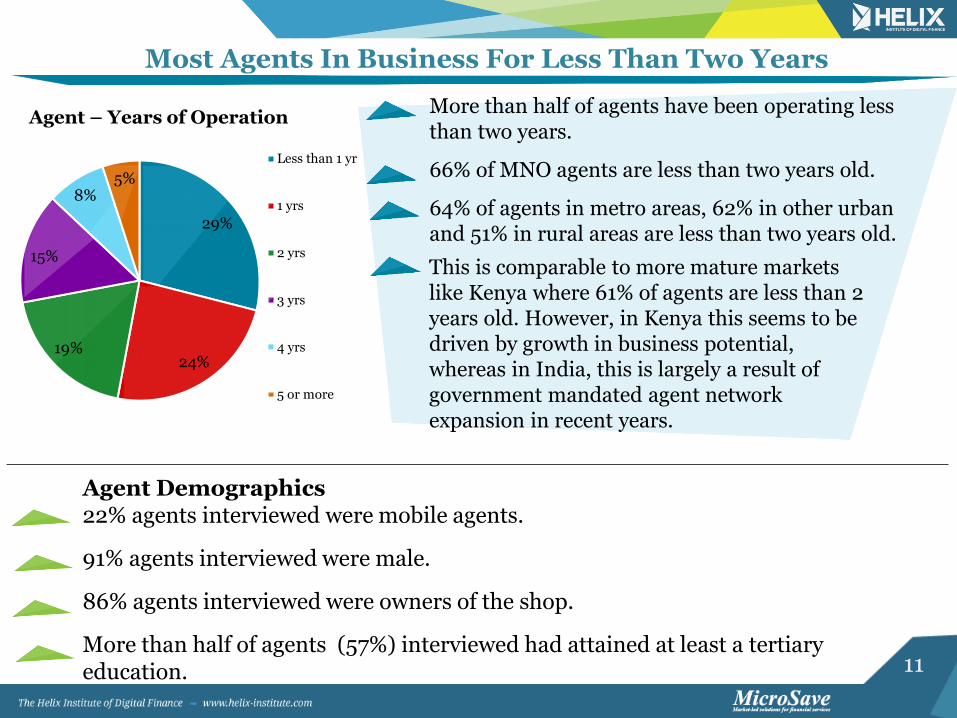
Agent Demographics 22% agents interviewed were mobile agents.
91% agents interviewed were male.
86% agents interviewed were owners of the shop.
More than half of agents (57%) interviewed had attained at least a tertiary education.
29%
24% 19%
15%
8% 5%
Agent – Years of Operation
Less than 1 yr
1 yrs
2 yrs
3 yrs
4 yrs
5 or more
More than half of agents have been operating less than two years.
66% of MNO agents are less than two years old.
64% of agents in metro areas, 62% in other urban and 51% in rural areas are less than two years old.
This is comparable to more mature markets like Kenya where 61% of agents are less than 2 years old. However, in Kenya this seems to be driven by growth in business potential, whereas in India, this is largely a result of government mandated agent network expansion in recent years.

12
Core Agency Operations

13
Products And Services Offered Differ Across Locations
76% 79% 73%
51% 44%
18% 18% 10% 13%
7%
0%
10%
20%
30%
40%
50%
60%
70%
80%
90%
Acc
ou
nt
Op
enin
g*
Ca
sh-I
n
Ca
sh-O
ut
PM
JD
Y
Do
mes
tic
Rem
itta
nce
s
G2
P P
ay
me
nts
Bil
l P
ay
men
ts
Insu
ran
ce
Air
tim
e T
op
-Up
Cre
dit
% o
f R
es
po
nd
en
ts
Rural Other Urban Metro Country
These are high value transactions concentrated mostly on the remittance corridors.
*Account opening doesn’t include accounts opened under PMJDY.
Government mandates have contributed to the increase of the number of agents offering account opening services.
Only a fifth of agents interviewed were offering G2P payments, potentially as a result of low overall commissions offered by the government.
14
Median Transaction Volumes Are Low When Compared To Other Countries
8
15
45
31 30
13
0
5
10
15
20
25
30
35
40
45
50
Pakistan Bangladesh Kenya '14 Tanzania Uganda India
Me
dia
n T
ra
ns
ac
tio
ns
Pe
r D
ay
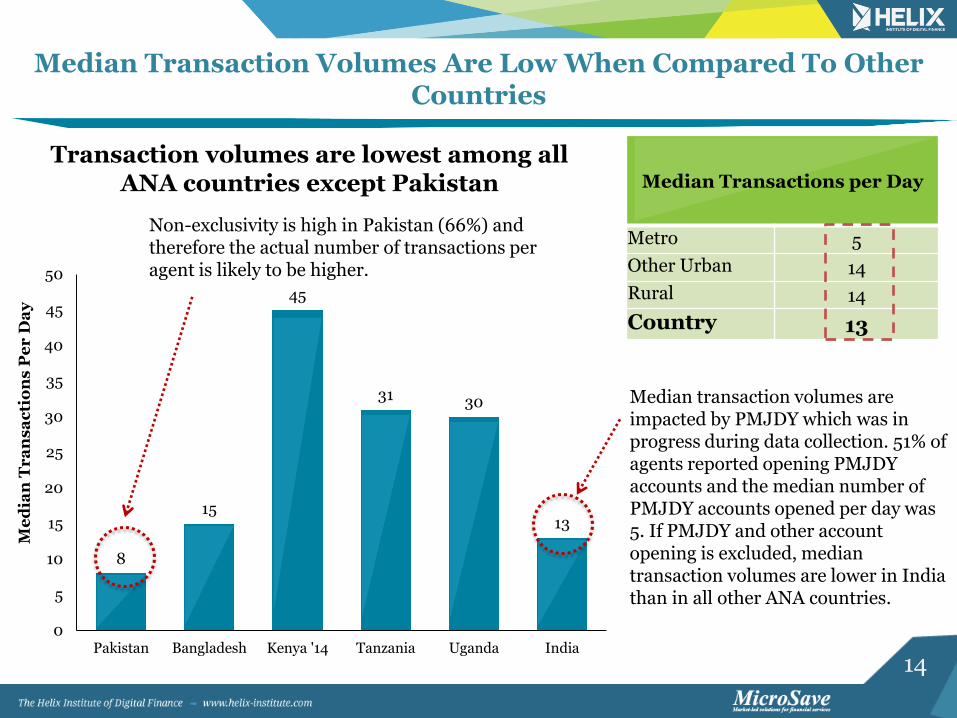
Transaction volumes are lowest among all ANA countries except Pakistan
Non-exclusivity is high in Pakistan (66%) and therefore the actual number of transactions per agent is likely to be higher.
Median Transactions per Day
Metro 5
Other Urban 14
Rural 14
Country 13
Median transaction volumes are impacted by PMJDY which was in progress during data collection. 51% of agents reported opening PMJDY accounts and the median number of PMJDY accounts opened per day was 5. If PMJDY and other account opening is excluded, median transaction volumes are lower in India than in all other ANA countries.

15
Transaction Volumes And Values Of Products Offered
Transaction Volume (median/month) Transaction Value (median in US$)
India Rural Other Urban
Metro India Rural Other Urban
Metro
Cash-in 90 90 90 50 32 32 32 81
Cash-out 90 90 90 30 32 32 32 81
Domestic Remittances
30 25 21 60 48 40 81 161
Account Opening 86 86 97 25
• Cash-in volume in metro areas is 56% of the country median, while cash-out volume is only 33%, and the volume of domestic remittances is twice as high.
• CICO values in metro areas are 2.5 times the country median; and the metro median value of domestic remittances is almost 3.5 times the country median.
• These factors highlight the fact that metros are the origination points for domestic remittances across the country.
The variations in volumes and values of different transaction types (especially account opening) provide an understanding of how complicated a predictor of revenue they can be.

16
Largest Stated Barriers To Doing More Business*
* Agents ranked a minimum of three of these seven dimensions. The above figures are a weighted average of the fist three choices, where taller bars mean a higher relative ranking.
Lack of awareness ofservice among
customers
Individual clientsdemand for service is
not very regular
Too many otheragents competing for
business
Lack of resources tobuy enough float
Lack of adequatesupport from BC
company
Doing more businessmeans too much
more risk of fraud oroccurrence of
robbery.
This points at a need for more aggressive marketing activities to increase awareness among potential customers.
This is substantiated by Intermedia’s Wave II research report published in June 2015 which states that 48% of bank accounts in India are inactive. Government of India’s PMJDY website cites that 46% of accounts have no balance.

17
Pradhan Mantri Jan Dhan Yojana (PMJDY)
Median Transaction Volume (Monthly)
India Rural Other Urban
Metro
PMJDY 150 150 300 N/A*
During the time of data collection, account opening for PMJDY was being promoted and accounted for 38% of all transactions. However significant account opening is also happening for non-PMJDY accounts. These two transaction types account for 60% of all transactions by volumes in India. Since account opening is not prevalent in metro areas, metro areas show much lower transaction volumes.
Pradhan Mantri Jan Dhan Yojana (PMJDY) was launched on August 28, 2014 with the goal to provide all households in the country with banking facilities by January 26, 2015. PMJDY consists of six pillars:
Universal access to banking facilities, Providing basic bank accounts with overdraft facility and RuPay Debit card to all households, Financial literacy to enable use of financial products, A credit guarantee fund to mitigate risks stemming from overdraft facilities extended to these accounts, Microinsurance for all account holders under PMJDY, and Pension schemes such as Atal Pension Yojana.
*Sample count in metro areas for PMJDY was only 5, which is not large enough to report on.

18
Business Model Viability
19
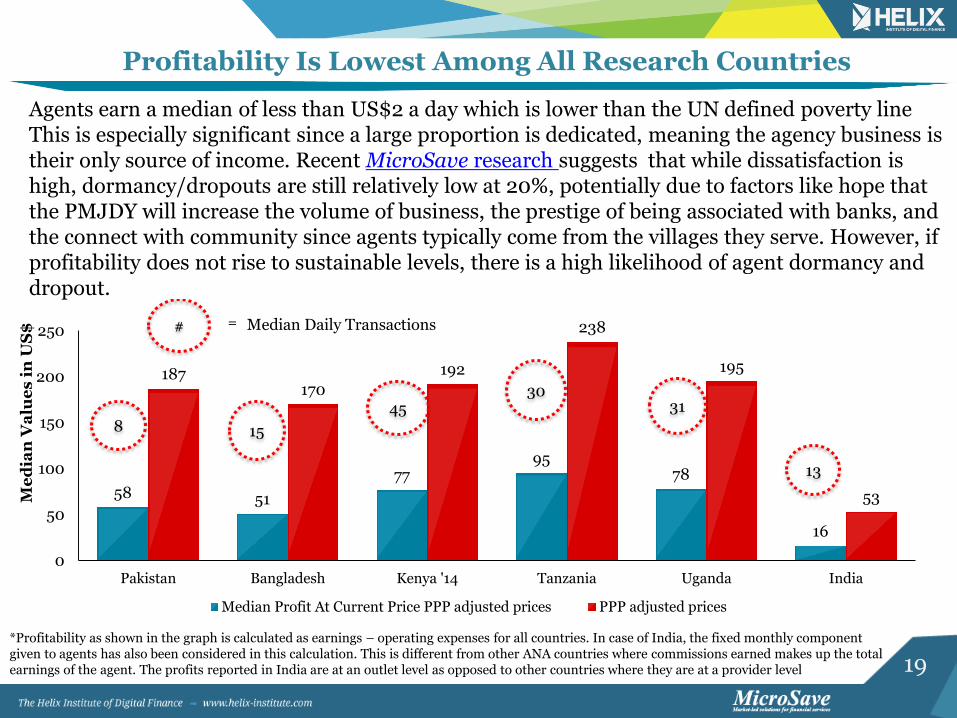
Profitability Is Lowest Among All Research Countries
58 51
77 95
78
16
187 170
192
238
195
53
0
50
100
150
200
250
Pakistan Bangladesh Kenya '14 Tanzania Uganda India
Me
dia
n V
alu
es
in
US
$
Median Profit At Current Price PPP adjusted prices PPP adjusted prices
# = Median Daily Transactions
8 15
45 30
31
13
*Profitability as shown in the graph is calculated as earnings – operating expenses for all countries. In case of India, the fixed monthly component given to agents has also been considered in this calculation. This is different from other ANA countries where commissions earned makes up the total earnings of the agent. The profits reported in India are at an outlet level as opposed to other countries where they are at a provider level
Agents earn a median of less than US$2 a day which is lower than the UN defined poverty line This is especially significant since a large proportion is dedicated, meaning the agency business is their only source of income. Recent MicroSave research suggests that while dissatisfaction is high, dormancy/dropouts are still relatively low at 20%, potentially due to factors like hope that the PMJDY will increase the volume of business, the prestige of being associated with banks, and the connect with community since agents typically come from the villages they serve. However, if profitability does not rise to sustainable levels, there is a high likelihood of agent dormancy and dropout.

20
A Significant Proportion Of Agents Make Losses
28%
4%
15%
11% 9% 8%
12% 13%
0%
5%
10%
15%
20%
25%
30%
Loss Break even $ 1-15 $ 16-30 $ 31-45 $ 46-60 $ 61-100 $100+
% o
f R
esp
on
de
nts
*Profitability as shown in the graph is calculated as earnings – operating expenses for all countries. In case of India, the fixed monthly component given to agents has also been considered in this calculation.
32% of agents report not being profitable
Median Profitability per Month in US$ (Including
the fixed component)
Metro 61
Other Urban 5
Rural 16
Country 16
Agents in metros make significantly higher profits, potentially due to higher transaction values and the prevalence of domestic remittances.
24% of agents receive a fixed monthly component from service providers (median of US$55), shoring up their revenue. If we exclude this factor from the analysis, median profits fall to US$11, PPP adjusted monthly equivalent of the UN defined extreme poverty level of US$1.25 per day.
52% of agents report profits below
US$18 and 44% report profits below
US$11, the PPP adjusted monthly
equivalents of UN defined poverty line
of US$2 and extreme poverty line of
US$1.25 per day respectively

21
Product Mix Has A Significant Impact on Agent Revenues
40 44 47 48 48 48
56
80 81
0
10
20
30
40
50
60
70
80
90
G2
P P
ay
men
ts
Air
tim
e T
op
-up
En
rolm
ent
/ A
cco
un
tO
pen
ing
PM
JD
Y A
cco
un
t O
pe
nin
g
Ca
sh-i
n/C
ash
-ou
t
Bil
l P
ay
men
ts
Do
me
stic
Rem
itta
nce
s
Cre
dit
Insu
ran
ce
Ag
en
t r
ev
en
ue
s P
er
Mo
nth
(U
S$
)
Agents who offered remittances earn 40% more revenues as compared to a country median of US$ 40.
Agents who offered credit and/or insurance earn the highest revenues but are fewer in number. Only 7% and 10% of respondents offered credit and/or insurance respectively.
Earnings for agents offering G2P payments were the lowest, reflecting the low commissions paid on G2P.

22
Operating Expenses Are High In India
40 38
113
40
-32
-48 -56
-32
-80
-60
-40
-20
20
40
60
80
100
120
140
Rural Other Urban Metro India
Me
dia
n V
alu
es
in
US
$
Median Commissions/month Median Opex/month
In part because of liquidity management challenges (see below) operating expenses in India are higher than in other South Asian countries (Pakistan: US$3), Bangladesh: US$6) and comparable to those in East African nations ( Kenya-2014:US$35, Tanzania: US$25, Uganda: US$58).
Agents in metros conduct double the number of domestic remittance transactions with three times the value when compared to the country median.
Past MicroSave research indicates out that rent, electricity and travel expenses for liquidity management constitute bulk of the operational expenses for agents. The expenses are high compared to other South Asian countries since agents in India are primarily dedicated as
opposed to Pakistan (77% non-dedicated) and Bangladesh (96% non-dedicated), and Indian agents have to allocate full costs of the outlet to the agency business.
Previous studies indicate that agents in India expect a minimum income of US$ 118 per month for the business to be considered sustainable.

23
Front End Devices Used And Extent Of Dedication Are Influencers Of Operating Expenses
32 32
48
0
10
20
30
40
50
60
Mobile phones POS Devices Kiosks*
Me
dia
n O
pe
ra
tio
na
l E
xp
en
se
s P
er
Mo
nth
(U
S$
)
Front End Devices Used
32
24
0
5
10
15
20
25
30
35
Dedicated Non-Dedicated
Me
dia
n O
pe
ra
tio
na
l E
xp
en
se
s P
er
Mo
nth
(U
S$
)
Dedication
Operating expenses for non-dedicated agents are 25% lower than the country median.
*Kiosks often use desktops or laptops along with biometric authentication devices.
Operating expenses for where kiosks are used are higher potentially due to higher maintenance and space requirements.
See Transaction Economics for Technology Enabled Branchless Banking
24
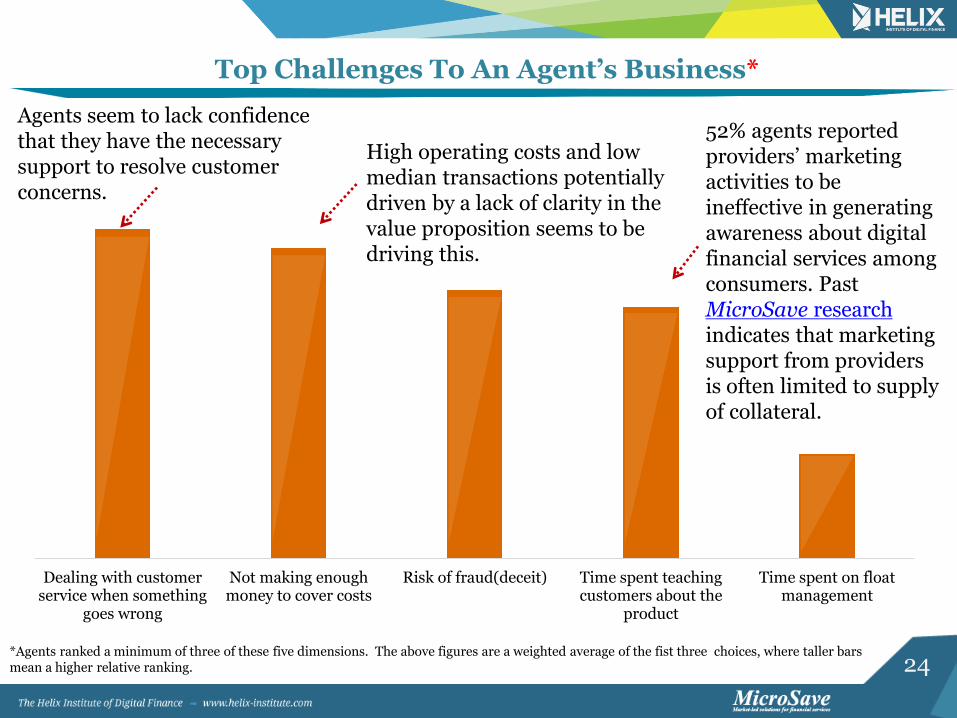
Top Challenges To An Agent’s Business*
Dealing with customerservice when something
goes wrong
Not making enoughmoney to cover costs
Risk of fraud(deceit) Time spent teachingcustomers about the
product
Time spent on floatmanagement
High operating costs and low median transactions potentially driven by a lack of clarity in the value proposition seems to be driving this.
Agents seem to lack confidence that they have the necessary support to resolve customer concerns.
52% agents reported providers’ marketing activities to be ineffective in generating awareness about digital financial services among consumers. Past MicroSave research indicates that marketing support from providers is often limited to supply of collateral.
*Agents ranked a minimum of three of these five dimensions. The above figures are a weighted average of the fist three choices, where taller bars mean a higher relative ranking.
25
Liquidity Management
26
76%
14% 13% 8% 6% 4% 3% %
20%
40%
60%
80%
100%
Bank Provider ATM Aggregator Ondemand Surroundingretailor
Another agent
% o
f R
es
po
nd
en
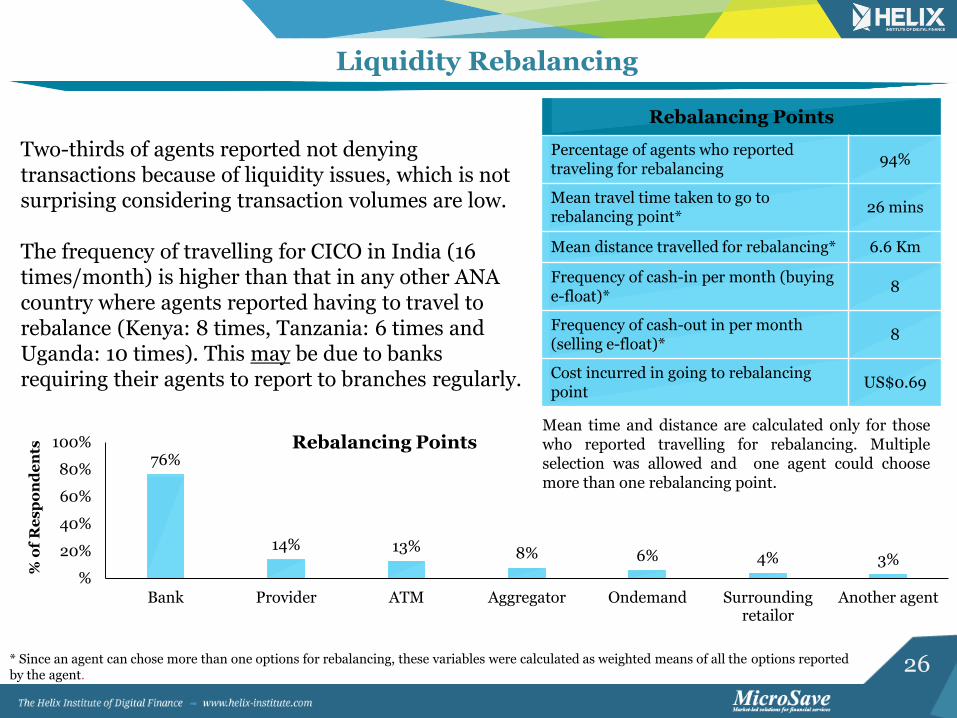
ts Rebalancing Points
Liquidity Rebalancing
Rebalancing Points
Percentage of agents who reported traveling for rebalancing
94%
Mean travel time taken to go to rebalancing point*
26 mins
Mean distance travelled for rebalancing* 6.6 Km
Frequency of cash-in per month (buying e-float)*
8
Frequency of cash-out in per month (selling e-float)*
8
Cost incurred in going to rebalancing point
US$0.69
Two-thirds of agents reported not denying transactions because of liquidity issues, which is not surprising considering transaction volumes are low. The frequency of travelling for CICO in India (16 times/month) is higher than that in any other ANA country where agents reported having to travel to rebalance (Kenya: 8 times, Tanzania: 6 times and Uganda: 10 times). This may be due to banks requiring their agents to report to branches regularly.
Mean time and distance are calculated only for those who reported travelling for rebalancing. Multiple selection was allowed and one agent could choose more than one rebalancing point.
* Since an agent can chose more than one options for rebalancing, these variables were calculated as weighted means of all the options reported by the agent.
27
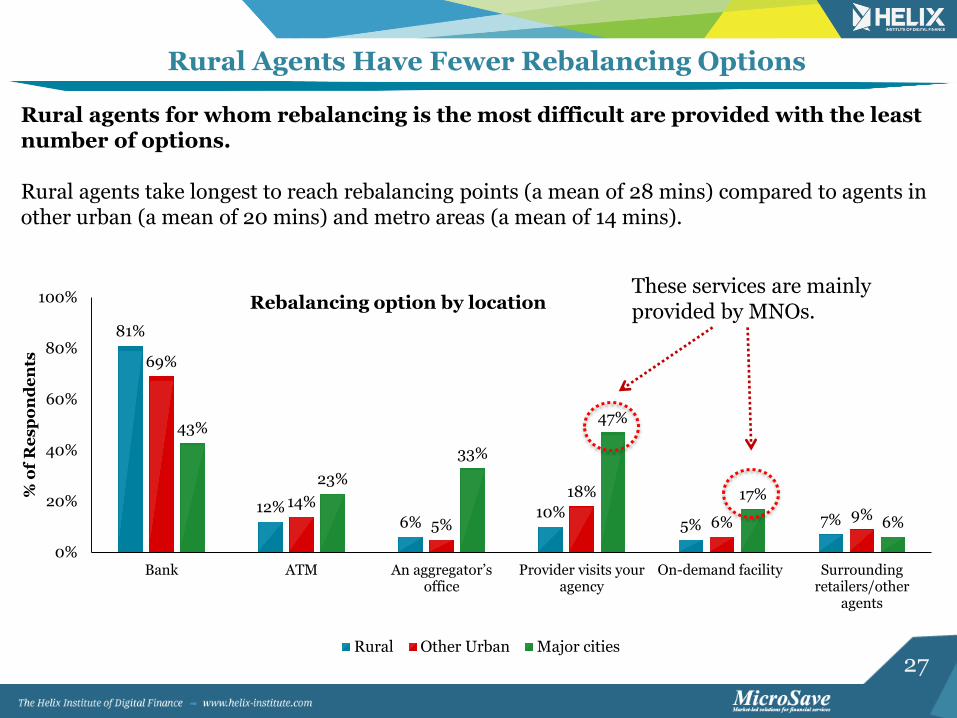
Rural Agents Have Fewer Rebalancing Options
81%
12% 6%
10% 5% 7%
69%
14%
5%
18%
6% 9%
43%
23%
33%
47%
17%
6%
0%
20%
40%
60%
80%
100%
Bank ATM An aggregator’s office
Provider visits youragency
On-demand facility Surroundingretailers/other
agents
% o
f R
esp
on
de
nts
Rebalancing option by location
Rural Other Urban Major cities
Rural agents for whom rebalancing is the most difficult are provided with the least number of options. Rural agents take longest to reach rebalancing points (a mean of 28 mins) compared to agents in other urban (a mean of 20 mins) and metro areas (a mean of 14 mins).
These services are mainly provided by MNOs.
28
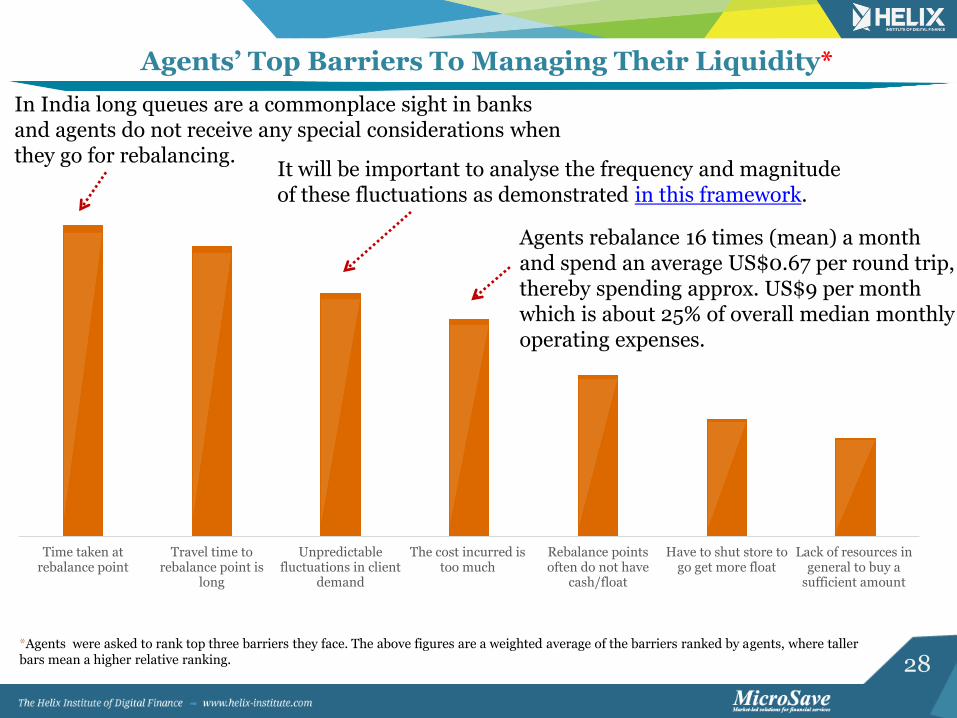
Agents’ Top Barriers To Managing Their Liquidity*
Time taken atrebalance point
Travel time torebalance point is
long
Unpredictablefluctuations in client
demand
The cost incurred istoo much
Rebalance pointsoften do not have
cash/float
Have to shut store togo get more float
Lack of resources ingeneral to buy a
sufficient amount
*Agents were asked to rank top three barriers they face. The above figures are a weighted average of the barriers ranked by agents, where taller bars mean a higher relative ranking.
It will be important to analyse the frequency and magnitude of these fluctuations as demonstrated in this framework.
In India long queues are a commonplace sight in banks and agents do not receive any special considerations when they go for rebalancing.
Agents rebalance 16 times (mean) a month and spend an average US$0.67 per round trip, thereby spending approx. US$9 per month which is about 25% of overall median monthly operating expenses.

29
Quality of Provider Support

30
Training: 59% of agents received training. This percentage is the lowest compared to the baselines done in other ANA research countries*. Of those trained, 61% agents have undergone a refresher training. 36%
of these have received refresher training only once.
Quality Of Agent Support Is Low Compared to Other Countries
*Bangladesh (68%), Pakistan (62%) Kenya II (92%), Tanzania (79%), and Uganda (94%) **Bangladesh (69%), Pakistan (76%), Kenya II (86%) Tanzania (76%) and Uganda (33%)
Operational Support: 58% of agents reported regular visits** (68% in major cities). This percentage is low compared to all other ANA countries except Uganda. Of those visited, 60% are visited at least monthly and 32% reported ‘no fixed frequency’ of visits.
Call Center: Only 59% of agents know that there is a call center to resolve their queries and call it a median of 2 times a month. This implies low awareness and usage of call center.
31
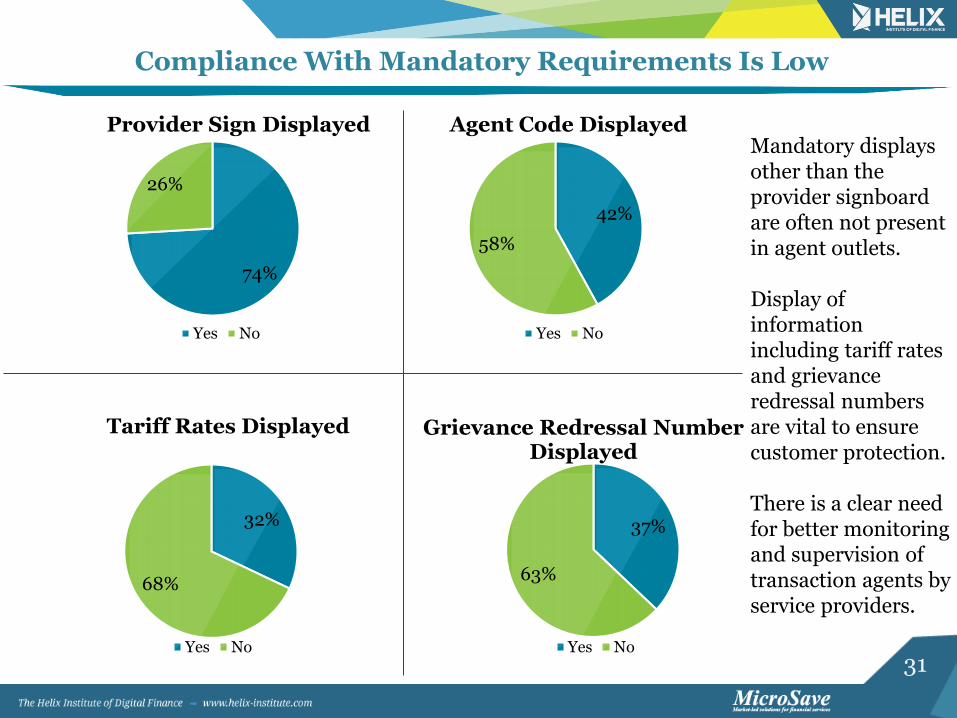
Compliance With Mandatory Requirements Is Low
74%
26%
Provider Sign Displayed
Yes No
42%
58%
Agent Code Displayed
Yes No
32%
68%
Tariff Rates Displayed
Yes No
37%
63%
Grievance Redressal Number Displayed
Yes No
Mandatory displays other than the provider signboard are often not present in agent outlets. Display of information including tariff rates and grievance redressal numbers are vital to ensure customer protection. There is a clear need for better monitoring and supervision of transaction agents by service providers.
32
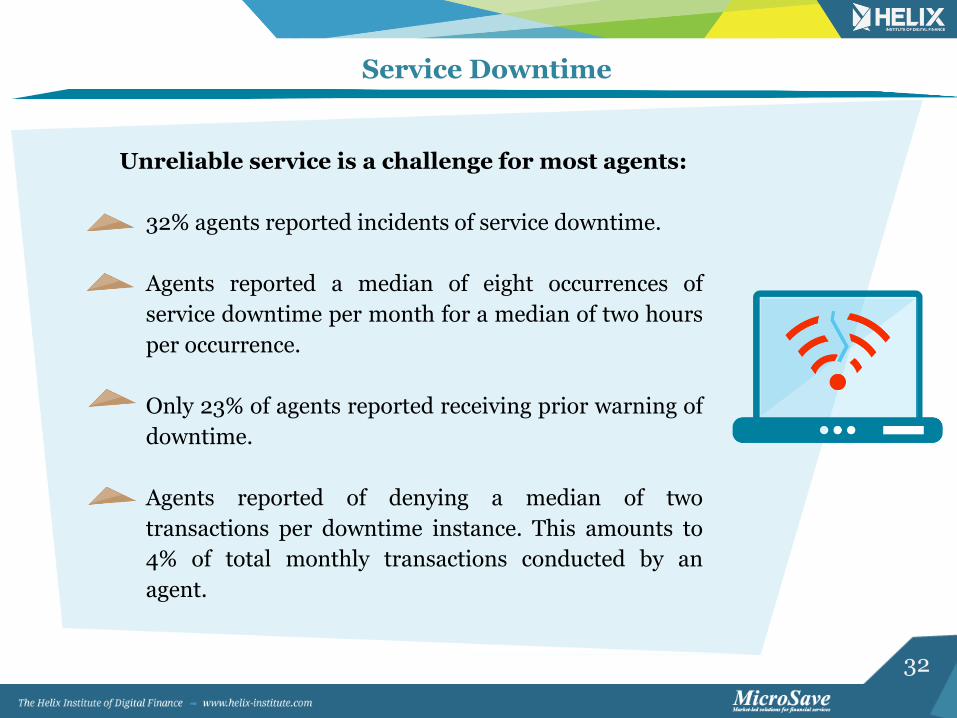
Service Downtime
Unreliable service is a challenge for most agents:
32% agents reported incidents of service downtime.
Agents reported a median of eight occurrences of
service downtime per month for a median of two hours
per occurrence.
Only 23% of agents reported receiving prior warning of
downtime.
Agents reported of denying a median of two
transactions per downtime instance. This amounts to
4% of total monthly transactions conducted by an
agent.
33
Key Highlights Across Major Agent Network Management Models

34
Differences Between The Three Models
79%
91% 94%
50%
60%
70%
80%
90%
100%
MNO BCNM Direct to Bank
% o
f R
es
po
nd
en
ts
Exclusivity
14%
36% 31%
68%
53% 53%
19% 11%
16%
0%
20%
40%
60%
80%
100%
Rural Other Urban Metro
% o
f R
es
po
nd
en
ts
ANM Model Location Wise
MNO BCNM Direct to Bank
37%
75% 68%
0%
20%
40%
60%
80%
100%
MNO BCNM Direct to Bank
% o
f R
es
po
nd
en
ts
Dedication
Close to one third of agents in urban areas are MNO agents.
MNOs have seen limited success in making inroads to rural areas.
Across locations, a majority of agents are managed by BCNMs.

35
Profitability* By Model
8 10
24 19
40
64
-16
-32 -32 -40
-20
0
20
40
60
80
MNO BCNM Direct BankMe
dia
n V
alu
es
in
US
$
Median Profits Median Revenues Median Opex
# Monthly median transactions
5
15
17
*Since MNOs do not get a fixed monthly component, to bring in parity while comparing profitability among the three models, the fixed component has not been included in profit calculations.
Since revenues of agents directly linked to banks are not shared with ANMs (as in the case of BCNMs), their revenues are higher despite lower transaction volumes.
Transaction type, volume and value affect the remuneration per transaction. That helps explain why BCNMs conduct three times as many transactions as MNO agents do, while the revenue they earn is only double that of MNO agents.
36
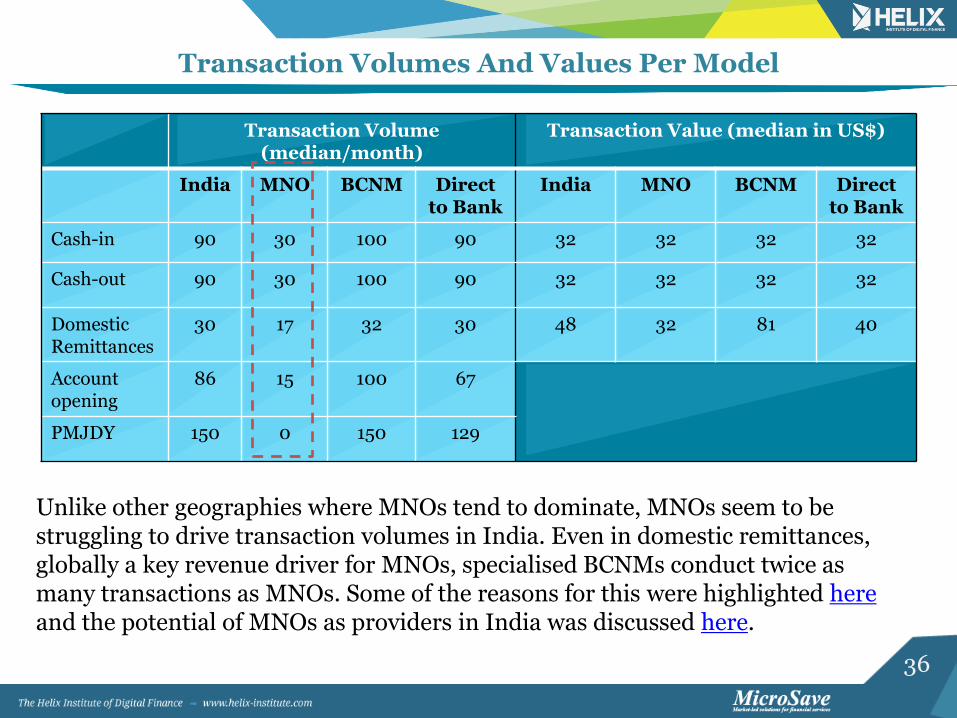
Transaction Volumes And Values Per Model
Transaction Volume (median/month)
Transaction Value (median in US$)
India MNO BCNM Direct to Bank
India MNO BCNM Direct to Bank
Cash-in 90 30 100 90 32 32 32 32
Cash-out 90 30 100 90 32 32 32 32
Domestic Remittances
30 17 32 30 48 32 81 40
Account opening
86 15 100 67
PMJDY 150 0 150 129
Unlike other geographies where MNOs tend to dominate, MNOs seem to be struggling to drive transaction volumes in India. Even in domestic remittances, globally a key revenue driver for MNOs, specialised BCNMs conduct twice as many transactions as MNOs. Some of the reasons for this were highlighted here and the potential of MNOs as providers in India was discussed here.
37
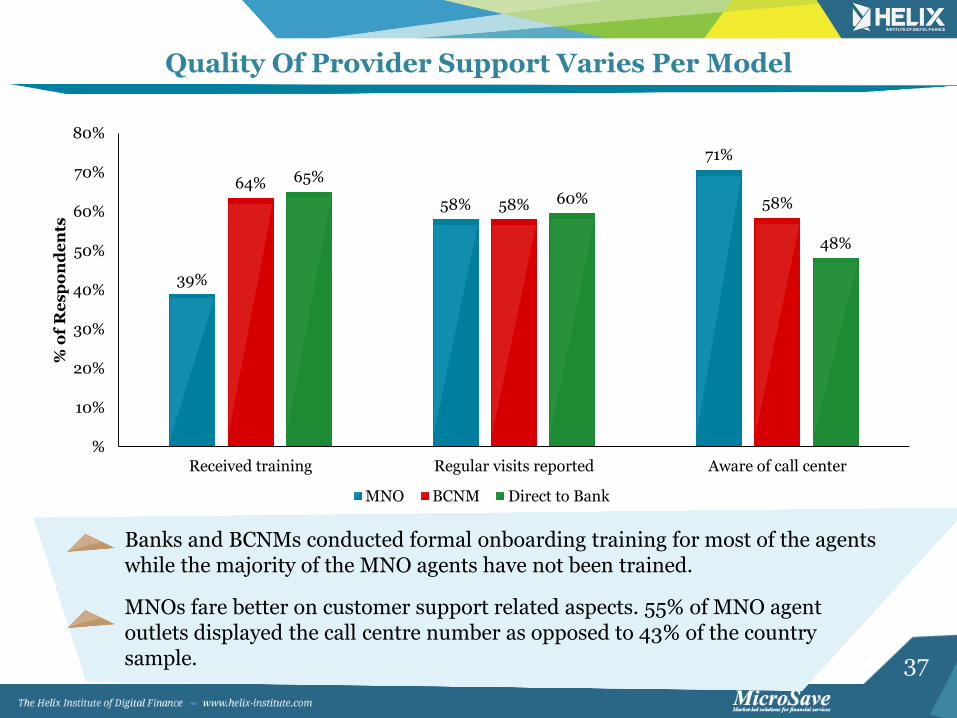
Quality Of Provider Support Varies Per Model
39%
58%
71%
64%
58% 58%
65%
60%
48%
%
10%
20%
30%
40%
50%
60%
70%
80%
Received training Regular visits reported Aware of call center
% o
f R
es
po
nd
en
ts
MNO BCNM Direct to Bank
MNOs fare better on customer support related aspects. 55% of MNO agent outlets displayed the call centre number as opposed to 43% of the country sample.
Banks and BCNMs conducted formal onboarding training for most of the agents while the majority of the MNO agents have not been trained.

38
Factors Likely To Promote Growth of Digital Financial Services in India
The government has issued payment bank licenses which effectively creates a more equitable playing field for MNOs and BCNMs.
The government of India has stressed the importance of government payment digitisation, thus giving DFS providers an opportunity to capitalise on this.
Through its mandates, the government of India has played an important role in developing the DFS supply side and is now taking on a more supportive role:
The PMJDY scheme was launched with the goal to provide all households in the country with banking facilities.
39
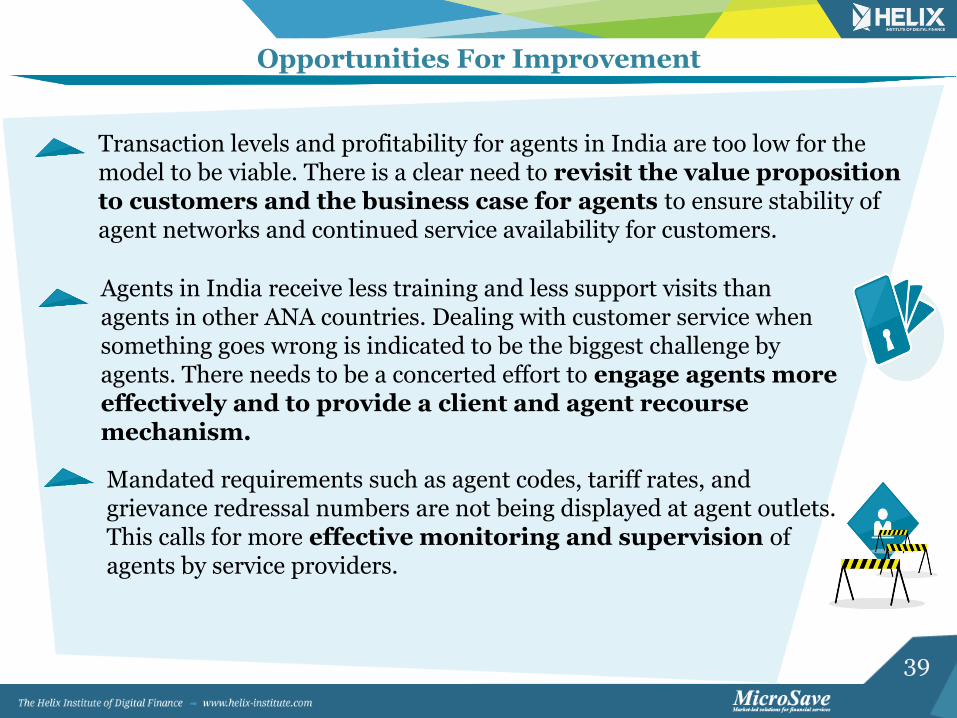
Opportunities For Improvement
Agents in India receive less training and less support visits than agents in other ANA countries. Dealing with customer service when something goes wrong is indicated to be the biggest challenge by agents. There needs to be a concerted effort to engage agents more effectively and to provide a client and agent recourse mechanism.
Transaction levels and profitability for agents in India are too low for the model to be viable. There is a clear need to revisit the value proposition to customers and the business case for agents to ensure stability of agent networks and continued service availability for customers.
Mandated requirements such as agent codes, tariff rates, and grievance redressal numbers are not being displayed at agent outlets. This calls for more effective monitoring and supervision of agents by service providers.
40
Appendix

41
Appendix I: Acronyms
Acronyms
1 SBI State Bank of India
2 PNB Punjab National Bank
3 BOI Bank of India
4 ICICI Industrial Credit and Investment Corporation of India
5 RBI Reserve Bank of India
6 PMJDY Pradhan Mantri Jan Dhan Yojana

42
Appendix II: Definitions
Definitions
1 Location Metro Comprises sample drawn from major cities of India: Delhi,
Mumbai, Kolkata, Chennai, Bangaluru and Hyderabad.
2 Other Urban Comprises sample drawn from other cities of India which includes
state capitals other than the ones covered in Metro.
Rural Sample drawn from villages (as mentioned in Census data). 3
5 Dedication Dedicated agent Agents whose only income source is through digital financial
services.
6 Non-dedicated
agent
Agents who have other income sources in addition to digital
financial services.
7 Exclusivity Exclusive agent Agents who work for only one service provider.
Non-exclusive
agent
Agents who work for more than one service provider. 8
9 BC Model Agent Network
Managers
ANMs are hired by banks to build, incentivise and manage agent networks. Examples include FINO, EKO, SAVE, ALW etcetera.
43
Thank You
www.helix-institute.com
Helix Institute
Helix Institute of Digital Finance