Embed Size (px)
Citation preview
R-13-27 Meeting 13-05 February 27, 2013
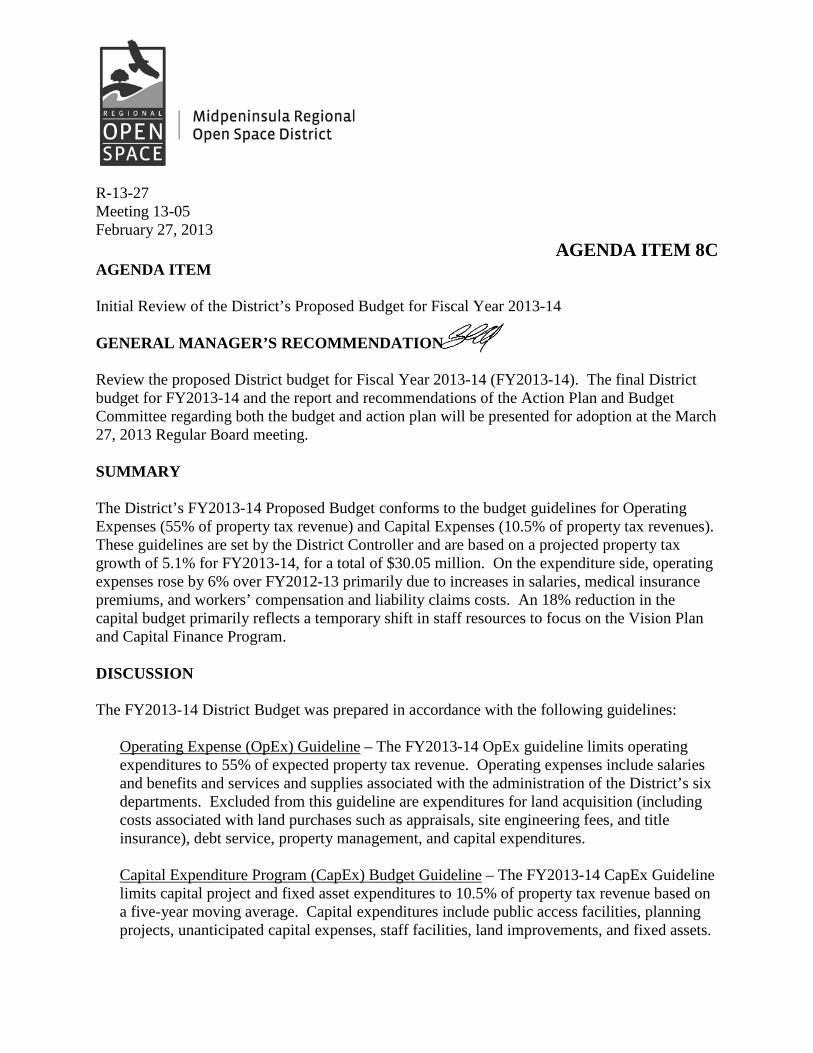
AGENDA ITEM 8C AGENDA ITEM Initial Review of the District’s Proposed Budget for Fiscal Year 2013-14 GENERAL MANAGER’S RECOMMENDATION Review the proposed District budget for Fiscal Year 2013-14 (FY2013-14). The final District budget for FY2013-14 and the report and recommendations of the Action Plan and Budget Committee regarding both the budget and action plan will be presented for adoption at the March 27, 2013 Regular Board meeting. SUMMARY The District’s FY2013-14 Proposed Budget conforms to the budget guidelines for Operating Expenses (55% of property tax revenue) and Capital Expenses (10.5% of property tax revenues). These guidelines are set by the District Controller and are based on a projected property tax growth of 5.1% for FY2013-14, for a total of $30.05 million. On the expenditure side, operating expenses rose by 6% over FY2012-13 primarily due to increases in salaries, medical insurance premiums, and workers’ compensation and liability claims costs. An 18% reduction in the capital budget primarily reflects a temporary shift in staff resources to focus on the Vision Plan and Capital Finance Program. DISCUSSION The FY2013-14 District Budget was prepared in accordance with the following guidelines:
Operating Expense (OpEx) Guideline – The FY2013-14 OpEx guideline limits operating expenditures to 55% of expected property tax revenue. Operating expenses include salaries and benefits and services and supplies associated with the administration of the District’s six departments. Excluded from this guideline are expenditures for land acquisition (including costs associated with land purchases such as appraisals, site engineering fees, and title insurance), debt service, property management, and capital expenditures. Capital Expenditure Program (CapEx) Budget Guideline – The FY2013-14 CapEx Guideline limits capital project and fixed asset expenditures to 10.5% of property tax revenue based on a five-year moving average. Capital expenditures include public access facilities, planning projects, unanticipated capital expenses, staff facilities, land improvements, and fixed assets.
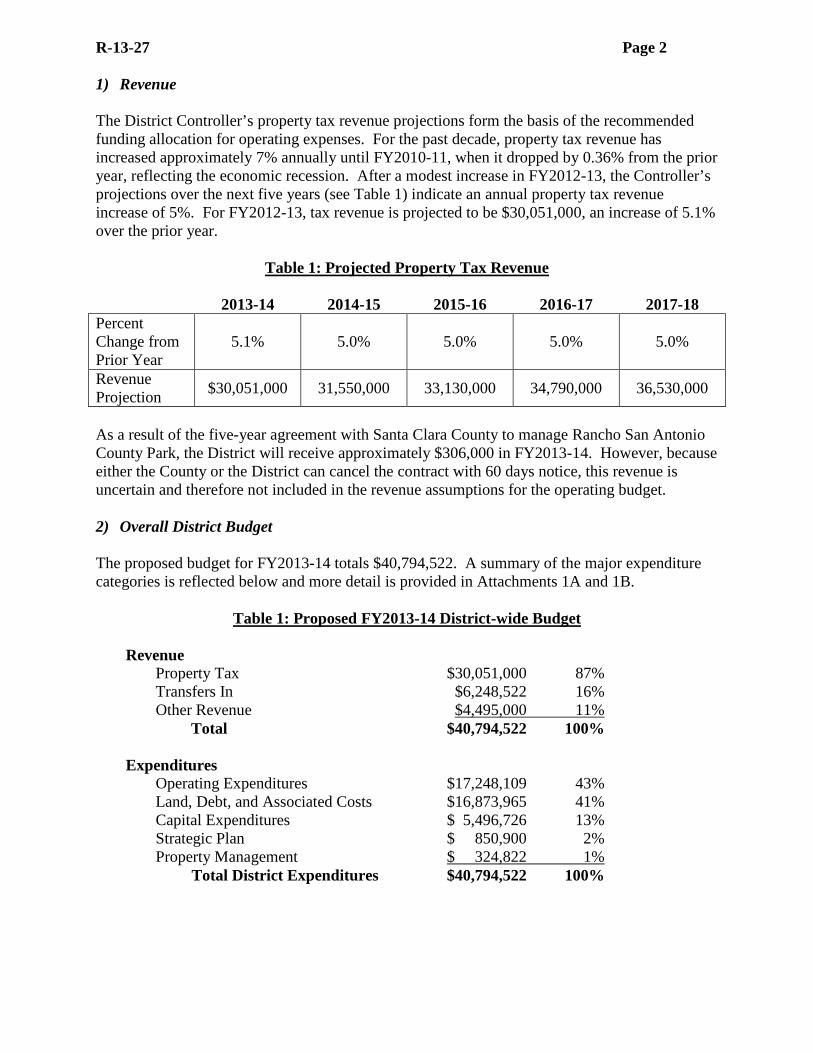
R-13-27 Page 2 1) Revenue The District Controller’s property tax revenue projections form the basis of the recommended funding allocation for operating expenses. For the past decade, property tax revenue has increased approximately 7% annually until FY2010-11, when it dropped by 0.36% from the prior year, reflecting the economic recession. After a modest increase in FY2012-13, the Controller’s projections over the next five years (see Table 1) indicate an annual property tax revenue increase of 5%. For FY2012-13, tax revenue is projected to be $30,051,000, an increase of 5.1% over the prior year.
Table 1: Projected Property Tax Revenue
2013-14 2014-15 2015-16 2016-17 2017-18 Percent Change from Prior Year
5.1% 5.0% 5.0% 5.0% 5.0%
Revenue Projection $30,051,000 31,550,000 33,130,000 34,790,000 36,530,000
As a result of the five-year agreement with Santa Clara County to manage Rancho San Antonio County Park, the District will receive approximately $306,000 in FY2013-14. However, because either the County or the District can cancel the contract with 60 days notice, this revenue is uncertain and therefore not included in the revenue assumptions for the operating budget. 2) Overall District Budget The proposed budget for FY2013-14 totals $40,794,522. A summary of the major expenditure categories is reflected below and more detail is provided in Attachments 1A and 1B.
Table 1: Proposed FY2013-14 District-wide Budget
Revenue Property Tax $30,051,000 87% Transfers In $6,248,522 16% Other Revenue $4,495,000 11% Total $40,794,522 100%
Expenditures Operating Expenditures $17,248,109 43% Land, Debt, and Associated Costs $16,873,965 41% Capital Expenditures $ 5,496,726 13% Strategic Plan $ 850,900 2% Property Management $ 324,822 1% Total District Expenditures $40,794,522 100%
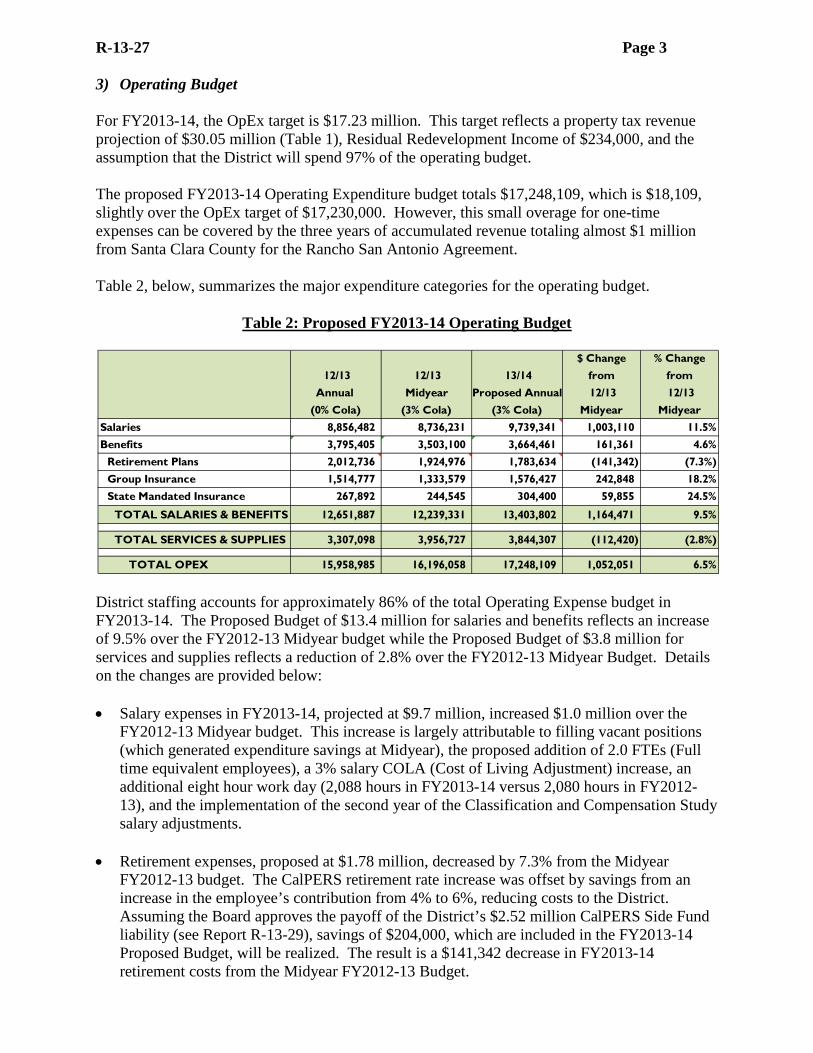
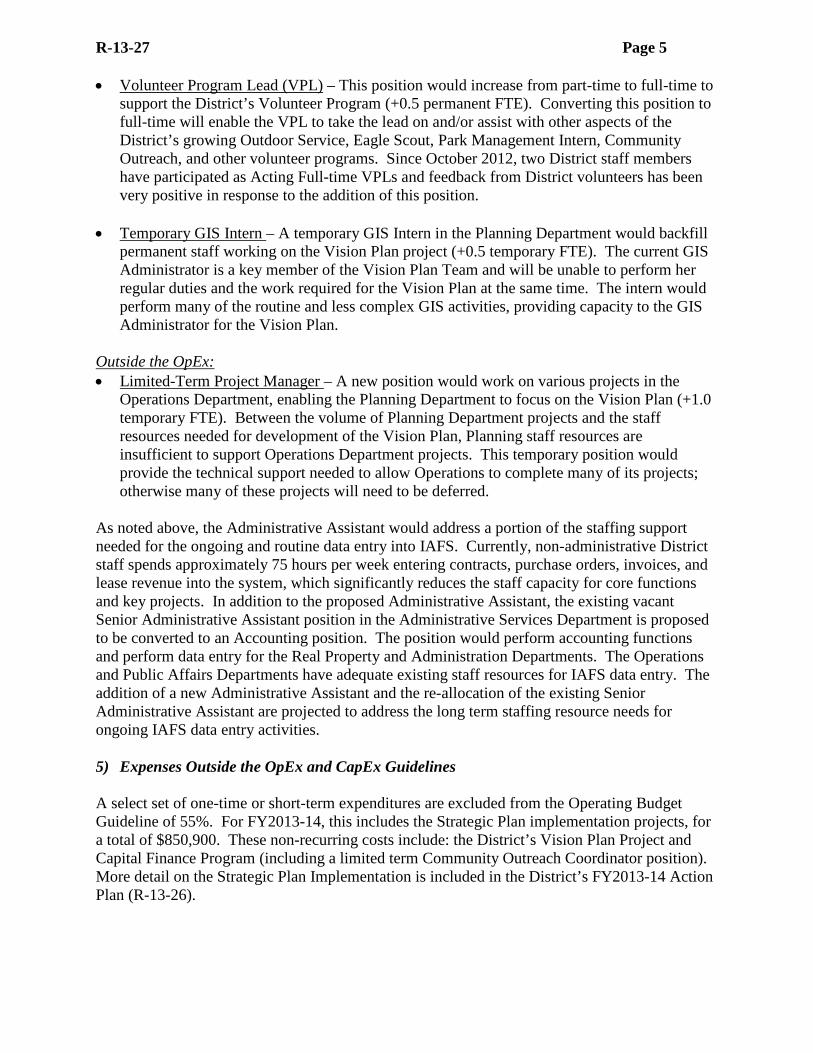
R-13-27 Page 3 3) Operating Budget For FY2013-14, the OpEx target is $17.23 million. This target reflects a property tax revenue projection of $30.05 million (Table 1), Residual Redevelopment Income of $234,000, and the assumption that the District will spend 97% of the operating budget. The proposed FY2013-14 Operating Expenditure budget totals $17,248,109, which is $18,109, slightly over the OpEx target of $17,230,000. However, this small overage for one-time expenses can be covered by the three years of accumulated revenue totaling almost $1 million from Santa Clara County for the Rancho San Antonio Agreement. Table 2, below, summarizes the major expenditure categories for the operating budget.
Table 2: Proposed FY2013-14 Operating Budget
District staffing accounts for approximately 86% of the total Operating Expense budget in FY2013-14. The Proposed Budget of $13.4 million for salaries and benefits reflects an increase of 9.5% over the FY2012-13 Midyear budget while the Proposed Budget of $3.8 million for services and supplies reflects a reduction of 2.8% over the FY2012-13 Midyear Budget. Details on the changes are provided below: • Salary expenses in FY2013-14, projected at $9.7 million, increased $1.0 million over the
FY2012-13 Midyear budget. This increase is largely attributable to filling vacant positions (which generated expenditure savings at Midyear), the proposed addition of 2.0 FTEs (Full time equivalent employees), a 3% salary COLA (Cost of Living Adjustment) increase, an additional eight hour work day (2,088 hours in FY2013-14 versus 2,080 hours in FY2012-13), and the implementation of the second year of the Classification and Compensation Study salary adjustments.
• Retirement expenses, proposed at $1.78 million, decreased by 7.3% from the Midyear
FY2012-13 budget. The CalPERS retirement rate increase was offset by savings from an increase in the employee’s contribution from 4% to 6%, reducing costs to the District. Assuming the Board approves the payoff of the District’s $2.52 million CalPERS Side Fund liability (see Report R-13-29), savings of $204,000, which are included in the FY2013-14 Proposed Budget, will be realized. The result is a $141,342 decrease in FY2013-14 retirement costs from the Midyear FY2012-13 Budget.
12/13 12/13 13/14$ Change
from % Change
from Annual Midyear Proposed Annual 12/13 12/13
(0% Cola) (3% Cola) (3% Cola) Midyear MidyearSalaries 8,856,482 8,736,231 9,739,341 1,003,110 11.5%Benefits 3,795,405 3,503,100 3,664,461 161,361 4.6%
Retirement Plans 2,012,736 1,924,976 1,783,634 (141,342) (7.3%)Group Insurance 1,514,777 1,333,579 1,576,427 242,848 18.2%State Mandated Insurance 267,892 244,545 304,400 59,855 24.5%
TOTAL SALARIES & BENEFITS 12,651,887 12,239,331 13,403,802 1,164,471 9.5%
TOTAL SERVICES & SUPPLIES 3,307,098 3,956,727 3,844,307 (112,420) (2.8%)
TOTAL OPEX 15,958,985 16,196,058 17,248,109 1,052,051 6.5%
R-13-27 Page 4 • Group health insurance is budgeted at $1.78 million, representing an increase of $242,848 or
18.2% from the FY2012-13 Midyear budget due to the 9.5% group health insurance rate increase. The remaining increase is attributed to conservatively budgeting health benefit costs at the “family coverage level” for vacancies.
• Worker’s compensation insurance increased $59,855 or 24.5% due to two factors: 1) a rise in
agency losses in the pool in which the District is a member, and 2) increased costs directly resulting from District employee injuries over the past five years.
• For FY2013-14, services and supplies decreased by $112.420 or 2.8% from the FY2012-13
Midyear Budget. Major decreases include resource management costs and consulting services.
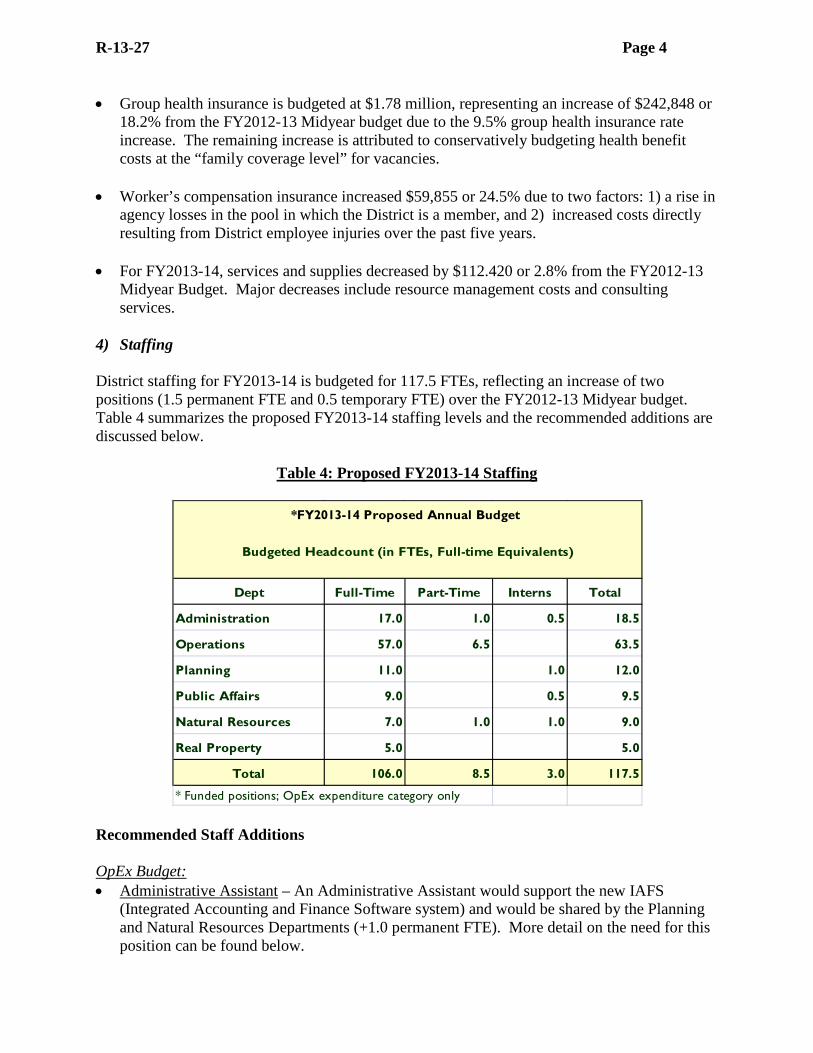
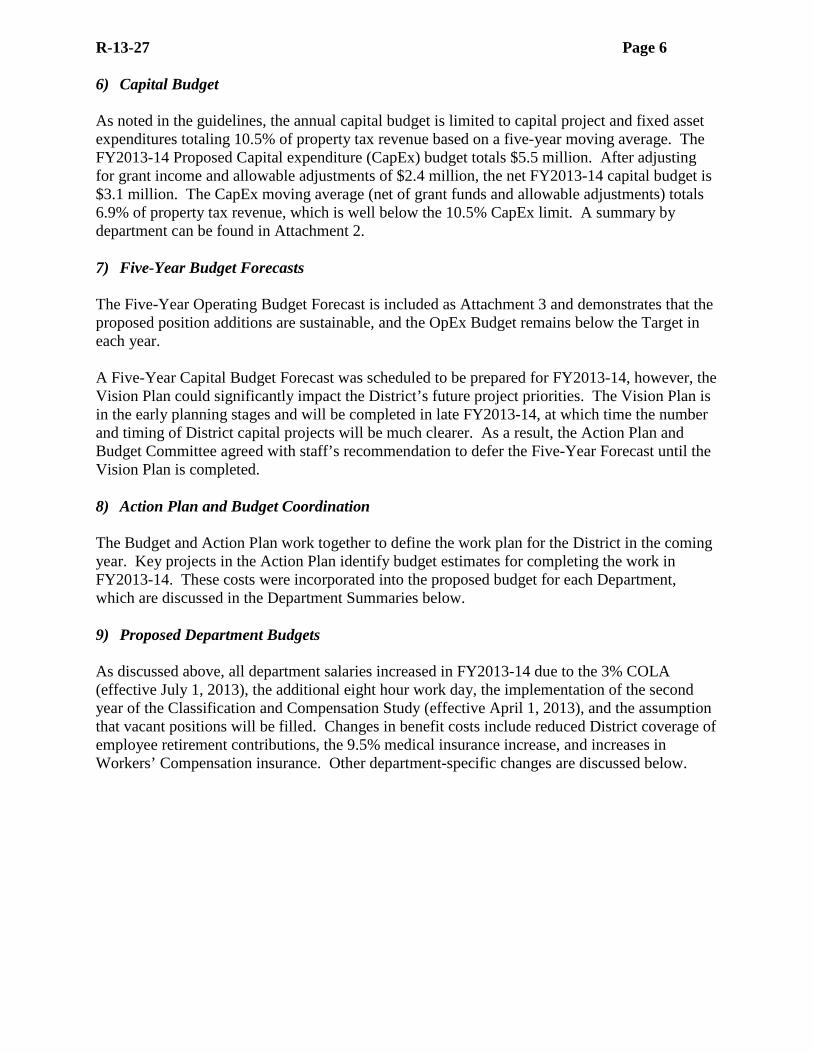
4) Staffing District staffing for FY2013-14 is budgeted for 117.5 FTEs, reflecting an increase of two positions (1.5 permanent FTE and 0.5 temporary FTE) over the FY2012-13 Midyear budget. Table 4 summarizes the proposed FY2013-14 staffing levels and the recommended additions are discussed below.
Table 4: Proposed FY2013-14 Staffing
Recommended Staff Additions OpEx Budget: • Administrative Assistant – An Administrative Assistant would support the new IAFS
(Integrated Accounting and Finance Software system) and would be shared by the Planning and Natural Resources Departments (+1.0 permanent FTE). More detail on the need for this position can be found below.
Dept Full-Time Part-Time Interns Total
Administration 17.0 1.0 0.5 18.5
Operations 57.0 6.5 63.5
Planning 11.0 1.0 12.0
Public Affairs 9.0 0.5 9.5
Natural Resources 7.0 1.0 1.0 9.0
Real Property 5.0 5.0
Total 106.0 8.5 3.0 117.5
* Funded positions; OpEx expenditure category only
Budgeted Headcount (in FTEs, Full-time Equivalents)
*FY2013-14 Proposed Annual Budget
R-13-27 Page 5 • Volunteer Program Lead (VPL) – This position would increase from part-time to full-time to
support the District’s Volunteer Program (+0.5 permanent FTE). Converting this position to full-time will enable the VPL to take the lead on and/or assist with other aspects of the District’s growing Outdoor Service, Eagle Scout, Park Management Intern, Community Outreach, and other volunteer programs. Since October 2012, two District staff members have participated as Acting Full-time VPLs and feedback from District volunteers has been very positive in response to the addition of this position.
• Temporary GIS Intern – A temporary GIS Intern in the Planning Department would backfill
permanent staff working on the Vision Plan project (+0.5 temporary FTE). The current GIS Administrator is a key member of the Vision Plan Team and will be unable to perform her regular duties and the work required for the Vision Plan at the same time. The intern would perform many of the routine and less complex GIS activities, providing capacity to the GIS Administrator for the Vision Plan.
Outside the OpEx: • Limited-Term Project Manager – A new position would work on various projects in the
Operations Department, enabling the Planning Department to focus on the Vision Plan (+1.0 temporary FTE). Between the volume of Planning Department projects and the staff resources needed for development of the Vision Plan, Planning staff resources are insufficient to support Operations Department projects. This temporary position would provide the technical support needed to allow Operations to complete many of its projects; otherwise many of these projects will need to be deferred.
As noted above, the Administrative Assistant would address a portion of the staffing support needed for the ongoing and routine data entry into IAFS. Currently, non-administrative District staff spends approximately 75 hours per week entering contracts, purchase orders, invoices, and lease revenue into the system, which significantly reduces the staff capacity for core functions and key projects. In addition to the proposed Administrative Assistant, the existing vacant Senior Administrative Assistant position in the Administrative Services Department is proposed to be converted to an Accounting position. The position would perform accounting functions and perform data entry for the Real Property and Administration Departments. The Operations and Public Affairs Departments have adequate existing staff resources for IAFS data entry. The addition of a new Administrative Assistant and the re-allocation of the existing Senior Administrative Assistant are projected to address the long term staffing resource needs for ongoing IAFS data entry activities. 5) Expenses Outside the OpEx and CapEx Guidelines A select set of one-time or short-term expenditures are excluded from the Operating Budget Guideline of 55%. For FY2013-14, this includes the Strategic Plan implementation projects, for a total of $850,900. These non-recurring costs include: the District’s Vision Plan Project and Capital Finance Program (including a limited term Community Outreach Coordinator position). More detail on the Strategic Plan Implementation is included in the District’s FY2013-14 Action Plan (R-13-26).
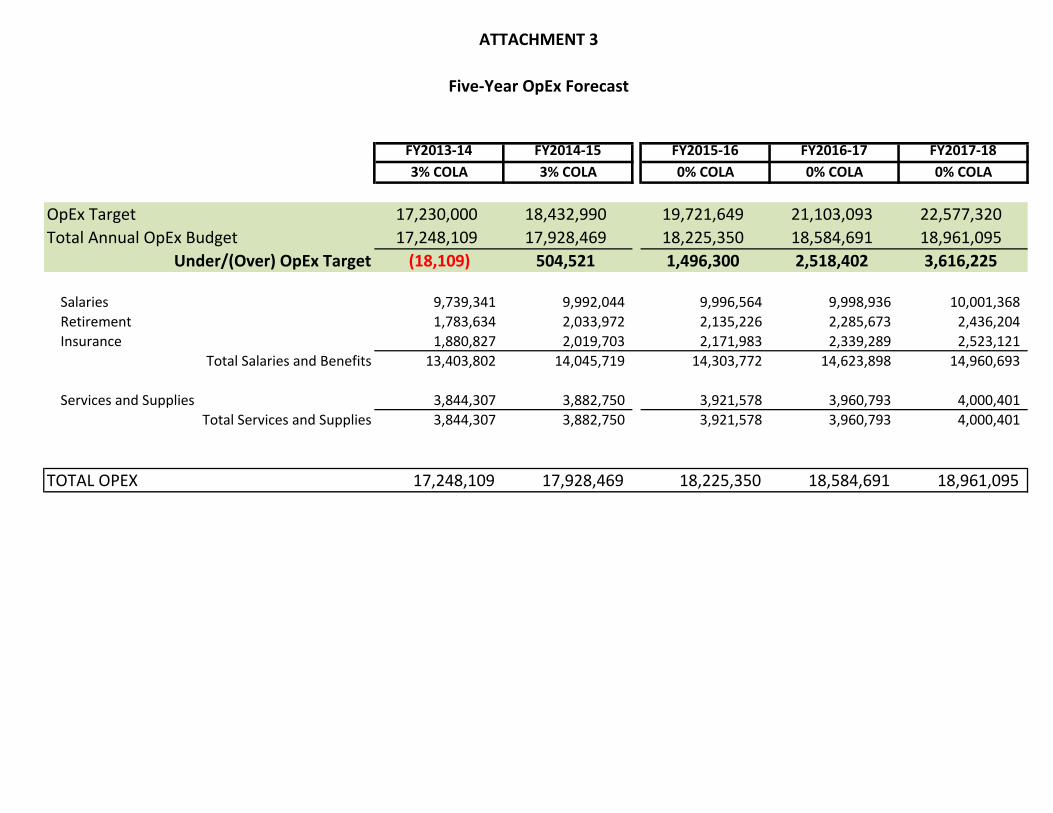
R-13-27 Page 6 6) Capital Budget As noted in the guidelines, the annual capital budget is limited to capital project and fixed asset expenditures totaling 10.5% of property tax revenue based on a five-year moving average. The FY2013-14 Proposed Capital expenditure (CapEx) budget totals $5.5 million. After adjusting for grant income and allowable adjustments of $2.4 million, the net FY2013-14 capital budget is $3.1 million. The CapEx moving average (net of grant funds and allowable adjustments) totals 6.9% of property tax revenue, which is well below the 10.5% CapEx limit. A summary by department can be found in Attachment 2. 7) Five-Year Budget Forecasts The Five-Year Operating Budget Forecast is included as Attachment 3 and demonstrates that the proposed position additions are sustainable, and the OpEx Budget remains below the Target in each year. A Five-Year Capital Budget Forecast was scheduled to be prepared for FY2013-14, however, the Vision Plan could significantly impact the District’s future project priorities. The Vision Plan is in the early planning stages and will be completed in late FY2013-14, at which time the number and timing of District capital projects will be much clearer. As a result, the Action Plan and Budget Committee agreed with staff’s recommendation to defer the Five-Year Forecast until the Vision Plan is completed. 8) Action Plan and Budget Coordination The Budget and Action Plan work together to define the work plan for the District in the coming year. Key projects in the Action Plan identify budget estimates for completing the work in FY2013-14. These costs were incorporated into the proposed budget for each Department, which are discussed in the Department Summaries below. 9) Proposed Department Budgets As discussed above, all department salaries increased in FY2013-14 due to the 3% COLA (effective July 1, 2013), the additional eight hour work day, the implementation of the second year of the Classification and Compensation Study (effective April 1, 2013), and the assumption that vacant positions will be filled. Changes in benefit costs include reduced District coverage of employee retirement contributions, the 9.5% medical insurance increase, and increases in Workers’ Compensation insurance. Other department-specific changes are discussed below.
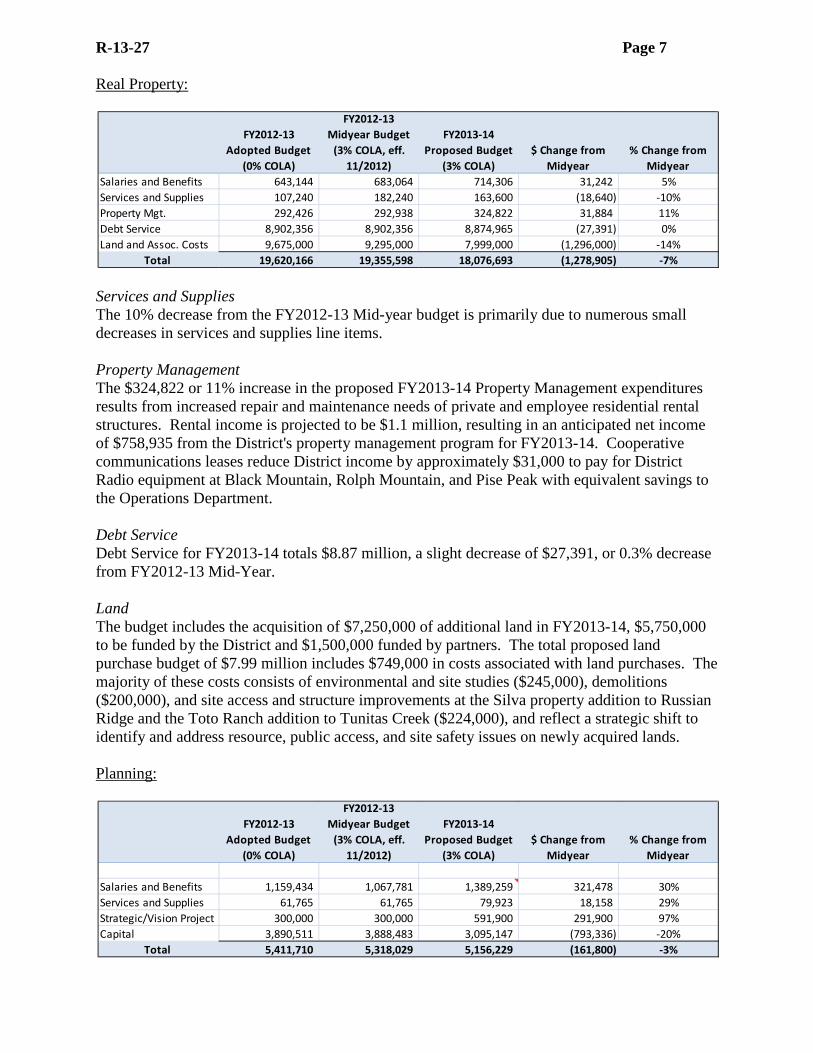
R-13-27 Page 7 Real Property:
Services and Supplies The 10% decrease from the FY2012-13 Mid-year budget is primarily due to numerous small decreases in services and supplies line items. Property Management The $324,822 or 11% increase in the proposed FY2013-14 Property Management expenditures results from increased repair and maintenance needs of private and employee residential rental structures. Rental income is projected to be $1.1 million, resulting in an anticipated net income of $758,935 from the District's property management program for FY2013-14. Cooperative communications leases reduce District income by approximately $31,000 to pay for District Radio equipment at Black Mountain, Rolph Mountain, and Pise Peak with equivalent savings to the Operations Department. Debt Service Debt Service for FY2013-14 totals $8.87 million, a slight decrease of $27,391, or 0.3% decrease from FY2012-13 Mid-Year. Land The budget includes the acquisition of $7,250,000 of additional land in FY2013-14, $5,750,000 to be funded by the District and $1,500,000 funded by partners. The total proposed land purchase budget of $7.99 million includes $749,000 in costs associated with land purchases. The majority of these costs consists of environmental and site studies ($245,000), demolitions ($200,000), and site access and structure improvements at the Silva property addition to Russian Ridge and the Toto Ranch addition to Tunitas Creek ($224,000), and reflect a strategic shift to identify and address resource, public access, and site safety issues on newly acquired lands. Planning:
FY2012-13 Adopted Budget
(0% COLA)
FY2012-13 Midyear Budget
(3% COLA, eff. 11/2012)
FY2013-14 Proposed Budget
(3% COLA)$ Change from
Midyear% Change from
MidyearSalaries and Benefits 643,144 683,064 714,306 31,242 5%Services and Supplies 107,240 182,240 163,600 (18,640) -10%Property Mgt. 292,426 292,938 324,822 31,884 11%Debt Service 8,902,356 8,902,356 8,874,965 (27,391) 0%Land and Assoc. Costs 9,675,000 9,295,000 7,999,000 (1,296,000) -14%
Total 19,620,166 19,355,598 18,076,693 (1,278,905) -7%
FY2012-13 Adopted Budget
(0% COLA)
FY2012-13 Midyear Budget
(3% COLA, eff. 11/2012)
FY2013-14 Proposed Budget
(3% COLA)$ Change from
Midyear% Change from
Midyear
Salaries and Benefits 1,159,434 1,067,781 1,389,259 321,478 30%Services and Supplies 61,765 61,765 79,923 18,158 29%Strategic/Vision Project 300,000 300,000 591,900 291,900 97%Capital 3,890,511 3,888,483 3,095,147 (793,336) -20%
Total 5,411,710 5,318,029 5,156,229 (161,800) -3%
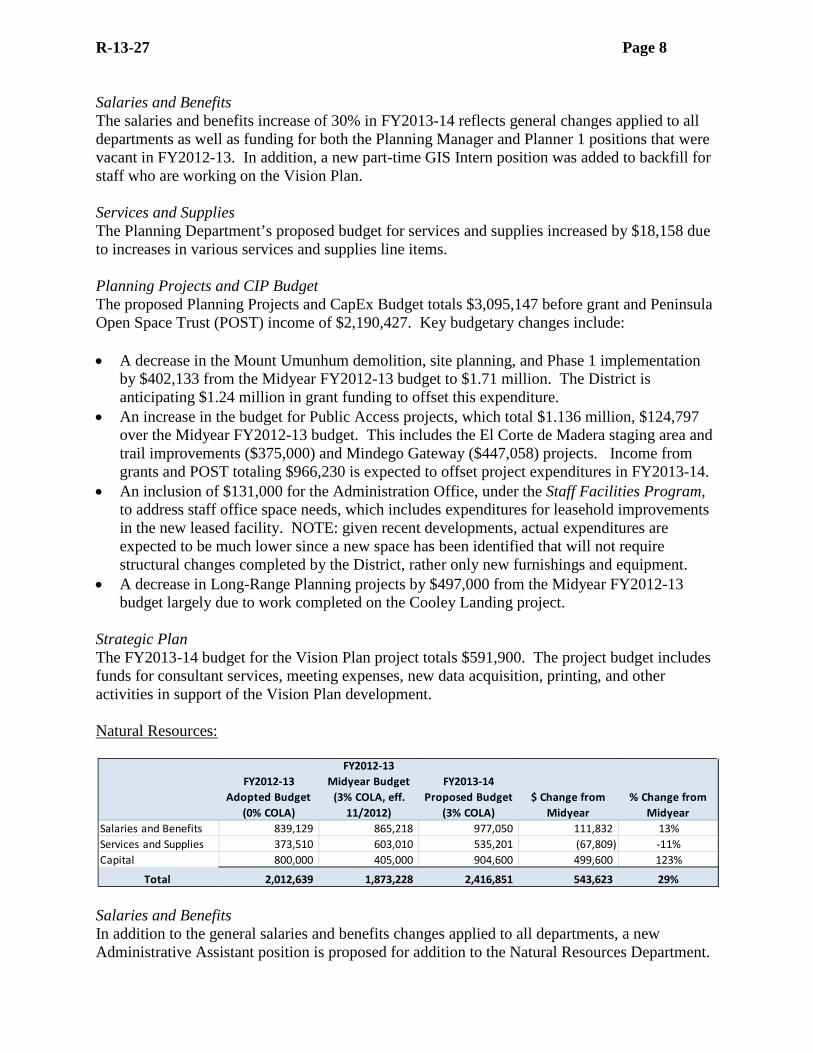
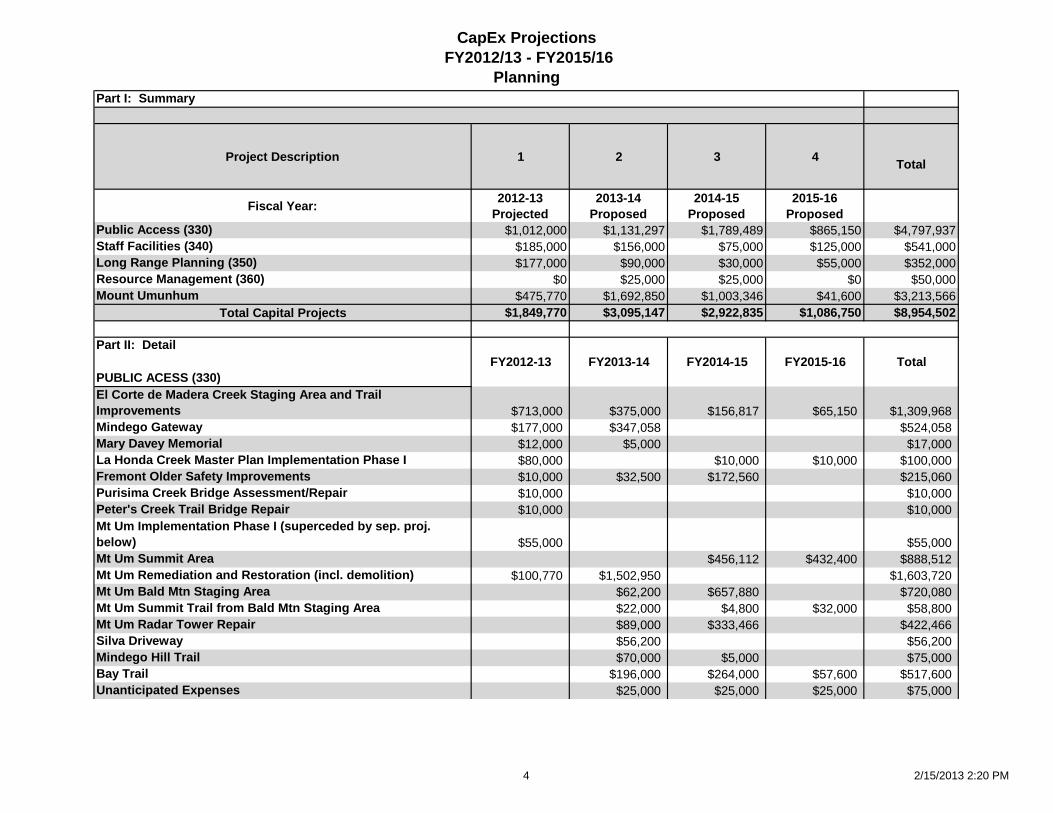
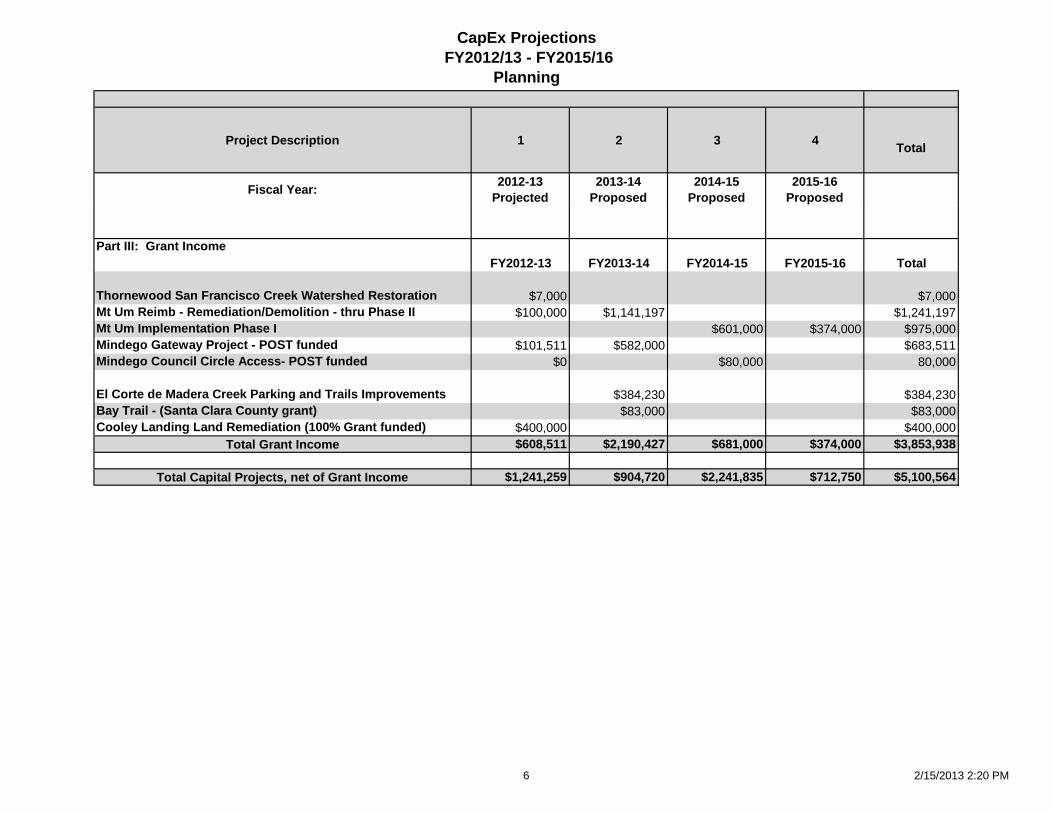
R-13-27 Page 8 Salaries and Benefits The salaries and benefits increase of 30% in FY2013-14 reflects general changes applied to all departments as well as funding for both the Planning Manager and Planner 1 positions that were vacant in FY2012-13. In addition, a new part-time GIS Intern position was added to backfill for staff who are working on the Vision Plan. Services and Supplies The Planning Department’s proposed budget for services and supplies increased by $18,158 due to increases in various services and supplies line items. Planning Projects and CIP Budget The proposed Planning Projects and CapEx Budget totals $3,095,147 before grant and Peninsula Open Space Trust (POST) income of $2,190,427. Key budgetary changes include: • A decrease in the Mount Umunhum demolition, site planning, and Phase 1 implementation
by $402,133 from the Midyear FY2012-13 budget to $1.71 million. The District is anticipating $1.24 million in grant funding to offset this expenditure.
• An increase in the budget for Public Access projects, which total $1.136 million, $124,797 over the Midyear FY2012-13 budget. This includes the El Corte de Madera staging area and trail improvements ($375,000) and Mindego Gateway ($447,058) projects. Income from grants and POST totaling $966,230 is expected to offset project expenditures in FY2013-14.
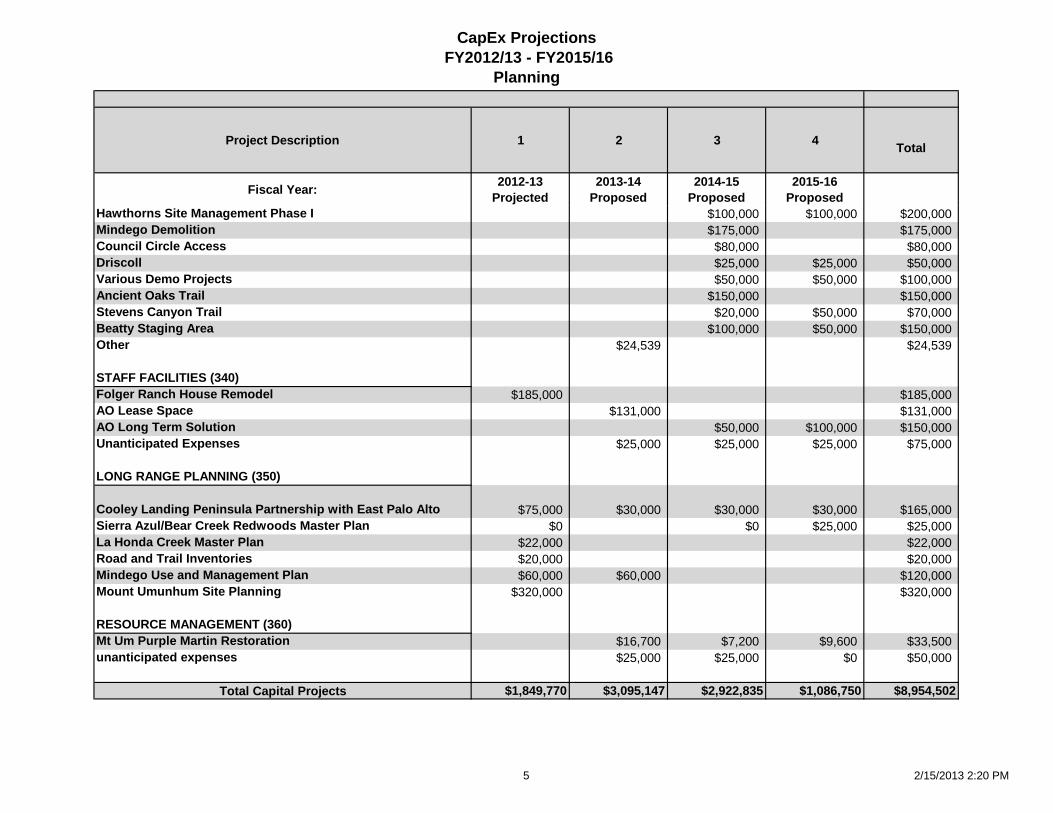
• An inclusion of $131,000 for the Administration Office, under the Staff Facilities Program, to address staff office space needs, which includes expenditures for leasehold improvements in the new leased facility. NOTE: given recent developments, actual expenditures are expected to be much lower since a new space has been identified that will not require structural changes completed by the District, rather only new furnishings and equipment.
• A decrease in Long-Range Planning projects by $497,000 from the Midyear FY2012-13 budget largely due to work completed on the Cooley Landing project.
Strategic Plan The FY2013-14 budget for the Vision Plan project totals $591,900. The project budget includes funds for consultant services, meeting expenses, new data acquisition, printing, and other activities in support of the Vision Plan development. Natural Resources:
Salaries and Benefits In addition to the general salaries and benefits changes applied to all departments, a new Administrative Assistant position is proposed for addition to the Natural Resources Department.
FY2012-13 Adopted Budget
(0% COLA)
FY2012-13 Midyear Budget
(3% COLA, eff. 11/2012)
FY2013-14 Proposed Budget
(3% COLA)$ Change from
Midyear% Change from
MidyearSalaries and Benefits 839,129 865,218 977,050 111,832 13%Services and Supplies 373,510 603,010 535,201 (67,809) -11%Capital 800,000 405,000 904,600 499,600 123%
Total 2,012,639 1,873,228 2,416,851 543,623 29%
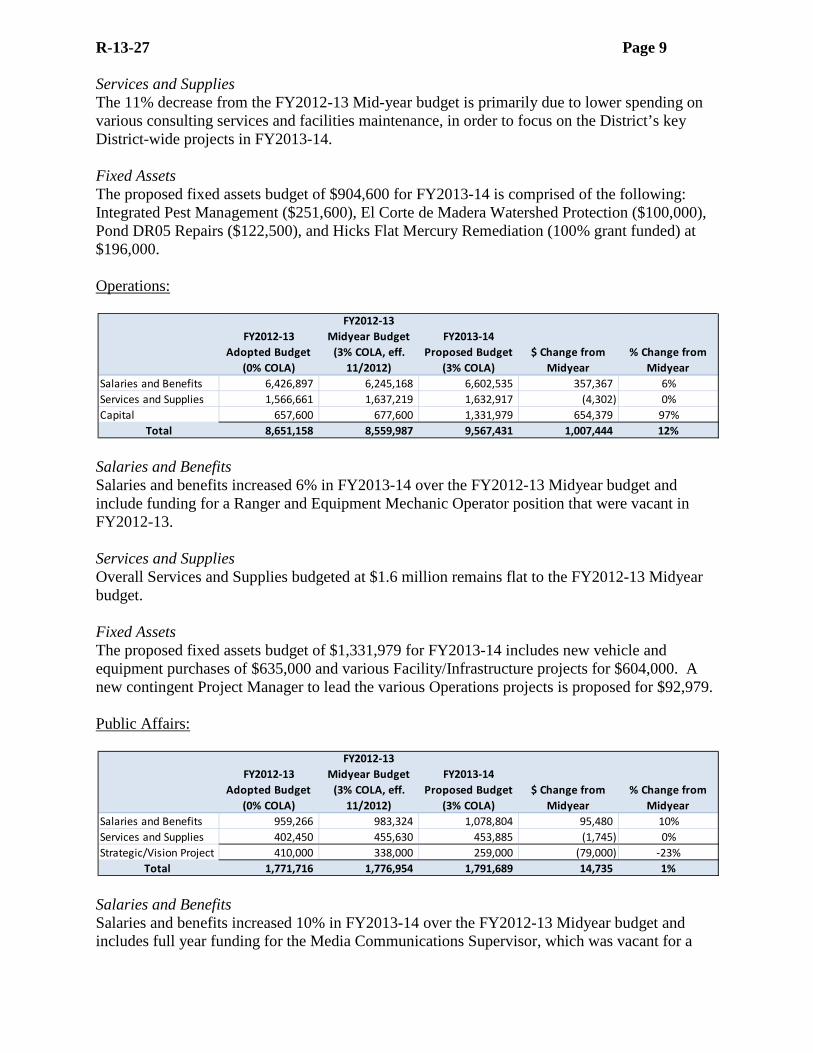
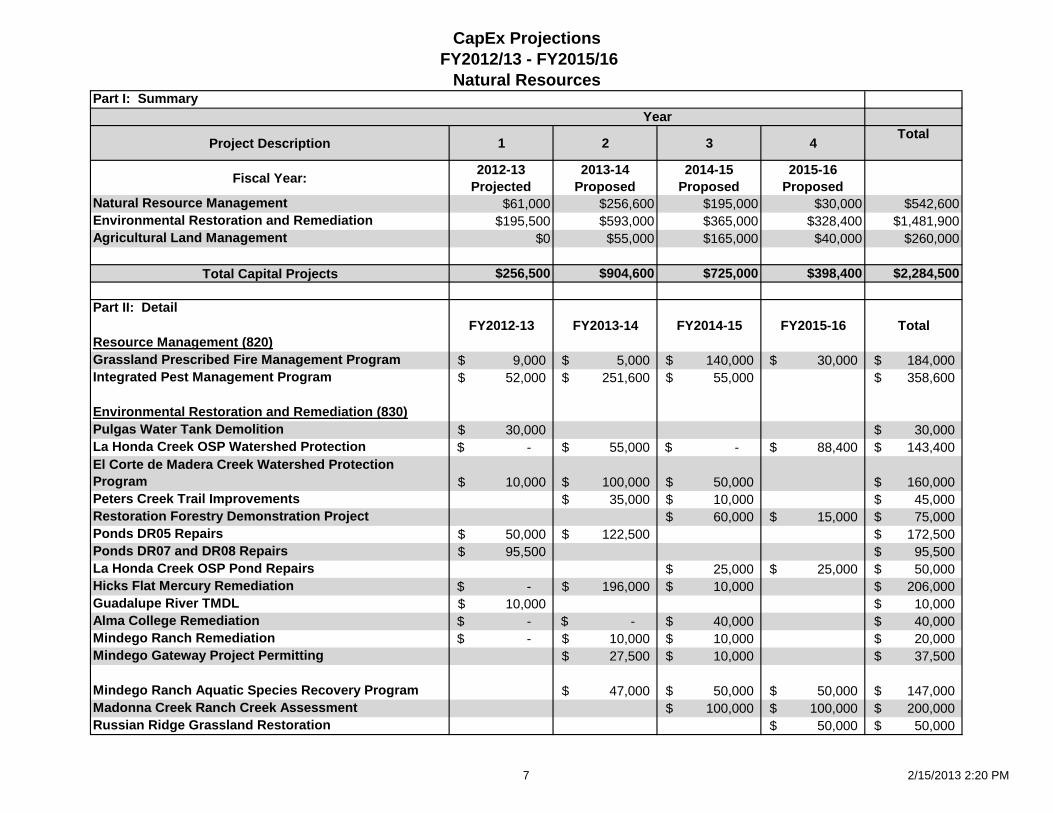
R-13-27 Page 9 Services and Supplies The 11% decrease from the FY2012-13 Mid-year budget is primarily due to lower spending on various consulting services and facilities maintenance, in order to focus on the District’s key District-wide projects in FY2013-14. Fixed Assets The proposed fixed assets budget of $904,600 for FY2013-14 is comprised of the following: Integrated Pest Management ($251,600), El Corte de Madera Watershed Protection ($100,000), Pond DR05 Repairs ($122,500), and Hicks Flat Mercury Remediation (100% grant funded) at $196,000. Operations:
Salaries and Benefits Salaries and benefits increased 6% in FY2013-14 over the FY2012-13 Midyear budget and include funding for a Ranger and Equipment Mechanic Operator position that were vacant in FY2012-13. Services and Supplies Overall Services and Supplies budgeted at $1.6 million remains flat to the FY2012-13 Midyear budget. Fixed Assets The proposed fixed assets budget of $1,331,979 for FY2013-14 includes new vehicle and equipment purchases of $635,000 and various Facility/Infrastructure projects for $604,000. A new contingent Project Manager to lead the various Operations projects is proposed for $92,979. Public Affairs:
Salaries and Benefits Salaries and benefits increased 10% in FY2013-14 over the FY2012-13 Midyear budget and includes full year funding for the Media Communications Supervisor, which was vacant for a
FY2012-13 Adopted Budget
(0% COLA)
FY2012-13 Midyear Budget
(3% COLA, eff. 11/2012)
FY2013-14 Proposed Budget
(3% COLA)$ Change from
Midyear% Change from
MidyearSalaries and Benefits 6,426,897 6,245,168 6,602,535 357,367 6%Services and Supplies 1,566,661 1,637,219 1,632,917 (4,302) 0%Capital 657,600 677,600 1,331,979 654,379 97%
Total 8,651,158 8,559,987 9,567,431 1,007,444 12%
FY2012-13 Adopted Budget
(0% COLA)
FY2012-13 Midyear Budget
(3% COLA, eff. 11/2012)
FY2013-14 Proposed Budget
(3% COLA)$ Change from
Midyear% Change from
MidyearSalaries and Benefits 959,266 983,324 1,078,804 95,480 10%Services and Supplies 402,450 455,630 453,885 (1,745) 0%Strategic/Vision Project 410,000 338,000 259,000 (79,000) -23%
Total 1,771,716 1,776,954 1,791,689 14,735 1%
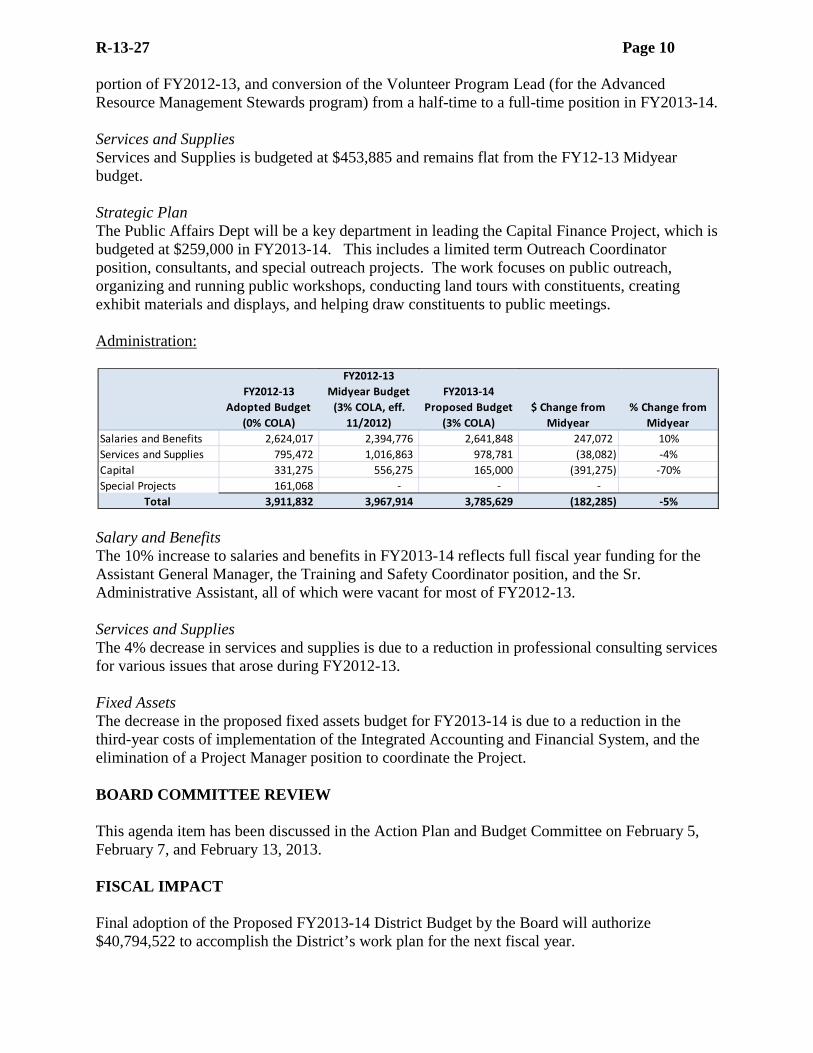
R-13-27 Page 10 portion of FY2012-13, and conversion of the Volunteer Program Lead (for the Advanced Resource Management Stewards program) from a half-time to a full-time position in FY2013-14. Services and Supplies Services and Supplies is budgeted at $453,885 and remains flat from the FY12-13 Midyear budget. Strategic Plan The Public Affairs Dept will be a key department in leading the Capital Finance Project, which is budgeted at $259,000 in FY2013-14. This includes a limited term Outreach Coordinator position, consultants, and special outreach projects. The work focuses on public outreach, organizing and running public workshops, conducting land tours with constituents, creating exhibit materials and displays, and helping draw constituents to public meetings. Administration:
Salary and Benefits The 10% increase to salaries and benefits in FY2013-14 reflects full fiscal year funding for the Assistant General Manager, the Training and Safety Coordinator position, and the Sr. Administrative Assistant, all of which were vacant for most of FY2012-13. Services and Supplies The 4% decrease in services and supplies is due to a reduction in professional consulting services for various issues that arose during FY2012-13. Fixed Assets The decrease in the proposed fixed assets budget for FY2013-14 is due to a reduction in the third-year costs of implementation of the Integrated Accounting and Financial System, and the elimination of a Project Manager position to coordinate the Project. BOARD COMMITTEE REVIEW This agenda item has been discussed in the Action Plan and Budget Committee on February 5, February 7, and February 13, 2013. FISCAL IMPACT Final adoption of the Proposed FY2013-14 District Budget by the Board will authorize $40,794,522 to accomplish the District’s work plan for the next fiscal year.
FY2012-13 Adopted Budget
(0% COLA)
FY2012-13 Midyear Budget
(3% COLA, eff. 11/2012)
FY2013-14 Proposed Budget
(3% COLA)$ Change from
Midyear% Change from
MidyearSalaries and Benefits 2,624,017 2,394,776 2,641,848 247,072 10%Services and Supplies 795,472 1,016,863 978,781 (38,082) -4%Capital 331,275 556,275 165,000 (391,275) -70%Special Projects 161,068 - - -
Total 3,911,832 3,967,914 3,785,629 (182,285) -5%
R-13-27 Page 11 PUBLIC NOTICE Public notice has been provided as required by the Brown Act. CEQA COMPLIANCE This agenda item is not a project and is not subject to the California Environmental Quality Act (CEQA). NEXT STEPS • The Board determines whether the Action Plan and Budget Committee shall meet to further
discuss and refine the Proposed FY2013-14 District Budget. • The Board approves the FY2013-14 Proposed District Budget at the March 27, 2013 Board
Meeting. Attachment(s)
1. Attachment 1A: District-wide Budget 2. Attachment 1B: District Budget by Department 3. Attachment 2: CapEx Three-Year Forecast 4. Attachment 3: Five-Year Operating Budget Forecast 5. Attachment 4: CapEx Budget by Department
Action Plan and Budget Committee: Yoriko Kishimoto, Chair Curt Riffle Pete Siemens Prepared by: Lynn Tottori, Senior Management Analyst Kate Drayson, Administrative Services Manager Ana Ruiz, Interim Assistant General Manager Meredith Manning, Co-Acting Planning Manager Tina Hugg, Co-Acting Planning Manager David Sanguinetti, Operations Manager Paul McGowan, Co-Acting Public Affairs Manager Renee Fitzsimons, Co-Acting Public Affairs Manager Michael Williams, Real Property Manager Kirk Lenington, Natural Resources Manager Gordon Baillie, Management Analyst Elaina Cuzick, Real Property Specialist Gretchen Laustsen, Planner II Peggy Koenig, Public Affairs Specialist Contact persons: Stephen E. Abbors, General Manager Ana Ruiz, Interim Assistant General Manager Kate Drayson, Administrative Services Manager Yoriko Kishimoto, Chair, Action Plan and Budget Committee
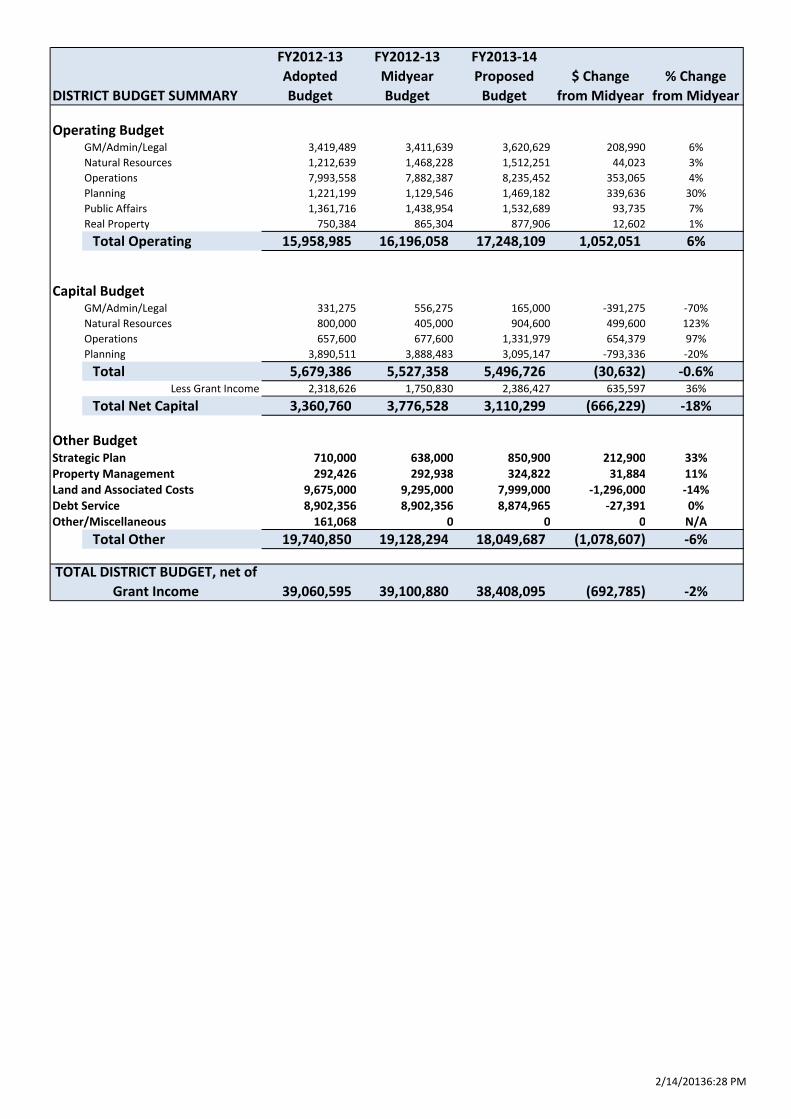
DISTRICT BUDGET SUMMARY
FY2012-13
Adopted
Budget
FY2012-13
Midyear
Budget
FY2013-14
Proposed
Budget
$ Change
from Midyear
% Change
from Midyear
Operating BudgetGM/Admin/Legal 3,419,489 3,411,639 3,620,629 208,990 6%
Natural Resources 1,212,639 1,468,228 1,512,251 44,023 3%
Operations 7,993,558 7,882,387 8,235,452 353,065 4%
Planning 1,221,199 1,129,546 1,469,182 339,636 30%
Public Affairs 1,361,716 1,438,954 1,532,689 93,735 7%
Real Property 750,384 865,304 877,906 12,602 1%
Total Operating 15,958,985 16,196,058 17,248,109 1,052,051 6%
Capital BudgetGM/Admin/Legal 331,275 556,275 165,000 -391,275 -70%
Natural Resources 800,000 405,000 904,600 499,600 123%
Operations 657,600 677,600 1,331,979 654,379 97%
Planning 3,890,511 3,888,483 3,095,147 -793,336 -20%
Total 5,679,386 5,527,358 5,496,726 (30,632) -0.6%Less Grant Income 2,318,626 1,750,830 2,386,427 635,597 36%
Total Net Capital 3,360,760 3,776,528 3,110,299 (666,229) -18%
Other BudgetStrategic Plan 710,000 638,000 850,900 212,900 33%
Property Management 292,426 292,938 324,822 31,884 11%
Land and Associated Costs 9,675,000 9,295,000 7,999,000 -1,296,000 -14%
Debt Service 8,902,356 8,902,356 8,874,965 -27,391 0%
Other/Miscellaneous 161,068 0 0 0 N/A
Total Other 19,740,850 19,128,294 18,049,687 (1,078,607) -6%
39,060,595 39,100,880 38,408,095 (692,785) -2%
TOTAL DISTRICT BUDGET, net of
Grant Income
2/14/20136:28 PM
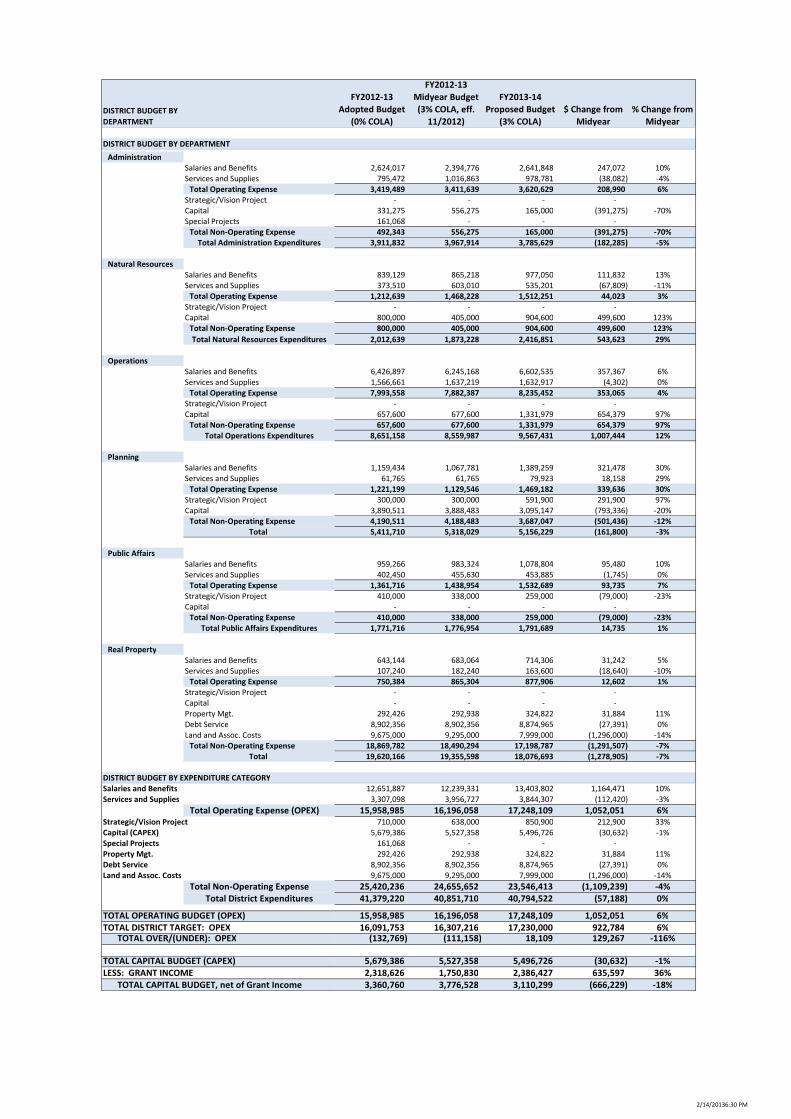
DISTRICT BUDGET BY
DEPARTMENT
FY2012-13
Adopted Budget
(0% COLA)
FY2012-13
Midyear Budget
(3% COLA, eff.
11/2012)
FY2013-14
Proposed Budget
(3% COLA)
$ Change from
Midyear
% Change from
Midyear
DISTRICT BUDGET BY DEPARTMENT
Administration
Salaries and Benefits 2,624,017 2,394,776 2,641,848 247,072 10%
Services and Supplies 795,472 1,016,863 978,781 (38,082) -4%
Total Operating Expense 3,419,489 3,411,639 3,620,629 208,990 6%
Strategic/Vision Project - - - -
Capital 331,275 556,275 165,000 (391,275) -70%
Special Projects 161,068 - - -
Total Non-Operating Expense 492,343 556,275 165,000 (391,275) -70%
Total Administration Expenditures 3,911,832 3,967,914 3,785,629 (182,285) -5%
Natural Resources
Salaries and Benefits 839,129 865,218 977,050 111,832 13%
Services and Supplies 373,510 603,010 535,201 (67,809) -11%
Total Operating Expense 1,212,639 1,468,228 1,512,251 44,023 3%
Strategic/Vision Project - - - -
Capital 800,000 405,000 904,600 499,600 123%
Total Non-Operating Expense 800,000 405,000 904,600 499,600 123%
Total Natural Resources Expenditures 2,012,639 1,873,228 2,416,851 543,623 29%
Operations
Salaries and Benefits 6,426,897 6,245,168 6,602,535 357,367 6%
Services and Supplies 1,566,661 1,637,219 1,632,917 (4,302) 0%
Total Operating Expense 7,993,558 7,882,387 8,235,452 353,065 4%
Strategic/Vision Project - - - -
Capital 657,600 677,600 1,331,979 654,379 97%
Total Non-Operating Expense 657,600 677,600 1,331,979 654,379 97%
Total Operations Expenditures 8,651,158 8,559,987 9,567,431 1,007,444 12%
Planning
Salaries and Benefits 1,159,434 1,067,781 1,389,259 321,478 30%
Services and Supplies 61,765 61,765 79,923 18,158 29%
Total Operating Expense 1,221,199 1,129,546 1,469,182 339,636 30%
Strategic/Vision Project 300,000 300,000 591,900 291,900 97%
Capital 3,890,511 3,888,483 3,095,147 (793,336) -20%
Total Non-Operating Expense 4,190,511 4,188,483 3,687,047 (501,436) -12%
Total 5,411,710 5,318,029 5,156,229 (161,800) -3%
Public Affairs
Salaries and Benefits 959,266 983,324 1,078,804 95,480 10%
Services and Supplies 402,450 455,630 453,885 (1,745) 0%
Total Operating Expense 1,361,716 1,438,954 1,532,689 93,735 7%Total Operating Expense 1,361,716 1,438,954 1,532,689 93,735 7%
Strategic/Vision Project 410,000 338,000 259,000 (79,000) -23%
Capital - - - -
Total Non-Operating Expense 410,000 338,000 259,000 (79,000) -23%
Total Public Affairs Expenditures 1,771,716 1,776,954 1,791,689 14,735 1%
Real Property
Salaries and Benefits 643,144 683,064 714,306 31,242 5%
Services and Supplies 107,240 182,240 163,600 (18,640) -10%
Total Operating Expense 750,384 865,304 877,906 12,602 1%
Strategic/Vision Project - - - -
Capital - - - -
Property Mgt. 292,426 292,938 324,822 31,884 11%
Debt Service 8,902,356 8,902,356 8,874,965 (27,391) 0%
Land and Assoc. Costs 9,675,000 9,295,000 7,999,000 (1,296,000) -14%
Total Non-Operating Expense 18,869,782 18,490,294 17,198,787 (1,291,507) -7%
Total 19,620,166 19,355,598 18,076,693 (1,278,905) -7%
DISTRICT BUDGET BY EXPENDITURE CATEGORY
Salaries and Benefits 12,651,887 12,239,331 13,403,802 1,164,471 10%
Services and Supplies 3,307,098 3,956,727 3,844,307 (112,420) -3%
Total Operating Expense (OPEX) 15,958,985 16,196,058 17,248,109 1,052,051 6%Strategic/Vision Project 710,000 638,000 850,900 212,900 33%
Capital (CAPEX) 5,679,386 5,527,358 5,496,726 (30,632) -1%
Special Projects 161,068 - - -
Property Mgt. 292,426 292,938 324,822 31,884 11%
Debt Service 8,902,356 8,902,356 8,874,965 (27,391) 0%
Land and Assoc. Costs 9,675,000 9,295,000 7,999,000 (1,296,000) -14%
Total Non-Operating Expense 25,420,236 24,655,652 23,546,413 (1,109,239) -4%
Total District Expenditures 41,379,220 40,851,710 40,794,522 (57,188) 0%
TOTAL OPERATING BUDGET (OPEX) 15,958,985 16,196,058 17,248,109 1,052,051 6%
16,091,753 16,307,216 17,230,000 922,784 6%TOTAL OVER/(UNDER): OPEX (132,769) (111,158) 18,109 129,267 -116%
TOTAL CAPITAL BUDGET (CAPEX) 5,679,386 5,527,358 5,496,726 (30,632) -1%
2,318,626 1,750,830 2,386,427 635,597 36%
TOTAL CAPITAL BUDGET, net of Grant Income 3,360,760 3,776,528 3,110,299 (666,229) -18%
TOTAL DISTRICT TARGET: OPEX
LESS: GRANT INCOME
2/14/20136:30 PM
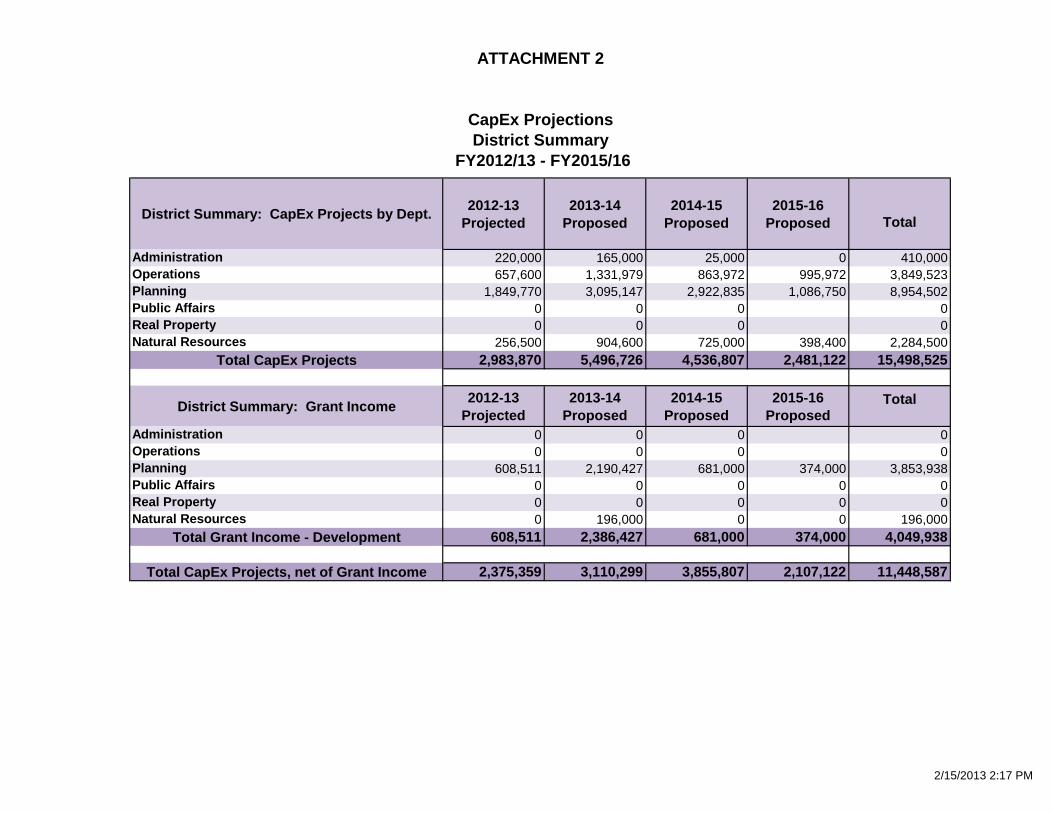
ATTACHMENT 2
CapEx Projections
District Summary
FY2012/13 - FY2015/16
District Summary: CapEx Projects by Dept.2012-13
Projected
2013-14
Proposed
2014-15
Proposed
2015-16
Proposed Total
Administration 220,000 165,000 25,000 0 410,000
Operations 657,600 1,331,979 863,972 995,972 3,849,523
Planning 1,849,770 3,095,147 2,922,835 1,086,750 8,954,502
Public Affairs 0 0 0 0
Real Property 0 0 0 0
Natural Resources 256,500 904,600 725,000 398,400 2,284,500
Total CapEx Projects 2,983,870 5,496,726 4,536,807 2,481,122 15,498,525
District Summary: Grant Income2012-13
Projected
2013-14
Proposed
2014-15
Proposed
2015-16
ProposedTotal
Administration 0 0 0 0
Operations 0 0 0 0
Planning 608,511 2,190,427 681,000 374,000 3,853,938
Public Affairs 0 0 0 0 0
Real Property 0 0 0 0 0
Natural Resources 0 196,000 0 0 196,000
Total Grant Income - Development 608,511 2,386,427 681,000 374,000 4,049,938
Total CapEx Projects, net of Grant Income 2,375,359 3,110,299 3,855,807 2,107,122 11,448,587
2/15/2013 2:17 PM
ATTACHMENT 3
Five-Year OpEx Forecast
FY2013-14 FY2014-15 FY2015-16 FY2016-17 FY2017-18
3% COLA 3% COLA 0% COLA 0% COLA 0% COLA
OpEx Target 17,230,000 18,432,990 19,721,649 21,103,093 22,577,320
Total Annual OpEx Budget 17,248,109 17,928,469 18,225,350 18,584,691 18,961,095
Under/(Over) OpEx Target (18,109) 504,521 1,496,300 2,518,402 3,616,225
Salaries 9,739,341 9,992,044 9,996,564 9,998,936 10,001,368
Retirement 1,783,634 2,033,972 2,135,226 2,285,673 2,436,204
Insurance 1,880,827 2,019,703 2,171,983 2,339,289 2,523,121
Total Salaries and Benefits 13,403,802 14,045,719 14,303,772 14,623,898 14,960,693
Services and Supplies 3,844,307 3,882,750 3,921,578 3,960,793 4,000,401
Total Services and Supplies 3,844,307 3,882,750 3,921,578 3,960,793 4,000,401
TOTAL OPEX 17,248,109 17,928,469 18,225,350 18,584,691 18,961,095
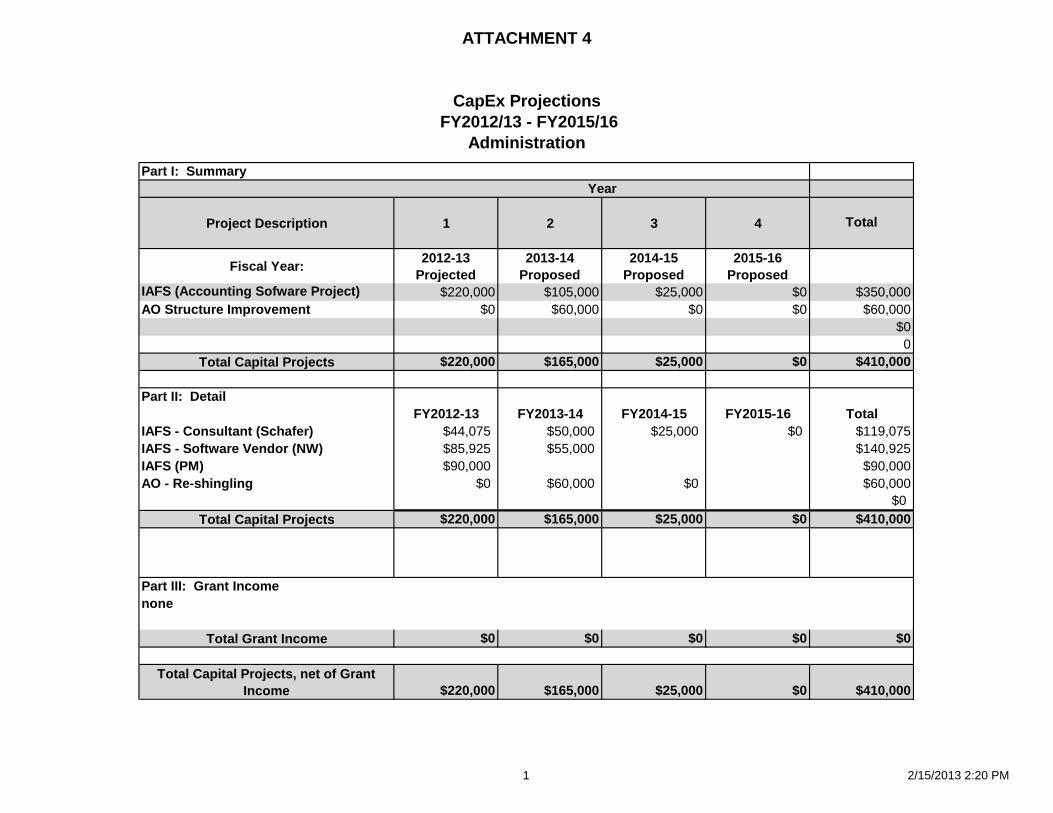
ATTACHMENT 4
CapEx Projections
FY2012/13 - FY2015/16
Administration
Part I: Summary
Project Description 1 2 3 4 Total
Fiscal Year:2012-13
Projected
2013-14
Proposed
2014-15
Proposed
2015-16
Proposed
IAFS (Accounting Sofware Project) $220,000 $105,000 $25,000 $0 $350,000
AO Structure Improvement $0 $60,000 $0 $0 $60,000
$0
0
Total Capital Projects $220,000 $165,000 $25,000 $0 $410,000
Part II: Detail
FY2012-13 FY2013-14 FY2014-15 FY2015-16 Total
IAFS - Consultant (Schafer) $44,075 $50,000 $25,000 $0 $119,075
IAFS - Software Vendor (NW) $85,925 $55,000 $140,925
IAFS (PM) $90,000 $90,000
AO - Re-shingling $0 $60,000 $0 $60,000
$0
Total Capital Projects $220,000 $165,000 $25,000 $0 $410,000
Part III: Grant Income
none
Total Grant Income $0 $0 $0 $0 $0
Total Capital Projects, net of Grant
Income $220,000 $165,000 $25,000 $0 $410,000
Year
1 2/15/2013 2:20 PM
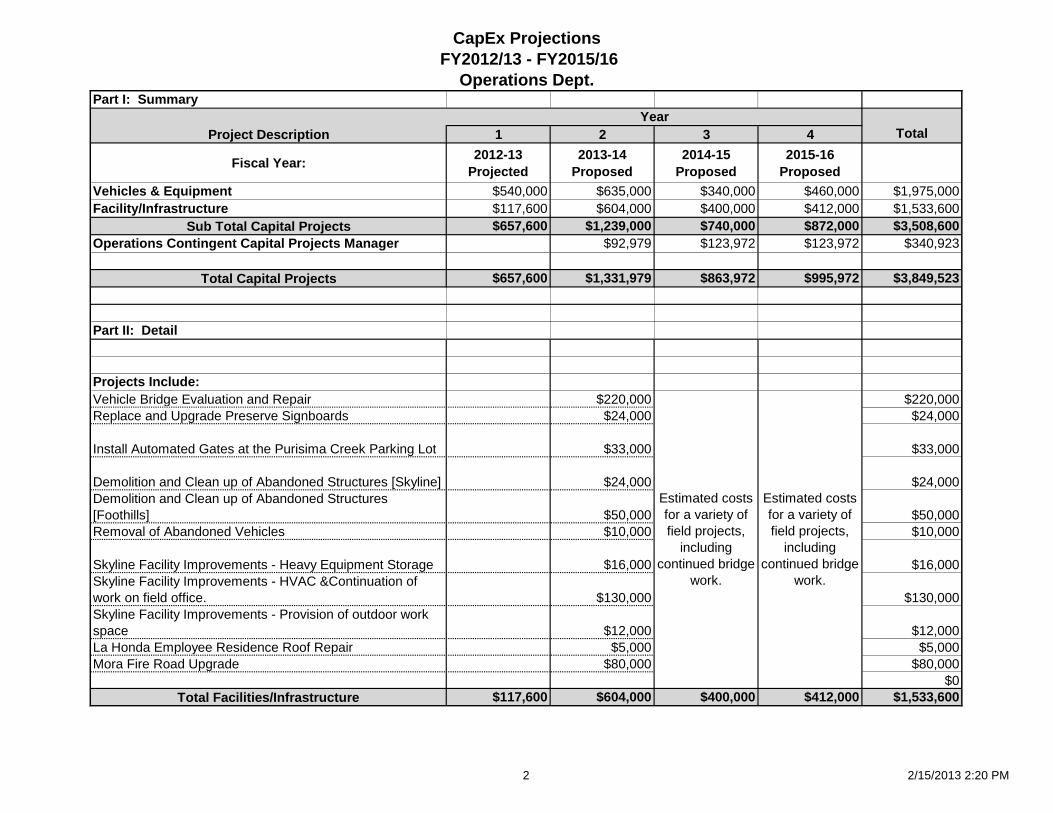
CapEx Projections
FY2012/13 - FY2015/16
Operations Dept.Part I: Summary
Project Description 1 2 3 4 Total
Fiscal Year:2012-13
Projected
2013-14
Proposed
2014-15
Proposed
2015-16
Proposed
Vehicles & Equipment $540,000 $635,000 $340,000 $460,000 $1,975,000
Facility/Infrastructure $117,600 $604,000 $400,000 $412,000 $1,533,600
Sub Total Capital Projects $657,600 $1,239,000 $740,000 $872,000 $3,508,600
Operations Contingent Capital Projects Manager $92,979 $123,972 $123,972 $340,923
Total Capital Projects $657,600 $1,331,979 $863,972 $995,972 $3,849,523
Part II: Detail
Projects Include:
Vehicle Bridge Evaluation and Repair $220,000 $220,000
Replace and Upgrade Preserve Signboards $24,000 $24,000
Install Automated Gates at the Purisima Creek Parking Lot $33,000 $33,000
Demolition and Clean up of Abandoned Structures [Skyline] $24,000 $24,000
Demolition and Clean up of Abandoned Structures
[Foothills] $50,000 $50,000
Removal of Abandoned Vehicles $10,000 $10,000
Skyline Facility Improvements - Heavy Equipment Storage $16,000 $16,000
Skyline Facility Improvements - HVAC &Continuation of
work on field office. $130,000 $130,000
Skyline Facility Improvements - Provision of outdoor work
space $12,000 $12,000
La Honda Employee Residence Roof Repair $5,000 $5,000
Mora Fire Road Upgrade $80,000 $80,000
$0
Total Facilities/Infrastructure $117,600 $604,000 $400,000 $412,000 $1,533,600
Year
Estimated costs
for a variety of
field projects,
including
continued bridge
work.
Estimated costs
for a variety of
field projects,
including
continued bridge
work.
2 2/15/2013 2:20 PM
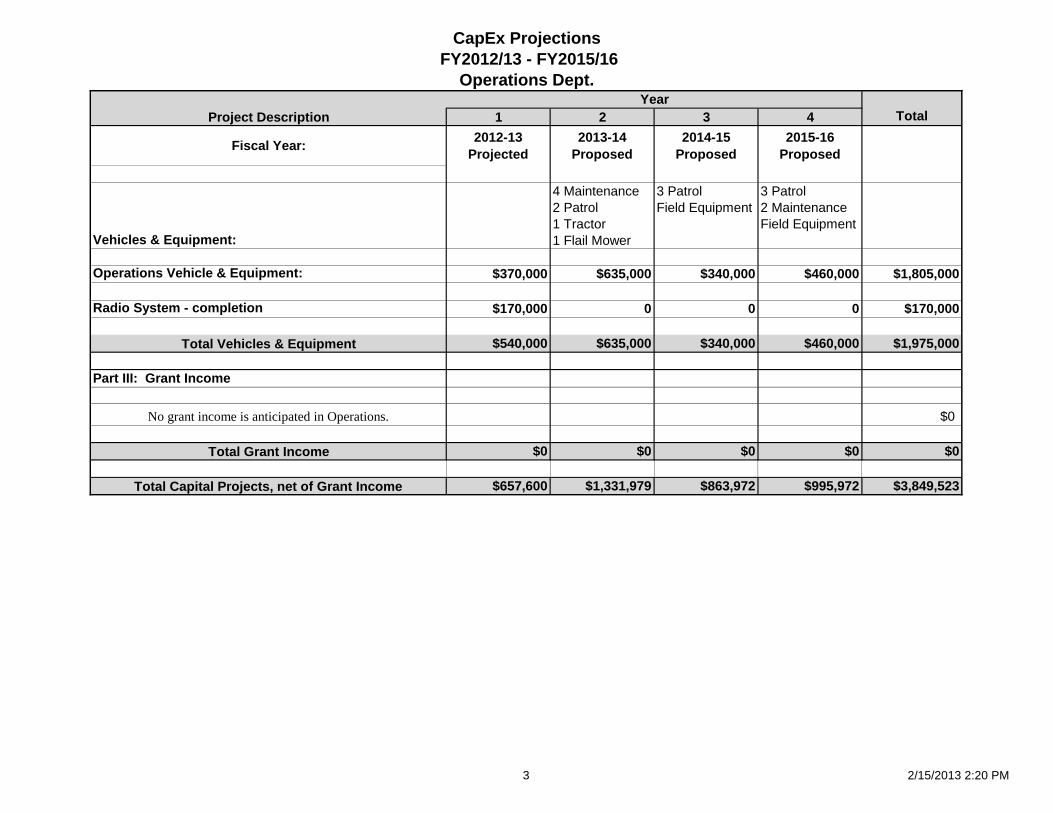
CapEx Projections
FY2012/13 - FY2015/16
Operations Dept.
Project Description 1 2 3 4 Total
Fiscal Year:2012-13
Projected
2013-14
Proposed
2014-15
Proposed
2015-16
Proposed
Year
Vehicles & Equipment:
4 Maintenance
2 Patrol
1 Tractor
1 Flail Mower
3 Patrol
Field Equipment
3 Patrol
2 Maintenance
Field Equipment
Operations Vehicle & Equipment: $370,000 $635,000 $340,000 $460,000 $1,805,000
Radio System - completion $170,000 0 0 0 $170,000
Total Vehicles & Equipment $540,000 $635,000 $340,000 $460,000 $1,975,000
Part III: Grant Income
$0
Total Grant Income $0 $0 $0 $0 $0
Total Capital Projects, net of Grant Income $657,600 $1,331,979 $863,972 $995,972 $3,849,523
No grant income is anticipated in Operations.
3 2/15/2013 2:20 PM
CapEx Projections
FY2012/13 - FY2015/16
Planning
Part I: Summary
Project Description 1 2 3 4Total
Fiscal Year:2012-13
Projected
2013-14
Proposed
2014-15
Proposed
2015-16
Proposed
Public Access (330) $1,012,000 $1,131,297 $1,789,489 $865,150 $4,797,937
Staff Facilities (340) $185,000 $156,000 $75,000 $125,000 $541,000
Long Range Planning (350) $177,000 $90,000 $30,000 $55,000 $352,000
Resource Management (360) $0 $25,000 $25,000 $0 $50,000
Mount Umunhum $475,770 $1,692,850 $1,003,346 $41,600 $3,213,566
Total Capital Projects $1,849,770 $3,095,147 $2,922,835 $1,086,750 $8,954,502
Part II: Detail
FY2012-13 FY2013-14 FY2014-15 FY2015-16 Total
PUBLIC ACESS (330)
El Corte de Madera Creek Staging Area and Trail
Improvements $713,000 $375,000 $156,817 $65,150 $1,309,968
Mindego Gateway $177,000 $347,058 $524,058
Mary Davey Memorial $12,000 $5,000 $17,000
La Honda Creek Master Plan Implementation Phase I $80,000 $10,000 $10,000 $100,000
Fremont Older Safety Improvements $10,000 $32,500 $172,560 $215,060
Purisima Creek Bridge Assessment/Repair $10,000 $10,000
Peter's Creek Trail Bridge Repair $10,000 $10,000
Mt Um Implementation Phase I (superceded by sep. proj.
below) $55,000 $55,000
Mt Um Summit Area $456,112 $432,400 $888,512
Mt Um Remediation and Restoration (incl. demolition) $100,770 $1,502,950 $1,603,720
Mt Um Bald Mtn Staging Area $62,200 $657,880 $720,080
Mt Um Summit Trail from Bald Mtn Staging Area $22,000 $4,800 $32,000 $58,800
Mt Um Radar Tower Repair $89,000 $333,466 $422,466
Silva Driveway $56,200 $56,200
Mindego Hill Trail $70,000 $5,000 $75,000
Bay Trail $196,000 $264,000 $57,600 $517,600
Unanticipated Expenses $25,000 $25,000 $25,000 $75,000
4 2/15/2013 2:20 PM
CapEx Projections
FY2012/13 - FY2015/16
Planning
Project Description 1 2 3 4Total
Fiscal Year:2012-13
Projected
2013-14
Proposed
2014-15
Proposed
2015-16
Proposed
Hawthorns Site Management Phase I $100,000 $100,000 $200,000
Mindego Demolition $175,000 $175,000
Council Circle Access $80,000 $80,000
Driscoll $25,000 $25,000 $50,000
Various Demo Projects $50,000 $50,000 $100,000
Ancient Oaks Trail $150,000 $150,000
Stevens Canyon Trail $20,000 $50,000 $70,000
Beatty Staging Area $100,000 $50,000 $150,000
Other $24,539 $24,539
STAFF FACILITIES (340)
Folger Ranch House Remodel $185,000 $185,000
AO Lease Space $131,000 $131,000
AO Long Term Solution $50,000 $100,000 $150,000
Unanticipated Expenses $25,000 $25,000 $25,000 $75,000
LONG RANGE PLANNING (350)
Cooley Landing Peninsula Partnership with East Palo Alto $75,000 $30,000 $30,000 $30,000 $165,000
Sierra Azul/Bear Creek Redwoods Master Plan $0 $0 $25,000 $25,000
La Honda Creek Master Plan $22,000 $22,000
Road and Trail Inventories $20,000 $20,000
Mindego Use and Management Plan $60,000 $60,000 $120,000
Mount Umunhum Site Planning $320,000 $320,000
RESOURCE MANAGEMENT (360)
Mt Um Purple Martin Restoration $16,700 $7,200 $9,600 $33,500
unanticipated expenses $25,000 $25,000 $0 $50,000
Total Capital Projects $1,849,770 $3,095,147 $2,922,835 $1,086,750 $8,954,502
5 2/15/2013 2:20 PM
CapEx Projections
FY2012/13 - FY2015/16
Planning
Project Description 1 2 3 4Total
Fiscal Year:2012-13
Projected
2013-14
Proposed
2014-15
Proposed
2015-16
Proposed
Part III: Grant Income
FY2012-13 FY2013-14 FY2014-15 FY2015-16 Total
Thornewood San Francisco Creek Watershed Restoration $7,000 $7,000
Mt Um Reimb - Remediation/Demolition - thru Phase II $100,000 $1,141,197 $1,241,197
Mt Um Implementation Phase I $601,000 $374,000 $975,000
Mindego Gateway Project - POST funded $101,511 $582,000 $683,511
Mindego Council Circle Access- POST funded $0 $80,000 80,000
El Corte de Madera Creek Parking and Trails Improvements $384,230 $384,230
Bay Trail - (Santa Clara County grant) $83,000 $83,000
Cooley Landing Land Remediation (100% Grant funded) $400,000 $400,000
Total Grant Income $608,511 $2,190,427 $681,000 $374,000 $3,853,938
Total Capital Projects, net of Grant Income $1,241,259 $904,720 $2,241,835 $712,750 $5,100,564
6 2/15/2013 2:20 PM
CapEx Projections
FY2012/13 - FY2015/16
Natural ResourcesPart I: Summary
Project Description 1 2 3 4Total
Fiscal Year:2012-13
Projected
2013-14
Proposed
2014-15
Proposed
2015-16
Proposed
Natural Resource Management $61,000 $256,600 $195,000 $30,000 $542,600
Environmental Restoration and Remediation $195,500 $593,000 $365,000 $328,400 $1,481,900
Agricultural Land Management $0 $55,000 $165,000 $40,000 $260,000
Total Capital Projects $256,500 $904,600 $725,000 $398,400 $2,284,500
Part II: Detail
FY2012-13 FY2013-14 FY2014-15 FY2015-16 Total
Resource Management (820)
Grassland Prescribed Fire Management Program 9,000$ 5,000$ 140,000$ 30,000$ 184,000$
Integrated Pest Management Program 52,000$ 251,600$ 55,000$ 358,600$
Environmental Restoration and Remediation (830)
Pulgas Water Tank Demolition 30,000$ 30,000$
La Honda Creek OSP Watershed Protection -$ 55,000$ -$ 88,400$ 143,400$
El Corte de Madera Creek Watershed Protection
Program 10,000$ 100,000$ 50,000$ 160,000$
Peters Creek Trail Improvements 35,000$ 10,000$ 45,000$
Restoration Forestry Demonstration Project 60,000$ 15,000$ 75,000$
Ponds DR05 Repairs 50,000$ 122,500$ 172,500$
Ponds DR07 and DR08 Repairs 95,500$ 95,500$
La Honda Creek OSP Pond Repairs 25,000$ 25,000$ 50,000$
Hicks Flat Mercury Remediation -$ 196,000$ 10,000$ 206,000$
Guadalupe River TMDL 10,000$ 10,000$
Alma College Remediation -$ -$ 40,000$ 40,000$
Mindego Ranch Remediation -$ 10,000$ 10,000$ 20,000$
Mindego Gateway Project Permitting 27,500$ 10,000$ 37,500$
Mindego Ranch Aquatic Species Recovery Program 47,000$ 50,000$ 50,000$ 147,000$
Madonna Creek Ranch Creek Assessment 100,000$ 100,000$ 200,000$
Russian Ridge Grassland Restoration 50,000$ 50,000$
Year
7 2/15/2013 2:20 PM
CapEx Projections
FY2012/13 - FY2015/16
Natural Resources
Project Description 1 2 3 4Total
Fiscal Year:2012-13
Projected
2013-14
Proposed
2014-15
Proposed
2015-16
Proposed
Year
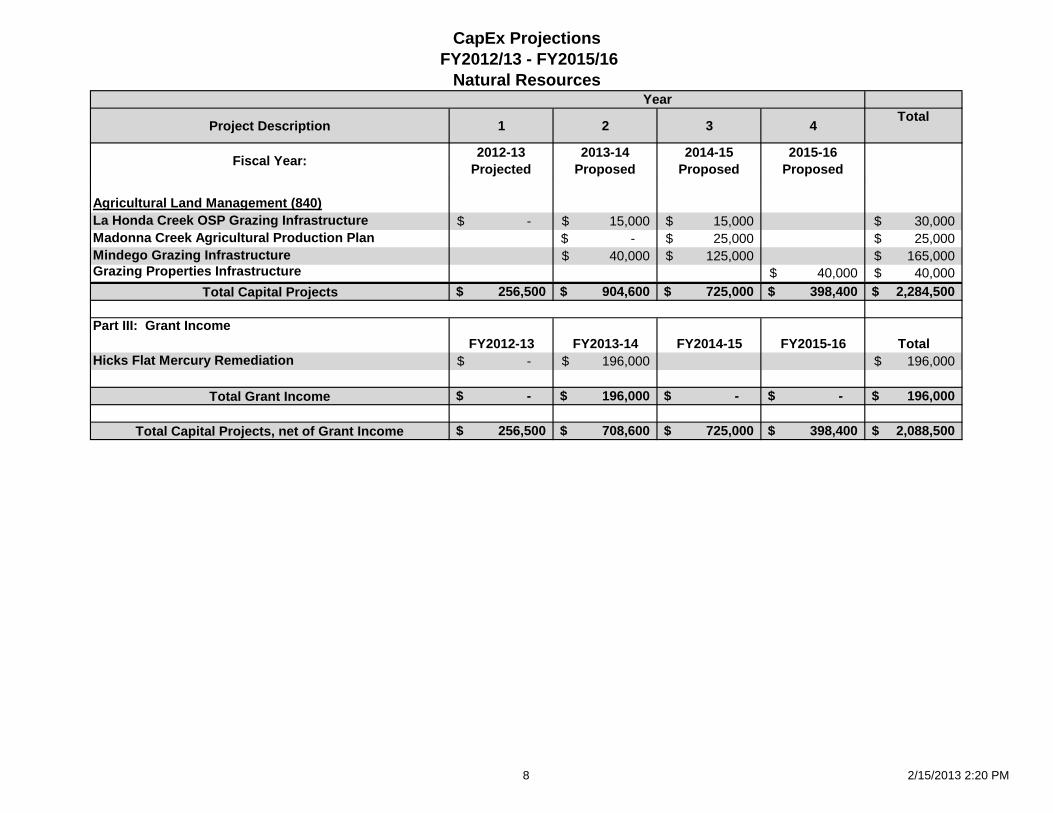
Agricultural Land Management (840)
La Honda Creek OSP Grazing Infrastructure -$ 15,000$ 15,000$ 30,000$
Madonna Creek Agricultural Production Plan -$ 25,000$ 25,000$
Mindego Grazing Infrastructure 40,000$ 125,000$ 165,000$ Grazing Properties Infrastructure 40,000$ 40,000$
Total Capital Projects 256,500$ 904,600$ 725,000$ 398,400$ 2,284,500$
Part III: Grant Income
FY2012-13 FY2013-14 FY2014-15 FY2015-16 Total
Hicks Flat Mercury Remediation -$ 196,000$ 196,000$
Total Grant Income -$ 196,000$ -$ -$ 196,000$
Total Capital Projects, net of Grant Income 256,500$ 708,600$ 725,000$ 398,400$ 2,088,500$
8 2/15/2013 2:20 PM