Embed Size (px)
Citation preview
FIN – 1
Agenda
Finance Committee
Council Chambers, City Hall 6911 No. 3 Road
Tuesday, September 7, 2021 Immediately following the General Purposes Committee meeting
Pg. # ITEM
MINUTES FIN-4 Motion to adopt the minutes of the meeting of the Finance Committee held
on July 5, 2021.
FINANCE AND CORPORATE SERVICES DIVISION 1. FINANCIAL INFORMATION – 2ND QUARTER JUNE 30, 2021
(File Ref. No.) (REDMS No. 6713116)
FIN-8 See Page FIN-8 for full report
Designated Speaker: Cindy Gilfillan
STAFF RECOMMENDATION
That the staff report titled, “Financial Information – 2nd Quarter June 30, 2021”, dated August 6, 2021 from the Acting Director, Finance be received for information.
Finance Committee Agenda – Tuesday, September 7, 2021 Pg. # ITEM
FIN – 2
2. ACTIVE CAPITAL PROJECTS INFORMATION - 2ND QUARTER JUNE 30, 2021 (File Ref. No. 03-0975-01) (REDMS No. 6713219)
FIN-36 See Page FIN-36 for full report
Designated Speaker: Jenny Ho
STAFF RECOMMENDATION
That the staff report titled, “Active Capital Projects Information – 2nd Quarter June 30, 2021”, dated August 4, 2021 from the Acting Director, Finance be received for information.
LULU ISLAND ENERGY COMPANY 3. LULU ISLAND ENERGY COMPANY – 2ND QUARTER JUNE 30,
2021 FINANCIAL INFORMATION (File Ref. No. 01-0060-20-LIEC) (REDMS No. 6726602)
FIN-67 See Page FIN-67 for full report
Designated Speakers: Alen Postolka & Jerry Chong
STAFF RECOMMENDATION
That the Lulu Island Energy Company report titled “Lulu Island Energy Company – 2nd Quarter June 30, 2021 Financial Information”, dated August 10, 2021 from the Chief Executive Officer and Chief Financial Officer, be received for information.
RICHMOND OLYMPIC OVAL CORPORATION 4. RICHMOND OLYMPIC OVAL CORPORATION - 2ND QUARTER
2021 FINANCIAL INFORMATION (REDMS No. 6730969)
FIN-75 See Page FIN-75 for full report
Designated Speaker: Rick Dusanj
Finance Committee Agenda – Tuesday, September 7, 2021 Pg. # ITEM
FIN – 3
STAFF RECOMMENDATION
That the report on Financial Information for the Richmond Olympic Oval Corporation for the second quarter ended June 30, 2021 from the Director, Finance of the Richmond Olympic Oval Corporation be received for information.
ADJOURNMENT
Date:
Place:
Present:
City of Richmond
Finance Committee
Monday, July 5, 2021
Council Chambers
Richmond City Hall
Mayor Malcolm D. Brodie, Chair Councillor Chak Au Councillor Carol Day (by teleconference) Councillor Andy Hobbs
Councillor Alexa Loo Councillor Bill McNulty (by teleconference) Councillor Linda McPhail (by teleconference) Councillor Harold Steves (by teleconference) Councillor Michael Wolfe (by teleconference)
Minutes
Call to Order: The Chair called the meeting to order at 5:55 p.m.
MINUTES
It was moved and seconded
That the minutes of the Special Finance Committee meeting held on April
26, 2021, and the Finance Committee meeting held on June 7, 2021, be
adopted as circulated.
CARRIED
FINANCE AND CORPORATE SERVICES DIVISION
1. REVENUE ANTICIPATION BORROWING (2021) BYLAW NO. 10270(File Ref. No. 03-0900-01 (REDMS No. 6689521)
It was moved and seconded
That Revenue Anticipation Borrowing (2021) Bylaw No. 10270 be
introduced and given first, second and third readings.
CARRIED
1.FIN – 4
6706571
Finance Committee Monday, July 5, 2021
2. BANKING RESOLUTION UPDATE (File Ref. No. 03-0900-01) (REDMS No. 6684789)
It was moved and seconded That effective July 12, 2021, the banking resolution (part 9 of resolution R09!11-4) adopted by Cou11cil on June 8, 2009, be replaced with the following:
(1) All cheques be signed on behalf of the City by the Mayor or, in his/her absence, the Acting Mayor as determined by Council resolution, and counter-sig11ed by the General Manager, Fi11ance and Corporate Services or, in his/her absence, the Acting General Manager, Finance and Corporate Services. The use of a mechanical or other device in affixing a facsimile of their signatures to such cheques is also an acceptable means of authorization.
(2) The following persons are authorized in all dealings (as described below) with the City's bank 011 behalf of the City:
• Chief Administrative Officer, or in his/her absence, the Deputy Chief Administrative Officer
• General Manager, Finance and Corporate Services, or in his/her absence, the Acting General Manager, Finance and Corporate Services
• Director, Finance, or in his/her absence, the Acting Director, Finance
• Manager, Revenue, or in his/her absence, the Acting Manager, Revenue
• Manager, Treasury and Fina11cial Services, or in his/her absence, the Acting Manager, Treasury and Financial Services
Two of the above persons, one of whom must be the Chief Administrative Officer (in his/her absence, the Deputy Chief Administrative Officer), or the General Manager, Finance and Corporate Services (in his/her absence, the Acting Ge11eral Manager, Finance and Corporate Services), or the Director, Finance (in his/her absence, the Acting Director, Finance), are authorized to:
(a) Provide instructions, verifications and approvals to the City's bank (without limitation) to transfer funds, wire payments and authorize debits on behalf of the City;
(b) Enter into and authorize Financial Services Agreement, other banking agreements, cash management service requests, and electronic banking arrangements with the City's bank on behalf of the City;
2.
FIN – 5
6706571
Finance Committee Monday, July 5, 2021
( c) Obtain delivery of all or any stocks, bonds and other securities held in safekeeping or otherwise for the account of the City; and
(d) Give instructions to the City's bank and its subsidiaries in assisting with the management of the City's investments.
Any one of the above persons is authorized to:
(e) Negotiate with, deposit with, or transfer to the City's account, all or any cheques and other orders for the payment of money to the City, and to endorse such cheques and orders for the payment of money to the City, either in writing or by rubber stamp.
(3) Authorization from both the Mayor (in his/her absence the Acting Mayor) and the General Manager, Finance and Corporate Services (in his/her absence the Acting General Manager, Finance and Corporate Services or the Director, Finance), along with a copy of the adopted bylaw, are required for the City to obtain long-term borrowing from the City's bank and to grant security to the City's bank on behalf of the City.
(4) The City's bank is authorized to honour, pay and charge to the account of the City, all City's written instructions bearing a facsimile or facsimiles of the signature of the above-mentioned authorized persons on the understanding that each instruction will be binding 011
the City to the same extent as though they had been manually signed.
(5) This resolution:
(a) Remains in force and effect until written notice to the contrary has been given in writing to, and acknowledged in writing by, the City's bank; and
(b) Be certified by the Corporate Officer and provided to the City's bank, together with specimens of facsimiles of the signatures having authority to sign cheques and/or written instructions on behalf of the City.
CARRIED
ADJOURNMENT
It was moved and seconded That the meeting adjourn (5:56 p.m.).
CARRIED
3.
FIN – 6
Mayor Malcolm D. Brodie Chair
6706571
Finance Committee Monday, July 5, 2021
Certified a true and correct copy of the Minutes of the meeting of the Finance Committee of the Council of the City of Richmond held on Monday, July 5, 2021.
Shannon Unrau Legislative Services Associate
4.
FIN – 7
Report to Committee
To: Finance Committee Date: August 6, 2021
From: Ivy Wong, CPA, CMA File: Acting Director, Finance
Re: Financial Information - 2nd Quarter June 30, 2021
Staff Recommendation
That the staff rep01t titled, "Financial Information - 2nd Qumter June 30, 2021 ", dated August 6, 2021 from the Acting Director, Finance be received for information.
~ Ivy Wong, CPA, CMA Acting Director, Finance (604-276-4046)
Att: 5
ROUTED TO: Arts, Culture & Heritage Building Approvals Community Bylaws Community Social Development Development Applications Economic Development Engineering Facilities and Project Development Fire Rescue Information Technology Parks Services Public Works RCMP Real Estate Services Recreation & Sport Services Transportation Library Services
SENIOR STAFF REPORT REVIEW
67 13 11 6
REPORT CONCURRENCE
CONCURRENCE [fil
[fil
[fil
[fil
[fil
[fil
[fil
[fil
[fil
[fil
[fil
[fil
[fil
[fil
[fil
[fil
[fil
INITIALS:
CONCURRENCE OF GENERAL MANAGER
Acting GM, F&CS
C
FIN – 8
Origin
Pre-audited financial information for the 2nd quarter ended June 30, 2021 is provided to the Finance Committee for review. The report provides details on the economic environment, financial results and other key indicator information. The financial information provides Council with an overview of the City of Richmond’s (the City) financial results throughout the year and before the annual audited financial statements are presented.
The COVID-19 pandemic began to impact the City’s financial results in mid-March 2020 by the closure of public facilities, including libraries, community recreation centres, and cultural facilities. In May 2020, Council endorsed the Restoring Richmond Plan for the gradual reimplementation of program and services through a step-by-step approach to reopening various City services, amenities and facilities while maintaining physical distancing and public health guidelines as they continue to be updated. Due to the pandemic, the City continues to experience reductions in revenue such as gaming revenues, which will have a significant impact on future quarterly results. The length of the economic disruption and recovery is uncertain at this time as public health orders continue to be updated to address issues as they arise.
This report supports Council’s Strategic Plan 2018-2022 Strategic Focus Area #5 Sound Financial Management and #8 An Engaged and Informed Community:
5.1 Maintain a strong and robust financial position.
5.2 Clear accountability through transparent budgeting practices and effective public communication.
8.2 Ensure citizens are well-informed with timely, accurate and easily accessible communication using a variety of methods and tools.
Analysis
Macroeconomic Indicators & Forecast
Economic growth prospects remain highly uncertain across the globe due to the ongoing COVID-19 pandemic. Expanding vaccine coverage is enabling increased activity and optimism, although recovery timelines vary by geography and sector. This reflects different levels of pandemic-induced disruptions and government policy support. New virus mutations, particularly the Delta variant, are adding additional elements of uncertainty regarding the extent and duration of the pandemic.
As public health restrictions subside, household spending is anticipated to fuel a surge in demand for services consumption as limited spending opportunities and high government transfers during the pandemic have resulted in an accumulation of personal savings.
FIN – 9
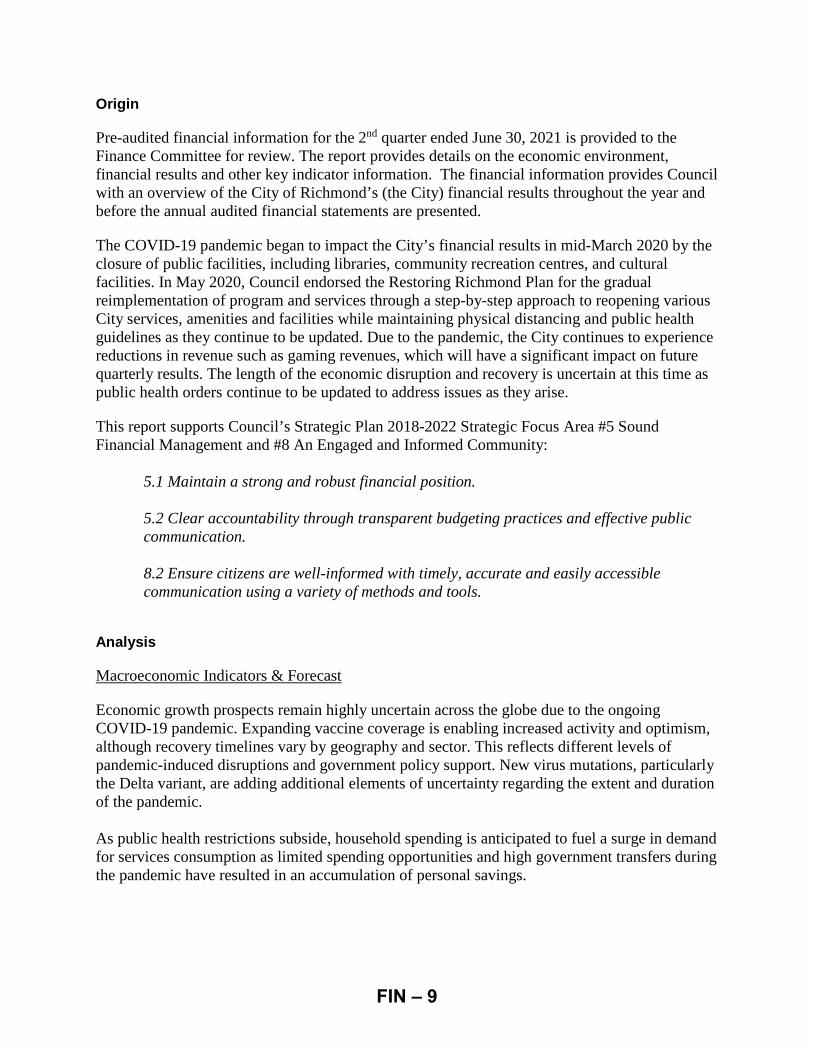
1) Global Growth – Real Gross Domestic Product (GDP) % Change1
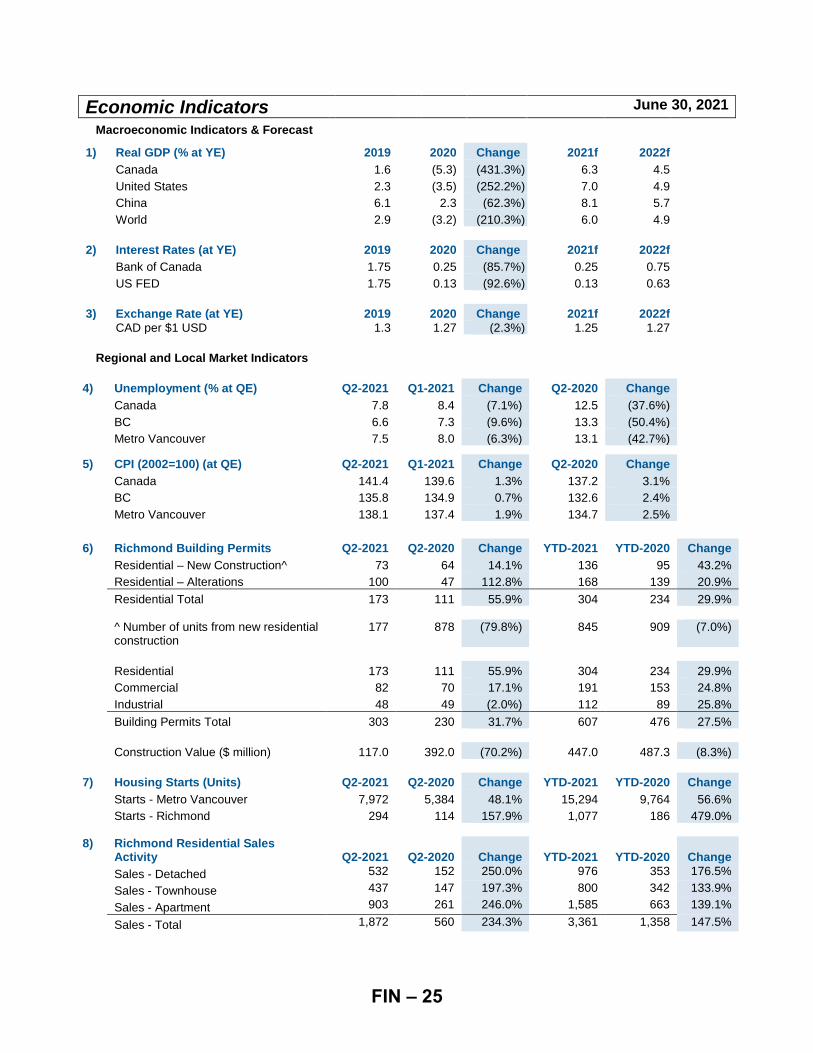
• The International Monetary Fund (IMF) projects global Gross Domestic Product (GDP) will increase by 6.0% in 2021, compared to a 3.2% decline in 2020.
• GDP forecasts have changed slightly since the April 2021 report reflecting fiscal support and improved health conditions in a few major economies, but also some delay in recoveries in many upstream producing nations. The overall global forecast remained unchanged while the outlook is diverging for advanced economies compared to emerging markets.
• 2020 marked the largest decline in Canada’s economy since the Great Depression, but the year ended with strong rebound activity and GDP is forecasted to grow by 6.3% in 2021. The U.S. growth forecast for 2021 is 7%.
• Global GDP growth is expected to slow to 4.9% in 2022. Canadian, U.S. and China GDP growth forecasts are 4.5%, 4.9%, and 5.7%, respectively, for 2022.
2) Interest Rates – US and Canadian Overnight Central Bank Rate % at Year-End2
• At the end of Q1 2020, in response to the COVID-19 pandemic, the Bank of Canada (BoC) announced an emergency rate cut to 0.25% for the overnight lending rate where it has remained since that time.
• The BoC rate is forecasted to remain at its lower bound throughout 2021 and climb gradually once the inflation rate returns consistently to the 2 percent.
• The U.S. Federal Reserve (US FED) rate remained at 0.13% where it is expected to remain, potentially rising in 2022.
1 International Monetary Fund, World Economic Outlook (July 2021) 2 US Federal Reserve, Bank of Canada and Royal Bank Economic Research Forecast (July 2021)
FIN – 10
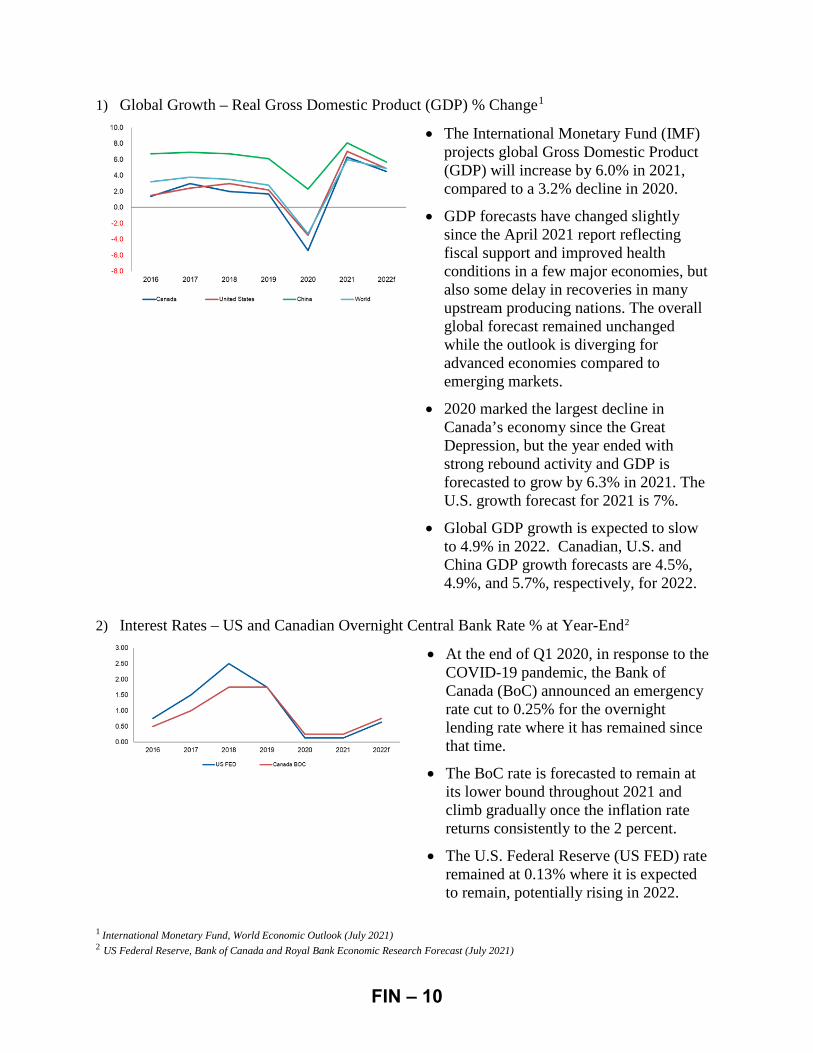
3) Exchange Rates – CAD/USD at Year-End3
• Due to a combination of better growth prospects boosting commodity prices and a weakening in the US dollar, the USD/CAD exchange rate ended Q2 2021 at $1.24 CAD per $1 USD.
• The Canadian dollar (CAD) is expected to end 2021 at $1.25 CAD per $1 USD and depreciate further to $1.27 CAD per $1 USD by the end of 2022.
• The value of the CAD against the USD will be dependent on the relative economic recovery in the two countries.
• A weaker Canadian dollar may benefit non-commodity export sectors, such as tourism, as cross-border economic activity resumes.
Regional & Local Economic Activity Indicators
4) Unemployment4
• While the unemployment rate in Canada improved in Q2, the rate has still not returned to pre-pandemic levels as more people have entered the workforce.
• Employment in some sectors has proven to be highly resilient and has surpassed levels seen before the pandemic. Those sectors most affected by public health restrictions, such as hospitality, have seen restrictions eased. However, it is proving challenging finding staff for some segments of the hospitality industry as many found new sectors of employment during the pandemic.
• At the end of Q2 2021 the Canada, BC and Metro Vancouver unemployment rates were 7.8%, 6.6% and 7.5%, respectively.
3 Royal Bank Economic Research Forecast (July 2021) 4 Statistics Canada
FIN – 11
5) Consumer Price Index (CPI – 2002=100)5
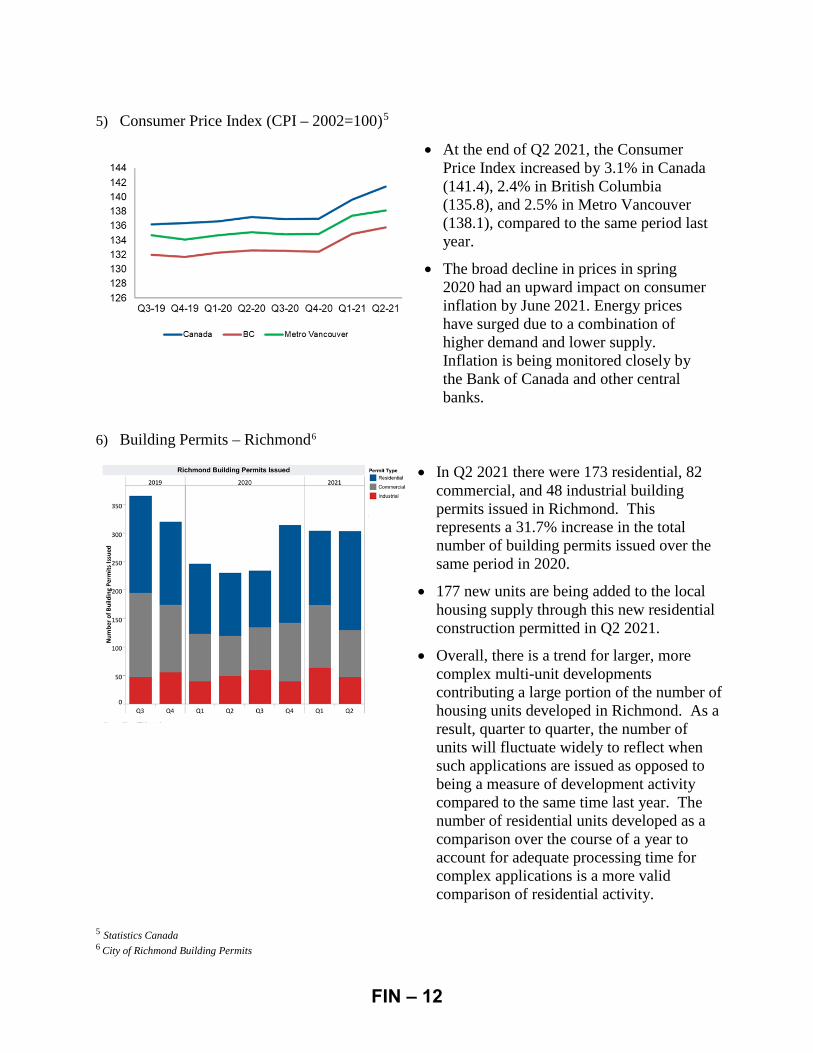
• At the end of Q2 2021, the Consumer Price Index increased by 3.1% in Canada (141.4), 2.4% in British Columbia (135.8), and 2.5% in Metro Vancouver (138.1), compared to the same period last year.
• The broad decline in prices in spring 2020 had an upward impact on consumer inflation by June 2021. Energy prices have surged due to a combination of higher demand and lower supply. Inflation is being monitored closely by the Bank of Canada and other central banks.
6) Building Permits – Richmond6
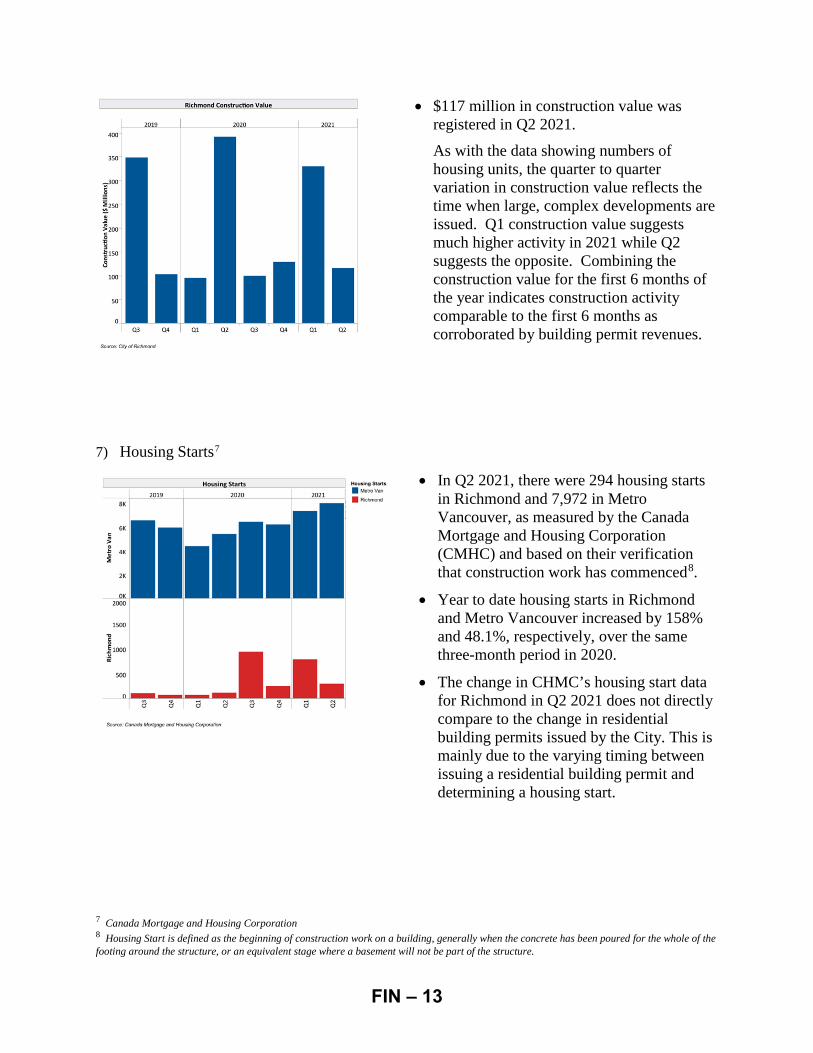
• In Q2 2021 there were 173 residential, 82 commercial, and 48 industrial building permits issued in Richmond. This represents a 31.7% increase in the total number of building permits issued over the same period in 2020.
• 177 new units are being added to the local housing supply through this new residential construction permitted in Q2 2021.
• Overall, there is a trend for larger, more complex multi-unit developments contributing a large portion of the number of housing units developed in Richmond. As a result, quarter to quarter, the number of units will fluctuate widely to reflect when such applications are issued as opposed to being a measure of development activity compared to the same time last year. The number of residential units developed as a comparison over the course of a year to account for adequate processing time for complex applications is a more valid comparison of residential activity.
5 Statistics Canada 6 City of Richmond Building Permits
FIN – 12
• $117 million in construction value was registered in Q2 2021. As with the data showing numbers of housing units, the quarter to quarter variation in construction value reflects the time when large, complex developments are issued. Q1 construction value suggests much higher activity in 2021 while Q2 suggests the opposite. Combining the construction value for the first 6 months of the year indicates construction activity comparable to the first 6 months as corroborated by building permit revenues.
7) Housing Starts7
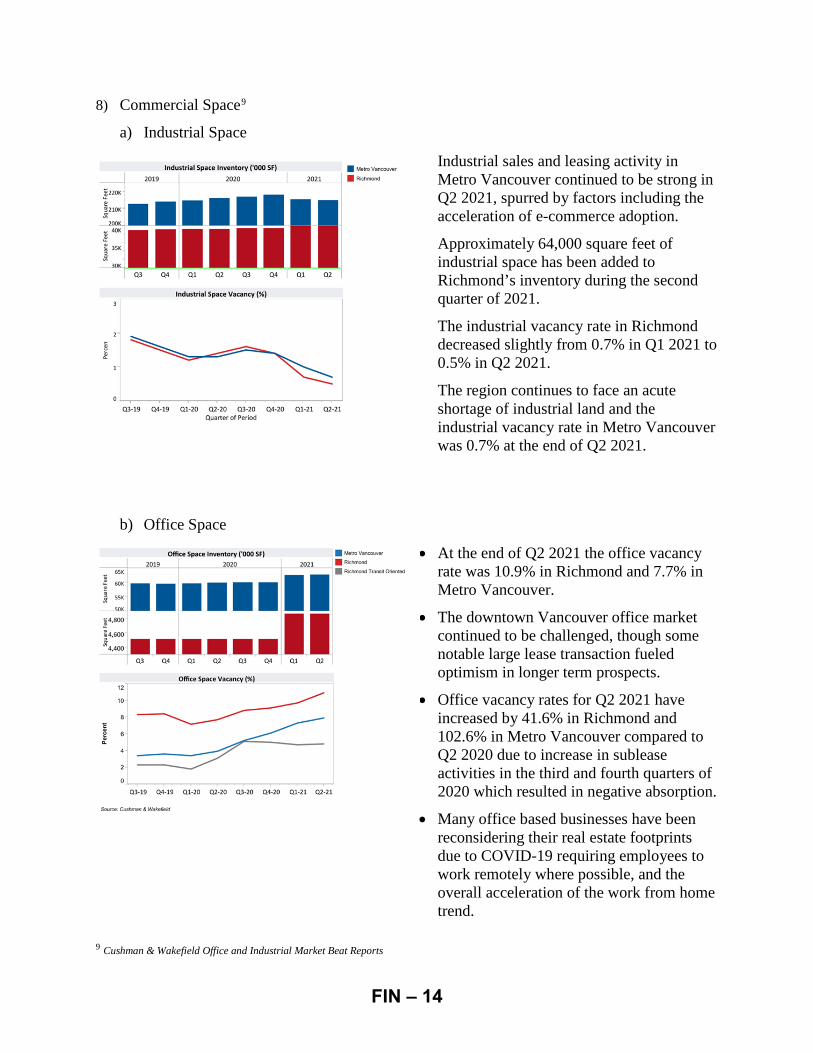
• In Q2 2021, there were 294 housing starts in Richmond and 7,972 in Metro Vancouver, as measured by the Canada Mortgage and Housing Corporation (CMHC) and based on their verification that construction work has commenced8.
• Year to date housing starts in Richmond and Metro Vancouver increased by 158% and 48.1%, respectively, over the same three-month period in 2020.
• The change in CHMC’s housing start data for Richmond in Q2 2021 does not directly compare to the change in residential building permits issued by the City. This is mainly due to the varying timing between issuing a residential building permit and determining a housing start.
7 Canada Mortgage and Housing Corporation 8 Housing Start is defined as the beginning of construction work on a building, generally when the concrete has been poured for the whole of the footing around the structure, or an equivalent stage where a basement will not be part of the structure.
FIN – 13
8) Commercial Space9
a) Industrial Space
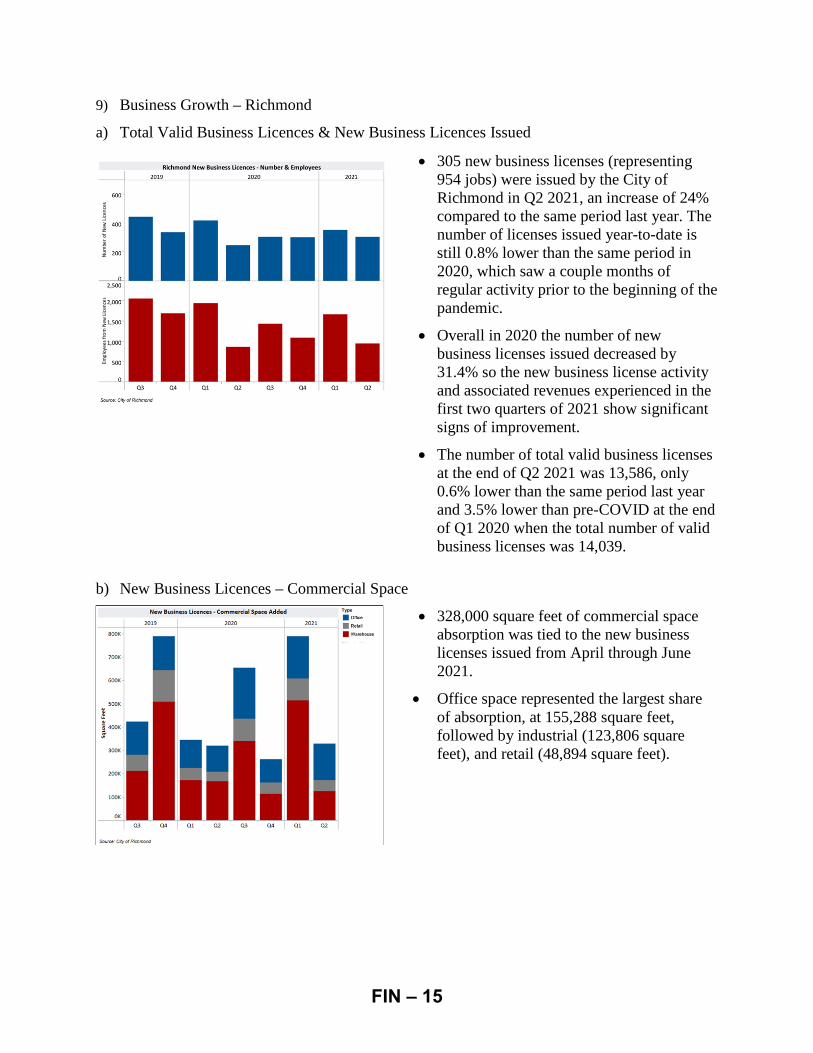
• Industrial sales and leasing activity in Metro Vancouver continued to be strong in Q2 2021, spurred by factors including the acceleration of e-commerce adoption.
• Approximately 64,000 square feet of industrial space has been added to Richmond’s inventory during the second quarter of 2021.
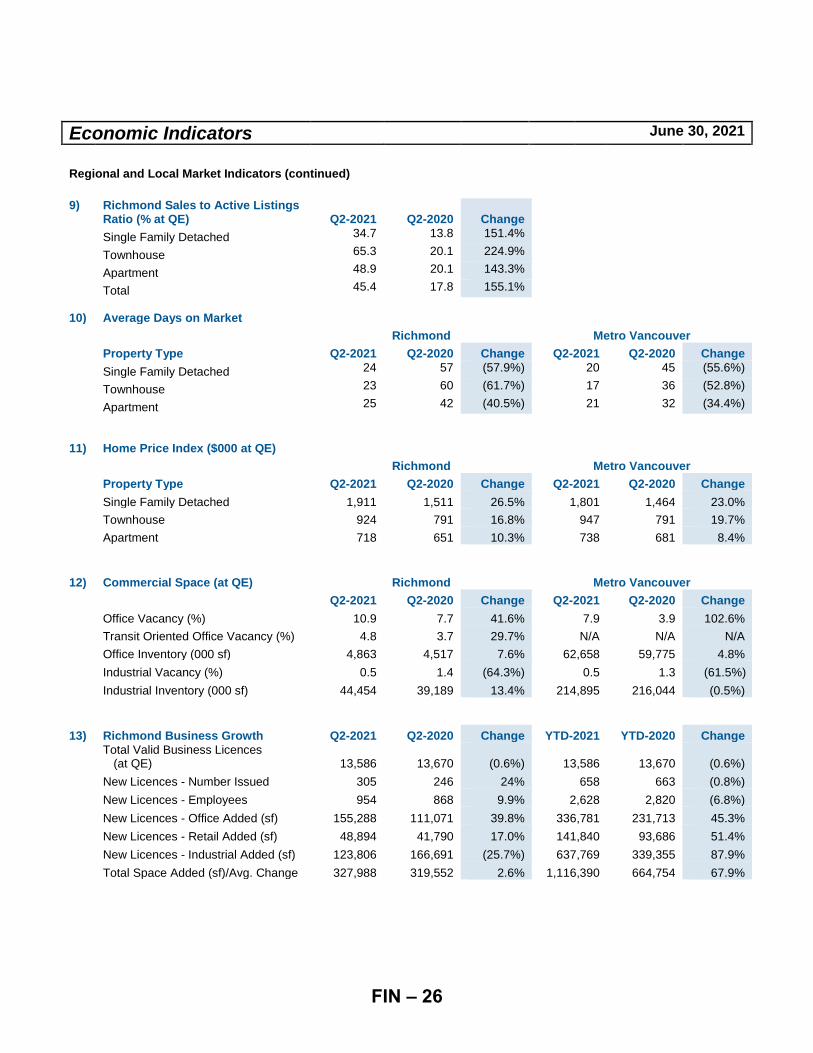
• The industrial vacancy rate in Richmond decreased slightly from 0.7% in Q1 2021 to 0.5% in Q2 2021.
• The region continues to face an acute shortage of industrial land and the industrial vacancy rate in Metro Vancouver was 0.7% at the end of Q2 2021.
b) Office Space
• At the end of Q2 2021 the office vacancy rate was 10.9% in Richmond and 7.7% in Metro Vancouver.
• The downtown Vancouver office market continued to be challenged, though some notable large lease transaction fueled optimism in longer term prospects.
• Office vacancy rates for Q2 2021 have increased by 41.6% in Richmond and 102.6% in Metro Vancouver compared to Q2 2020 due to increase in sublease activities in the third and fourth quarters of 2020 which resulted in negative absorption.
• Many office based businesses have been reconsidering their real estate footprints due to COVID-19 requiring employees to work remotely where possible, and the overall acceleration of the work from home trend.
9 Cushman & Wakefield Office and Industrial Market Beat Reports
FIN – 14
9) Business Growth – Richmond
a) Total Valid Business Licences & New Business Licences Issued
• 305 new business licenses (representing 954 jobs) were issued by the City of Richmond in Q2 2021, an increase of 24% compared to the same period last year. The number of licenses issued year-to-date is still 0.8% lower than the same period in 2020, which saw a couple months of regular activity prior to the beginning of the pandemic.
• Overall in 2020 the number of new business licenses issued decreased by 31.4% so the new business license activity and associated revenues experienced in the first two quarters of 2021 show significant signs of improvement.
• The number of total valid business licenses at the end of Q2 2021 was 13,586, only 0.6% lower than the same period last year and 3.5% lower than pre-COVID at the end of Q1 2020 when the total number of valid business licenses was 14,039.
b) New Business Licences – Commercial Space
• 328,000 square feet of commercial space absorption was tied to the new business licenses issued from April through June 2021.
• Office space represented the largest share of absorption, at 155,288 square feet, followed by industrial (123,806 square feet), and retail (48,894 square feet).
FIN – 15
10) Goods and People Movement
a) Regional Cargo Movement10
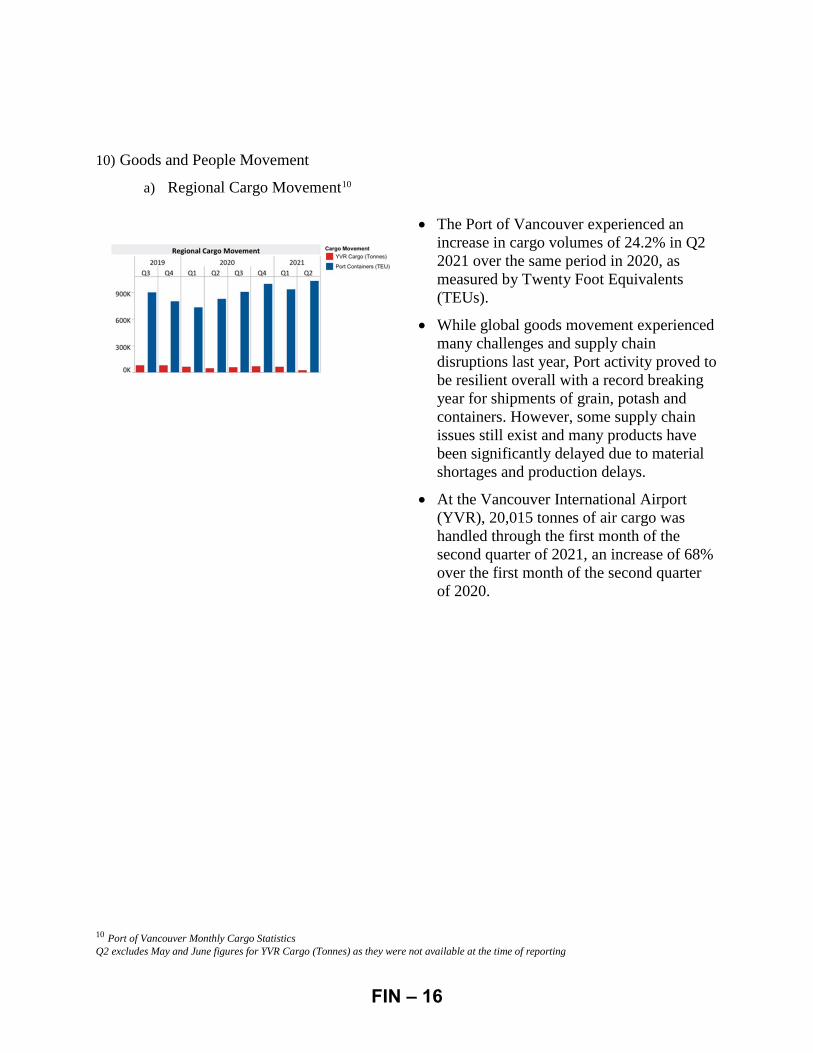
• The Port of Vancouver experienced an
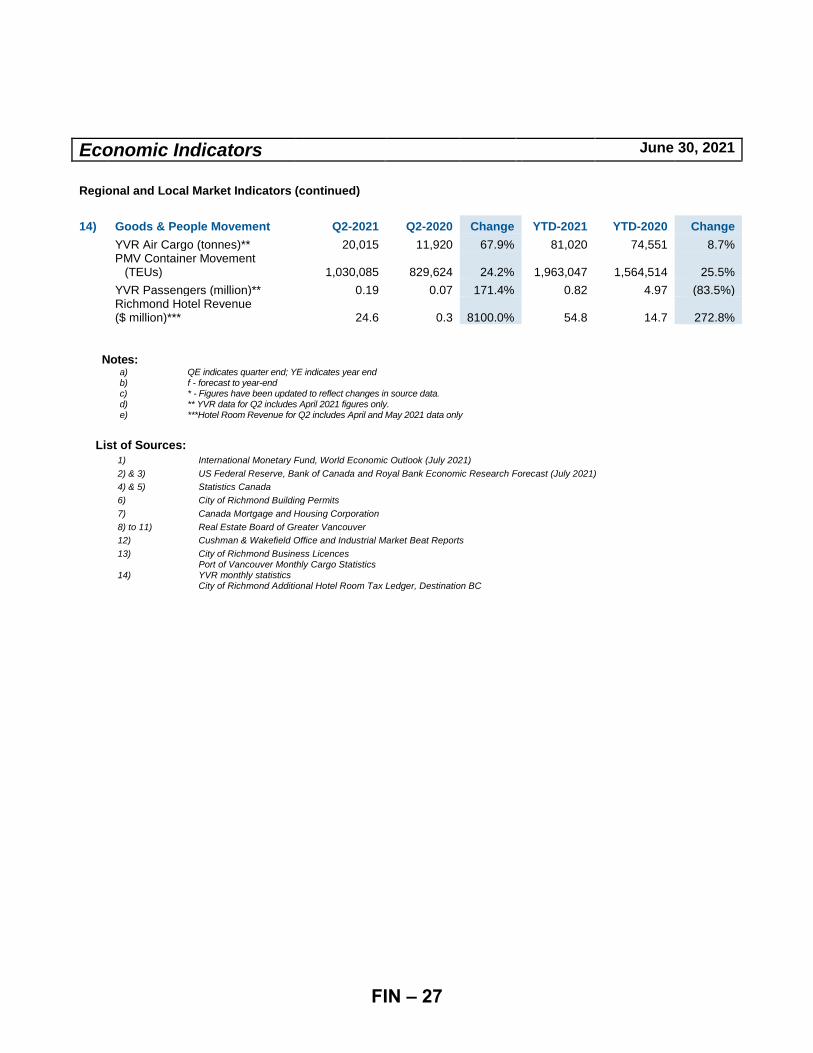
increase in cargo volumes of 24.2% in Q2 2021 over the same period in 2020, as measured by Twenty Foot Equivalents (TEUs).
• While global goods movement experienced many challenges and supply chain disruptions last year, Port activity proved to be resilient overall with a record breaking year for shipments of grain, potash and containers. However, some supply chain issues still exist and many products have been significantly delayed due to material shortages and production delays.
• At the Vancouver International Airport (YVR), 20,015 tonnes of air cargo was handled through the first month of the second quarter of 2021, an increase of 68% over the first month of the second quarter of 2020.
10 Port of Vancouver Monthly Cargo Statistics Q2 excludes May and June figures for YVR Cargo (Tonnes) as they were not available at the time of reporting
FIN – 16
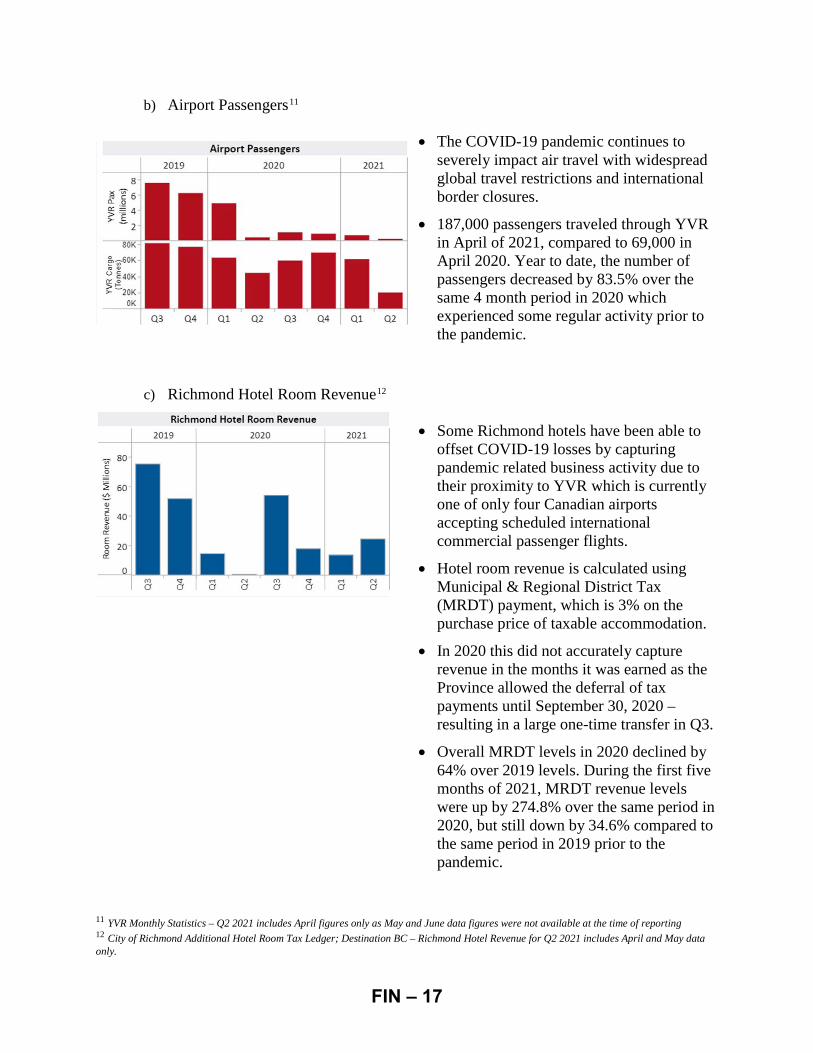
b) Airport Passengers11
• The COVID-19 pandemic continues to severely impact air travel with widespread global travel restrictions and international border closures.
• 187,000 passengers traveled through YVR in April of 2021, compared to 69,000 in April 2020. Year to date, the number of passengers decreased by 83.5% over the same 4 month period in 2020 which experienced some regular activity prior to the pandemic.
c) Richmond Hotel Room Revenue12
• Some Richmond hotels have been able to offset COVID-19 losses by capturing pandemic related business activity due to their proximity to YVR which is currently one of only four Canadian airports accepting scheduled international commercial passenger flights.
• Hotel room revenue is calculated using Municipal & Regional District Tax (MRDT) payment, which is 3% on the purchase price of taxable accommodation.
• In 2020 this did not accurately capture revenue in the months it was earned as the Province allowed the deferral of tax payments until September 30, 2020 – resulting in a large one-time transfer in Q3.
• Overall MRDT levels in 2020 declined by 64% over 2019 levels. During the first five months of 2021, MRDT revenue levels were up by 274.8% over the same period in 2020, but still down by 34.6% compared to the same period in 2019 prior to the pandemic.
11 YVR Monthly Statistics – Q2 2021 includes April figures only as May and June data figures were not available at the time of reporting 12 City of Richmond Additional Hotel Room Tax Ledger; Destination BC – Richmond Hotel Revenue for Q2 2021 includes April and May data only.
FIN – 17
Residential Real Estate13
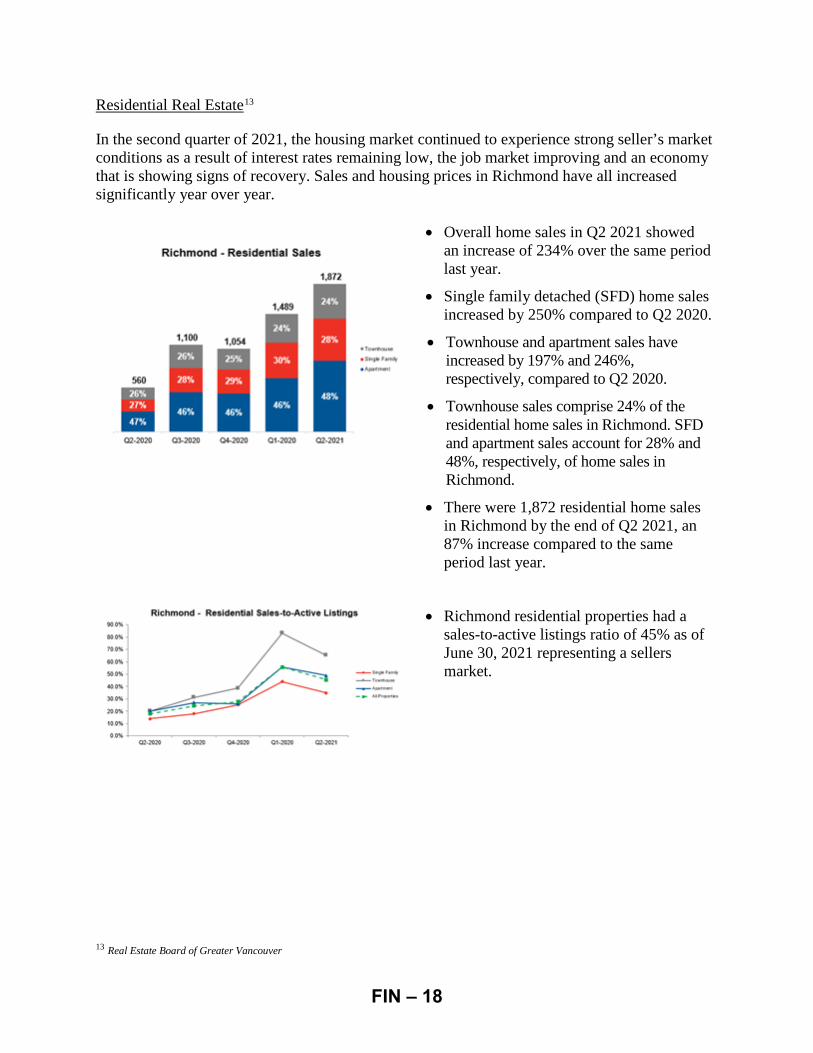
In the second quarter of 2021, the housing market continued to experience strong seller’s market conditions as a result of interest rates remaining low, the job market improving and an economy that is showing signs of recovery. Sales and housing prices in Richmond have all increased significantly year over year.
• Overall home sales in Q2 2021 showed an increase of 234% over the same period last year.
• Single family detached (SFD) home sales increased by 250% compared to Q2 2020.
• Townhouse and apartment sales have increased by 197% and 246%, respectively, compared to Q2 2020.
• Townhouse sales comprise 24% of the residential home sales in Richmond. SFD and apartment sales account for 28% and 48%, respectively, of home sales in Richmond.
• There were 1,872 residential home sales in Richmond by the end of Q2 2021, an 87% increase compared to the same period last year.
• Richmond residential properties had a sales-to-active listings ratio of 45% as of June 30, 2021 representing a sellers market.
13 Real Estate Board of Greater Vancouver
FIN – 18
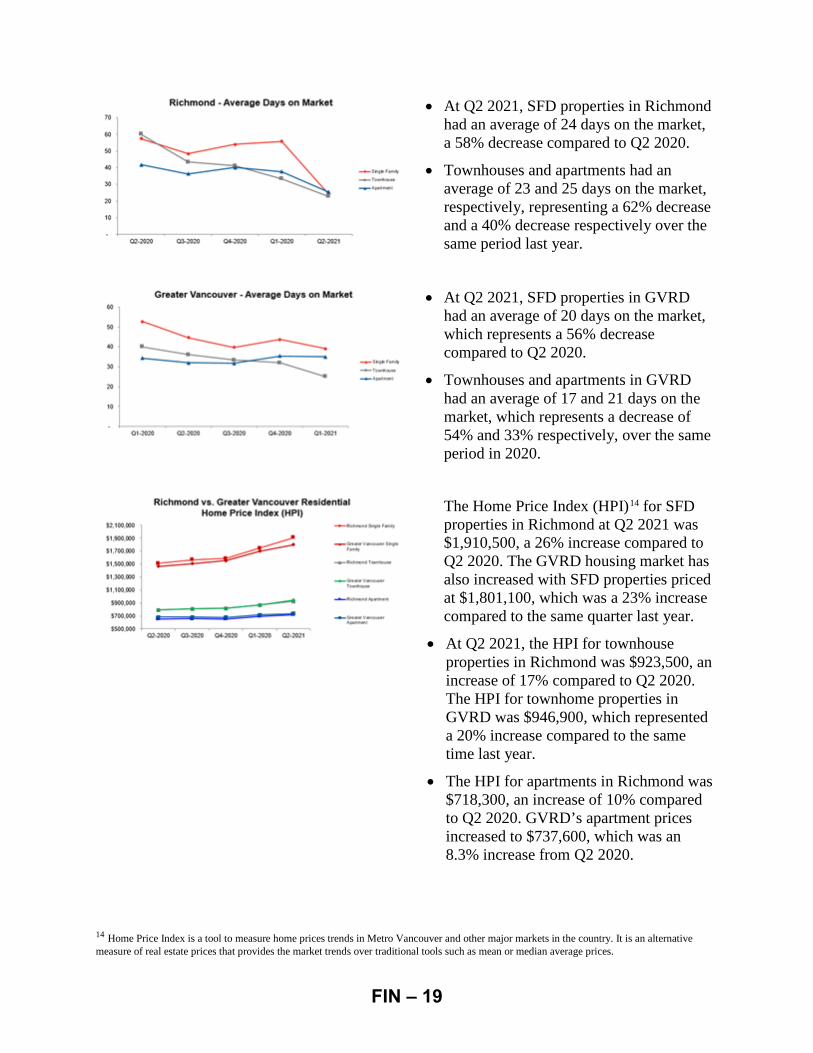
• At Q2 2021, SFD properties in Richmond had an average of 24 days on the market, a 58% decrease compared to Q2 2020.
• Townhouses and apartments had an average of 23 and 25 days on the market, respectively, representing a 62% decrease and a 40% decrease respectively over the same period last year.
• At Q2 2021, SFD properties in GVRD had an average of 20 days on the market, which represents a 56% decrease compared to Q2 2020.
• Townhouses and apartments in GVRD had an average of 17 and 21 days on the market, which represents a decrease of 54% and 33% respectively, over the same period in 2020.
The Home Price Index (HPI)14 for SFD properties in Richmond at Q2 2021 was $1,910,500, a 26% increase compared to Q2 2020. The GVRD housing market has also increased with SFD properties priced at $1,801,100, which was a 23% increase compared to the same quarter last year.
• At Q2 2021, the HPI for townhouse properties in Richmond was $923,500, an increase of 17% compared to Q2 2020. The HPI for townhome properties in GVRD was $946,900, which represented a 20% increase compared to the same time last year.
• The HPI for apartments in Richmond was $718,300, an increase of 10% compared to Q2 2020. GVRD’s apartment prices increased to $737,600, which was an 8.3% increase from Q2 2020.
14 Home Price Index is a tool to measure home prices trends in Metro Vancouver and other major markets in the country. It is an alternative measure of real estate prices that provides the market trends over traditional tools such as mean or median average prices.
FIN – 19
Gaming Revenue
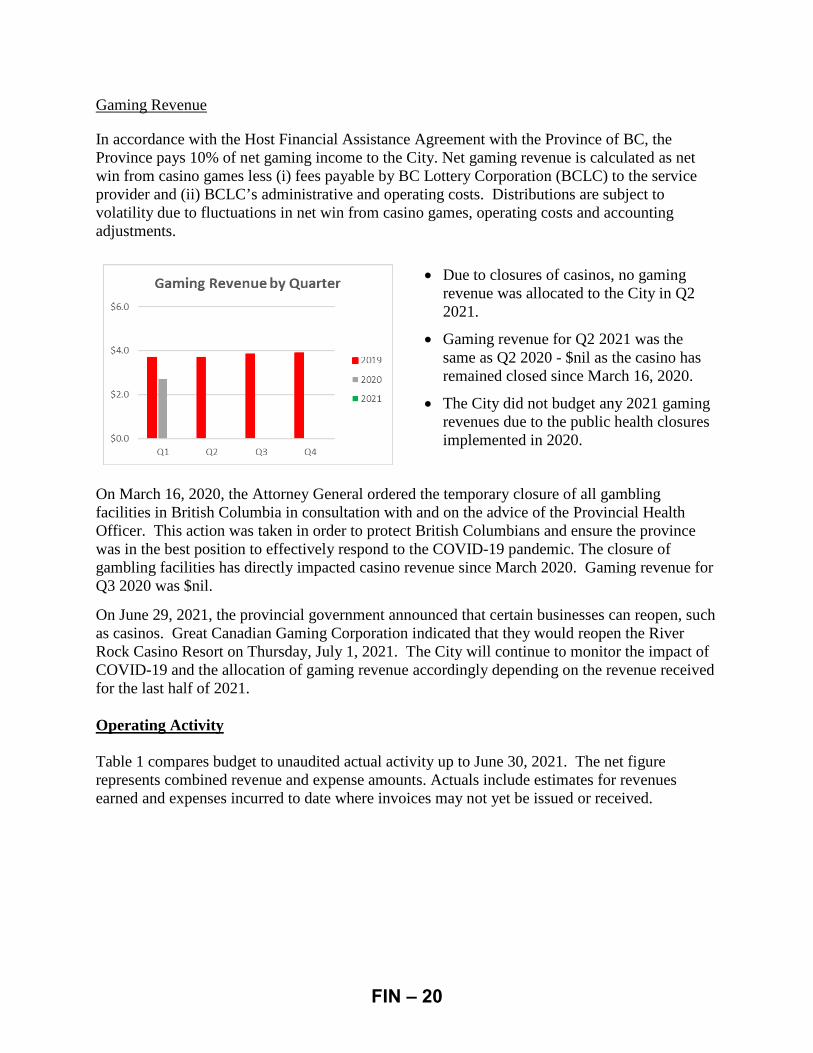
In accordance with the Host Financial Assistance Agreement with the Province of BC, the Province pays 10% of net gaming income to the City. Net gaming revenue is calculated as net win from casino games less (i) fees payable by BC Lottery Corporation (BCLC) to the service provider and (ii) BCLC’s administrative and operating costs. Distributions are subject to volatility due to fluctuations in net win from casino games, operating costs and accounting adjustments.
• Due to closures of casinos, no gamingrevenue was allocated to the City in Q22021.
• Gaming revenue for Q2 2021 was thesame as Q2 2020 - $nil as the casino hasremained closed since March 16, 2020.
• The City did not budget any 2021 gamingrevenues due to the public health closuresimplemented in 2020.
On March 16, 2020, the Attorney General ordered the temporary closure of all gambling facilities in British Columbia in consultation with and on the advice of the Provincial Health Officer. This action was taken in order to protect British Columbians and ensure the province was in the best position to effectively respond to the COVID-19 pandemic. The closure of gambling facilities has directly impacted casino revenue since March 2020. Gaming revenue for Q3 2020 was $nil.
On June 29, 2021, the provincial government announced that certain businesses can reopen, such as casinos. Great Canadian Gaming Corporation indicated that they would reopen the River Rock Casino Resort on Thursday, July 1, 2021. The City will continue to monitor the impact of COVID-19 and the allocation of gaming revenue accordingly depending on the revenue received for the last half of 2021.
Operating Activity
Table 1 compares budget to unaudited actual activity up to June 30, 2021. The net figure represents combined revenue and expense amounts. Actuals include estimates for revenues earned and expenses incurred to date where invoices may not yet be issued or received.
FIN – 20
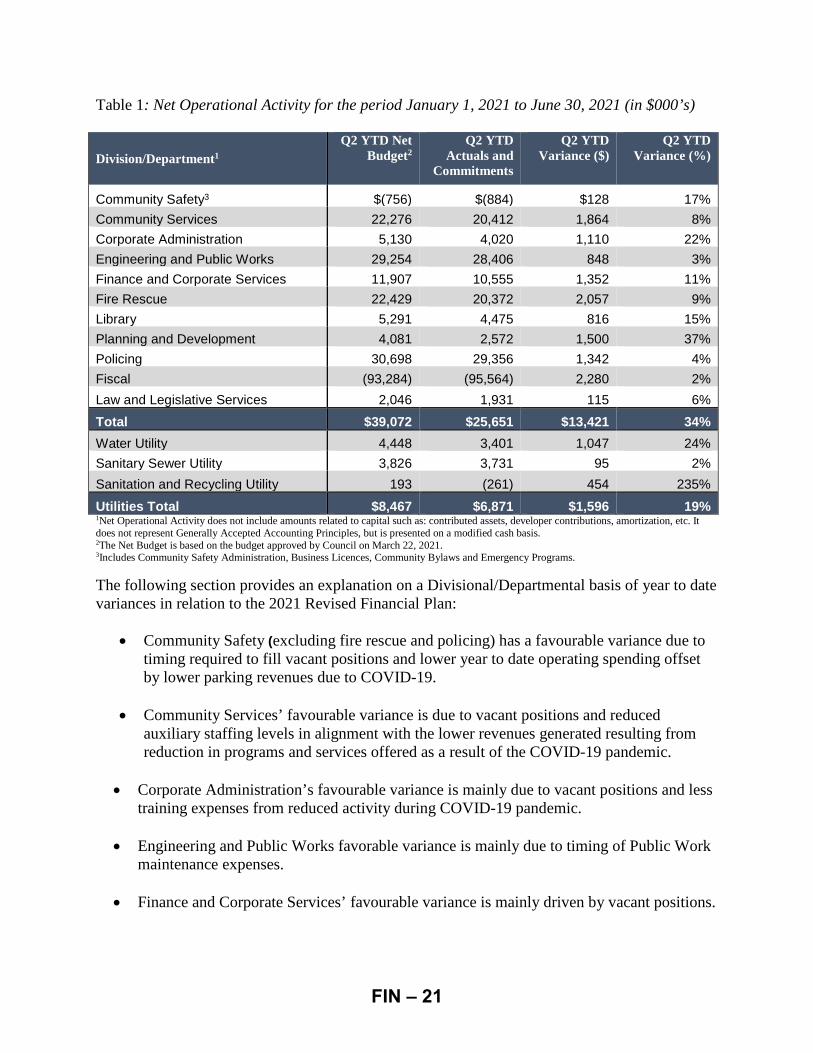
Table 1: Net Operational Activity for the period January 1, 2021 to June 30, 2021 (in $000’s)
Division/Department1 Q2 YTD Net
Budget2 Q2 YTD
Actuals and Commitments
Q2 YTD Variance ($)
Q2 YTD Variance (%)
Community Safety3 $(756) $(884) $128 17% Community Services 22,276 20,412 1,864 8% Corporate Administration 5,130 4,020 1,110 22% Engineering and Public Works 29,254 28,406 848 3% Finance and Corporate Services 11,907 10,555 1,352 11% Fire Rescue 22,429 20,372 2,057 9% Library 5,291 4,475 816 15% Planning and Development 4,081 2,572 1,500 37% Policing 30,698 29,356 1,342 4% Fiscal (93,284) (95,564) 2,280 2% Law and Legislative Services 2,046 1,931 115 6% Total $39,072 $25,651 $13,421 34% Water Utility 4,448 3,401 1,047 24% Sanitary Sewer Utility 3,826 3,731 95 2% Sanitation and Recycling Utility 193 (261) 454 235% Utilities Total $8,467 $6,871 $1,596 19% 1Net Operational Activity does not include amounts related to capital such as: contributed assets, developer contributions, amortization, etc. It does not represent Generally Accepted Accounting Principles, but is presented on a modified cash basis. 2The Net Budget is based on the budget approved by Council on March 22, 2021. 3Includes Community Safety Administration, Business Licences, Community Bylaws and Emergency Programs. The following section provides an explanation on a Divisional/Departmental basis of year to date variances in relation to the 2021 Revised Financial Plan:
• Community Safety (excluding fire rescue and policing) has a favourable variance due to
timing required to fill vacant positions and lower year to date operating spending offset by lower parking revenues due to COVID-19.
• Community Services’ favourable variance is due to vacant positions and reduced auxiliary staffing levels in alignment with the lower revenues generated resulting from reduction in programs and services offered as a result of the COVID-19 pandemic.
• Corporate Administration’s favourable variance is mainly due to vacant positions and less
training expenses from reduced activity during COVID-19 pandemic.
• Engineering and Public Works favorable variance is mainly due to timing of Public Work maintenance expenses.
• Finance and Corporate Services’ favourable variance is mainly driven by vacant positions.
FIN – 21
• Fire Rescue’s favourable variance is due to timing required to fill the Council approved 12Firefighters and vacancies due to retirement.
• The Library’s favourable variance is mainly due to vacant positions. Any surplus at year-end will be appropriated for future use within library operations.
• Planning and Development’s favourable variance is primarily due to vacant positions andhigher than budgeted building permit revenue related to multi residential buildings.
• Policing favourable variance is due to timing required to fill the Council approved 16RCMP Officers and 11 Municipal Employees.
• Fiscal’s favourable variance is mainly due to timing of expenditures.
• Law and Legislative Services’ favourable variance is due to vacancies and lower thanbudgeted general operating expenses.
• Water Utility’s favorable variance is mainly driven by unbudgeted construction revenueand less public works maintenance than budgeted. Any surplus at year-end will betransferred to the Water Levy Stabilization Provision.
• Sanitary Sewer Utility is on budget. Any surplus at year-end will be transferred to theSewer Stabilization Provision.
• Sanitation and Recycling Utility’s favourable variance is mainly due to higher thanbudgeted Recycle BC revenue and garbage and recycling processing fees. Any surplus atyear end will be transferred to the General Solid Waste and Recycling Provision
The capability of remote work has also contributed to savings in most of the respective Divisions/Departments listed above.
The presentation of the figures for the Financial Statement, Statement of Operations is different from the Net Budget presentation above. The above presentation combines revenues and expenses and presents the net amount inclusive of transfers. The Statement of Operations presents the revenues and expenses separately and prior to any appropriations and transfer to reserves. The Statement of Operations for the Three Month Period Ended June 30, 2021, with comparative figures for 2020 is included in Attachment 3.
Cash and Investment Portfolio
As of June 30, 2021, the City’s total cash and investment balance totalled $1.53 billion with a weighted average annualized yield of 1.42%. The overall cash and investment balance is comprised of $653.4 million in investments and $880.4 million in interest bearing cash account (Attachment 4). The higher than normal cash balance was primarily due to the annual incoming cash flow from property tax collection, of which close to $230 million collected on behalf of other taxing agencies will be remitted back to these agencies in subsequent months.
FIN – 22
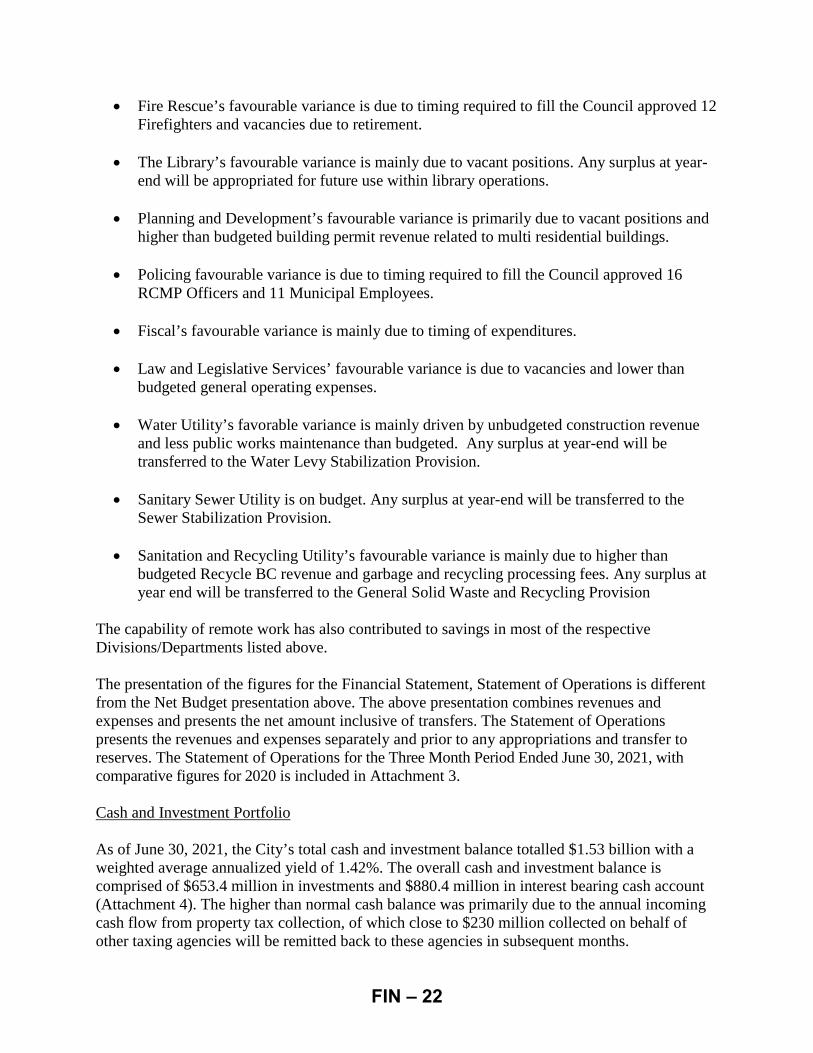
The City holds a significant proportion of its cash and investment balance in short-term and cashable products for liquidity and yield enhancement purposes. The City integrates Environmental, Social and Governance (ESG) considerations in its investment approach by using negative screening to exclude any direct investments in environmentally-sensitive or fossil-fuel industries. Through the use of negative screening, the City is able to demonstrate responsible investing while complying with the restrictive nature of the City’s permitted investments.
Table 2: Market Interest Rates (for analytical purposes only) June 30, 2021
(current quarter) March 31, 2021
(previous quarter) 2 Year Government of Canada Bonds 0.40% 0.22% 5 Year Government of Canada Bonds 0.97% 0.99% 10 Year Government of Canada Bonds 1.39% 1.55%
Source: Bank of Canada
In Canada, the third wave of the virus slowed growth in the second quarter. However, falling COVID-19 cases, progress on vaccinations and easing containment restrictions all point to a strong pickup in the second half of this year. At the latest interest rate announcement on July 14, 2021, the Bank of Canada (the Bank) kept the policy interest rate at 0.25%. The overnight interest rate has remained unchanged at the current 0.25% level since March 27, 2020. The Bank said it will keep the rate at near-zero until the economy is ready to handle an increase in rates, which it does not expect to happen until the second half of 2022.
The Bank also said that economic conditions have improved enough to allow it to reduce its weekly purchases of federal bonds to $2 billion from $3 billion. The purchases are a stimulus measure, known as quantitative easing, designed to help drive down rates charged on mortgages and business loans.
As economic prospects improve, there is still considerable excess capacity and the recovery continues to require extraordinary monetary policy support. The Bank will continue to hold the policy interest rate at the effective lower bound until economic slack is absorbed so that the 2% inflation target is sustainably achieved. The Bank will continue to provide the appropriate degree of monetary policy stimulus to support the recovery and achieve the inflation objective.
The City’s overall credit risk exposure remains low because the City continues to maintain a diversified portfolio of strong credit quality investments. Staff will continue to monitor the interest rate movement and will strategically reposition its cash and investments to ensure that, amongst its investment policy objectives, capital preservation and liquidity continue to be the most critical considerations for all municipal investment decisions.
Contract Awards
In accordance with Policy 3104, this report provides information on new contract awards and aggregate contract extensions greater than $75,000. During the second quarter, 41 contracts greater than $75,000 were awarded totalling over $16.9 million (Attachment 5).
FIN – 23
Financial Impact
None.
Conclusion
At the end of the second quarter, the City continued with the Restoring Richmond Plan while maintaining public health protection protocols to minimize the spread of COVID-19. Staff are closely monitoring the situation and making adjustments where applicable to mitigate the impacts.
Cindy Gilfillan, CPA, CMA Manager, Financial Reporting (604) 276-4077
Att. 1: Economic Indicators Att. 2: Financial and Key Indicators Att. 3: Unaudited Statement of Operations Att. 4: Cash and Investment Portfolio Att. 5: Contract Awards greater than $75,000
FIN – 24
Economic Indicators June 30, 2021
Macroeconomic Indicators & Forecast
1) Real GDP (% at YE) 2019 2020 Change 2021f 2022f Canada 1.6 (5.3) (431.3%) 6.3 4.5 United States 2.3 (3.5) (252.2%) 7.0 4.9 China 6.1 2.3 (62.3%) 8.1 5.7 World 2.9 (3.2) (210.3%) 6.0 4.9
2) Interest Rates (at YE) 2019 2020 Change 2021f 2022f Bank of Canada 1.75 0.25 (85.7%) 0.25 0.75 US FED 1.75 0.13 (92.6%) 0.13 0.63
3) Exchange Rate (at YE) 2019 2020 Change 2021f 2022f CAD per $1 USD 1.3 1.27 (2.3%) 1.25 1.27
Regional and Local Market Indicators
4) Unemployment (% at QE) Q2-2021 Q1-2021 Change Q2-2020 Change Canada 7.8 8.4 (7.1%) 12.5 (37.6%) BC 6.6 7.3 (9.6%) 13.3 (50.4%) Metro Vancouver 7.5 8.0 (6.3%) 13.1 (42.7%)
5) CPI (2002=100) (at QE) Q2-2021 Q1-2021 Change Q2-2020 Change Canada 141.4 139.6 1.3% 137.2 3.1% BC 135.8 134.9 0.7% 132.6 2.4% Metro Vancouver 138.1 137.4 1.9% 134.7 2.5%
6) Richmond Building Permits Q2-2021 Q2-2020 Change YTD-2021 YTD-2020 Change Residential – New Construction^ 73 64 14.1% 136 95 43.2% Residential – Alterations 100 47 112.8% 168 139 20.9% Residential Total 173 111 55.9% 304 234 29.9%
^ Number of units from new residential construction
177 878 (79.8%) 845 909 (7.0%)
Residential 173 111 55.9% 304 234 29.9% Commercial 82 70 17.1% 191 153 24.8% Industrial 48 49 (2.0%) 112 89 25.8% Building Permits Total 303 230 31.7% 607 476 27.5%
Construction Value ($ million) 117.0 392.0 (70.2%) 447.0 487.3 (8.3%)
7) Housing Starts (Units) Q2-2021 Q2-2020 Change YTD-2021 YTD-2020 Change Starts - Metro Vancouver 7,972 5,384 48.1% 15,294 9,764 56.6% Starts - Richmond 294 114 157.9% 1,077 186 479.0%
8) Richmond Residential SalesActivity Q2-2021 Q2-2020 Change YTD-2021 YTD-2020 Change Sales - Detached 532 152 250.0% 976 353 176.5% Sales - Townhouse 437 147 197.3% 800 342 133.9% Sales - Apartment 903 261 246.0% 1,585 663 139.1%
Sales - Total 1,872 560 234.3% 3,361 1,358 147.5%
FIN – 25
Economic Indicators June 30, 2021
Regional and Local Market Indicators (continued)
9)
Richmond Sales to Active Listings Ratio (% at QE) Q2-2021 Q2-2020 Change
Single Family Detached 34.7 13.8 151.4% Townhouse 65.3 20.1 224.9% Apartment 48.9 20.1 143.3% Total 45.4 17.8 155.1% 10) Average Days on Market Richmond Metro Vancouver Property Type Q2-2021 Q2-2020 Change Q2-2021 Q2-2020 Change Single Family Detached 24 57 (57.9%) 20 45 (55.6%)
Townhouse 23 60 (61.7%) 17 36 (52.8%)
Apartment 25 42 (40.5%) 21 32 (34.4%) 11) Home Price Index ($000 at QE) Richmond Metro Vancouver Property Type Q2-2021 Q2-2020 Change Q2-2021 Q2-2020 Change Single Family Detached 1,911 1,511 26.5% 1,801 1,464 23.0% Townhouse 924 791 16.8% 947 791 19.7% Apartment 718 651 10.3% 738 681 8.4%
12) Commercial Space (at QE) Richmond Metro Vancouver
Q2-2021 Q2-2020 Change Q2-2021 Q2-2020 Change
Office Vacancy (%) 10.9 7.7 41.6% 7.9 3.9 102.6%
Transit Oriented Office Vacancy (%) 4.8 3.7 29.7% N/A N/A N/A
Office Inventory (000 sf) 4,863 4,517 7.6% 62,658 59,775 4.8%
Industrial Vacancy (%) 0.5 1.4 (64.3%) 0.5 1.3 (61.5%)
Industrial Inventory (000 sf) 44,454 39,189 13.4% 214,895 216,044 (0.5%)
13) Richmond Business Growth Q2-2021 Q2-2020 Change YTD-2021 YTD-2020 Change
Total Valid Business Licences (at QE) 13,586 13,670 (0.6%) 13,586 13,670 (0.6%)
New Licences - Number Issued 305 246 24% 658 663 (0.8%)
New Licences - Employees 954 868 9.9% 2,628 2,820 (6.8%)
New Licences - Office Added (sf) 155,288 111,071 39.8% 336,781 231,713 45.3%
New Licences - Retail Added (sf) 48,894 41,790 17.0% 141,840 93,686 51.4%
New Licences - Industrial Added (sf) 123,806 166,691 (25.7%) 637,769 339,355 87.9%
Total Space Added (sf)/Avg. Change 327,988 319,552 2.6% 1,116,390 664,754 67.9%
FIN – 26
Economic Indicators June 30, 2021
Regional and Local Market Indicators (continued)
14) Goods & People Movement Q2-2021 Q2-2020 Change YTD-2021 YTD-2020 Change
YVR Air Cargo (tonnes)** 20,015 11,920 67.9% 81,020 74,551 8.7%
PMV Container Movement (TEUs) 1,030,085 829,624 24.2% 1,963,047 1,564,514 25.5%
YVR Passengers (million)** 0.19 0.07 171.4% 0.82 4.97 (83.5%)
Richmond Hotel Revenue ($ million)*** 24.6 0.3 8100.0% 54.8 14.7 272.8%
Notes:
a) QE indicates quarter end; YE indicates year end b) f - forecast to year-end c) * - Figures have been updated to reflect changes in source data. d) ** YVR data for Q2 includes April 2021 figures only. e) ***Hotel Room Revenue for Q2 includes April and May 2021 data only
List of Sources:
1) International Monetary Fund, World Economic Outlook (July 2021) 2) & 3) US Federal Reserve, Bank of Canada and Royal Bank Economic Research Forecast (July 2021) 4) & 5) Statistics Canada 6) City of Richmond Building Permits 7) Canada Mortgage and Housing Corporation 8) to 11) Real Estate Board of Greater Vancouver 12) Cushman & Wakefield Office and Industrial Market Beat Reports 13) City of Richmond Business Licences
14)
Port of Vancouver Monthly Cargo Statistics YVR monthly statistics City of Richmond Additional Hotel Room Tax Ledger, Destination BC
FIN – 27
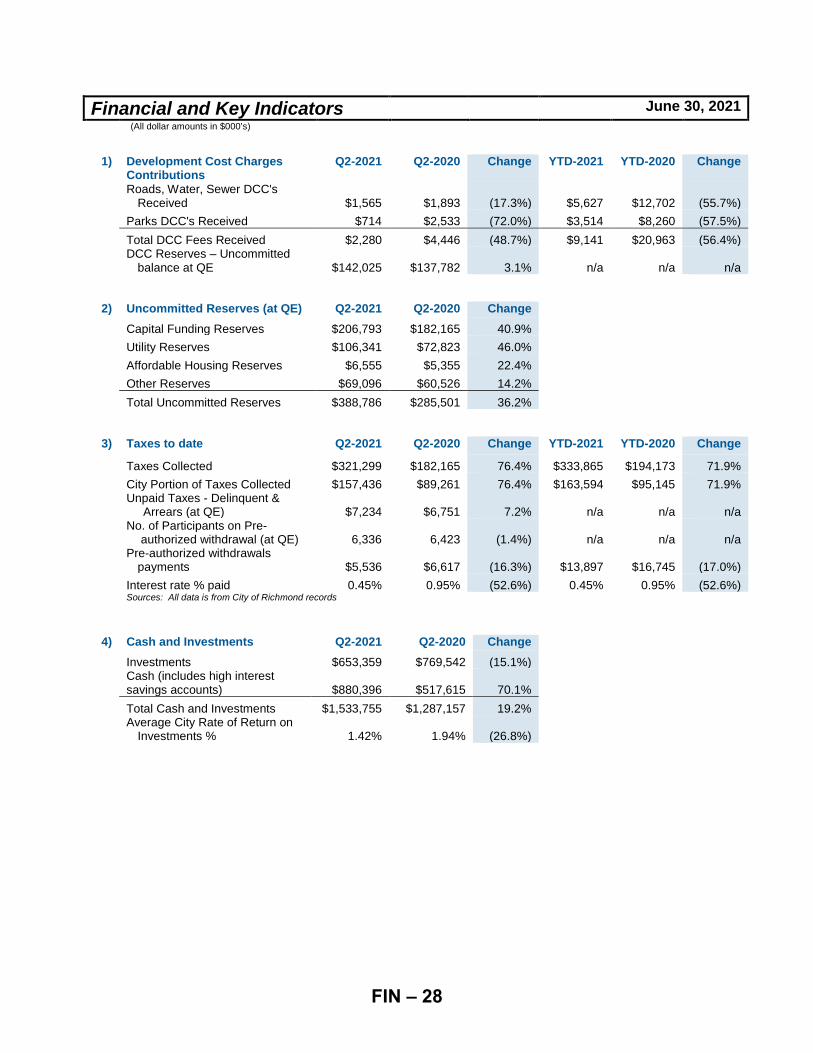
Financial and Key Indicators June 30, 2021 (All dollar amounts in $000’s)
1) Development Cost Charges Contributions
Q2-2021 Q2-2020 Change YTD-2021 YTD-2020 Change
Roads, Water, Sewer DCC's
Received $1,565 $1,893 (17.3%) $5,627 $12,702 (55.7%) Parks DCC's Received $714 $2,533 (72.0%) $3,514 $8,260 (57.5%)
Total DCC Fees Received $2,280 $4,446 (48.7%) $9,141 $20,963 (56.4%) DCC Reserves – Uncommitted
balance at QE $142,025 $137,782 3.1% n/a n/a n/a
2) Uncommitted Reserves (at QE) Q2-2021 Q2-2020 Change Capital Funding Reserves $206,793 $182,165 40.9% Utility Reserves $106,341 $72,823 46.0% Affordable Housing Reserves $6,555 $5,355 22.4% Other Reserves $69,096 $60,526 14.2% Total Uncommitted Reserves $388,786 $285,501 36.2%
3) Taxes to date Q2-2021 Q2-2020 Change YTD-2021 YTD-2020 Change Taxes Collected $321,299 $182,165 76.4% $333,865 $194,173 71.9% City Portion of Taxes Collected $157,436 $89,261 76.4% $163,594 $95,145 71.9% Unpaid Taxes - Delinquent &
Arrears (at QE) $7,234 $6,751 7.2% n/a n/a n/a No. of Participants on Pre-
authorized withdrawal (at QE) 6,336 6,423 (1.4%) n/a n/a n/a Pre-authorized withdrawals
payments $5,536 $6,617 (16.3%) $13,897 $16,745 (17.0%) Interest rate % paid 0.45% 0.95% (52.6%) 0.45% 0.95% (52.6%) Sources: All data is from City of Richmond records
4) Cash and Investments Q2-2021 Q2-2020 Change Investments $653,359 $769,542 (15.1%) Cash (includes high interest
savings accounts) $880,396 $517,615 70.1% Total Cash and Investments $1,533,755 $1,287,157 19.2% Average City Rate of Return on
Investments % 1.42% 1.94% (26.8%)
FIN – 28
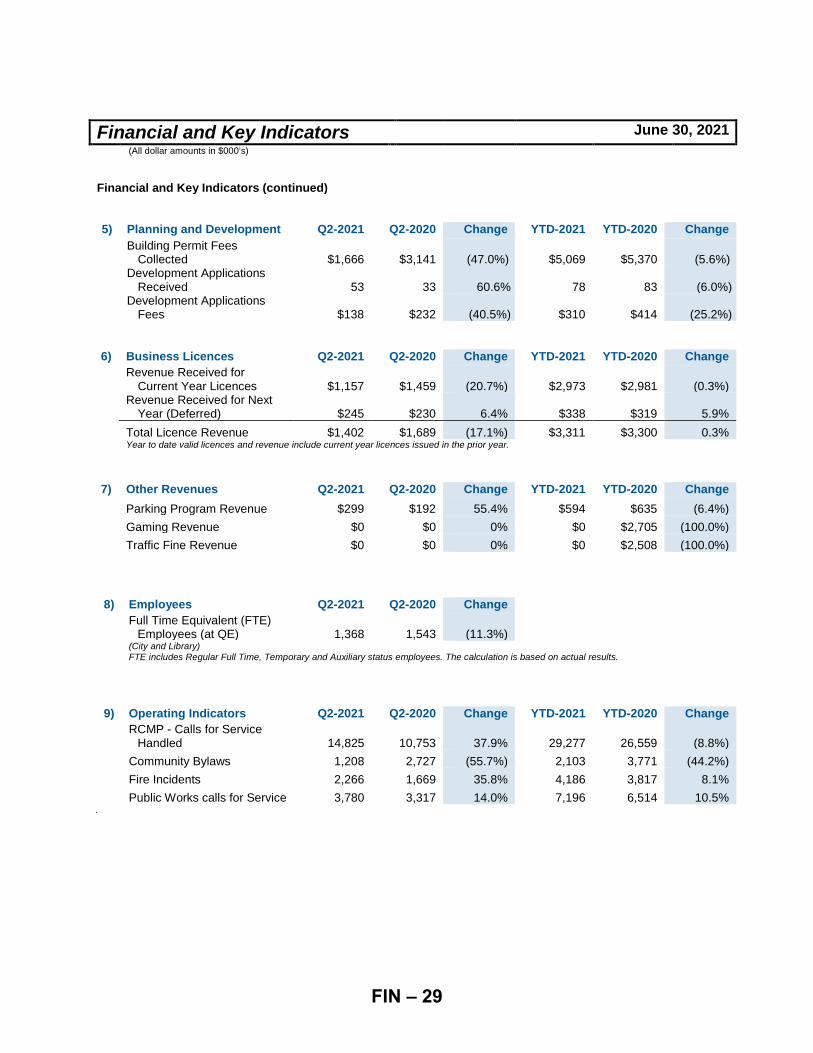
Financial and Key Indicators June 30, 2021
(All dollar amounts in $000’s) Financial and Key Indicators (continued)
5) Planning and Development Q2-2021 Q2-2020 Change YTD-2021 YTD-2020 Change Building Permit Fees
Collected $1,666 $3,141 (47.0%) $5,069 $5,370 (5.6%) Development Applications
Received 53 33 60.6% 78 83 (6.0%) Development Applications
Fees $138 $232 (40.5%) $310 $414 (25.2%)
6) Business Licences Q2-2021 Q2-2020 Change YTD-2021 YTD-2020 Change Revenue Received for
Current Year Licences $1,157 $1,459 (20.7%) $2,973 $2,981 (0.3%) Revenue Received for Next
Year (Deferred) $245 $230 6.4% $338 $319 5.9% Total Licence Revenue $1,402 $1,689 (17.1%) $3,311 $3,300 0.3%
Year to date valid licences and revenue include current year licences issued in the prior year.
7) Other Revenues Q2-2021 Q2-2020 Change YTD-2021 YTD-2020 Change Parking Program Revenue $299 $192 55.4% $594 $635 (6.4%) Gaming Revenue $0 $0 0% $0 $2,705 (100.0%) Traffic Fine Revenue $0 $0 0% $0 $2,508 (100.0%)
8) Employees Q2-2021 Q2-2020 Change Full Time Equivalent (FTE)
Employees (at QE) 1,368 1,543 (11.3%)
(City and Library) FTE includes Regular Full Time, Temporary and Auxiliary status employees. The calculation is based on actual results.
9) Operating Indicators Q2-2021 Q2-2020 Change YTD-2021 YTD-2020 Change RCMP - Calls for Service
Handled 14,825 10,753 37.9% 29,277 26,559 (8.8%) Community Bylaws 1,208 2,727 (55.7%) 2,103 3,771 (44.2%) Fire Incidents 2,266 1,669 35.8% 4,186 3,817 8.1% Public Works calls for Service 3,780 3,317 14.0% 7,196 6,514 10.5%
.
FIN – 29
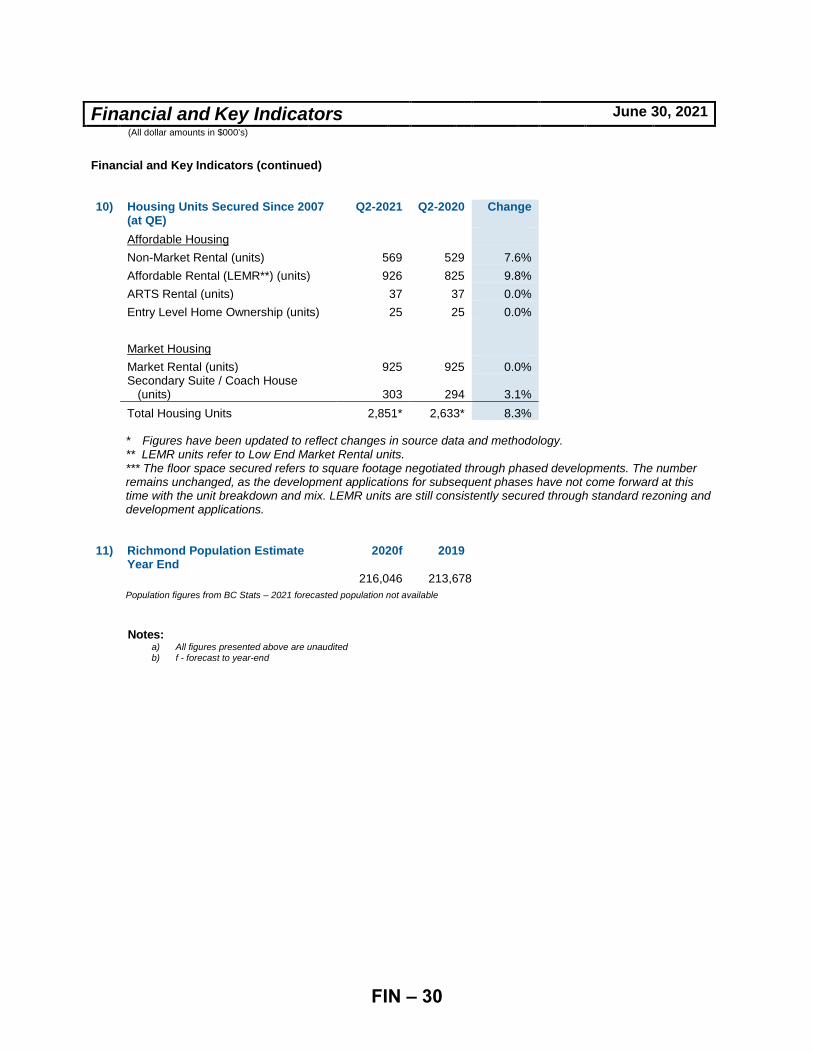
Financial and Key Indicators June 30, 2021 (All dollar amounts in $000’s)
Financial and Key Indicators (continued)
10) Housing Units Secured Since 2007 (at QE)
Q2-2021 Q2-2020 Change
Affordable Housing Non-Market Rental (units) 569 529 7.6% Affordable Rental (LEMR**) (units) 926 825 9.8% ARTS Rental (units) 37 37 0.0% Entry Level Home Ownership (units) 25 25 0.0% Market Housing Market Rental (units) 925 925 0.0% Secondary Suite / Coach House
(units) 303 294 3.1% Total Housing Units 2,851* 2,633* 8.3%
* Figures have been updated to reflect changes in source data and methodology. ** LEMR units refer to Low End Market Rental units. *** The floor space secured refers to square footage negotiated through phased developments. The number remains unchanged, as the development applications for subsequent phases have not come forward at this time with the unit breakdown and mix. LEMR units are still consistently secured through standard rezoning and development applications.
11) Richmond Population Estimate
Year End 2020f 2019
216,046 213,678 Population figures from BC Stats – 2021 forecasted population not available
Notes: a) All figures presented above are unaudited b) f - forecast to year-end
FIN – 30
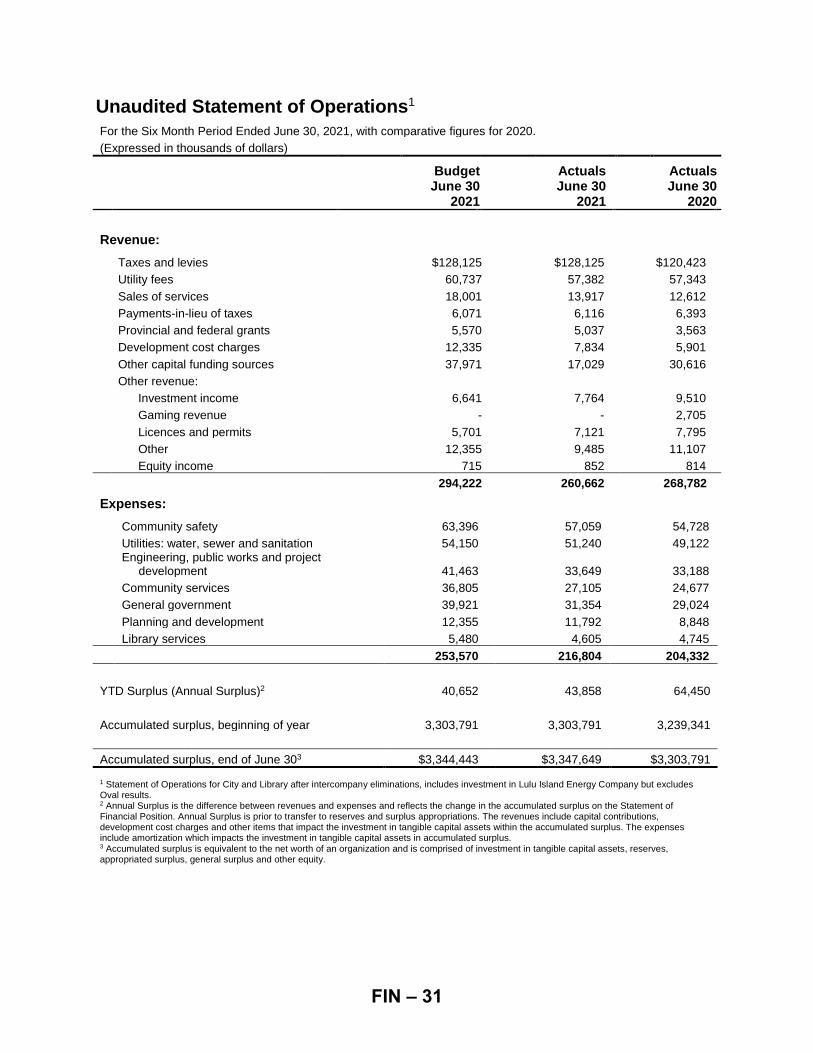
Unaudited Statement of Operations1 For the Six Month Period Ended June 30, 2021, with comparative figures for 2020. (Expressed in thousands of dollars)
Budget June 30
Actuals June 30
Actuals June 30
2021 2021 2020
Revenue:
Taxes and levies $128,125 $128,125 $120,423
Utility fees 60,737 57,382 57,343
Sales of services 18,001 13,917 12,612
Payments-in-lieu of taxes 6,071 6,116 6,393
Provincial and federal grants 5,570 5,037 3,563
Development cost charges 12,335 7,834 5,901
Other capital funding sources 37,971 17,029 30,616
Other revenue:
Investment income 6,641 7,764 9,510
Gaming revenue - - 2,705
Licences and permits 5,701 7,121 7,795
Other 12,355 9,485 11,107 Equity income 715 852 814
294,222 260,662 268,782
Expenses:
Community safety 63,396 57,059 54,728
Utilities: water, sewer and sanitation 54,150 51,240 49,122
Engineering, public works and project development 41,463 33,649 33,188
Community services 36,805 27,105 24,677
General government 39,921 31,354 29,024
Planning and development 12,355 11,792 8,848
Library services 5,480 4,605 4,745
253,570 216,804 204,332
YTD Surplus (Annual Surplus)2 40,652 43,858 64,450 Accumulated surplus, beginning of year 3,303,791 3,303,791 3,239,341 Accumulated surplus, end of June 303 $3,344,443 $3,347,649 $3,303,791
1 Statement of Operations for City and Library after intercompany eliminations, includes investment in Lulu Island Energy Company but excludes Oval results. 2 Annual Surplus is the difference between revenues and expenses and reflects the change in the accumulated surplus on the Statement of Financial Position. Annual Surplus is prior to transfer to reserves and surplus appropriations. The revenues include capital contributions, development cost charges and other items that impact the investment in tangible capital assets within the accumulated surplus. The expenses include amortization which impacts the investment in tangible capital assets in accumulated surplus. 3 Accumulated surplus is equivalent to the net worth of an organization and is comprised of investment in tangible capital assets, reserves, appropriated surplus, general surplus and other equity.
FIN – 31
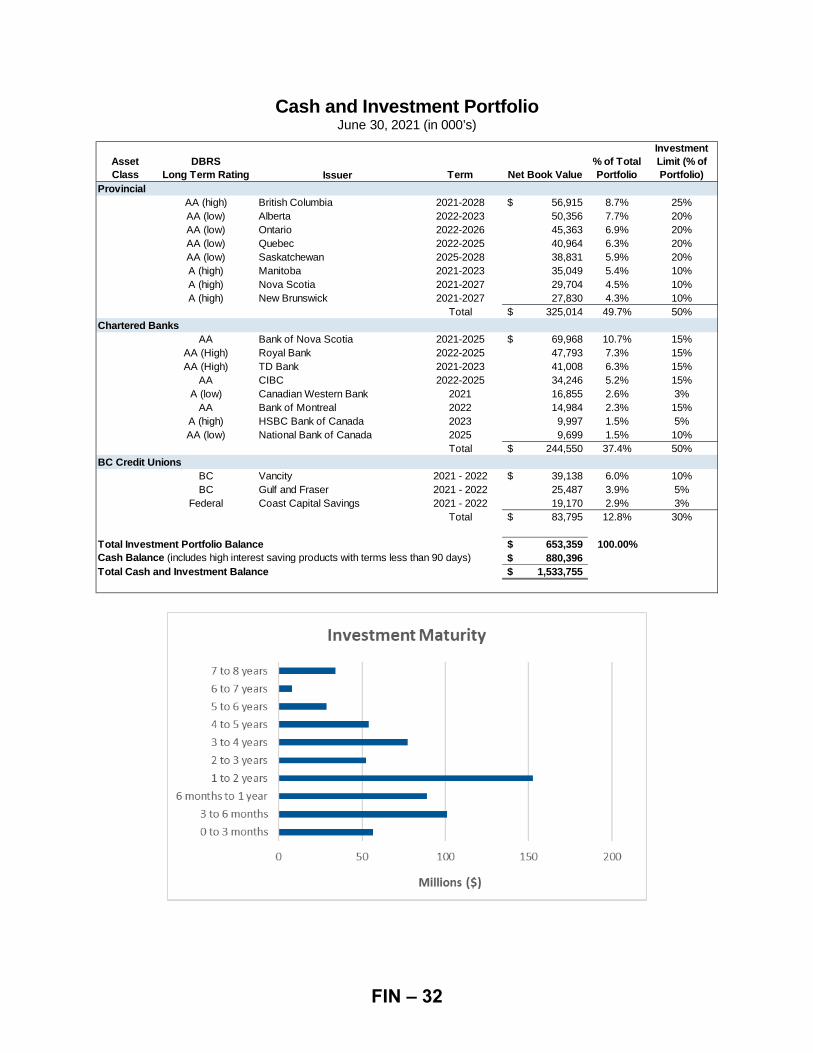
Cash and Investment Portfolio June 30, 2021 (in 000’s)
Asset Class
DBRS Long Term Rating Term Net Book Value
% of Total Portfolio
Investment Limit (% of Portfolio)
ProvincialAA (high) British Columbia 2021-2028 56,915$ 8.7% 25%AA (low) Alberta 2022-2023 50,356 7.7% 20%AA (low) Ontario 2022-2026 45,363 6.9% 20%AA (low) Quebec 2022-2025 40,964 6.3% 20%AA (low) Saskatchewan 2025-2028 38,831 5.9% 20%A (high) Manitoba 2021-2023 35,049 5.4% 10%A (high) Nova Scotia 2021-2027 29,704 4.5% 10%A (high) New Brunswick 2021-2027 27,830 4.3% 10%
Total 325,014$ 49.7% 50%Chartered Banks
AA Bank of Nova Scotia 2021-2025 69,968$ 10.7% 15%AA (High) Royal Bank 2022-2025 47,793 7.3% 15%AA (High) TD Bank 2021-2023 41,008 6.3% 15%
AA CIBC 2022-2025 34,246 5.2% 15%A (low) Canadian Western Bank 2021 16,855 2.6% 3%
AA Bank of Montreal 2022 14,984 2.3% 15%A (high) HSBC Bank of Canada 2023 9,997 1.5% 5%AA (low) National Bank of Canada 2025 9,699 1.5% 10%
Total 244,550$ 37.4% 50%BC Credit Unions
BC Vancity 2021 - 2022 39,138$ 6.0% 10%BC Gulf and Fraser 2021 - 2022 25,487 3.9% 5%
Federal Coast Capital Savings 2021 - 2022 19,170 2.9% 3%Total 83,795$ 12.8% 30%
Total Investment Portfolio Balance 653,359$ 100.00%Cash Balance (includes high interest saving products with terms less than 90 days) 880,396$ Total Cash and Investment Balance 1,533,755$
Issuer
FIN – 32
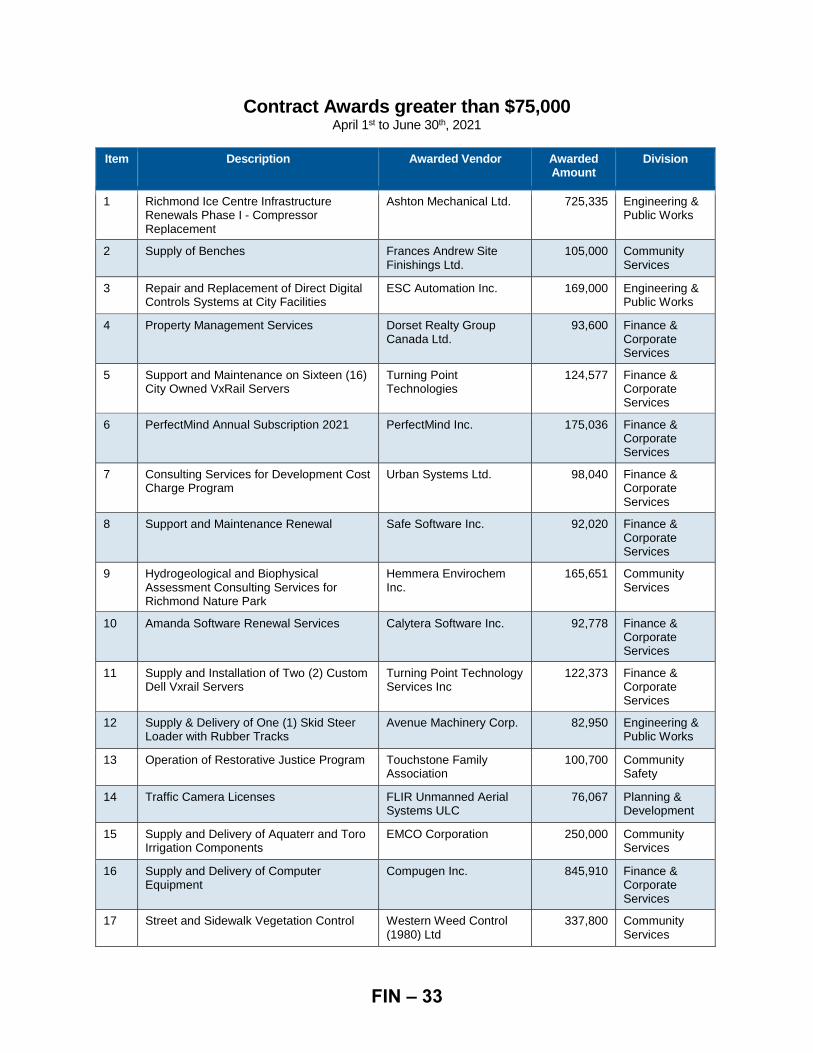
Contract Awards greater than $75,000 April 1st to June 30th, 2021
Item Description Awarded Vendor Awarded
Amount Division
1 Richmond Ice Centre Infrastructure Renewals Phase I - Compressor Replacement
Ashton Mechanical Ltd. 725,335 Engineering & Public Works
2 Supply of Benches Frances Andrew Site Finishings Ltd.
105,000 Community Services
3 Repair and Replacement of Direct Digital Controls Systems at City Facilities
ESC Automation Inc. 169,000 Engineering & Public Works
4 Property Management Services Dorset Realty Group Canada Ltd.
93,600 Finance & Corporate Services
5 Support and Maintenance on Sixteen (16) City Owned VxRail Servers
Turning Point Technologies
124,577 Finance & Corporate Services
6 PerfectMind Annual Subscription 2021 PerfectMind Inc. 175,036 Finance & Corporate Services
7 Consulting Services for Development Cost Charge Program
Urban Systems Ltd. 98,040 Finance & Corporate Services
8 Support and Maintenance Renewal Safe Software Inc. 92,020 Finance & Corporate Services
9 Hydrogeological and Biophysical Assessment Consulting Services for Richmond Nature Park
Hemmera Envirochem Inc.
165,651 Community Services
10 Amanda Software Renewal Services Calytera Software Inc. 92,778 Finance & Corporate Services
11 Supply and Installation of Two (2) Custom Dell Vxrail Servers
Turning Point Technology Services Inc
122,373 Finance & Corporate Services
12
Supply & Delivery of One (1) Skid Steer Loader with Rubber Tracks
Avenue Machinery Corp. 82,950 Engineering & Public Works
13 Operation of Restorative Justice Program Touchstone Family Association
100,700 Community Safety
14 Traffic Camera Licenses FLIR Unmanned Aerial Systems ULC
76,067 Planning & Development
15 Supply and Delivery of Aquaterr and Toro Irrigation Components
EMCO Corporation 250,000 Community Services
16 Supply and Delivery of Computer Equipment
Compugen Inc. 845,910 Finance & Corporate Services
17 Street and Sidewalk Vegetation Control Western Weed Control (1980) Ltd
337,800 Community Services
FIN – 33
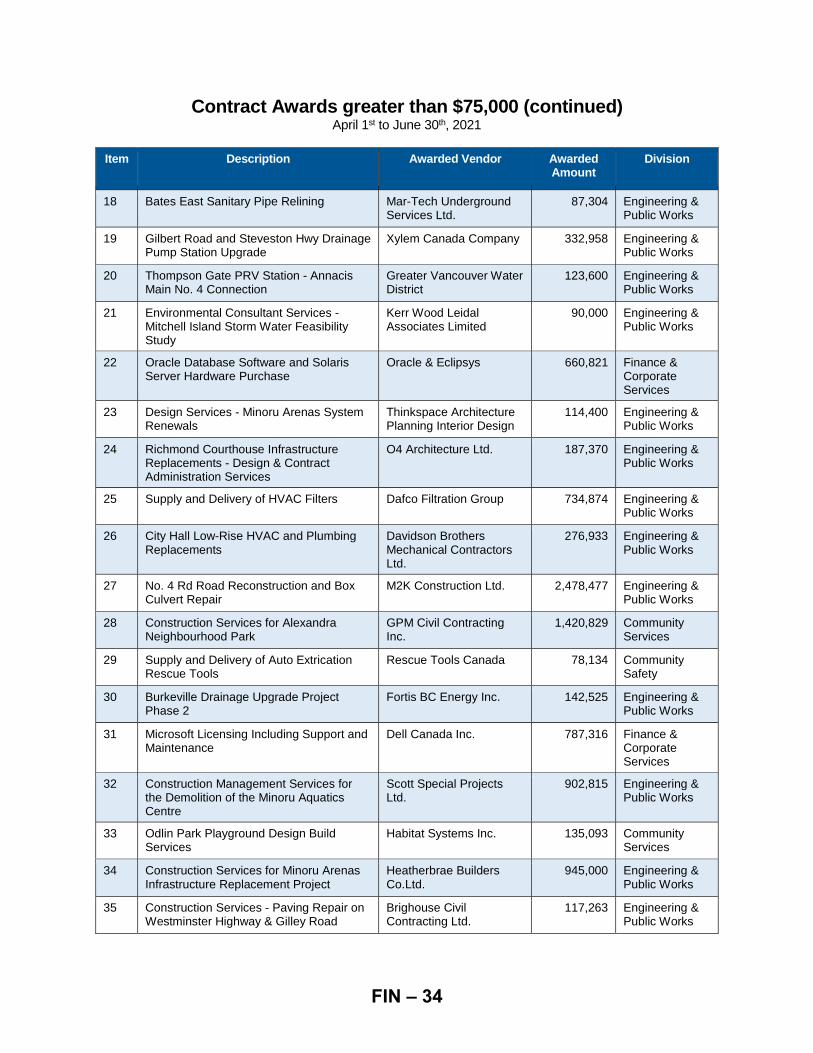
Contract Awards greater than $75,000 (continued) April 1st to June 30th, 2021
Item Description Awarded Vendor Awarded
Amount Division
18 Bates East Sanitary Pipe Relining Mar-Tech Underground Services Ltd.
87,304 Engineering & Public Works
19 Gilbert Road and Steveston Hwy Drainage Pump Station Upgrade
Xylem Canada Company 332,958 Engineering & Public Works
20 Thompson Gate PRV Station - Annacis Main No. 4 Connection
Greater Vancouver Water District
123,600 Engineering & Public Works
21 Environmental Consultant Services - Mitchell Island Storm Water Feasibility Study
Kerr Wood Leidal Associates Limited
90,000 Engineering & Public Works
22 Oracle Database Software and Solaris Server Hardware Purchase
Oracle & Eclipsys 660,821 Finance & Corporate Services
23 Design Services - Minoru Arenas System Renewals
Thinkspace Architecture Planning Interior Design
114,400 Engineering & Public Works
24 Richmond Courthouse Infrastructure Replacements - Design & Contract Administration Services
O4 Architecture Ltd. 187,370 Engineering & Public Works
25 Supply and Delivery of HVAC Filters Dafco Filtration Group 734,874 Engineering & Public Works
26 City Hall Low-Rise HVAC and Plumbing Replacements
Davidson Brothers Mechanical Contractors Ltd.
276,933 Engineering & Public Works
27
No. 4 Rd Road Reconstruction and Box Culvert Repair
M2K Construction Ltd. 2,478,477 Engineering & Public Works
28 Construction Services for Alexandra Neighbourhood Park
GPM Civil Contracting Inc.
1,420,829 Community Services
29 Supply and Delivery of Auto Extrication Rescue Tools
Rescue Tools Canada 78,134 Community Safety
30 Burkeville Drainage Upgrade Project Phase 2
Fortis BC Energy Inc. 142,525 Engineering & Public Works
31 Microsoft Licensing Including Support and Maintenance
Dell Canada Inc. 787,316 Finance & Corporate Services
32 Construction Management Services for the Demolition of the Minoru Aquatics Centre
Scott Special Projects Ltd.
902,815 Engineering & Public Works
33 Odlin Park Playground Design Build Services
Habitat Systems Inc. 135,093 Community Services
34 Construction Services for Minoru Arenas Infrastructure Replacement Project
Heatherbrae Builders Co.Ltd.
945,000 Engineering & Public Works
35 Construction Services - Paving Repair on Westminster Highway & Gilley Road
Brighouse Civil Contracting Ltd.
117,263 Engineering & Public Works
FIN – 34
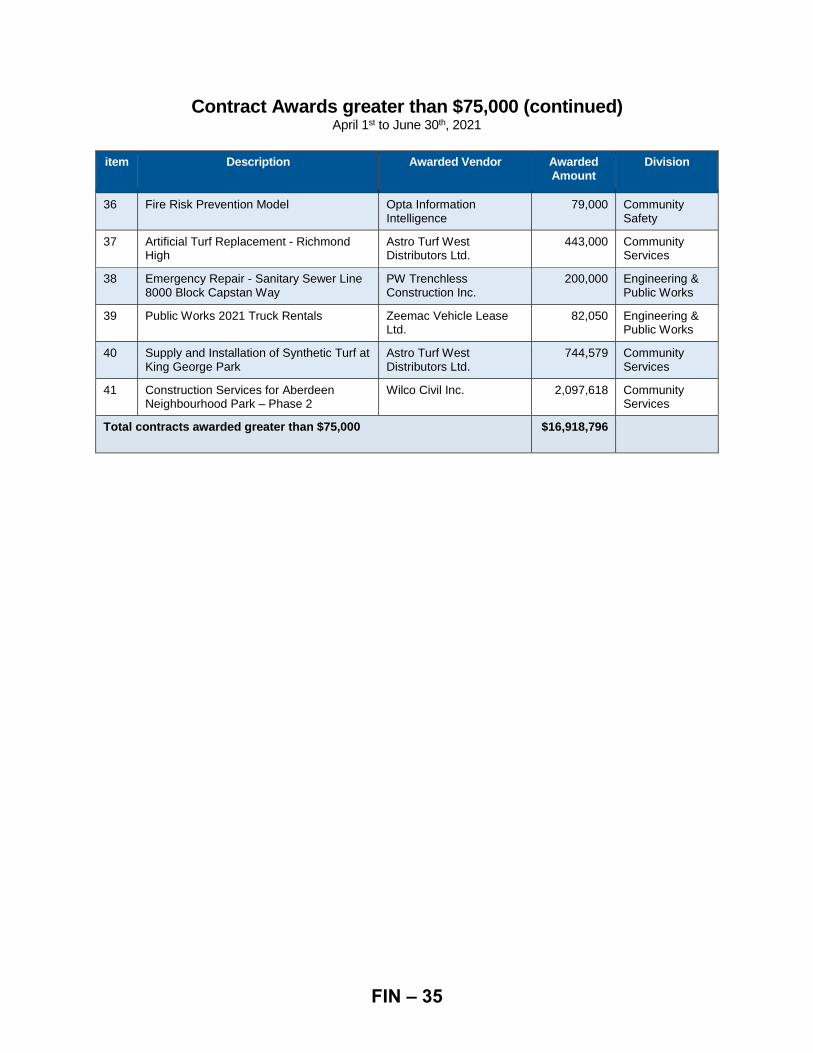
Contract Awards greater than $75,000 (continued) April 1st to June 30th, 2021
item
Description Awarded Vendor Awarded
Amount Division
36
Fire Risk Prevention Model Opta Information Intelligence
79,000 Community Safety
37 Artificial Turf Replacement - Richmond High
Astro Turf West Distributors Ltd.
443,000 Community Services
38 Emergency Repair - Sanitary Sewer Line 8000 Block Capstan Way
PW Trenchless Construction Inc.
200,000 Engineering & Public Works
39 Public Works 2021 Truck Rentals Zeemac Vehicle Lease Ltd.
82,050 Engineering & Public Works
40 Supply and Installation of Synthetic Turf at King George Park
Astro Turf West Distributors Ltd.
744,579 Community Services
41 Construction Services for Aberdeen Neighbourhood Park – Phase 2
Wilco Civil Inc. 2,097,618 Community Services
Total contracts awarded greater than $75,000 $16,918,796
FIN – 35
To:
From:
City of Richmond
Finance Committee
Ivy Wong, CPA, CMA Acting Director, Finance
Report to Committee
Date: August 4, 2021
File: 03-0975-01/2021-Vol 01
Re: Active Capital Projects Information - 2nd Quarter June 30, 2021
Staff Recommendation
That the staff report titled, "Active Capital Projects Information - 2nd Quarter June 30, 2021 ", dated August 4, 2021 from the Acting Director, Finance be received for information .
Ivy Wong, CPA, CMA Acting Director, Finance ( 604-27 6-4046)
Att. 2
REPORT CONCURRENCE
ROUTED To:
Arts, Culture & Heritage Community Social Development Engineering Facility Services & Project Development Fleet Information Technology Parks Services RCMP Real Estate Services Recreation & Sport Roads & Construction Sewerage & Drainage Sustainability & District Energy Transportation
SENIOR STAFF REPORT REVIEW
67 132 19
CONCURRENCE CONCURRENCE OF GENERAL MANAGER
Acting GM, F&CS
FIN – 36
- 2 -
6713219
Staff Report
Origin
Active Capital Project Information for the 2nd Quarter (ended June 30, 2021) is provided to the Finance Committee for information purposes. This report includes the approved 2021 Capital Budget and other previously approved capital projects.
This report supports Council’s Strategic Plan 2018-2022 Strategy #5 Sound Financial Management:
Accountable, transparent, and responsible financial management that supports the needs of the community into the future.
5.2 Clear accountability through transparent budgeting practices and effective public communication.
Analysis
SUMMARY OF ACTIVE CAPITAL PROJECTS
Active capital projects represent construction, non-construction and acquisition (e.g. equipment and land) capital projects previously approved by Council. A capital project is considered active for the purpose of this report if the project falls within one of the following project completion stages:
Planning and Design – includes projects that were approved in the 2021 budget and other previously approved projects that are undergoing design specifications, design approvals, or public consultation.
Contract Award – this includes preparing and issuing a request for proposal, evaluating proposals received, and finalizing contract award agreements.
Construction – includes build out of the approved design either by City workforce or under executed agreements.
Functional Completion – certain projects are completed in phases that allow for portions of the project to be functionally complete while the next phase is initiated.
Project Completion – may include fully functional assets that are in their final inspection and acceptance stage, assets that may still require minor deficiencies to be addressed, as-built drawings to be received, collection of external funding and fulfillment of audit requirements, where applicable.
Capital projects also include amounts set aside for land acquisition, public art, child care and affordable housing which are dependent upon external factors such as market conditions, availability and external partners. Therefore, these projects are presented to Council prior to final approval.
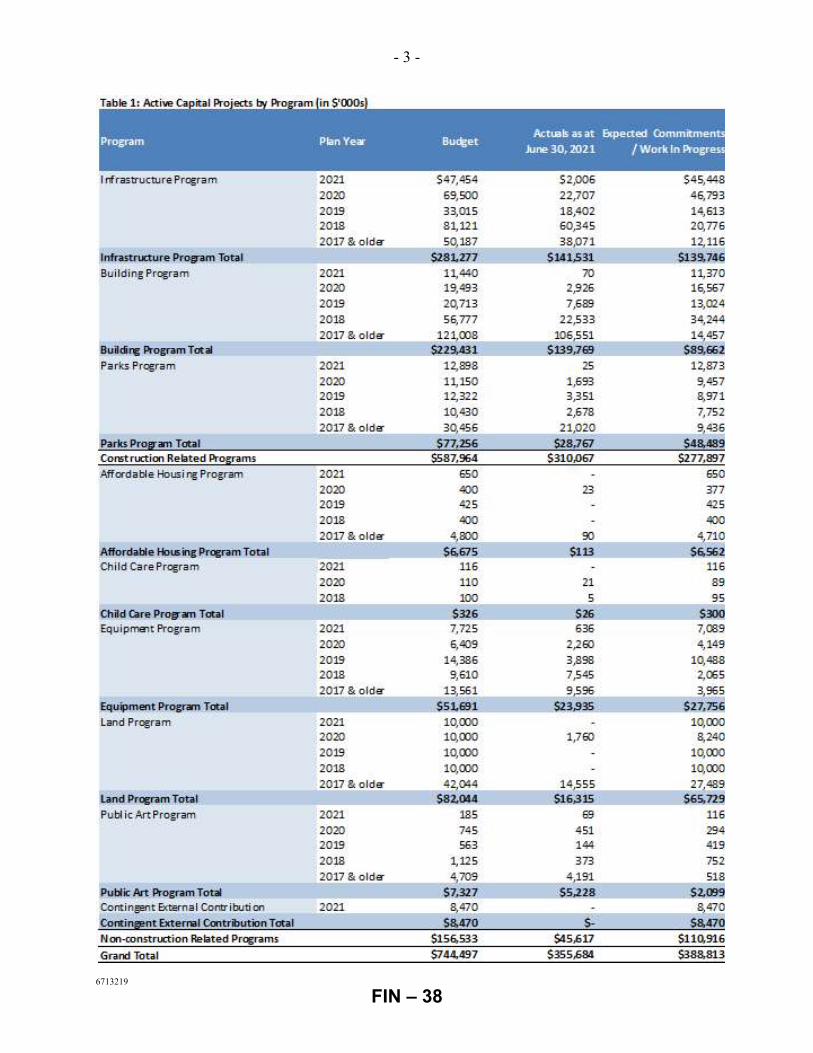
The approved 2021 Capital Budget of $100.3M (excluding internal transfers and debt repayments) and other previously approved active capital projects are summarized by program in Table 1. The current balance committed to active capital projects is $388.8M.
FIN – 37
- 3 -
6713219
FIN – 38
- 4 -
6713219
An estimate of $10M was included in the 2021 Capital Plan (2021-2025 Financial Plan Bylaw) for external grants or contributions that may be received throughout the year. Funding is transferred to the approved applicable projects only when funding is confirmed. As of June 30, 2021, $1,530,000 was received and the budget for Contingent External Contribution was adjusted to $8,470,000.
The City has awarded multiple contracts to successful bidders following procurement processes in order to support the capital construction projects described in this report. Termination provisions within each contract will need to be reviewed on a case-by-case basis by the City’s Law Department to assess the financial and legal implications that would result if the City considers the possible cancellation, or delay of a project.
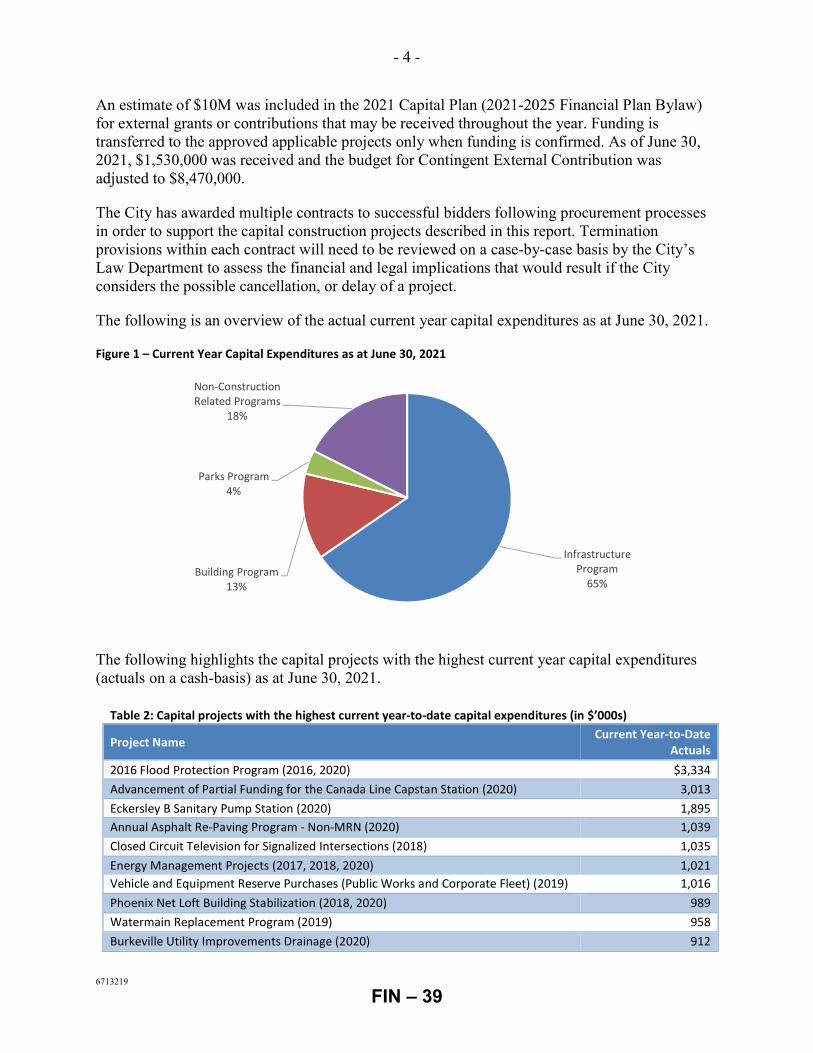
The following is an overview of the actual current year capital expenditures as at June 30, 2021.
Figure 1 – Current Year Capital Expenditures as at June 30, 2021
The following highlights the capital projects with the highest current year capital expenditures (actuals on a cash-basis) as at June 30, 2021.
Table 2: Capital projects with the highest current year-to-date capital expenditures (in $’000s)
Project Name Current Year-to-Date
Actuals 2016 Flood Protection Program (2016, 2020) $3,334 Advancement of Partial Funding for the Canada Line Capstan Station (2020) 3,013 Eckersley B Sanitary Pump Station (2020) 1,895 Annual Asphalt Re-Paving Program - Non-MRN (2020) 1,039 Closed Circuit Television for Signalized Intersections (2018) 1,035 Energy Management Projects (2017, 2018, 2020) 1,021 Vehicle and Equipment Reserve Purchases (Public Works and Corporate Fleet) (2019) 1,016 Phoenix Net Loft Building Stabilization (2018, 2020) 989 Watermain Replacement Program (2019) 958 Burkeville Utility Improvements Drainage (2020) 912
Infrastructure Program
65%Building Program
13%
Parks Program4%
Non-Construction Related Programs
18%
FIN – 39
- 5 -
6713219
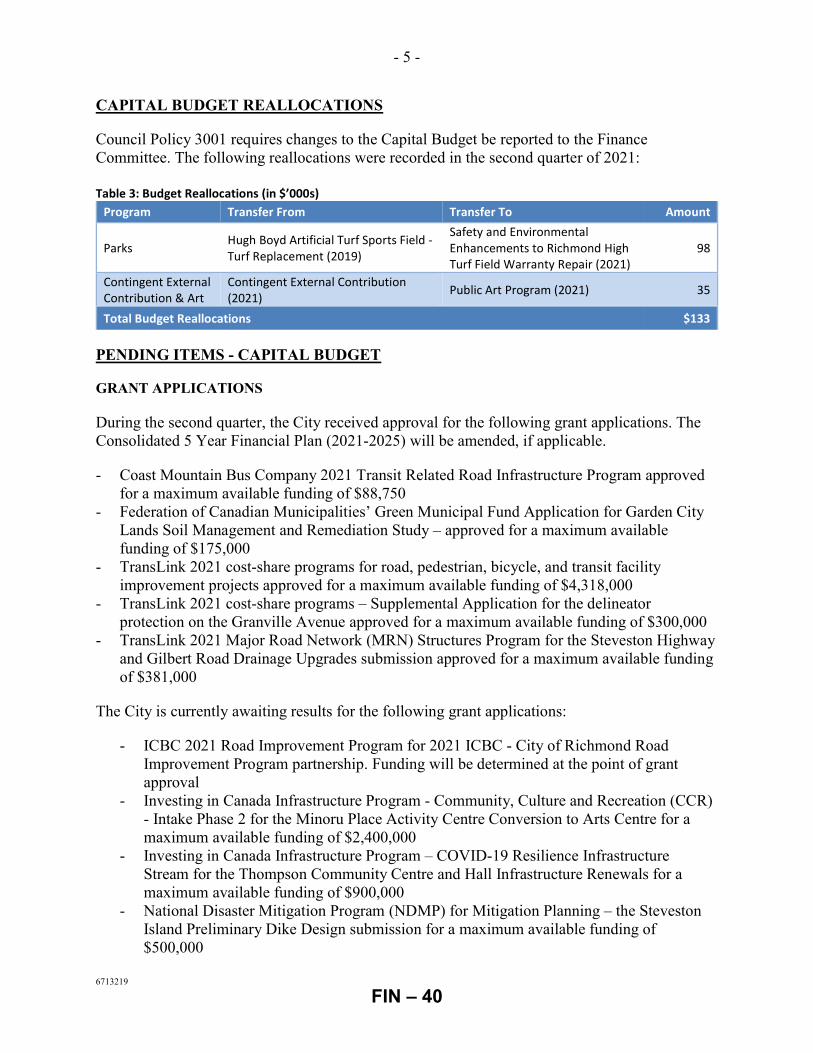
CAPITAL BUDGET REALLOCATIONS
Council Policy 3001 requires changes to the Capital Budget be reported to the Finance Committee. The following reallocations were recorded in the second quarter of 2021: Table 3: Budget Reallocations (in $’000s)
Program Transfer From Transfer To Amount
Parks Hugh Boyd Artificial Turf Sports Field - Turf Replacement (2019)
Safety and Environmental Enhancements to Richmond High Turf Field Warranty Repair (2021)
98
Contingent External Contribution & Art
Contingent External Contribution (2021)
Public Art Program (2021) 35
Total Budget Reallocations $133 PENDING ITEMS - CAPITAL BUDGET
GRANT APPLICATIONS During the second quarter, the City received approval for the following grant applications. The Consolidated 5 Year Financial Plan (2021-2025) will be amended, if applicable.
- Coast Mountain Bus Company 2021 Transit Related Road Infrastructure Program approved for a maximum available funding of $88,750
- Federation of Canadian Municipalities’ Green Municipal Fund Application for Garden City Lands Soil Management and Remediation Study – approved for a maximum available funding of $175,000
- TransLink 2021 cost-share programs for road, pedestrian, bicycle, and transit facility improvement projects approved for a maximum available funding of $4,318,000
- TransLink 2021 cost-share programs – Supplemental Application for the delineator protection on the Granville Avenue approved for a maximum available funding of $300,000
- TransLink 2021 Major Road Network (MRN) Structures Program for the Steveston Highway and Gilbert Road Drainage Upgrades submission approved for a maximum available funding of $381,000
The City is currently awaiting results for the following grant applications:
- ICBC 2021 Road Improvement Program for 2021 ICBC - City of Richmond Road Improvement Program partnership. Funding will be determined at the point of grant approval
- Investing in Canada Infrastructure Program - Community, Culture and Recreation (CCR) - Intake Phase 2 for the Minoru Place Activity Centre Conversion to Arts Centre for a maximum available funding of $2,400,000
- Investing in Canada Infrastructure Program – COVID-19 Resilience Infrastructure Stream for the Thompson Community Centre and Hall Infrastructure Renewals for a maximum available funding of $900,000
- National Disaster Mitigation Program (NDMP) for Mitigation Planning – the Steveston Island Preliminary Dike Design submission for a maximum available funding of $500,000
FIN – 40
- 6 -
6713219
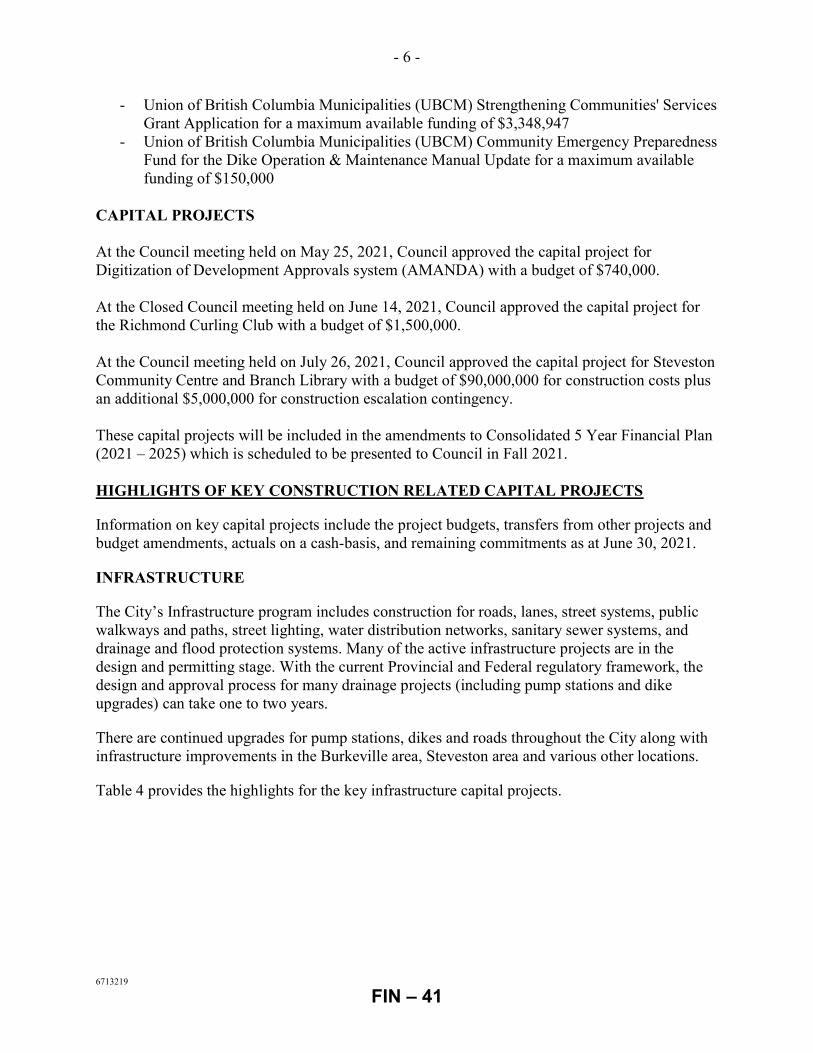
- Union of British Columbia Municipalities (UBCM) Strengthening Communities' Services Grant Application for a maximum available funding of $3,348,947
- Union of British Columbia Municipalities (UBCM) Community Emergency Preparedness Fund for the Dike Operation & Maintenance Manual Update for a maximum available funding of $150,000
CAPITAL PROJECTS At the Council meeting held on May 25, 2021, Council approved the capital project for Digitization of Development Approvals system (AMANDA) with a budget of $740,000. At the Closed Council meeting held on June 14, 2021, Council approved the capital project for the Richmond Curling Club with a budget of $1,500,000. At the Council meeting held on July 26, 2021, Council approved the capital project for Steveston Community Centre and Branch Library with a budget of $90,000,000 for construction costs plus an additional $5,000,000 for construction escalation contingency. These capital projects will be included in the amendments to Consolidated 5 Year Financial Plan (2021 – 2025) which is scheduled to be presented to Council in Fall 2021. HIGHLIGHTS OF KEY CONSTRUCTION RELATED CAPITAL PROJECTS
Information on key capital projects include the project budgets, transfers from other projects and budget amendments, actuals on a cash-basis, and remaining commitments as at June 30, 2021.
INFRASTRUCTURE
The City’s Infrastructure program includes construction for roads, lanes, street systems, public walkways and paths, street lighting, water distribution networks, sanitary sewer systems, and drainage and flood protection systems. Many of the active infrastructure projects are in the design and permitting stage. With the current Provincial and Federal regulatory framework, the design and approval process for many drainage projects (including pump stations and dike upgrades) can take one to two years.
There are continued upgrades for pump stations, dikes and roads throughout the City along with infrastructure improvements in the Burkeville area, Steveston area and various other locations.
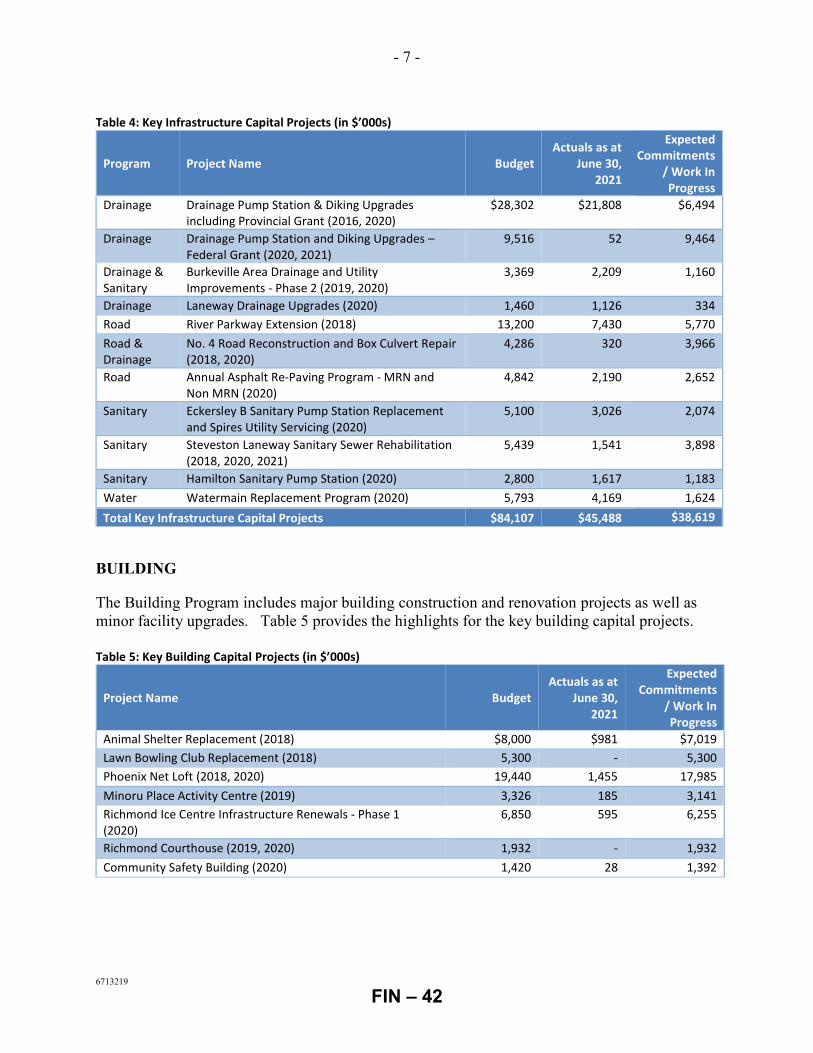
Table 4 provides the highlights for the key infrastructure capital projects.
FIN – 41
- 7 -
6713219
Table 4: Key Infrastructure Capital Projects (in $’000s)
Program Project Name Budget Actuals as at
June 30, 2021
Expected Commitments
/ Work In Progress
Drainage Drainage Pump Station & Diking Upgrades including Provincial Grant (2016, 2020)
$28,302 $21,808 $6,494
Drainage Drainage Pump Station and Diking Upgrades – Federal Grant (2020, 2021)
9,516 52 9,464
Drainage & Sanitary
Burkeville Area Drainage and Utility Improvements - Phase 2 (2019, 2020)
3,369 2,209 1,160
Drainage Laneway Drainage Upgrades (2020) 1,460 1,126 334 Road River Parkway Extension (2018) 13,200 7,430 5,770 Road & Drainage
No. 4 Road Reconstruction and Box Culvert Repair (2018, 2020)
4,286 320 3,966
Road Annual Asphalt Re-Paving Program - MRN and Non MRN (2020)
4,842 2,190 2,652
Sanitary Eckersley B Sanitary Pump Station Replacement and Spires Utility Servicing (2020)
5,100 3,026 2,074
Sanitary Steveston Laneway Sanitary Sewer Rehabilitation (2018, 2020, 2021)
5,439 1,541 3,898
Sanitary Hamilton Sanitary Pump Station (2020) 2,800 1,617 1,183 Water Watermain Replacement Program (2020) 5,793 4,169 1,624
Total Key Infrastructure Capital Projects $84,107 $45,488 $38,619
BUILDING
The Building Program includes major building construction and renovation projects as well as minor facility upgrades. Table 5 provides the highlights for the key building capital projects. Table 5: Key Building Capital Projects (in $’000s)
Project Name Budget Actuals as at
June 30, 2021
Expected Commitments
/ Work In Progress
Animal Shelter Replacement (2018) $8,000 $981 $7,019 Lawn Bowling Club Replacement (2018) 5,300 - 5,300 Phoenix Net Loft (2018, 2020) 19,440 1,455 17,985 Minoru Place Activity Centre (2019) 3,326 185 3,141 Richmond Ice Centre Infrastructure Renewals - Phase 1 (2020)
6,850 595 6,255
Richmond Courthouse (2019, 2020) 1,932 - 1,932 Community Safety Building (2020) 1,420 28 1,392
FIN – 42
- 8 -
6713219
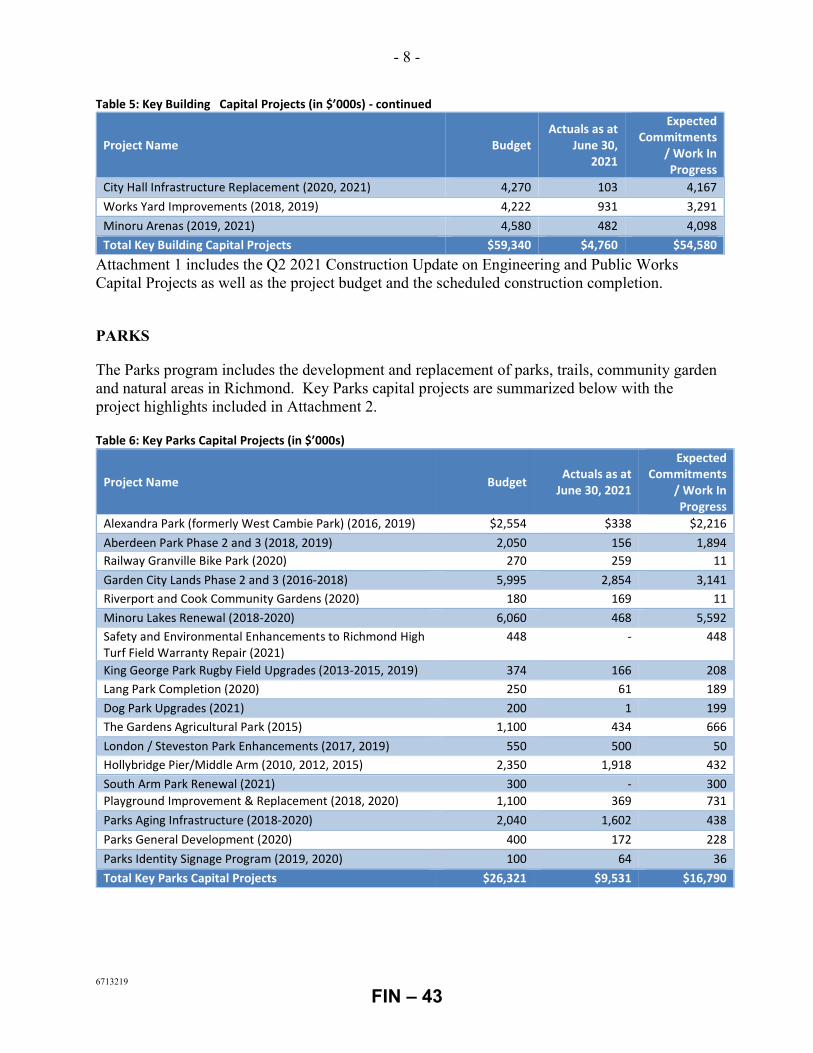
Table 5: Key Building Capital Projects (in $’000s) - continued
Project Name Budget Actuals as at
June 30, 2021
Expected Commitments
/ Work In Progress
City Hall Infrastructure Replacement (2020, 2021) 4,270 103 4,167 Works Yard Improvements (2018, 2019) 4,222 931 3,291 Minoru Arenas (2019, 2021) 4,580 482 4,098 Total Key Building Capital Projects $59,340 $4,760 $54,580
Attachment 1 includes the Q2 2021 Construction Update on Engineering and Public Works Capital Projects as well as the project budget and the scheduled construction completion.
PARKS
The Parks program includes the development and replacement of parks, trails, community garden and natural areas in Richmond. Key Parks capital projects are summarized below with the project highlights included in Attachment 2. Table 6: Key Parks Capital Projects (in $’000s)
Project Name Budget Actuals as at June 30, 2021
Expected Commitments
/ Work In Progress
Alexandra Park (formerly West Cambie Park) (2016, 2019) $2,554 $338 $2,216 Aberdeen Park Phase 2 and 3 (2018, 2019) 2,050 156 1,894 Railway Granville Bike Park (2020) 270 259 11 Garden City Lands Phase 2 and 3 (2016-2018) 5,995 2,854 3,141 Riverport and Cook Community Gardens (2020) 180 169 11 Minoru Lakes Renewal (2018-2020) 6,060 468 5,592 Safety and Environmental Enhancements to Richmond High Turf Field Warranty Repair (2021)
448 - 448
King George Park Rugby Field Upgrades (2013-2015, 2019) 374 166 208 Lang Park Completion (2020) 250 61 189 Dog Park Upgrades (2021) 200 1 199 The Gardens Agricultural Park (2015) 1,100 434 666 London / Steveston Park Enhancements (2017, 2019) 550 500 50 Hollybridge Pier/Middle Arm (2010, 2012, 2015) 2,350 1,918 432 South Arm Park Renewal (2021) 300 - 300 Playground Improvement & Replacement (2018, 2020) 1,100 369 731 Parks Aging Infrastructure (2018-2020) 2,040 1,602 438 Parks General Development (2020) 400 172 228 Parks Identity Signage Program (2019, 2020) 100 64 36 Total Key Parks Capital Projects $26,321 $9,531 $16,790
FIN – 43
- 9 -
6713219
TRANSPORTATION
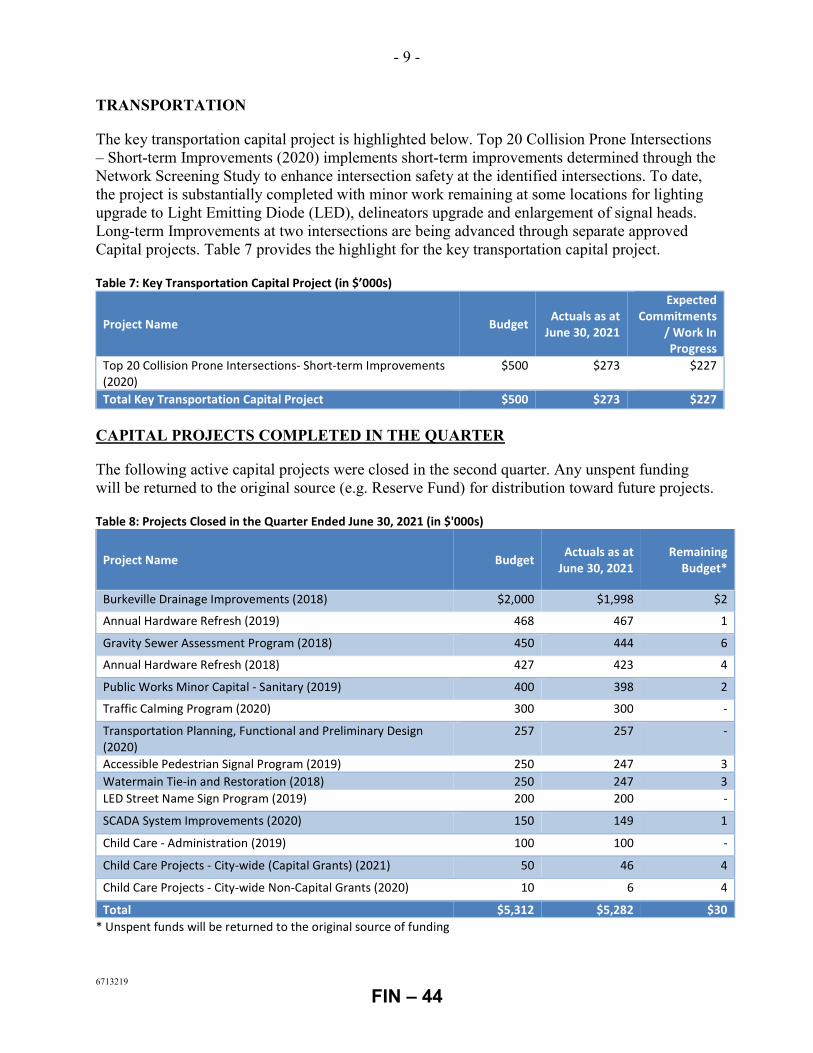
The key transportation capital project is highlighted below. Top 20 Collision Prone Intersections – Short-term Improvements (2020) implements short-term improvements determined through the Network Screening Study to enhance intersection safety at the identified intersections. To date, the project is substantially completed with minor work remaining at some locations for lighting upgrade to Light Emitting Diode (LED), delineators upgrade and enlargement of signal heads. Long-term Improvements at two intersections are being advanced through separate approved Capital projects. Table 7 provides the highlight for the key transportation capital project. Table 7: Key Transportation Capital Project (in $’000s)
Project Name Budget Actuals as at
June 30, 2021
Expected Commitments
/ Work In Progress
Top 20 Collision Prone Intersections- Short-term Improvements (2020)
$500 $273 $227
Total Key Transportation Capital Project $500 $273 $227 CAPITAL PROJECTS COMPLETED IN THE QUARTER
The following active capital projects were closed in the second quarter. Any unspent funding will be returned to the original source (e.g. Reserve Fund) for distribution toward future projects. Table 8: Projects Closed in the Quarter Ended June 30, 2021 (in $'000s)
Project Name Budget Actuals as at
June 30, 2021 Remaining
Budget*
Burkeville Drainage Improvements (2018) $2,000 $1,998 $2
Annual Hardware Refresh (2019) 468 467 1
Gravity Sewer Assessment Program (2018) 450 444 6
Annual Hardware Refresh (2018) 427 423 4
Public Works Minor Capital - Sanitary (2019) 400 398 2
Traffic Calming Program (2020) 300 300 -
Transportation Planning, Functional and Preliminary Design (2020)
257 257 -
Accessible Pedestrian Signal Program (2019) 250 247 3 Watermain Tie-in and Restoration (2018) 250 247 3 LED Street Name Sign Program (2019) 200 200 -
SCADA System Improvements (2020) 150 149 1
Child Care - Administration (2019) 100 100 -
Child Care Projects - City-wide (Capital Grants) (2021) 50 46 4
Child Care Projects - City-wide Non-Capital Grants (2020) 10 6 4
Total $5,312 $5,282 $30 * Unspent funds will be returned to the original source of funding
FIN – 44
- 10 -
6713219
CONTRIBUTED ASSETS
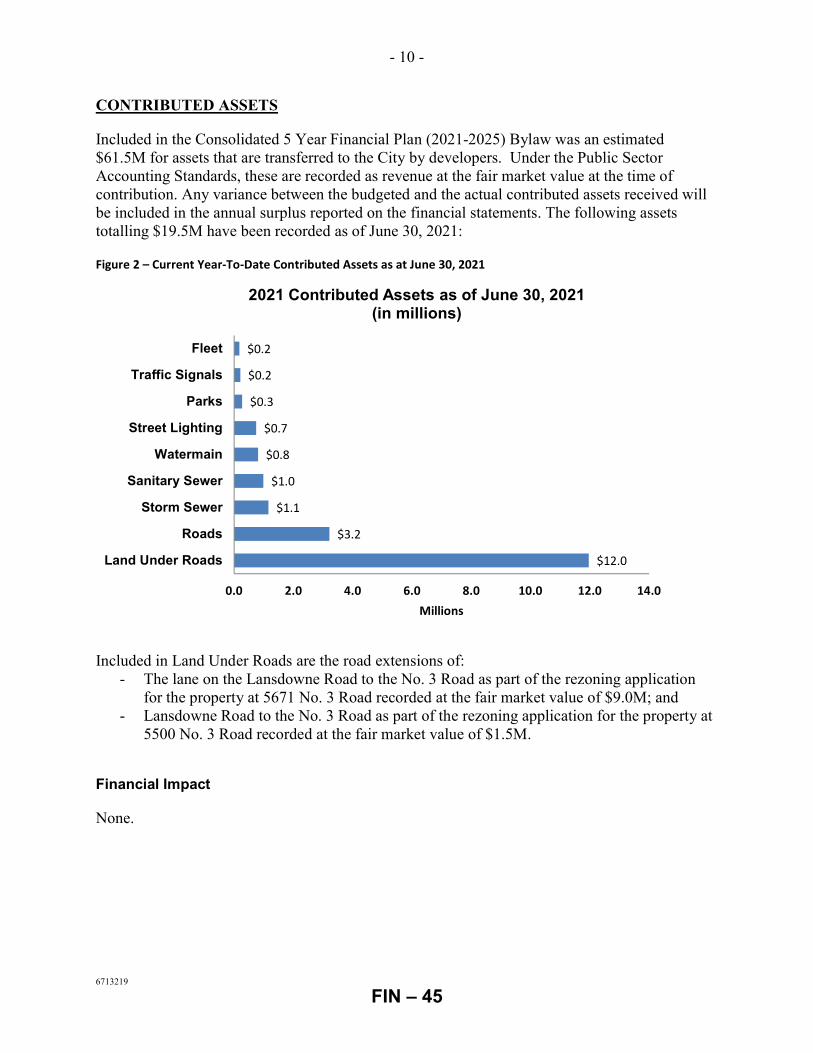
Included in the Consolidated 5 Year Financial Plan (2021-2025) Bylaw was an estimated $61.5M for assets that are transferred to the City by developers. Under the Public Sector Accounting Standards, these are recorded as revenue at the fair market value at the time of contribution. Any variance between the budgeted and the actual contributed assets received will be included in the annual surplus reported on the financial statements. The following assets totalling $19.5M have been recorded as of June 30, 2021:
Figure 2 – Current Year-To-Date Contributed Assets as at June 30, 2021
Included in Land Under Roads are the road extensions of: - The lane on the Lansdowne Road to the No. 3 Road as part of the rezoning application
for the property at 5671 No. 3 Road recorded at the fair market value of $9.0M; and - Lansdowne Road to the No. 3 Road as part of the rezoning application for the property at
5500 No. 3 Road recorded at the fair market value of $1.5M.
Financial Impact
None.
$12.0
$3.2
$1.1
$1.0
$0.8
$0.7
$0.3
$0.2
$0.2
0.0 2.0 4.0 6.0 8.0 10.0 12.0 14.0
Land Under Roads
Roads
Storm Sewer
Sanitary Sewer
Watermain
Street Lighting
Parks
Traffic Signals
Fleet
Millions
2021 Contributed Assets as of June 30, 2021(in millions)
FIN – 45
- 11 -
6713219
Conclusion
This report provides information on active capital projects that were previously approved by Council. All previously approved active capital projects are currently within budget.
Jenny Ho, CPA, CGA Acting Manager, Budgets (604-276-4223) JH:sx Att. 1: Q2 2021 Construction Update on Engineering and Public Works Capital Projects 2: Q2 2021 Construction Update on Parks Capital Projects
FIN – 46
August 4, 2021 - 12 - Attachment 1
6713219
Q2 2021 Construction Update on Engineering and Public Works Capital Projects
Flood Protection
Drainage Pump Station and Diking Upgrades – Provincial Grant The City secured $16.6 million from the Provincial Government under the Flood Protection Program. This project includes the upgrades of four drainage pump stations and diking upgrades. Construction for the South Dike upgrade (Gilbert Road to No. 3 Road), Horseshoe Slough drainage pump station and Shell Road North drainage pump station is substantially complete. Construction for the No. 7 Road South drainage pump station is ongoing. Drainage Pump Station and Diking Upgrades – Federal Grant The City secured $13.8 million from the Federal Government through the Disaster Mitigation and Adaptation Fund Grant to contribute towards the multi-year $34.45M Flood Protection Program that are budgeted from 2020 to 2025. This project includes the upgrades of various drainage pump station and diking upgrades. Procurement of the Steveston Highway and Gilbert Road drainage pump station and South Dike Upgrades from No. 3 Road to west of No. 4 Rd is ongoing. Burkeville Area Drainage, Watermain and Sanitary Sewer Upgrades This project consists of upgrades to the City’s storm sewer capacity. Ageing watermain and sanitary sewers will also be upgraded at the same time to minimize ongoing disruption to residents and overall construction costs. This project will be performed in phases over 5 to 10 years. Phase 2 is ongoing with Phase 3 commencing in Q3 2021. Laneway Drainage Upgrades This project consists of upgrades to laneways in the Broadmoor area to reduce local flood risks by increasing the City’s storm system capacity. Construction at Bates Road East laneway is ongoing, followed by Reeder Road South laneway in Q3 2021. Roads
River Parkway Extension This project involves the construction of the interim two-lane road along the former railway corridor, from 200m northeast of Gilbert Road to Cambie Road. The new River Parkway connects to the existing Leslie Road, Gilbert Road, Cambie Road and future Minoru Boulevard as well as provides access to the future park. River Parkway has replaced the existing River Road between Gilbert Road and Cambie Road and provides a continuous alternate route to No. 3 Road and existing River Road. This project is substantially complete and River Parkway is open for public use. The River Road access at Gilbert Road has been closed and the construction of a cul-de-sac at the west end of River Road is complete.
FIN – 47
August 4, 2021 - 13 - Attachment 1
6713219
No. 4 Road Reconstruction and Box Culvert Repair from Blundell Road to Granville Avenue This project involves the reconstruction of the northbound lanes of No. 4 Road from Blundell Road to Granville Avenue. This section has undergone settlement over the years resulting in road surface deterioration. In addition, the joints in the drainage box culvert located on the west side of No. 4 Road are failing which will also be repaired through this project. Construction is ongoing. Paving Program – Various Locations – City-Wide The annual Paving Program works are ongoing. Locations completed include 11000 Block Railway Avenue, 10000 Block No. 4 Road, 8000 Block Lansdowne Road, 8000 Block Westminster Highway, and 6000 Block Cooney Road. Upcoming locations include: 11000 Block No. 3 Road, Alderbridge and Garden City Road, Bridgeport and No. 5 Road, and various spot repairs. Sanitary Sewers
Eckersley B Sanitary Pump Station This project includes the replacement of the existing sanitary pump station located at William Cook Elementary School and will connect to the existing sanitary system and recently completed Spires area upgrades. Construction is ongoing. Steveston Sanitary Sewer This project includes the rehabilitation and upgrades to the City’s sanitary sewer in the Steveston catchment. This project will be performed in phases over 5 to 10 year. Construction started in 2020 to address priority locations and the design of the master plan is ongoing with some rehabilitation work planned for late-2021.
Water
Watermain Replacement Program This project replaces and upsizes ageing watermains at the end of their service life with PVC pipe, in line with the City's Ageing Infrastructure Replacement Strategy. This will minimize unplanned maintenance and improve fire protection. Construction in the Bridgeport/Simpson/Olafson area and Bates area is complete. Construction in the Chatsworth/Chelmsford area is ongoing. Thompson Gate Pressure Reducing Valve (PRV) Station This project includes the construction of a new PRV station on Boundary Road and Thompson Gate to connect the neighbourhood's watermain system to Metro Vancouver's Annacis transmission main. Completion of the project is required to provide adequate flows to support upcoming development in the area. Construction is ongoing.
FIN – 48
August 4, 2021 - 14 - Attachment 1
6713219
Buildings
Animal Shelter The project scope includes upgrading the existing 4,580 sq. ft. facility and building a new 1,600 sq. ft. addition. This work will support the growing population of Richmond, while providing improved facilities, amenities and a high quality environment for animal care. Design development is complete, abatement works are in progress and the construction contract has been awarded. It is anticipated that this project will be complete by Q2 2022.
Bowling Green Community Activity Centre The current Richmond Lawn Bowling Clubhouse was constructed in 1963 and is located in the northeast corner of Minoru Park. This facility will be demolished and replaced with a modern 4,900 sq. ft. single-storey facility in the same location. It is anticipated that the design will be complete and ready for tendering by Q3 2021 with construction to be completed by Q1 2023.
Phoenix Net Loft Deconstruction and salvage of the Phoenix Net Loft is complete and salvaged materials are stored at the City owned warehouse at 7400 River Road.
Minoru Place Activity Centre BC Housing is temporarily operating the facility as an Emergency Response Centre for the vulnerable population experiencing homelessness due to COVID-19. The Minoru Place Activity Centre will be repurposed to a Community Arts Program and Education space (Cultural Centre Annex), once the license agreement with BC Housing is complete. In September 2020, Council approved the submission of a grant to Investing in Canada Infrastructure Program – Community, Culture and Recreation Stream. The detailed design phase of the project has been completed and construction is anticipated to begin in Q3 2022.
City Centre Community Centre North The developer driven amenity will feature an indoor activity track, gymnasium, multi-purpose rooms and Children’s Exploratorium. The 33,000 sq. ft. project is currently in the detailed design phase by the developer and it is anticipated to be under construction in 2021, with an estimated completion by the end of 2023. Richmond Ice Centre- Phase 1 Existing ageing equipment and infrastructure will be replaced with new and more efficient alternatives. Three new compressors will use less ammonia, have more efficient power consumption and improved control operation. The equipment and infrastructure replacements will minimize unplanned maintenance and improve life and safety for the users and operators. The compressors replacement and the other upgrades to the refrigeration plant will be completed in Q3 2021, whereas the design for the remainder of the work is ongoing, with construction scheduled to start in Q1 2022.
Child Care Centres A combined total of approximately 64,880 sq. ft. has been designed to accommodate about 201 children in various licensed child care programs. Funding was collected through both the Development Cost Charges and Community Amenities Charges. Design and construction, which is the responsibility of the developer, continue for the following:
FIN – 49
August 4, 2021 - 15 - Attachment 1
6713219
Sprouts Early Childhood Development Hub - Pinnacle International (construction completion anticipated by Q3 2021)
Seedlings Early Childhood Development Hub - Keltic Canada Development Co. Ltd. (construction completion anticipated by Q1 2022)
Hummingbird Child Care - Aspac Development Ltd. (construction completion anticipated by Q3 2022)
Richmond Courthouse The two-storey, 64,000 sq. ft. building was originally built in 1975 and currently houses spaces for the Attorney General Office, Richmond Community Corrections, Richmond Family Justice Centre and RCMP Community Services. Existing ageing equipment will be replaced with new and more efficient alternatives. Existing infrastructure will be improved to enhance life and safety for the users and operators. Staff have procured the consulting team and contractor, with anticipated completion for the design in Q4 2021 and construction start in Q2 2022.
Community Safety Building The heat pump system has reached the end of its life expectancy. This is the last phase of the heat pump replacement works, which will prevent service disruption and potential closure for this building. The design has been completed and construction is planned to start in Q3 2021.
City Hall Infrastructure Replacement Multiple building components and mechanical equipment at City Hall will be replaced with modern energy efficient systems, with construction completion anticipated by Q1 2022. In addition, the replacement of the Council Chamber roof is anticipated to be complete in Q3 2022.
Works Yard Improvements Buildings in general at the Works Yard have aged beyond their expected lifespan. In advance of a broader rebuilding program being finalised and funded, there are many building components within each of the active Works Yard facilities that require replacement in order to maintain operability. Design for this phase is complete and construction tendering is in progress. Construction is estimated to be complete by Q1 2022.
Minoru Arenas Building infrastructure renewals and replacements include mechanical and electrical upgrades, life and safety equipment upgrades and architectural improvements of the mezzanine viewing area and change rooms. Construction started in Q2 2021 with anticipated completion in Q2 2022.
FIN – 50
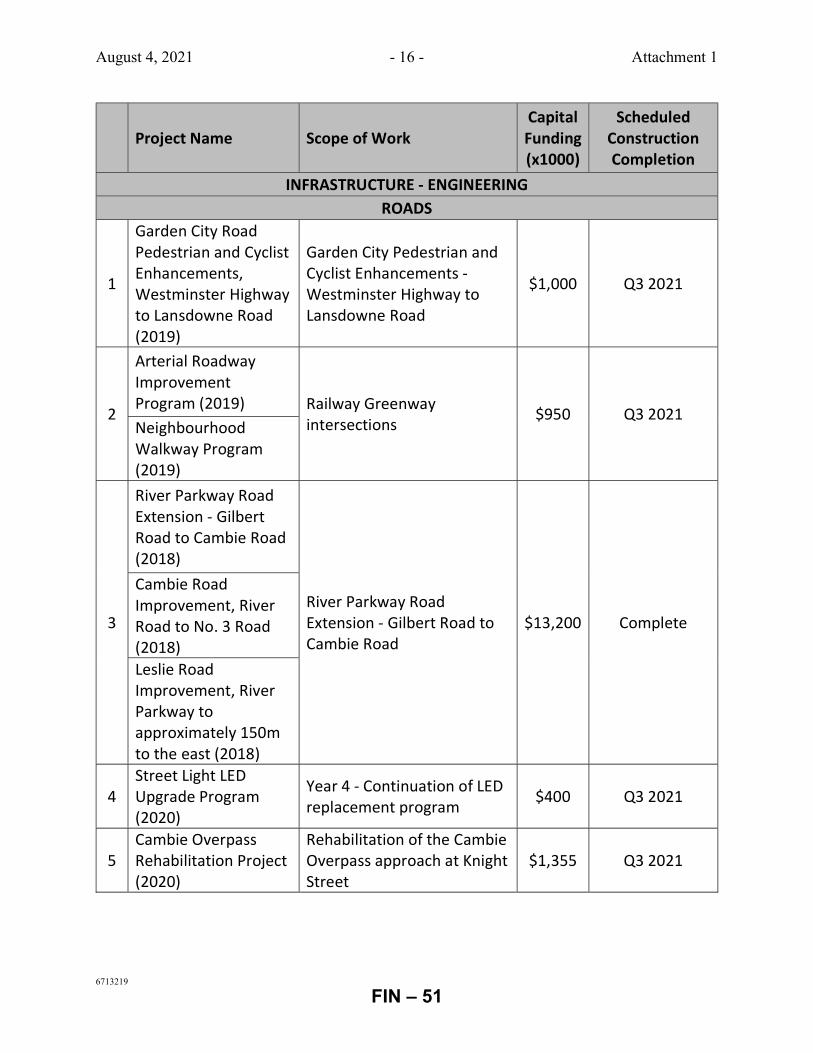
August 4, 2021 - 16 - Attachment 1
6713219
Project Name Scope of Work Capital Funding (x1000)
Scheduled Construction Completion
INFRASTRUCTURE - ENGINEERING ROADS
1
Garden City Road Pedestrian and Cyclist Enhancements, Westminster Highway to Lansdowne Road (2019)
Garden City Pedestrian and Cyclist Enhancements - Westminster Highway to Lansdowne Road
$1,000 Q3 2021
2
Arterial Roadway Improvement Program (2019) Railway Greenway
intersections $950 Q3 2021
Neighbourhood Walkway Program (2019)
3
River Parkway Road Extension - Gilbert Road to Cambie Road (2018)
River Parkway Road Extension - Gilbert Road to Cambie Road
$13,200 Complete
Cambie Road Improvement, River Road to No. 3 Road (2018) Leslie Road Improvement, River Parkway to approximately 150m to the east (2018)
4 Street Light LED Upgrade Program (2020)
Year 4 - Continuation of LED replacement program
$400 Q3 2021
5 Cambie Overpass Rehabilitation Project (2020)
Rehabilitation of the Cambie Overpass approach at Knight Street
$1,355 Q3 2021
FIN – 51
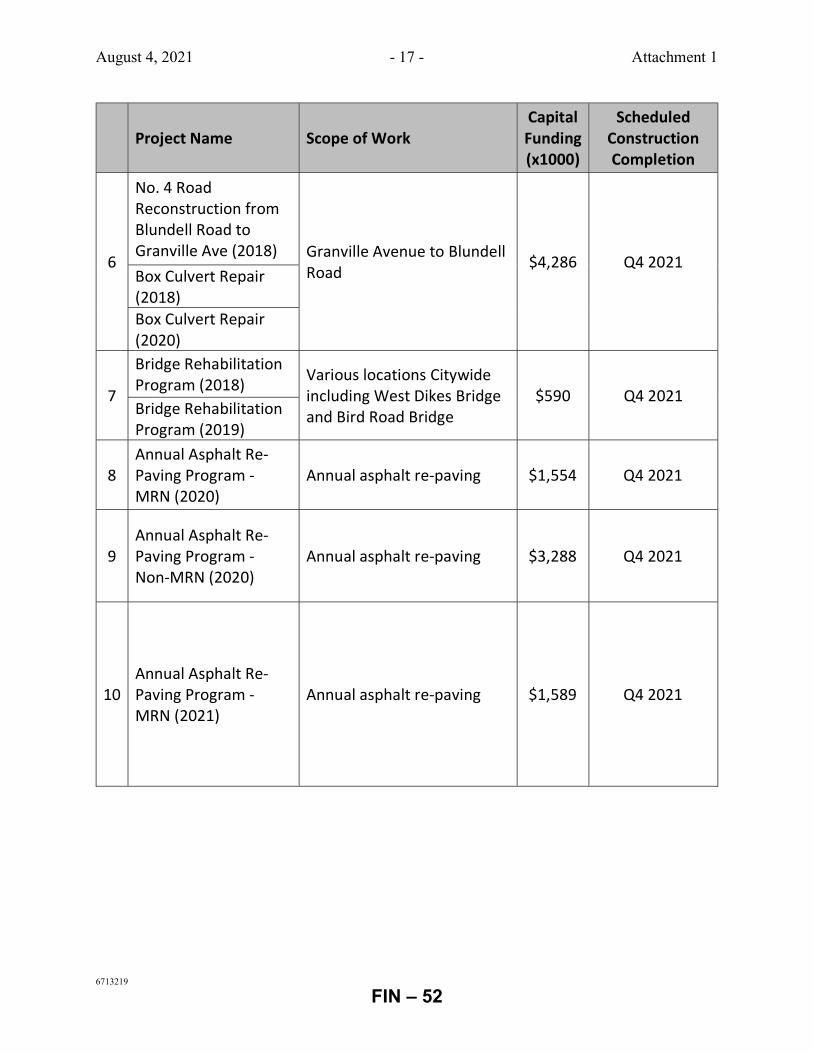
August 4, 2021 - 17 - Attachment 1
6713219
Project Name Scope of Work Capital Funding (x1000)
Scheduled Construction Completion
6
No. 4 Road Reconstruction from Blundell Road to Granville Ave (2018) Granville Avenue to Blundell
Road $4,286 Q4 2021
Box Culvert Repair (2018) Box Culvert Repair (2020)
7
Bridge Rehabilitation Program (2018) Various locations Citywide
including West Dikes Bridge and Bird Road Bridge
$590 Q4 2021 Bridge Rehabilitation Program (2019)
8 Annual Asphalt Re-Paving Program - MRN (2020)
Annual asphalt re-paving $1,554 Q4 2021
9 Annual Asphalt Re-Paving Program - Non-MRN (2020)
Annual asphalt re-paving $3,288 Q4 2021
10 Annual Asphalt Re-Paving Program - MRN (2021)
Annual asphalt re-paving $1,589 Q4 2021
FIN – 52
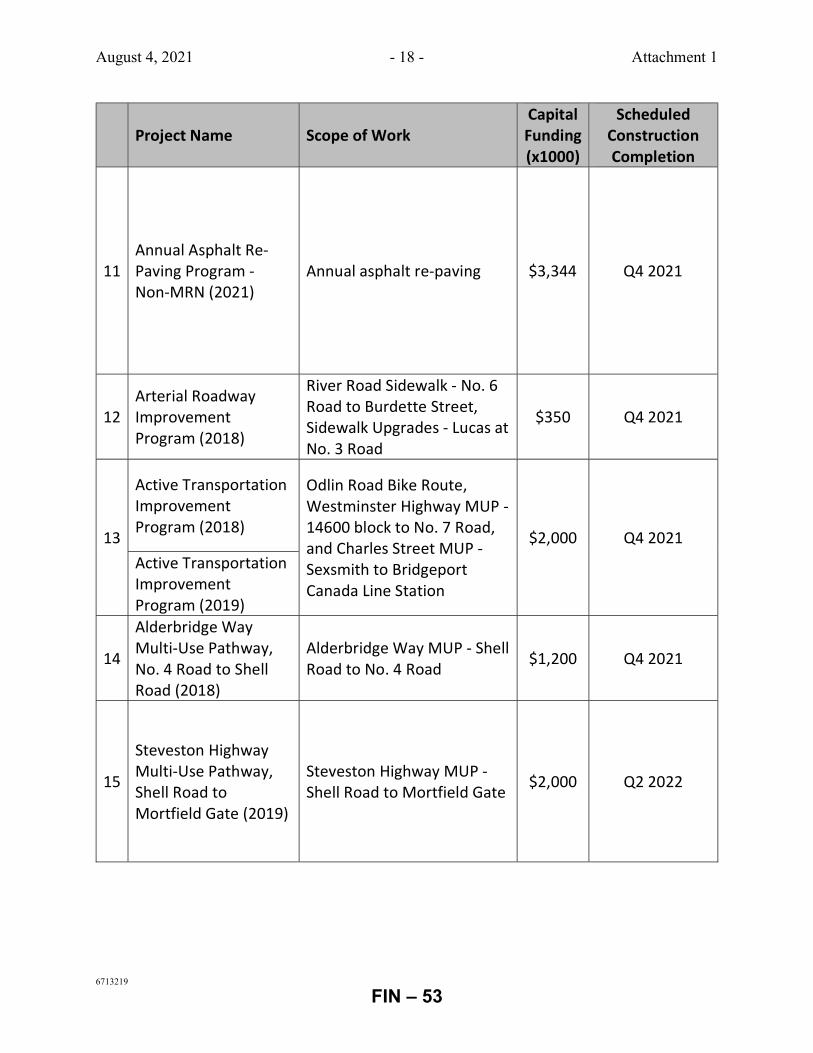
August 4, 2021 - 18 - Attachment 1
6713219
Project Name Scope of Work Capital Funding (x1000)
Scheduled Construction Completion
11 Annual Asphalt Re-Paving Program - Non-MRN (2021)
Annual asphalt re-paving $3,344 Q4 2021
12 Arterial Roadway Improvement Program (2018)
River Road Sidewalk - No. 6 Road to Burdette Street, Sidewalk Upgrades - Lucas at No. 3 Road
$350 Q4 2021
13
Active Transportation Improvement Program (2018)
Odlin Road Bike Route, Westminster Highway MUP - 14600 block to No. 7 Road, and Charles Street MUP - Sexsmith to Bridgeport Canada Line Station
$2,000 Q4 2021 Active Transportation Improvement Program (2019)
14
Alderbridge Way Multi-Use Pathway, No. 4 Road to Shell Road (2018)
Alderbridge Way MUP - Shell Road to No. 4 Road
$1,200 Q4 2021
15
Steveston Highway Multi-Use Pathway, Shell Road to Mortfield Gate (2019)
Steveston Highway MUP - Shell Road to Mortfield Gate
$2,000 Q2 2022
FIN – 53
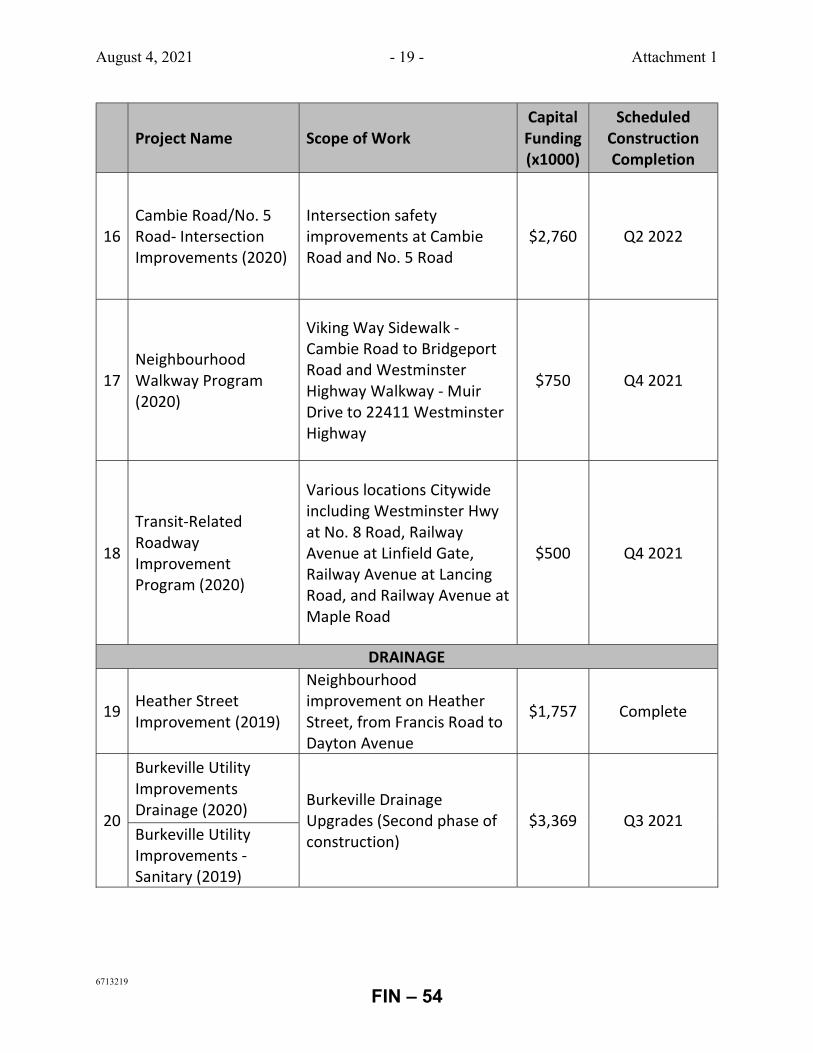
August 4, 2021 - 19 - Attachment 1
6713219
Project Name Scope of Work Capital Funding (x1000)
Scheduled Construction Completion
16 Cambie Road/No. 5 Road- Intersection Improvements (2020)
Intersection safety improvements at Cambie Road and No. 5 Road
$2,760 Q2 2022
17 Neighbourhood Walkway Program (2020)
Viking Way Sidewalk - Cambie Road to Bridgeport Road and Westminster Highway Walkway - Muir Drive to 22411 Westminster Highway
$750 Q4 2021
18
Transit-Related Roadway Improvement Program (2020)
Various locations Citywide including Westminster Hwy at No. 8 Road, Railway Avenue at Linfield Gate, Railway Avenue at Lancing Road, and Railway Avenue at Maple Road
$500 Q4 2021
DRAINAGE
19 Heather Street Improvement (2019)
Neighbourhood improvement on Heather Street, from Francis Road to Dayton Avenue
$1,757 Complete
20
Burkeville Utility Improvements Drainage (2020) Burkeville Drainage
Upgrades (Second phase of construction)
$3,369 Q3 2021 Burkeville Utility Improvements - Sanitary (2019)
FIN – 54
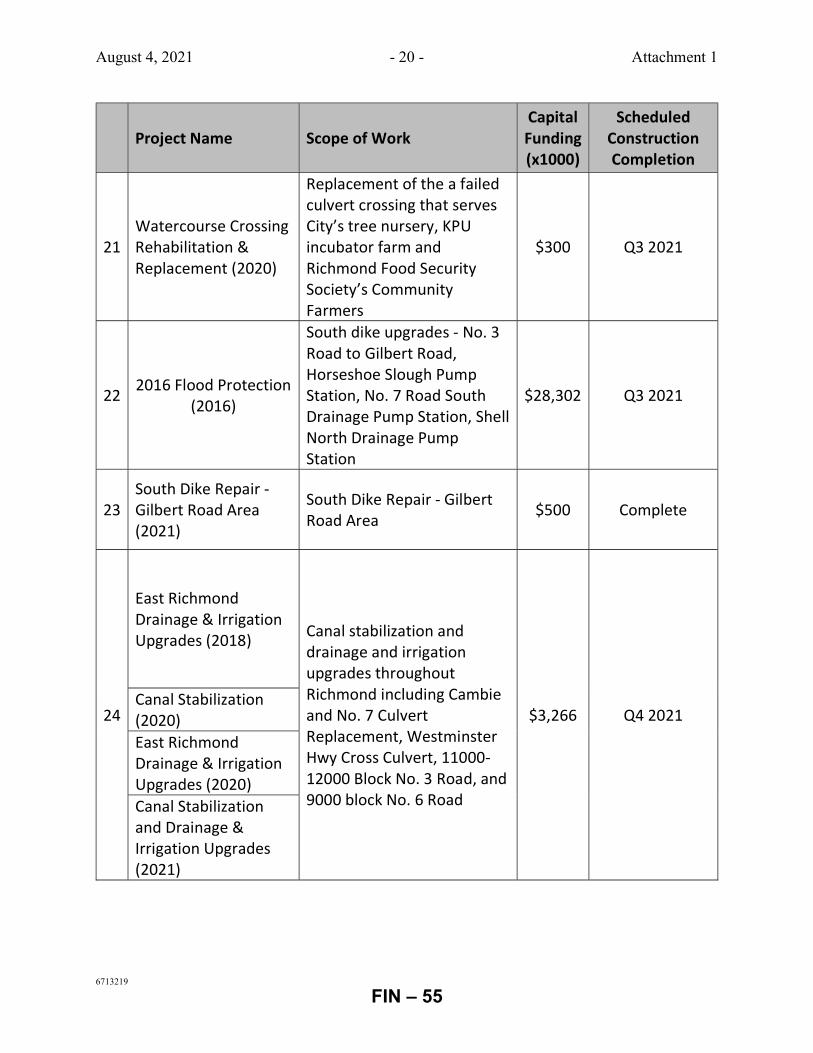
August 4, 2021 - 20 - Attachment 1
6713219
Project Name Scope of Work Capital Funding (x1000)
Scheduled Construction Completion
21 Watercourse Crossing Rehabilitation & Replacement (2020)
Replacement of the a failed culvert crossing that serves City’s tree nursery, KPU incubator farm and Richmond Food Security Society’s Community Farmers
$300 Q3 2021
22 2016 Flood Protection
(2016)
South dike upgrades - No. 3 Road to Gilbert Road, Horseshoe Slough Pump Station, No. 7 Road South Drainage Pump Station, Shell North Drainage Pump Station
$28,302 Q3 2021
23 South Dike Repair - Gilbert Road Area (2021)
South Dike Repair - Gilbert Road Area
$500 Complete
24
East Richmond Drainage & Irrigation Upgrades (2018) Canal stabilization and
drainage and irrigation upgrades throughout Richmond including Cambie and No. 7 Culvert Replacement, Westminster Hwy Cross Culvert, 11000-12000 Block No. 3 Road, and 9000 block No. 6 Road
$3,266 Q4 2021 Canal Stabilization (2020) East Richmond Drainage & Irrigation Upgrades (2020) Canal Stabilization and Drainage & Irrigation Upgrades (2021)
FIN – 55
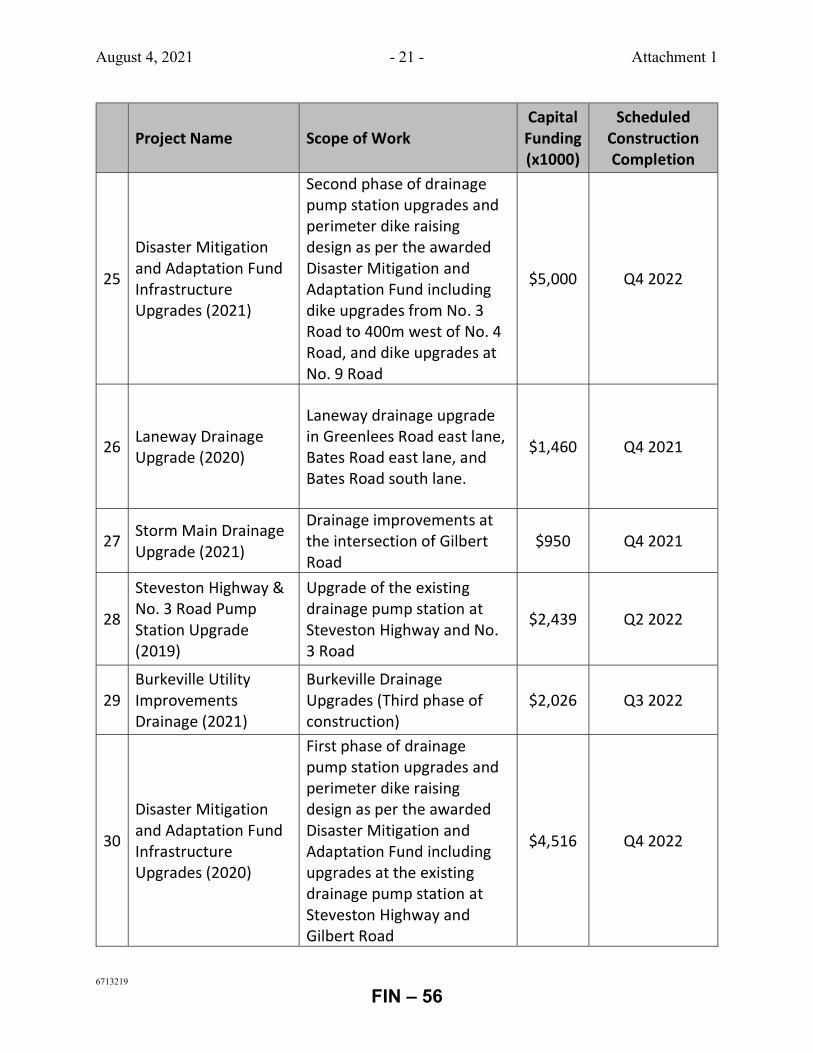
August 4, 2021 - 21 - Attachment 1
6713219
Project Name Scope of Work Capital Funding (x1000)
Scheduled Construction Completion
25
Disaster Mitigation and Adaptation Fund Infrastructure Upgrades (2021)
Second phase of drainage pump station upgrades and perimeter dike raising design as per the awarded Disaster Mitigation and Adaptation Fund including dike upgrades from No. 3 Road to 400m west of No. 4 Road, and dike upgrades at No. 9 Road
$5,000 Q4 2022
26 Laneway Drainage Upgrade (2020)
Laneway drainage upgrade in Greenlees Road east lane, Bates Road east lane, and Bates Road south lane.
$1,460 Q4 2021
27 Storm Main Drainage Upgrade (2021)
Drainage improvements at the intersection of Gilbert Road
$950 Q4 2021
28
Steveston Highway & No. 3 Road Pump Station Upgrade (2019)
Upgrade of the existing drainage pump station at Steveston Highway and No. 3 Road
$2,439 Q2 2022
29 Burkeville Utility Improvements Drainage (2021)
Burkeville Drainage Upgrades (Third phase of construction)
$2,026 Q3 2022
30
Disaster Mitigation and Adaptation Fund Infrastructure Upgrades (2020)
First phase of drainage pump station upgrades and perimeter dike raising design as per the awarded Disaster Mitigation and Adaptation Fund including upgrades at the existing drainage pump station at Steveston Highway and Gilbert Road
$4,516 Q4 2022
FIN – 56
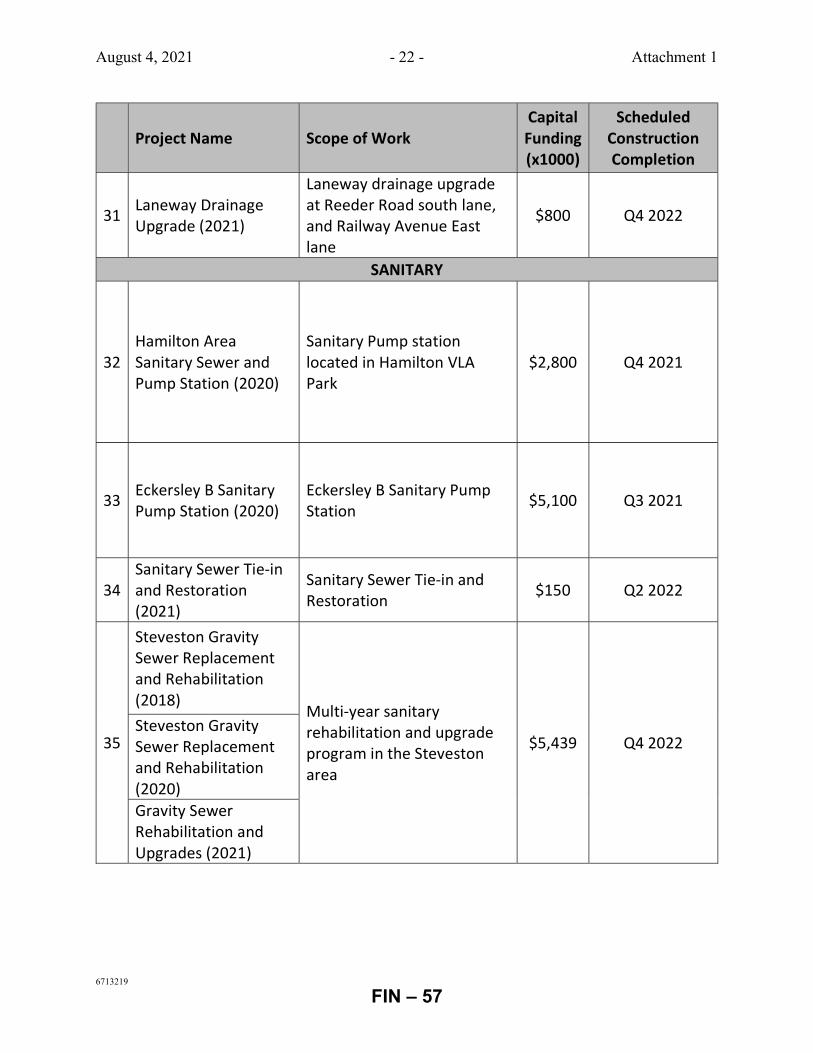
August 4, 2021 - 22 - Attachment 1
6713219
Project Name Scope of Work Capital Funding (x1000)
Scheduled Construction Completion
31 Laneway Drainage Upgrade (2021)
Laneway drainage upgrade at Reeder Road south lane, and Railway Avenue East lane
$800 Q4 2022
SANITARY
32 Hamilton Area Sanitary Sewer and Pump Station (2020)
Sanitary Pump station located in Hamilton VLA Park
$2,800 Q4 2021
33 Eckersley B Sanitary Pump Station (2020)
Eckersley B Sanitary Pump Station
$5,100 Q3 2021
34 Sanitary Sewer Tie-in and Restoration (2021)
Sanitary Sewer Tie-in and Restoration
$150 Q2 2022
35
Steveston Gravity Sewer Replacement and Rehabilitation (2018)
Multi-year sanitary rehabilitation and upgrade program in the Steveston area
$5,439 Q4 2022 Steveston Gravity Sewer Replacement and Rehabilitation (2020) Gravity Sewer Rehabilitation and Upgrades (2021)
FIN – 57
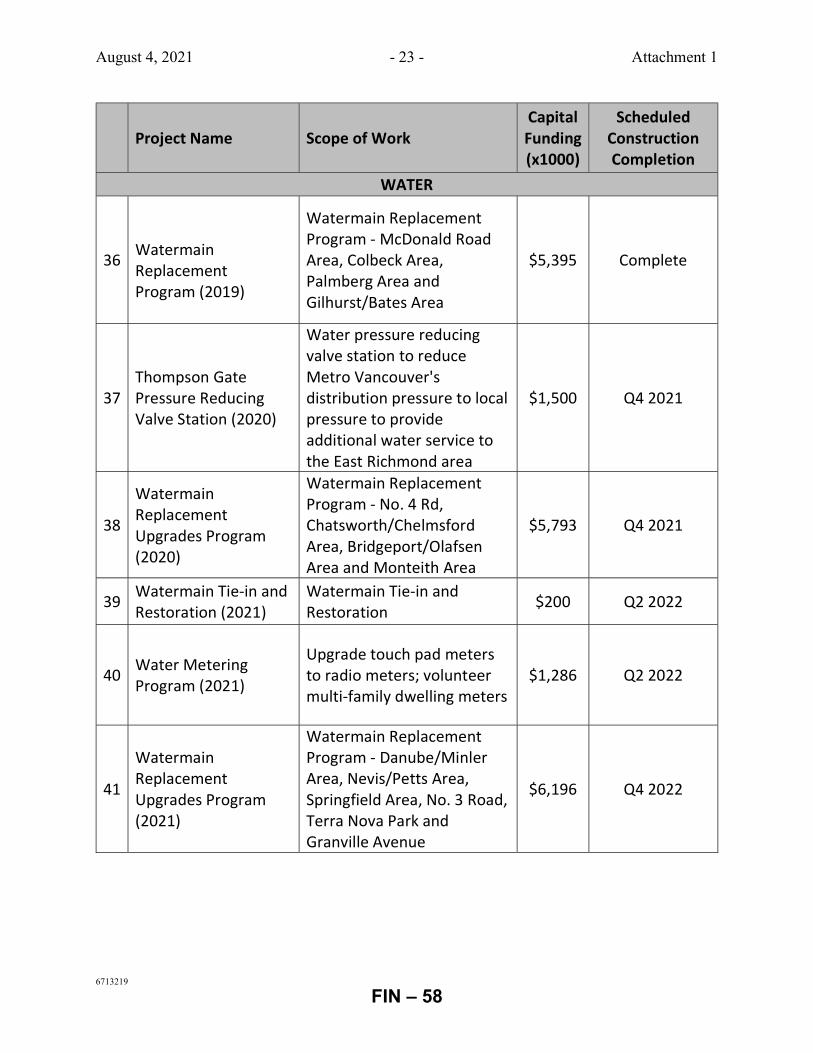
August 4, 2021 - 23 - Attachment 1
6713219
Project Name Scope of Work Capital Funding (x1000)
Scheduled Construction Completion
WATER
36
Watermain Replacement Program (2019)
Watermain Replacement Program - McDonald Road Area, Colbeck Area, Palmberg Area and Gilhurst/Bates Area
$5,395 Complete
37 Thompson Gate Pressure Reducing Valve Station (2020)
Water pressure reducing valve station to reduce Metro Vancouver's distribution pressure to local pressure to provide additional water service to the East Richmond area
$1,500 Q4 2021
38
Watermain Replacement Upgrades Program (2020)
Watermain Replacement Program - No. 4 Rd, Chatsworth/Chelmsford Area, Bridgeport/Olafsen Area and Monteith Area
$5,793 Q4 2021
39 Watermain Tie-in and Restoration (2021)
Watermain Tie-in and Restoration
$200 Q2 2022
40 Water Metering Program (2021)
Upgrade touch pad meters to radio meters; volunteer multi-family dwelling meters
$1,286 Q2 2022
41
Watermain Replacement Upgrades Program (2021)
Watermain Replacement Program - Danube/Minler Area, Nevis/Petts Area, Springfield Area, No. 3 Road, Terra Nova Park and Granville Avenue
$6,196 Q4 2022
FIN – 58
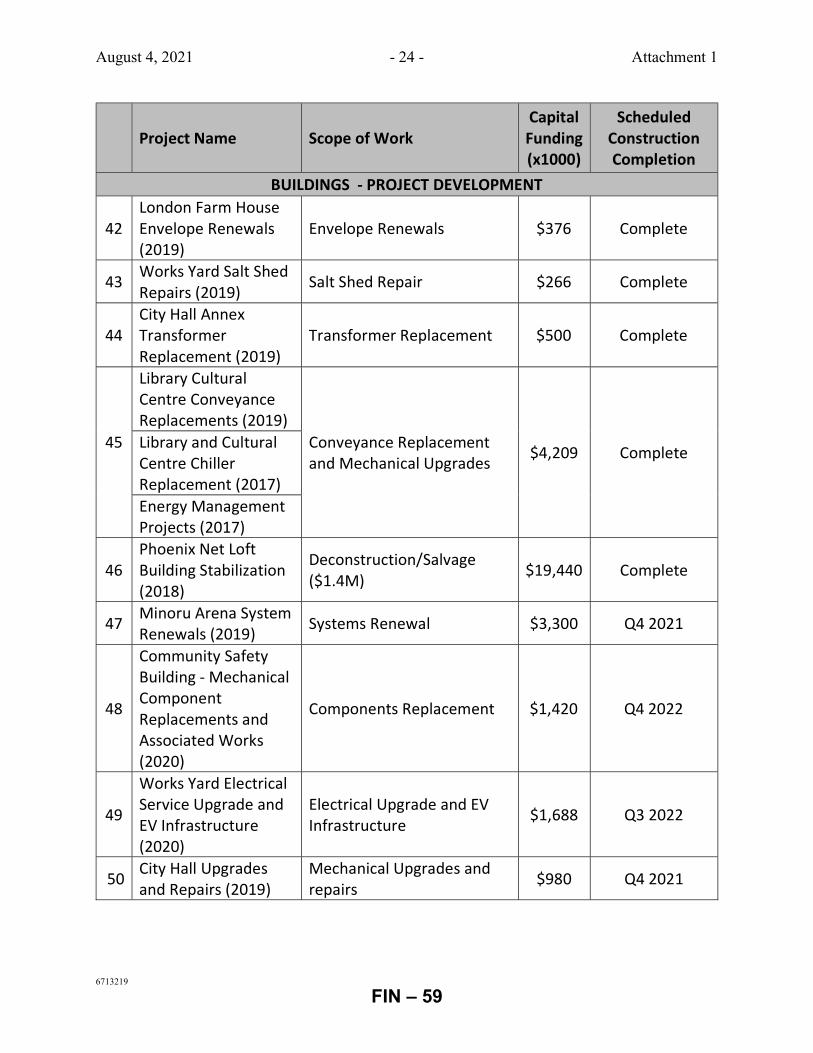
August 4, 2021 - 24 - Attachment 1
6713219
Project Name Scope of Work Capital Funding (x1000)
Scheduled Construction Completion
BUILDINGS - PROJECT DEVELOPMENT
42 London Farm House Envelope Renewals (2019)
Envelope Renewals $376 Complete
43 Works Yard Salt Shed Repairs (2019)
Salt Shed Repair $266 Complete
44 City Hall Annex Transformer Replacement (2019)
Transformer Replacement $500 Complete
45
Library Cultural Centre Conveyance Replacements (2019)
Conveyance Replacement and Mechanical Upgrades
$4,209 Complete Library and Cultural Centre Chiller Replacement (2017) Energy Management Projects (2017)
46 Phoenix Net Loft Building Stabilization (2018)
Deconstruction/Salvage ($1.4M)
$19,440 Complete
47 Minoru Arena System Renewals (2019)
Systems Renewal $3,300 Q4 2021
48
Community Safety Building - Mechanical Component Replacements and Associated Works (2020)
Components Replacement $1,420 Q4 2022
49
Works Yard Electrical Service Upgrade and EV Infrastructure (2020)
Electrical Upgrade and EV Infrastructure
$1,688 Q3 2022
50 City Hall Upgrades and Repairs (2019)
Mechanical Upgrades and repairs
$980 Q4 2021
FIN – 59
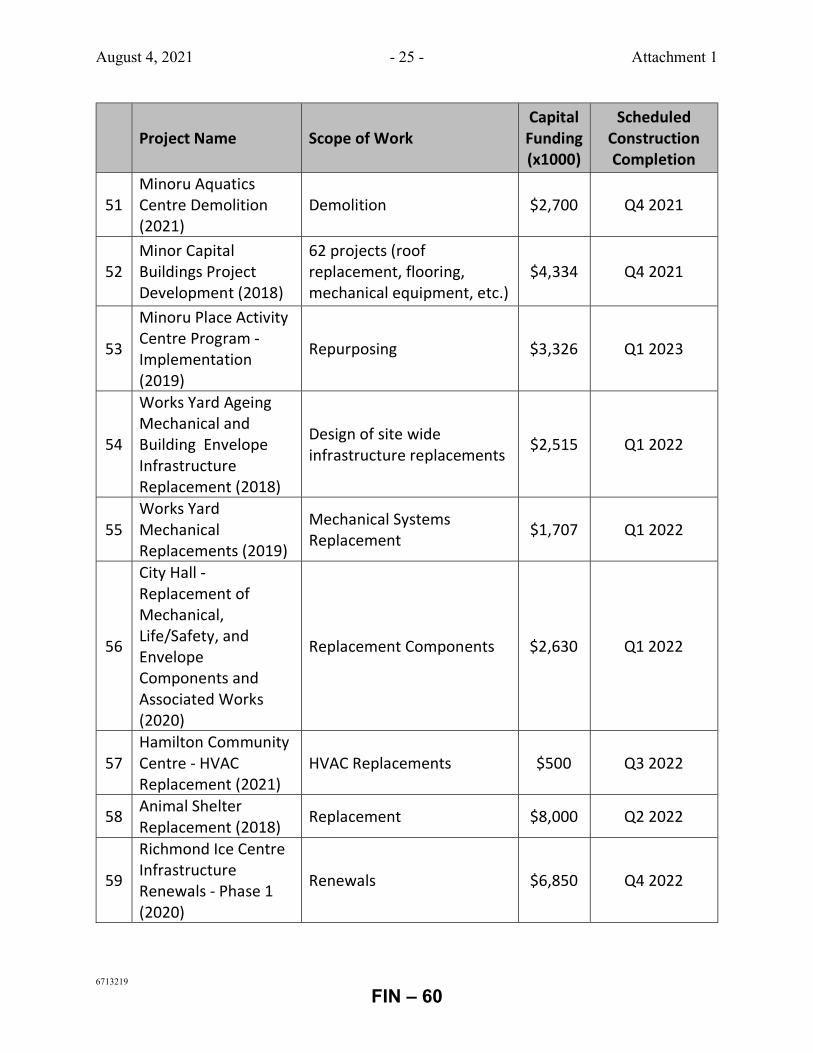
August 4, 2021 - 25 - Attachment 1
6713219
Project Name Scope of Work Capital Funding (x1000)
Scheduled Construction Completion
51 Minoru Aquatics Centre Demolition (2021)
Demolition $2,700 Q4 2021
52 Minor Capital Buildings Project Development (2018)
62 projects (roof replacement, flooring, mechanical equipment, etc.)
$4,334 Q4 2021
53
Minoru Place Activity Centre Program - Implementation (2019)
Repurposing $3,326 Q1 2023
54
Works Yard Ageing Mechanical and Building Envelope Infrastructure Replacement (2018)
Design of site wide infrastructure replacements
$2,515 Q1 2022
55 Works Yard Mechanical Replacements (2019)
Mechanical Systems Replacement
$1,707 Q1 2022
56
City Hall - Replacement of Mechanical, Life/Safety, and Envelope Components and Associated Works (2020)
Replacement Components $2,630 Q1 2022
57 Hamilton Community Centre - HVAC Replacement (2021)
HVAC Replacements $500 Q3 2022
58 Animal Shelter Replacement (2018)
Replacement $8,000 Q2 2022
59
Richmond Ice Centre Infrastructure Renewals - Phase 1 (2020)
Renewals $6,850 Q4 2022
FIN – 60
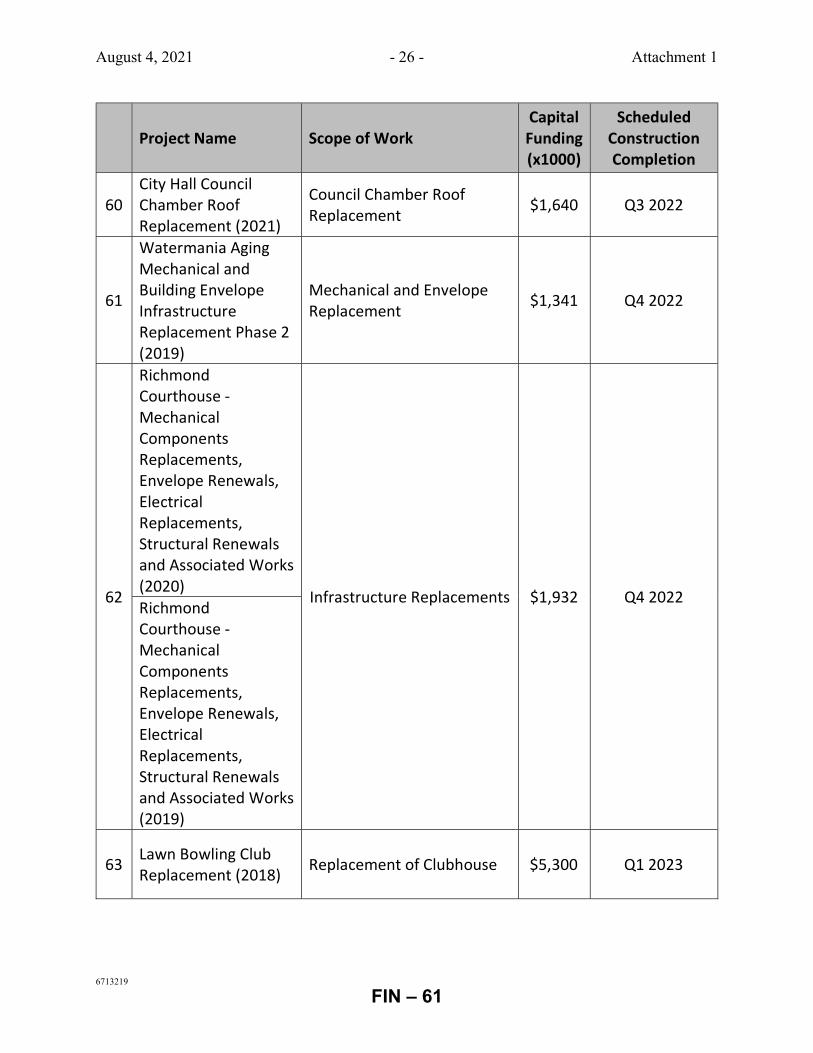
August 4, 2021 - 26 - Attachment 1
6713219
Project Name Scope of Work Capital Funding (x1000)
Scheduled Construction Completion
60 City Hall Council Chamber Roof Replacement (2021)
Council Chamber Roof Replacement
$1,640 Q3 2022
61
Watermania Aging Mechanical and Building Envelope Infrastructure Replacement Phase 2 (2019)
Mechanical and Envelope Replacement
$1,341 Q4 2022
62
Richmond Courthouse - Mechanical Components Replacements, Envelope Renewals, Electrical Replacements, Structural Renewals and Associated Works (2020)
Infrastructure Replacements $1,932 Q4 2022 Richmond Courthouse - Mechanical Components Replacements, Envelope Renewals, Electrical Replacements, Structural Renewals and Associated Works (2019)
63 Lawn Bowling Club Replacement (2018)
Replacement of Clubhouse $5,300 Q1 2023
FIN – 61
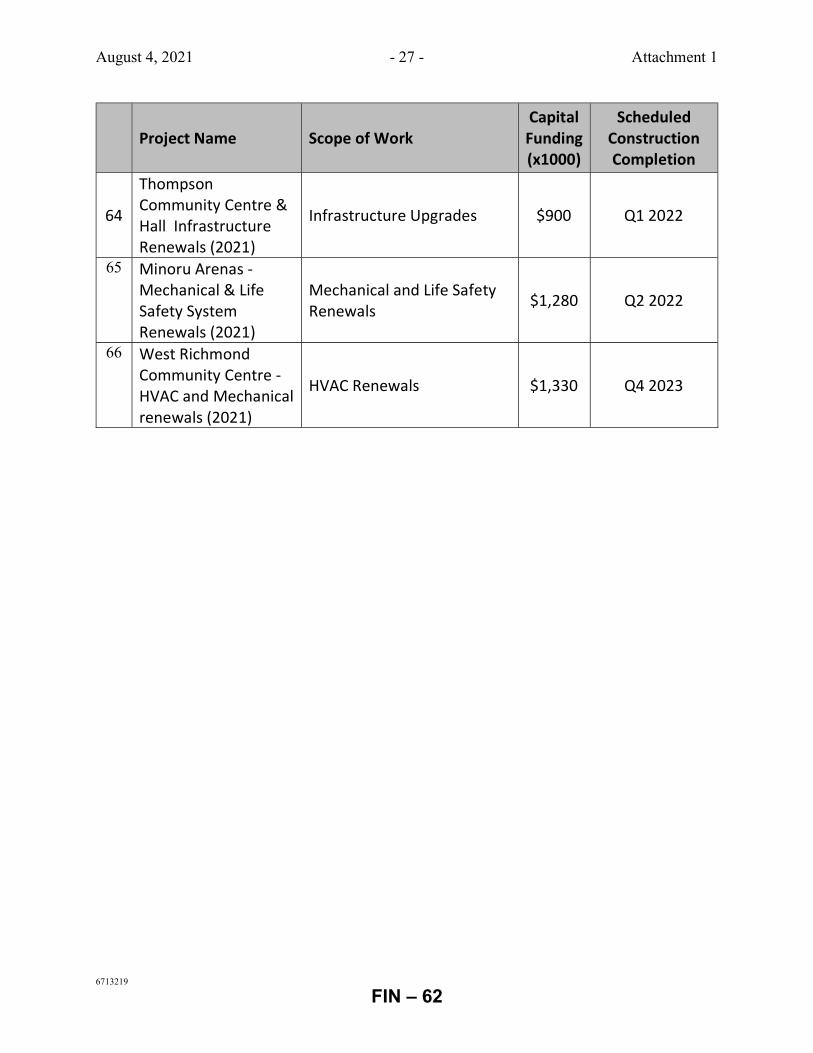
August 4, 2021 - 27 - Attachment 1
6713219
Project Name Scope of Work Capital Funding (x1000)
Scheduled Construction Completion
64
Thompson Community Centre & Hall Infrastructure Renewals (2021)
Infrastructure Upgrades $900 Q1 2022
65 Minoru Arenas - Mechanical & Life Safety System Renewals (2021)
Mechanical and Life Safety Renewals
$1,280 Q2 2022
66 West Richmond Community Centre - HVAC and Mechanical renewals (2021)
HVAC Renewals $1,330 Q4 2023
FIN – 62
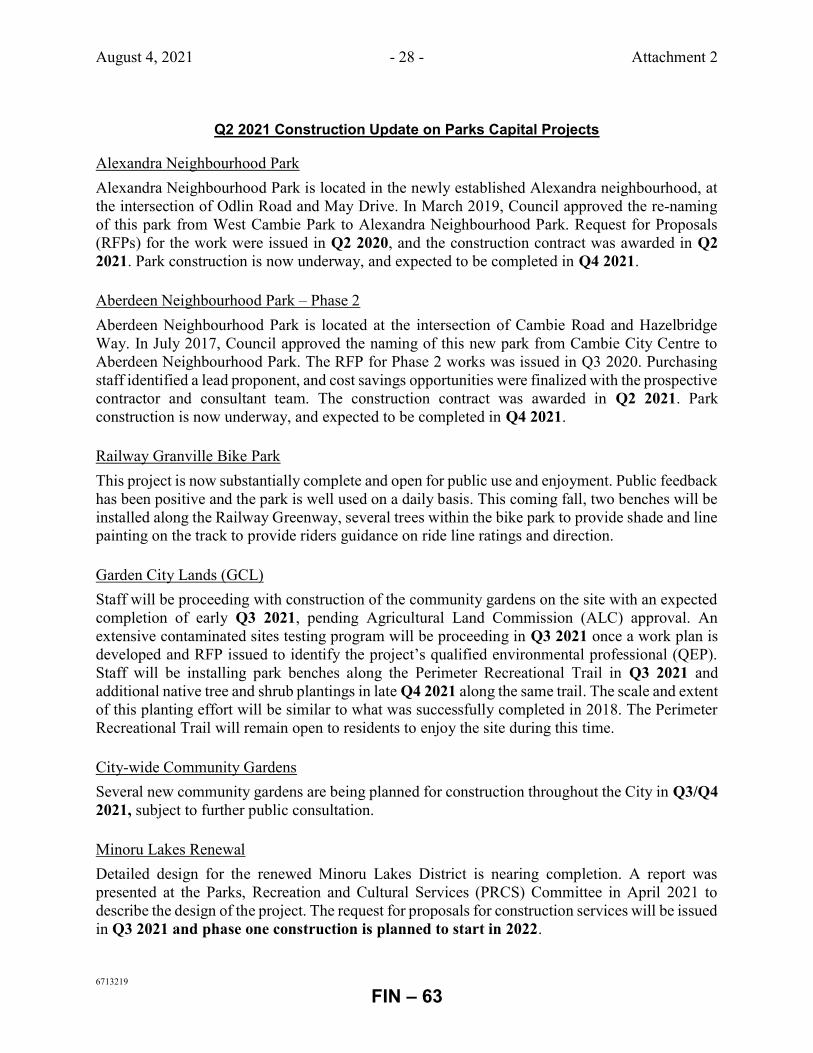
August 4, 2021 - 28 - Attachment 2
6713219
Q2 2021 Construction Update on Parks Capital Projects
Alexandra Neighbourhood Park
Alexandra Neighbourhood Park is located in the newly established Alexandra neighbourhood, at the intersection of Odlin Road and May Drive. In March 2019, Council approved the re-naming of this park from West Cambie Park to Alexandra Neighbourhood Park. Request for Proposals (RFPs) for the work were issued in Q2 2020, and the construction contract was awarded in Q2 2021. Park construction is now underway, and expected to be completed in Q4 2021. Aberdeen Neighbourhood Park – Phase 2
Aberdeen Neighbourhood Park is located at the intersection of Cambie Road and Hazelbridge Way. In July 2017, Council approved the naming of this new park from Cambie City Centre to Aberdeen Neighbourhood Park. The RFP for Phase 2 works was issued in Q3 2020. Purchasing staff identified a lead proponent, and cost savings opportunities were finalized with the prospective contractor and consultant team. The construction contract was awarded in Q2 2021. Park construction is now underway, and expected to be completed in Q4 2021. Railway Granville Bike Park
This project is now substantially complete and open for public use and enjoyment. Public feedback has been positive and the park is well used on a daily basis. This coming fall, two benches will be installed along the Railway Greenway, several trees within the bike park to provide shade and line painting on the track to provide riders guidance on ride line ratings and direction. Garden City Lands (GCL)
Staff will be proceeding with construction of the community gardens on the site with an expected completion of early Q3 2021, pending Agricultural Land Commission (ALC) approval. An extensive contaminated sites testing program will be proceeding in Q3 2021 once a work plan is developed and RFP issued to identify the project’s qualified environmental professional (QEP). Staff will be installing park benches along the Perimeter Recreational Trail in Q3 2021 and additional native tree and shrub plantings in late Q4 2021 along the same trail. The scale and extent of this planting effort will be similar to what was successfully completed in 2018. The Perimeter Recreational Trail will remain open to residents to enjoy the site during this time. City-wide Community Gardens
Several new community gardens are being planned for construction throughout the City in Q3/Q4 2021, subject to further public consultation. Minoru Lakes Renewal
Detailed design for the renewed Minoru Lakes District is nearing completion. A report was presented at the Parks, Recreation and Cultural Services (PRCS) Committee in April 2021 to describe the design of the project. The request for proposals for construction services will be issued in Q3 2021 and phase one construction is planned to start in 2022.
FIN – 63
August 4, 2021 - 29 - Attachment 2
6713219
Safety and Environmental Enhancements to Richmond High Turf Field Warranty
Replacement of the artificial turf field was completed in 2016, however due to product defects, the vendor will be replacing the synthetic turf under warranty at no cost to the City. Staff have identified opportunities to improve the safety, performance and play experience of the field. Construction has begun near end of Q2 2021, and is expected to be completed in Q3 2021. King George Park – Artificial Turf Field Replacement
Synthetic sports fields generally last 8 to 12 years depending on the usage and the maintenance of the fields. Installed in 2008, the King George field is at the end of its expected lifespan and is failing to meet minimum operating safety standards for shock attenuation (e.g. risk of injury). The RFP process has been completed and the contract has been awarded. This project is anticipated to start in Q3 2021. King George Community Park – Gathering Area
The construction phases of the social gathering area was completed in Q2 2021. Remaining works are scheduled for fall 2021. These works include tree planting, native shrub planting in bioretention areas, and temporary irrigation for plant establishment. The new gathering area features a community stage, a large harvest table, and additional site furnishings reflective of public feedback gathered as part of the King George Community Park Master Plan. Lang Park Redevelopment Plan – Phase 3 Completion
The current construction phase of the Lang Park Redevelopment Plan includes an overhead shelter, table tennis tables and a community book exchange kiosk as part of the approved park program to address the needs of the community. The table tennis table installations and book exchange kiosk were completed in Q1 2021 and fabrication of the overhead shelter is underway and expected to be completed near end of Q3 2021. Dog Park Upgrades
The existing Steveston Dogs Off-Leash Area is slated to be upgraded in 2021. Upgrades are expected to include improved surfacing, play features, tree planting, site furnishings, and a drinking fountain. Detailed design is anticipated to begin in Q3 2021. The Gardens Agricultural Park
Rehabilitation of the existing park features is ongoing, including pathways, a bridge, planting and site furnishings. The southern part of the park is open to the public with the northern section under final planning and detailed design. Full implementation of the approved park concept is currently on hold due to the potential impacts of the George Massey Tunnel project.
FIN – 64
August 4, 2021 - 30 - Attachment 2
6713219
London/Steveston Neighbourhood Park
London/Steveston Neighbourhood Park enhancements are being implemented in phases. The first phase was completed in 2018 and included greenway connections to No. 2 Road. The second phase, completed in 2019, included a pathway loop, trees, landforms, and stormwater detention ponds. The third phase of the project includes a playground, half-court basketball plaza and park shelter. Construction of the playground was completed in July 2020 and the half-court basketball plaza was completed in December 2020. The park shelter was installed in February 2021. The fourth and final phase of enhancements include an off-leash dog park. The off-leash area will include a variety of surface treatments, fencing, play elements, tree planting, and site furnishings. Detailed design is anticipated to begin in Q3 2021. Hollybridge Pier/Middle Arm
This project is the continuation of the Oval West waterfront development as part of the Middle Arm waterfront with a new public pier at the end of Hollybridge Way. The project has been delayed as the City has received a final decision letter from the Ministry of Forest, Lands, Natural Resources Operations and Rural Development (FLNRORD), stating that the City’s application to construct a public pier has been rejected in March 2021. A report is being prepared for the redesign process of a structure that does not require Crown Provincial’s water lot. South Arm Community Park Renewal
South Arm Community Park Renewal includes enhanced trail connections, a plaza with park shelter, expanded picnic areas, new furnishings and shade trees. Detailed design is currently underway with the playground improvement project, with construction anticipated to start after playground construction to be completed in 2022. Playground Improvement and Replacement
South Arm Community Park Playground – The request for proposals will be issued to market near end of Q3 2021. Construction is expected to start in spring 2022.
Talmey Neighbourhood School Park and Garnet Tot Lot Playgrounds – Construction on both playgrounds has been completed in Q2 2021.
Steveston Community Park Playground Renewal – A staff report on the Steveston Community Park Playground Next Steps received Council support in Q1 2021. Preparation for a request for proposals for detailed design and costing services is underway and targeted to be issued in Q3 2021.
Odlin Park Playground – Procurement and detailed design has been completed and the playground improvement project is scheduled for construction in Q3 2021.
Parks Aging Infrastructure
South Arm Park Basketball Courts – improvements were completed in Q1 2021 through replacement of the existing basketball hoops and backboards. Sport surfacing replacement of the courts started on the first week of July and expected completion by August 2021.
FIN – 65
August 4, 2021 - 31 - Attachment 2
6713219
No. 2 Road Pier – A Structural Conditional Assessment was completed in August 2018. Phase 1 repairs to the pile foundation were completed in July 2020. Replacement of the perimeter rail fence was completed in November 2020. Planning for Phase 2 of the pile foundation replacement is now anticipated for 2022-2023. A capital submission will be submitted for consideration in the future year’s budget process.
No. 3 Road Pier – A conditional assessment of the pier was completed in March 2021. Minor repairs to the piled foundation is scheduled to start in fall of 2021.
Gibbons Park – Installation of storm drainage onto the field is scheduled to start in fall 2021.
Thompson Burnett Tennis Courts – In May 2021, repairs to cracks on the courts and resurfacing of play areas was completed.
Parks General Development
London Heritage Farm – The implementation of the Master Plan has started in Q2 2021 following Council approval of the plan in Q1 2021. Works started include upgrades to the irrigation system, a new lavender garden, and site preparation for further works scheduled for Q3 2021, including renovations to an existing chicken run and upgrades to a bee apiary.
Richmond Nature Park – Upgrades to the bird feeding stations were performed with realigned fence sections and new bases for the posts. These works reduce maintenance issues for the stations by levelling the surfaces for easier cleaning and sweeping.
Thompson Burnett School Park – New pathway alignments were installed in Q2 2021 to improve pedestrian circulation throughout the site.
Parks Identity Signage Program
This project consists of the design and fabrication of various Park and Open Space signage including wayfinding and identity signs. Completed sites for the signage include various neighbourhood park locations in the Thompson area, e.g., Brighouse, Dover, Gibbons, Thompson, McCallan, Terra Nova School, Terra Nova South and Quilchena. Fabrication and installation of new bases and signs is currently underway for 10 locations in the west zone, between Granville and Francis Road.
FIN – 66
City of Richmond
To: Finance Committee
From: John Irving, P.Eng., MPA General Manager, Engineering and Public Works Chief Executive Officer, Lulu Island Energy Company
Jerry Chong, CPA, CA Acting General Manager, Finance Chief Financial Officer, Lulu Island Energy Company
Report to Committee
Date: August 10, 2021
File: 01-0060-20-LIEC1/2021-Vol 01
Re: Lulu Island Energy Company - 2nd Quarter June 30, 2021 Financial Information
Staff Recommendation
That the Lulu Island Energy Company report titled "Lulu Island Energy Company - 2nd Quarter June 30, 2021 Financial Information", dated August 10, 2021 from the Chief Executive Officer and Chief Financial Officer, be received for information.
John Irving, P.Eng., MPA General Manager, Engineering and Public Works & Chief Executive Officer, Lulu Island Energy Company (604-276-4140)
6726602
Jerry Chong, CPA, CA Acting General Manager, Finance & Chief Financial Officer, Lulu Island Energy Company (604-276-4064)
REPORT CONCURRENCE
FIN – 67
July 13, 2021 - 2 -
Report
DATE:
TO:
FROM:
July 13, 2021
Board of Directors
Jerry Chong, CPA, CA, Chief Financial Officer
A Lulu lsland V ENERGY COMPANY
6911 NO. 3 ROAD RICHMOND, BC V6Y 2C1
Re: Lulu Island Energy Company - 2021 2nd Quarter Financial Information
Staff Recommendation
That the 2nd Quarter Financial Information as presented in the repmi titled "Lulu Island Energy Company- 2021 2nd Quarter Financial Infonnation" dated July 13, 2021 be approved.
Background
Lulu Island Energy Company (LIEC), a corporation wholly-owned by the City of Richmond, was established to provide district energy services on behalf of the City. This report is prepared with the objective to provide pre-audited financial information to the Board of Directors and LIEC's shareholder, represented by Richmond City Council.
Analysis
The financial statements have been prepared in accordance with International Financial Reporting Standards (IFRS). LIEC's pre-audited Q2 financial information consists of the interim statement of the financial position as of June 30, 2021 (Attachment 1) and the interim income statement for the period ended June 30, 2021 (Attachment 2).
Financial Position
The interim statement of the financial position provides a summary of assets, liabilities and shareholder's equity. Total assets are comprised of current assets ( cash, investments and receivables) $15,892,773 and non-current assets (plant and equipment) $38,400,609. The total assets are $54,293,382. The total liabilities of $20,705,071 include outstanding invoices, deferred contributions and concession liabilities. The shareholder's equity represents the net worth of the company. It is equal to the total assets minus its total liabilities and measures the company's financial health. As of June 30, 2020, LIEC's shareholder equity is $33,588,311, showing good financial health of the company. Year-to-date budget to actual numbers are shown in Attachment 3.
6726602 FIN – 68
July 13, 2021 - 3 -
Revenues
The metered billing revenue is the total energy sales of both ADEU and OVDEU service areas. The year to date metered billings revenue is $1,314,894 from the Alexandra District Energy Utility (ADEU) and $1,342,687 from the Oval Village District Energy Utility (OVDEU). Overall, the first six months of metered billing revenue of $2,657,581 increased by 20% over 2020. This reflects the addition of two new building connections, increased energy use from customers due to increased occupancy, and the approved annual increase for the 2021 rates. The year-to-date metered billings revenue is in line with the budget.
Cost of Sales
The cost of sales is the accumulated total of expenses attributable to the metered billing revenue, which includes contract services, utilities ( electricity and natural gas), and amortization expenses. The contract expense increased by 9% over 2020 with more buildings being serviced, resulting in additional operations and maintenance work. The growth in energy demand, due to the addition of more buildings, resulted in an increased use of electricity and natural gas to run distribution pumps, geo-exchange heat pumps, auxiliary equipment and boilers which are used to deliver energy to customers' buildings. This increased demand paired with electricity and gas rate increases caused the utility expense to rise by 23% compared to 2020. The amortization expense increased due to capital asset additions. The year-over-year cost of sales has increased by 17%.
General and Administration Expenses
The general and administration (G&A) expenses are expenditures that LIEC incurs to engage in operating activities which include salaries and benefits, administration expenses, professional fees, etc. Salaries and benefits increased by 12% compared to Q2 2020 due to the alignment with the Administration Procedure 3001.01 in order to fairly reimburse the City for administrative and operational time that City management staff members incur while conducting LIEC business, however, salaries and benefits are in line with budget. The administration expense includes the overhead allocation paid to the City of Richmond for the day-to-day support that LIEC receives from City staff. Insurance expense increased due to the general insurance rate increase and additional DEU assets being insured. The professional fees increased compared to 2020 due to additional costs as a result of the delayed completion of the year end third party audit. Overall, the G&A expenses as a percentage ofrevenues are at 17%, which is in line with last year's Q2 results.
Contributions and Financing
The contributions and financing expense section represents other sources of income and costs for the business. The current energy modeling review fee revenues are higher than 2020's due to larger than anticipated building permit reviews. The net finance cost is the result of year-to-date finance costs on concession liabilities, offset by interest income. The net finance cost is higher than 2020 mainly due to the increase in the concession liability and the reduction in investment income due to low interest rates. The additional capital expenditure for OVDEU infrastructure has resulted in a higher balance of concession liability than the prior year.
6726602 FIN – 69
July 13, 2021 - 4 -
LIEC's EBITA (earnings before interest, tax, and amortization), used as a proxy to measure the company's financial performance, increased by 20% compared to the first six months of 2020. Q2 EBIT A as a percentage ofrevenue is at 59% for 2021 and was 57% in 2020.
The year-to-date net income of $851,810 has exceeded the budget by 19%, though, the net income as a percentage of revenue decreased to 27% for 2021 compared to 30% in 2020. Consistent with the company's financial plan objectives, any net income will be maintained in LIEC's equity in order to fund future capital projects and infrastructure replacements.
Financial Impact
None.
Conclusion
The pre-audited financial information shows that LIEC's financial position is positive.
Owen Sinclair Budget and Training Coordinator
Attachment 1: Interim Statement of Financial Position as at June 30, 2021 (unaudited) Attachment 2: Interim Income Statement for the period end June 30, 2021 (unaudited) Attachment 3: Year-To-Date Budget vs. Actual Comparison (unaudited)
6726602 FIN – 70
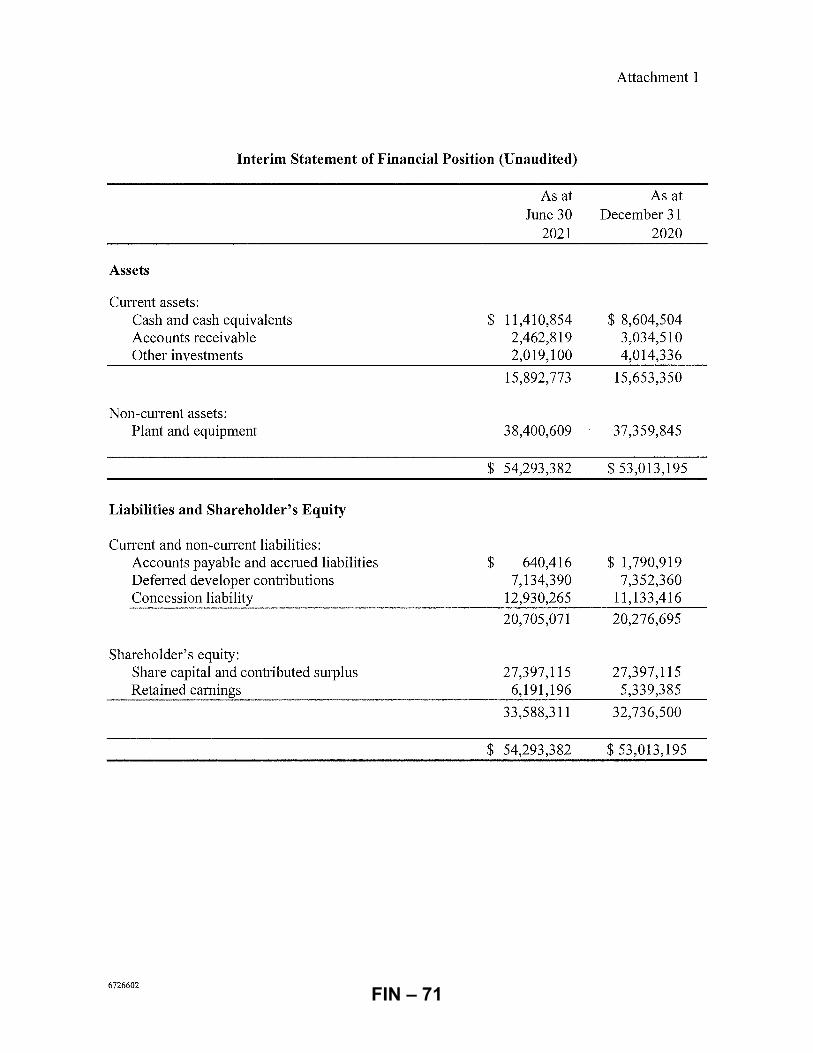
Attachment 1
Interim Statement of Financial Position (Unaudited)
As at As at June 30 December 31
2021 2020
Assets
Cun-ent assets: Cash and cash equivalents $ 11,410,854 $ 8,604,504 Accounts receivable 2,462,819 3,034,510 Other investments 2,019,100 4,014,336
15,892,773 15,653,350
Non-current assets: Plant and equipment 38,400,609 37,359,845
$ 54,293,382 $ 53,013,195
Liabilities and Shareholder's Equity
Current and non-cun-ent liabilities: Accounts payable and accrued liabilities $ 640,416 $ 1,790,919 Defen-ed developer contributions 7,134,390 7,352,360 Concession liability 12,930,265 11,133,416
20,705,071 20,276,695
Shareholder's equity: Share capital and contributed surplus 27,397,115 27,397,115 Retained earnings 6,191,196 5,339,385
33,588,311 32,736,500
$ 54,293,382 $ 53,013,195
6726602 FIN – 71
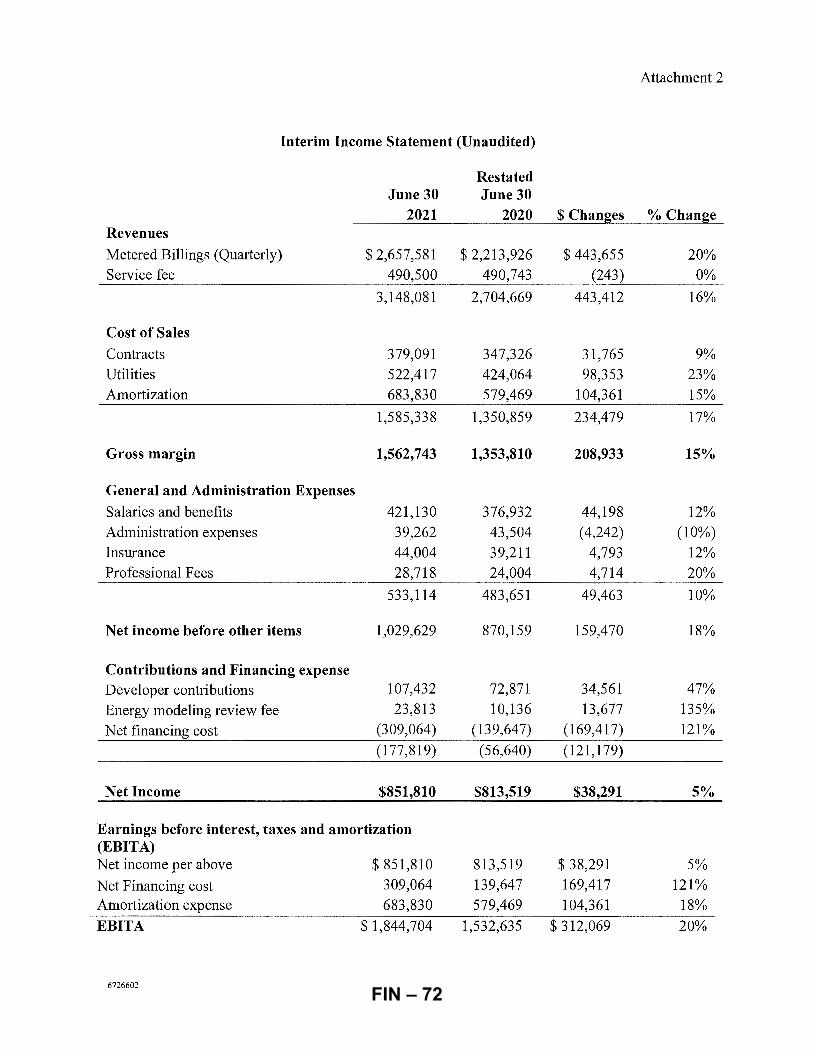
Attachment 2
Interim Income Statement (Unaudited)
Restated June 30 June 30
2021 2020 $ Changes % Change Revenues
Metered Billings (Quarterly) $2,657,581 $2,213,926 $443,655 20% Service fee 490,500 490,743 (243) 0%
3,148,081 2,704,669 443,412 16%
Cost of Sales
Contracts 379,091 347,326 31,765 9% Utilities 522,417 424,064 98,353 23% Amortization 683,830 579,469 104,361 15%
1,585,338 1,350,859 234,479 17%
Gross margin 1,562,743 1,353,810 208,933 15%
General and Administration Expenses
Salaries and benefits 421,130 376,932 44,198 12% Administration expenses 39,262 43,504 (4,242) (10%) Insurance 44,004 39,211 4,793 12% Professional Fees 28,718 24,004 4,714 20%
533,114 483,651 49,463 10%
Net income before other items 1,029,629 870,159 159,470 18%
Contributions and Financing expense Developer contributions 107,432 72,871 34,561 47%
Energy modeling review fee 23,813 10,136 13,677 135%
Net financing cost (309,064) (139,647) (169,417) 121%
(177,819) (56,640) (121,179)
Net Income $851,810 $813,519 $38,291 5%
Earnings before interest, taxes and amortization (EBITA) Net income per above $ 851,810 813,519 $ 38,291 5%
Net Financing cost 309,064 139,647 169,417 121% Amortization expense 683,830 579,469 104,361 18%
EBITA $1,844,704 1,532,635 $ 312,069 20%
6726602 FIN – 72
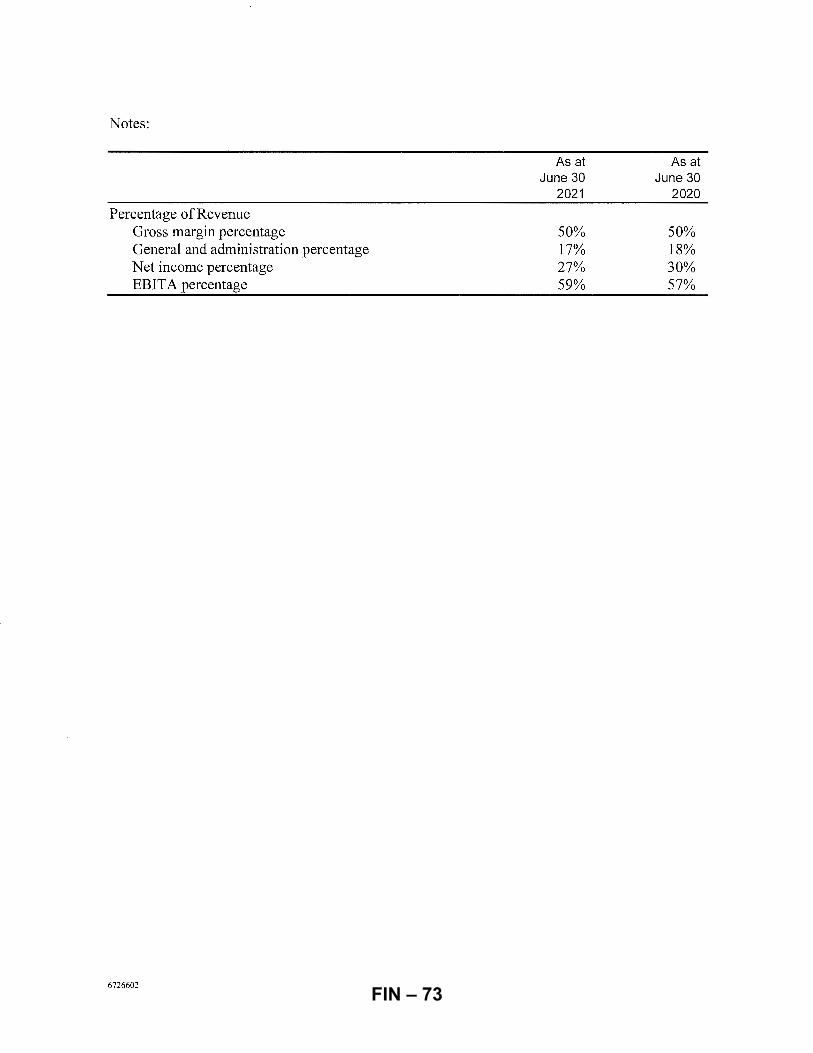
Notes:
Percentage of Revenue Gross margin percentage General and administration percentage Net income percentage EBITA percentage
6726602
As at June 30
2021
50% 17% 27% 59%
As at June 30
2020
50% 18% 30% 57%
FIN – 73
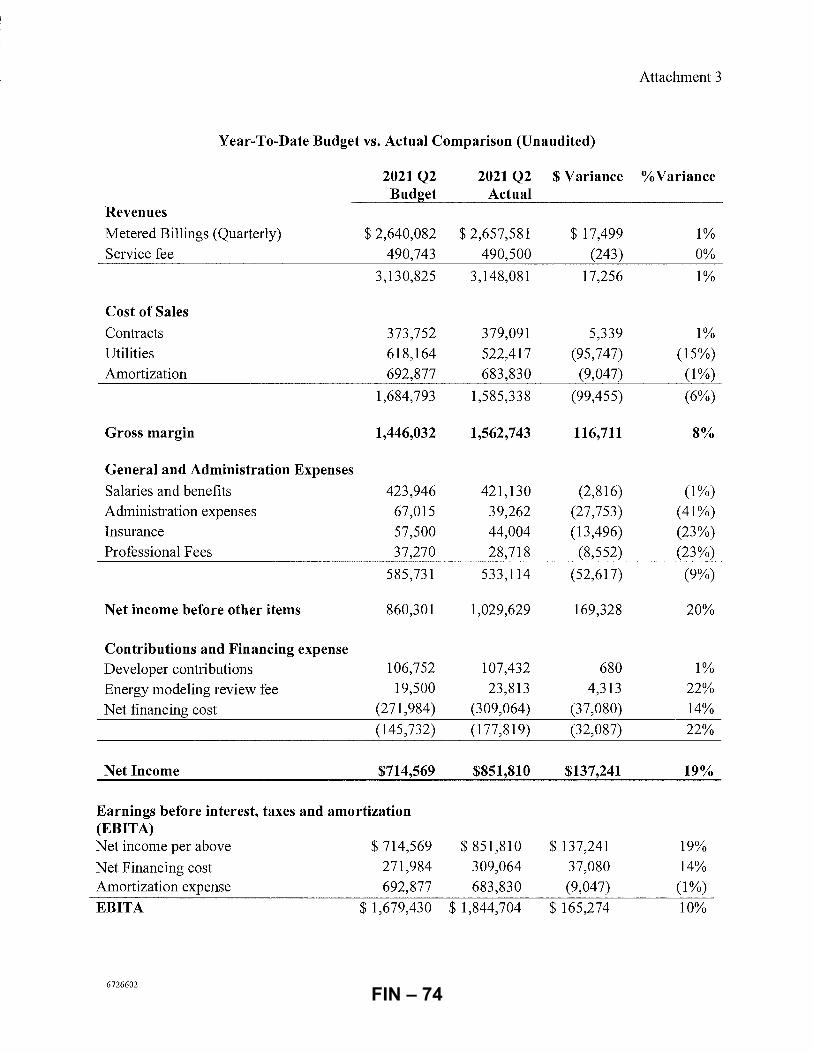
Attachment 3
Year-To-Date Budget vs. Actual Comparison (Unaudited)
2021 Q2 2021 Q2 $ Variance % Variance Budget Actual
Revenues
Metered Billings (Quarterly) $2,640,082 $2,657,581 $ 17,499 1% Service fee 490,743 490,500 (243) 0%
3,130,825 3,148,081 17,256 1%
Cost of Sales
Contracts 373,752 379,091 5,339 1% Utilities 618,164 522,417 (95,747) (15%) Amortization 692,877 683,830 (9,047) (1%)
1,684,793 1,585,338 (99,455) (6%)
Gross margin 1,446,032 1,562,743 116,711 8%
General and Administration Expenses
Salaries and benefits 423,946 421,130 (2,816) (1%) Administration expenses 67,015 39,262 (27,753) (41%) Insurance 57,500 44,004 (13,496) (23%) Professional Fees 37,270 28,718 (8,552) (23%)
585,731 533,114 (52,617) (9%)
Net income before other items 860,301 1,029,629 169,328 20%
Contributions and Financing expense Developer contributions 106,752 107,432 680 1%
Energy modeling review fee 19,500 23,813 4,313 22%
Net financing cost (271,984) (309,064) (37,080) 14%
(145,732) (177,819) (32,087) 22%
Net Income $714,569 $851,810 $137,241 19%
Earnings before interest, taxes and amortization (EBITA) Net income per above $ 714,569 $ 851,810 $ 137,241 19%
Net Financing cost 271,984 309,064 37,080 14% Amortization expense 692,877 683,830 (9,047) (1%)
EBITA $ 1,679,430 $ 1,844,704 $ 165,274 10%
6726602 FIN – 74
To:
From:
City of Richmond
Finance Committee
George Duncan Chief Administrative Officer & President and CEO Richmond Olympic Oval
Jerry Chong
Report to Committee
Date: August 26, 2021
File:
Acting General Manager, Finance and Corporate Services & Chief Financial Officer, Richmond Olympic Oval
Re: Richmond Olympic Oval Corporation - 2nd Quarter 2021 Financial Information
Staff Recommendation
That the report on Financial Information for the Richmond Olympic Oval Corporation for the second quarter ended June 30, 2021 from the Director, Finance of the Richmond Olympic Oval Corporation be received for information.
George Duncan Chief Administrative Officer & President and CEO Richmond Olympic Oval
6730969
Jeny Chong Acting General Manager, Finance and Corporate Services & Chief Financial Officer, Richmond Olympic Oval
FIN – 75
.!~, RICHMOND OLYMPIC OVAL Report
DATE: August 19, 2021
TO: George Duncan
Chief Executive Officer, Richmond Olympic Oval Corporation
Jerry Chong
Chief Financial Officer, Richmond Olympic Oval Corporation
FROM: Rick Dusanj, CPA, CA
Director, Finance, Richmond Olympic Oval Corporation
Re: Richmond Olympic Oval Corporation - 2nd Quarter 2021 Financial information
Origin
This staff report addresses the second quarter financial results for the 3 months ended June 30, 2021 · ("Q2") which was endorsed by the Corporation's Board of Directors.
Highlights
During Q2 the Corporation continued its gradual restoration of services approach to the COVID-19
pandemic. With safety and community health as our guiding principles, the Corporation remained agile and continued to make operational adjustments to adhere to evolving provincial health orders and province
wide restrictions. Below are some of the highlights of the activities undertaken by the Corporation during
Q2.
Community Use
Q2 of 2021 marked continued changes to the Provincial Health Order, and the announcement of the 4-step
Restart Plan for British Columbia. In alignment with the move to Steps 1 and 2 of the Restart Plan, the Oval
began to offer outdoor group fitness classes and modified indoor group fitness classes respectively. By the
end of Q2, the Oval offered 23 weekly group fitness classes. Personal training services continued to
increase to pre-pandemic levels with a high of 122 sessions in a bi-weekly period. For those unable or not yet ready to return to activities in-facility, the Oval continued to provide virtual group fitness classes on
social media, garnering over 14,000 views across 40 live streams.
In Q2, numerous community groups utilized the Oval to provide programs and services to young children
through to and including actively aging seniors. These programs and services include the following sports:
basketball, karate, gymnastics, soccer, hockey, figure skating, speed skating, aikido, sport climbing and volleyball.
Page 1 of 5
FIN – 76
In accordance with the Richmond Oval Agreement between the City of Richmond ("City") and the Corporation, the funding that is received from the City on an annual basis is required for the Corporation to
fulfill the operating objectives which include the Corporation providing facilities, programs and services for
quality sport, fitness, recreational uses and wellness services for the Richmond community, neighbouring communities and the general public. Without the Oval and the annual contribution from the City, these
facilities, programs and services would have to be provided elsewhere.
Sport Development and Events
Due to COVID-19 and the restrictions outlined in the Provincial Health Order, events scheduled to take
place in Q2 at the Oval have been limited, altered or postponed. The postponed events were rescheduled for 2022 and 2023. Some of the future new events secured in Q2 by Events and Sport Hosting include:
Futbol de Salon, City Shred, Boccia Provincials, and the Western Canadian Powerlifting Championship.
Throughout Q2, the Oval's climbing wall proved to be an important training facility for Canada's sport
climbing athletes training as they prepared for the Tokyo 2020 Summer Games ("the Games"). Additionally,
CBC The National profiled Alannah Yip and Sean McColl training at the Richmond Olympic Oval on April 28th
in advance of their debut at the Games.
Athletes from Field Hockey Canada, Wheelchair Rugby Canada, Wheelchair Basketball Canada and Climbing Escalade Canada utilized the Oval's facilities and services during Q2 as a part of their preparations for the
Games. Additionally, the Oval hosted a mock competition on June 5th for Alannah Yip and Sean McColl of
Climbing Escalade Canada to prepare for the Games, in addition to future mock competitions planned for
early Q3.
Governance
Meetings of the Corporation's Audit & Finance Committee and the Board of Directors took place during
Q2.
Financial
For Q2, the Corporation continued to exceed conservative budget targets that were established during the pandemic. The actual surplus before amortization and transfers to reserves/equity for the 3 months ended
June 30, 2021 was $169,000 compared to a budgeted break-even amount, indicating a favorable variance of $169,000 (please see page 4 for the Corporation's balance sheet as of June 30, 2021 and page 5 for the
statement of operations).
Page 2 of 5
FIN – 77
Comments on the Financial Results for Q2
Revenues
The Q2 portion of the estimated 2021 Games Operating Trust Fund ("GOT") distribution of $931,000 was
recognized as revenue. Memberships, admissions and programs revenues were $986,000 in Q2 and other
revenue of $243,000 primarily pertained to sponsorship, space leasing, parking, and interest revenue.
Overall, revenues were $16,000 favorable to budget.
Expenses
Memberships, admissions and program services costs for Q2 2021 were $1,179,000, facility operations costs
were $968,000, marketing expenses were $119,000, and administration and finance expenses were $642,000. Overall, expenditures were $215,000 favorable to budget.
·P-t2· Rick Dusanj, CPA, CA Director, Finance, Richmond Olympic Oval Corporation
Page 3 of 5 FIN – 78
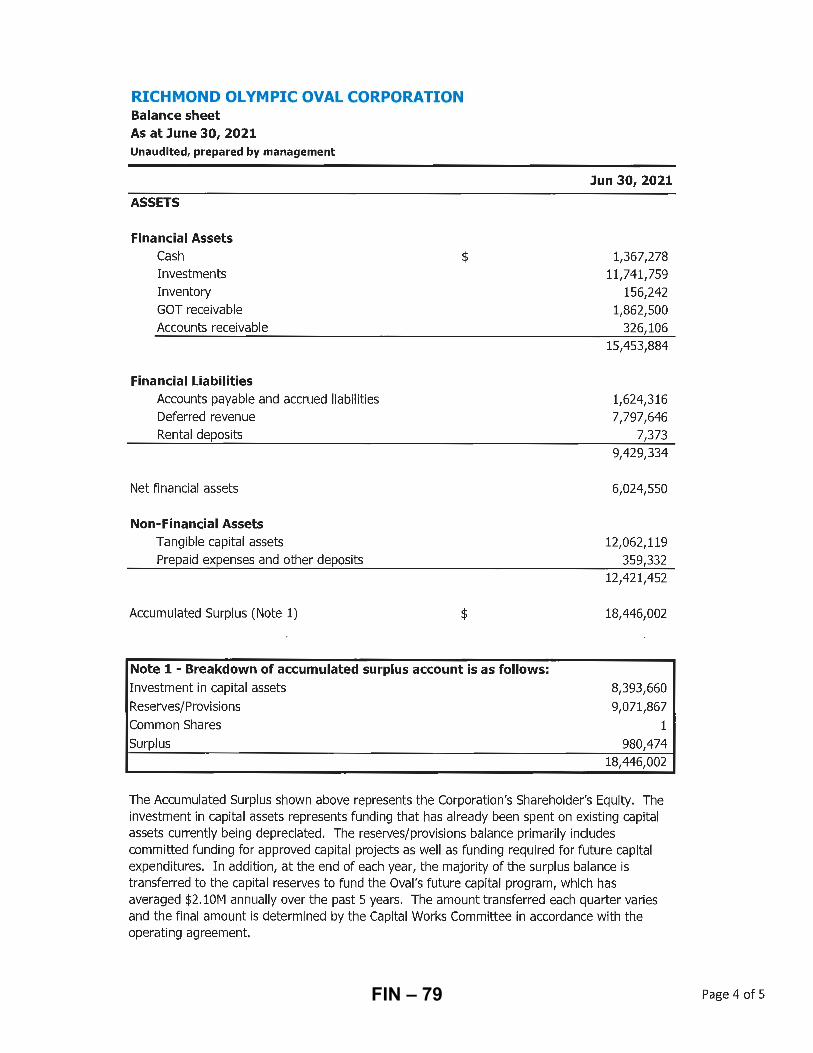
RICHMOND OLYMPIC OVAL CORPORATION Balance sheet As at June 30, 2021 Unaudited, prepared by management
ASSETS
Financial Assets Cash
Investments
Inventory
GOT receivable
Accounts receivable
Financial Liabilities Accounts payable and accrued liabilities
Deferred revenue
Rental deposits
Net financial assets
Non-Financial Assets Tangible capital assets
Prepaid expenses and other deposits
Accumulated Surplus (Note 1)
$
$
Note 1 - Breakdown of accumulated surplus account is as follows: Investment in capital assets
Reserves/Provisions
Common Shares
Surplus
Jun 30, 2021
1,367,278 11,741,759
156,242 1,862,500
326,106 15,453,884
1,624,316 7,797,646
7,373 9,429,334
6,024,550
12,062,119 359,332
12,421,452
18,446,002
8,393,660 9,071,867
1 980,474
18,446,002
The Accumulated Surplus shown above represents the Corporation's Shareholder's Equity. The investment in capital assets represents funding that has already been spent on existing capital assets currently being depreciated. The reserves/provisions balance primarily includes committed funding for approved capital projects as well as funding required for future capital expenditures. In addition, at the end of each year, the majority of the surplus balance is transferred to the capital reserves to fund the Oval's future capital program, which has averaged $2.lOM annually over the past 5 years. The amount transferred each quarter varies and the final amount is determined by the Capital Works Committee in accordance with the operating agreement.
Page 4 of 5 FIN – 79
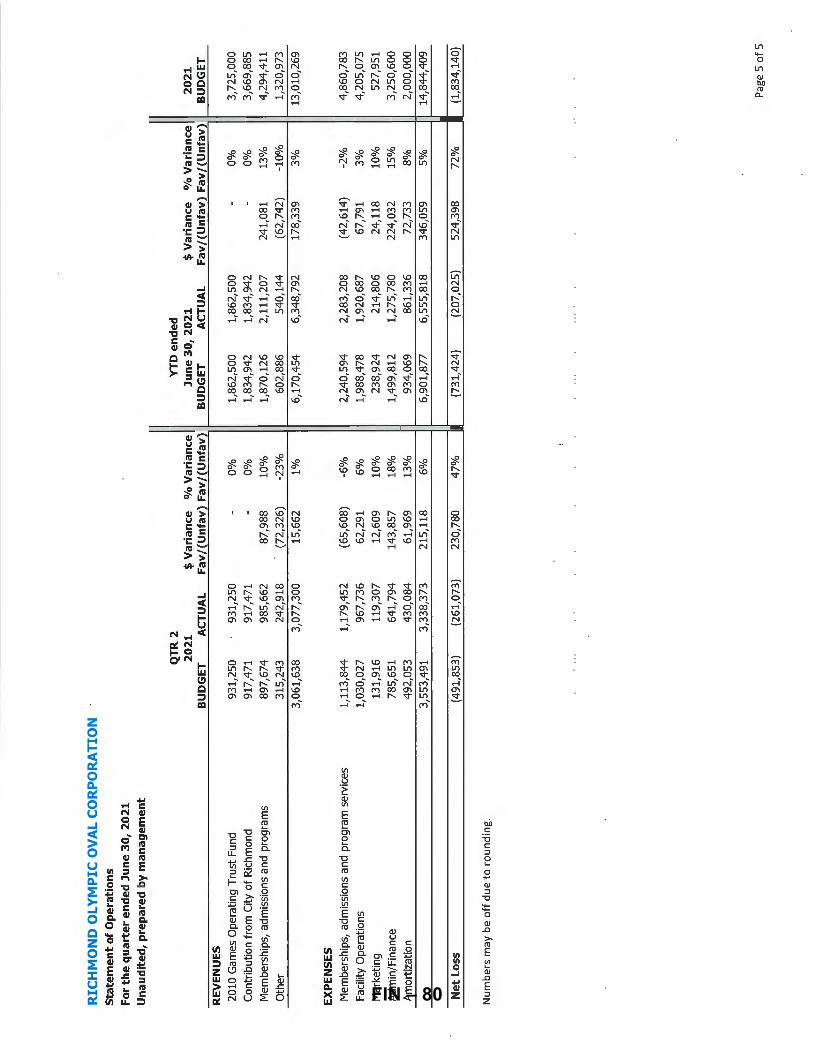
RIC
HM
ON
D O
LY
MPI
C O
VA
L C
OR
POR
AT
ION
S
tate
me
nt
of
Op
erat
ion
s F
or
the
qu
art
er
en
de
d J
un
e 3
0,
20
21
U
na
ud
ite
d,
pre
pa
red
by
ma
na
ge
me
nt
RE
VE
NU
ES
20
10 G
ames
Ope
rati
ng T
rust
Fun
d
Con
trib
utio
n fr
om C
ity o
f R
ichm
ond
Mem
bers
hips
, ad
mis
sion
s an
d pr
ogra
ms
Oth
er
EX
PE
NS
ES
M
embe
rshi
ps,
adm
issi
ons
and
prog
ram
ser
vice
s
Faci
lity
Ope
rati
ons
Mar
ketin
g
Adm
in/F
inan
ce
Am
ortiz
atio
n
Ne
t Lo
ss
Num
bers
may
be
off
du
e to
rou
ndin
g.
QT
R2
2
02
1
BU
DG
ET
A
CT
UA
L
931,
250
931,
250
917,
471
917,
471
897,
674
985,
662
315,
243
242,
918
3,06
1,63
8 3,
077,
300
1,11
3,84
4 1,
179,
452
1,03
0,02
7 96
7,73
6
131,
916
119,
307
785,
651
641,
794
492,
053
430,
084
3,55
3,49
1 3,
338,
373
(491
,853
) (2
61,0
73)
$ V
ari
an
ce
0/
o V
ari
an
ce
F
av /
(Un
fav
) F
av /
(Un
fav
)
-0%
-0%
87,9
88
10%
(72,
326)
-2
3%
15,6
62
1%
(65,
608)
-6
%
62,2
91
6%
12,6
09
10%
143,
857
18%
61,9
69
13%
215,
118
6%
230,
780
47%
YT
D e
nd
ed
Ju
ne
30
, 2
02
1
$ V
ari
an
ce
0/
o V
ari
an
ce
2
02
1 B
UD
GE
T
AC
TU
AL
F
av /
(Un
fav
) F
av / (
Un
fav
) B
UD
GE
T
1,86
2,50
0 1,
862,
500
-0%
3,
725,
000
1,83
4,94
2 1,
834,
942
-0%
3,
669,
885
1,87
0,12
6 2,
111,
207
241,
081
13%
4,
294,
411
602,
886
540,
144
(62,
742)
-1
0%
1,32
0,97
3
6,17
0,45
4 6,
348,
792
178,
339
3%
13
,010
,269
2,24
0,59
4 2,
283,
208
(42,
614)
-2
%
4,86
0,78
3
1,98
8,47
8 1,
920,
687
67,7
91
3%
4,
205,
075
238,
924
214,
806
24,1
18
10%
52
7,95
1
1,49
9,81
2 1,
275,
780
224,
032
15%
3,
250,
600
934,
069
861,
336
72,7
33
8%
2,00
0,00
0
6,90
1,87
7 6,
555,
818
346,
059
5%
14,8
44,4
09
{731
,424
) (2
07,0
25)
524,
398
72%
(1
,834
,140
) -
Pag
e 5
of 5
FIN – 80