Embed Size (px)
Citation preview
Agenda
FOCUSING ON VALUEZoran BogdanovicRegion Director
OVERVIEW OF STRATEGYDimitris LoisCEO
DRIVING VOLUME GROWTHKeith SandersRegion Director
Q&A
IMPROVING EFFICIENCYMichalis ImellosCFO
INVESTMENTS& CONCLUSION
COKE BREAK
GENERAL MANAGERS
1
Forward-looking statements
Unless otherwise indicated, this document and the financial and operating data or other information included herein relate to Coca-Cola HBC AG and its subsidiaries(“Coca-Cola HBC” or the “Company” or “we” or the “Group”).
This document contains forward-looking statements that involve risks and uncertainties. These statements may generally, but not always, be identified by the useof words such as “believe”, “outlook”, “guidance”, “intend”, “expect”, “anticipate”, “plan”, “target” and similar expressions to identify forward-looking statements.All statements other than statements of historical facts, including, among others, statements regarding our future financial position and results, our outlook for2016 and future years, business strategy and the effects of the global economic slowdown, the impact of the sovereign debt crisis, currency volatility, our recentacquisitions, and restructuring initiatives on our business and financial condition, our future dealings with The Coca-Cola Company, budgets, projected levels ofconsumption and production, projected raw material and other costs, estimates of capital expenditure, free cash flow, effective tax rates and plans and objectives ofmanagement for future operations, are forward-looking statements. You should not place undue reliance on such forward-looking statements. By their nature,forward-looking statements involve risk and uncertainty because they reflect our current expectations and assumptions as to future events and circumstances thatmay not prove accurate. Our actual results and events could differ materially from those anticipated in the forward-looking statements for many reasons, includingthe risks described in the 2015 Integrated Annual Report for Coca-Cola HBC AG and its subsidiaries.
Although we believe that, as of the date of this document, the expectations reflected in the forward-looking statements are reasonable, we cannot assure you thatour future results, level of activity, performance or achievements will meet these expectations. Moreover, neither we, nor our directors, employees, advisors nor anyother person assumes responsibility for the accuracy and completeness of the forward-looking statements. After the date of this document, unless we are requiredby law or the rules of the UK Financial Conduct Authority to update these forward-looking statements, we will not necessarily update any of these forward-lookingstatements to conform them either to actual results or to changes in our expectations.
In the United Kingdom, this Presentation and the information presented herein is only being distributed to and is only directed at persons that are (i) investmentprofessionals falling within Article 19(5) of the Financial Services and Markets Act 2000 (Financial Promotion) Order 2005 (the “Order”); or (ii) high net worth entities,and other persons to whom it may lawfully be communicated, falling within Article 49(2)(a) to (d) of the Order (all such persons together being “Relevant Persons”).Nothing in this Presentation constitutes investment advice and any recommendations that may be contained herein have not been based upon a consideration ofthe investment objectives, financial situation or particular needs of any specific recipient. If you have received this Presentation and you are not a Relevant Personyou must return it immediately to CCHBC.
Nothing in this presentation should be construed as a profit forecast. There is no certainty over timing or probability of achieving these targets and they aredependent on a variety of assumptions and factors, both Coca-Cola HBC AG specific and otherwise.
2 2
Overview of strategyDimitris LoisChief Executive Officer
3
Coca-Cola Hellenic
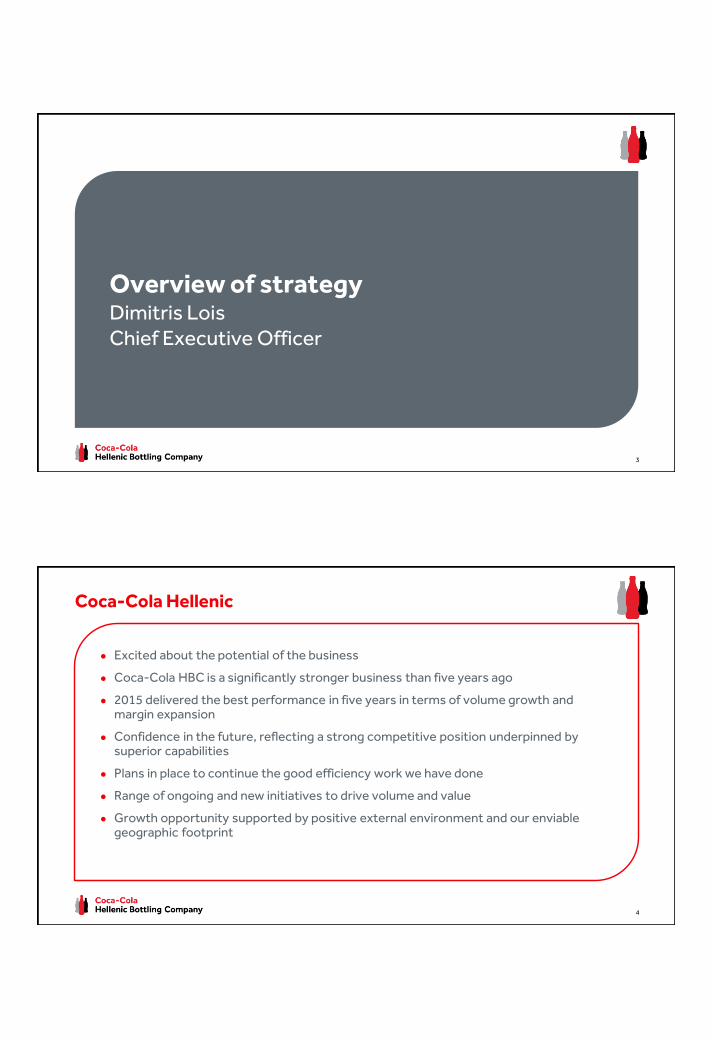
● Excited about the potential of the business
● Coca-Cola HBC is a significantly stronger business than five years ago
● 2015 delivered the best performance in five years in terms of volume growth and margin expansion
● Confidence in the future, reflecting a strong competitive position underpinned by superior capabilities
● Plans in place to continue the good efficiency work we have done
● Range of ongoing and new initiatives to drive volume and value
● Growth opportunity supported by positive external environment and our enviable geographic footprint
4
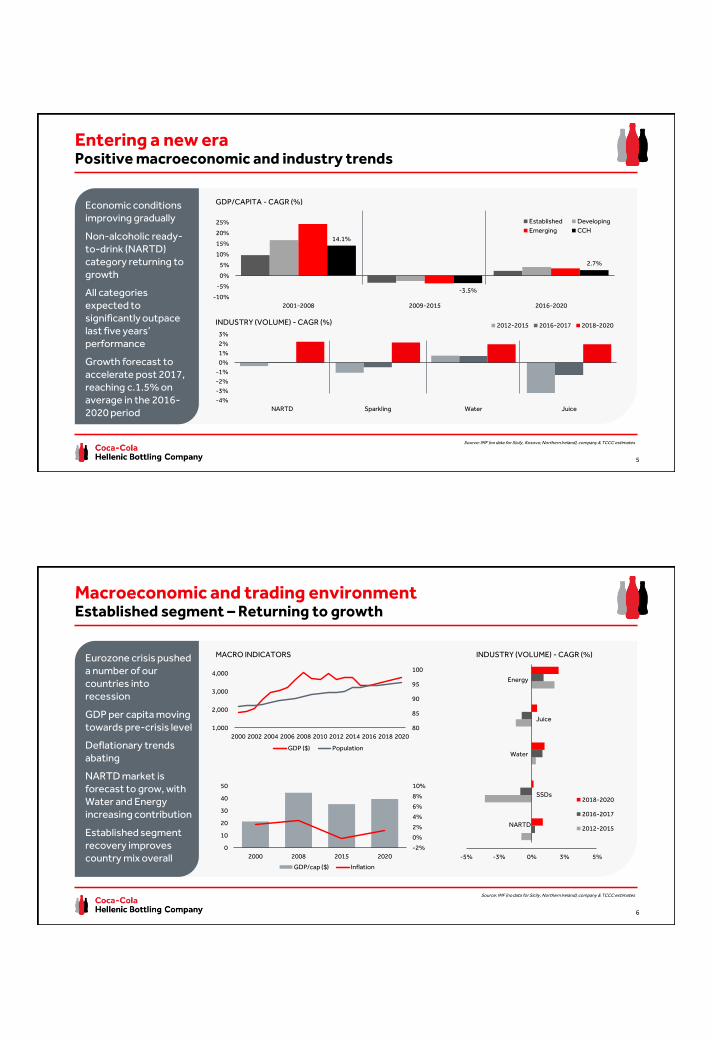
Entering a new eraPositive macroeconomic and industry trends
Economic conditions improving gradually
Non-alcoholic ready-to-drink (NARTD) category returning to growth
All categories expected to significantly outpace last five years’ performance
Growth forecast to accelerate post 2017, reaching c.1.5% on average in the 2016-2020 period
14.1%
-3.5%
2.7%
-10%
-5%
0%
5%
10%
15%
20%
25%
2001-2008 2009-2015 2016-2020
Established Developing
Emerging CCH
GDP/CAPITA - CAGR (%)
INDUSTRY (VOLUME) - CAGR (%)
-4%
-3%
-2%
-1%
0%
1%
2%
3%
NARTD Sparkling Water Juice
2012-2015 2016-2017 2018-2020
5
Source: IMF (no data for Sicily, Kosovo, Northern Ireland), company & TCCC estimates
Macroeconomic and trading environmentEstablished segment – Returning to growth
Eurozone crisis pushed a number of our countries into recession
GDP per capita moving towards pre-crisis level
Deflationary trends abating
NARTD market is forecast to grow, with Water and Energy increasing contribution
Established segment recovery improves country mix overall
MACRO INDICATORS
80
85
90
95
100
1,000
2,000
3,000
4,000
2000 2002 2004 2006 2008 2010 2012 2014 2016 2018 2020
GDP ($) Population
-2%
0%
2%
4%
6%
8%
10%
0
10
20
30
40
50
2000 2008 2015 2020
GDP/cap ($) Inflation
-5% -3% 0% 3% 5%
2018-2020
2016-2017
2012-2015
INDUSTRY (VOLUME) - CAGR (%)
Energy
Juice
Water
SSDs
NARTD
6
Source: IMF (no data for Sicily, Northern Ireland), company & TCCC estimates
-2%
0%
2%
4%
6%
8%
10%
0
5
10
15
20
2000 2008 2015 2020
GDP/cap ($) Inflation
70
75
80
85
90
300
500
700
900
1,100
1,300
1,500
2000 2002 2004 2006 2008 2010 2012 2014 2016 2018 2020
GDP ($) Population
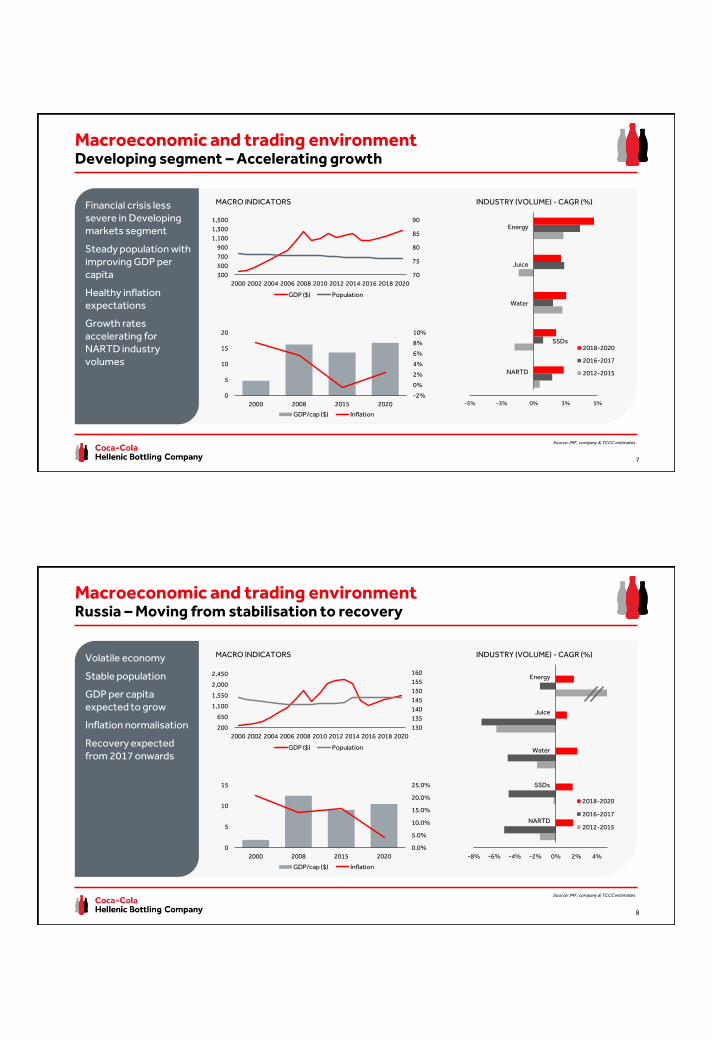
Macroeconomic and trading environmentDeveloping segment – Accelerating growth
Financial crisis less severe in Developing markets segment
Steady population with improving GDP per capita
Healthy inflation expectations
Growth rates accelerating for NARTD industry volumes
MACRO INDICATORS INDUSTRY (VOLUME) - CAGR (%)
Energy
Juice
Water
SSDs
NARTD
-5% -3% 0% 3% 5%
2018-2020
2016-2017
2012-2015
7
Source: IMF, company & TCCC estimates
-8% -6% -4% -2% 0% 2% 4%
2018-2020
2016-2017
2012-2015
0.0%
5.0%
10.0%
15.0%
20.0%
25.0%
0
5
10
15
2000 2008 2015 2020
GDP/cap ($) Inflation
130
135
140
145
150
155
160
200
650
1,100
1,550
2,000
2,450
2000 2002 2004 2006 2008 2010 2012 2014 2016 2018 2020
GDP ($) Population
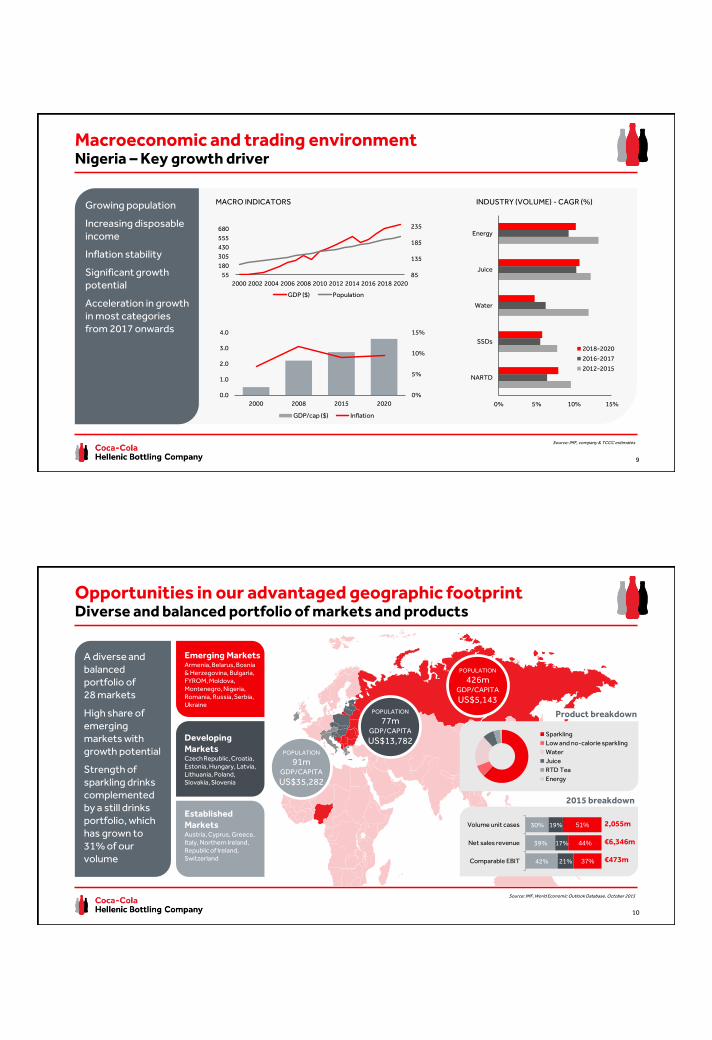
Macroeconomic and trading environmentRussia – Moving from stabilisation to recovery
Volatile economy
Stable population
GDP per capita expected to grow
Inflation normalisation
Recovery expected from 2017 onwards
MACRO INDICATORS INDUSTRY (VOLUME) - CAGR (%)
Energy
Juice
Water
SSDs
NARTD
8
Source: IMF, company & TCCC estimates
0%
5%
10%
15%
0.0
1.0
2.0
3.0
4.0
2000 2008 2015 2020
GDP/cap ($) Inflation
85
135
185
235
55
180
305
430
555
680
2000 2002 2004 2006 2008 2010 2012 2014 2016 2018 2020
GDP ($) Population
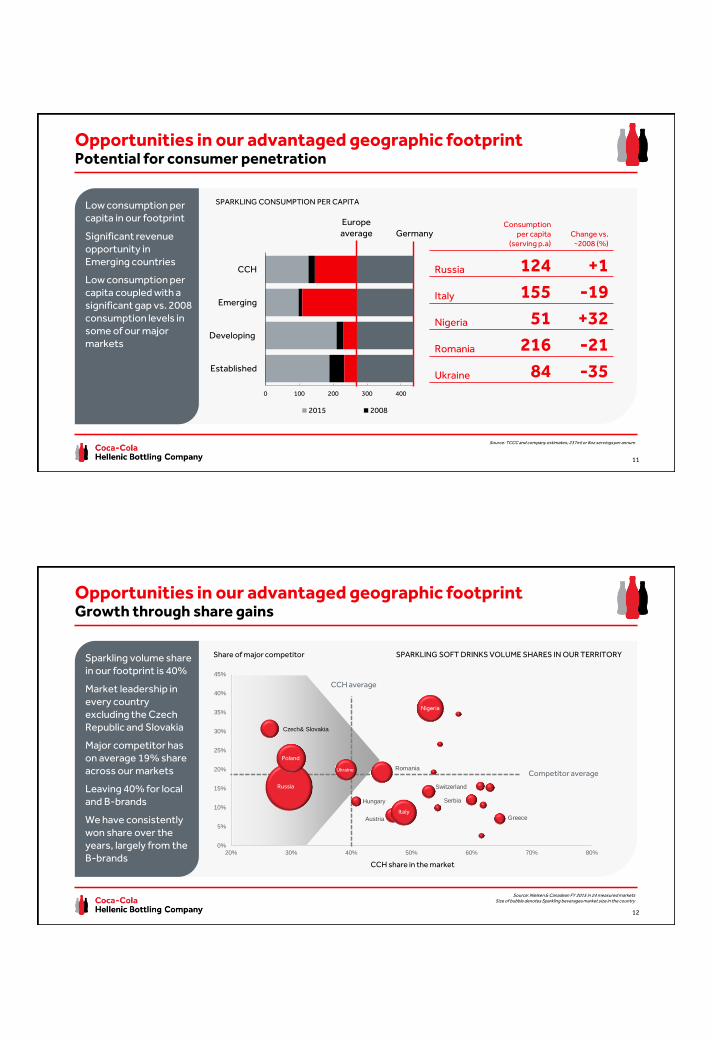
Macroeconomic and trading environmentNigeria – Key growth driver
Growing population
Increasing disposable income
Inflation stability
Significant growth potential
Acceleration in growth in most categories from 2017 onwards
MACRO INDICATORS INDUSTRY (VOLUME) - CAGR (%)
0% 5% 10% 15%
NARTD
SSDs
Water
Juice
Energy
2018-2020
2016-2017
2012-2015
9
Source: IMF, company & TCCC estimates
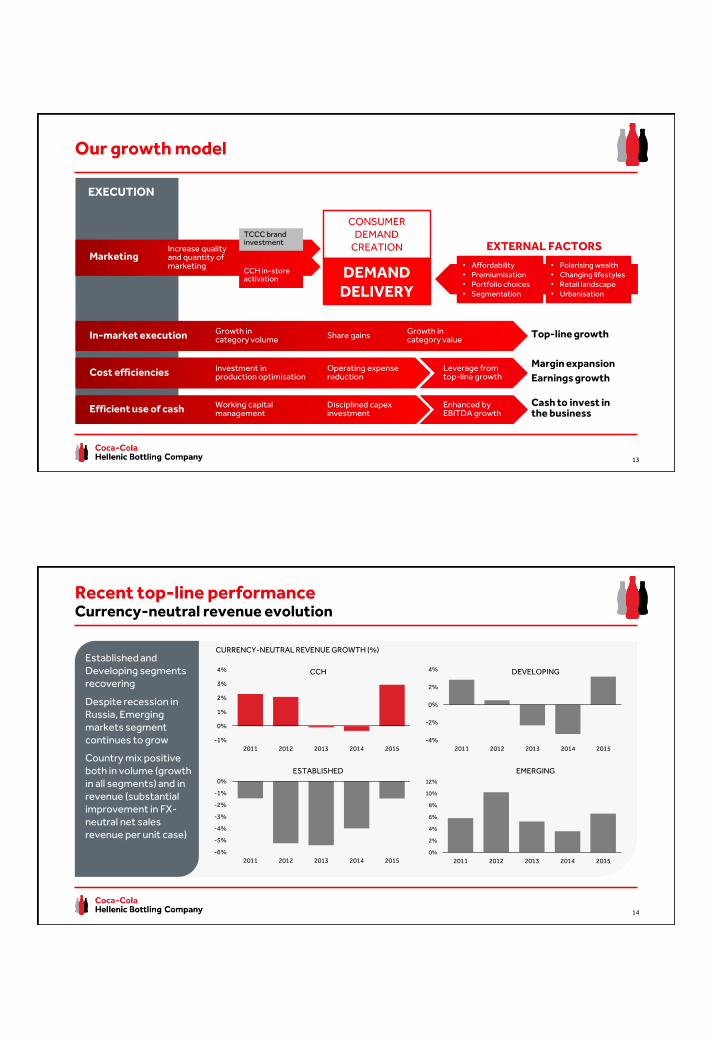
Opportunities in our advantaged geographic footprintDiverse and balanced portfolio of markets and products
POPULATION
77mGDP/CAPITA
US$13,782POPULATION
91mGDP/CAPITA
US$35,282
2,055m
2015 breakdown
42%
39%
30%
21%
17%
19%
37%
44%
51%
Comparable EBIT
Net sales revenue
Volume unit cases
€6,346m
€473m
Sparkling
Low and no-calorie sparkling
Water
Juice
RTD Tea
Energy
Product breakdown
A diverse and balanced portfolio of 28 markets
High share of emerging markets with growth potential
Strength of sparkling drinks complemented by a still drinks portfolio, which has grown to 31% of our volume
EstablishedMarketsAustria, Cyprus, Greece, Italy, Northern Ireland, Republic of Ireland, Switzerland
DevelopingMarketsCzech Republic, Croatia, Estonia, Hungary, Latvia, Lithuania, Poland, Slovakia, Slovenia
Emerging MarketsArmenia, Belarus, Bosnia & Herzegovina, Bulgaria, FYROM, Moldova, Montenegro, Nigeria, Romania, Russia, Serbia, Ukraine
POPULATION
426mGDP/CAPITA
US$5,143
10
Source: IMF, World Economic Outlook Database, October 2015
Low consumption per capita in our footprint
Significant revenue opportunity in Emerging countries
Low consumption per capita coupled with a significant gap vs. 2008 consumption levels in some of our major markets
Opportunities in our advantaged geographic footprintPotential for consumer penetration
Europe average Germany
11
Source: TCCC and company estimates; 237ml or 8oz servings per annum
Consumptionper capita
(serving p.a)Change vs.
~2008 (%)
Russia 124 +1
Italy 155 -19
Nigeria 51 +32
Romania 216 -21
Ukraine 84 -35Established
Developing
Emerging
CCH
0 100 200 300 400
2015 2008
SPARKLING CONSUMPTION PER CAPITA
Sparkling volume share in our footprint is 40%
Market leadership in every country excluding the Czech Republic and Slovakia
Major competitor has on average 19% share across our markets
Leaving 40% for local and B-brands
We have consistently won share over the years, largely from the B-brands
Opportunities in our advantaged geographic footprintGrowth through share gains
12
Source: Nielsen & Canadean FY 2015 in 24 measured marketsSize of bubble denotes Sparkling beverages market size in the country
Austria
Italy
Switzerland
Poland
Russia
Ukraine
Nigeria
Romania
Serbia
Czech& Slovakia
Greece
Hungary
0%
5%
10%
15%
20%
25%
30%
35%
40%
45%
20% 30% 40% 50% 60% 70% 80%
CCH share in the market
Competitor average
CCH average
SPARKLING SOFT DRINKS VOLUME SHARES IN OUR TERRITORYShare of major competitor
Russia
Poland
Ukraine
Italy
Nigeria
Our growth model
• Affordability• Premiumisation• Portfolio choices• Segmentation
• Polarising wealth• Changing lifestyles• Retail landscape• Urbanisation
DEMAND DELIVERY
CONSUMER DEMAND
CREATIONMarketing
EXTERNAL FACTORS
EXECUTION
Cost efficiencies
Top-line growthGrowth in category volumeIn-market execution Growth in
category valueShare gains
Investment in production optimisation
Operating expense reduction Earnings growth
Efficient use of cashCash to invest in the business
Working capital management
Disciplined capex investment
Increase quality and quantity of marketing
Leverage from top-line growth
Enhanced by EBITDA growth
TCCC brand investment
CCH in-store activation
Margin expansion
13
-1%
0%
1%
2%
3%
4%
2011 2012 2013 2014 2015
Established and Developing segments recovering
Despite recession in Russia, Emerging markets segment continues to grow
Country mix positive both in volume (growth in all segments) and in revenue (substantial improvement in FX-neutral net sales revenue per unit case)
Recent top-line performanceCurrency-neutral revenue evolution
-6%
-5%
-4%
-3%
-2%
-1%
0%
2011 2012 2013 2014 2015
-4%
-2%
0%
2%
4%
2011 2012 2013 2014 2015
0%
2%
4%
6%
8%
10%
12%
2011 2012 2013 2014 2015
CURRENCY-NEUTRAL REVENUE GROWTH (%)
ESTABLISHED EMERGING
CCH DEVELOPING
14
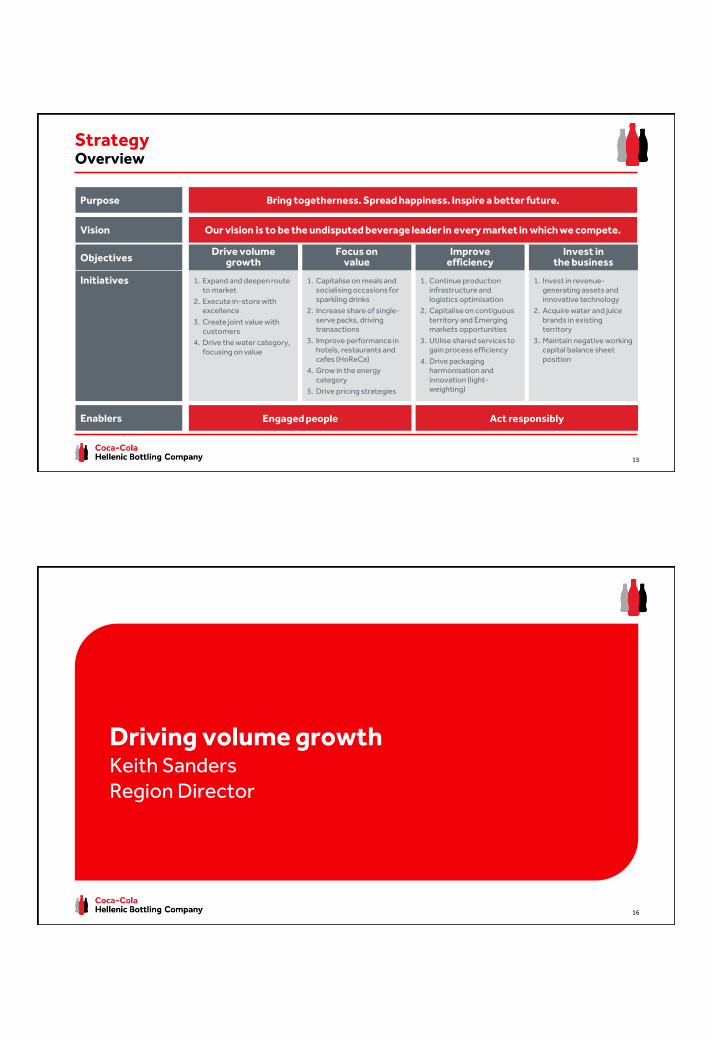
StrategyOverview
Purpose Bring togetherness. Spread happiness. Inspire a better future.
Vision Our vision is to be the undisputed beverage leader in every market in which we compete.
Enablers Engaged people Act responsibly
Initiatives 1. Expand and deepen route to market
2. Execute in-store with excellence
3. Create joint value with customers
4. Drive the water category, focusing on value
ObjectivesDrive volume
growth
1. Capitalise on meals and socialising occasions for sparkling drinks
2. Increase share of single-serve packs, driving transactions
3. Improve performance in hotels, restaurants and cafes (HoReCa)
4. Grow in the energy category
5. Drive pricing strategies
Focus on value
1. Continue production infrastructure and logistics optimisation
2. Capitalise on contiguous territory and Emerging markets opportunities
3. Utilise shared services to gain process efficiency
4. Drive packaging harmonisation and innovation (light-weighting)
Improve efficiency
1. Invest in revenue-generating assets and innovative technology
2. Acquire water and juice brands in existing territory
3. Maintain negative working capital balance sheet position
Invest in the business
15
Driving volume growthKeith SandersRegion Director
16
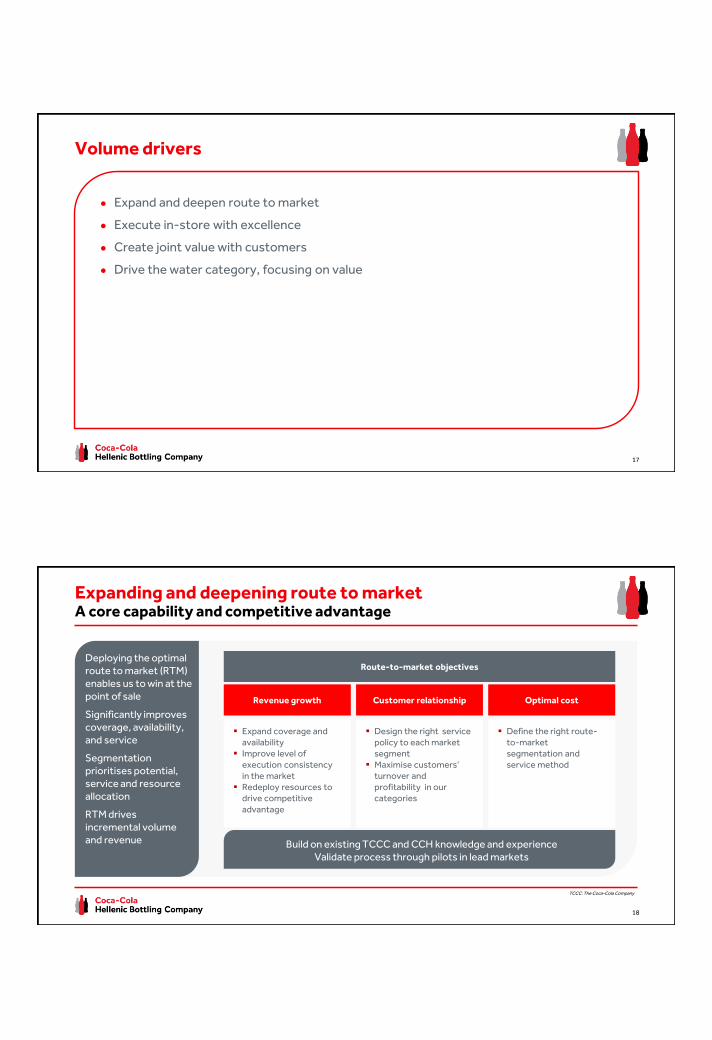
Volume drivers
● Expand and deepen route to market
● Execute in-store with excellence
● Create joint value with customers
● Drive the water category, focusing on value
17
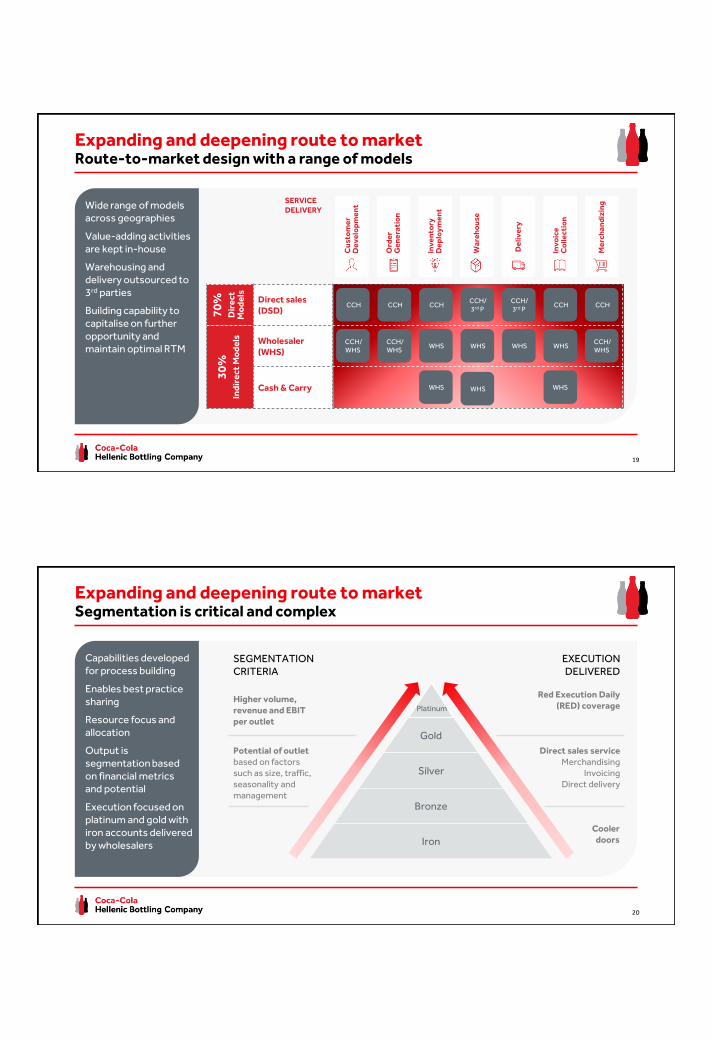
Deploying the optimal route to market (RTM) enables us to win at the point of sale
Significantly improves coverage, availability, and service
Segmentation prioritises potential, service and resource allocation
RTM drives incremental volume and revenue
Expanding and deepening route to market A core capability and competitive advantage
18
Expand coverage and availability
Improve level of execution consistency in the market
Redeploy resources to drive competitive advantage
Design the right service policy to each market segment
Maximise customers’ turnover and profitability in our categories
Define the right route-to-market segmentation and service method
Revenue growth Customer relationship Optimal cost
Route-to-market objectives
Build on existing TCCC and CCH knowledge and experienceValidate process through pilots in lead markets
TCCC: The Coca-Cola Company
70
%D
ire
ct
Mo
de
ls
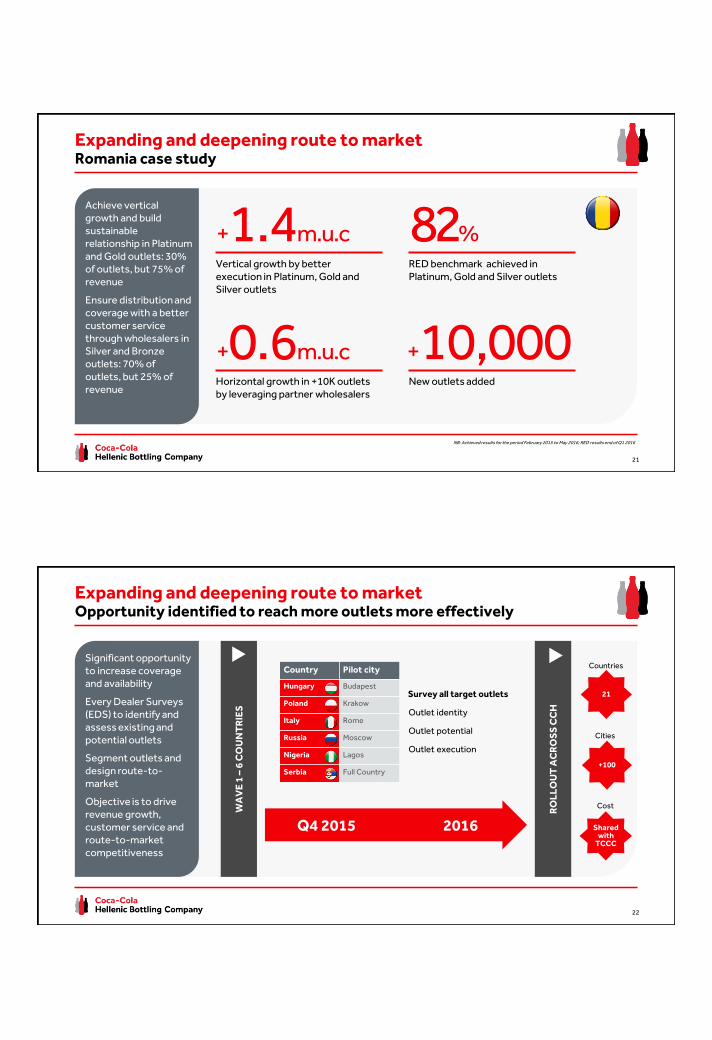
Direct sales (DSD)
30
%In
dir
ect
Mo
de
ls
Wholesaler (WHS)
Cash & Carry
Expanding and deepening route to marketRoute-to-market design with a range of models
Cu
sto
me
r D
ev
elo
pm
en
t
Ord
er
Ge
ne
rati
on
Inv
en
tory
D
ep
loy
me
nt
Wa
reh
ou
se
De
liv
ery
Inv
oic
eC
oll
ect
ion
Me
rch
an
diz
ingSERVICE
DELIVERYWide range of models across geographies
Value-adding activities are kept in-house
Warehousing and delivery outsourced to 3rd parties
Building capability to capitalise on further opportunity and maintain optimal RTM
CCH CCH CCHCCH/3rd P
CCH/3rd P
CCH CCH
CCH/WHS
CCH/WHS
WHS WHS WHS WHSCCH/WHS
WHS WHS WHS
19
Capabilities developed for process building
Enables best practice sharing
Resource focus and allocation
Output is segmentation based on financial metrics and potential
Execution focused on platinum and gold with iron accounts delivered by wholesalers
Expanding and deepening route to marketSegmentation is critical and complex
Potential of outlet based on factors such as size, traffic, seasonality and management
Higher volume, revenue and EBIT per outlet
Direct sales serviceMerchandising
InvoicingDirect delivery
EXECUTION DELIVERED
Red Execution Daily (RED) coverage
Coolerdoors
Platinum
Gold
Silver
Bronze
Iron
SEGMENTATION CRITERIA
20
Expanding and deepening route to marketRomania case study
Vertical growth by better execution in Platinum, Gold and Silver outlets
Achieve vertical growth and build sustainable relationship in Platinum and Gold outlets: 30% of outlets, but 75% of revenue
Ensure distribution and coverage with a better customer service through wholesalers in Silver and Bronze outlets: 70% of outlets, but 25% of revenue
RED benchmark achieved in Platinum, Gold and Silver outlets
Horizontal growth in +10K outlets by leveraging partner wholesalers
New outlets added
82%
+10,000
+1.4m.u.c
+0.6m.u.c
21
NB: Achieved results for the period February 2015 to May 2016; RED results end of Q1 2016
Expanding and deepening route to marketOpportunity identified to reach more outlets more effectively
Country Pilot city
Hungary Budapest
Poland Krakow
Italy Rome
Russia Moscow
Nigeria Lagos
Serbia Full Country
WA
VE
1 –
6 C
OU
NT
RIE
S
21Survey all target outlets
Outlet identity
Outlet potential
Outlet execution
+100
Countries
Cities
Shared with
TCCC
Cost
Q4 2015 2016
RO
LL
OU
T A
CR
OS
S C
CH
Significant opportunity to increase coverage and availability
Every Dealer Surveys (EDS) to identify and assess existing and potential outlets
Segment outlets and design route-to-market
Objective is to drive revenue growth, customer service and route-to-market competitiveness
22
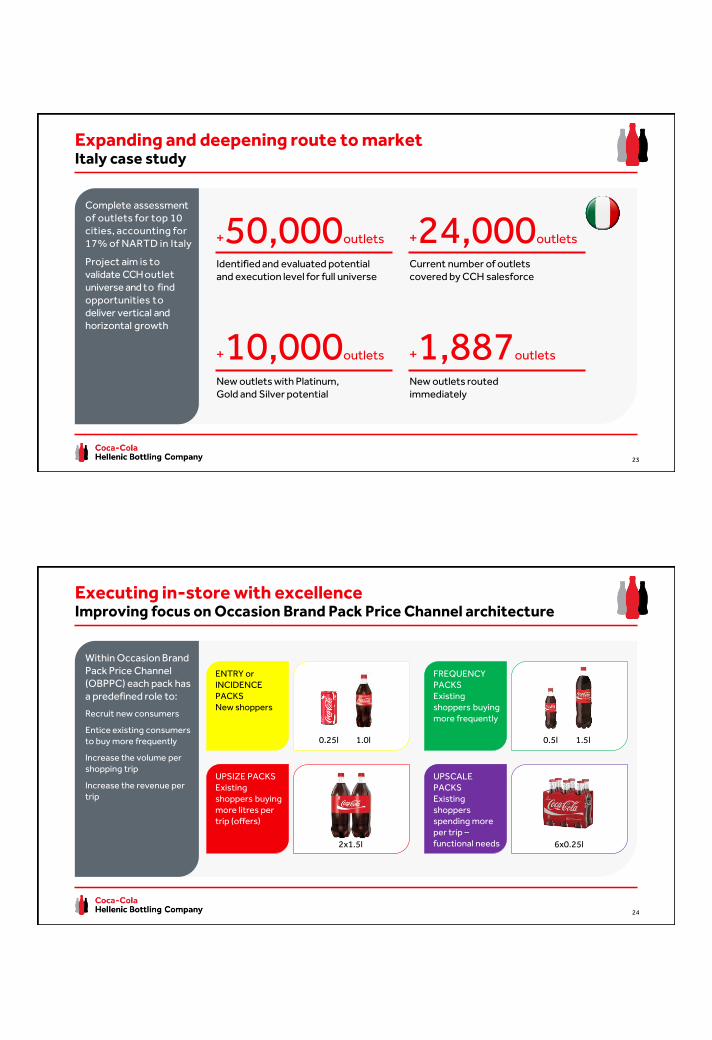
Expanding and deepening route to marketItaly case study
Identified and evaluated potential and execution level for full universe
Complete assessment of outlets for top 10 cities, accounting for 17% of NARTD in Italy
Project aim is to validate CCH outlet universe and to find opportunities todeliver vertical and horizontal growth
Current number of outletscovered by CCH salesforce
New outlets with Platinum, Gold and Silver potential
New outlets routed immediately
+50,000outlets
+10,000outlets +1,887outlets
+24,000outlets
23
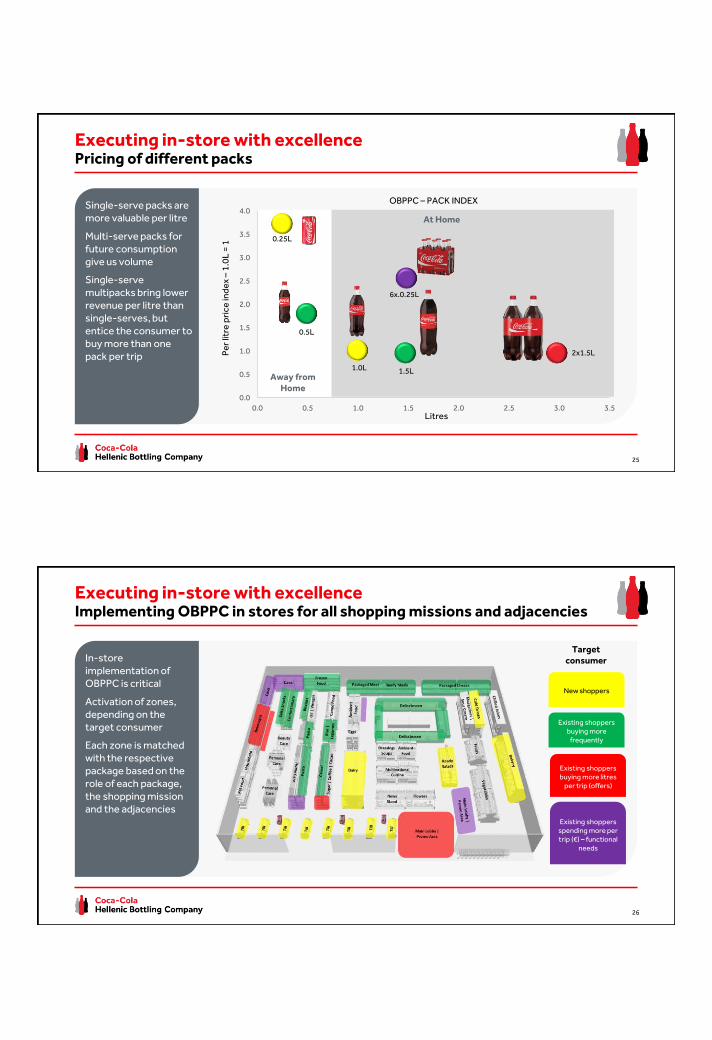
Within Occasion Brand Pack Price Channel (OBPPC) each pack has a predefined role to:
Recruit new consumers
Entice existing consumers to buy more frequently
Increase the volume per shopping trip
Increase the revenue per trip
Executing in-store with excellenceImproving focus on Occasion Brand Pack Price Channel architecture
ENTRY or INCIDENCE PACKSNew shoppers
FREQUENCY PACKSExisting shoppers buying more frequently
UPSIZE PACKSExisting shoppers buying more litres per trip (offers)
UPSCALE PACKSExisting shoppers spending more per trip –functional needs
0.25l 1.0l
2x1.5l 6x0.25l
0.5l 1.5l
24
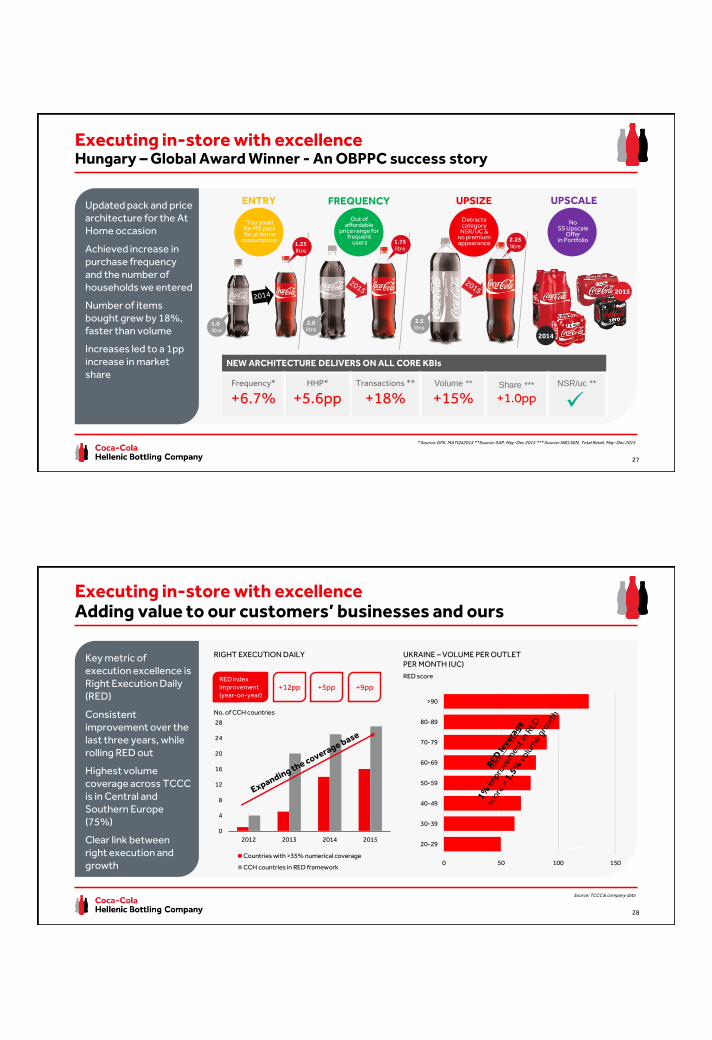
At Home
Litres
Pe
r lit
rep
ric
e in
de
x –
1.0
L =
1
Away from Home
2x1.5L
1.5L
6x.0.25L
0.25L
0.5L
OBPPC – PACK INDEX
1.0L
Executing in-store with excellencePricing of different packs
Single-serve packs are more valuable per litre
Multi-serve packs for future consumption give us volume
Single-serve multipacks bring lower revenue per litre than single-serves, but entice the consumer to buy more than one pack per trip
25
0.0
0.5
1.0
1.5
2.0
2.5
3.0
3.5
4.0
0.0 0.5 1.0 1.5 2.0 2.5 3.0 3.5
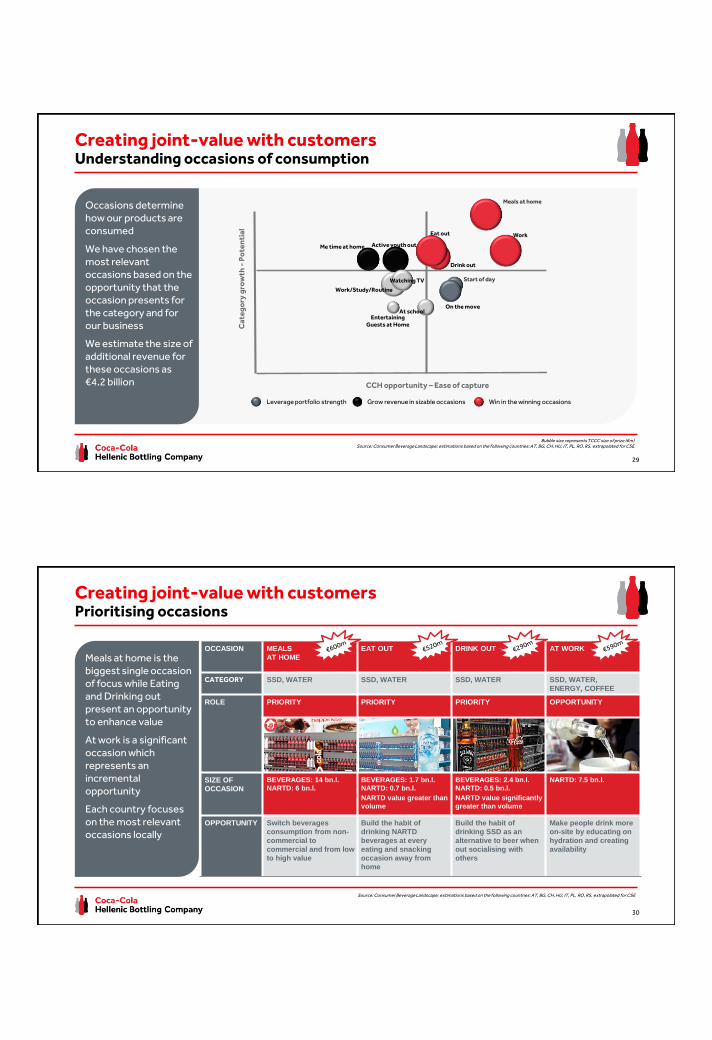
In-store implementation of OBPPC is critical
Activation of zones, depending on the target consumer
Each zone is matched with the respective package based on the role of each package, the shopping mission and the adjacencies
Executing in-store with excellenceImplementing OBPPC in stores for all shopping missions and adjacencies
New shoppers
Existing shoppers buying more
frequently
Existing shoppers buying more litres
per trip (offers)
Existing shoppers spending more per trip (€) – functional
needs
Targetconsumer
26
Executing in-store with excellenceHungary – Global Award Winner - An OBPPC success story
* Source: GFK, MATQ42015 **Source: SAP, May-Dec 2015 *** Source: NIELSEN, Total Retail, May-Dec 2015
27
1.0litre
Out of affordable
price range for frequent
users
2.0litre
2.25litre
2.5litre
1.75litre
1.25litre
Detracts category
NSR/UC & no premiumappearance
ENTRY FREQUENCY UPSIZE
Too small for MS pack for at home
consumption
UPSCALE
No SS Upscale
Offer in Portfolio
2014
2015
NEW ARCHITECTURE DELIVERS ON ALL CORE KBIs
Frequency*
+6.7%HHP*
+5.6ppTransactions **
+18%Volume **
+15%Share ***
+1.0ppNSR/uc **
Updated pack and price architecture for the At Home occasion
Achieved increase in purchase frequency and the number of households we entered
Number of items bought grew by 18%, faster than volume
Increases led to a 1pp increase in market share
+0.25% +1.0%
0 50 100 150
20-29
30-39
40-49
50-59
60-69
70-79
80-89
>90
RED score
Key metric of execution excellence is Right Execution Daily (RED)
Consistent improvement over the last three years, while rolling RED out
Highest volume coverage across TCCC is in Central and Southern Europe (75%)
Clear link between right execution and growth
Executing in-store with excellenceAdding value to our customers’ businesses and ours
RIGHT EXECUTION DAILY
Source: TCCC & company data
28
0
4
8
12
16
20
24
28
2012 2013 2014 2015
Countries with >35% numerical coverage
CCH countries in RED framework
UKRAINE – VOLUME PER OUTLET PER MONTH (UC)
+12% +5pp +9ppRED index improvement (year-on-year)
No. of CCH countries
+12pp
Occasions determine how our products are consumed
We have chosen the most relevant occasions based on the opportunity that the occasion presents for the category and for our business
We estimate the size of additional revenue for these occasions as €4.2 billion
Creating joint-value with customersUnderstanding occasions of consumption
Grow revenue in sizable occasions Win in the winning occasionsLeverage portfolio strength
CCH opportunity – Ease of capture
Ca
teg
ory
gro
wth
-P
ote
nti
al
Drink out
Me time at home
Meals at home
WorkEat out
Active youth out
Watching TV
Entertaining Guests at Home
At schoolOn the move
Start of day
Work/Study/Routine
Bubble size represents TCCC size of prize (€m)Source: Consumer Beverage Landscape; estimations based on the following countries: AT, BG, CH, HU, IT, PL, RO, RS, extrapolated for CSE
29
Creating joint-value with customersPrioritising occasions
Meals at home is the biggest single occasion of focus while Eating and Drinking out present an opportunity to enhance value
At work is a significant occasion which represents an incremental opportunity
Each country focuses on the most relevant occasions locally
OCCASION MEALS
AT HOME
EAT OUT DRINK OUT AT WORK
CATEGORY SSD, WATER SSD, WATER SSD, WATER SSD, WATER,
ENERGY, COFFEE
ROLE PRIORITY PRIORITY PRIORITY OPPORTUNITY
SIZE OF
OCCASION
BEVERAGES: 14 bn.l.
NARTD: 6 bn.l.
BEVERAGES: 1.7 bn.l.
NARTD: 0.7 bn.l.
NARTD value greater than
volume
BEVERAGES: 2.4 bn.l.
NARTD: 0.5 bn.l.
NARTD value significantly
greater than volume
NARTD: 7.5 bn.l.
OPPORTUNITY Switch beverages
consumption from non-
commercial to
commercial and from low
to high value
Build the habit of
drinking NARTD
beverages at every
eating and snacking
occasion away from
home
Build the habit of
drinking SSD as an
alternative to beer when
out socialising with
others
Make people drink more
on-site by educating on
hydration and creating
availability
30
Source: Consumer Beverage Landscape; estimations based on the following countries: AT, BG, CH, HU, IT, PL, RO, RS, extrapolated for CSE
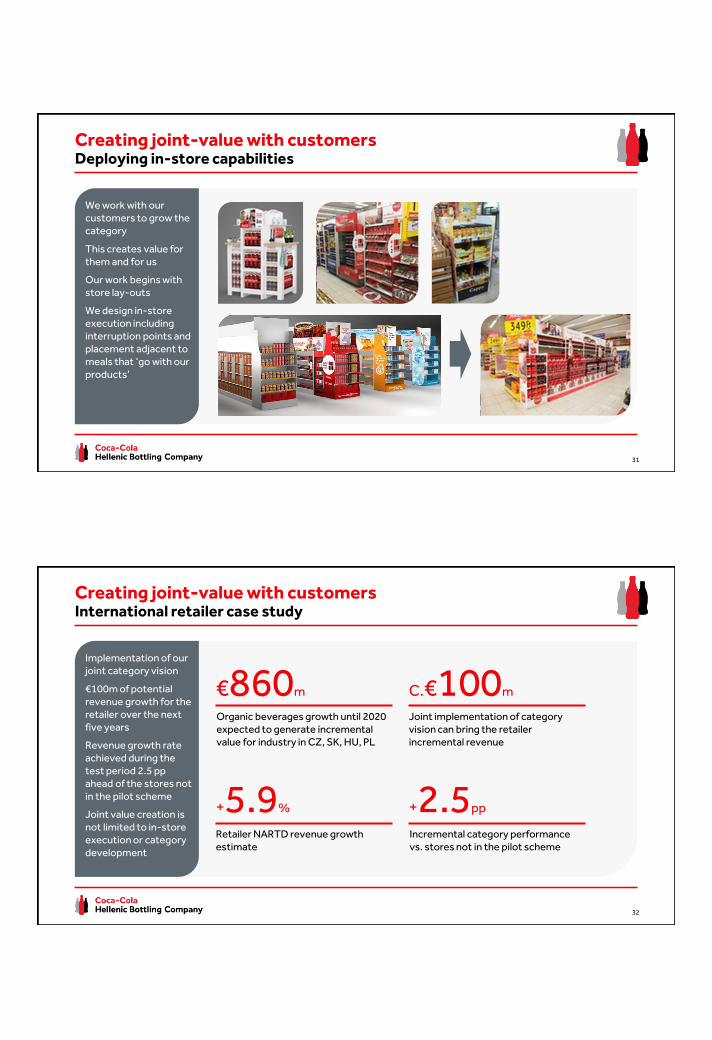
We work with our customers to grow the category
This creates value for them and for us
Our work begins with store lay-outs
We design in-store execution including interruption points and placement adjacent to meals that ‘go with our products’
Creating joint-value with customersDeploying in-store capabilities
31
+2.5pp
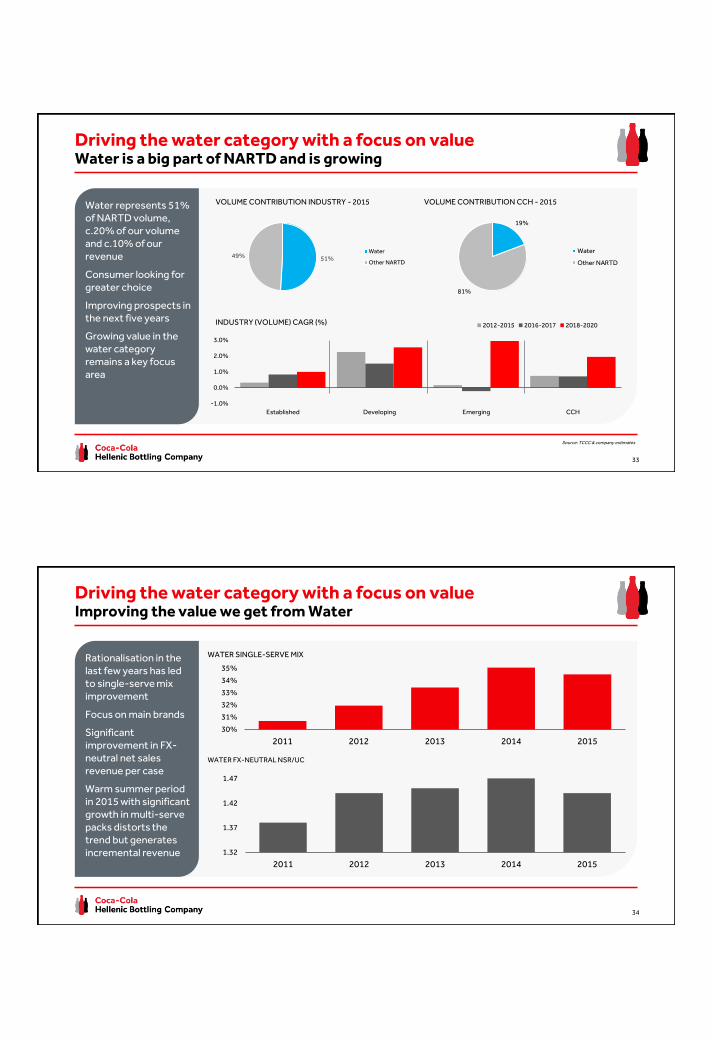
Creating joint-value with customersInternational retailer case study
Organic beverages growth until 2020 expected to generate incremental value for industry in CZ, SK, HU, PL
Implementation of our joint category vision
€100m of potential revenue growth for the retailer over the next five years
Revenue growth rate achieved during the test period 2.5 pp ahead of the stores not in the pilot scheme
Joint value creation is not limited to in-store execution or category development
Joint implementation of category vision can bring the retailer incremental revenue
Retailer NARTD revenue growth estimate
Incremental category performance vs. stores not in the pilot scheme
€860m
+5.9%
C.€100m
32
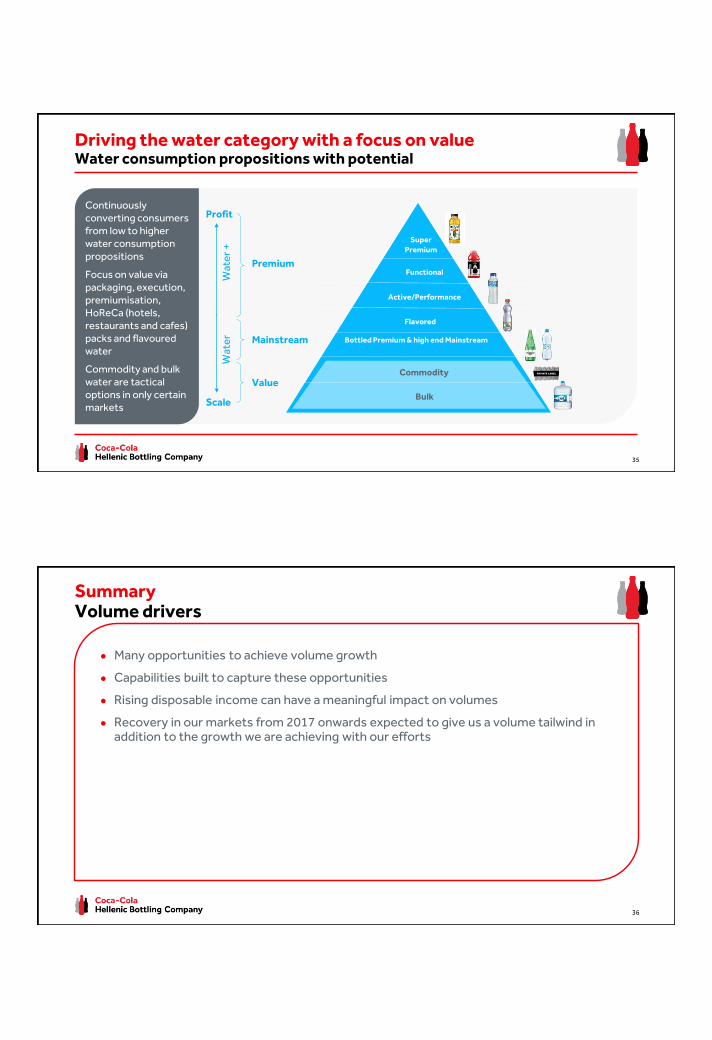
Driving the water category with a focus on valueWater is a big part of NARTD and is growing
-1.0%
0.0%
1.0%
2.0%
3.0%
Established Developing Emerging CCH
2012-2015 2016-2017 2018-2020
Water represents 51% of NARTD volume, c.20% of our volume and c.10% of our revenue
Consumer looking for greater choice
Improving prospects in the next five years
Growing value in the water category remains a key focus area
Source: TCCC & company estimates
33
19%
81%
Water
Other NARTD
VOLUME CONTRIBUTION CCH - 2015
INDUSTRY (VOLUME) CAGR (%)
51%49%Water
Other NARTD
VOLUME CONTRIBUTION INDUSTRY - 2015
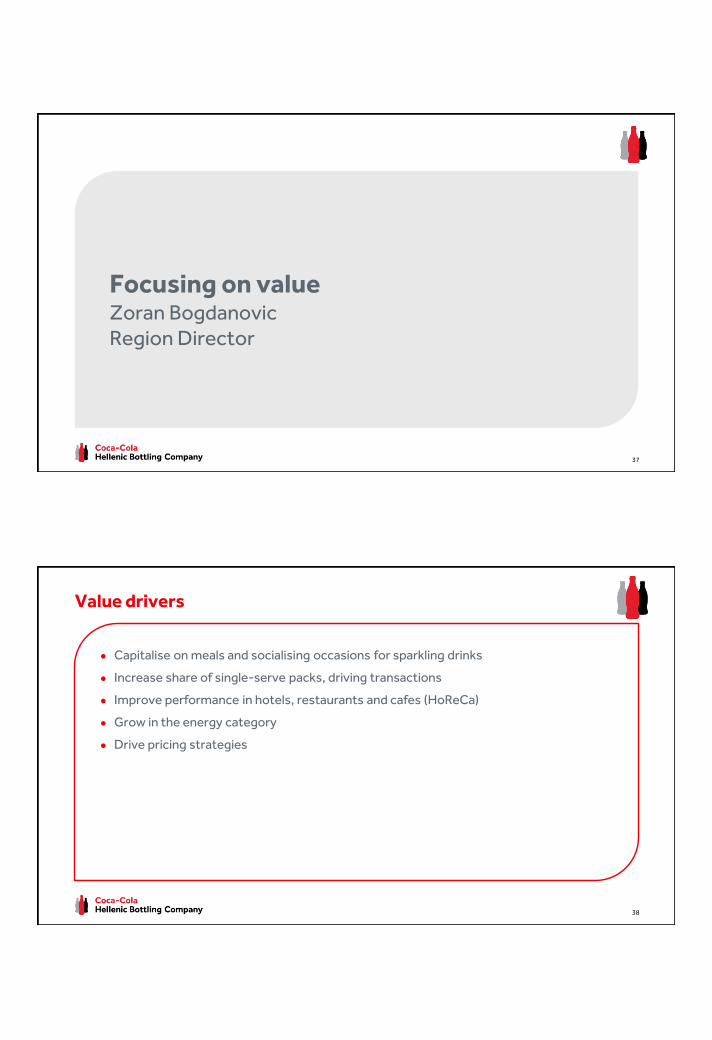
Driving the water category with a focus on valueImproving the value we get from Water
30%
31%
32%
33%
34%
35%
2011 2012 2013 2014 2015
Rationalisation in the last few years has led to single-serve mix improvement
Focus on main brands
Significant improvement in FX-neutral net sales revenue per case
Warm summer period in 2015 with significant growth in multi-serve packs distorts the trend but generates incremental revenue
WATER SINGLE-SERVE MIX
WATER FX-NEUTRAL NSR/UC
1.32
1.37
1.42
1.47
2011 2012 2013 2014 2015
34
Continuously converting consumers from low to higher water consumption propositions
Focus on value via packaging, execution, premiumisation, HoReCa (hotels, restaurants and cafes) packs and flavouredwater
Commodity and bulk water are tactical options in only certain markets
Driving the water category with a focus on valueWater consumption propositions with potential
Wat
er
+W
ate
r
Premium
Mainstream
Value
Profit
Scale
Bottled Premium & high end Mainstream
Bulk
Super
Premium
Functional
Commodity
Active/Performance
Flavored
PRIVATE LABEL
35
SummaryVolume drivers
● Many opportunities to achieve volume growth
● Capabilities built to capture these opportunities
● Rising disposable income can have a meaningful impact on volumes
● Recovery in our markets from 2017 onwards expected to give us a volume tailwind in addition to the growth we are achieving with our efforts
36
Focusing on valueZoran BogdanovicRegion Director
37
Value drivers
● Capitalise on meals and socialising occasions for sparkling drinks
● Increase share of single-serve packs, driving transactions
● Improve performance in hotels, restaurants and cafes (HoReCa)
● Grow in the energy category
● Drive pricing strategies
38
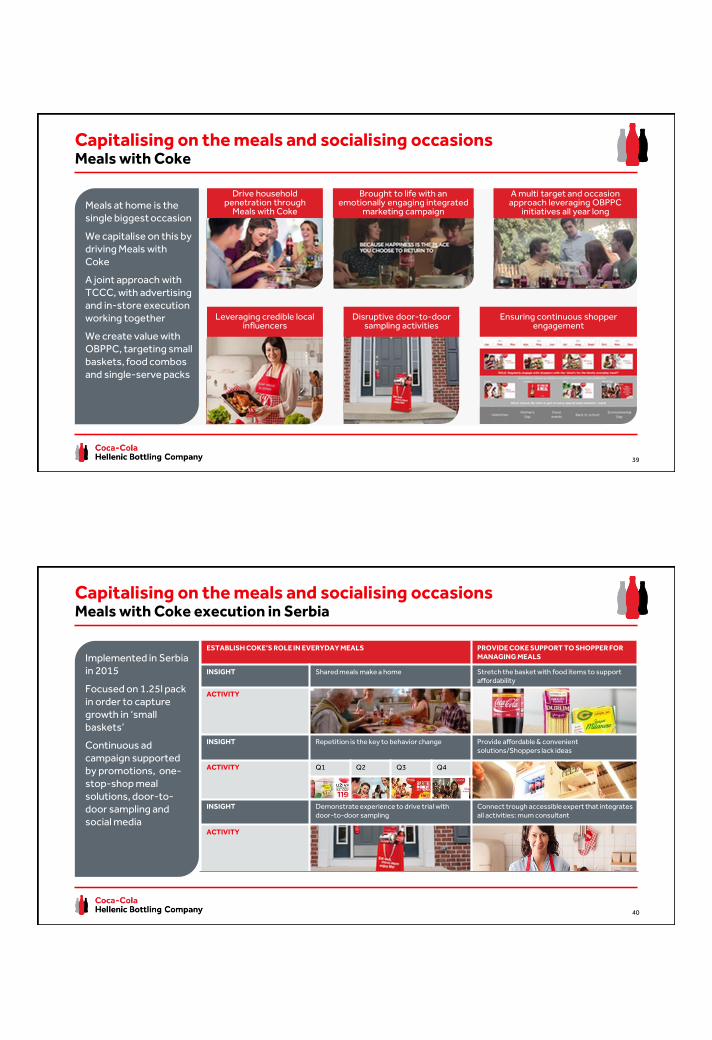
Capitalising on the meals and socialising occasions Meals with Coke
Meals at home is the single biggest occasion
We capitalise on this by driving Meals with Coke
A joint approach with TCCC, with advertising and in-store execution working together
We create value with OBPPC, targeting small baskets, food combos and single-serve packs
Drive household penetration through
Meals with Coke
Brought to life with an emotionally engaging integrated
marketing campaign
A multi target and occasion approach leveraging OBPPC
initiatives all year long
Leveraging credible local influencers
Disruptive door-to-door sampling activities
Ensuring continuous shopper engagement
39
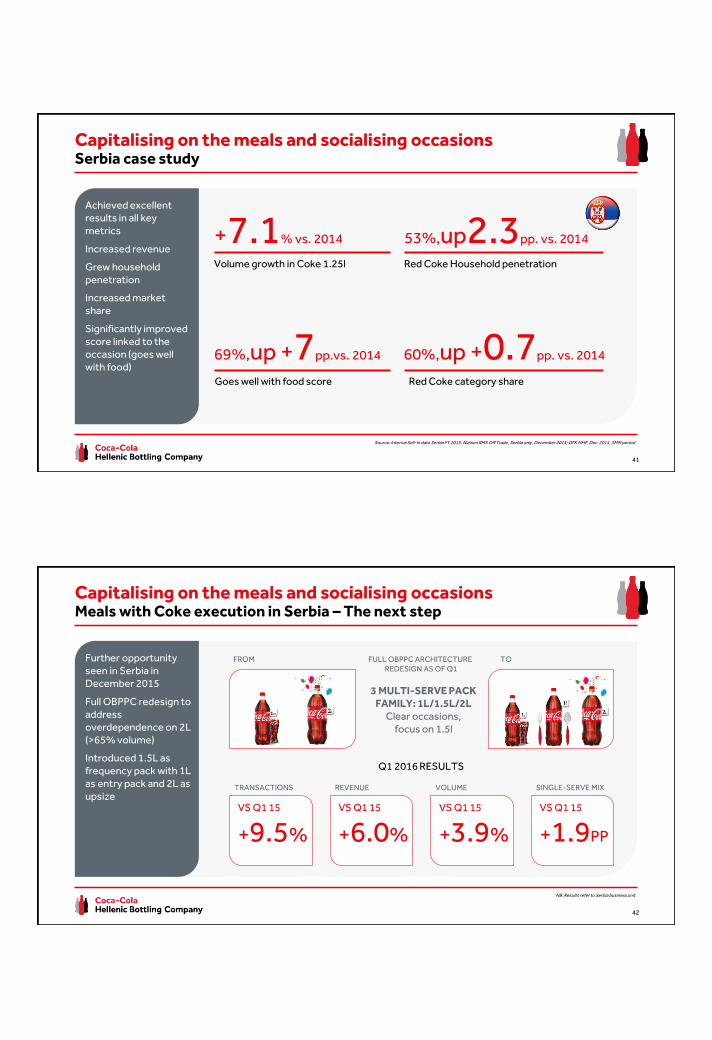
Capitalising on the meals and socialising occasions Meals with Coke execution in Serbia
Implemented in Serbia in 2015
Focused on 1.25l pack in order to capture growth in ‘small baskets’
Continuous ad campaign supported by promotions, one-stop-shop meal solutions, door-to-door sampling and social media
ESTABLISH COKE’S ROLE IN EVERYDAY MEALS PROVIDE COKE SUPPORT TO SHOPPER FOR MANAGING MEALS
INSIGHT Shared meals make a home Stretch the basket with food items to support affordability
ACTIVITY
INSIGHT Repetition is the key to behavior change Provide affordable & convenient solutions/Shoppers lack ideas
ACTIVITY Q1 Q2 Q3 Q4
INSIGHT Demonstrate experience to drive trial with door-to-door sampling
Connect trough accessible expert that integrates all activities: mum consultant
ACTIVITY
40
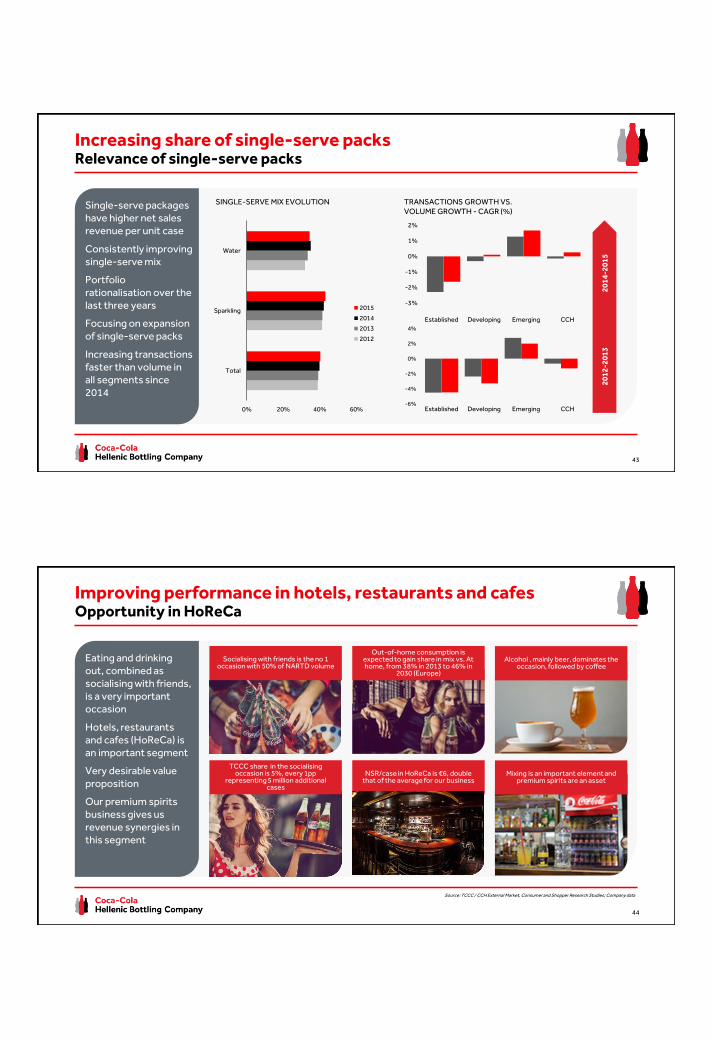
60%,up +0.7pp. vs. 2014
53%,up2.3pp. vs. 2014
Capitalising on the meals and socialising occasions Serbia case study
Volume growth in Coke 1.25l
Achieved excellent results in all key metrics
Increased revenue
Grew household penetration
Increased market share
Significantly improved score linked to the occasion (goes well with food)
Red Coke Household penetration
Goes well with food score Red Coke category share
+7.1% vs. 2014
69%,up +7pp.vs. 2014
Source: Internal Sell-In data Serbia FY 2015, Nielsen RMS Off Trade, Serbia only, December 2015; GFK HHP, Dec 2015, 3MM period
41
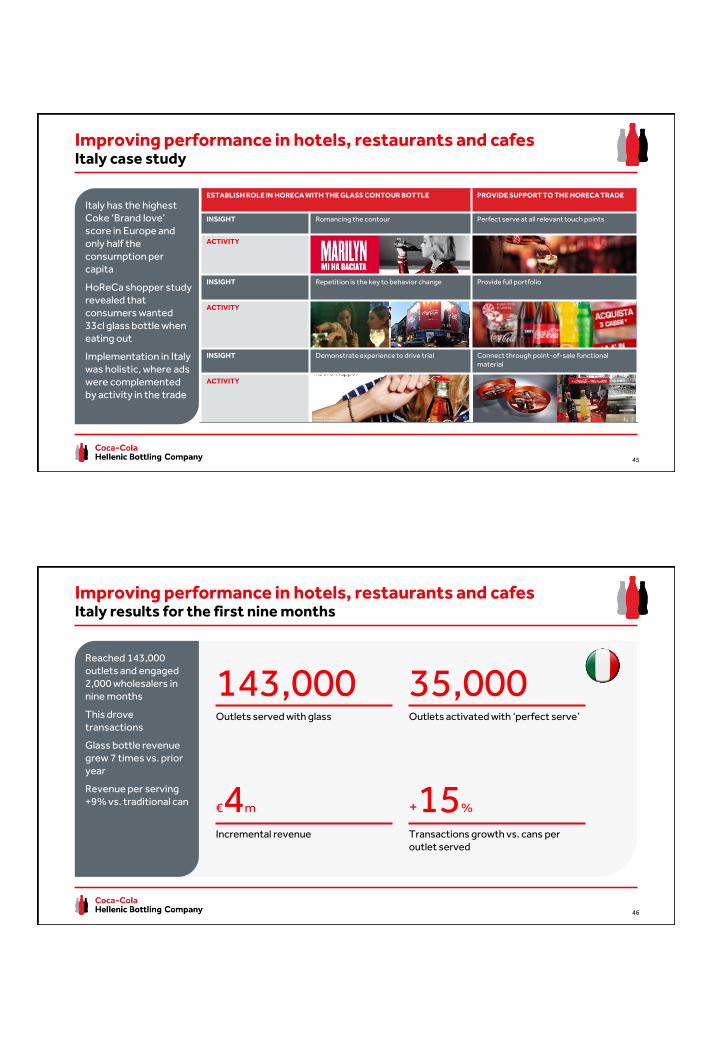
Capitalising on the meals and socialising occasions Meals with Coke execution in Serbia – The next step
Further opportunity seen in Serbia in December 2015
Full OBPPC redesign to address overdependence on 2L (>65% volume)
Introduced 1.5L as frequency pack with 1L as entry pack and 2L as upsize
VS Q1 15
+9.5%
TRANSACTIONS REVENUE
VS Q1 15
+6.0%
VOLUME
VS Q1 15
+3.9%
SINGLE-SERVE MIX
VS Q1 15
+1.9PP
FULL OBPPC ARCHITECTURE REDESIGN AS OF Q1
3 MULTI-SERVE PACK FAMILY: 1L/1.5L/2L
Clear occasions, focus on 1.5l
TOFROM
Q1 2016 RESULTS
125L
42
NB: Results refer to Serbia business unit
Increasing share of single-serve packsRelevance of single-serve packs
Single-serve packages have higher net sales revenue per unit case
Consistently improving single-serve mix
Portfolio rationalisation over the last three years
Focusing on expansion of single-serve packs
Increasing transactions faster than volume in all segments since 2014
SINGLE-SERVE MIX EVOLUTION TRANSACTIONS GROWTH VS. VOLUME GROWTH - CAGR (%)
43
0% 20% 40% 60%
Total
Sparkling
Water
2015
2014
2013
2012
-3%
-2%
-1%
0%
1%
2%
-6%
-4%
-2%
0%
2%
4%
Established Developing Emerging CCH
20
12
-20
13
20
14
-20
15
Established Developing Emerging CCH
Improving performance in hotels, restaurants and cafesOpportunity in HoReCa
Eating and drinking out, combined as socialising with friends, is a very important occasion
Hotels, restaurants and cafes (HoReCa) is an important segment
Very desirable value proposition
Our premium spirits business gives us revenue synergies in this segment
Socialising with friends is the no 1 occasion with 50% of NARTD volume
Out-of-home consumption is expected to gain share in mix vs. At home, from 38% in 2013 to 46% in
2030 (Europe)
Alcohol , mainly beer, dominates the occasion, followed by coffee
TCCC share in the socialisingoccasion is 5%, every 1pp
representing 5 million additional cases
NSR/case in HoReCa is €6, double that of the average for our business
Mixing is an important element and premium spirits are an asset
44
Source: TCCC / CCH External Market, Consumer and Shopper Research Studies; Company data
Improving performance in hotels, restaurants and cafesItaly case study
Italy has the highest Coke ‘Brand love’ score in Europe and only half the consumption per capita
HoReCa shopper study revealed that consumers wanted 33cl glass bottle when eating out
Implementation in Italy was holistic, where ads were complemented by activity in the trade
ESTABLISH ROLE IN HORECA WITH THE GLASS CONTOUR BOTTLE PROVIDE SUPPORT TO THE HORECA TRADE
INSIGHT Romancing the contour Perfect serve at all relevant touch points
ACTIVITY
INSIGHT Repetition is the key to behavior change Provide full portfolio
ACTIVITY
INSIGHT Demonstrate experience to drive trial Connect through point-of-sale functional material
ACTIVITY
45
Improving performance in hotels, restaurants and cafesItaly results for the first nine months
Outlets served with glass
Reached 143,000 outlets and engaged 2,000 wholesalers in nine months
This drove transactions
Glass bottle revenue grew 7 times vs. prior year
Revenue per serving +9% vs. traditional can
Outlets activated with ‘perfect serve’
Incremental revenue Transactions growth vs. cans per outlet served
143,000
€4m +15%
35,000
46
0
3
6
9
12
15
2011 2012 2013 2014 2015
Burn Monster Other
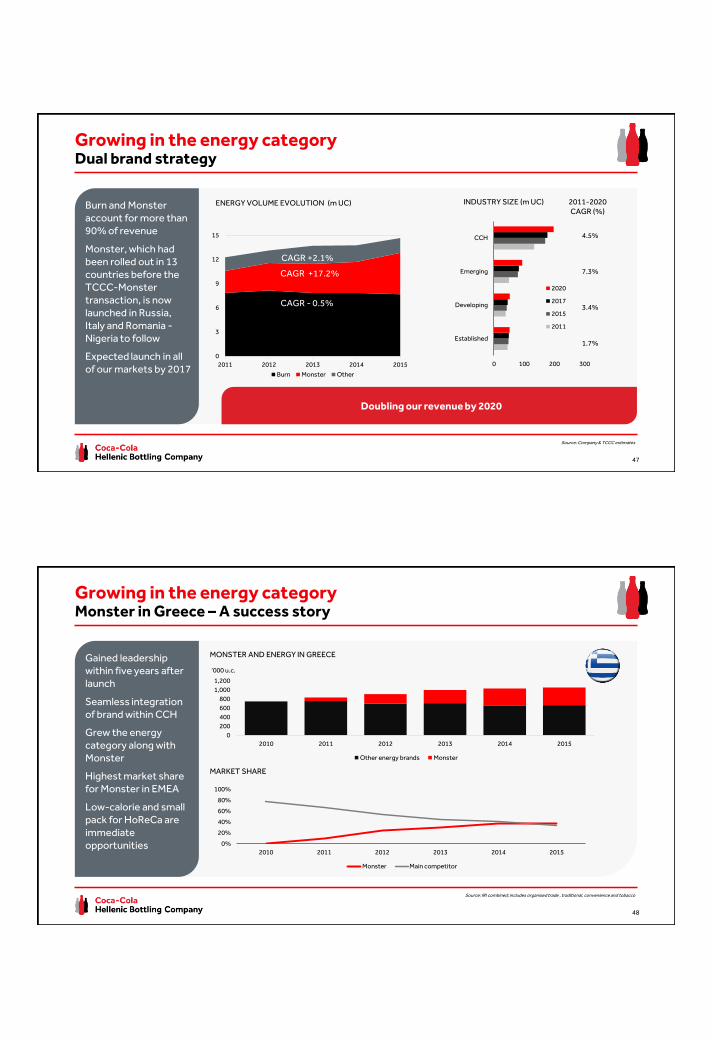
Growing in the energy categoryDual brand strategy
Burn and Monster account for more than 90% of revenue
Monster, which had been rolled out in 13 countries before the TCCC-Monster transaction, is now launched in Russia, Italy and Romania -Nigeria to follow
Expected launch in all of our markets by 2017
ENERGY VOLUME EVOLUTION (m UC) INDUSTRY SIZE (m UC)
47
Source: Company & TCCC estimates
0 100 200 300
Established
Developing
Emerging
CCH
2020
2017
2015
2011
CAGR - 0.5%
CAGR +17.2%
CAGR +2.1%
4.5%
1.7%
7.3%
3.4%
2011-2020CAGR (%)
Doubling our revenue by 2020
0%
20%
40%
60%
80%
100%
2010 2011 2012 2013 2014 2015
Monster Main competitor
0
200
400
600
800
1,000
1,200
2010 2011 2012 2013 2014 2015
Other energy brands Monster
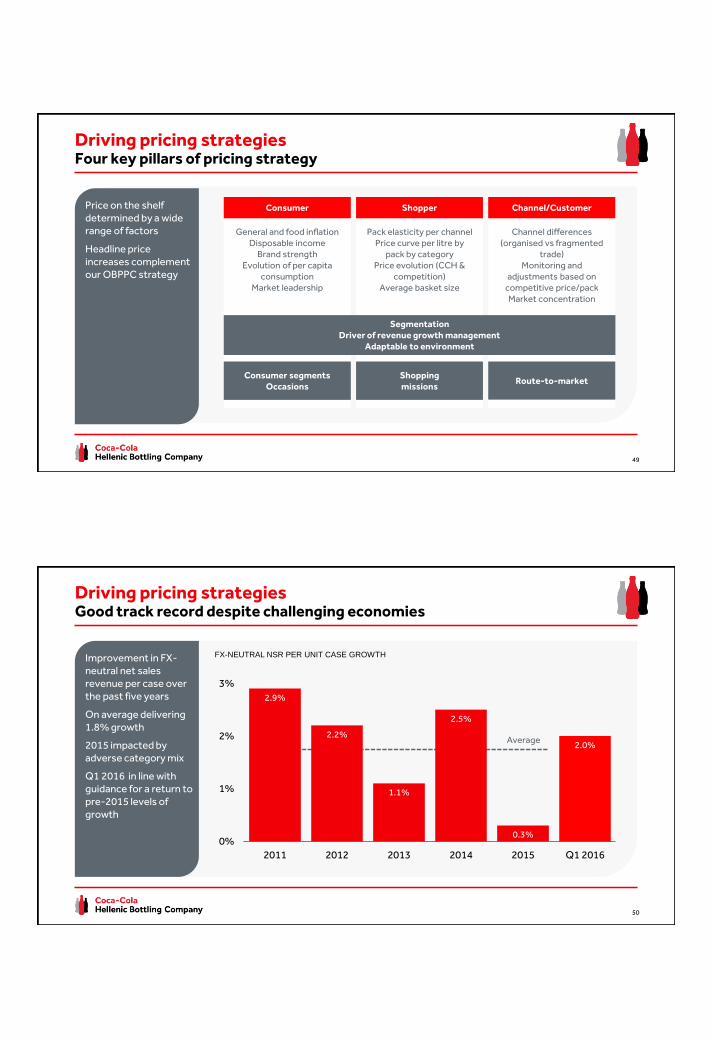
Gained leadership within five years after launch
Seamless integration of brand within CCH
Grew the energy category along with Monster
Highest market share for Monster in EMEA
Low-calorie and small pack for HoReCa are immediate opportunities
Growing in the energy categoryMonster in Greece – A success story
MONSTER AND ENERGY IN GREECE
Source: IRI combined; includes organised trade , traditional, convenience and tobacco
MARKET SHARE
48
‘000 u.c.
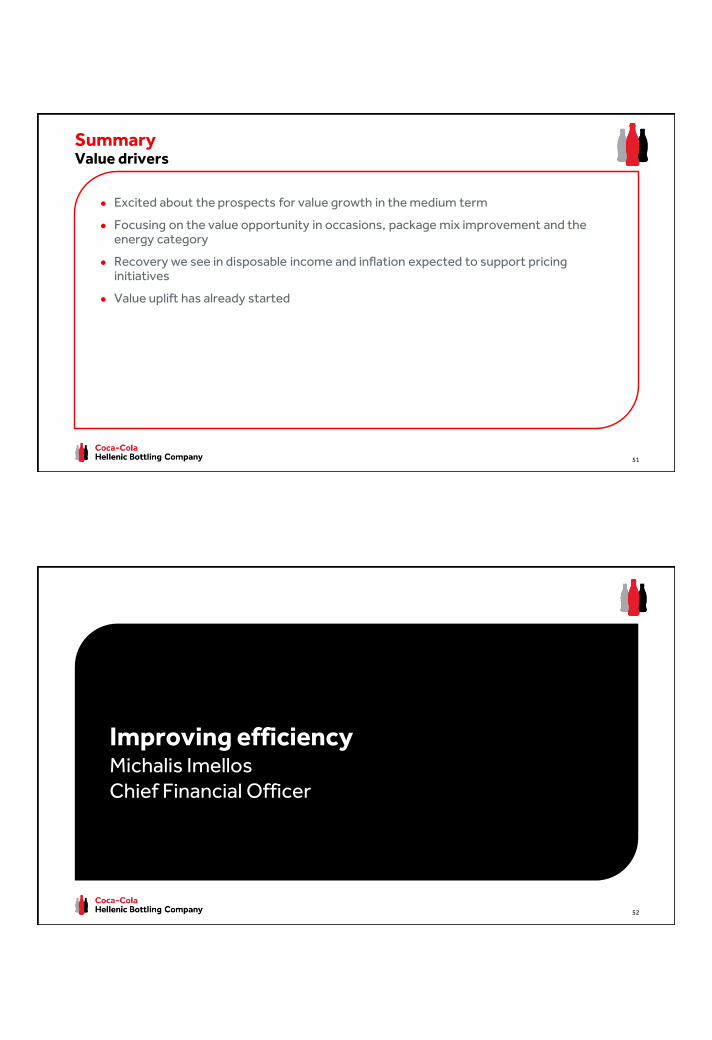
Price on the shelf determined by a wide range of factors
Headline price increases complement our OBPPC strategy
Driving pricing strategiesFour key pillars of pricing strategy
General and food inflationDisposable income
Brand strengthEvolution of per capita
consumptionMarket leadership
Pack elasticity per channelPrice curve per litre by
pack by categoryPrice evolution (CCH &
competition)Average basket size
Channel differences (organised vs fragmented
trade)Monitoring and
adjustments based on competitive price/packMarket concentration
Consumer segmentsOccasions
Shoppingmissions
Route-to-market
Consumer Shopper Channel/Customer
SegmentationDriver of revenue growth management
Adaptable to environment
49
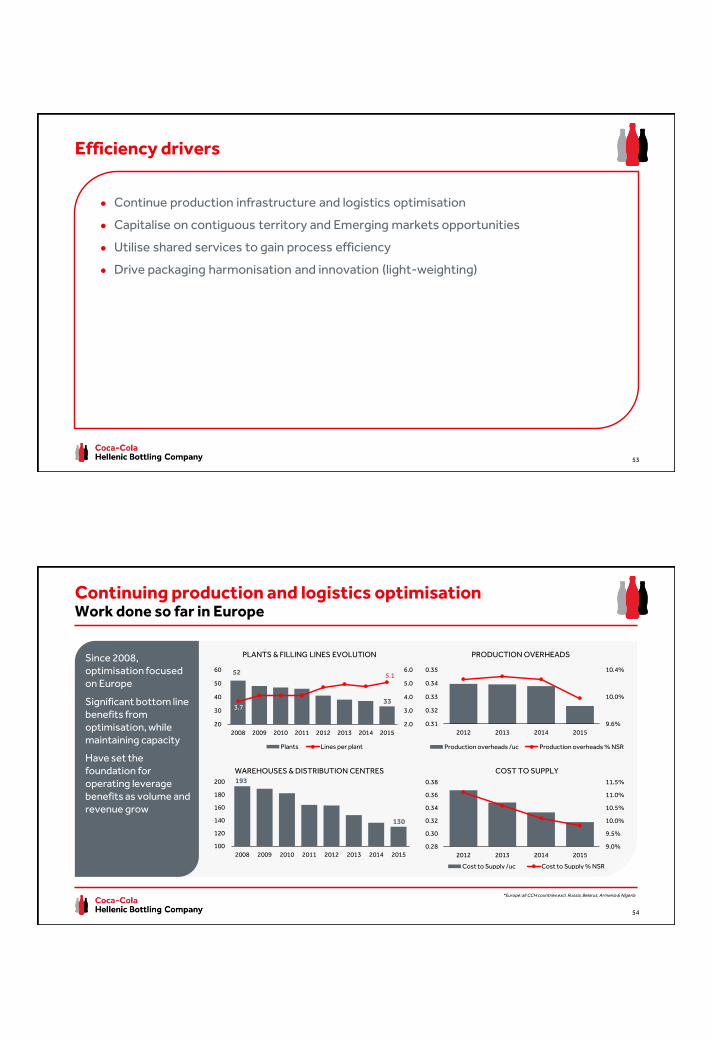
Improvement in FX-neutral net sales revenue per case over the past five years
On average delivering 1.8% growth
2015 impacted by adverse category mix
Q1 2016 in line with guidance for a return to pre-2015 levels of growth
Driving pricing strategiesGood track record despite challenging economies
Average
2.9%
2.2%
1.1%
2.5%
0.3%
2.0%
0%
1%
2%
3%
2011 2012 2013 2014 2015 Q1 2016
FX-NEUTRAL NSR PER UNIT CASE GROWTH
50
SummaryValue drivers
● Excited about the prospects for value growth in the medium term
● Focusing on the value opportunity in occasions, package mix improvement and the energy category
● Recovery we see in disposable income and inflation expected to support pricing initiatives
● Value uplift has already started
51
Improving efficiencyMichalis ImellosChief Financial Officer
52
Efficiency drivers
● Continue production infrastructure and logistics optimisation
● Capitalise on contiguous territory and Emerging markets opportunities
● Utilise shared services to gain process efficiency
● Drive packaging harmonisation and innovation (light-weighting)
53
100
120
140
160
180
200
2008 2009 2010 2011 2012 2013 2014 2015
Since 2008, optimisation focused on Europe
Significant bottom line benefits from optimisation, while maintaining capacity
Have set the foundation for operating leverage benefits as volume and revenue grow
3.7
5.1
2.0
3.0
4.0
5.0
6.0
20
30
40
50
60
2008 2009 2010 2011 2012 2013 2014 2015
Plants Lines per plant
Continuing production and logistics optimisation Work done so far in Europe
52
33
193
130
9.6%
10.0%
10.4%
0.31
0.32
0.33
0.34
0.35
2012 2013 2014 2015
Production overheads /uc Production overheads % NSR
9.0%
9.5%
10.0%
10.5%
11.0%
11.5%
0.28
0.30
0.32
0.34
0.36
0.38
2012 2013 2014 2015
Cost to Supply /uc Cost to Supply % NSR
*Europe: all CCH countries excl. Russia, Belarus, Armenia & Nigeria
54
PLANTS & FILLING LINES EVOLUTION PRODUCTION OVERHEADS
WAREHOUSES & DISTRIBUTION CENTRES COST TO SUPPLY
12.5%
13.0%
13.5%
14.0%
14.5%
0.00
0.10
0.20
0.30
0.40
0.50
0.60
2012 2013 2014 2015
Cost to Supply /uc Cost to Supply % NSR
9.8%
11.8%
13.8%
15.8%
0.32
0.37
0.42
0.47
2012 2013 2014 2015
Production overheads /uc Production overheads % NSR
3.3
4.7
2.0
3.0
4.0
5.0
05
10152025303540
2008 2009 2010 2011 2012 2013 2014 2015
Plants Lines per plant
20406080
100120140160180200
2008 2009 2010 2011 2012 2013 2014 2015
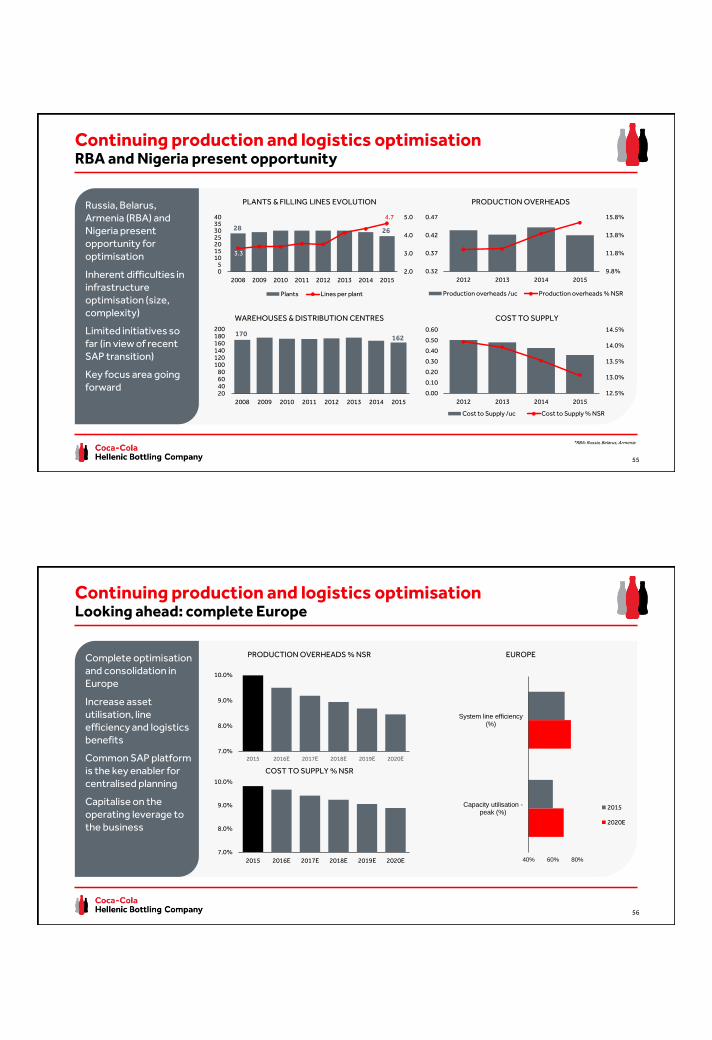
Russia, Belarus, Armenia (RBA) and Nigeria present opportunity for optimisation
Inherent difficulties in infrastructure optimisation (size, complexity)
Limited initiatives so far (in view of recent SAP transition)
Key focus area going forward
Continuing production and logistics optimisation RBA and Nigeria present opportunity
26
33
170
130
*RBA: Russia, Belarus, Armenia
55
PLANTS & FILLING LINES EVOLUTION PRODUCTION OVERHEADS
WAREHOUSES & DISTRIBUTION CENTRES COST TO SUPPLY
28
162
7.0%
8.0%
9.0%
10.0%
2015 2016E 2017E 2018E 2019E 2020E
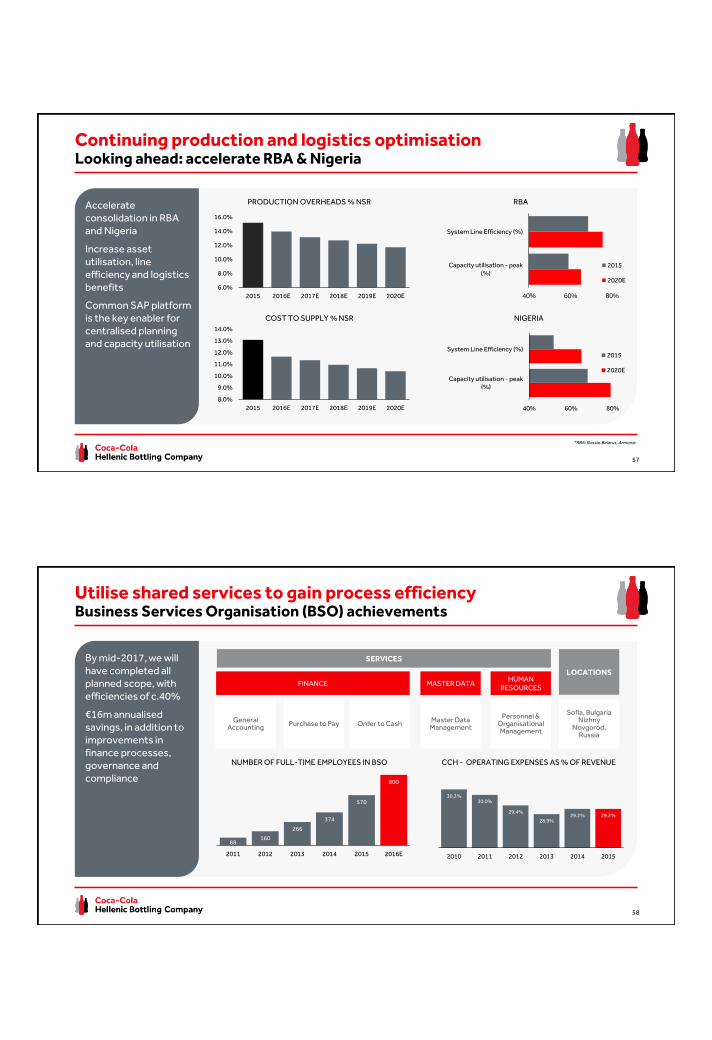
Complete optimisationand consolidation in Europe
Increase asset utilisation, line efficiency and logistics benefits
Common SAP platform is the key enabler for centralised planning
Capitalise on the operating leverage to the business
Continuing production and logistics optimisation Looking ahead: complete Europe
56
PRODUCTION OVERHEADS % NSR EUROPE
COST TO SUPPLY % NSR
40% 60% 80%
Capacity utilisation -peak (%)
System line efficiency(%)
2015
2020E
7.0%
8.0%
9.0%
10.0%
2015 2016E 2017E 2018E 2019E 2020E
8.0%
9.0%
10.0%
11.0%
12.0%
13.0%
14.0%
2015 2016E 2017E 2018E 2019E 2020E
6.0%
8.0%
10.0%
12.0%
14.0%
16.0%
2015 2016E 2017E 2018E 2019E 2020E
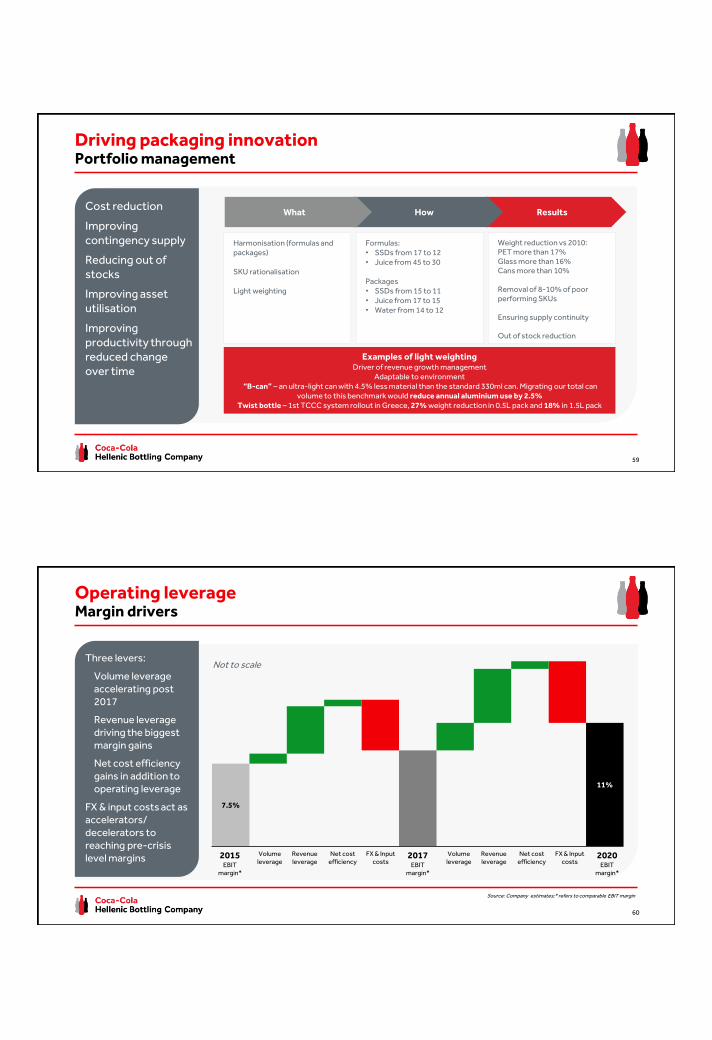
Accelerate consolidation in RBA and Nigeria
Increase asset utilisation, line efficiency and logistics benefits
Common SAP platform is the key enabler for centralised planning and capacity utilisation
Continuing production and logistics optimisation Looking ahead: accelerate RBA & Nigeria
*RBA: Russia, Belarus, Armenia
57
PRODUCTION OVERHEADS % NSR RBA
COST TO SUPPLY % NSR
40% 60% 80%
Capacity utilisation - peak(%)
System Line Efficiency (%)
2015
2020E
40% 60% 80%
Capacity utilisation - peak(%)
System Line Efficiency (%)2015
2020E
NIGERIA
By mid-2017, we will have completed all planned scope, with efficiencies of c.40%
€16m annualisedsavings, in addition to improvements in finance processes, governance and compliance
Utilise shared services to gain process efficiencyBusiness Services Organisation (BSO) achievements
88160
266
374
570
800
2011 2012 2013 2014 2015 2016E
30.3%30.0%
29.4%
28.9%29.2% 29.2%
2010 2011 2012 2013 2014 2015
FINANCE MASTER DATAHUMAN
RESOURCES
SERVICES
Order to CashGeneral
AccountingPurchase to Pay
Personnel & Organisational Management
Master DataManagement
Sofia, Bulgaria Nizhny
Novgorod, Russia
LOCATIONS
58
NUMBER OF FULL-TIME EMPLOYEES IN BSO CCH - OPERATING EXPENSES AS % OF REVENUE
ResultsHowWhatCost reduction
Improving contingency supply
Reducing out of stocks
Improving asset utilisation
Improving productivity through reduced change over time
Driving packaging innovationPortfolio management
Harmonisation (formulas and packages)
SKU rationalisation
Light weighting
Formulas:• SSDs from 17 to 12• Juice from 45 to 30
Packages• SSDs from 15 to 11• Juice from 17 to 15• Water from 14 to 12
Weight reduction vs 2010:PET more than 17%Glass more than 16%Cans more than 10%
Removal of 8-10% of poor performing SKUs
Ensuring supply continuity
Out of stock reduction
Examples of light weightingDriver of revenue growth management
Adaptable to environment“B-can” – an ultra-light can with 4.5% less material than the standard 330ml can. Migrating our total can
volume to this benchmark would reduce annual aluminium use by 2.5%Twist bottle – 1st TCCC system rollout in Greece, 27% weight reduction in 0.5L pack and 18% in 1.5L pack
59
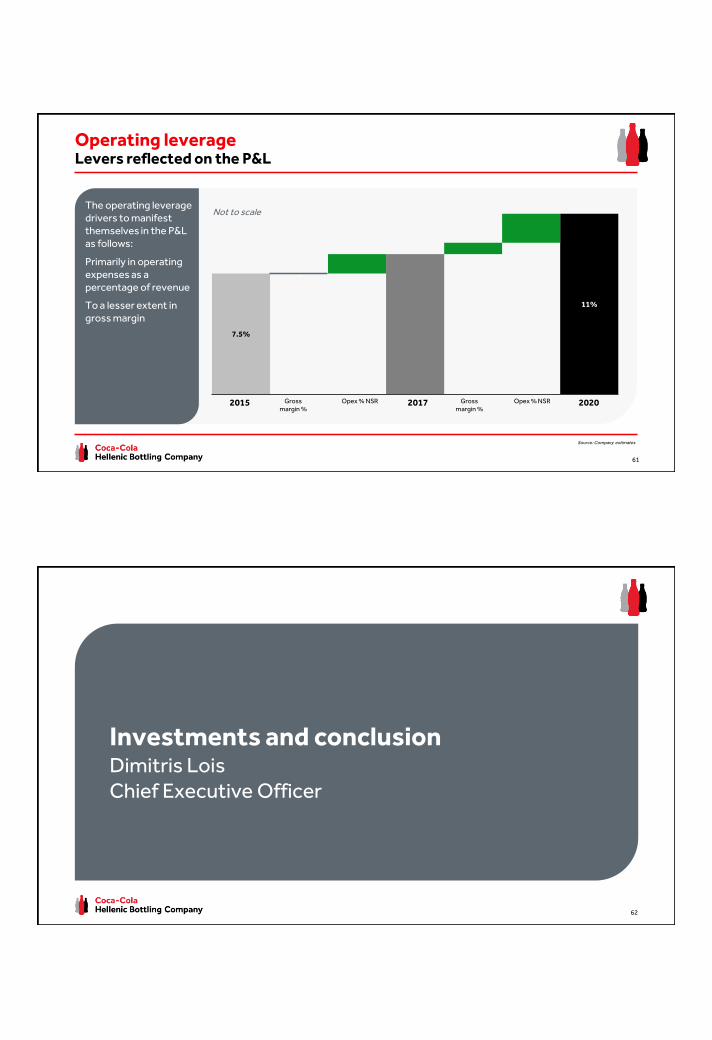
Three levers:
Volume leverage accelerating post 2017
Revenue leverage driving the biggest margin gains
Net cost efficiency gains in addition to operating leverage
FX & input costs act as accelerators/decelerators to reaching pre-crisis level margins
Operating leverageMargin drivers
7.5%
11%
FX & Input costs
Net cost efficiency
Revenueleverage
Net cost efficiency
Revenueleverage
Volumeleverage
2017EBIT
margin*
Volumeleverage
2015EBIT
margin*
2020EBIT
margin*
FX & Input costs
Source: Company estimates;* refers to comparable EBIT margin
60
Not to scale
The operating leverage drivers to manifest themselves in the P&L as follows:
Primarily in operating expenses as a percentage of revenue
To a lesser extent in gross margin
Operating leverageLevers reflected on the P&L
2020Opex % NSRGross margin %
2017Opex % NSRGross margin %
Source: Company estimates
61
7.5%
0
11%
2015
Not to scale
Investments and conclusionDimitris LoisChief Executive Officer
62
Investing for the long term
● Our people
● Growing sustainably and responsibly
● Working with The Coca-Cola Company
● Investing in the business
63
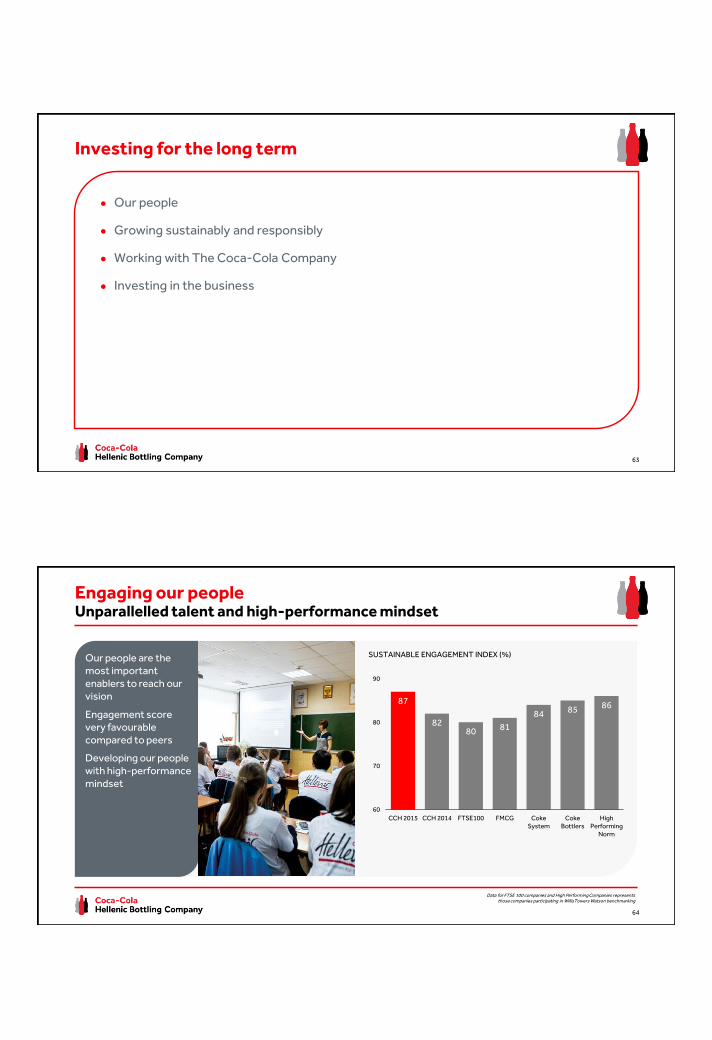
Our people are the most important enablers to reach our vision
Engagement score very favourablecompared to peers
Developing our people with high-performance mindset
Engaging our peopleUnparallelled talent and high-performance mindset
87
8280 81
84 85 86
60
70
80
90
CCH 2015 CCH 2014 FTSE100 FMCG CokeSystem
CokeBottlers
HighPerforming
Norm
Data for FTSE 100 companies and High Performing Companies representsthose companies participating in WillisTowers Watson benchmarking
64
SUSTAINABLE ENGAGEMENT INDEX (%)
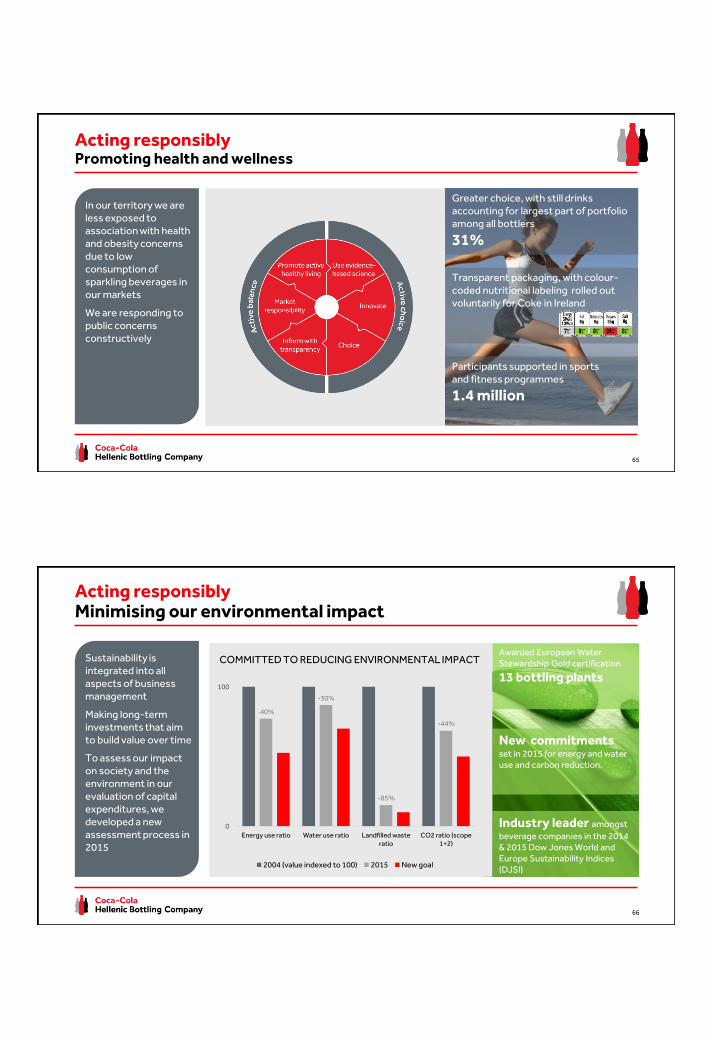
Transparent packaging, with colour-coded nutritional labeling rolled out voluntarily for Coke in Ireland
Acting responsiblyPromoting health and wellness
Greater choice, with still drinks accounting for largest part of portfolio among all bottlers
31%
Participants supported in sports and fitness programmes
1.4 million
In our territory we are less exposed to association with health and obesity concerns due to low consumption of sparkling beverages in our markets
We are responding to public concerns constructively
65
Transparent packaging, with colour-coded nutritional labeling rolled out voluntarily for Coke in Ireland
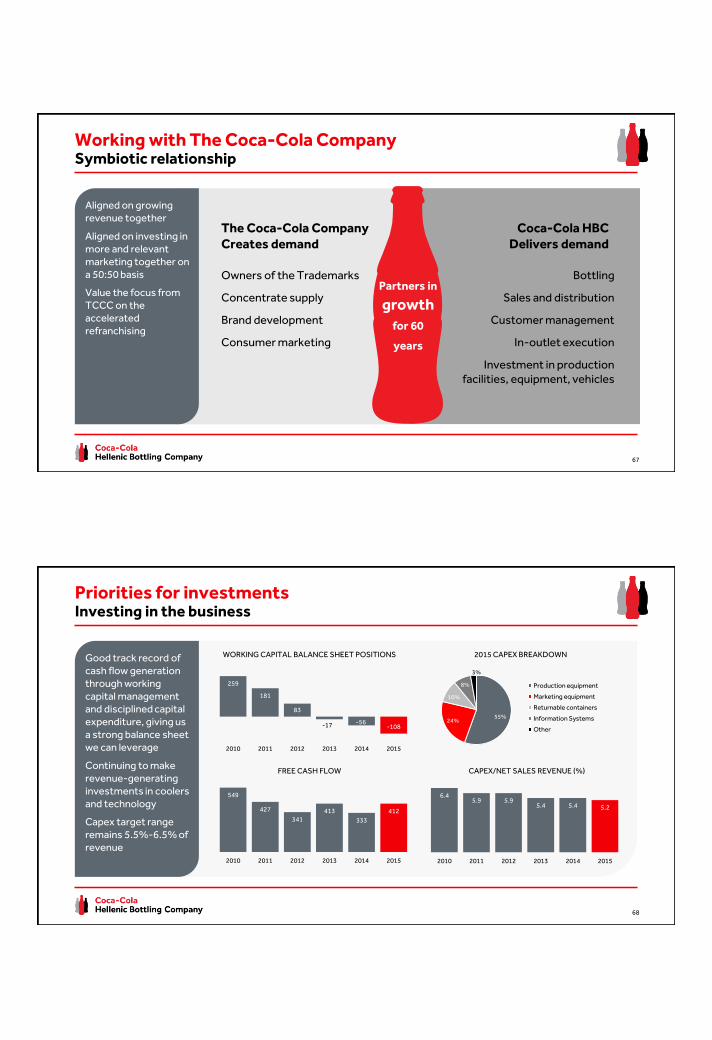
Awarded European Water Stewardship Gold certification
13 bottling plants
New commitmentsset in 2015 for energy and water use and carbon reduction.
Industry leader amongst
beverage companies in the 2014 & 2015 Dow Jones World and Europe Sustainability Indices (DJSI)
Acting responsiblyMinimising our environmental impact
66
Sustainability is integrated into all aspects of business management
Making long-term investments that aim to build value over time
To assess our impact on society and the environment in our evaluation of capital expenditures, we developed a new assessment process in 2015
-40%
-30%
-85%
-44%
0
100
Energy use ratio Water use ratio Landfilled wasteratio
CO2 ratio (scope1+2)
2004 (value indexed to 100) 2015 New goal
COMMITTED TO REDUCING ENVIRONMENTAL IMPACT
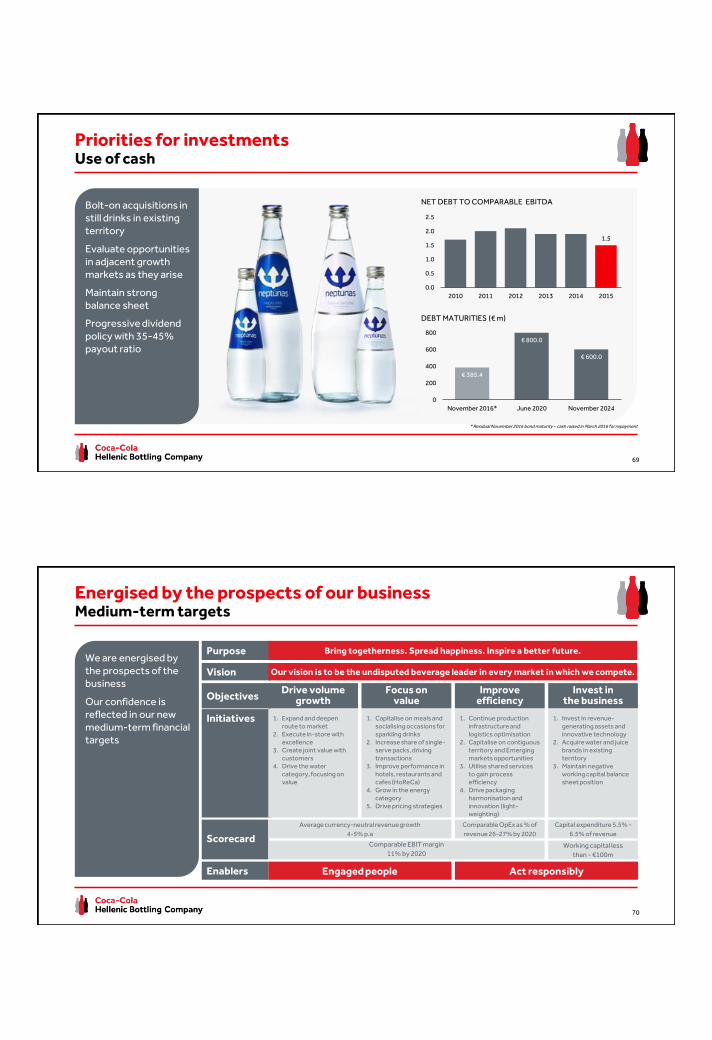
Working with The Coca-Cola CompanySymbiotic relationship
Owners of the Trademarks
Concentrate supply
Brand development
Consumer marketing
Bottling
Sales and distribution
Customer management
In-outlet execution
Investment in production facilities, equipment, vehicles
The Coca-Cola Company Creates demand
Coca-Cola HBC Delivers demand
Partners in
growth for 60
years
Aligned on growing revenue together
Aligned on investing in more and relevant marketing together on a 50:50 basis
Value the focus from TCCC on the accelerated refranchising
67
55%24%
10%
8%
3%
Production equipment
Marketing equipment
Returnable containers
Information Systems
Other
259
181
83
-17 -56-108
2010 2011 2012 2013 2014 2015
549
427
341
413
333
412
2010 2011 2012 2013 2014 2015
6.45.9 5.9
5.4 5.4 5.2
2010 2011 2012 2013 2014 2015
Good track record of cash flow generation through working capital management and disciplined capital expenditure, giving us a strong balance sheet we can leverage
Continuing to make revenue-generating investments in coolers and technology
Capex target range remains 5.5%-6.5% of revenue
Priorities for investmentsInvesting in the business
68
WORKING CAPITAL BALANCE SHEET POSITIONS 2015 CAPEX BREAKDOWN
FREE CASH FLOW CAPEX/NET SALES REVENUE (%)
Bolt-on acquisitions in still drinks in existing territory
Evaluate opportunities in adjacent growth markets as they arise
Maintain strong balance sheet
Progressive dividend policy with 35-45% payout ratio
Priorities for investmentsUse of cash
* Residual November 2016 bond maturity – cash raised in March 2016 for repayment
69
NET DEBT TO COMPARABLE EBITDA
DEBT MATURITIES (€ m)
1.5
0.0
0.5
1.0
1.5
2.0
2.5
2010 2011 2012 2013 2014 2015
€ 385.4
€ 800.0
€ 600.0
0
200
400
600
800
November 2016* June 2020 November 2024
Energised by the prospects of our businessMedium-term targets
Purpose Bring togetherness. Spread happiness. Inspire a better future.
Vision Our vision is to be the undisputed beverage leader in every market in which we compete.
Enablers Engaged people Act responsibly
Initiatives 1. Expand and deepen route to market
2. Execute in-store with excellence
3. Create joint value with customers
4. Drive the water category, focusing on value
ObjectivesDrive volume
growth
1. Capitalise on meals and socialising occasions for sparkling drinks
2. Increase share of single-serve packs, driving transactions
3. Improve performance in hotels, restaurants and cafes (HoReCa)
4. Grow in the energy category
5. Drive pricing strategies
Focus on value
1. Continue production infrastructure and logistics optimisation
2. Capitalise on contiguous territory and Emerging markets opportunities
3. Utilise shared services to gain process efficiency
4. Drive packaging harmonisation and innovation (light-weighting)
Improve efficiency
1. Invest in revenue-generating assets and innovative technology
2. Acquire water and juice brands in existing territory
3. Maintain negative working capital balance sheet position
Invest in the business
We are energised by the prospects of the business
Our confidence is reflected in our new medium-term financial targets
70
Scorecard
Average currency-neutral revenue growth
4-5% p.a
Comparable OpEx as % of
revenue 26-27% by 2020
Capital expenditure 5.5% -
6.5% of revenue
Comparable EBIT margin
11% by 2020Working capital less
than - €100m

Speaker biographies
Dimitris Lois (55) Chief Executive Officer
Appointed July 2011
Previous Group roles: Mr. Lois joined the Group as Region Director in 2007. He was appointed Chief Operating Officer in 2009.
Previous relevant experience: Mr. Lois began his career in 1988 at Grecian Magnesite S.A., where he held various managerial positions including that of business development manager. He joined Frigoglass S.A.I.C. in 1997 and after serving in various international positions, he was appointed managing director in August 2003.
Nationality: Greek
Michalis Imellos
(47) Chief Financial Officer
Appointed April 2012
Previous Group roles: Region finance director responsible for Nigeria, Romania, Moldova, Bulgaria, Greece, Cyprus and Serbia and Montenegro; General manager, Romania and Moldova.
Previous relevant experience: Mr. Imellos held a number of finance positions in the UK-based European headquarters of Xerox, including those of European Mergers & Acquisitions Director and Finance Director of the Office Europe Division. He managed the financial, tax and legal aspects of Xerox’s sponsorship of the Athens 2004 Olympic Games as well as the finance function of the company’s operations in Greece. He is a Fellow of the Institute of Chartered Accountants in England and Wales, and started his career at Ernst & Young.
Nationality: Greek
Keith Sanders
(55) Region Director: Armenia, Belarus, Estonia, Latvia, Lithuania, Poland, Russian Federation, Ukraine and Moldova
Appointed August 2009
Previous Group roles: General manager of the Company’s operations in Russia (2004).
Previous relevant experience: Prior to joining the Group, Mr. Sanders spent 11 years within the Coca-Cola System. He started his career with The Coca-Cola Company in a regional marketing role within the Gulf Region. In 1993, he was appointed human resources and training manager for the Gulf Region. In 1994, he assumed his first bottling general manager role in Bahrain, and then moved through a series of larger country general management roles until 2001, when he was appointed director for bottling operations in the Eurasia & Middle East Division with responsibility for Saudi Arabia, Pakistan, UAE, Oman, Bahrain and Qatar. Prior to joining the Coca-Cola System, Mr. Sanders spent six years with Procter & Gamble in the United States in a variety of sales and marketing roles.
Nationality: American
Zoran Bogdanovic
(44) Region Director: Bosnia and Herzegovina, Bulgaria, Croatia, Cyprus, FYROM, Greece, Northern Ireland and Republic of Ireland, Nigeria, Romania and Serbia (including the Republic of Kosovo), Slovenia and Montenegro
Appointed June 2013
Previous Group roles: Mr. Bogdanovic’s previous roles include: member of the Finance team of Coca-Cola HBC Croatia from 1996 to 1998; CFO and then general manager of the Croatian operations from 1998 to 2004; Country general manager of Coca-Cola HBC Croatia from 2004 to 2008; Country general manager for Coca-Cola HBC Switzerland from 2008 to 2011; and Country general manager for Coca-Cola HBC Greece from 2011 to 2013.
Previous relevant experience: Mr. Bogdanovic started his career as an auditor with Arthur Andersen before joining Coca-Cola HBC Croatia in 1996.
Nationality: Croatian
Naya Kalogeraki
(46) Country General Manager Greece & Cyprus
Appointed September 2013
Previous Group roles: Director of Strategy, CEO office
Previous relevant experience: Mrs. Kalogeraki joined Coca-Cola Hellenic in 1998 from The Coca-Cola Company where she held a number of Marketing positions up to Marketing Manager. From 1998 and onwards she built up her career assuming roles of increased scale and scope including Marketing Director, Trade Marketing Director, Sales Director and Country Commercial Director, Greece. Throughout the years she has been heavily involved in Group strategic projects and tasks forces, addressing mission critical business imperatives.
Nationality: Greek
Ben Langat
(45) Country General Manager Nigeria
Appointed November 2012
Previous Group roles: Chief Finance Officer, Nigerian Bottling Company Limited
Previous relevant experience: Mr. Langat joined NBC as Chief Finance Officer in June 2009 from Unilever. He spent over 16 years with Unilever in various roles in Kenya, Malawi and Ghana. He joined Unilever as Internal Auditor and rose to the position of Finance Director Unilever Ghana, a role he occupied before joining NBC. Mr. Langat is a Certified Public Accountant of Kenya (CPA-K) and a member of the Institute of Certified Public Accountants of Kenya (ICPAK).
Nationality: Kenyan
Jaak Mikkel
(42) Country General Manager Romania
Previous Group roles: General Manager Pivara Skopje (CCH JV with Heineken) 2012-2014, Commercial Director Baltic countries (Estonia, Latvia, Lithuania) 2008-2012
Previous relevant experience: Prior to joining Coca-Cola Hellenic, Mr. Mikkel spent 10 years with Royal Dutch Shell in various retail sales and strategy roles in Nordic countries (based in Norway), Central Eastern Europe (based in Poland) and Baltic countries (based in Estonia)
Nationality: Estonian
Vitaliy Novikov
(37) Country General Manager Italy
Appointed July 2014
Previous Group roles: Country General Manager Poland; Country General Manager Baltics
Previous relevant experience: Mr. Novikov joined Coca-Cola HBC in 2011 as General Manager, Baltics; in 2013 he was appointed to the role of General Manager, Poland. Before joining Coca-Cola HBC, he worked at Johnson & Johnson, where he led the establishment of the Ukrainian operation holding the position of Managing Director for Ukraine. Prior to joining Johnson & Johnson, Mr. Novikov held a number of senior positions in sales and marketing in various European geographies with Henkel. Mr. Novikov holds a PhD in Economics and Finance from the University of St. Gallen, a post-graduate degree in Business Administration from Vienna University of Economics and Business Administration and a Master’s degree in International Economics and Business Administration from Kyiv National Economics University.
Nationality: Ukrainian
Stefanos Vafidis
(55) Country General Manager Russia
Appointed September 2009
Previous Group roles: Country General Manager Serbia, Montenegro & Kosovo for eight years (November 2001 – August 2009); General Manager of Greek islands for two years (1999-2001); Commercial Manager Northern Greece for three years (1996-1998); Mr Vafeidis joined Coca-Cola Hellenic on June 1991 as Graduate Trainee.
Nationality: Greek