Embed Size (px)
Citation preview
S T A T I S T I C A L B O O K S
Ageing EuropeLOOKING AT THE LIVES
OF OLDER PEOPLE IN THE EU 2020 edition

Ageing EuropeLOOKING AT THE LIVES
OF OLDER PEOPLE IN THE EU 2020 edition
Manuscript completed in September 2020
The European Commission is not liable for any consequence stemming from the reuse of this publication.
Luxembourg: Publications Office of the European Union, 2020
© European Union, 2020
The reuse policy of European Commission documents is implemented based on Commission Decision 2011/833/EU of 12 December 2011 on the reuse of Commission documents (OJ L 330, 14.12.2011, p. 39).
Except otherwise noted, the reuse of this document is authorised under a Creative Commons Attribution 4.0 International (CC-BY 4.0) licence (https://creativecommons.org/licenses/by/4.0/). This means that reuse is allowed provided appropriate credit is given and any changes are indicated.
For any use or reproduction of elements that are not owned by the European Union, permission may need to be sought directly from the respective rightholders. The European Union does not own the copyright in relation to the following elements:cover photo, YAKOBCHUK VIACHESLAV/Shutterstock.com; introduction, oneinchpunch/Shutterstock.com; Chapter 1, goodluz/Shutterstock.com; Chapter 2, belushi/Shutterstock.com; Chapter 3, Rido/Shutterstock.com; Chapter 4, wavebreakmedia/Shutterstock.com; Chapter 5, UfaBizPhoto/Shutterstock.com; Chapter 6, CREATISTA/Shutterstock.com.
Theme: Population and social conditionsCollection: Statistical books
ISBN 978-92-76-21520-2doi:10.2785/628105Cat. No: KS-02-20-655-EN-N
Ageing Europe — looking at the lives of older people in the EU — 2020 edition 3
ForewordPopulation ageing is a phenomenon that affects almost every developed country in the world: the number and the proportion of older people is increasing across large parts of the globe. This transformation is likely to have a considerable impact on most aspects of society and the economy, including housing, healthcare, social protection, labour markets, the demand for goods and services, macroeconomic and fiscal sustainability, family structures and intergenerational ties.
The Eurostat publication Ageing Europe — looking at the lives of older people in the EU provides a broad range of statistics that describe the European Union’s (EU) older generations and their activities. This is the second edition of this publication, which has a gender dimension added to many of the statistical indicators. Looking at various socioeconomic statistics by age gives us a better understanding of intergenerational differences and also draws a picture of the lives of older people.
As EU citizens expect to live increasingly long lives, their attention turns to how they can make the most of their retirement. Many older people engage in some kind of activity or employment. Some take up new pastimes, sports or learn new skills, others decide to volunteer or travel, while some may work on a part-time basis.
Studies confirm that older people are more likely to maintain their physical and mental health by remaining active and preserving their social contacts. This may also improve their chances of a happier retirement with higher levels of life satisfaction.
I hope that you will find plenty of interesting facts and statistics in this publication.
Mariana KotzevaDirector-General, Eurostat
Editors
Ageing Europe — looking at the lives of older people in the EU — 2020 edition4
AbstractAgeing Europe — looking at the lives of older people in the EU is a Eurostat publication providing a broad range of statistics that describe the everyday lives of the European Union’s (EU) older generations.
Each chapter presents statistical information in tables, figures and maps, accompanied by a descriptive text highlighting the main findings. Statistical indicators are presented for the following six sub-jects: population developments; housing and living conditions; health and disability; working and mov-ing into retirement; pensions, income and expenditure; social life and opinions.
EditorsLouise Corselli-Nordblad and Helene Strandell Eurostat, Unit B4 — Dissemination and user support
Contact detailsEurostat Bâtiment Joseph Bech 5, rue Alphonse Weicker 2721 Luxembourg E-mail: [email protected]
ProductionInforma s.à r.l. — Giovanni Albertone, Simon Allen and Andrew Redpath
For more information please consultEurostat website: https://ec.europa.eu/eurostatStatistics Explained: https://ec.europa.eu/eurostat/statistics-explained
AcknowledgementsThe editors of the publication would like to thank their Eurostat colleagues who were involved in its preparation: Jørgen Rasmussen (Eurostat Unit E4 — Regional statistics and geographical information); Marta Beck-Domżalska (Eurostat Unit F1 — Social indicators: methodology and development; relations with users); Gabriela Senchea Badea (Eurostat Unit F2 — Population and migration); Giacomo Frosi and Fabienne Montaigne (Eurostat Unit F3 — Labour market and lifelong learning); Emilio Di Meglio and Barbara Moench (Eurostat Unit F4 — Income and living conditions; quality of life).
Editors
Ageing Europe — looking at the lives of older people in the EU — 2020 edition 5
Contents
Foreword 3
Introduction 7
1. Population developments 15
2. Housing and living conditions 33
3. Health and disability 49
4. Working and moving into retirement 89
5. Pensions, income and expenditure 113
6. Social life and opinions 141


Introduction
Introduction
Ageing Europe — looking at the lives of older people in the EU — 2020 edition8
Why does population ageing matter?There were 90.5 million older people — defined here as those aged 65 years or more — living in the EU-27 at the start of 2019; this equated to approximately one fifth (20.3 %) of the total population. During the next three decades, the number of older people in the European Union (EU) is projected to follow an upward path, peaking at 129.8 million inhabitants in 2050; their relative share of the total population will also gradually increase and is projected to reach 29.4 % in 2050.
Population ageing has resulted primarily from a long-term fall in fertility rates and increased life expectancy (longevity), the latter reflecting a number of different factors, including:
• reductions in child mortality;• advances in public health and medical
technologies;• increased awareness of the benefits linked
to a healthy lifestyle;• a move away from heavy labour towards
tertiary occupations;• improved living conditions.
These changes have led to a growing number and share of older people and this process of demographic ageing can, in many ways, be considered a success story. For a large number of people there is much to look forward to in later life — especially if these extra years are in relatively good health. Older people are quite often more satisfied with life and many feel a stronger connection to their families, friends and local communities.
The growing number and share of older people within society poses a range of economic challenges. Some analysts suggest that population ageing will likely
exert downward pressure on economic growth, reduce labour supply, lead to higher (age-related) social costs and impact on the sustainability of government finances. These arguments are centred on the assumption that the old-age dependency ratio — in other words, the number of older people relative to the size of the working-age population — will continue to rise. As this ratio increases, there is a decline in the size of the workforce that is potentially available to take care of the older generations and this has already led to an increased burden on government finances, changes to the statutory retirement age and lower levels of pension provision.
Other observers argue that population ageing need not impede economic growth and that it may instead provide a stimulus for developing new goods and services, for example, housing or transport adapted to the needs of an ageing population, or a range of new social care services. Furthermore, it is increasingly common to find a growing share of older people facing fewer risks (than younger generations) from poverty or social exclusion; this pattern has become all the more apparent in the aftermath of the global financial and economic crisis, with real wages stagnating or falling for much of the working population. In some EU Member States, this had led to a growing proportion of older people being relatively well off, which could result in a ‘demographic dividend’, insofar as ageing populations may choose to spend more. By contrast, the ongoing COVID-19 pandemic has in general had a much greater impact on the health of older people, as the risk of illness and death increases with age. Older people, particularly those in residential care, are more likely to face the challenges associated with a lack of personal contact with other family members, friends and acquaintances.
Introduction
Ageing Europe — looking at the lives of older people in the EU — 2020 edition 9
Defining older peopleThere are different ways of defining older people, while public perception as to what constitutes being old can differ widely. Statistics on ageing generally categorise older people as being above a certain age threshold. Indeed, the United Nations (UN) noted in World Population Ageing 2019 that older people are commonly defined as those aged 60 or 65 years or more, while the World Health Organisation (WHO) states that older people in developed world economies are commonly defined as those aged 65 years or more. The WHO also uses an alternative definition, whereby an older person is defined as someone who has passed the median life expectancy at birth.
A practical approach has been taken within Ageing Europe — looking at the lives of older people in the EU. The following terminology is employed:
• older people — those aged 65 years or more;
• very old people — those aged 85 years or more.
The principal focus of this publication concentrates on older people (aged 65 years or more). Nevertheless, some sections — for example, the transition from work into retirement — present data covering people aged 55 years or more. Furthermore, the constraints of official statistics in general — and more specifically the various surveys that have been employed as sources of information — have a practical impact on the information presented. Survey-specific requirements for each of the main sources determine the availability and choice of age groups available; this explains why some sections refer simply to a broad age range covering older people aged 65 years or more, whereas other sections might present data mainly for 10-year age groups, covering people aged 55-64 years, 65-74 years, 75-84 years and 85 years or more.
EU policyWith populations ageing across the EU, pensions, healthcare and long-term care systems risk becoming financially unsustainable, as a shrinking labour force may no longer be able to provide for a growing number of older people. Active ageing is the European Commission’s policy directed towards ‘helping people stay in charge of their own lives for as long as possible as they age and, where possible, to contribute to the economy and society’. Policymakers hope to address these challenges by turning them into opportunities, with a focus on extending working lives and providing older people with access to adequate social protection and, where necessary, supplementary pensions.
Living longer does not necessarily mean living a healthier, more active and independent life — this is all the more important given the growing number of older and very old people in the EU. The European innovation partnership (EIP) on active and healthy ageing was created in 2011 and aims to foster innovation that will promote active ageing and raise healthy life expectancy.
Furthermore, as an increasing number of older people reach an age where declining physical and mental health makes them dependent on help from others, there are considerable implications for long-term care expenditure. The European pillar of social rights stresses the right to affordable long-term care services of good quality, in particular home-based care and community-based services. It also underlines that everyone in old age should have a pension that is commensurate with their contributions and the right to resources that ensure living in dignity.
Introduction
Ageing Europe — looking at the lives of older people in the EU — 2020 edition10
The Social Protection Committee is an advisory policy committee to the Ministers in the Employment and Social Affairs Council (EPSCO). It has looked at ways of providing adequate and sustainable long-term care in ageing societies, through investing in preventative care, rehabilitation, age-friendly environments, and more ways of delivering care that are better adjusted to people’s needs and existing abilities; these developments could potentially create many more jobs in the long-term care sector and much greater demand for a wide range of age-related goods and services, including assistive technology.
Every three years, the European Commission communicates on ageing from a monetary perspective through a report on economic and budgetary projections — the latest of these was released in 2018. The publication provides information on age-related expenditure projections, based on Eurostat population projections; it highlights the budgetary impact of ageing on the sustainability of EU public finances.
As part of the European Commission’s work on a ‘new push for democracy’ which forms part of its priorities for the period 2019-2024, a report was released in June 2020 in relation to the ‘Impact of Demographic Change in Europe’. It highlights the profound changes that have taken place following the outbreak of the COVID-19 pandemic and the lasting impact that the pandemic is likely to have on the way we live and work together (at a time when the EU had already been going
through a period of profound demographic and societal change). The report presents the main drivers of demographic change and the impact they are having across the EU. It launches a process aimed at identifying specific actions and solutions, mindful of lessons learned from the COVID-19 pandemic, to support people, regions and communities that are most affected and to enable them to adapt to changing realities.
FOR MORE INFORMATION:
• Active ageing — https://ec.europa.eu/social/main.jsp?langId=en&catId=1062
• EIP on active and healthy ageing — https://ec.europa.eu/eip/ageing/home_en
• European pillar of social rights: — https://ec.europa.eu/commission/priorities/deeper-and-fairer-economic-and-monetary-union/european-pillar-social-rights_en
• Delivering on the European pillar of social rights — https://ec.europa.eu/social/main.jsp?langId=en&catId=1226
• European social protection committee — https://ec.europa.eu/social/main.jsp?catId=758
• 2018 Ageing report: policy challenges for an ageing societ — https://ec.europa.eu/info/news/economy-finance/policy-implications-ageing-examined-new-report-2018-may-25_en
• The impact of demographic change in Europe — https://ec.europa.eu/info/strategy/priorities-2019-2024/new-push-european-democracy/impact-demographic-change-europe_en
Introduction
Ageing Europe — looking at the lives of older people in the EU — 2020 edition 11
Structure of this publicationAgeing Europe — looking at the lives of older people in the EU focuses on the most recent data available, usually for 2018 or 2019 (although some older data are presented from surveys that are only carried out every four or five years). It also provides information of change over time: a majority of these findings go back in time to look at recent developments, although they are supplemented by a set of population projections shown through to 2050. The findings are supported by a range of tables, figures and maps which are designed to highlight inter-generational variations.
Chapter 1 looks at population developments: all of the EU Member States will experience population ageing in the coming decades, however, the size of this demographic challenge will vary considerably as will the drivers of population ageing. Is the ageing process driven by low fertility rates and/or increases in life expectancy and will it be further amplified by net migration (more people emigrating than people immigrating)?
Chapter 2 provides information on housing and living conditions for older people. A relatively high share of older people in the EU live in rural areas; this distribution may have an important bearing on policymakers when assessing access to various services for older people. The type of household in which older people live also plays an important role in determining their quality of life, risk of poverty, or the services that they require, with a growing number of older people living alone.
Chapter 3 looks at issues related to health and disability. Health is an important measure of well-being: this is particularly true for older people in relation to their personal independence and participation in local communities. As older people have different healthcare requirements, health systems will need to adapt and it is likely that there will
be a considerable surge in demand for long-term care (in residential facilities) and services covering diseases that typically affect older people (for example, arthritis, mental health /dementia, and sensory impairment).
Chapter 4 presents information on the transition from work into retirement. Economic activity rates for older people in the EU have gradually increased during the last three decades. Work-life balance is a concept that is relevant to older workers as they plan their exit from the labour force: a growing number benefit from flexible working patterns that allow them to remain in work until a later age, increasing their income and reducing their reliance on support from taxpayers.
Chapter 5 provides information on pensions, income, and expenditure. As people age, their spending patterns are transformed: for example, older people tend to devote a higher proportion of their expenditure to health, food or the home in which they live, and a lower proportion to transport, clothing and footwear. Older people are relatively well off in several of the EU Member States: indeed, they are often found to have a lower risk of poverty than other age groups. This inter-generational divide is likely to grow in the coming years, with some evidence that younger generations find it increasingly difficult to finance their studies, enter the home ownership market, and save adequately for their retirement, and at the same time may expect to continue working to a later age.
Chapter 6 concludes by presenting information on the social life and opinions of older people. Retirees who are fortunate to be in good health are much more likely to take part in a range of activities, such as returning to education, continuing or taking up a hobby, travelling or playing sports. Alongside participation in a diverse range of activities, another factor that can have an important influence on the well-being of older people is the frequency with which
Introduction
Ageing Europe — looking at the lives of older people in the EU — 2020 edition12
they have regular contacts with family and/or friends. The subjective well-being of older people may be analysed through self-reported measures of overall life satisfaction. In conclusion, it is particularly inspiring to note that some age groups of older people had higher levels of life satisfaction (compared with other age groups) in several western and northern EU Member States.
A short reading guideAgeing Europe — looking at the lives of older people in the EU is available in two formats on Eurostat’s website: as an online publication via Statistics Explained and as a PDF file.
COVERAGE AND TIMELINESS OF THE DATA
The data presented within Ageing Europe — looking at the lives of older people in the EU were extracted during July 2020; the publication was drafted during August 2020.
Ageing Europe — looking at the lives of older people in the EU contains statistics for the Member States of the EU and, where available, data are also shown for the United Kingdom and EFTA countries (Iceland, Liechtenstein, Norway and Switzerland). The EU-27 aggregate is only presented when information was available for all of the EU Member States; any incomplete totals that were created have been systematically footnoted. As such, any time series for the EU-27 systematically refer to a sum or an average for the 27 Member States at the time of drafting, regardless of when they joined the EU. For a small number of data sources (such as data from older Eurobarometer public opinion surveys), EU totals or averages are only available for the EU as it was composed before the withdrawal of the United Kingdom, in other words for the EU-28. In these cases, data for the EU-27 have been estimated by adjusting the EU-28 data to remove the population-weighted data for the United Kingdom.
The geographical descriptions used to group EU Member States, for example, ‘northern’, ‘eastern’, ‘southern’ and ‘western’ are not intended as political categorisations. Rather, these references are made in relation to the geographical location of the Member States, as listed within the geography domain of Eurovoc, the European Commission’s multilingual thesaurus. The northern Member States are often distinguished between the Baltic Member States (Estonia, Latvia and Lithuania) and the Nordic Member States (Denmark, Finland and Sweden).
Throughout the publication, a billion is used to mean a thousand million and a trillion to mean a thousand billion.
DATA SOURCES
A large number of different sources were used to compile the information presented in this publication. As a result, the latest available reference year may vary across figures, tables and maps — as each aims to show the freshest information. The most common recent reference period is 2018 or 2019, although it was necessary to go back to earlier reference periods for some infrequent surveys, ad-hoc modules or one-off studies. If data for a particular reference period were not available (at the time of data extraction) for a particular country, then efforts were made to fill figures, tables and maps with data for previous reference periods (these exceptions are footnoted).
Eurostat’s data are published with accompanying metadata that provide background information on each source, as well as specific information (flags) for individual data cells. These flags provide information pertaining to the status of the data, for example, detailing whether a value is estimated, provisional or forecasted. Such flags and breaks in series are indicated, as appropriate, in the footnotes provided under each figure, table or map.
Introduction
Ageing Europe — looking at the lives of older people in the EU — 2020 edition 13
In particular cases, use has been made of sources from outside of the European statistical system; these are systematically credited in the source under each figure, table or map. The most common use of such sources concerns information provided in Eurobarometer public opinion surveys that are produced by the European Commission’s Directorate-General for Communication. These surveys provide qualitative studies on the motivations, feelings and reactions of selected age groups towards a given subject (this source was principally used in Chapters 5 and 6).
Although a majority of the data presented in Ageing Europe — looking at the lives of older people in the EU concern information for the EU Member States, the United Kingdom and EFTA countries, there are some figures and tables that provide international comparisons with non-member countries (these are mainly located in Chapters 1 and 2). The principal source of information for these global comparisons is the Population Division of the Department of Economic and Social Affairs in the United Nations — with demographic statistics from the World Population Prospects 2019.
Access to data and other information on Eurostat’s websiteEurostat’s database may have fresher (or more disaggregated data) due to the continuous nature of data collection and processing (resulting in updates and new reference periods being added throughout the year). The online data code(s) below each figure, table or map helps users to locate the freshest data.
Many terms and abbreviations in the publication may be linked to glossary pages on Eurostat’s Statistics Explained website.
The simplest way to find more information on the broad range of topics that appear within Ageing Europe — looking at the lives of older people in the EU is through Eurostat’s website. It provides users with free access to data, publications and methodological information. The website is updated daily with the latest and most comprehensive statistical information available on: the EU-27 and the euro area, the individual EU Member States, the United Kingdom, EFTA countries, candidate countries and potential candidates, as well as some other non-member countries.


1 Population developments
1 Population developments
Ageing Europe — looking at the lives of older people in the EU — 2020 edition16
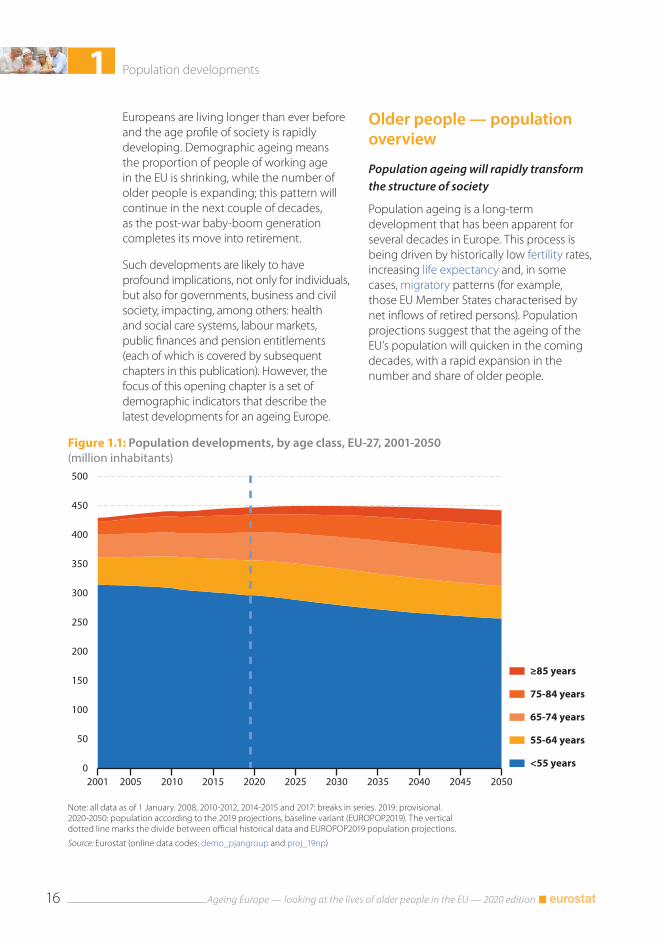
Figure 1.1: Population developments, by age class, EU-27, 2001-2050(million inhabitants)
0
50
100
150
200
250
300
350
400
450
500
2001 2005 2010 2015 2020 2025 2030 2035 2040 2045 2050
≥85 years
75-84 years
65-74 years
55-64 years
<55 years
Note: all data as of 1 January. 2008, 2010-2012, 2014-2015 and 2017: breaks in series. 2019: provisional. 2020-2050: population according to the 2019 projections, baseline variant (EUROPOP2019). The vertical dotted line marks the divide between official historical data and EUROPOP2019 population projections.
Source: Eurostat (online data codes: demo_pjangroup and proj_19np)
Europeans are living longer than ever before and the age profile of society is rapidly developing. Demographic ageing means the proportion of people of working age in the EU is shrinking, while the number of older people is expanding; this pattern will continue in the next couple of decades, as the post-war baby-boom generation completes its move into retirement.
Such developments are likely to have profound implications, not only for individuals, but also for governments, business and civil society, impacting, among others: health and social care systems, labour markets, public finances and pension entitlements (each of which is covered by subsequent chapters in this publication). However, the focus of this opening chapter is a set of demographic indicators that describe the latest developments for an ageing Europe.
Older people — population overview
Population ageing will rapidly transform the structure of society
Population ageing is a long-term development that has been apparent for several decades in Europe. This process is being driven by historically low fertility rates, increasing life expectancy and, in some cases, migratory patterns (for example, those EU Member States characterised by net inflows of retired persons). Population projections suggest that the ageing of the EU’s population will quicken in the coming decades, with a rapid expansion in the number and share of older people.
1Population developments
Ageing Europe — looking at the lives of older people in the EU — 2020 edition 17
Figure 1.2: People aged ≥55 years, by age class, 2019 and 2050(% share of total population)
0
5
10
15
20
25
30
35
40
45
50
EU-2
7 (1 )
Italy
Lith
uani
aPo
rtug
alG
reec
eLa
tvia
Pola
ndBu
lgar
iaSp
ain
Rom
ania
Slov
akia
Croa
tiaSl
oven
iaEs
toni
aFi
nlan
dCz
echi
aH
unga
ryM
alta
Ger
man
yA
ustr
iaLu
xem
bour
gFr
ance
(1 )N
ethe
rland
sBe
lgiu
mD
enm
ark
Irela
nd (1 )
Swed
enCy
prus
Uni
ted
King
dom
(2 )
Liec
hten
stei
nSw
itzer
land
Nor
way
Icel
and
2050:≥55 years2019:≥85 years2019:75-84 years2019:65-74 years
Note: all data as of 1 January. Ranked on the projected share of people aged ≥55 years in the total number of inhabitants in 2050 (according to the 2019 projections, baseline variant (EUROPOP2019)).
(1) Estimates and/or provisional.(2) Population projections for 2050: not available.
Source: Eurostat (online data codes: demo_pjangroup and proj_19np)
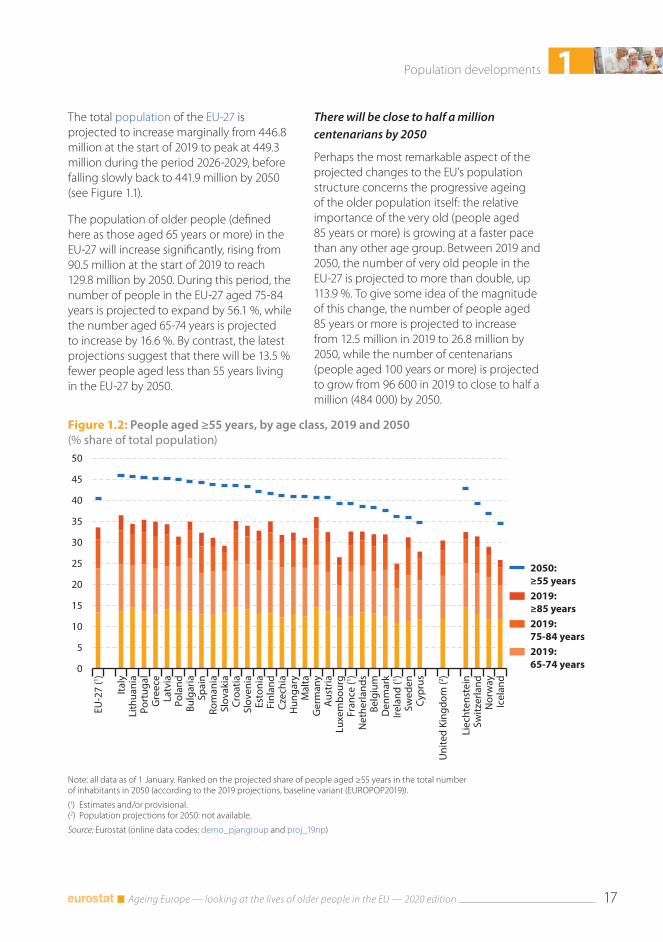
The total population of the EU-27 is projected to increase marginally from 446.8 million at the start of 2019 to peak at 449.3 million during the period 2026-2029, before falling slowly back to 441.9 million by 2050 (see Figure 1.1).
The population of older people (defined here as those aged 65 years or more) in the EU-27 will increase significantly, rising from 90.5 million at the start of 2019 to reach 129.8 million by 2050. During this period, the number of people in the EU-27 aged 75-84 years is projected to expand by 56.1 %, while the number aged 65-74 years is projected to increase by 16.6 %. By contrast, the latest projections suggest that there will be 13.5 % fewer people aged less than 55 years living in the EU-27 by 2050.
There will be close to half a million centenarians by 2050
Perhaps the most remarkable aspect of the projected changes to the EU’s population structure concerns the progressive ageing of the older population itself: the relative importance of the very old (people aged 85 years or more) is growing at a faster pace than any other age group. Between 2019 and 2050, the number of very old people in the EU-27 is projected to more than double, up 113.9 %. To give some idea of the magnitude of this change, the number of people aged 85 years or more is projected to increase from 12.5 million in 2019 to 26.8 million by 2050, while the number of centenarians (people aged 100 years or more) is projected to grow from 96 600 in 2019 to close to half a million (484 000) by 2050.
1 Population developments
Ageing Europe — looking at the lives of older people in the EU — 2020 edition18
Figure 1.3: Population pyramids, EU-27, 2019 and 2050(% share of total population)
5 4 3 2 1 0 1 2 3 4 5
< 55-9
10-1415-1920-2425-2930-3435-3940-4445-4950-5455-5960-6465-6970-7475-7980-84
≥85
Age
cla
ss (y
ears
)
Men Women
Solid colour: 2019Bordered: 2050
Note: all data as of 1 January. 2019: estimates and provisional. 2050: population according to the 2019 projections, baseline variant (EUROPOP2019).
Source: Eurostat (online data codes: demo_pjangroup and proj_19np)
Given the shrinking size of the working-age population and the growing number of older and very old people in society, one of the most pressing concerns for policymakers is to encourage older people to remain, for as long as possible, in the labour force.
In 2019, people aged 55 years or more accounted for just over one third (33.6 %) of the total EU-27 population (see Figure 1.2). Among the EU Member States, this share was higher than one third in 10 of the EU Member States and peaked at 36.5 % in Italy. At the other end of the range, people aged 55 years or more accounted for one quarter (25.0 %) of the population in Ireland. The share of this age group (55 years or more) in the EU-27 population is projected to reach 40.6 % by 2050; it will increase in each of the EU Member States. By 2050, those aged 55 years or more are projected to account for 45.9 % of the population in Italy, and for more than 45.0 % in Lithuania, Portugal, Greece and Latvia.
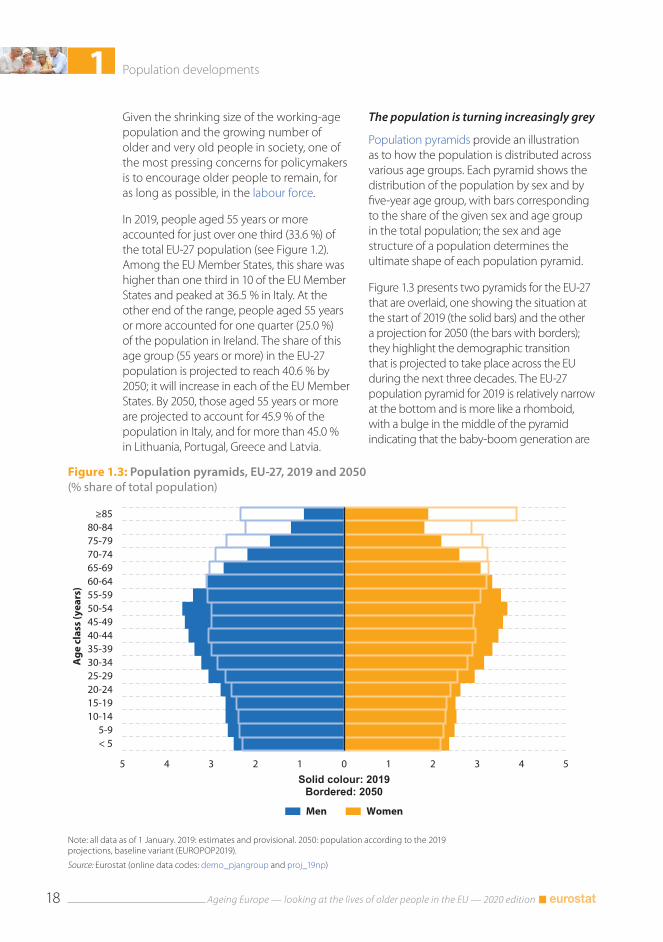
The population is turning increasingly grey
Population pyramids provide an illustration as to how the population is distributed across various age groups. Each pyramid shows the distribution of the population by sex and by five-year age group, with bars corresponding to the share of the given sex and age group in the total population; the sex and age structure of a population determines the ultimate shape of each population pyramid.
Figure 1.3 presents two pyramids for the EU-27 that are overlaid, one showing the situation at the start of 2019 (the solid bars) and the other a projection for 2050 (the bars with borders); they highlight the demographic transition that is projected to take place across the EU during the next three decades. The EU-27 population pyramid for 2019 is relatively narrow at the bottom and is more like a rhomboid, with a bulge in the middle of the pyramid indicating that the baby-boom generation are
1Population developments
Ageing Europe — looking at the lives of older people in the EU — 2020 edition 19
Figure 1.4: People aged ≥65 years, by sex, 2019 and 2050(% share of total population)
EU-2
7 (1 )
Gre
ece
Italy
Port
ugal
Spai
nLi
thua
nia
Latv
iaSl
oven
iaBu
lgar
iaRo
man
iaCr
oatia
Pola
ndSl
ovak
iaEs
toni
aFi
nlan
dCz
echi
aG
erm
any
Aus
tria
Fran
ce (1 )
Hun
gary
Net
herla
nds
Belg
ium
Den
mar
kLu
xem
bour
gM
alta
Irela
nd (1 )
Swed
enCy
prus
Uni
ted
King
dom
(2 )
Liec
hten
stei
nSw
itzer
land
Nor
way
Icel
and
0
5
10
15
20
25
30
35
2019: men2019: women
2050: men2050: women
(1) 2019: estimates and/or provisional.(2) 2050: not available.
Source: Eurostat (online data codes: demo_pjangroup and proj_19np)
approaching retirement. Falling fertility rates from the 1970s onwards explain why the base of the pyramid for 2019 is relatively narrow; this process is known as ‘ageing at the bottom’ (of the population pyramid).
In the coming decades, a high number of baby-boomers will swell the number of old and very old people as the EU-27 population pyramid takes on an almost pillar-like shape, with each age group having a similar share of the total population. The growing proportion of older people may be explained in part by increased longevity; this process is often referred to as ‘ageing at the top’ (of the population pyramid). One of the most striking aspects of the pyramid for 2050 is the lengthening of the bars for the upper age group (compared with those for 2019), indicating that a greater share of the population will live to be very old (85 years or more); this is particularly notable among women.
Older people — differences between the sexes
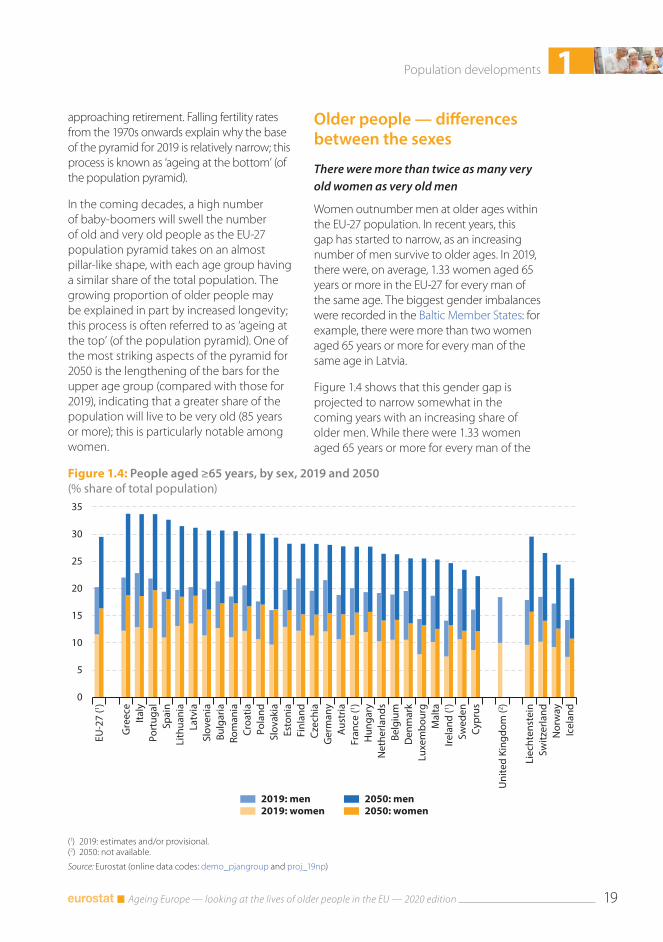
There were more than twice as many very old women as very old men
Women outnumber men at older ages within the EU-27 population. In recent years, this gap has started to narrow, as an increasing number of men survive to older ages. In 2019, there were, on average, 1.33 women aged 65 years or more in the EU-27 for every man of the same age. The biggest gender imbalances were recorded in the Baltic Member States: for example, there were more than two women aged 65 years or more for every man of the same age in Latvia.
Figure 1.4 shows that this gender gap is projected to narrow somewhat in the coming years with an increasing share of older men. While there were 1.33 women aged 65 years or more for every man of the
1 Population developments
Ageing Europe — looking at the lives of older people in the EU — 2020 edition20
Figure 1.5: Gender imbalance for people aged ≥65 years, by age class, 2019(ratio of women to men)
0.0
0.5
1.0
1.5
2.0
2.5
3.0
3.5
4.0
EU-2
7 (1 )
Latv
iaLi
thua
nia
Esto
nia
Hun
gary
Slov
akia
Pola
ndBu
lgar
iaRo
man
iaCr
oatia
Port
ugal
Czec
hia
Slov
enia
Fran
ce (1 )
Aus
tria
Spai
nIta
lyG
erm
any
Finl
and
Belg
ium
Gre
ece
Luxe
mbo
urg
Mal
taD
enm
ark
Cypr
usN
ethe
rland
sSw
eden
Irela
nd (1 )
Uni
ted
King
dom
Switz
erla
ndLi
echt
enst
ein
Nor
way
Icel
and
≥85 years
75-84 years
65-74 years
Note: the figure is ranked on the ratio of women to men for all people aged ≥65 years. All data as of 1 January.
(1) Estimates and/or provisional.
Source: Eurostat (online data code: demo_pjangroup)
same age in 2019, this ratio is projected to fall to 1.24 women aged 65 years or more for every man of the same age by 2050. The ratio of older women to older men is projected to be 1.49 : 1 in Latvia by 2050 — the highest ratio among the EU Member States — while the latest projections suggest in Malta there will be more old men than old women by 2050.
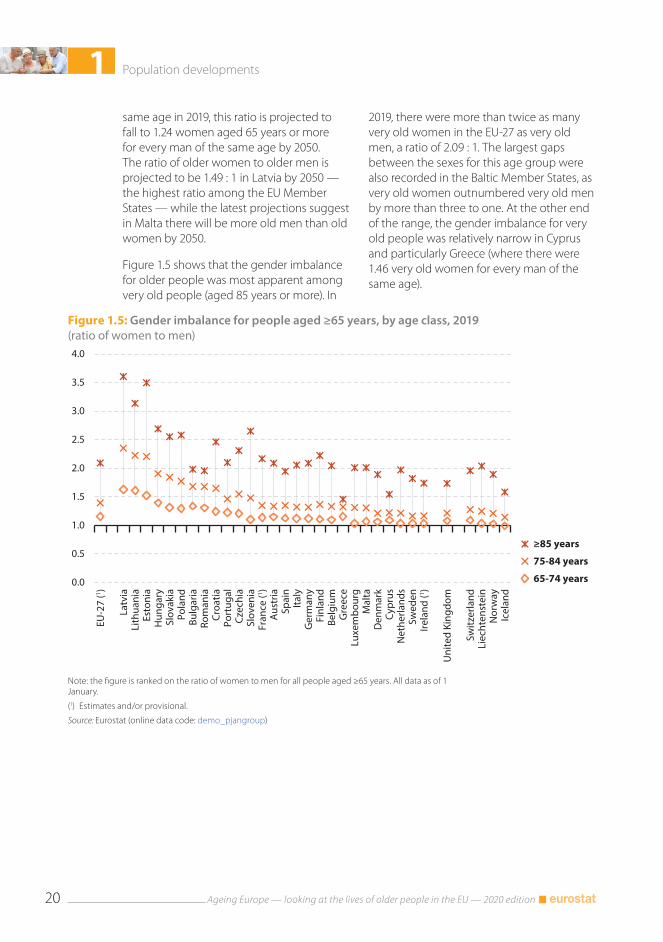
Figure 1.5 shows that the gender imbalance for older people was most apparent among very old people (aged 85 years or more). In
2019, there were more than twice as many very old women in the EU-27 as very old men, a ratio of 2.09 : 1. The largest gaps between the sexes for this age group were also recorded in the Baltic Member States, as very old women outnumbered very old men by more than three to one. At the other end of the range, the gender imbalance for very old people was relatively narrow in Cyprus and particularly Greece (where there were 1.46 very old women for every man of the same age).
1Population developments
Ageing Europe — looking at the lives of older people in the EU — 2020 edition 21
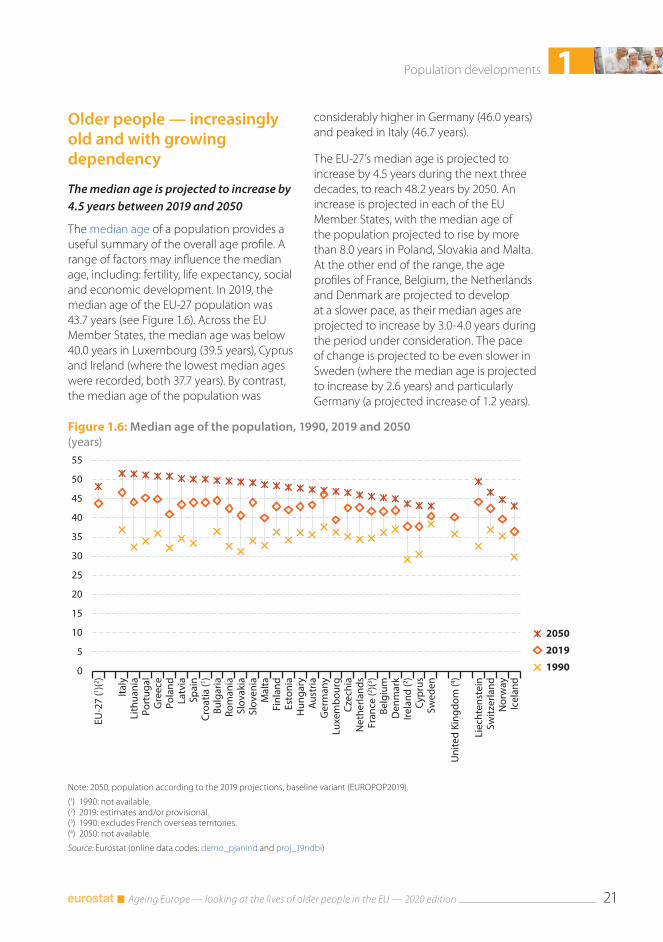
Figure 1.6: Median age of the population, 1990, 2019 and 2050(years)
0
5
10
15
20
25
30
35
40
45
50
55
EU-2
7 (1 )(2 )
Italy
Lith
uani
aPo
rtug
alG
reec
ePo
land
Latv
iaSp
ain
Croa
tia (1 )
Bulg
aria
Rom
ania
Slov
akia
Slov
enia
Mal
taFi
nlan
dEs
toni
aH
unga
ryA
ustr
iaG
erm
any
Luxe
mbo
urg
Czec
hia
Net
herla
nds
Fran
ce (2 )(3 )
Belg
ium
Den
mar
kIre
land
(2 )Cy
prus
Swed
en
Uni
ted
King
dom
(4 )
Liec
hten
stei
nSw
itzer
land
Nor
way
Icel
and
2050
2019
1990
Note: 2050, population according to the 2019 projections, baseline variant (EUROPOP2019).
(1) 1990: not available.(2) 2019: estimates and/or provisional.(3) 1990: excludes French overseas territories.(4) 2050: not available.
Source: Eurostat (online data codes: demo_pjanind and proj_19ndbi)
Older people — increasingly old and with growing dependency
The median age is projected to increase by 4.5 years between 2019 and 2050
The median age of a population provides a useful summary of the overall age profile. A range of factors may influence the median age, including: fertility, life expectancy, social and economic development. In 2019, the median age of the EU-27 population was 43.7 years (see Figure 1.6). Across the EU Member States, the median age was below 40.0 years in Luxembourg (39.5 years), Cyprus and Ireland (where the lowest median ages were recorded, both 37.7 years). By contrast, the median age of the population was
considerably higher in Germany (46.0 years) and peaked in Italy (46.7 years).
The EU-27’s median age is projected to increase by 4.5 years during the next three decades, to reach 48.2 years by 2050. An increase is projected in each of the EU Member States, with the median age of the population projected to rise by more than 8.0 years in Poland, Slovakia and Malta. At the other end of the range, the age profiles of France, Belgium, the Netherlands and Denmark are projected to develop at a slower pace, as their median ages are projected to increase by 3.0-4.0 years during the period under consideration. The pace of change is projected to be even slower in Sweden (where the median age is projected to increase by 2.6 years) and particularly Germany (a projected increase of 1.2 years).
1 Population developments
Ageing Europe — looking at the lives of older people in the EU — 2020 edition22
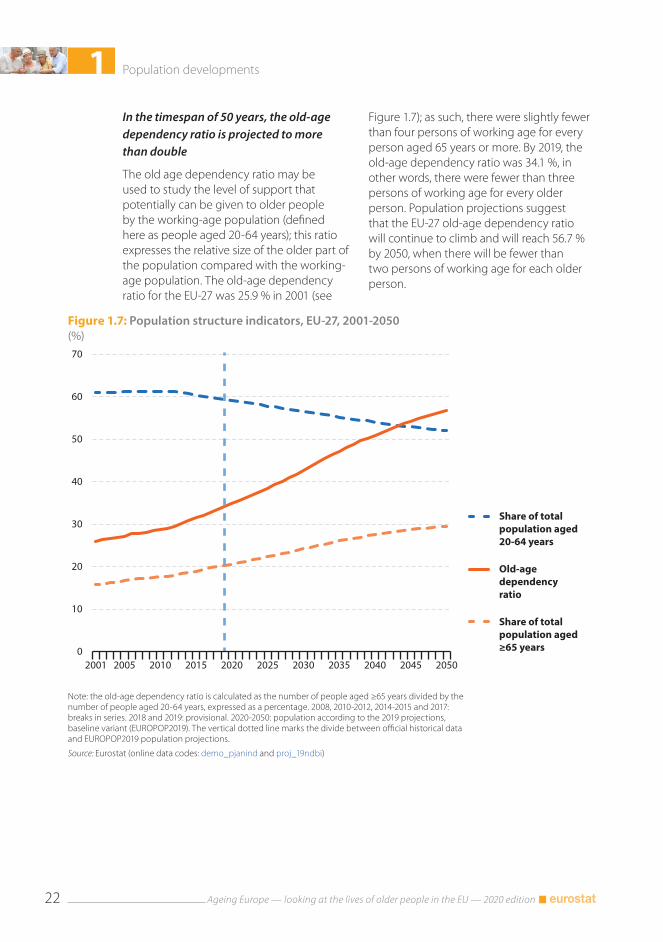
Figure 1.7: Population structure indicators, EU-27, 2001-2050(%)
0
10
20
30
40
50
60
70
2001 2005 2010 2015 2020 2025 2030 2035 2040 2045 2050
Share of totalpopulation aged20-64 years
Old-agedependencyratio
Share of total population aged ≥65 years
Note: the old-age dependency ratio is calculated as the number of people aged ≥65 years divided by the number of people aged 20-64 years, expressed as a percentage. 2008, 2010-2012, 2014-2015 and 2017: breaks in series. 2018 and 2019: provisional. 2020-2050: population according to the 2019 projections, baseline variant (EUROPOP2019). The vertical dotted line marks the divide between official historical data and EUROPOP2019 population projections.
Source: Eurostat (online data codes: demo_pjanind and proj_19ndbi)
In the timespan of 50 years, the old-age dependency ratio is projected to more than double
The old age dependency ratio may be used to study the level of support that potentially can be given to older people by the working-age population (defined here as people aged 20-64 years); this ratio expresses the relative size of the older part of the population compared with the working-age population. The old-age dependency ratio for the EU-27 was 25.9 % in 2001 (see
Figure 1.7); as such, there were slightly fewer than four persons of working age for every person aged 65 years or more. By 2019, the old-age dependency ratio was 34.1 %, in other words, there were fewer than three persons of working age for every older person. Population projections suggest that the EU-27 old-age dependency ratio will continue to climb and will reach 56.7 % by 2050, when there will be fewer than two persons of working age for each older person.
1Population developments
Ageing Europe — looking at the lives of older people in the EU — 2020 edition 23
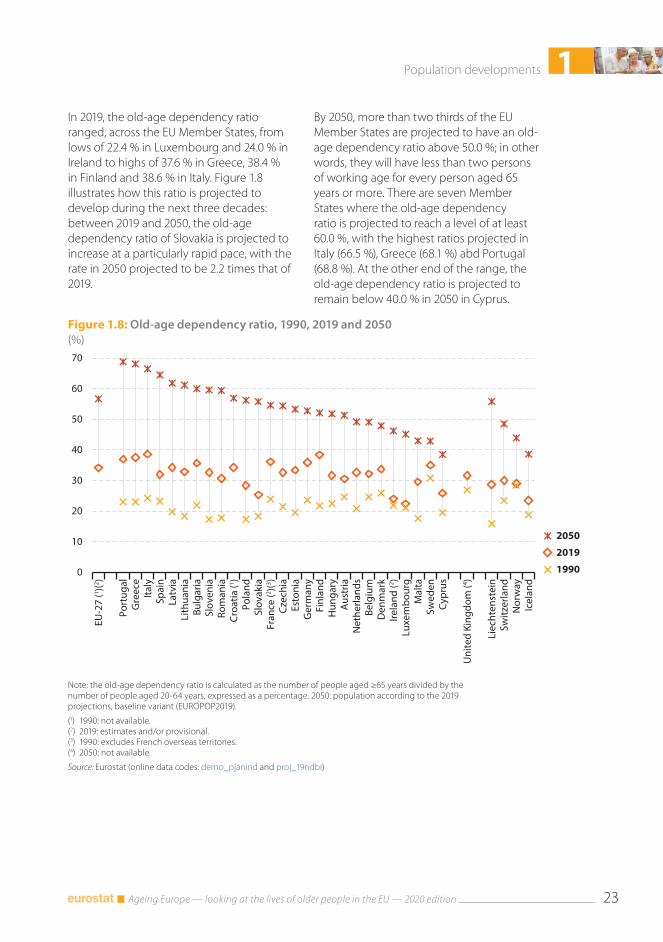
Figure 1.8: Old-age dependency ratio, 1990, 2019 and 2050(%)
0
10
20
30
40
50
60
70
EU-2
7 (1 )(2 )
Port
ugal
Gre
ece
Italy
Spai
nLa
tvia
Lith
uani
aBu
lgar
iaSl
oven
iaRo
man
iaCr
oatia
(1 )Po
land
Slov
akia
Fran
ce (2 )(3 )
Czec
hia
Esto
nia
Ger
man
yFi
nlan
dH
unga
ryA
ustr
iaN
ethe
rland
sBe
lgiu
mD
enm
ark
Irela
nd (2 )
Luxe
mbo
urg
Mal
taSw
eden
Cypr
us
Uni
ted
King
dom
(4 )
Liec
hten
stei
nSw
itzer
land
Nor
way
Icel
and
2050
2019
1990
Note: the old-age dependency ratio is calculated as the number of people aged ≥65 years divided by the number of people aged 20-64 years, expressed as a percentage. 2050: population according to the 2019 projections, baseline variant (EUROPOP2019).
(1) 1990: not available.(2) 2019: estimates and/or provisional.(3) 1990: excludes French overseas territories.(4) 2050: not available.
Source: Eurostat (online data codes: demo_pjanind and proj_19ndbi)
In 2019, the old-age dependency ratio ranged, across the EU Member States, from lows of 22.4 % in Luxembourg and 24.0 % in Ireland to highs of 37.6 % in Greece, 38.4 % in Finland and 38.6 % in Italy. Figure 1.8 illustrates how this ratio is projected to develop during the next three decades: between 2019 and 2050, the old-age dependency ratio of Slovakia is projected to increase at a particularly rapid pace, with the rate in 2050 projected to be 2.2 times that of 2019.
By 2050, more than two thirds of the EU Member States are projected to have an old-age dependency ratio above 50.0 %; in other words, they will have less than two persons of working age for every person aged 65 years or more. There are seven Member States where the old-age dependency ratio is projected to reach a level of at least 60.0 %, with the highest ratios projected in Italy (66.5 %), Greece (68.1 %) abd Portugal (68.8 %). At the other end of the range, the old-age dependency ratio is projected to remain below 40.0 % in 2050 in Cyprus.
1 Population developments
Ageing Europe — looking at the lives of older people in the EU — 2020 edition24
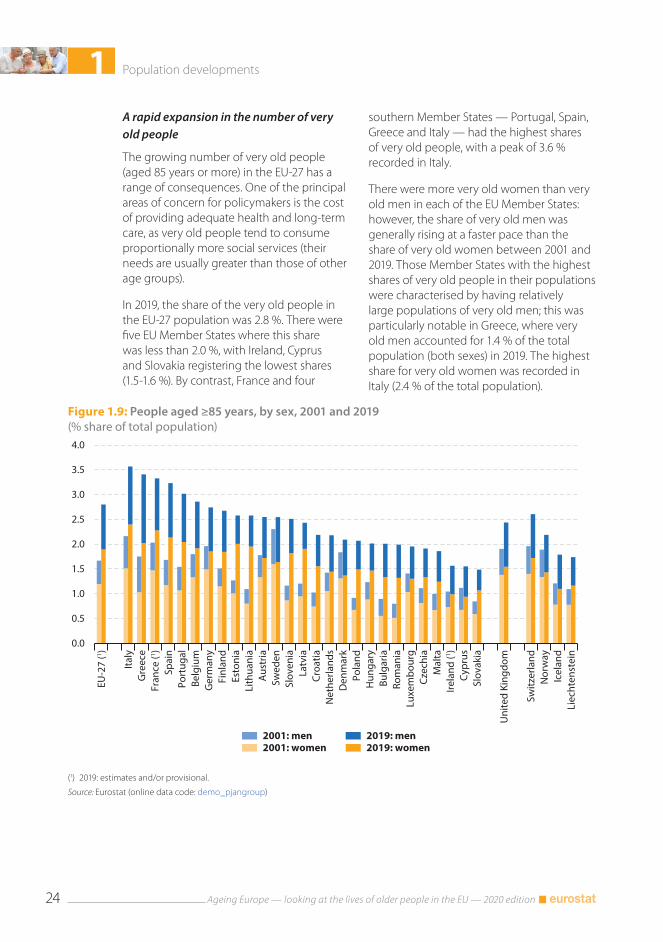
Figure 1.9: People aged ≥85 years, by sex, 2001 and 2019(% share of total population)
EU-2
7 (1 )
Italy
Gre
ece
Fran
ce (1 )
Spai
nPo
rtug
alBe
lgiu
mG
erm
any
Finl
and
Esto
nia
Lith
uani
aA
ustr
iaSw
eden
Slov
enia
Latv
iaCr
oatia
Net
herla
nds
Den
mar
kPo
land
Hun
gary
Bulg
aria
Rom
ania
Luxe
mbo
urg
Czec
hia
Mal
taIre
land
(1 )Cy
prus
Slov
akia
Uni
ted
King
dom
Switz
erla
ndN
orw
ayIc
elan
dLi
echt
enst
ein
0.0
0.5
1.0
1.5
2.0
2.5
3.0
3.5
4.0
2001: men2001: women
2019: men2019: women
(1) 2019: estimates and/or provisional.
Source: Eurostat (online data code: demo_pjangroup)
A rapid expansion in the number of very old people
The growing number of very old people (aged 85 years or more) in the EU-27 has a range of consequences. One of the principal areas of concern for policymakers is the cost of providing adequate health and long-term care, as very old people tend to consume proportionally more social services (their needs are usually greater than those of other age groups).
In 2019, the share of the very old people in the EU-27 population was 2.8 %. There were five EU Member States where this share was less than 2.0 %, with Ireland, Cyprus and Slovakia registering the lowest shares (1.5-1.6 %). By contrast, France and four
southern Member States — Portugal, Spain, Greece and Italy — had the highest shares of very old people, with a peak of 3.6 % recorded in Italy.
There were more very old women than very old men in each of the EU Member States: however, the share of very old men was generally rising at a faster pace than the share of very old women between 2001 and 2019. Those Member States with the highest shares of very old people in their populations were characterised by having relatively large populations of very old men; this was particularly notable in Greece, where very old men accounted for 1.4 % of the total population (both sexes) in 2019. The highest share for very old women was recorded in Italy (2.4 % of the total population).
1Population developments
Ageing Europe — looking at the lives of older people in the EU — 2020 edition 25
Figure 1.10: People aged ≥65 years, by age class, 2019(% share of total population)
Wor
ld (1 )
EU-2
7 (2 )
Italy
Ger
man
y
Fran
ce (2 )
Japa
n (3 )
Uni
ted
King
dom
Cana
da (3 )
Uni
ted
Stat
es (3 )
Aus
tral
ia (3 )
Sout
h Ko
rea
(3 )
Russ
ia (1 )
Arg
entin
a
Chin
a (1 )
Braz
il (1 )
Turk
ey
Mex
ico
Indi
a (1 )
Indo
nesi
a (1 )
Sout
h A
fric
a (1 )
Saud
i Ara
bia
(1 )
0
5
10
15
20
25
30
≥85 years
75-84 years
65-74 years
Note: data for the EU-27, EU Member States, the United Kingdom and Turkey are as of 1 January; world and other G20 members are mid-year data.
(1) 2015.(2) Provisional.(3) 2018.
Source: Eurostat (online data code: demo_pjangroup), United Nations Statistics Division (Demographic Statistics Database) and United Nations, Department of Economic and Social Affairs, Population Division, World Population Prospects 2019
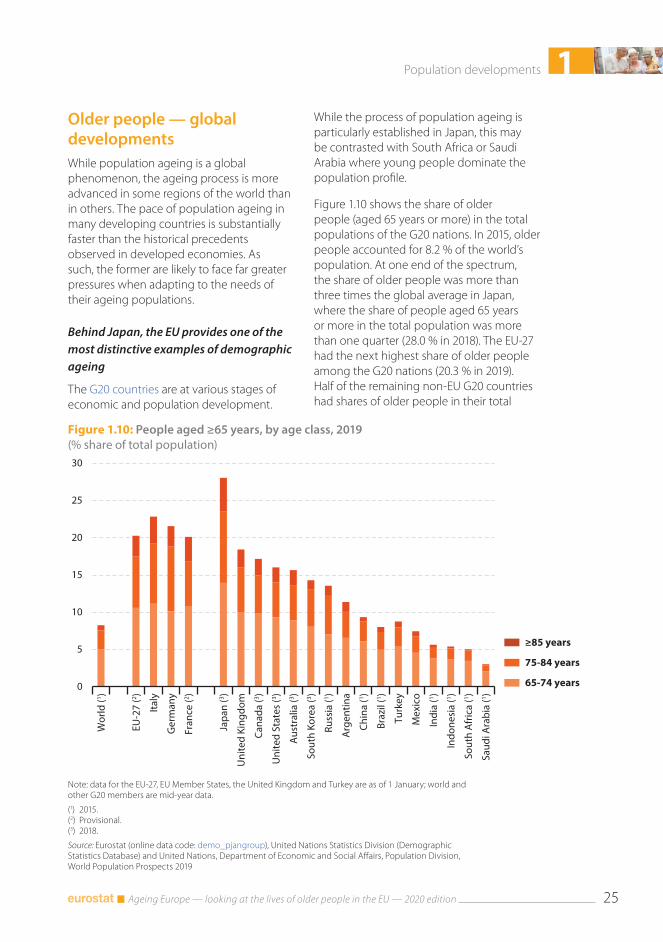
Older people — global developmentsWhile population ageing is a global phenomenon, the ageing process is more advanced in some regions of the world than in others. The pace of population ageing in many developing countries is substantially faster than the historical precedents observed in developed economies. As such, the former are likely to face far greater pressures when adapting to the needs of their ageing populations.
Behind Japan, the EU provides one of the most distinctive examples of demographic ageing
The G20 countries are at various stages of economic and population development.
While the process of population ageing is particularly established in Japan, this may be contrasted with South Africa or Saudi Arabia where young people dominate the population profile.
Figure 1.10 shows the share of older people (aged 65 years or more) in the total populations of the G20 nations. In 2015, older people accounted for 8.2 % of the world’s population. At one end of the spectrum, the share of older people was more than three times the global average in Japan, where the share of people aged 65 years or more in the total population was more than one quarter (28.0 % in 2018). The EU-27 had the next highest share of older people among the G20 nations (20.3 % in 2019). Half of the remaining non-EU G20 countries had shares of older people in their total
1 Population developments
Ageing Europe — looking at the lives of older people in the EU — 2020 edition26
Figure 1.11: Median age of the population, 1980, 2020 and 2050(years)
0
5
10
15
20
25
30
35
40
45
50
55
60
Wor
ld
EU-2
7 (1 )
Italy
Ger
man
y
Fran
ce (2 )
Sout
h Ko
rea
Japa
n
Chin
a
Cana
da
Braz
il
Uni
ted
King
dom
Uni
ted
Stat
es
Aus
tral
ia
Russ
ia
Turk
ey
Saud
i Ara
bia
Mex
ico
Arg
entin
a
Indi
a
Indo
nesi
a
Sout
h A
fric
a
2050
2020
1980
Note: 2020 and 2050, EU-27 and the EU Member States according to the 2019 projections, baseline variant (EUROPOP2019). 2020 and 2050, world and G20 population projections according to the United Nations Population Division medium variant.
(1) 1980: not available.(2) 1980: excludes French overseas territories.
Source: Eurostat (online data codes: demo_pjanind and proj_19ndbi) and United Nations, Department of Economic and Social Affairs, Population Division, World Population Prospects 2019
populations that were above the global average; these included the United States (16.0 % in 2018) and China (9.3 % in 2015). The G20 countries where older people accounted for a relatively small proportion of the total population are often characterised as emerging economies, with relatively young populations and expanding labour forces; examples include Mexico (where older people accounted for 7.4 % of the total population in 2019), India (5.6 % in 2015), Indonesia (5.4 % in 2015), South Africa (5.0 % in 2015) and Saudi Arabia (3.0 % in 2015).
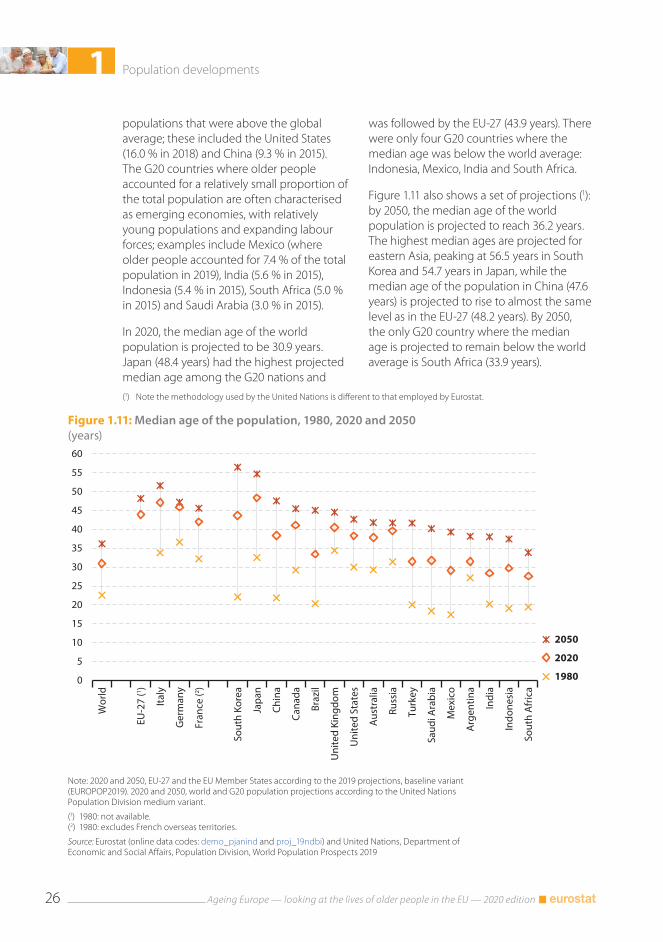
In 2020, the median age of the world population is projected to be 30.9 years. Japan (48.4 years) had the highest projected median age among the G20 nations and
(1) Note the methodology used by the United Nations is different to that employed by Eurostat.
was followed by the EU-27 (43.9 years). There were only four G20 countries where the median age was below the world average: Indonesia, Mexico, India and South Africa.
Figure 1.11 also shows a set of projections (1): by 2050, the median age of the world population is projected to reach 36.2 years. The highest median ages are projected for eastern Asia, peaking at 56.5 years in South Korea and 54.7 years in Japan, while the median age of the population in China (47.6 years) is projected to rise to almost the same level as in the EU-27 (48.2 years). By 2050, the only G20 country where the median age is projected to remain below the world average is South Africa (33.9 years).
1Population developments
Ageing Europe — looking at the lives of older people in the EU — 2020 edition 27
Figure 1.12: Old-age dependency ratio, 1980-2050(%)
0
10
20
30
40
50
60
70
80
90
1980 1985 1990 1995 2000 2005 2010 2015 2020 2025 2030 2035 2040 2045 2050
Japan
EU-27 (1)
China
UnitedStates
World
India
Note: the old-age dependency ratio is calculated as the number of people aged ≥65 years divided by the number of people aged 20-64 years, expressed as a percentage. 2020-2050: EU-27 population according to the 2019 projections, baseline variant (EUROPOP2019); other population projections according to the United Nations Population Division medium variant. The vertical dotted line marks the divide between historical data and projections.
(1) 1980-2000: not available. 2010 and 2015: breaks in series.
Source: Eurostat (online data codes: demo_pjanind and proj_19ndbi) and United Nations, Department of Economic and Social Affairs, Population Division, World Population Prospects 2019
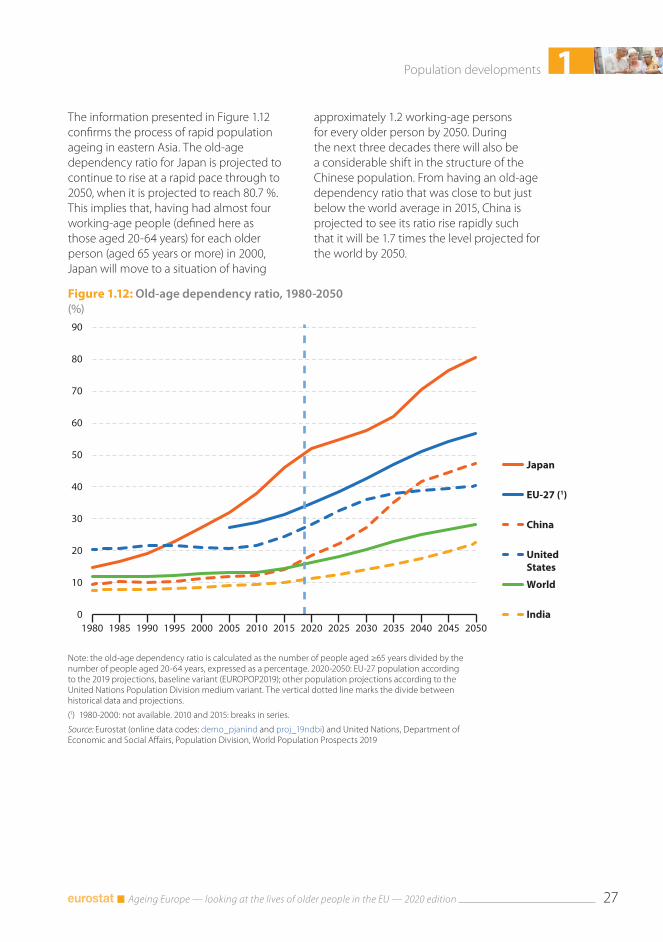
The information presented in Figure 1.12 confirms the process of rapid population ageing in eastern Asia. The old-age dependency ratio for Japan is projected to continue to rise at a rapid pace through to 2050, when it is projected to reach 80.7 %. This implies that, having had almost four working-age people (defined here as those aged 20-64 years) for each older person (aged 65 years or more) in 2000, Japan will move to a situation of having
approximately 1.2 working-age persons for every older person by 2050. During the next three decades there will also be a considerable shift in the structure of the Chinese population. From having an old-age dependency ratio that was close to but just below the world average in 2015, China is projected to see its ratio rise rapidly such that it will be 1.7 times the level projected for the world by 2050.
1 Population developments
Ageing Europe — looking at the lives of older people in the EU — 2020 edition28
Figure 1.13: People aged ≥65 years, by urban-rural typology, 2019(%, share of total population living in each type of region = 100)
50
60
70
80
90
100
110
120
130
140
150
EU-2
7 (1 )
Spai
nN
ethe
rland
sFr
ance
(1 )Sw
eden
Port
ugal
Den
mar
kG
reec
eFi
nlan
dBu
lgar
iaIre
land
(1 )Es
toni
aG
erm
any
Aus
tria
Italy
Rom
ania
Lith
uani
aSl
oven
ia (2 )
Czec
hia
Croa
tiaH
unga
ryLa
tvia
Slov
akia
Belg
ium
Pola
ndCy
prus
(3 )Lu
xem
bour
g (3 )
Mal
ta (4 )
Uni
ted
King
dom
Nor
way
Switz
erla
ndIc
elan
d (5 )
Liec
hten
stei
n (4 )
Predominantlyrural regions
Intermediateregions
Predominantlyurban regions
Note: the indicator is calculated as the share of older people (aged ≥65 years) living in different types of regions (predominantly urban, intermediate and predominantly rural), divided by the same share for the total population, expressed as a percentage.
(1) Estimates and/or provisional.(2) Predominantly urban regions: not applicable.(3) Predominantly urban and predominantly rural regions: not applicable.(4) Intermediate and predominantly rural regions: not applicable.(5) Intermediate regions: not applicable.
Source: Eurostat (online data code: urt_pjangrp3)
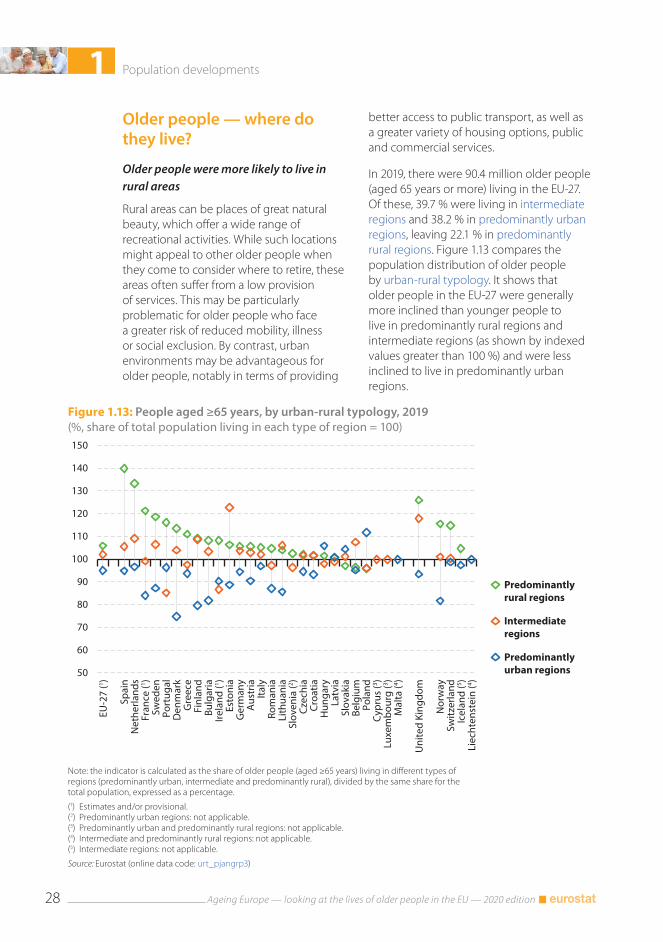
Older people — where do they live?
Older people were more likely to live in rural areas
Rural areas can be places of great natural beauty, which offer a wide range of recreational activities. While such locations might appeal to other older people when they come to consider where to retire, these areas often suffer from a low provision of services. This may be particularly problematic for older people who face a greater risk of reduced mobility, illness or social exclusion. By contrast, urban environments may be advantageous for older people, notably in terms of providing
better access to public transport, as well as a greater variety of housing options, public and commercial services.
In 2019, there were 90.4 million older people (aged 65 years or more) living in the EU-27. Of these, 39.7 % were living in intermediate regions and 38.2 % in predominantly urban regions, leaving 22.1 % in predominantly rural regions. Figure 1.13 compares the population distribution of older people by urban-rural typology. It shows that older people in the EU-27 were generally more inclined than younger people to live in predominantly rural regions and intermediate regions (as shown by indexed values greater than 100 %) and were less inclined to live in predominantly urban regions.
1Population developments
Ageing Europe — looking at the lives of older people in the EU — 2020 edition 29
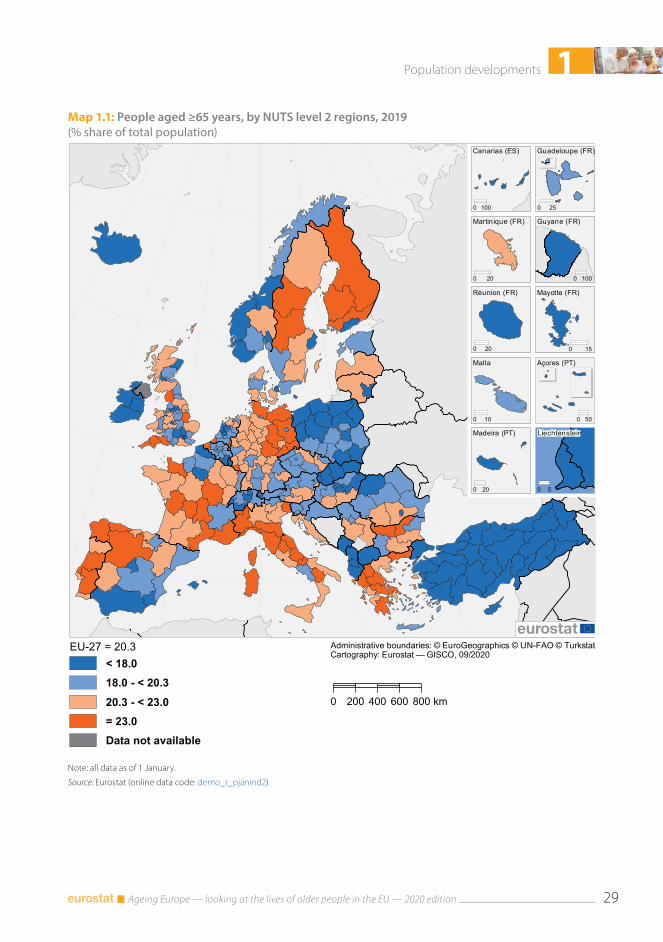
Map 1.1: People aged ≥65 years, by NUTS level 2 regions, 2019(% share of total population)
Administrative boundaries: © EuroGeographics © UN-FAO © Turkstat
Note: data as of 1 January.
People aged =65 years, by NUTS level 2 regions, 2019(% share of total population)
0 200 400 600 800 km
Guadeloupe (FR)
0 25
Martinique (FR)
0 20
Guyane (FR)
0 100
Réunion (FR)
0 20
Açores (PT)
0 50
Madeira (PT)
0 20
Canarias (ES)
0 100
Malta
0 10
Liechtenstein
0 5
Cartography: Eurostat — GISCO, 09/2020
Source: Eurostat (online data code: demo_r_pjanind2)
Mayotte (FR)
0 15
EU-27 = 20.3< 18.018.0 - < 20.320.3 - < 23.0= 23.0Data not available
Note: all data as of 1 January.
Source: Eurostat (online data code: demo_r_pjanind2)
1 Population developments
Ageing Europe — looking at the lives of older people in the EU — 2020 edition30
This pattern — a higher than average proportion of older people living in predominantly rural regions — was repeated in the vast majority of EU Member States; in 2019, the only exceptions were Slovakia, Belgium and Poland (2). By contrast, the share of older people living in predominantly rural regions was high (relative to the share for the rest of the population) in France, the Netherlands and particularly Spain. In some cases, the relatively high shares of older people living in rural regions may reflect younger generations leaving sparsely populated regions (for example, in search of job opportunities and/or a better quality of life), while older people continue to live in rural areas.
Older people accounted for a high share of the population in eastern Germany and northern Italy
Subnational breakdowns of demographic statistics can be useful to policymakers, particularly when making preparations for age-related services. Map 1.1 provides information by NUTS level 2 regions and is based on the shares of older people (aged 65 years or more) in the total population. In 2019, there were 17 regions across the EU where older people made up more than one quarter of the total population. These regions were principally located in eastern Germany, northern/central Italy and north-western/central Spain (with only 5 of the 17 regions from other EU Member States): the highest shares were recorded in Chemnitz (eastern Germany; 28.9 %), Liguria (north-western Italy; 28.5 %) and Ipeiros (north-western Greece; 27.0 %).
(2) Note that in the urban-rural typology there are no rural areas defined for Cyprus, Luxembourg or Malta.
There were high concentrations of older people in rural, sparsely populated regions
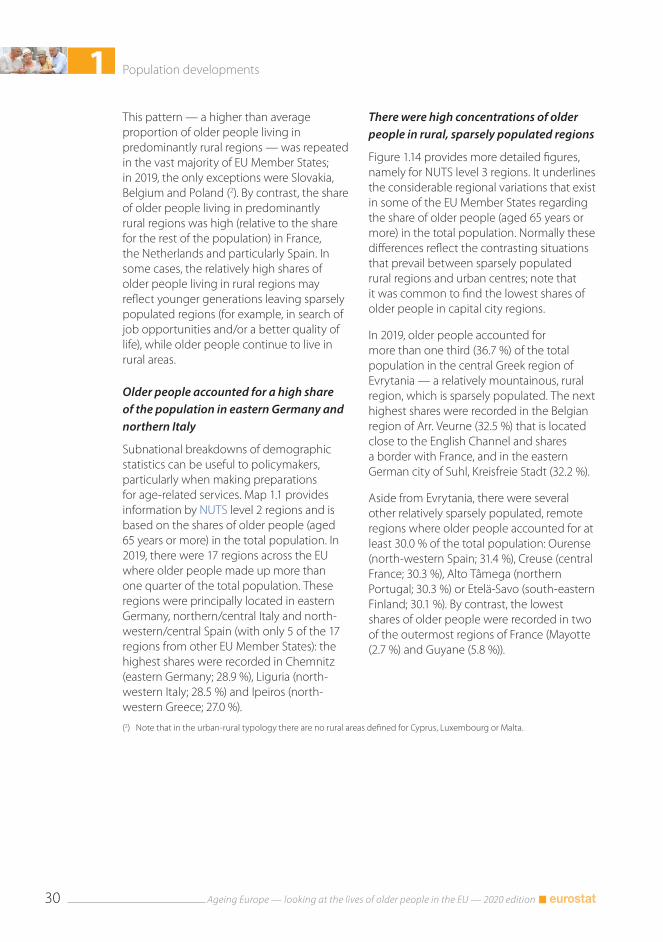
Figure 1.14 provides more detailed figures, namely for NUTS level 3 regions. It underlines the considerable regional variations that exist in some of the EU Member States regarding the share of older people (aged 65 years or more) in the total population. Normally these differences reflect the contrasting situations that prevail between sparsely populated rural regions and urban centres; note that it was common to find the lowest shares of older people in capital city regions.
In 2019, older people accounted for more than one third (36.7 %) of the total population in the central Greek region of Evrytania — a relatively mountainous, rural region, which is sparsely populated. The next highest shares were recorded in the Belgian region of Arr. Veurne (32.5 %) that is located close to the English Channel and shares a border with France, and in the eastern German city of Suhl, Kreisfreie Stadt (32.2 %).
Aside from Evrytania, there were several other relatively sparsely populated, remote regions where older people accounted for at least 30.0 % of the total population: Ourense (north-western Spain; 31.4 %), Creuse (central France; 30.3 %), Alto Tâmega (northern Portugal; 30.3 %) or Etelä-Savo (south-eastern Finland; 30.1 %). By contrast, the lowest shares of older people were recorded in two of the outermost regions of France (Mayotte (2.7 %) and Guyane (5.8 %)).
1Population developments
Ageing Europe — looking at the lives of older people in the EU — 2020 edition 31
Figure 1.14: Range of NUTS level 3 regions with the highest and lowest shares of people aged ≥65 years, 2019(% share of total population)
0 5 10 15 20 25 30 35 40
EU-27
ItalyGreece
PortugalFinland (1)GermanyBulgaria
CroatiaLatvia
France (2)SwedenEstonia
LithuaniaSloveniaCzechia
DenmarkSpain
HungaryNetherlands
BelgiumAustria
MaltaRomania
PolandCyprus (3)
SlovakiaLuxembourg (3)
Ireland
United Kingdom
SwitzerlandLiechtenstein (3)
Norway (1)Iceland
Note: the figure has a bar for each country that shows the range from the region with the lowest share to the region with the highest share; the vertical line inside each bar denotes the national average (mean). All data as of 1 January.
(1) Data are not available for all regions.(2) Provisional.(3) No regional breakdown for level 3 regions.
Source: Eurostat (online data code: demo_r_pjanind3)
1 Population developments
Ageing Europe — looking at the lives of older people in the EU — 2020 edition32
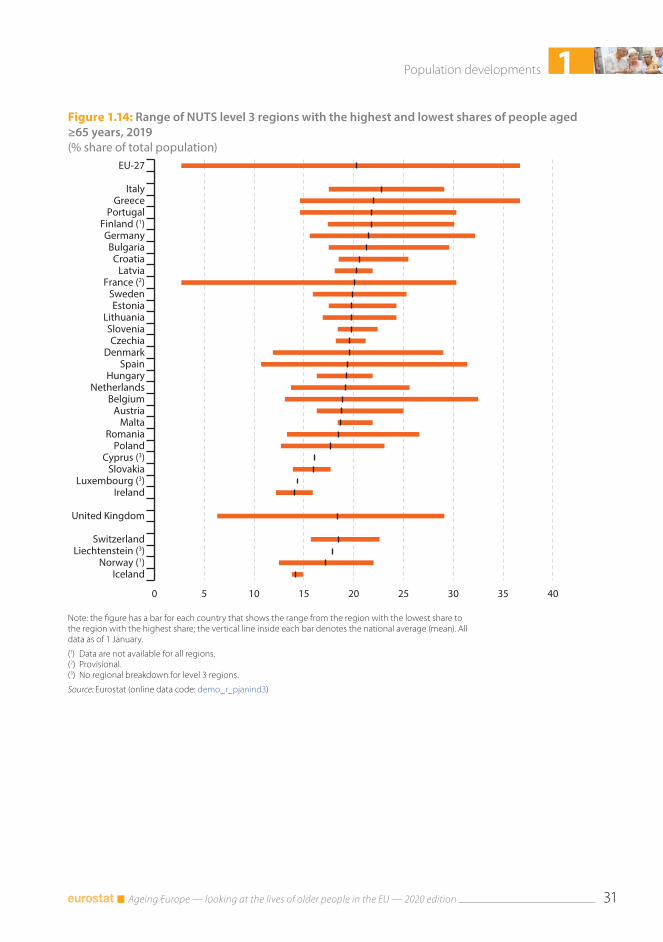
Figure 1.15: Share of foreign citizens, 2019(%)
0
5
10
15
20
25
30
35
40
45
50
EU-2
7 (1 )
Luxe
mbo
urg
Latv
iaEs
toni
aCy
prus
Aus
tria
Belg
ium
Mal
taIre
land
(1 )G
erm
any
Fran
ce (1 )
Spai
nSw
eden
Den
mar
kIta
ly (1 )
Gre
ece
Slov
enia
Port
ugal
Czec
hia
Net
herla
nds
Finl
and
Bulg
aria
Slov
akia
Croa
tiaLi
thua
nia
Hun
gary
Rom
ania
Pola
nd
Uni
ted
King
dom
Liec
hten
stei
nSw
itzer
land
Nor
way
Icel
and
Total population People aged ≥65 years
(1) Estimates and/or provisional.
Source: Eurostat (online data code: migr_pop1ctz)
Older people — where do they come from?While declining fertility and increasing longevity are the key drivers of population ageing in the EU, international migration can also play a role in determining the age profile of a population. Indeed, migration usually slows down the ageing process, as a majority of immigrants tend to be relatively young, fleeing persecution or conflict, searching for work opportunities and the chance of a better quality of life.
A relatively small proportion of older people are foreign citizens
Figure 1.15 presents information on the prominence of foreign citizens. In 2019, foreign citizens accounted for 7.9 % of the EU-27 population, a share that was 4.1 % among older people (aged 65 years or more). Across the EU it was relatively common to find the share of foreign citizens in the total population falling as a function of age. This may reflect several factors, such as:
• the size of migratory flows may have changed over time;
• the age structure of migratory flows may have changed;
• some people may move to a country for a specific reason, for example to study or to work, and then leave thereafter;
• demographic factors such as fertility rates may be different among foreign and national citizens.
For example, in Luxembourg foreign citizens made up almost half (47.5 %) of the total population in 2019, while their share among older people was considerably lower (at 34.7 %). There were two exceptions to this pattern, Latvia and Estonia, where a higher share of older people (than the total population) were foreign citizens. This may be linked to a high number of older people in these two Member States being classified as recognised non-citizens; these people are mainly former Soviet Union citizens, who are permanently resident but have not acquired any other citizenship.
2 Housing and living conditions
2 Housing and living conditions
Ageing Europe — looking at the lives of older people in the EU — 2020 edition34
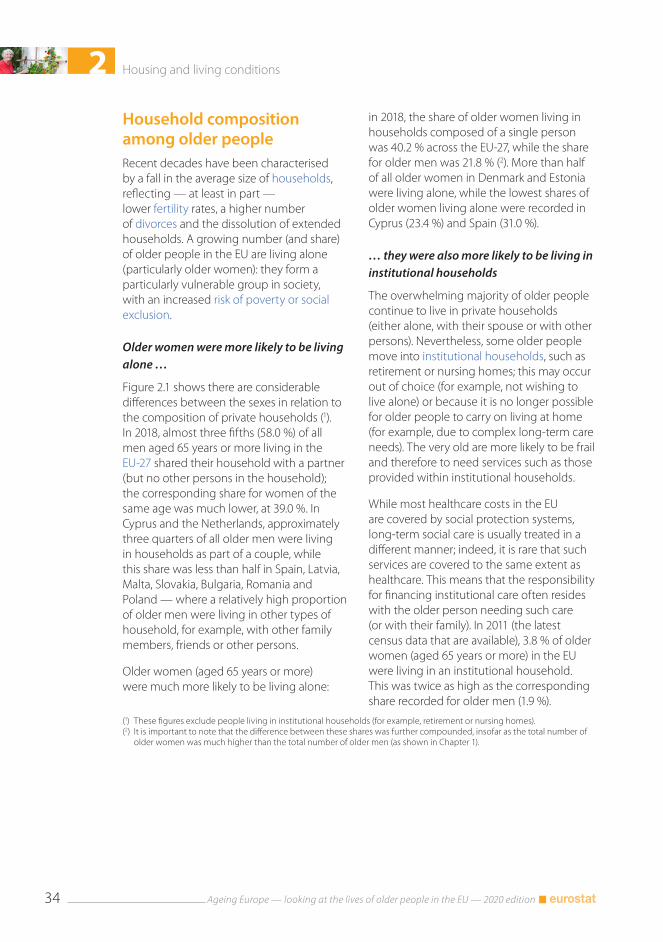
Household composition among older peopleRecent decades have been characterised by a fall in the average size of households, reflecting — at least in part — lower fertility rates, a higher number of divorces and the dissolution of extended households. A growing number (and share) of older people in the EU are living alone (particularly older women): they form a particularly vulnerable group in society, with an increased risk of poverty or social exclusion.
Older women were more likely to be living alone …
Figure 2.1 shows there are considerable differences between the sexes in relation to the composition of private households (1). In 2018, almost three fifths (58.0 %) of all men aged 65 years or more living in the EU-27 shared their household with a partner (but no other persons in the household); the corresponding share for women of the same age was much lower, at 39.0 %. In Cyprus and the Netherlands, approximately three quarters of all older men were living in households as part of a couple, while this share was less than half in Spain, Latvia, Malta, Slovakia, Bulgaria, Romania and Poland — where a relatively high proportion of older men were living in other types of household, for example, with other family members, friends or other persons.
Older women (aged 65 years or more) were much more likely to be living alone:
(1) These figures exclude people living in institutional households (for example, retirement or nursing homes).(2) It is important to note that the difference between these shares was further compounded, insofar as the total number of
older women was much higher than the total number of older men (as shown in Chapter 1).
in 2018, the share of older women living in households composed of a single person was 40.2 % across the EU-27, while the share for older men was 21.8 % (2). More than half of all older women in Denmark and Estonia were living alone, while the lowest shares of older women living alone were recorded in Cyprus (23.4 %) and Spain (31.0 %).
… they were also more likely to be living in institutional households
The overwhelming majority of older people continue to live in private households (either alone, with their spouse or with other persons). Nevertheless, some older people move into institutional households, such as retirement or nursing homes; this may occur out of choice (for example, not wishing to live alone) or because it is no longer possible for older people to carry on living at home (for example, due to complex long-term care needs). The very old are more likely to be frail and therefore to need services such as those provided within institutional households.
While most healthcare costs in the EU are covered by social protection systems, long-term social care is usually treated in a different manner; indeed, it is rare that such services are covered to the same extent as healthcare. This means that the responsibility for financing institutional care often resides with the older person needing such care (or with their family). In 2011 (the latest census data that are available), 3.8 % of older women (aged 65 years or more) in the EU were living in an institutional household. This was twice as high as the corresponding share recorded for older men (1.9 %).
2Housing and living conditions
Ageing Europe — looking at the lives of older people in the EU — 2020 edition 35
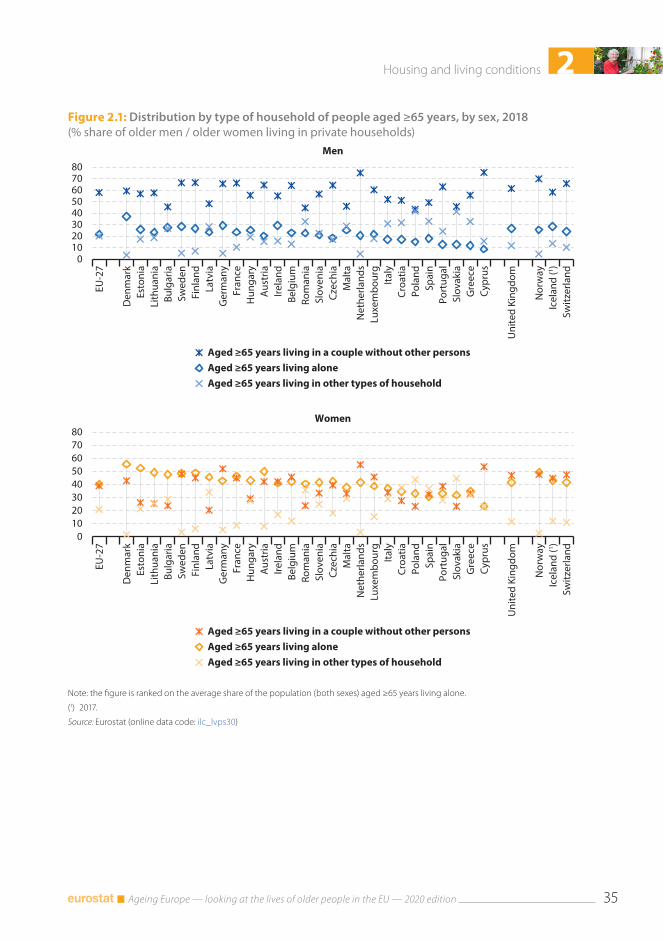
Figure 2.1: Distribution by type of household of people aged ≥65 years, by sex, 2018(% share of older men / older women living in private households)
01020304050607080
EU-2
7
Den
mar
kEs
toni
aLi
thua
nia
Bulg
aria
Swed
enFi
nlan
dLa
tvia
Ger
man
yFr
ance
Hun
gary
Aus
tria
Irela
ndBe
lgiu
mRo
man
iaSl
oven
iaCz
echi
aM
alta
Net
herla
nds
Luxe
mbo
urg
Italy
Croa
tiaPo
land
Spai
nPo
rtug
alSl
ovak
iaG
reec
eCy
prus
Uni
ted
King
dom
Nor
way
Icel
and
(1 )Sw
itzer
land
Aged ≥65 years living in a couple without other personsAged ≥65 years living aloneAged ≥65 years living in other types of household
Aged ≥65 years living in a couple without other personsAged ≥65 years living aloneAged ≥65 years living in other types of household
Men
01020304050607080
EU-2
7
Den
mar
kEs
toni
aLi
thua
nia
Bulg
aria
Swed
enFi
nlan
dLa
tvia
Ger
man
yFr
ance
Hun
gary
Aus
tria
Irela
ndBe
lgiu
mRo
man
iaSl
oven
iaCz
echi
aM
alta
Net
herla
nds
Luxe
mbo
urg
Italy
Croa
tiaPo
land
Spai
nPo
rtug
alSl
ovak
iaG
reec
eCy
prus
Uni
ted
King
dom
Nor
way
Icel
and
(1 )Sw
itzer
land
Women
Note: the figure is ranked on the average share of the population (both sexes) aged ≥65 years living alone.
(1) 2017.
Source: Eurostat (online data code: ilc_lvps30)
2 Housing and living conditions
Ageing Europe — looking at the lives of older people in the EU — 2020 edition36
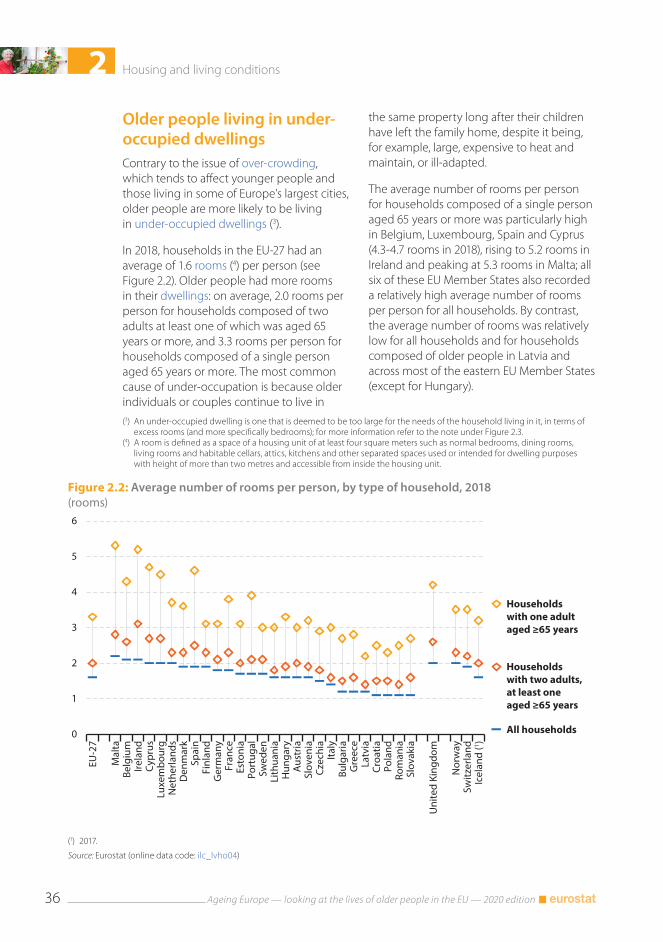
Figure 2.2: Average number of rooms per person, by type of household, 2018(rooms)
0
1
2
3
4
5
6
EU-2
7
Mal
taBe
lgiu
mIre
land
Cypr
usLu
xem
bour
gN
ethe
rland
sD
enm
ark
Spai
nFi
nlan
dG
erm
any
Fran
ceEs
toni
aPo
rtug
alSw
eden
Lith
uani
aH
unga
ryA
ustr
iaSl
oven
iaCz
echi
aIta
lyBu
lgar
iaG
reec
eLa
tvia
Croa
tiaPo
land
Rom
ania
Slov
akia
Uni
ted
King
dom
Nor
way
Switz
erla
ndIc
elan
d (1 )
Households with one adult aged ≥65 years
Households with two adults, at least one aged ≥65 years
All households
(1) 2017.
Source: Eurostat (online data code: ilc_lvho04)
Older people living in under-occupied dwellingsContrary to the issue of over-crowding, which tends to affect younger people and those living in some of Europe’s largest cities, older people are more likely to be living in under-occupied dwellings (3).
In 2018, households in the EU-27 had an average of 1.6 rooms (4) per person (see Figure 2.2). Older people had more rooms in their dwellings: on average, 2.0 rooms per person for households composed of two adults at least one of which was aged 65 years or more, and 3.3 rooms per person for households composed of a single person aged 65 years or more. The most common cause of under-occupation is because older individuals or couples continue to live in
(3) An under-occupied dwelling is one that is deemed to be too large for the needs of the household living in it, in terms of excess rooms (and more specifically bedrooms); for more information refer to the note under Figure 2.3.
(4) A room is defined as a space of a housing unit of at least four square meters such as normal bedrooms, dining rooms, living rooms and habitable cellars, attics, kitchens and other separated spaces used or intended for dwelling purposes with height of more than two metres and accessible from inside the housing unit.
the same property long after their children have left the family home, despite it being, for example, large, expensive to heat and maintain, or ill-adapted.
The average number of rooms per person for households composed of a single person aged 65 years or more was particularly high in Belgium, Luxembourg, Spain and Cyprus (4.3-4.7 rooms in 2018), rising to 5.2 rooms in Ireland and peaking at 5.3 rooms in Malta; all six of these EU Member States also recorded a relatively high average number of rooms per person for all households. By contrast, the average number of rooms was relatively low for all households and for households composed of older people in Latvia and across most of the eastern EU Member States (except for Hungary).
2Housing and living conditions
Ageing Europe — looking at the lives of older people in the EU — 2020 edition 37
Figure 2.3: People living in under-occupied dwellings, by age class, 2018(%)
0
10
20
30
40
50
60
70
80
90
100
EU-2
7
Irela
ndCy
prus
Mal
taSp
ain
Luxe
mbo
urg
Belg
ium
Fran
ceN
ethe
rland
sD
enm
ark
Finl
and
Port
ugal
Ger
man
ySw
eden
Slov
enia
Aus
tria
Esto
nia
Hun
gary
Czec
hia
Lith
uani
aIta
lySl
ovak
iaG
reec
eBu
lgar
iaPo
land
Croa
tiaLa
tvia
Rom
ania
Uni
ted
King
dom
Nor
way
Switz
erla
ndIc
elan
d (1 )
≥65 years
18-64 years
Note: a dwelling is defined as under-occupied if the household living in it has at its disposal more than the minimum number of rooms considered adequate, which is equal to: one room for the household; one room per couple in the household; one room for each single person aged 18 or more; one room per pair of single people of the same gender between 12 and 17 years of age; one room for each single person between 12 and 17 years of age and not included in the previous category; one room per pair of children under 12 years of age.
(1) 2017.
Source: Eurostat (online data code: ilc_lvho50a)
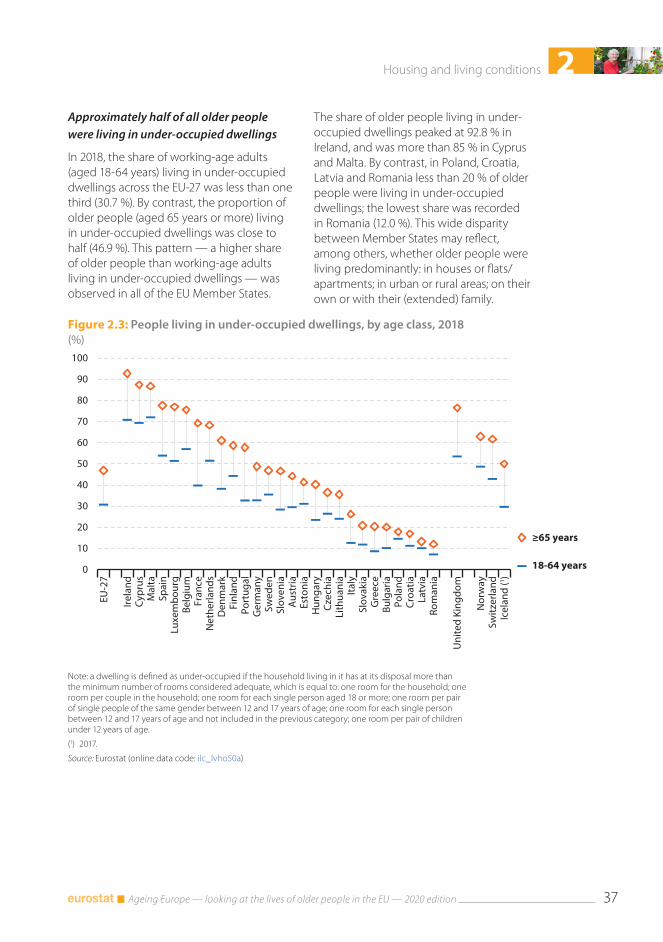
Approximately half of all older people were living in under-occupied dwellings
In 2018, the share of working-age adults (aged 18-64 years) living in under-occupied dwellings across the EU-27 was less than one third (30.7 %). By contrast, the proportion of older people (aged 65 years or more) living in under-occupied dwellings was close to half (46.9 %). This pattern — a higher share of older people than working-age adults living in under-occupied dwellings — was observed in all of the EU Member States.
The share of older people living in under-occupied dwellings peaked at 92.8 % in Ireland, and was more than 85 % in Cyprus and Malta. By contrast, in Poland, Croatia, Latvia and Romania less than 20 % of older people were living in under-occupied dwellings; the lowest share was recorded in Romania (12.0 %). This wide disparity between Member States may reflect, among others, whether older people were living predominantly: in houses or flats/apartments; in urban or rural areas; on their own or with their (extended) family.
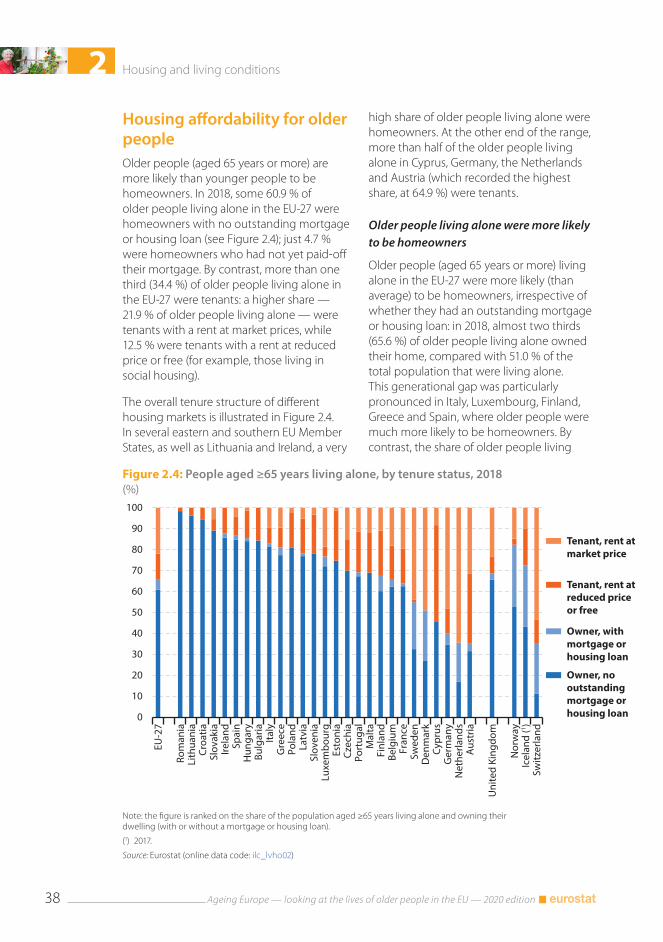
2 Housing and living conditions
Ageing Europe — looking at the lives of older people in the EU — 2020 edition38
Figure 2.4: People aged ≥65 years living alone, by tenure status, 2018(%)
0
10
20
30
40
50
60
70
80
90
100
EU-2
7
Rom
ania
Lith
uani
aCr
oatia
Slov
akia
Irela
ndSp
ain
Hun
gary
Bulg
aria
Italy
Gre
ece
Pola
ndLa
tvia
Slov
enia
Luxe
mbo
urg
Esto
nia
Czec
hia
Port
ugal
Mal
taFi
nlan
dBe
lgiu
mFr
ance
Swed
enD
enm
ark
Cypr
usG
erm
any
Net
herla
nds
Aus
tria
Uni
ted
King
dom
Nor
way
Icel
and
(1 )Sw
itzer
land
Tenant, rent atmarket price
Tenant, rent atreduced priceor free
Owner, with mortgage or housing loan
Owner, no outstanding mortgage or housing loan
Note: the figure is ranked on the share of the population aged ≥65 years living alone and owning their dwelling (with or without a mortgage or housing loan).
(1) 2017.
Source: Eurostat (online data code: ilc_lvho02)
Housing affordability for older peopleOlder people (aged 65 years or more) are more likely than younger people to be homeowners. In 2018, some 60.9 % of older people living alone in the EU-27 were homeowners with no outstanding mortgage or housing loan (see Figure 2.4); just 4.7 % were homeowners who had not yet paid-off their mortgage. By contrast, more than one third (34.4 %) of older people living alone in the EU-27 were tenants: a higher share — 21.9 % of older people living alone — were tenants with a rent at market prices, while 12.5 % were tenants with a rent at reduced price or free (for example, those living in social housing).
The overall tenure structure of different housing markets is illustrated in Figure 2.4. In several eastern and southern EU Member States, as well as Lithuania and Ireland, a very
high share of older people living alone were homeowners. At the other end of the range, more than half of the older people living alone in Cyprus, Germany, the Netherlands and Austria (which recorded the highest share, at 64.9 %) were tenants.
Older people living alone were more likely to be homeowners
Older people (aged 65 years or more) living alone in the EU-27 were more likely (than average) to be homeowners, irrespective of whether they had an outstanding mortgage or housing loan: in 2018, almost two thirds (65.6 %) of older people living alone owned their home, compared with 51.0 % of the total population that were living alone. This generational gap was particularly pronounced in Italy, Luxembourg, Finland, Greece and Spain, where older people were much more likely to be homeowners. By contrast, the share of older people living
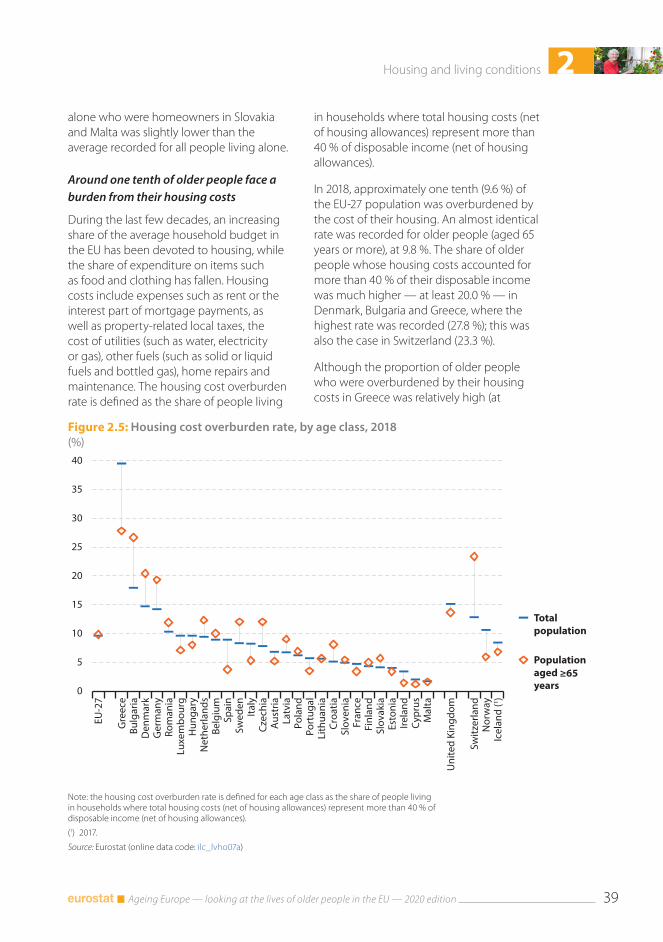
2Housing and living conditions
Ageing Europe — looking at the lives of older people in the EU — 2020 edition 39
Figure 2.5: Housing cost overburden rate, by age class, 2018(%)
0
5
10
15
20
25
30
35
40
EU-2
7
Gre
ece
Bulg
aria
Den
mar
kG
erm
any
Rom
ania
Luxe
mbo
urg
Hun
gary
Net
herla
nds
Belg
ium
Spai
nSw
eden
Italy
Czec
hia
Aus
tria
Latv
iaPo
land
Port
ugal
Lith
uani
aCr
oatia
Slov
enia
Fran
ceFi
nlan
dSl
ovak
iaEs
toni
aIre
land
Cypr
usM
alta
Uni
ted
King
dom
Switz
erla
ndN
orw
ayIc
elan
d (1 )
Totalpopulation
Population aged years
≥65
Note: the housing cost overburden rate is defined for each age class as the share of people living in households where total housing costs (net of housing allowances) represent more than 40 % of disposable income (net of housing allowances).
(1) 2017.
Source: Eurostat (online data code: ilc_lvho07a)
alone who were homeowners in Slovakia and Malta was slightly lower than the average recorded for all people living alone.
Around one tenth of older people face a burden from their housing costs
During the last few decades, an increasing share of the average household budget in the EU has been devoted to housing, while the share of expenditure on items such as food and clothing has fallen. Housing costs include expenses such as rent or the interest part of mortgage payments, as well as property-related local taxes, the cost of utilities (such as water, electricity or gas), other fuels (such as solid or liquid fuels and bottled gas), home repairs and maintenance. The housing cost overburden rate is defined as the share of people living
in households where total housing costs (net of housing allowances) represent more than 40 % of disposable income (net of housing allowances).
In 2018, approximately one tenth (9.6 %) of the EU-27 population was overburdened by the cost of their housing. An almost identical rate was recorded for older people (aged 65 years or more), at 9.8 %. The share of older people whose housing costs accounted for more than 40 % of their disposable income was much higher — at least 20.0 % — in Denmark, Bulgaria and Greece, where the highest rate was recorded (27.8 %); this was also the case in Switzerland (23.3 %).
Although the proportion of older people who were overburdened by their housing costs in Greece was relatively high (at
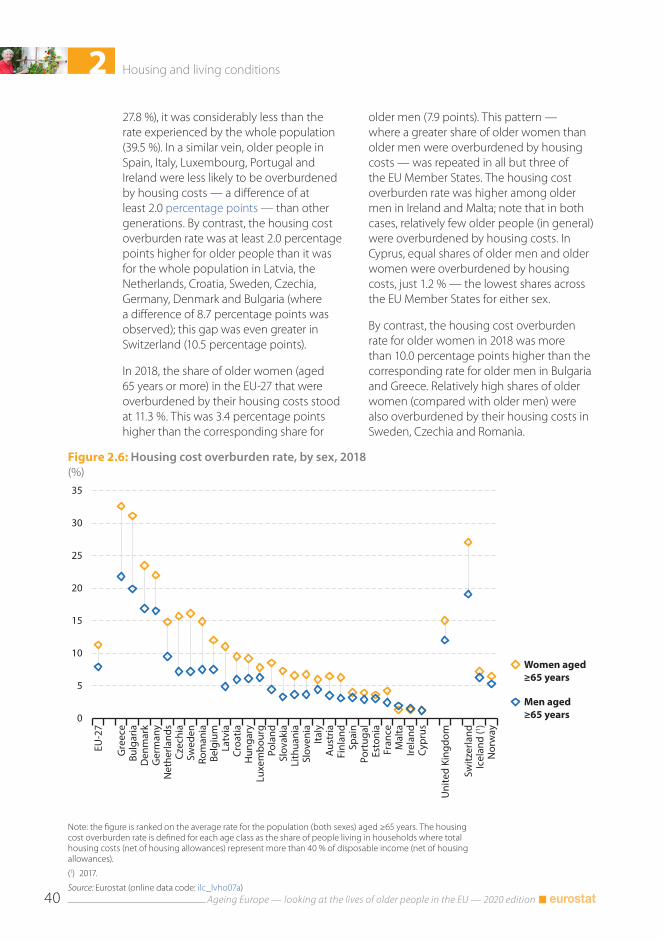
2 Housing and living conditions
Ageing Europe — looking at the lives of older people in the EU — 2020 edition40
Figure 2.6: Housing cost overburden rate, by sex, 2018(%)
0
5
10
15
20
25
30
35
EU-2
7
Gre
ece
Bulg
aria
Den
mar
kG
erm
any
Net
herla
nds
Czec
hia
Swed
enRo
man
iaBe
lgiu
mLa
tvia
Croa
tiaH
unga
ryLu
xem
bour
gPo
land
Slov
akia
Lith
uani
aSl
oven
iaIta
lyA
ustr
iaFi
nlan
dSp
ain
Port
ugal
Esto
nia
Fran
ceM
alta
Irela
ndCy
prus
Uni
ted
King
dom
Switz
erla
ndIc
elan
d (1 )
Nor
way
Women aged≥65 years
Men aged≥65 years
Note: the figure is ranked on the average rate for the population (both sexes) aged ≥65 years. The housing cost overburden rate is defined for each age class as the share of people living in households where total housing costs (net of housing allowances) represent more than 40 % of disposable income (net of housing allowances).
(1) 2017.
Source: Eurostat (online data code: ilc_lvho07a)
27.8 %), it was considerably less than the rate experienced by the whole population (39.5 %). In a similar vein, older people in Spain, Italy, Luxembourg, Portugal and Ireland were less likely to be overburdened by housing costs — a difference of at least 2.0 percentage points — than other generations. By contrast, the housing cost overburden rate was at least 2.0 percentage points higher for older people than it was for the whole population in Latvia, the Netherlands, Croatia, Sweden, Czechia, Germany, Denmark and Bulgaria (where a difference of 8.7 percentage points was observed); this gap was even greater in Switzerland (10.5 percentage points).
In 2018, the share of older women (aged 65 years or more) in the EU-27 that were overburdened by their housing costs stood at 11.3 %. This was 3.4 percentage points higher than the corresponding share for
older men (7.9 points). This pattern — where a greater share of older women than older men were overburdened by housing costs — was repeated in all but three of the EU Member States. The housing cost overburden rate was higher among older men in Ireland and Malta; note that in both cases, relatively few older people (in general) were overburdened by housing costs. In Cyprus, equal shares of older men and older women were overburdened by housing costs, just 1.2 % — the lowest shares across the EU Member States for either sex.
By contrast, the housing cost overburden rate for older women in 2018 was more than 10.0 percentage points higher than the corresponding rate for older men in Bulgaria and Greece. Relatively high shares of older women (compared with older men) were also overburdened by their housing costs in Sweden, Czechia and Romania.
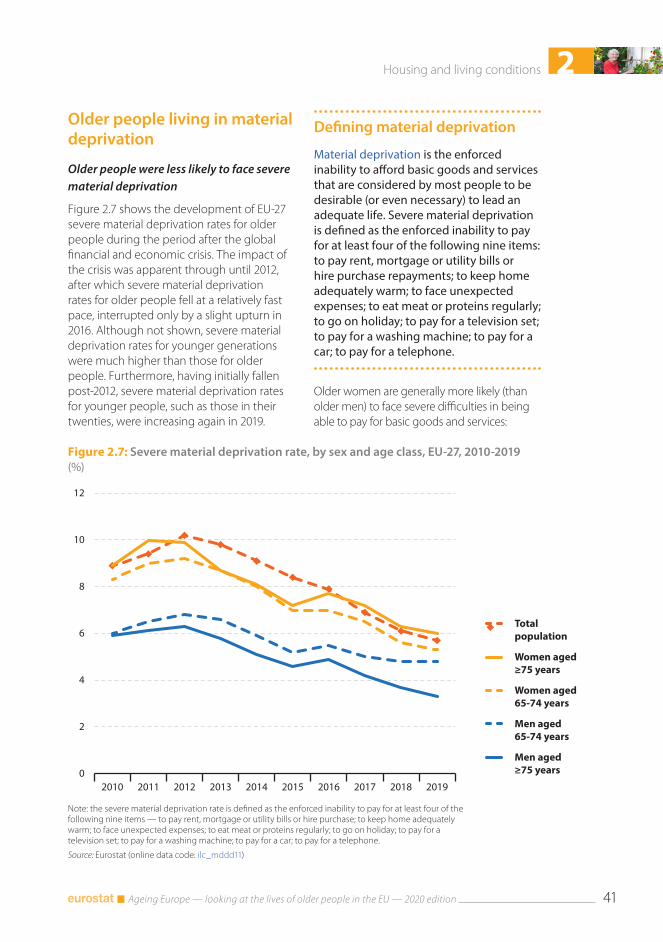
2Housing and living conditions
Ageing Europe — looking at the lives of older people in the EU — 2020 edition 41
Figure 2.7: Severe material deprivation rate, by sex and age class, EU-27, 2010-2019(%)
0
2
4
6
8
10
12
2010 2011 2012 2013 2014 2015 2016 2017 2018 2019
Totalpopulation
Women aged≥75 years
Women aged65-74 years
Men aged65-74 years
Men aged≥75 years
Note: the severe material deprivation rate is defined as the enforced inability to pay for at least four of the following nine items — to pay rent, mortgage or utility bills or hire purchase; to keep home adequately warm; to face unexpected expenses; to eat meat or proteins regularly; to go on holiday; to pay for a television set; to pay for a washing machine; to pay for a car; to pay for a telephone.
Source: Eurostat (online data code: ilc_mddd11)
Older people living in material deprivation
Older people were less likely to face severe material deprivation
Figure 2.7 shows the development of EU-27 severe material deprivation rates for older people during the period after the global financial and economic crisis. The impact of the crisis was apparent through until 2012, after which severe material deprivation rates for older people fell at a relatively fast pace, interrupted only by a slight upturn in 2016. Although not shown, severe material deprivation rates for younger generations were much higher than those for older people. Furthermore, having initially fallen post-2012, severe material deprivation rates for younger people, such as those in their twenties, were increasing again in 2019.
Older women are generally more likely (than older men) to face severe difficulties in being able to pay for basic goods and services:
Defining material deprivation
Material deprivation is the enforced inability to afford basic goods and services that are considered by most people to be desirable (or even necessary) to lead an adequate life. Severe material deprivation is defined as the enforced inability to pay for at least four of the following nine items: to pay rent, mortgage or utility bills or hire purchase repayments; to keep home adequately warm; to face unexpected expenses; to eat meat or proteins regularly; to go on holiday; to pay for a television set; to pay for a washing machine; to pay for a car; to pay for a telephone.
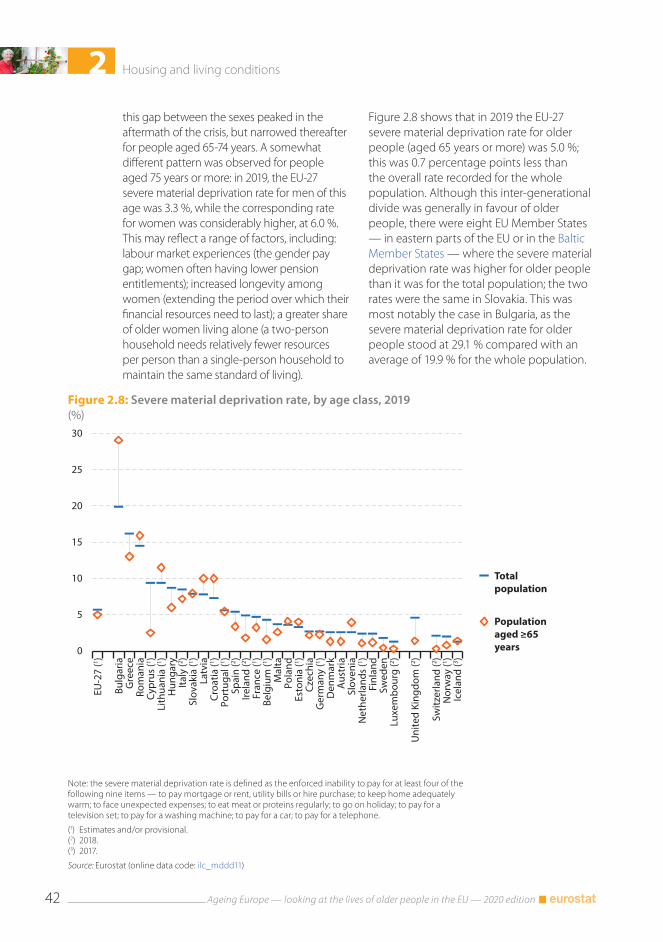
2 Housing and living conditions
Ageing Europe — looking at the lives of older people in the EU — 2020 edition42
Figure 2.8: Severe material deprivation rate, by age class, 2019(%)
0
5
10
15
20
25
30
EU-2
7 (1 )
Bulg
aria
Gre
ece
Rom
ania
Cypr
us (1 )
Lith
uani
a (1 )
Hun
gary
Italy
(2 )Sl
ovak
ia (1 )
Latv
iaCr
oatia
(1 )Po
rtug
al (1 )
Spai
n (2 )
Irela
nd (2 )
Fran
ce (1 )
Belg
ium
(1 )M
alta
Pola
ndEs
toni
a (1 )
Czec
hia
Ger
man
y (1 )
Den
mar
kA
ustr
iaSl
oven
iaN
ethe
rland
s (1 )
Finl
and
Swed
enLu
xem
bour
g (2 )
Uni
ted
King
dom
(2 )
Switz
erla
nd (2 )
Nor
way
(1 )Ic
elan
d (3 )
Totalpopulation
Population aged ≥65 years
Note: the severe material deprivation rate is defined as the enforced inability to pay for at least four of the following nine items — to pay mortgage or rent, utility bills or hire purchase; to keep home adequately warm; to face unexpected expenses; to eat meat or proteins regularly; to go on holiday; to pay for a television set; to pay for a washing machine; to pay for a car; to pay for a telephone.
(1) Estimates and/or provisional.(2) 2018.(3) 2017.
Source: Eurostat (online data code: ilc_mddd11)
this gap between the sexes peaked in the aftermath of the crisis, but narrowed thereafter for people aged 65-74 years. A somewhat different pattern was observed for people aged 75 years or more: in 2019, the EU-27 severe material deprivation rate for men of this age was 3.3 %, while the corresponding rate for women was considerably higher, at 6.0 %. This may reflect a range of factors, including: labour market experiences (the gender pay gap; women often having lower pension entitlements); increased longevity among women (extending the period over which their financial resources need to last); a greater share of older women living alone (a two-person household needs relatively fewer resources per person than a single-person household to maintain the same standard of living).
Figure 2.8 shows that in 2019 the EU-27 severe material deprivation rate for older people (aged 65 years or more) was 5.0 %; this was 0.7 percentage points less than the overall rate recorded for the whole population. Although this inter-generational divide was generally in favour of older people, there were eight EU Member States — in eastern parts of the EU or in the Baltic Member States — where the severe material deprivation rate was higher for older people than it was for the total population; the two rates were the same in Slovakia. This was most notably the case in Bulgaria, as the severe material deprivation rate for older people stood at 29.1 % compared with an average of 19.9 % for the whole population.
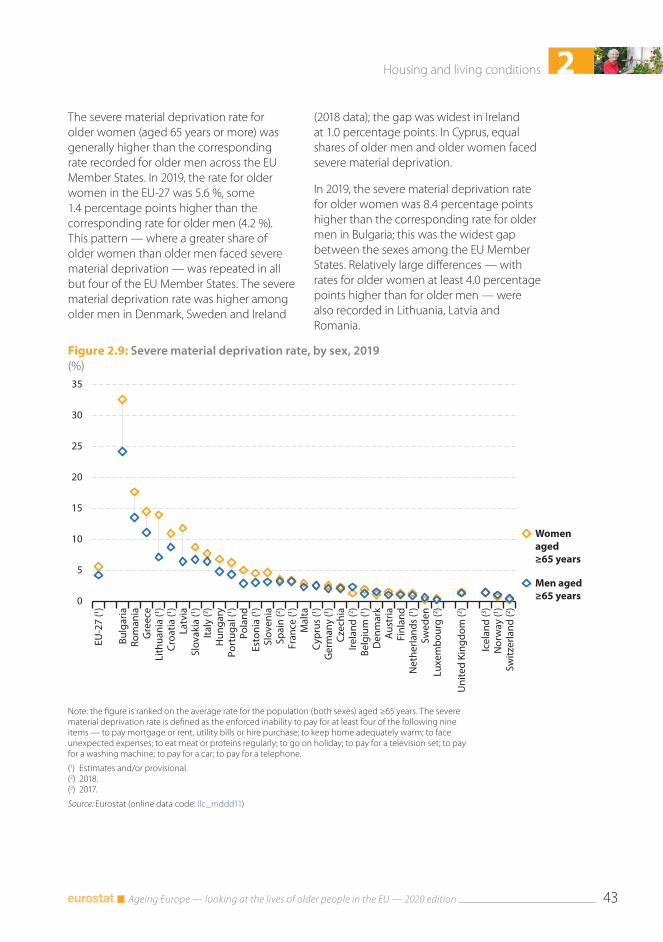
2Housing and living conditions
Ageing Europe — looking at the lives of older people in the EU — 2020 edition 43
Figure 2.9: Severe material deprivation rate, by sex, 2019(%)
0
5
10
15
20
25
30
35
EU-2
7 (1 )
Bulg
aria
Rom
ania
Gre
ece
Lith
uani
a (1 )
Croa
tia (1 )
Latv
iaSl
ovak
ia (1 )
Italy
(2 )H
unga
ryPo
rtug
al (1 )
Pola
ndEs
toni
a (1 )
Slov
enia
Spai
n (2 )
Fran
ce (1 )
Mal
taCy
prus
(1 )G
erm
any
(1 )Cz
echi
aIre
land
(2 )Be
lgiu
m (1 )
Den
mar
kA
ustr
iaFi
nlan
dN
ethe
rland
s (1 )
Swed
enLu
xem
bour
g (2 )
Uni
ted
King
dom
(2 )
Icel
and
(3 )N
orw
ay (1 )
Switz
erla
nd (2 )
Women aged≥65 years
Men aged≥65 years
Note: the figure is ranked on the average rate for the population (both sexes) aged ≥65 years. The severe material deprivation rate is defined as the enforced inability to pay for at least four of the following nine items — to pay mortgage or rent, utility bills or hire purchase; to keep home adequately warm; to face unexpected expenses; to eat meat or proteins regularly; to go on holiday; to pay for a television set; to pay for a washing machine; to pay for a car; to pay for a telephone.
(1) Estimates and/or provisional.(2) 2018.(3) 2017.
Source: Eurostat (online data code: ilc_mddd11)
The severe material deprivation rate for older women (aged 65 years or more) was generally higher than the corresponding rate recorded for older men across the EU Member States. In 2019, the rate for older women in the EU-27 was 5.6 %, some 1.4 percentage points higher than the corresponding rate for older men (4.2 %). This pattern — where a greater share of older women than older men faced severe material deprivation — was repeated in all but four of the EU Member States. The severe material deprivation rate was higher among older men in Denmark, Sweden and Ireland
(2018 data); the gap was widest in Ireland at 1.0 percentage points. In Cyprus, equal shares of older men and older women faced severe material deprivation.
In 2019, the severe material deprivation rate for older women was 8.4 percentage points higher than the corresponding rate for older men in Bulgaria; this was the widest gap between the sexes among the EU Member States. Relatively large differences — with rates for older women at least 4.0 percentage points higher than for older men — were also recorded in Lithuania, Latvia and Romania.
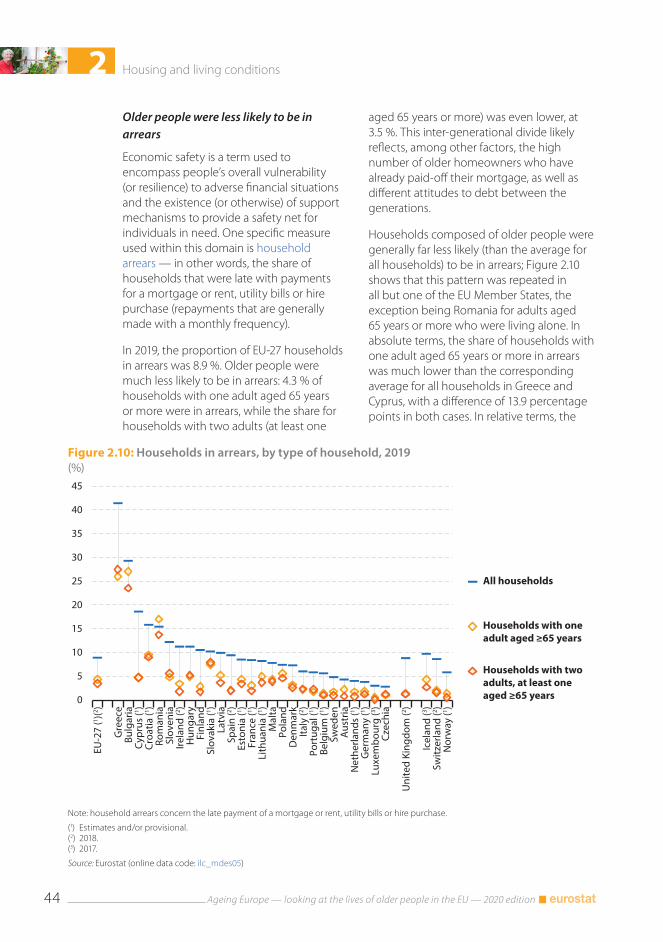
2 Housing and living conditions
Ageing Europe — looking at the lives of older people in the EU — 2020 edition44
Figure 2.10: Households in arrears, by type of household, 2019(%)
0
5
10
15
20
25
30
35
40
45
EU-2
7 (1 )(2 )
Gre
ece
Bulg
aria
Cypr
us (1 )
Croa
tia (1 )
Rom
ania
Slov
enia
Irela
nd (2 )
Hun
gary
Finl
and
Slov
akia
(1 )La
tvia
Spai
n (2 )
Esto
nia
(1 )Fr
ance
(1 )Li
thua
nia
(1 )M
alta
Pola
ndD
enm
ark
Italy
(2 )Po
rtug
al (1 )
Belg
ium
(1 )Sw
eden
Aus
tria
Net
herla
nds
(1 )G
erm
any
(1 )Lu
xem
bour
g (3 )
Czec
hia
Uni
ted
King
dom
(2 )
Icel
and
(3 )Sw
itzer
land
(2 )N
orw
ay (1 )
All households
Households with one adult aged ≥65 years
Households with two adults, at least one aged ≥65 years
Note: household arrears concern the late payment of a mortgage or rent, utility bills or hire purchase.
(1) Estimates and/or provisional.(2) 2018.(3) 2017.
Source: Eurostat (online data code: ilc_mdes05)
Older people were less likely to be in arrears
Economic safety is a term used to encompass people’s overall vulnerability (or resilience) to adverse financial situations and the existence (or otherwise) of support mechanisms to provide a safety net for individuals in need. One specific measure used within this domain is household arrears — in other words, the share of households that were late with payments for a mortgage or rent, utility bills or hire purchase (repayments that are generally made with a monthly frequency).
In 2019, the proportion of EU-27 households in arrears was 8.9 %. Older people were much less likely to be in arrears: 4.3 % of households with one adult aged 65 years or more were in arrears, while the share for households with two adults (at least one
aged 65 years or more) was even lower, at 3.5 %. This inter-generational divide likely reflects, among other factors, the high number of older homeowners who have already paid-off their mortgage, as well as different attitudes to debt between the generations.
Households composed of older people were generally far less likely (than the average for all households) to be in arrears; Figure 2.10 shows that this pattern was repeated in all but one of the EU Member States, the exception being Romania for adults aged 65 years or more who were living alone. In absolute terms, the share of households with one adult aged 65 years or more in arrears was much lower than the corresponding average for all households in Greece and Cyprus, with a difference of 13.9 percentage points in both cases. In relative terms, the
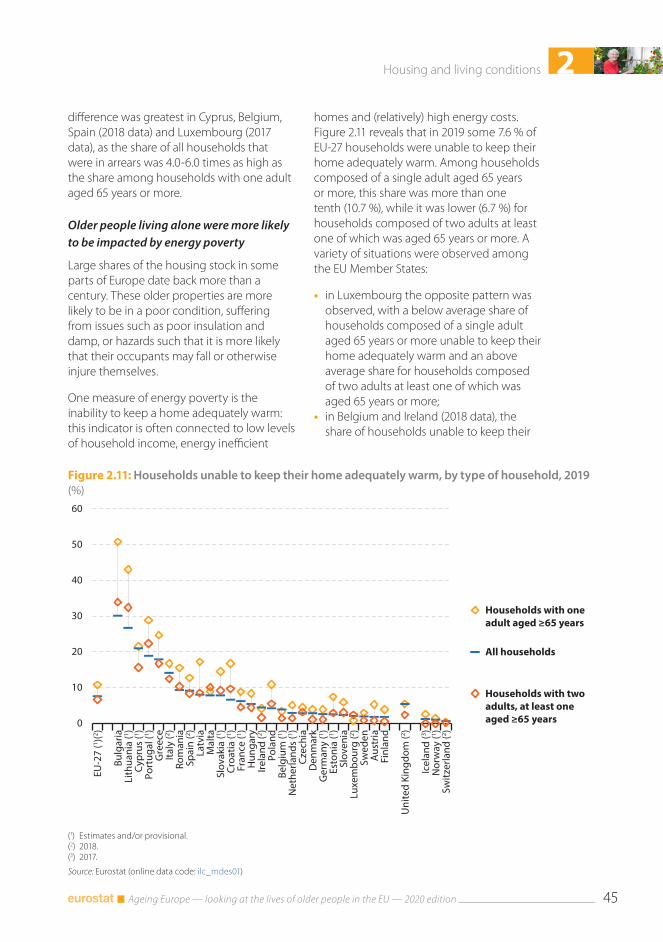
2Housing and living conditions
Ageing Europe — looking at the lives of older people in the EU — 2020 edition 45
Figure 2.11: Households unable to keep their home adequately warm, by type of household, 2019(%)
0
10
20
30
40
50
60
EU-2
7 (1 )(2 )
Bulg
aria
Lith
uani
a (1 )
Cypr
us (1 )
Port
ugal
(1 )G
reec
eIta
ly (2 )
Rom
ania
Spai
n (2 )
Latv
iaM
alta
Slov
akia
(1 )Cr
oatia
(1 )Fr
ance
(1 )H
unga
ryIre
land
(2 )Po
land
Belg
ium
(1 )N
ethe
rland
s (1 )
Czec
hia
Den
mar
kG
erm
any
(1 )Es
toni
a (1 )
Slov
enia
Luxe
mbo
urg
(2 )Sw
eden
Aus
tria
Finl
and
Uni
ted
King
dom
(2 )
Icel
and
(3 )N
orw
ay (1 )
Switz
erla
nd (2 )
Households with one adult aged ≥65 years
All households
Households with two adults, at least one aged ≥65 years
(1) Estimates and/or provisional.(2) 2018.(3) 2017.
Source: Eurostat (online data code: ilc_mdes01)
difference was greatest in Cyprus, Belgium, Spain (2018 data) and Luxembourg (2017 data), as the share of all households that were in arrears was 4.0-6.0 times as high as the share among households with one adult aged 65 years or more.
Older people living alone were more likely to be impacted by energy poverty
Large shares of the housing stock in some parts of Europe date back more than a century. These older properties are more likely to be in a poor condition, suffering from issues such as poor insulation and damp, or hazards such that it is more likely that their occupants may fall or otherwise injure themselves.
One measure of energy poverty is the inability to keep a home adequately warm: this indicator is often connected to low levels of household income, energy inefficient
homes and (relatively) high energy costs. Figure 2.11 reveals that in 2019 some 7.6 % of EU-27 households were unable to keep their home adequately warm. Among households composed of a single adult aged 65 years or more, this share was more than one tenth (10.7 %), while it was lower (6.7 %) for households composed of two adults at least one of which was aged 65 years or more. A variety of situations were observed among the EU Member States:
• in Luxembourg the opposite pattern was observed, with a below average share of households composed of a single adult aged 65 years or more unable to keep their home adequately warm and an above average share for households composed of two adults at least one of which was aged 65 years or more;
• in Belgium and Ireland (2018 data), the share of households unable to keep their
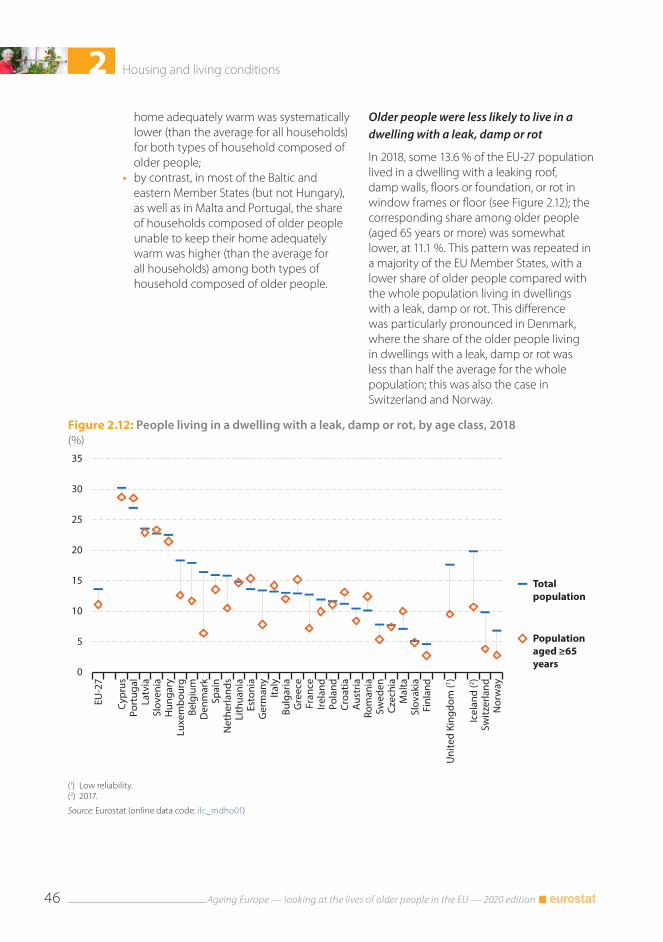
2 Housing and living conditions
Ageing Europe — looking at the lives of older people in the EU — 2020 edition46
Figure 2.12: People living in a dwelling with a leak, damp or rot, by age class, 2018(%)
0
5
10
15
20
25
30
35
EU-2
7
Cypr
usPo
rtug
alLa
tvia
Slov
enia
Hun
gary
Luxe
mbo
urg
Belg
ium
Den
mar
kSp
ain
Net
herla
nds
Lith
uani
aEs
toni
aG
erm
any
Italy
Bulg
aria
Gre
ece
Fran
ceIre
land
Pola
ndCr
oatia
Aus
tria
Rom
ania
Swed
enCz
echi
aM
alta
Slov
akia
Finl
and
Uni
ted
King
dom
(1 )
Icel
and
(2 )Sw
itzer
land
Nor
way
Totalpopulation
Population aged ≥65 years
(1) Low reliability.(2) 2017.
Source: Eurostat (online data code: ilc_mdho01)
home adequately warm was systematically lower (than the average for all households) for both types of household composed of older people;
• by contrast, in most of the Baltic and eastern Member States (but not Hungary), as well as in Malta and Portugal, the share of households composed of older people unable to keep their home adequately warm was higher (than the average for all households) among both types of household composed of older people.
Older people were less likely to live in a dwelling with a leak, damp or rot
In 2018, some 13.6 % of the EU-27 population lived in a dwelling with a leaking roof, damp walls, floors or foundation, or rot in window frames or floor (see Figure 2.12); the corresponding share among older people (aged 65 years or more) was somewhat lower, at 11.1 %. This pattern was repeated in a majority of the EU Member States, with a lower share of older people compared with the whole population living in dwellings with a leak, damp or rot. This difference was particularly pronounced in Denmark, where the share of the older people living in dwellings with a leak, damp or rot was less than half the average for the whole population; this was also the case in Switzerland and Norway.
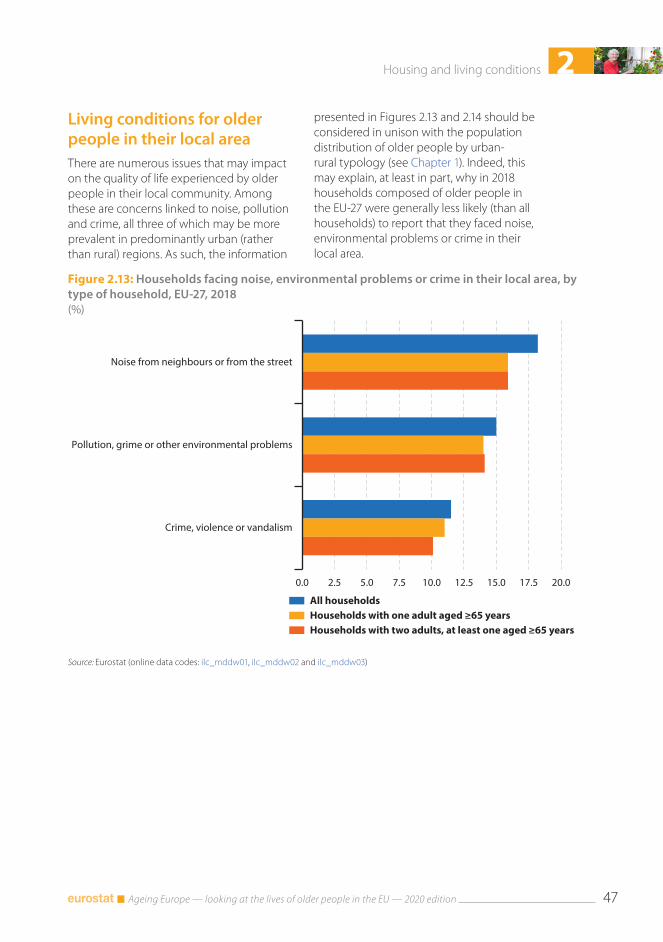
2Housing and living conditions
Ageing Europe — looking at the lives of older people in the EU — 2020 edition 47
Figure 2.13: Households facing noise, environmental problems or crime in their local area, by type of household, EU-27, 2018(%)
0.0 2.5 5.0 7.5 10.0 12.5 15.0 17.5 20.0
Noise from neighbours or from the street
Pollution, grime or other environmental problems
Crime, violence or vandalism
All householdsHouseholds with one adult aged ≥65 yearsHouseholds with two adults, at least one aged ≥65 years
Source: Eurostat (online data codes: ilc_mddw01, ilc_mddw02 and ilc_mddw03)
Living conditions for older people in their local areaThere are numerous issues that may impact on the quality of life experienced by older people in their local community. Among these are concerns linked to noise, pollution and crime, all three of which may be more prevalent in predominantly urban (rather than rural) regions. As such, the information
presented in Figures 2.13 and 2.14 should be considered in unison with the population distribution of older people by urban-rural typology (see Chapter 1). Indeed, this may explain, at least in part, why in 2018 households composed of older people in the EU-27 were generally less likely (than all households) to report that they faced noise, environmental problems or crime in their local area.
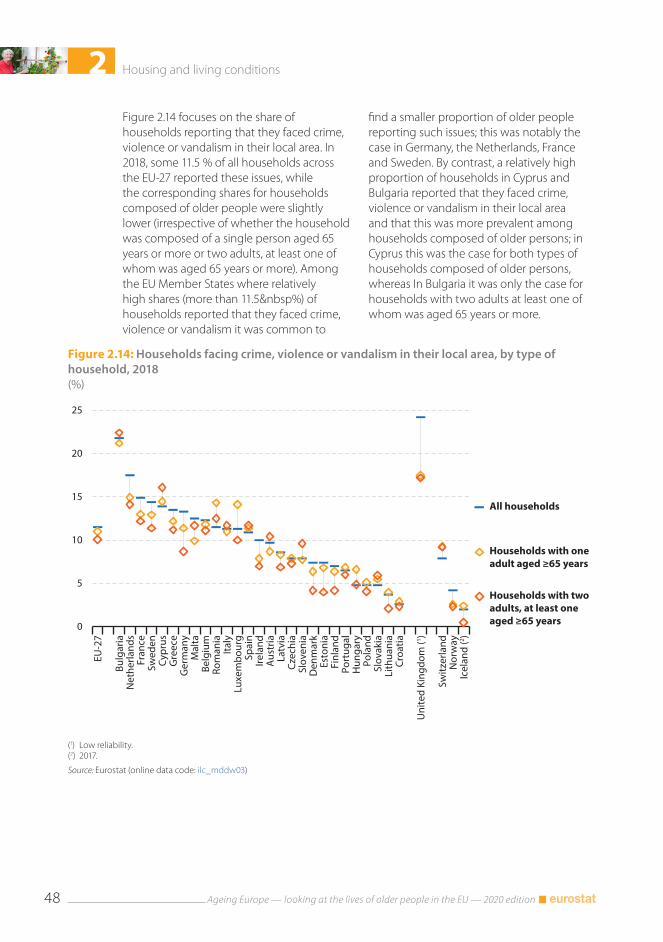
2 Housing and living conditions
Ageing Europe — looking at the lives of older people in the EU — 2020 edition48
Figure 2.14: Households facing crime, violence or vandalism in their local area, by type of household, 2018(%)
0
5
10
15
20
25
EU-2
7
Bulg
aria
Net
herla
nds
Fran
ceSw
eden
Cypr
usG
reec
eG
erm
any
Mal
taBe
lgiu
mRo
man
iaIta
lyLu
xem
bour
gSp
ain
Irela
ndA
ustr
iaLa
tvia
Czec
hia
Slov
enia
Den
mar
kEs
toni
aFi
nlan
dPo
rtug
alH
unga
ryPo
land
Slov
akia
Lith
uani
aCr
oatia
Uni
ted
King
dom
(1 )
Switz
erla
ndN
orw
ayIc
elan
d (2 )
All households
Households with one adult aged ≥65 years
Households with two adults, at least one aged ≥65 years
(1) Low reliability.(2) 2017.
Source: Eurostat (online data code: ilc_mddw03)
Figure 2.14 focuses on the share of households reporting that they faced crime, violence or vandalism in their local area. In 2018, some 11.5 % of all households across the EU-27 reported these issues, while the corresponding shares for households composed of older people were slightly lower (irrespective of whether the household was composed of a single person aged 65 years or more or two adults, at least one of whom was aged 65 years or more). Among the EU Member States where relatively high shares (more than 11.5 %) of households reported that they faced crime, violence or vandalism it was common to
find a smaller proportion of older people reporting such issues; this was notably the case in Germany, the Netherlands, France and Sweden. By contrast, a relatively high proportion of households in Cyprus and Bulgaria reported that they faced crime, violence or vandalism in their local area and that this was more prevalent among households composed of older persons; in Cyprus this was the case for both types of households composed of older persons, whereas In Bulgaria it was only the case for households with two adults at least one of whom was aged 65 years or more.

3 Health and disability
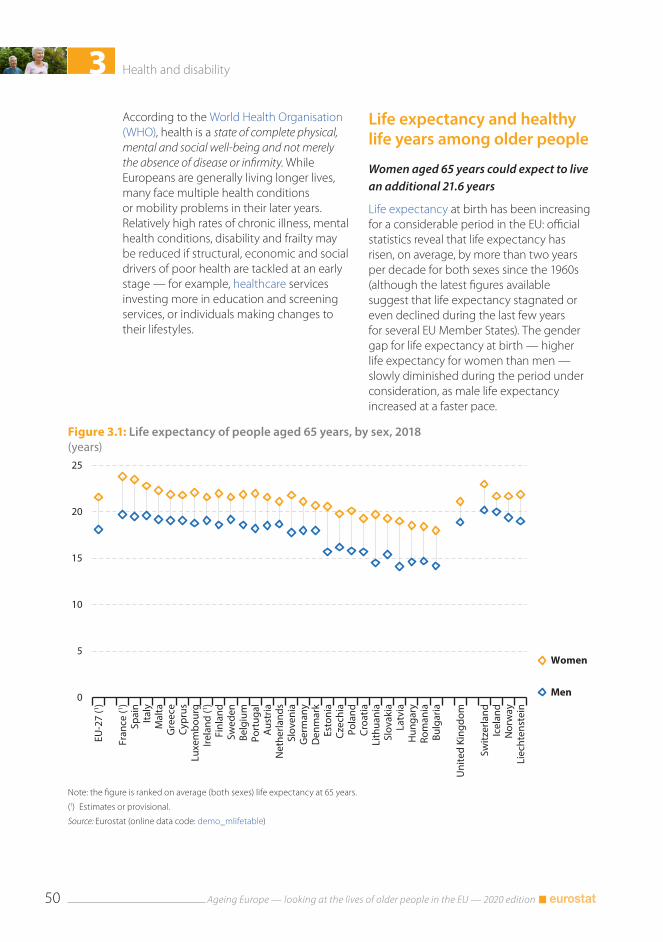
3 Health and disability
Ageing Europe — looking at the lives of older people in the EU — 2020 edition50
Figure 3.1: Life expectancy of people aged 65 years, by sex, 2018(years)
0
5
10
15
20
25
EU-2
7 (1 )
Fran
ce (1 )
Spai
nIta
lyM
alta
Gre
ece
Cypr
usLu
xem
bour
gIre
land
(1 )Fi
nlan
dSw
eden
Belg
ium
Port
ugal
Aus
tria
Net
herla
nds
Slov
enia
Ger
man
yD
enm
ark
Esto
nia
Czec
hia
Pola
ndCr
oatia
Lith
uani
aSl
ovak
iaLa
tvia
Hun
gary
Rom
ania
Bulg
aria
Uni
ted
King
dom
Switz
erla
ndIc
elan
dN
orw
ayLi
echt
enst
ein
Women
Men
Note: the figure is ranked on average (both sexes) life expectancy at 65 years.
(1) Estimates or provisional.
Source: Eurostat (online data code: demo_mlifetable)
According to the World Health Organisation (WHO), health is a state of complete physical, mental and social well-being and not merely the absence of disease or infirmity. While Europeans are generally living longer lives, many face multiple health conditions or mobility problems in their later years. Relatively high rates of chronic illness, mental health conditions, disability and frailty may be reduced if structural, economic and social drivers of poor health are tackled at an early stage — for example, healthcare services investing more in education and screening services, or individuals making changes to their lifestyles.
Life expectancy and healthy life years among older people
Women aged 65 years could expect to live an additional 21.6 years
Life expectancy at birth has been increasing for a considerable period in the EU: official statistics reveal that life expectancy has risen, on average, by more than two years per decade for both sexes since the 1960s (although the latest figures available suggest that life expectancy stagnated or even declined during the last few years for several EU Member States). The gender gap for life expectancy at birth — higher life expectancy for women than men — slowly diminished during the period under consideration, as male life expectancy increased at a faster pace.
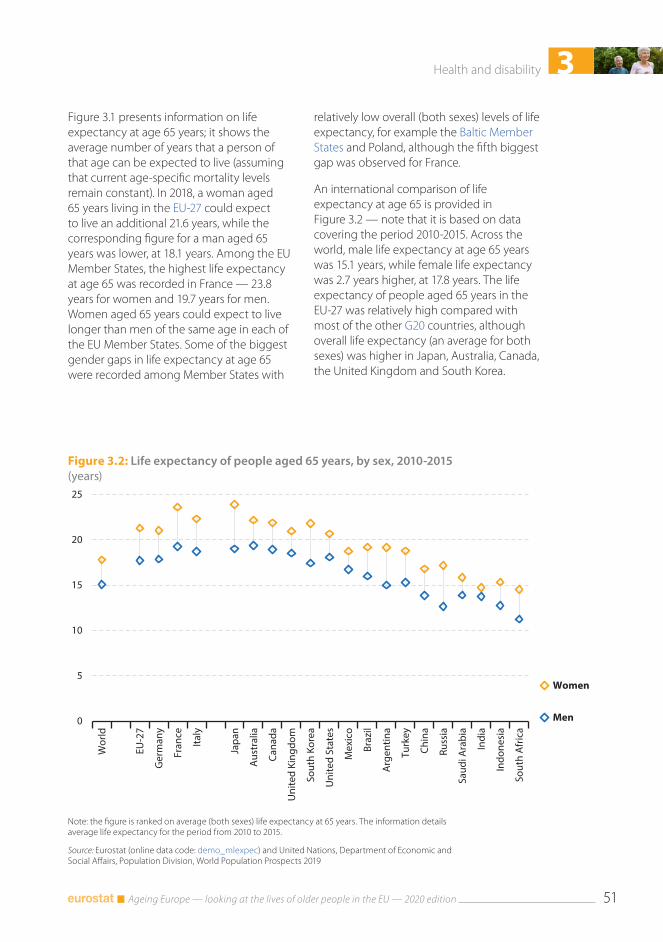
3Health and disability
Ageing Europe — looking at the lives of older people in the EU — 2020 edition 51
Figure 3.2: Life expectancy of people aged 65 years, by sex, 2010-2015(years)
0
5
10
15
20
25
Wor
ld
EU-2
7
Ger
man
y
Fran
ce
Italy
Japa
n
Aus
tral
ia
Cana
da
Uni
ted
King
dom
Sout
h Ko
rea
Uni
ted
Stat
es
Mex
ico
Braz
il
Arg
entin
a
Turk
ey
Chin
a
Russ
ia
Saud
i Ara
bia
Indi
a
Indo
nesi
a
Sout
h A
fric
a
Women
Men
Note: the figure is ranked on average (both sexes) life expectancy at 65 years. The information details average life expectancy for the period from 2010 to 2015.
Source: Eurostat (online data code: demo_mlexpec) and United Nations, Department of Economic and Social Affairs, Population Division, World Population Prospects 2019
Figure 3.1 presents information on life expectancy at age 65 years; it shows the average number of years that a person of that age can be expected to live (assuming that current age-specific mortality levels remain constant). In 2018, a woman aged 65 years living in the EU-27 could expect to live an additional 21.6 years, while the corresponding figure for a man aged 65 years was lower, at 18.1 years. Among the EU Member States, the highest life expectancy at age 65 was recorded in France — 23.8 years for women and 19.7 years for men. Women aged 65 years could expect to live longer than men of the same age in each of the EU Member States. Some of the biggest gender gaps in life expectancy at age 65 were recorded among Member States with
relatively low overall (both sexes) levels of life expectancy, for example the Baltic Member States and Poland, although the fifth biggest gap was observed for France.
An international comparison of life expectancy at age 65 is provided in Figure 3.2 — note that it is based on data covering the period 2010-2015. Across the world, male life expectancy at age 65 years was 15.1 years, while female life expectancy was 2.7 years higher, at 17.8 years. The life expectancy of people aged 65 years in the EU-27 was relatively high compared with most of the other G20 countries, although overall life expectancy (an average for both sexes) was higher in Japan, Australia, Canada, the United Kingdom and South Korea.
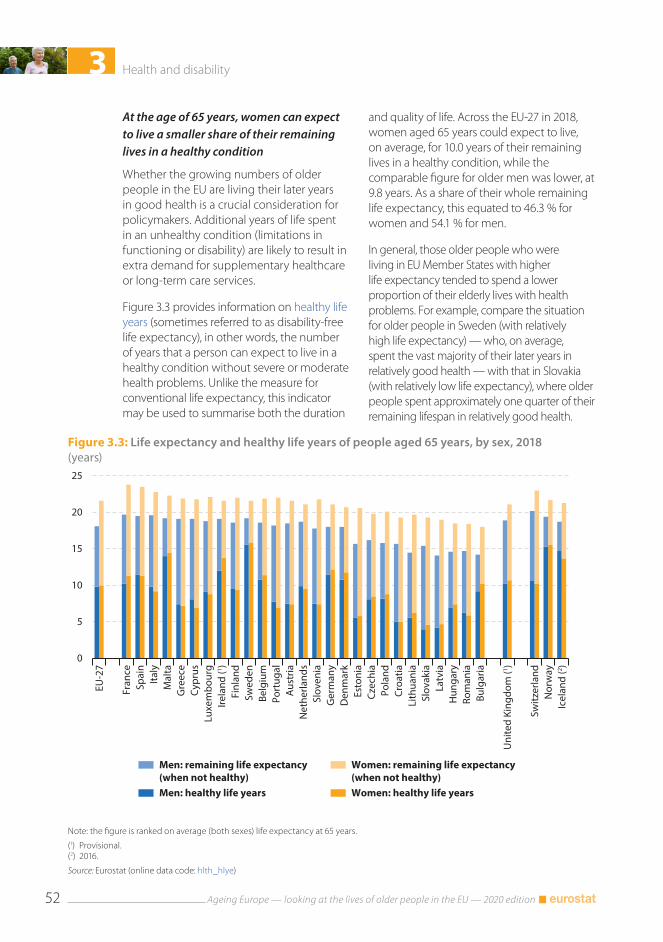
3 Health and disability
Ageing Europe — looking at the lives of older people in the EU — 2020 edition52
Figure 3.3: Life expectancy and healthy life years of people aged 65 years, by sex, 2018(years)
EU-2
7
Fran
ceSp
ain
Italy
Mal
taG
reec
eCy
prus
Luxe
mbo
urg
Irela
nd (1 )
Finl
and
Swed
enBe
lgiu
mPo
rtug
alA
ustr
iaN
ethe
rland
sSl
oven
iaG
erm
any
Den
mar
kEs
toni
aCz
echi
aPo
land
Croa
tiaLi
thua
nia
Slov
akia
Latv
iaH
unga
ryRo
man
iaBu
lgar
ia
Uni
ted
King
dom
(1 )
Switz
erla
ndN
orw
ayIc
elan
d (2 )
0
5
10
15
20
25
Men: remaining life expectancy (when not healthy)
Women: remaining life expectancy (when not healthy)
Men: healthy life years Women: healthy life years
Note: the figure is ranked on average (both sexes) life expectancy at 65 years.
(1) Provisional.(2) 2016.
Source: Eurostat (online data code: hlth_hlye)
At the age of 65 years, women can expect to live a smaller share of their remaining lives in a healthy condition
Whether the growing numbers of older people in the EU are living their later years in good health is a crucial consideration for policymakers. Additional years of life spent in an unhealthy condition (limitations in functioning or disability) are likely to result in extra demand for supplementary healthcare or long-term care services.
Figure 3.3 provides information on healthy life years (sometimes referred to as disability-free life expectancy), in other words, the number of years that a person can expect to live in a healthy condition without severe or moderate health problems. Unlike the measure for conventional life expectancy, this indicator may be used to summarise both the duration
and quality of life. Across the EU-27 in 2018, women aged 65 years could expect to live, on average, for 10.0 years of their remaining lives in a healthy condition, while the comparable figure for older men was lower, at 9.8 years. As a share of their whole remaining life expectancy, this equated to 46.3 % for women and 54.1 % for men.
In general, those older people who were living in EU Member States with higher life expectancy tended to spend a lower proportion of their elderly lives with health problems. For example, compare the situation for older people in Sweden (with relatively high life expectancy) — who, on average, spent the vast majority of their later years in relatively good health — with that in Slovakia (with relatively low life expectancy), where older people spent approximately one quarter of their remaining lifespan in relatively good health.
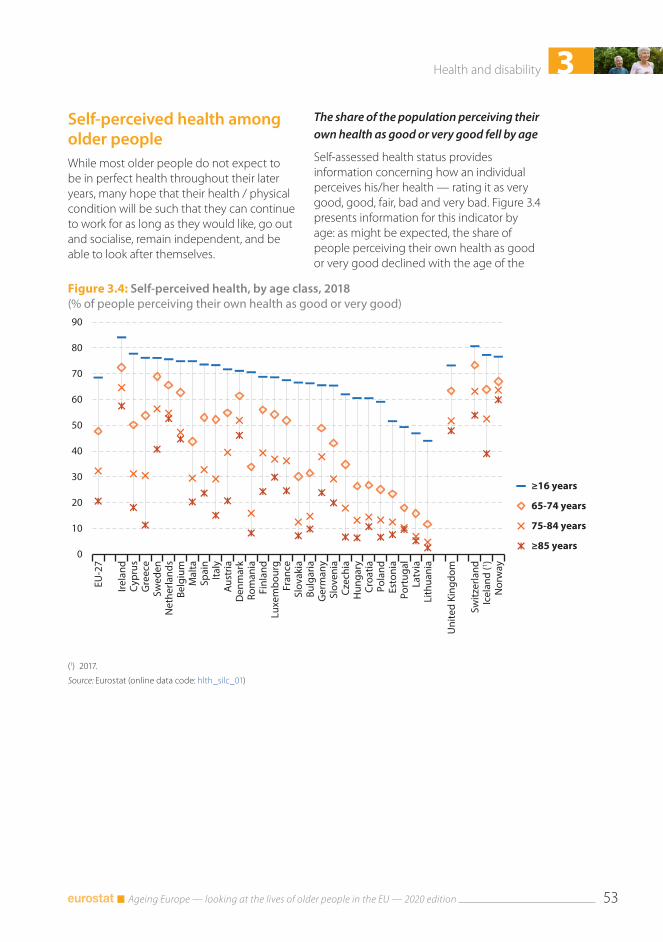
3Health and disability
Ageing Europe — looking at the lives of older people in the EU — 2020 edition 53
Figure 3.4: Self-perceived health, by age class, 2018(% of people perceiving their own health as good or very good)
0
10
20
30
40
50
60
70
80
90
EU-2
7
Irela
ndCy
prus
Gre
ece
Swed
enN
ethe
rland
sBe
lgiu
mM
alta
Spai
nIta
lyA
ustr
iaD
enm
ark
Rom
ania
Finl
and
Luxe
mbo
urg
Fran
ceSl
ovak
iaBu
lgar
iaG
erm
any
Slov
enia
Czec
hia
Hun
gary
Croa
tiaPo
land
Esto
nia
Port
ugal
Latv
iaLi
thua
nia
Uni
ted
King
dom
Switz
erla
ndIc
elan
d (1 )
Nor
way
≥16 years
65-74 years
75-84 years
≥85 years
(1) 2017.
Source: Eurostat (online data code: hlth_silc_01)
Self-perceived health among older peopleWhile most older people do not expect to be in perfect health throughout their later years, many hope that their health / physical condition will be such that they can continue to work for as long as they would like, go out and socialise, remain independent, and be able to look after themselves.
The share of the population perceiving their own health as good or very good fell by age
Self-assessed health status provides information concerning how an individual perceives his/her health — rating it as very good, good, fair, bad and very bad. Figure 3.4 presents information for this indicator by age: as might be expected, the share of people perceiving their own health as good or very good declined with the age of the
3 Health and disability
Ageing Europe — looking at the lives of older people in the EU — 2020 edition54
respondent. In 2018, some 68.5 % of the EU-27 adult population (aged 16 years or more) considered their own health to be good or very good. Just less than half (47.8 %) of older people (aged 65-74 years) in the EU-27 perceived their health to be good or very good, a share that fell to less than one third (32.3 %) among those aged 75-84 years and to around one fifth (20.6 %) for very old people (aged 85 years or more).
The pace at which the older population perceived their own health to be deteriorating varied considerably across the EU Member States. Nevertheless, the pattern of declining health as a function of age was repeated in all of the EU Member States in 2018. In Belgium, Lithuania, the Netherlands, Latvia and Portugal there was a relatively
small difference — less than 3.0 percentage points — between the share of people aged 75-84 years perceiving their own health as good or very good and the equivalent share for very old people.
In 2018, the share of older people (aged 65-74 years) perceiving their own health as good or very good was less than half the corresponding share recorded for the whole adult population in Romania, Bulgaria, Estonia, Slovakia, Croatia, Hungary, Poland and Portugal. Even greater differences were registered in Latvia and Lithuania, as the share for people aged 65-74 years was around one third of the average for all adults in Latvia and approximately one quarter of the average for all adults in Lithuania.
Data limitations for analysing self-perceived health
Health status and health services consumption may strongly differ between individuals living in institutions and in private households. It is important to note that the information presented below for self-perceived health conditions is taken from a survey where people living in collective households and institutions are generally excluded from the target population, which may lead to lower incidence of some health issues than might be observed with a complete coverage (considering that many of these conditions are more frequently experienced by older people who are unable to continue living at home).
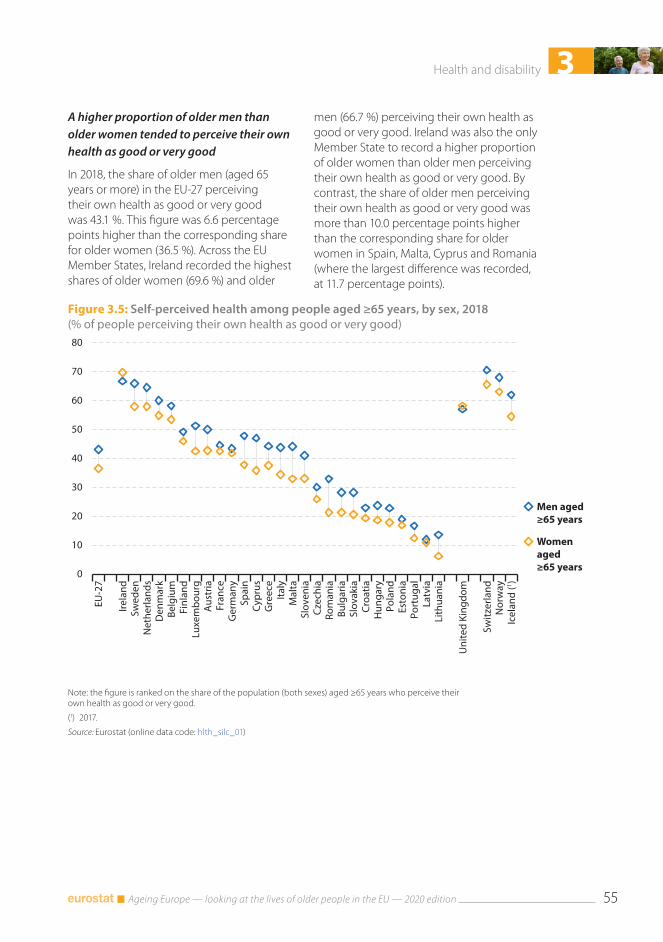
3Health and disability
Ageing Europe — looking at the lives of older people in the EU — 2020 edition 55
Figure 3.5: Self-perceived health among people aged ≥65 years, by sex, 2018(% of people perceiving their own health as good or very good)
0
10
20
30
40
50
60
70
80
EU-2
7
Irela
ndSw
eden
Net
herla
nds
Den
mar
kBe
lgiu
mFi
nlan
dLu
xem
bour
gA
ustr
iaFr
ance
Ger
man
ySp
ain
Cypr
usG
reec
eIta
lyM
alta
Slov
enia
Czec
hia
Rom
ania
Bulg
aria
Slov
akia
Croa
tiaH
unga
ryPo
land
Esto
nia
Port
ugal
Latv
iaLi
thua
nia
Uni
ted
King
dom
Switz
erla
ndN
orw
ayIc
elan
d (1 )
Men aged≥65 years
Women aged≥65 years
Note: the figure is ranked on the share of the population (both sexes) aged ≥65 years who perceive their own health as good or very good.
(1) 2017.
Source: Eurostat (online data code: hlth_silc_01)
A higher proportion of older men than older women tended to perceive their own health as good or very good
In 2018, the share of older men (aged 65 years or more) in the EU-27 perceiving their own health as good or very good was 43.1 %. This figure was 6.6 percentage points higher than the corresponding share for older women (36.5 %). Across the EU Member States, Ireland recorded the highest shares of older women (69.6 %) and older
men (66.7 %) perceiving their own health as good or very good. Ireland was also the only Member State to record a higher proportion of older women than older men perceiving their own health as good or very good. By contrast, the share of older men perceiving their own health as good or very good was more than 10.0 percentage points higher than the corresponding share for older women in Spain, Malta, Cyprus and Romania (where the largest difference was recorded, at 11.7 percentage points).
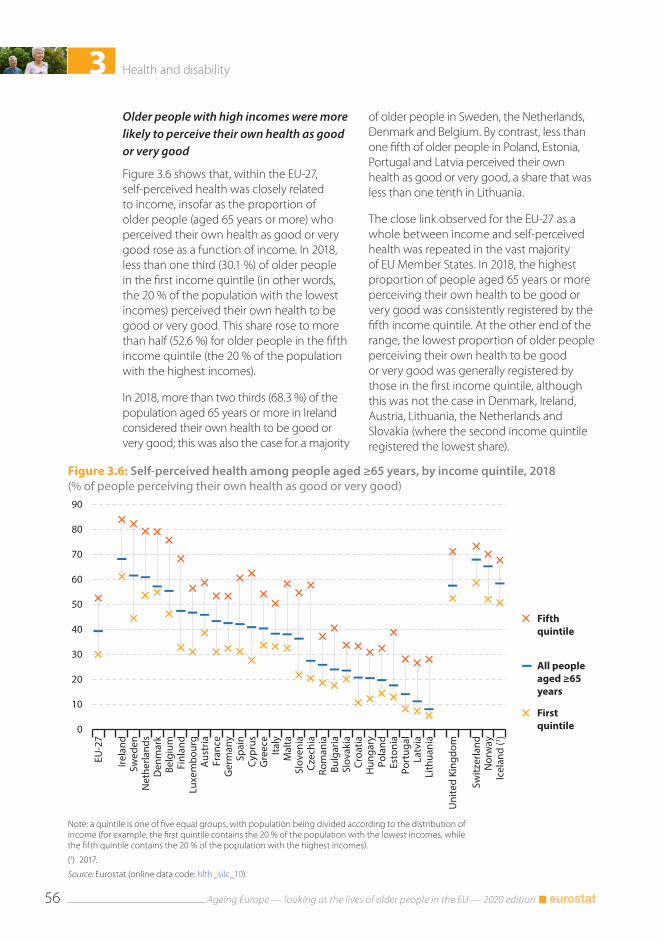
3 Health and disability
Ageing Europe — looking at the lives of older people in the EU — 2020 edition56
Figure 3.6: Self-perceived health among people aged ≥65 years, by income quintile, 2018(% of people perceiving their own health as good or very good)
0
10
20
30
40
50
60
70
80
90
EU-2
7
Irela
ndSw
eden
Net
herla
nds
Den
mar
kBe
lgiu
mFi
nlan
dLu
xem
bour
gA
ustr
iaFr
ance
Ger
man
ySp
ain
Cypr
usG
reec
eIta
lyM
alta
Slov
enia
Czec
hia
Rom
ania
Bulg
aria
Slov
akia
Croa
tiaH
unga
ryPo
land
Esto
nia
Port
ugal
Latv
iaLi
thua
nia
Uni
ted
King
dom
Switz
erla
ndN
orw
ayIc
elan
d (1 )
Fifthquintile
All people aged ≥65 years
Firstquintile
Note: a quintile is one of five equal groups, with population being divided according to the distribution of income (for example, the first quintile contains the 20 % of the population with the lowest incomes, while the fifth quintile contains the 20 % of the population with the highest incomes).
(1) 2017.
Source: Eurostat (online data code: hlth_silc_10)
Older people with high incomes were more likely to perceive their own health as good or very good
Figure 3.6 shows that, within the EU-27, self-perceived health was closely related to income, insofar as the proportion of older people (aged 65 years or more) who perceived their own health as good or very good rose as a function of income. In 2018, less than one third (30.1 %) of older people in the first income quintile (in other words, the 20 % of the population with the lowest incomes) perceived their own health to be good or very good. This share rose to more than half (52.6 %) for older people in the fifth income quintile (the 20 % of the population with the highest incomes).
In 2018, more than two thirds (68.3 %) of the population aged 65 years or more in Ireland considered their own health to be good or very good; this was also the case for a majority
of older people in Sweden, the Netherlands, Denmark and Belgium. By contrast, less than one fifth of older people in Poland, Estonia, Portugal and Latvia perceived their own health as good or very good, a share that was less than one tenth in Lithuania.
The close link observed for the EU-27 as a whole between income and self-perceived health was repeated in the vast majority of EU Member States. In 2018, the highest proportion of people aged 65 years or more perceiving their own health to be good or very good was consistently registered by the fifth income quintile. At the other end of the range, the lowest proportion of older people perceiving their own health to be good or very good was generally registered by those in the first income quintile, although this was not the case in Denmark, Ireland, Austria, Lithuania, the Netherlands and Slovakia (where the second income quintile registered the lowest share).
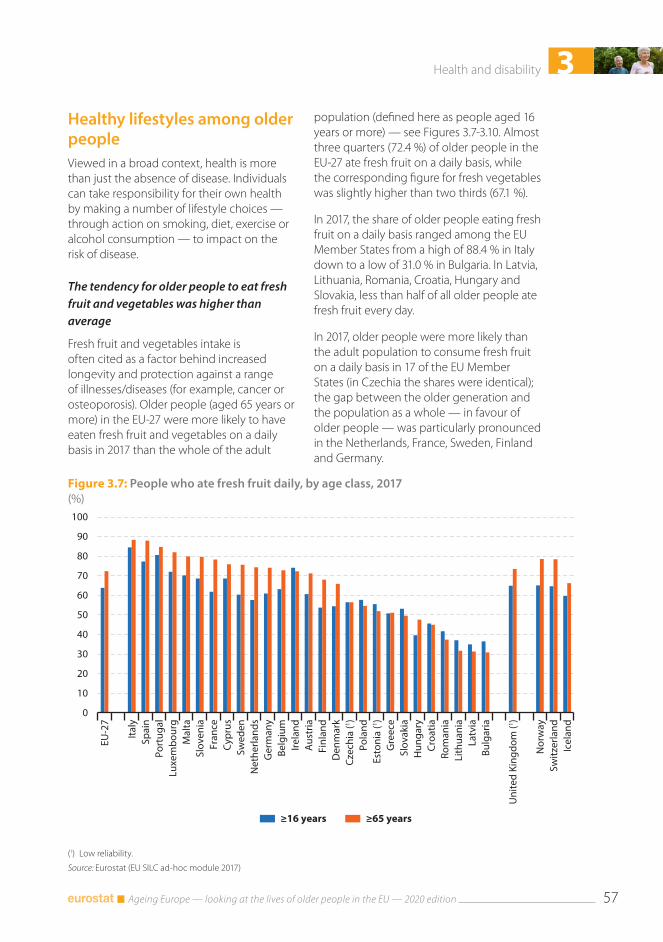
3Health and disability
Ageing Europe — looking at the lives of older people in the EU — 2020 edition 57
Figure 3.7: People who ate fresh fruit daily, by age class, 2017(%)
0
10
20
30
40
50
60
70
80
90
100
EU-2
7
Italy
Spai
nPo
rtug
alLu
xem
bour
gM
alta
Slov
enia
Fran
ceCy
prus
Swed
enN
ethe
rland
sG
erm
any
Belg
ium
Irela
ndA
ustr
iaFi
nlan
dD
enm
ark
Czec
hia
(1 )Po
land
Esto
nia
(1 )G
reec
eSl
ovak
iaH
unga
ryCr
oatia
Rom
ania
Lith
uani
aLa
tvia
Bulg
aria
Uni
ted
King
dom
(1 )
Nor
way
Switz
erla
ndIc
elan
d
≥16 years ≥65 years
(1) Low reliability.
Source: Eurostat (EU SILC ad-hoc module 2017)
Healthy lifestyles among older peopleViewed in a broad context, health is more than just the absence of disease. Individuals can take responsibility for their own health by making a number of lifestyle choices — through action on smoking, diet, exercise or alcohol consumption — to impact on the risk of disease.
The tendency for older people to eat fresh fruit and vegetables was higher than average
Fresh fruit and vegetables intake is often cited as a factor behind increased longevity and protection against a range of illnesses/diseases (for example, cancer or osteoporosis). Older people (aged 65 years or more) in the EU-27 were more likely to have eaten fresh fruit and vegetables on a daily basis in 2017 than the whole of the adult
population (defined here as people aged 16 years or more) — see Figures 3.7-3.10. Almost three quarters (72.4 %) of older people in the EU-27 ate fresh fruit on a daily basis, while the corresponding figure for fresh vegetables was slightly higher than two thirds (67.1 %).
In 2017, the share of older people eating fresh fruit on a daily basis ranged among the EU Member States from a high of 88.4 % in Italy down to a low of 31.0 % in Bulgaria. In Latvia, Lithuania, Romania, Croatia, Hungary and Slovakia, less than half of all older people ate fresh fruit every day.
In 2017, older people were more likely than the adult population to consume fresh fruit on a daily basis in 17 of the EU Member States (in Czechia the shares were identical); the gap between the older generation and the population as a whole — in favour of older people — was particularly pronounced in the Netherlands, France, Sweden, Finland and Germany.
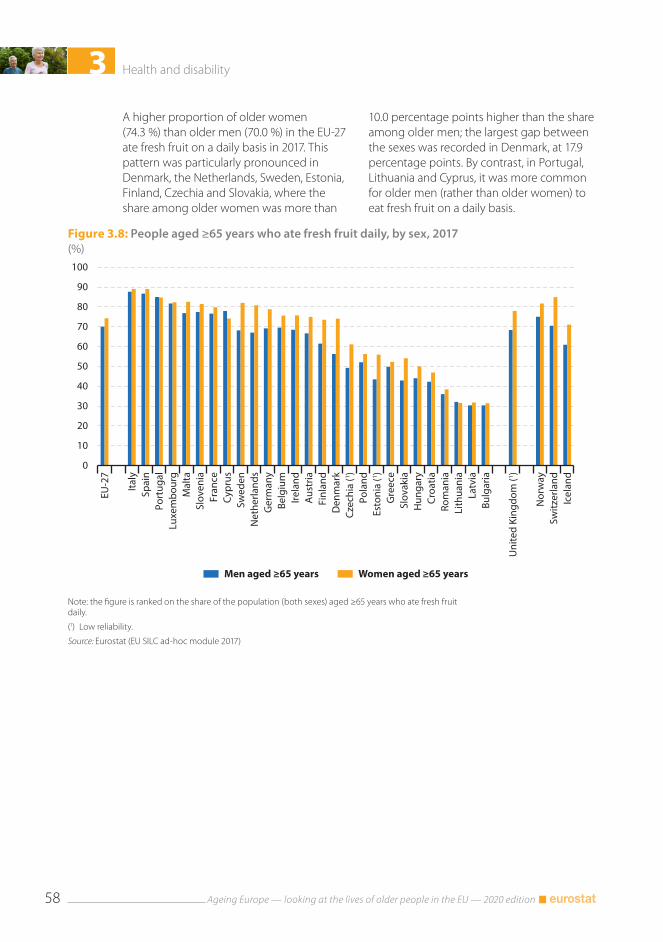
3 Health and disability
Ageing Europe — looking at the lives of older people in the EU — 2020 edition58
Figure 3.8: People aged ≥65 years who ate fresh fruit daily, by sex, 2017(%)
0
10
20
30
40
50
60
70
80
90
100
EU-2
7
Italy
Spai
nPo
rtug
alLu
xem
bour
gM
alta
Slov
enia
Fran
ceCy
prus
Swed
enN
ethe
rland
sG
erm
any
Belg
ium
Irela
ndA
ustr
iaFi
nlan
dD
enm
ark
Czec
hia
(1 )Po
land
Esto
nia
(1 )G
reec
eSl
ovak
iaH
unga
ryCr
oatia
Rom
ania
Lith
uani
aLa
tvia
Bulg
aria
Uni
ted
King
dom
(1 )
Nor
way
Switz
erla
ndIc
elan
dMen aged ≥65 years Women aged ≥65 years
Note: the figure is ranked on the share of the population (both sexes) aged ≥65 years who ate fresh fruit daily.
(1) Low reliability.
Source: Eurostat (EU SILC ad-hoc module 2017)
A higher proportion of older women (74.3 %) than older men (70.0 %) in the EU-27 ate fresh fruit on a daily basis in 2017. This pattern was particularly pronounced in Denmark, the Netherlands, Sweden, Estonia, Finland, Czechia and Slovakia, where the share among older women was more than
10.0 percentage points higher than the share among older men; the largest gap between the sexes was recorded in Denmark, at 17.9 percentage points. By contrast, in Portugal, Lithuania and Cyprus, it was more common for older men (rather than older women) to eat fresh fruit on a daily basis.
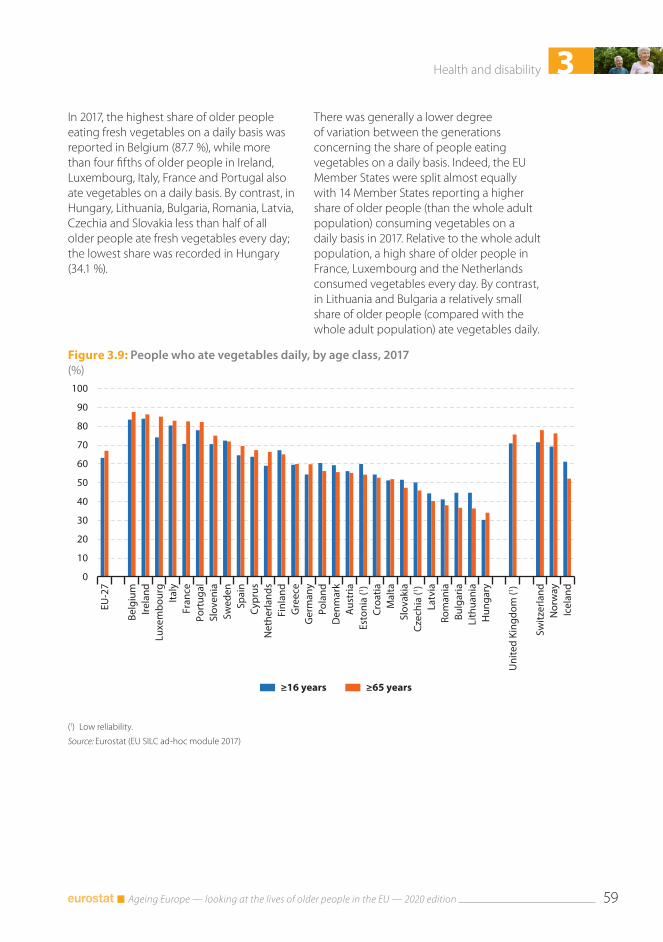
3Health and disability
Ageing Europe — looking at the lives of older people in the EU — 2020 edition 59
Figure 3.9: People who ate vegetables daily, by age class, 2017(%)
0
10
20
30
40
50
60
70
80
90
100
EU-2
7
Belg
ium
Irela
ndLu
xem
bour
gIta
lyFr
ance
Port
ugal
Slov
enia
Swed
enSp
ain
Cypr
usN
ethe
rland
sFi
nlan
dG
reec
eG
erm
any
Pola
ndD
enm
ark
Aus
tria
Esto
nia
(1 )Cr
oatia
Mal
taSl
ovak
iaCz
echi
a (1 )
Latv
iaRo
man
iaBu
lgar
iaLi
thua
nia
Hun
gary
Uni
ted
King
dom
(1 )
Switz
erla
ndN
orw
ayIc
elan
d
≥16 years ≥65 years
(1) Low reliability.
Source: Eurostat (EU SILC ad-hoc module 2017)
In 2017, the highest share of older people eating fresh vegetables on a daily basis was reported in Belgium (87.7 %), while more than four fifths of older people in Ireland, Luxembourg, Italy, France and Portugal also ate vegetables on a daily basis. By contrast, in Hungary, Lithuania, Bulgaria, Romania, Latvia, Czechia and Slovakia less than half of all older people ate fresh vegetables every day; the lowest share was recorded in Hungary (34.1 %).
There was generally a lower degree of variation between the generations concerning the share of people eating vegetables on a daily basis. Indeed, the EU Member States were split almost equally with 14 Member States reporting a higher share of older people (than the whole adult population) consuming vegetables on a daily basis in 2017. Relative to the whole adult population, a high share of older people in France, Luxembourg and the Netherlands consumed vegetables every day. By contrast, in Lithuania and Bulgaria a relatively small share of older people (compared with the whole adult population) ate vegetables daily.
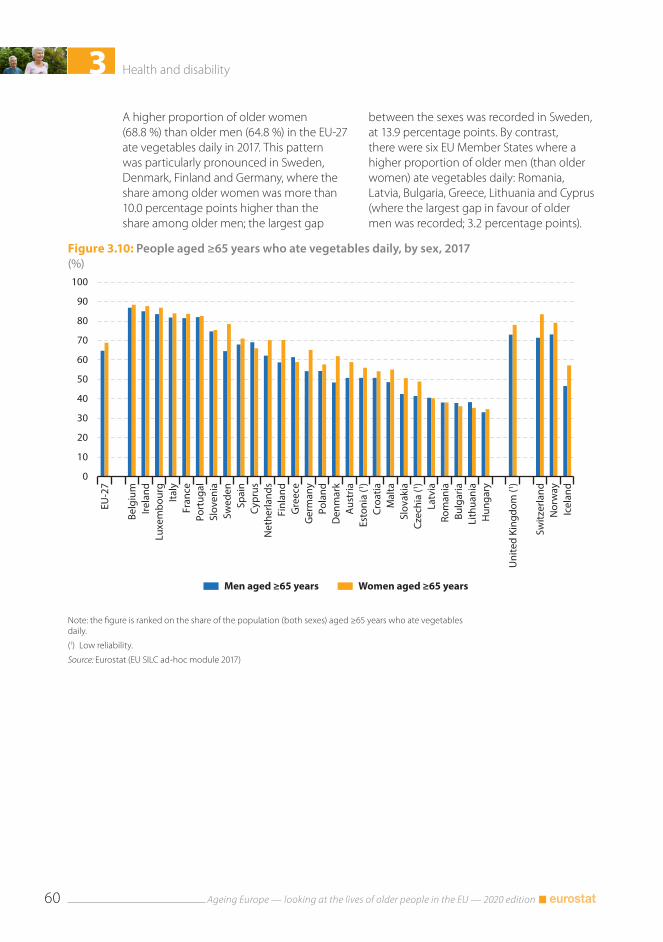
3 Health and disability
Ageing Europe — looking at the lives of older people in the EU — 2020 edition60
Figure 3.10: People aged ≥65 years who ate vegetables daily, by sex, 2017(%)
0
10
20
30
40
50
60
70
80
90
100
EU-2
7
Belg
ium
Irela
ndLu
xem
bour
gIta
lyFr
ance
Port
ugal
Slov
enia
Swed
enSp
ain
Cypr
usN
ethe
rland
sFi
nlan
dG
reec
eG
erm
any
Pola
ndD
enm
ark
Aus
tria
Esto
nia
(1 )Cr
oatia
Mal
taSl
ovak
iaCz
echi
a (1 )
Latv
iaRo
man
iaBu
lgar
iaLi
thua
nia
Hun
gary
Uni
ted
King
dom
(1 )
Switz
erla
ndN
orw
ayIc
elan
d
Men aged ≥65 years Women aged ≥65 years
Note: the figure is ranked on the share of the population (both sexes) aged ≥65 years who ate vegetables daily.
(1) Low reliability.
Source: Eurostat (EU SILC ad-hoc module 2017)
A higher proportion of older women (68.8 %) than older men (64.8 %) in the EU-27 ate vegetables daily in 2017. This pattern was particularly pronounced in Sweden, Denmark, Finland and Germany, where the share among older women was more than 10.0 percentage points higher than the share among older men; the largest gap
between the sexes was recorded in Sweden, at 13.9 percentage points. By contrast, there were six EU Member States where a higher proportion of older men (than older women) ate vegetables daily: Romania, Latvia, Bulgaria, Greece, Lithuania and Cyprus (where the largest gap in favour of older men was recorded; 3.2 percentage points).
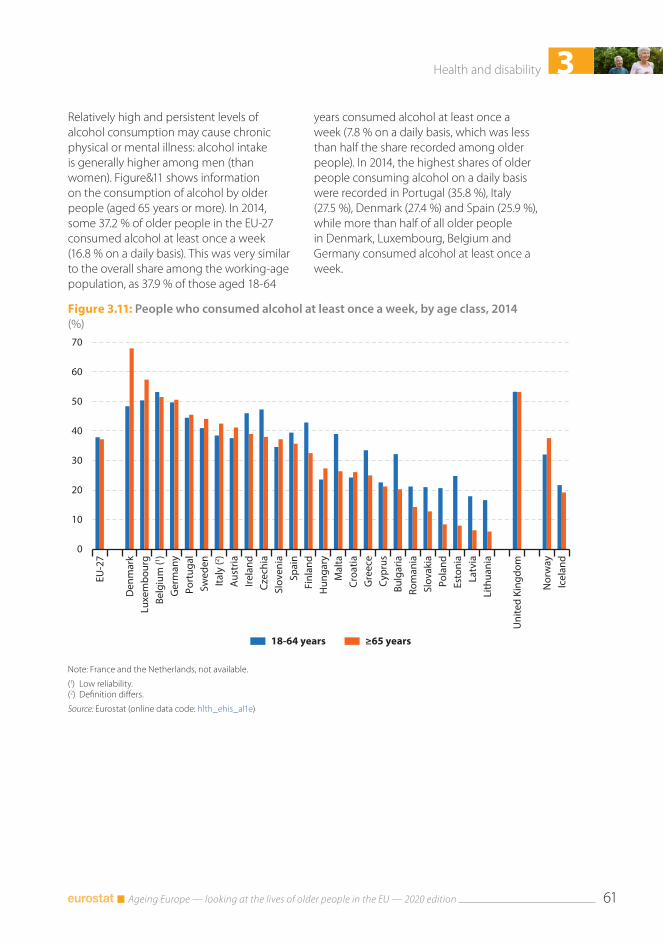
3Health and disability
Ageing Europe — looking at the lives of older people in the EU — 2020 edition 61
Figure 3.11: People who consumed alcohol at least once a week, by age class, 2014(%)
0
10
20
30
40
50
60
70
EU-2
7
Den
mar
kLu
xem
bour
gBe
lgiu
m (1 )
Ger
man
yPo
rtug
alSw
eden
Italy
(2 )A
ustr
iaIre
land
Czec
hia
Slov
enia
Spai
nFi
nlan
dH
unga
ryM
alta
Croa
tiaG
reec
eCy
prus
Bulg
aria
Rom
ania
Slov
akia
Pola
ndEs
toni
aLa
tvia
Lith
uani
a
Uni
ted
King
dom
Nor
way
Icel
and
18-64 years ≥65 years
Note: France and the Netherlands, not available.
(1) Low reliability.(2) Definition differs.
Source: Eurostat (online data code: hlth_ehis_al1e)
Relatively high and persistent levels of alcohol consumption may cause chronic physical or mental illness: alcohol intake is generally higher among men (than women). Figure&11 shows information on the consumption of alcohol by older people (aged 65 years or more). In 2014, some 37.2 % of older people in the EU-27 consumed alcohol at least once a week (16.8 % on a daily basis). This was very similar to the overall share among the working-age population, as 37.9 % of those aged 18-64
years consumed alcohol at least once a week (7.8 % on a daily basis, which was less than half the share recorded among older people). In 2014, the highest shares of older people consuming alcohol on a daily basis were recorded in Portugal (35.8 %), Italy (27.5 %), Denmark (27.4 %) and Spain (25.9 %), while more than half of all older people in Denmark, Luxembourg, Belgium and Germany consumed alcohol at least once a week.
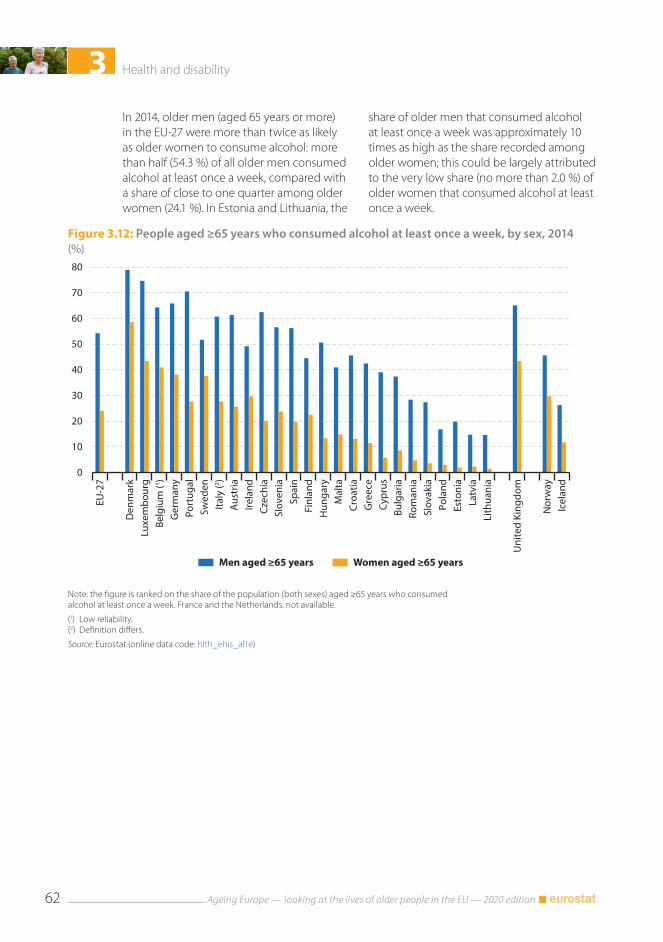
3 Health and disability
Ageing Europe — looking at the lives of older people in the EU — 2020 edition62
Figure 3.12: People aged ≥65 years who consumed alcohol at least once a week, by sex, 2014(%)
0
10
20
30
40
50
60
70
80
EU-2
7
Den
mar
kLu
xem
bour
gBe
lgiu
m (1 )
Ger
man
yPo
rtug
alSw
eden
Italy
(2 )A
ustr
iaIre
land
Czec
hia
Slov
enia
Spai
nFi
nlan
dH
unga
ryM
alta
Croa
tiaG
reec
eCy
prus
Bulg
aria
Rom
ania
Slov
akia
Pola
ndEs
toni
aLa
tvia
Lith
uani
a
Uni
ted
King
dom
Nor
way
Icel
and
Men aged ≥65 years Women aged ≥65 years
Note: the figure is ranked on the share of the population (both sexes) aged ≥65 years who consumed alcohol at least once a week. France and the Netherlands: not available.
(1) Low reliability.(2) Definition differs.
Source: Eurostat (online data code: hlth_ehis_al1e)
In 2014, older men (aged 65 years or more) in the EU-27 were more than twice as likely as older women to consume alcohol: more than half (54.3 %) of all older men consumed alcohol at least once a week, compared with a share of close to one quarter among older women (24.1 %). In Estonia and Lithuania, the
share of older men that consumed alcohol at least once a week was approximately 10 times as high as the share recorded among older women; this could be largely attributed to the very low share (no more than 2.0 %) of older women that consumed alcohol at least once a week.
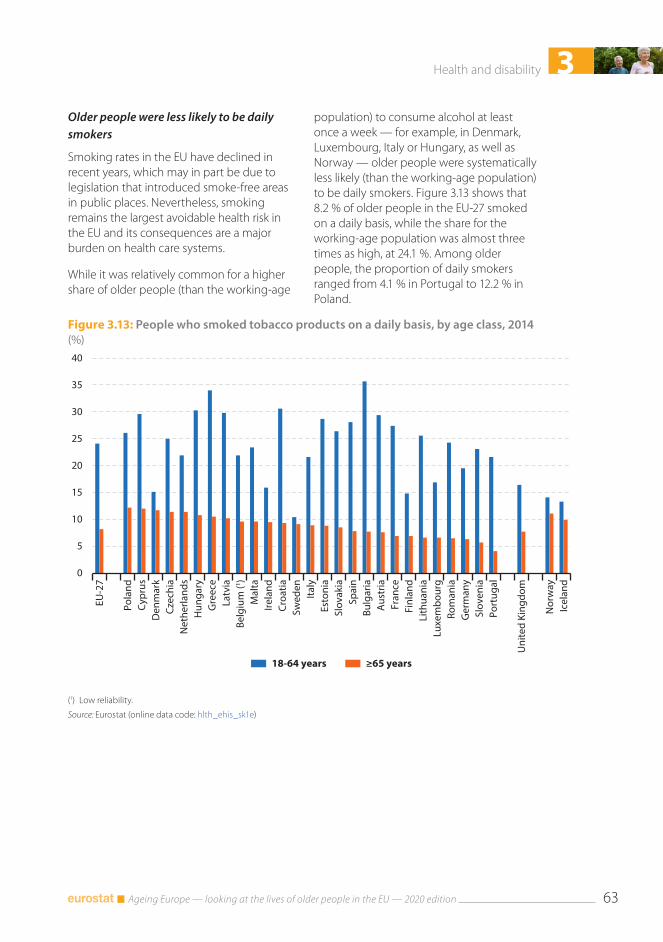
3Health and disability
Ageing Europe — looking at the lives of older people in the EU — 2020 edition 63
Figure 3.13: People who smoked tobacco products on a daily basis, by age class, 2014(%)
0
5
10
15
20
25
30
35
40
EU-2
7
Pola
ndCy
prus
Den
mar
kCz
echi
aN
ethe
rland
sH
unga
ryG
reec
eLa
tvia
Belg
ium
(1 )M
alta
Irela
ndCr
oatia
Swed
enIta
lyEs
toni
aSl
ovak
iaSp
ain
Bulg
aria
Aus
tria
Fran
ceFi
nlan
dLi
thua
nia
Luxe
mbo
urg
Rom
ania
Ger
man
ySl
oven
iaPo
rtug
al
Uni
ted
King
dom
Nor
way
Icel
and
18-64 years ≥65 years
(1) Low reliability.
Source: Eurostat (online data code: hlth_ehis_sk1e)
Older people were less likely to be daily smokers
Smoking rates in the EU have declined in recent years, which may in part be due to legislation that introduced smoke-free areas in public places. Nevertheless, smoking remains the largest avoidable health risk in the EU and its consequences are a major burden on health care systems.
While it was relatively common for a higher share of older people (than the working-age
population) to consume alcohol at least once a week — for example, in Denmark, Luxembourg, Italy or Hungary, as well as Norway — older people were systematically less likely (than the working-age population) to be daily smokers. Figure 3.13 shows that 8.2 % of older people in the EU-27 smoked on a daily basis, while the share for the working-age population was almost three times as high, at 24.1 %. Among older people, the proportion of daily smokers ranged from 4.1 % in Portugal to 12.2 % in Poland.
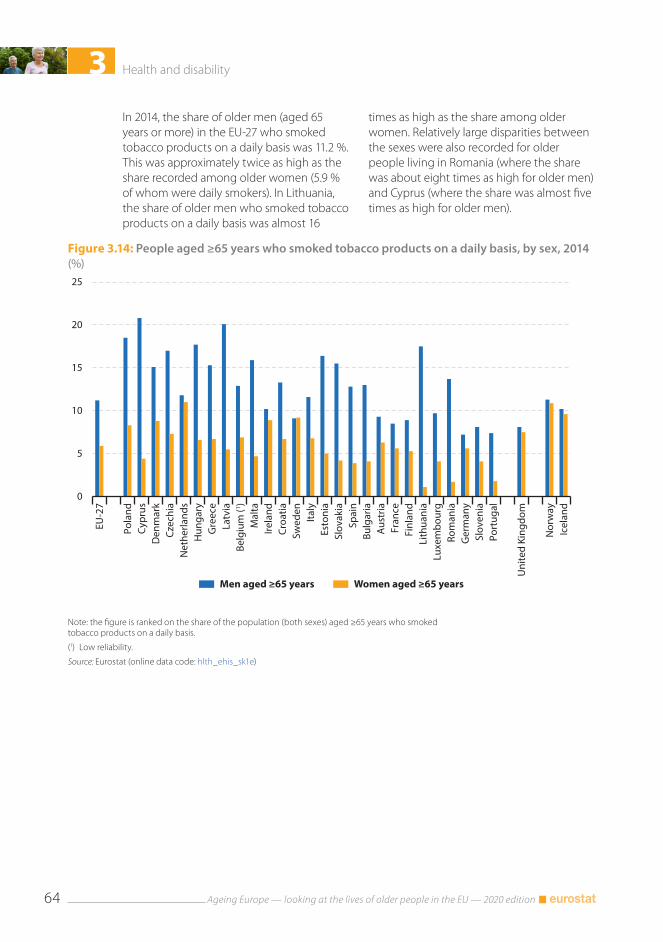
3 Health and disability
Ageing Europe — looking at the lives of older people in the EU — 2020 edition64
Figure 3.14: People aged ≥65 years who smoked tobacco products on a daily basis, by sex, 2014(%)
0
5
10
15
20
25
EU-2
7
Pola
ndCy
prus
Den
mar
kCz
echi
aN
ethe
rland
sH
unga
ryG
reec
eLa
tvia
Belg
ium
(1 )M
alta
Irela
ndCr
oatia
Swed
enIta
lyEs
toni
aSl
ovak
iaSp
ain
Bulg
aria
Aus
tria
Fran
ceFi
nlan
dLi
thua
nia
Luxe
mbo
urg
Rom
ania
Ger
man
ySl
oven
iaPo
rtug
al
Uni
ted
King
dom
Nor
way
Icel
and
Men aged ≥65 years Women aged ≥65 years
Note: the figure is ranked on the share of the population (both sexes) aged ≥65 years who smoked tobacco products on a daily basis.
(1) Low reliability.
Source: Eurostat (online data code: hlth_ehis_sk1e)
In 2014, the share of older men (aged 65 years or more) in the EU-27 who smoked tobacco products on a daily basis was 11.2 %. This was approximately twice as high as the share recorded among older women (5.9 % of whom were daily smokers). In Lithuania, the share of older men who smoked tobacco products on a daily basis was almost 16
times as high as the share among older women. Relatively large disparities between the sexes were also recorded for older people living in Romania (where the share was about eight times as high for older men) and Cyprus (where the share was almost five times as high for older men).
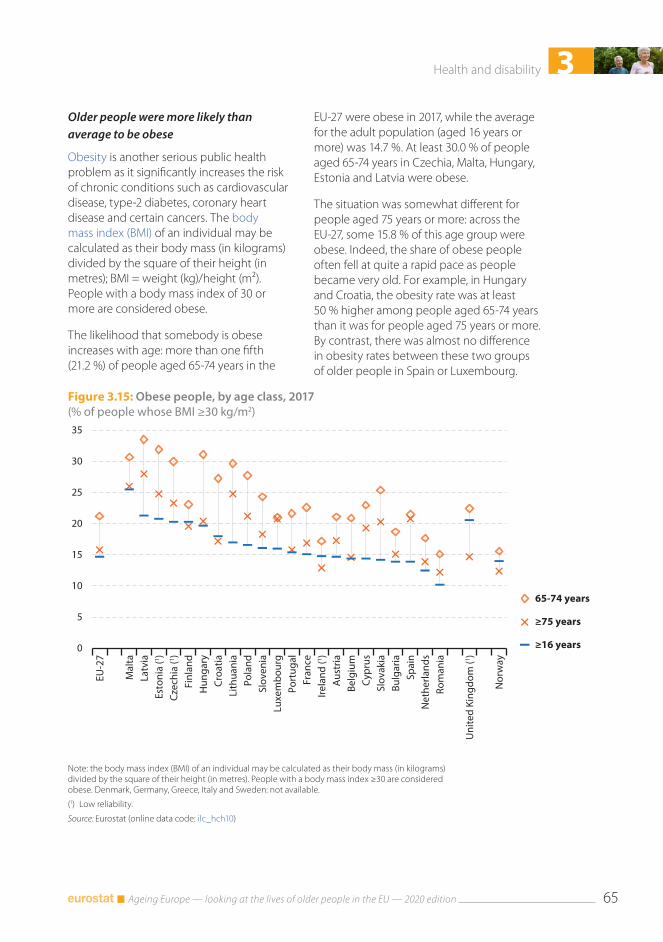
3Health and disability
Ageing Europe — looking at the lives of older people in the EU — 2020 edition 65
Figure 3.15: Obese people, by age class, 2017(% of people whose BMI ≥30 kg/m2)
0
5
10
15
20
25
30
35
EU-2
7
Mal
taLa
tvia
Esto
nia
(1 )Cz
echi
a (1 )
Finl
and
Hun
gary
Croa
tiaLi
thua
nia
Pola
ndSl
oven
iaLu
xem
bour
gPo
rtug
alFr
ance
Irela
nd (1 )
Aus
tria
Belg
ium
Cypr
usSl
ovak
iaBu
lgar
iaSp
ain
Net
herla
nds
Rom
ania
Uni
ted
King
dom
(1 )
Nor
way
65-74 years
≥75 years
≥16 years
Note: the body mass index (BMI) of an individual may be calculated as their body mass (in kilograms) divided by the square of their height (in metres). People with a body mass index ≥30 are considered obese. Denmark, Germany, Greece, Italy and Sweden: not available.
(1) Low reliability.
Source: Eurostat (online data code: ilc_hch10)
Older people were more likely than average to be obese
Obesity is another serious public health problem as it significantly increases the risk of chronic conditions such as cardiovascular disease, type-2 diabetes, coronary heart disease and certain cancers. The body mass index (BMI) of an individual may be calculated as their body mass (in kilograms) divided by the square of their height (in metres); BMI = weight (kg)/height (m²). People with a body mass index of 30 or more are considered obese.
The likelihood that somebody is obese increases with age: more than one fifth (21.2 %) of people aged 65-74 years in the
EU-27 were obese in 2017, while the average for the adult population (aged 16 years or more) was 14.7 %. At least 30.0 % of people aged 65-74 years in Czechia, Malta, Hungary, Estonia and Latvia were obese.
The situation was somewhat different for people aged 75 years or more: across the EU-27, some 15.8 % of this age group were obese. Indeed, the share of obese people often fell at quite a rapid pace as people became very old. For example, in Hungary and Croatia, the obesity rate was at least 50 % higher among people aged 65-74 years than it was for people aged 75 years or more. By contrast, there was almost no difference in obesity rates between these two groups of older people in Spain or Luxembourg.
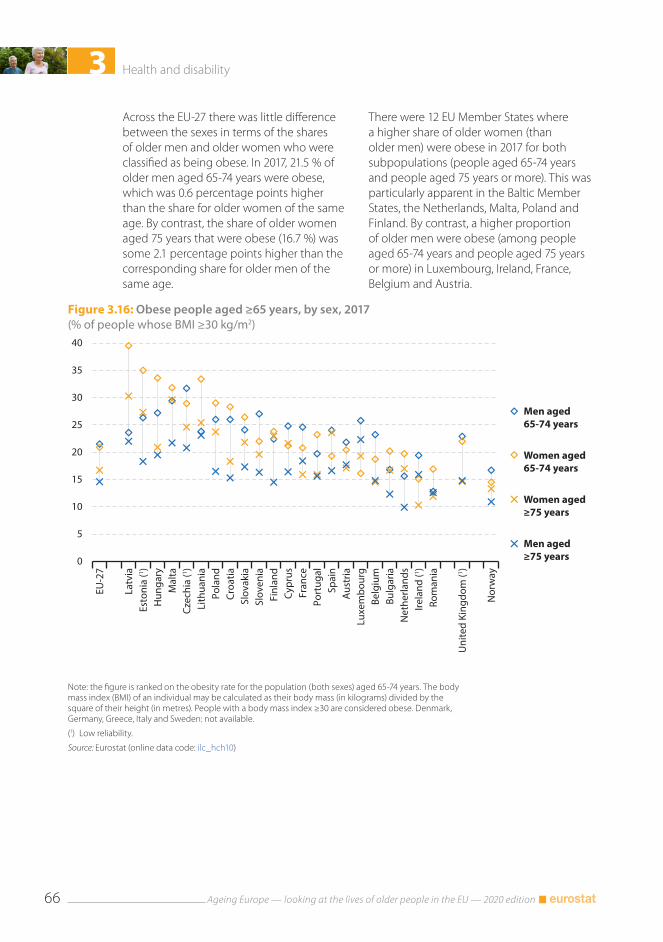
3 Health and disability
Ageing Europe — looking at the lives of older people in the EU — 2020 edition66
Figure 3.16: Obese people aged ≥65 years, by sex, 2017(% of people whose BMI ≥30 kg/m2)
0
5
10
15
20
25
30
35
40
EU-2
7
Latv
iaEs
toni
a (1 )
Hun
gary
Mal
taCz
echi
a (1 )
Lith
uani
aPo
land
Croa
tiaSl
ovak
iaSl
oven
iaFi
nlan
dCy
prus
Fran
cePo
rtug
alSp
ain
Aus
tria
Luxe
mbo
urg
Belg
ium
Bulg
aria
Net
herla
nds
Irela
nd (1 )
Rom
ania
Uni
ted
King
dom
(1 )
Nor
way
Men aged65-74 years
Women aged65-74 years
Women aged≥75 years
Men aged≥75 years
Note: the figure is ranked on the obesity rate for the population (both sexes) aged 65-74 years. The body mass index (BMI) of an individual may be calculated as their body mass (in kilograms) divided by the square of their height (in metres). People with a body mass index ≥30 are considered obese. Denmark, Germany, Greece, Italy and Sweden: not available.
(1) Low reliability.
Source: Eurostat (online data code: ilc_hch10)
Across the EU-27 there was little difference between the sexes in terms of the shares of older men and older women who were classified as being obese. In 2017, 21.5 % of older men aged 65-74 years were obese, which was 0.6 percentage points higher than the share for older women of the same age. By contrast, the share of older women aged 75 years that were obese (16.7 %) was some 2.1 percentage points higher than the corresponding share for older men of the same age.
There were 12 EU Member States where a higher share of older women (than older men) were obese in 2017 for both subpopulations (people aged 65-74 years and people aged 75 years or more). This was particularly apparent in the Baltic Member States, the Netherlands, Malta, Poland and Finland. By contrast, a higher proportion of older men were obese (among people aged 65-74 years and people aged 75 years or more) in Luxembourg, Ireland, France, Belgium and Austria.
3Health and disability
Ageing Europe — looking at the lives of older people in the EU — 2020 edition 67
Health limitations among older peopleHealth is a crucial measure of an individual’s well-being: it is intrinsically tied to aspects of personal independence. The share of the adult population that struggles with daily life — basic activities like eating, bathing and dressing — rises with age. One of the principal reasons behind this pattern is the relatively high share of older people who suffer from physical and sensory functional limitations, impacting on their vision, hearing, mobility, communication or ability to remember (see Figure 3.17).
Almost one third of people aged 75 years or more had severe difficulties in walking
In 2014, the share of people aged 65-74 years in the EU-27 who had severe difficulty in seeing was only marginally higher, at 3.2 %, than the average for the whole of the adult population (defined here as people aged 15 years or more; 2.2 %). A much higher proportion (9.3 %) of people aged 75 years or more in the EU-27 had severe difficulty in seeing, with this share rising above 12.5 % in Portugal, Croatia, Latvia, Cyprus and Poland.
Similar information for people who reported severe difficulties in hearing reveals that the share of the EU-27 adult population with this sensory functional limitation was 4.2 % in 2014, with higher shares among people aged 65-74 years (7.0 %) and people aged 75 years or more (19.1 %). The share of this latter age group who reported severe difficulties in hearing was at least 25.0 % in Cyprus, Estonia, France, Slovenia and Romania.
Regular (preferably daily) exercise may help prevent elderly mobility issues. Figure 3.17 shows that in 2014 almost one third (32.3 %) of people aged 75 years or more in the EU-27
reported severe difficulties in walking, while close to one tenth (10.5 %) of people aged 65-74 years faced this limitation. There were 10 EU Member States where the share of people aged 75 years or more who faced difficulties in walking was within the range of 40.0-50.0 %; the highest shares were in Croatia, Bulgaria and Hungary.
Around one quarter of all older women had severe difficulties in walking
Figure 3.18 extends the findings of self-reported severe physical and sensory functional limitations by looking at gender differences. In 2014, the share of older women (aged 65 years or more) in the EU-27 who had severe difficulty in seeing was 7.3 %, which was considerably higher than the corresponding share for older men (4.4 %). There was almost no difference in the shares of older men and older women that had severe difficulty in hearing (12.8 % and 12.7 %). However, the most striking difference between the sexes was in terms of the share of older people who had severe difficulty in walking. One quarter (25.0 %) of all older women in the EU-27 reported severe difficulty in walking, while the share for older men was much lower at 15.3 %. This pattern — a higher share of older women reporting severe difficulty in walking — was repeated in each of the EU Member States and was particularly notable in Cyprus (where the difference between the sexes was 19.9 percentage points), Portugal (16.1 percentage points) and Slovenia (15.3 percentage points). More than one third of all older women in Greece, Cyprus, Croatia and Hungary reported severe difficulty in walking, with a peak of 38.7 % in Hungary. The highest shares of older men reporting severe difficulty in walking were recorded in Hungary (25.6 %), Bulgaria (26.8 %) and Croatia (26.9 %).
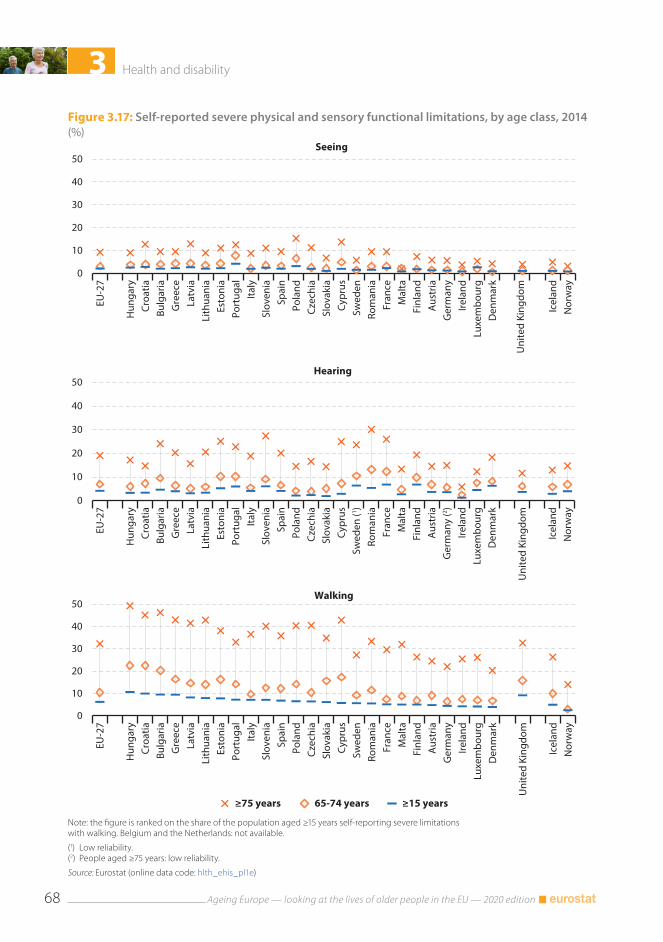
3 Health and disability
Ageing Europe — looking at the lives of older people in the EU — 2020 edition68
Figure 3.17: Self-reported severe physical and sensory functional limitations, by age class, 2014(%)
0
10
20
30
40
50
EU-2
7
Hun
gary
Croa
tiaBu
lgar
iaG
reec
eLa
tvia
Lith
uani
aEs
toni
aPo
rtug
alIta
lySl
oven
iaSp
ain
Pola
ndCz
echi
aSl
ovak
iaCy
prus
Swed
enRo
man
iaFr
ance
Mal
taFi
nlan
dA
ustr
iaG
erm
any
Irela
ndLu
xem
bour
gD
enm
ark
Uni
ted
King
dom
Icel
and
Nor
way
Seeing
0
10
20
30
40
50
EU-2
7
Hun
gary
Croa
tiaBu
lgar
iaG
reec
eLa
tvia
Lith
uani
aEs
toni
aPo
rtug
alIta
lySl
oven
iaSp
ain
Pola
ndCz
echi
aSl
ovak
iaCy
prus
Swed
en (1 )
Rom
ania
Fran
ceM
alta
Finl
and
Aus
tria
Ger
man
y (2 )
Irela
ndLu
xem
bour
gD
enm
ark
Uni
ted
King
dom
Icel
and
Nor
way
Hearing
0
10
20
30
40
50
EU-2
7
Hun
gary
Croa
tiaBu
lgar
iaG
reec
eLa
tvia
Lith
uani
aEs
toni
aPo
rtug
alIta
lySl
oven
iaSp
ain
Pola
ndCz
echi
aSl
ovak
iaCy
prus
Swed
enRo
man
iaFr
ance
Mal
taFi
nlan
dA
ustr
iaG
erm
any
Irela
ndLu
xem
bour
gD
enm
ark
Uni
ted
King
dom
Icel
and
Nor
way
≥75 years 65-74 years ≥15 years
Walking
Note: the figure is ranked on the share of the population aged ≥15 years self-reporting severe limitations with walking. Belgium and the Netherlands: not available.
(1) Low reliability.(2) People aged ≥75 years: low reliability.
Source: Eurostat (online data code: hlth_ehis_pl1e)
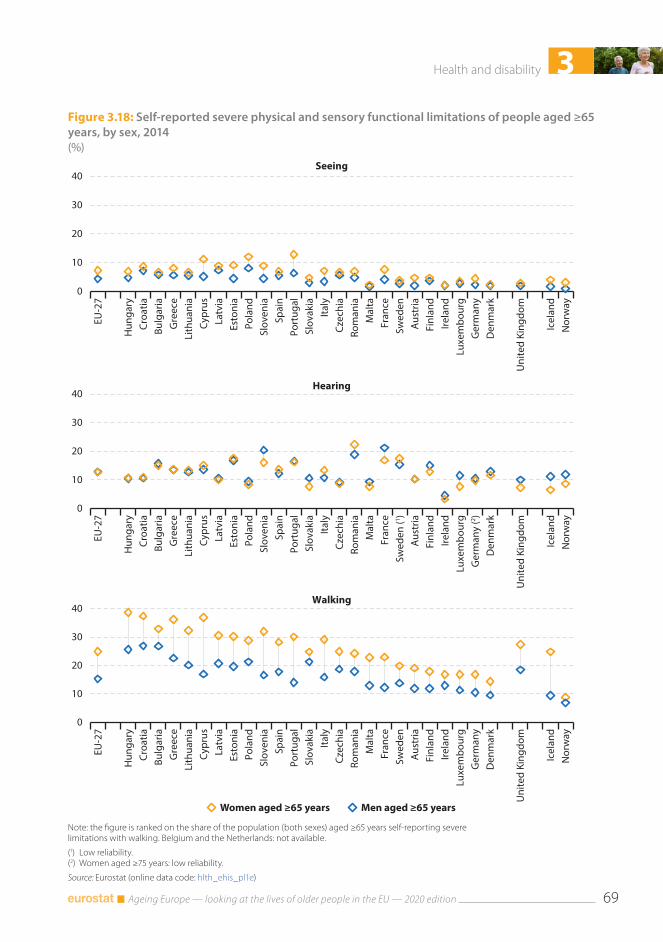
3Health and disability
Ageing Europe — looking at the lives of older people in the EU — 2020 edition 69
Figure 3.18: Self-reported severe physical and sensory functional limitations of people aged ≥65 years, by sex, 2014(%)
0
10
20
30
40
EU-2
7
Hun
gary
Croa
tiaBu
lgar
iaG
reec
eLi
thua
nia
Cypr
usLa
tvia
Esto
nia
Pola
ndSl
oven
iaSp
ain
Port
ugal
Slov
akia
Italy
Czec
hia
Rom
ania
Mal
taFr
ance
Swed
enA
ustr
iaFi
nlan
dIre
land
Luxe
mbo
urg
Ger
man
yD
enm
ark
Uni
ted
King
dom
Icel
and
Nor
way
Seeing
0
10
20
30
40
EU-2
7
Hun
gary
Croa
tiaBu
lgar
iaG
reec
eLi
thua
nia
Cypr
usLa
tvia
Esto
nia
Pola
ndSl
oven
iaSp
ain
Port
ugal
Slov
akia
Italy
Czec
hia
Rom
ania
Mal
taFr
ance
Swed
en (1 )
Aus
tria
Finl
and
Irela
ndLu
xem
bour
gG
erm
any
(2 )D
enm
ark
Uni
ted
King
dom
Icel
and
Nor
way
Hearing
0
10
20
30
40
EU-2
7
Hun
gary
Croa
tiaBu
lgar
iaG
reec
eLi
thua
nia
Cypr
usLa
tvia
Esto
nia
Pola
ndSl
oven
iaSp
ain
Port
ugal
Slov
akia
Italy
Czec
hia
Rom
ania
Mal
taFr
ance
Swed
enA
ustr
iaFi
nlan
dIre
land
Luxe
mbo
urg
Ger
man
yD
enm
ark
Uni
ted
King
dom
Icel
and
Nor
way
Women aged ≥65 years Men aged ≥65 years
Walking
Note: the figure is ranked on the share of the population (both sexes) aged ≥65 years self-reporting severe limitations with walking. Belgium and the Netherlands: not available.
(1) Low reliability.(2) Women aged ≥75 years: low reliability.
Source: Eurostat (online data code: hlth_ehis_pl1e)
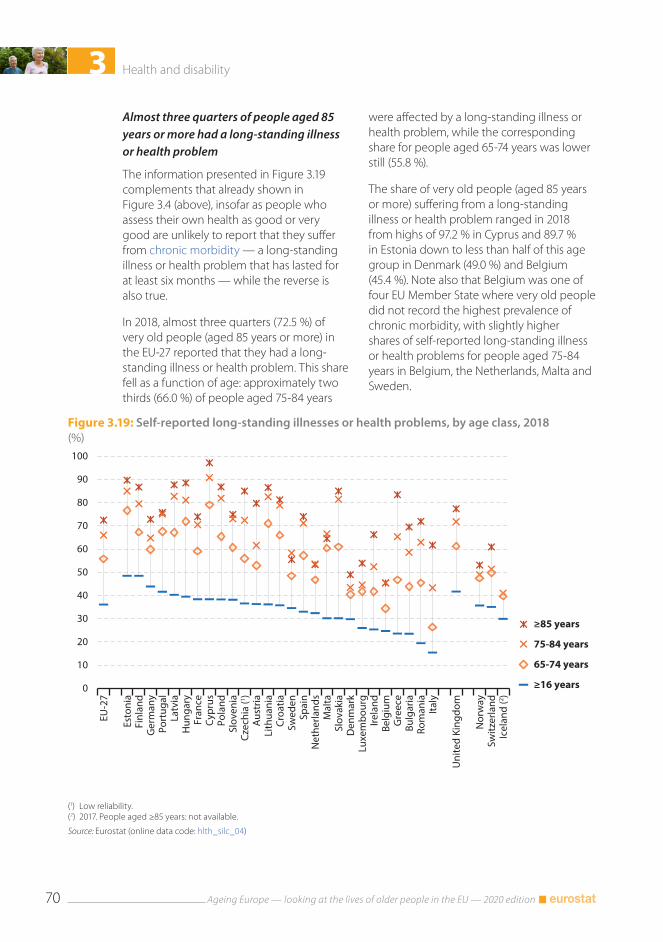
3 Health and disability
Ageing Europe — looking at the lives of older people in the EU — 2020 edition70
Figure 3.19: Self-reported long-standing illnesses or health problems, by age class, 2018(%)
0
10
20
30
40
50
60
70
80
90
100
EU-2
7
Esto
nia
Finl
and
Ger
man
yPo
rtug
alLa
tvia
Hun
gary
Fran
ceCy
prus
Pola
ndSl
oven
iaCz
echi
a (1 )
Aus
tria
Lith
uani
aCr
oatia
Swed
enSp
ain
Net
herla
nds
Mal
taSl
ovak
iaD
enm
ark
Luxe
mbo
urg
Irela
ndBe
lgiu
mG
reec
eBu
lgar
iaRo
man
iaIta
ly
Uni
ted
King
dom
Nor
way
Switz
erla
ndIc
elan
d (2 )
≥85 years
75-84 years
65-74 years
≥16 years
(1) Low reliability.(2) 2017. People aged ≥85 years: not available.
Source: Eurostat (online data code: hlth_silc_04)
Almost three quarters of people aged 85 years or more had a long-standing illness or health problem
The information presented in Figure 3.19 complements that already shown in Figure 3.4 (above), insofar as people who assess their own health as good or very good are unlikely to report that they suffer from chronic morbidity — a long-standing illness or health problem that has lasted for at least six months — while the reverse is also true.
In 2018, almost three quarters (72.5 %) of very old people (aged 85 years or more) in the EU-27 reported that they had a long-standing illness or health problem. This share fell as a function of age: approximately two thirds (66.0 %) of people aged 75-84 years
were affected by a long-standing illness or health problem, while the corresponding share for people aged 65-74 years was lower still (55.8 %).
The share of very old people (aged 85 years or more) suffering from a long-standing illness or health problem ranged in 2018 from highs of 97.2 % in Cyprus and 89.7 % in Estonia down to less than half of this age group in Denmark (49.0 %) and Belgium (45.4 %). Note also that Belgium was one of four EU Member State where very old people did not record the highest prevalence of chronic morbidity, with slightly higher shares of self-reported long-standing illness or health problems for people aged 75-84 years in Belgium, the Netherlands, Malta and Sweden.
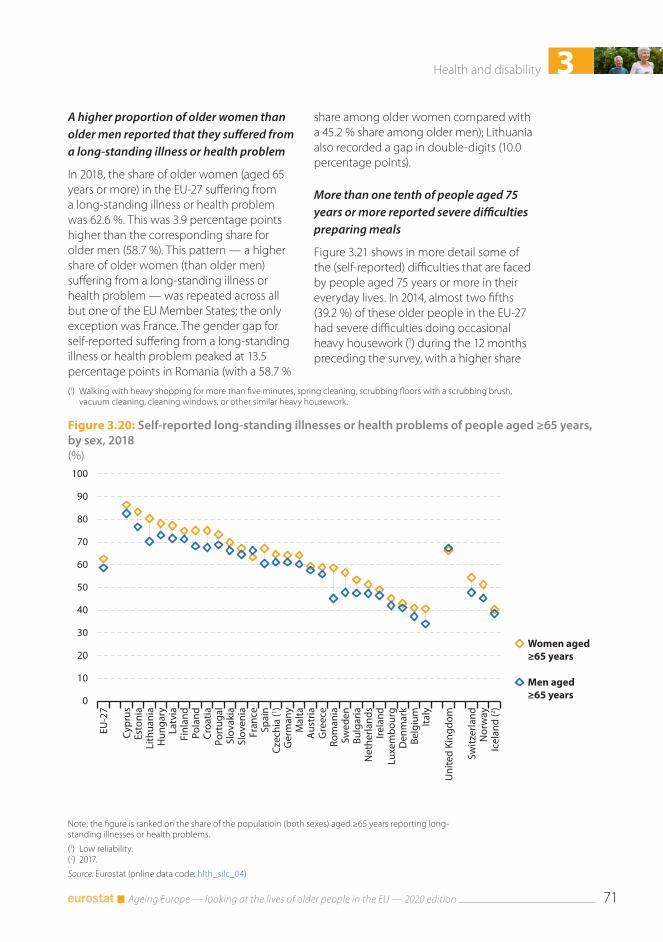
3Health and disability
Ageing Europe — looking at the lives of older people in the EU — 2020 edition 71
Figure 3.20: Self-reported long-standing illnesses or health problems of people aged ≥65 years, by sex, 2018(%)
0
10
20
30
40
50
60
70
80
90
100
EU-2
7
Cypr
usEs
toni
aLi
thua
nia
Hun
gary
Latv
iaFi
nlan
dPo
land
Croa
tiaPo
rtug
alSl
ovak
iaSl
oven
iaFr
ance
Spai
nCz
echi
a (1 )
Ger
man
yM
alta
Aus
tria
Gre
ece
Rom
ania
Swed
enBu
lgar
iaN
ethe
rland
sIre
land
Luxe
mbo
urg
Den
mar
kBe
lgiu
mIta
ly
Uni
ted
King
dom
Switz
erla
ndN
orw
ayIc
elan
d (2 )
Women aged≥65 years
Men aged≥65 years
Note: the figure is ranked on the share of the populatioin (both sexes) aged ≥65 years reporting long-standing illnesses or health problems.
(1) Low reliability.(2) 2017.
Source: Eurostat (online data code: hlth_silc_04)
A higher proportion of older women than older men reported that they suffered from a long-standing illness or health problem
In 2018, the share of older women (aged 65 years or more) in the EU-27 suffering from a long-standing illness or health problem was 62.6 %. This was 3.9 percentage points higher than the corresponding share for older men (58.7 %). This pattern — a higher share of older women (than older men) suffering from a long-standing illness or health problem — was repeated across all but one of the EU Member States; the only exception was France. The gender gap for self-reported suffering from a long-standing illness or health problem peaked at 13.5 percentage points in Romania (with a 58.7 %
(1) Walking with heavy shopping for more than five minutes, spring cleaning, scrubbing floors with a scrubbing brush, vacuum cleaning, cleaning windows, or other similar heavy housework.
share among older women compared with a 45.2 % share among older men); Lithuania also recorded a gap in double-digits (10.0 percentage points).
More than one tenth of people aged 75 years or more reported severe difficulties preparing meals
Figure 3.21 shows in more detail some of the (self-reported) difficulties that are faced by people aged 75 years or more in their everyday lives. In 2014, almost two fifths (39.2 %) of these older people in the EU-27 had severe difficulties doing occasional heavy housework (1) during the 12 months preceding the survey, with a higher share
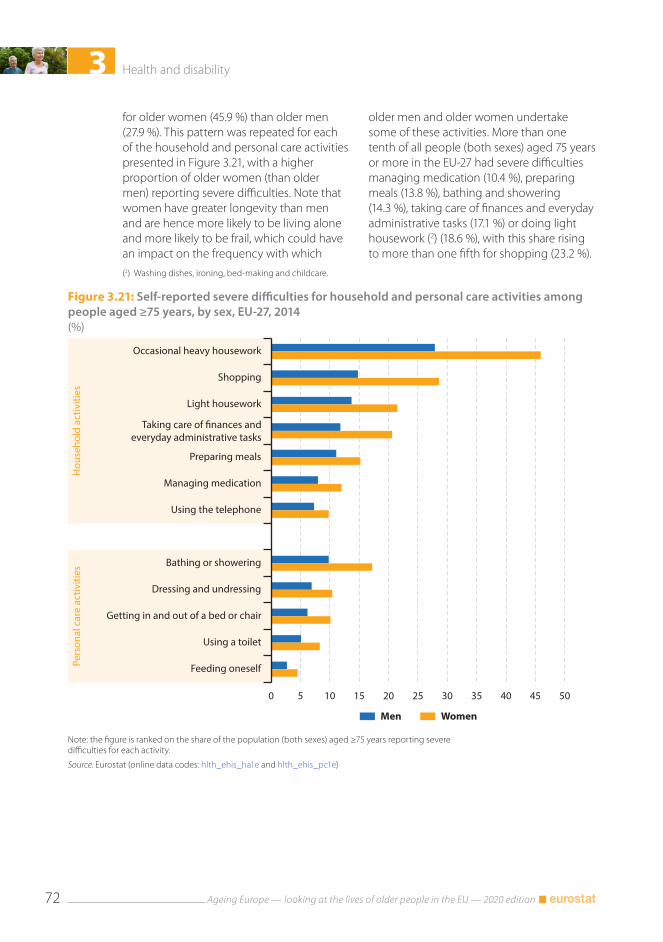
3 Health and disability
Ageing Europe — looking at the lives of older people in the EU — 2020 edition72
Figure 3.21: Self-reported severe difficulties for household and personal care activities among people aged ≥75 years, by sex, EU-27, 2014(%)
0 5 10 15 20 25 30 35 40 45 50
Occasional heavy housework
Shopping
Light housework
Taking care of �nances andeveryday administrative tasks
Preparing meals
Managing medication
Using the telephone
Bathing or showering
Dressing and undressing
Getting in and out of a bed or chair
Using a toilet
Feeding oneself
Hou
seho
ld a
ctiv
ities
Pers
onal
car
e ac
tiviti
es
Men Women
Note: the figure is ranked on the share of the population (both sexes) aged ≥75 years reporting severe difficulties for each activity.
Source: Eurostat (online data codes: hlth_ehis_ha1e and hlth_ehis_pc1e)
for older women (45.9 %) than older men (27.9 %). This pattern was repeated for each of the household and personal care activities presented in Figure 3.21, with a higher proportion of older women (than older men) reporting severe difficulties. Note that women have greater longevity than men and are hence more likely to be living alone and more likely to be frail, which could have an impact on the frequency with which
(2) Washing dishes, ironing, bed-making and childcare.
older men and older women undertake some of these activities. More than one tenth of all people (both sexes) aged 75 years or more in the EU-27 had severe difficulties managing medication (10.4 %), preparing meals (13.8 %), bathing and showering (14.3 %), taking care of finances and everyday administrative tasks (17.1 %) or doing light housework (2) (18.6 %), with this share rising to more than one fifth for shopping (23.2 %).

3Health and disability
Ageing Europe — looking at the lives of older people in the EU — 2020 edition 73
Figure 3.22: Self-reported use of homecare services among people aged ≥75 years, by sex, 2014(%)
0
5
10
15
20
25
30
35
40
45
50
55
EU-2
7
Mal
taN
ethe
rland
sBe
lgiu
mFr
ance
Den
mar
kFi
nlan
dSp
ain
Irela
ndCy
prus
Italy
Czec
hia
Hun
gary
Luxe
mbo
urg
Slov
enia
Pola
ndG
reec
eSl
ovak
iaSw
eden
Ger
man
yPo
rtug
alA
ustr
iaBu
lgar
iaCr
oatia
Latv
iaLi
thua
nia
Rom
ania
Esto
nia
Uni
ted
King
dom
Icel
and
Nor
way
Men aged ≥75 years Women aged ≥75 years
Note: the figure is ranked on the share of the population (both sexes) aged ≥75 years making use of homecare services.
Source: Eurostat (online data code: hlth_ehis_am7e)
One fifth of women aged 75 years or more made use of homecare services
The relatively high proportion of people aged 75 years or more in the EU-27 facing severe difficulties in carrying out a range of everyday tasks suggests that there is considerable demand for the provision of homecare services (3) that can alleviate such issues and make it possible for older people to remain independent for longer (rather than moving into residential, long-term, or institutional-based nursing and care homes); these (professional) services are expected to become increasingly important in the coming years.
In 2014, some 18.1 % of all persons aged 75 years or more in the EU-27 reported that they had made use of homecare services during the 12 months preceding the survey. The share of older women (20.8 %) making use of these services was higher than the corresponding share for older men (13.9 %); this pattern was repeated in all but one of
(3) Includes help with daily tasks such as meal preparations, house-keeping, shopping, medication reminders or transportation.
the EU Member States and was particularly strong in Latvia and Lithuania, where older women were three to four times as likely as older men to make use of homecare services. Luxembourg was the only exception, as a slightly higher share of older men (15.1 %) compared with older women (14.0 %) made use of homecare services. The provision and organisation of homecare services varies considerably between EU Member States and this is reflected in the use of such services: while at least one third of people aged 75 years or more reported using homecare services in France, Belgium, the Netherlands and Malta, this share was less than one tenth in the Baltic Member States, Croatia and Romania.
It is also worth considering that while some older people receive homecare services, others are providers of similar services — for example, looking after other elderly people or looking after grandchildren — more information on this is provided in Chapter 6.
3 Health and disability
Ageing Europe — looking at the lives of older people in the EU — 2020 edition74
Use of doctors, medicines and health services among older people
Older people are more likely to consult both general and surgical practitioners
As people age, it might be expected that they need more frequent visits to consult both general practitioners and surgical practitioners. Figure 3.23 confirms that this is true: in 2017, approximately three quarters (76.4 %) of the EU-27 adult population (defined here as people aged 16 years or more) had consulted a general practitioner during the 12 months preceding the survey. The share was higher for people aged 65-74 years (86.7 %) and peaked among people aged 75 years or more (92.0 %).
In 2017, almost all (97.4 %) people aged 75 years or more in Denmark had consulted a general medical practitioner during the 12 months preceding the survey, while there were seven further EU Member States where this share was at least 95.0 %. By contrast, the lowest consultation rates were recorded in Bulgaria, Finland and Sweden (all below 80.0 %).
While people were generally less likely to have consulted a surgical practitioner (compared with a general practitioner), a similar pattern was observed, insofar as older people (aged 75 years or more) were again more likely than younger generations to have consulted this type of doctor. In 2017, almost three quarters (74.0 %) of people aged 75 years or more in the EU-27 had consulted a surgical practitioner during the
12 months preceding the survey; the highest consultation rate for this age group was recorded in Germany (90.4 %).
The differences between the shares of older men and older women (aged 75 years or more) in the EU-27 who consulted a general or a surgical practitioner were relatively small. In 2017, a slightly higher share of older women (92.3 %) than older men (91.5 %) consulted a general practitioner during the 12 months preceding the survey. The situation was reversed for consulting a surgical practitioner: just over three quarters (75.4 %) of older men consulted this type of doctor in the 12 months preceding the survey, which was 2.4 percentage points higher than the corresponding share recorded among older women (73.0 %).
The share of older women that consulted a general practitioner in Estonia (88.2 %) was considerably higher than for older men (81.7 %); this was the largest gap (6.5 percentage points) between the sexes across the EU Member States. This pattern was repeated for consulting a surgical practitioner, as the share of older women (63.8 %) consulting this type of doctor in Estonia during the 12 months preceding the survey was 5.9 percentage points higher than the share for older men (57.9 %). By contrast, in Slovenia the share of older men (92.5 %) that consulted a general practitioner was 6.0 percentage points higher than the corresponding share for older women (86.5 %), while the share of older men (52.1 %) that consulted a surgical practitioner in Malta was 8.3 percentage points higher than the corresponding share for older women (43.8 %).
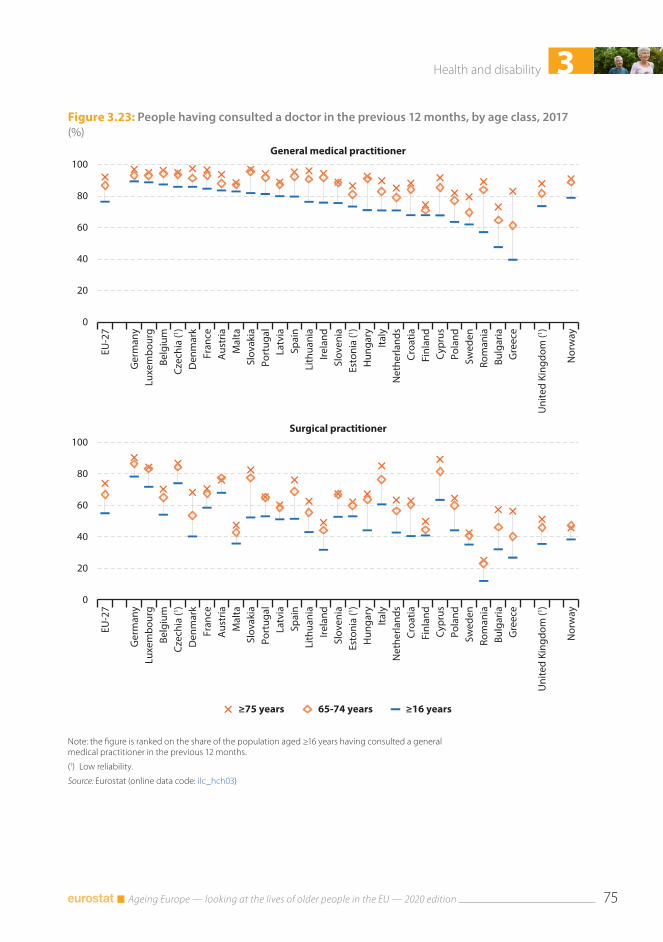
3Health and disability
Ageing Europe — looking at the lives of older people in the EU — 2020 edition 75
Figure 3.23: People having consulted a doctor in the previous 12 months, by age class, 2017(%)
0
20
40
60
80
100
EU-2
7
Ger
man
yLu
xem
bour
gBe
lgiu
mCz
echi
a (1 )
Den
mar
kFr
ance
Aus
tria
Mal
taSl
ovak
iaPo
rtug
alLa
tvia
Spai
nLi
thua
nia
Irela
ndSl
oven
iaEs
toni
a (1 )
Hun
gary
Italy
Net
herla
nds
Croa
tiaFi
nlan
dCy
prus
Pola
ndSw
eden
Rom
ania
Bulg
aria
Gre
ece
Uni
ted
King
dom
(1 )
Nor
way
General medical practitioner
0
20
40
60
80
100
EU-2
7
Ger
man
yLu
xem
bour
gBe
lgiu
mCz
echi
a (1 )
Den
mar
kFr
ance
Aus
tria
Mal
taSl
ovak
iaPo
rtug
alLa
tvia
Spai
nLi
thua
nia
Irela
ndSl
oven
iaEs
toni
a (1 )
Hun
gary
Italy
Net
herla
nds
Croa
tiaFi
nlan
dCy
prus
Pola
ndSw
eden
Rom
ania
Bulg
aria
Gre
ece
Uni
ted
King
dom
(1 )
Nor
way
Surgical practitioner
≥16 years65-74 years≥75 years
Note: the figure is ranked on the share of the population aged ≥16 years having consulted a general medical practitioner in the previous 12 months.
(1) Low reliability.
Source: Eurostat (online data code: ilc_hch03)
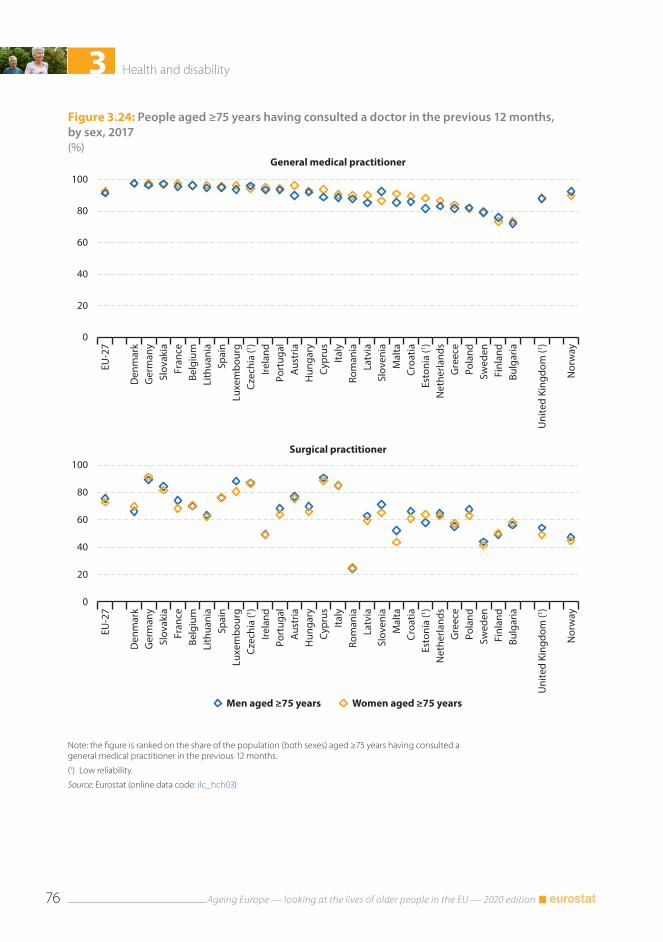
3 Health and disability
Ageing Europe — looking at the lives of older people in the EU — 2020 edition76
Figure 3.24: People aged ≥75 years having consulted a doctor in the previous 12 months, by sex, 2017(%)
0
20
40
60
80
100
EU-2
7
Den
mar
kG
erm
any
Slov
akia
Fran
ceBe
lgiu
mLi
thua
nia
Spai
nLu
xem
bour
gCz
echi
a (1 )
Irela
ndPo
rtug
alA
ustr
iaH
unga
ryCy
prus
Italy
Rom
ania
Latv
iaSl
oven
iaM
alta
Croa
tiaEs
toni
a (1 )
Net
herla
nds
Gre
ece
Pola
ndSw
eden
Finl
and
Bulg
aria
Uni
ted
King
dom
(1 )
Nor
way
General medical practitioner
0
20
40
60
80
100
EU-2
7
Den
mar
kG
erm
any
Slov
akia
Fran
ceBe
lgiu
mLi
thua
nia
Spai
nLu
xem
bour
gCz
echi
a (1 )
Irela
ndPo
rtug
alA
ustr
iaH
unga
ryCy
prus
Italy
Rom
ania
Latv
iaSl
oven
iaM
alta
Croa
tiaEs
toni
a (1 )
Net
herla
nds
Gre
ece
Pola
ndSw
eden
Finl
and
Bulg
aria
Uni
ted
King
dom
(1 )
Nor
way
Men aged ≥75 years Women aged ≥75 years
Surgical practitioner
Note: the figure is ranked on the share of the population (both sexes) aged ≥75 years having consulted a general medical practitioner in the previous 12 months.
(1) Low reliability.
Source: Eurostat (online data code: ilc_hch03)
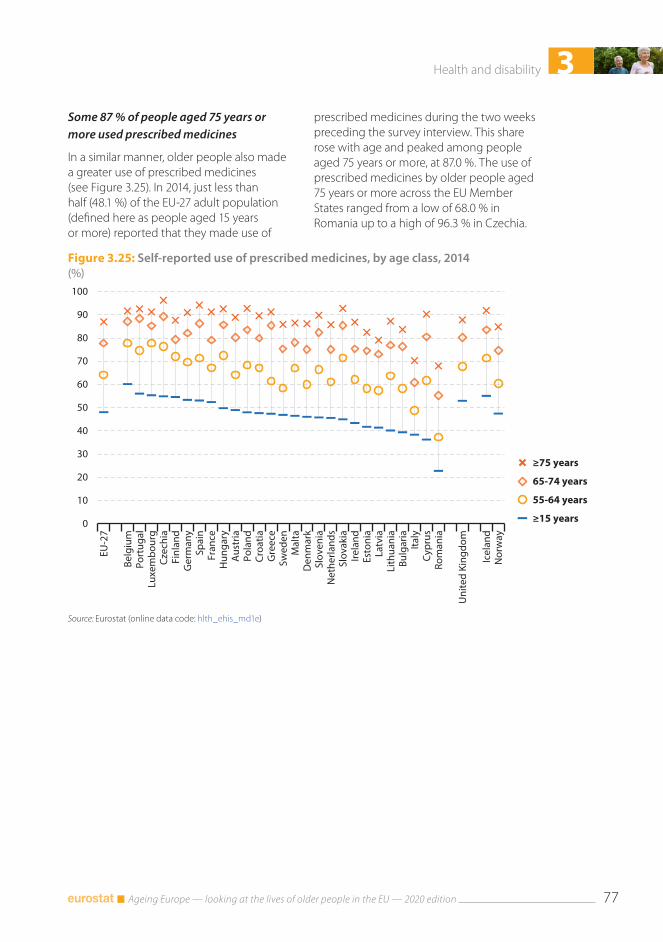
3Health and disability
Ageing Europe — looking at the lives of older people in the EU — 2020 edition 77
Figure 3.25: Self-reported use of prescribed medicines, by age class, 2014(%)
0
10
20
30
40
50
60
70
80
90
100
EU-2
7
Belg
ium
Port
ugal
Luxe
mbo
urg
Czec
hia
Finl
and
Ger
man
ySp
ain
Fran
ceH
unga
ryA
ustr
iaPo
land
Croa
tiaG
reec
eSw
eden
Mal
taD
enm
ark
Slov
enia
Net
herla
nds
Slov
akia
Irela
ndEs
toni
aLa
tvia
Lith
uani
aBu
lgar
iaIta
lyCy
prus
Rom
ania
Uni
ted
King
dom
Icel
and
Nor
way
≥75 years
65-74 years
55-64 years
≥15 years
Source: Eurostat (online data code: hlth_ehis_md1e)
Some 87 % of people aged 75 years or more used prescribed medicines
In a similar manner, older people also made a greater use of prescribed medicines (see Figure 3.25). In 2014, just less than half (48.1 %) of the EU-27 adult population (defined here as people aged 15 years or more) reported that they made use of
prescribed medicines during the two weeks preceding the survey interview. This share rose with age and peaked among people aged 75 years or more, at 87.0 %. The use of prescribed medicines by older people aged 75 years or more across the EU Member States ranged from a low of 68.0 % in Romania up to a high of 96.3 % in Czechia.
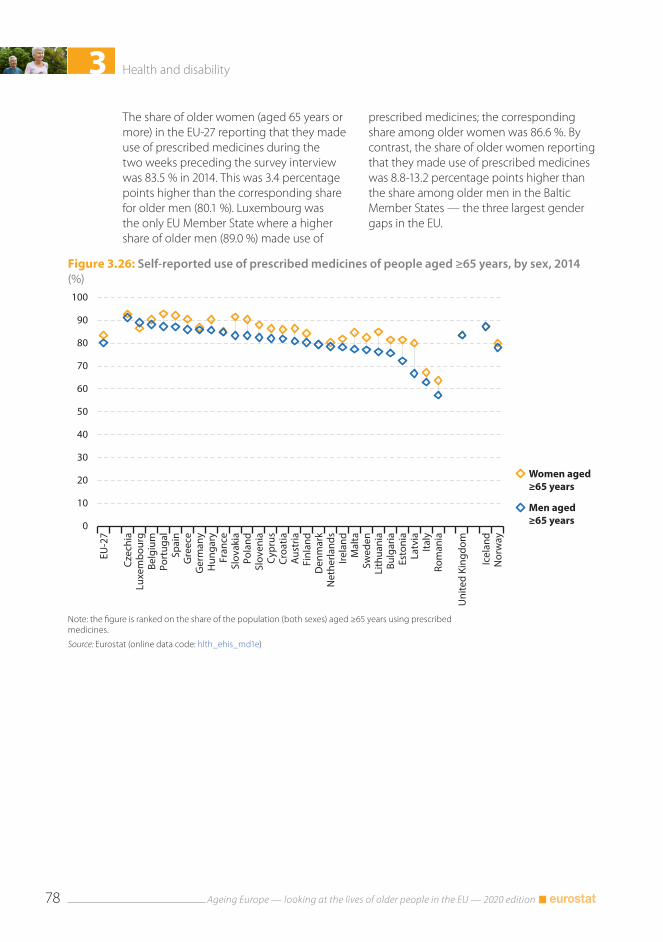
3 Health and disability
Ageing Europe — looking at the lives of older people in the EU — 2020 edition78
Figure 3.26: Self-reported use of prescribed medicines of people aged ≥65 years, by sex, 2014(%)
0
10
20
30
40
50
60
70
80
90
100
EU-2
7
Czec
hia
Luxe
mbo
urg
Belg
ium
Port
ugal
Spai
nG
reec
eG
erm
any
Hun
gary
Fran
ceSl
ovak
iaPo
land
Slov
enia
Cypr
usCr
oatia
Aus
tria
Finl
and
Den
mar
kN
ethe
rland
sIre
land
Mal
taSw
eden
Lith
uani
aBu
lgar
iaEs
toni
aLa
tvia
Italy
Rom
ania
Uni
ted
King
dom
Icel
and
Nor
way
Women aged≥65 years
Men aged≥65 years
Note: the figure is ranked on the share of the population (both sexes) aged ≥65 years using prescribed medicines.
Source: Eurostat (online data code: hlth_ehis_md1e)
The share of older women (aged 65 years or more) in the EU-27 reporting that they made use of prescribed medicines during the two weeks preceding the survey interview was 83.5 % in 2014. This was 3.4 percentage points higher than the corresponding share for older men (80.1 %). Luxembourg was the only EU Member State where a higher share of older men (89.0 %) made use of
prescribed medicines; the corresponding share among older women was 86.6 %. By contrast, the share of older women reporting that they made use of prescribed medicines was 8.8-13.2 percentage points higher than the share among older men in the Baltic Member States — the three largest gender gaps in the EU.
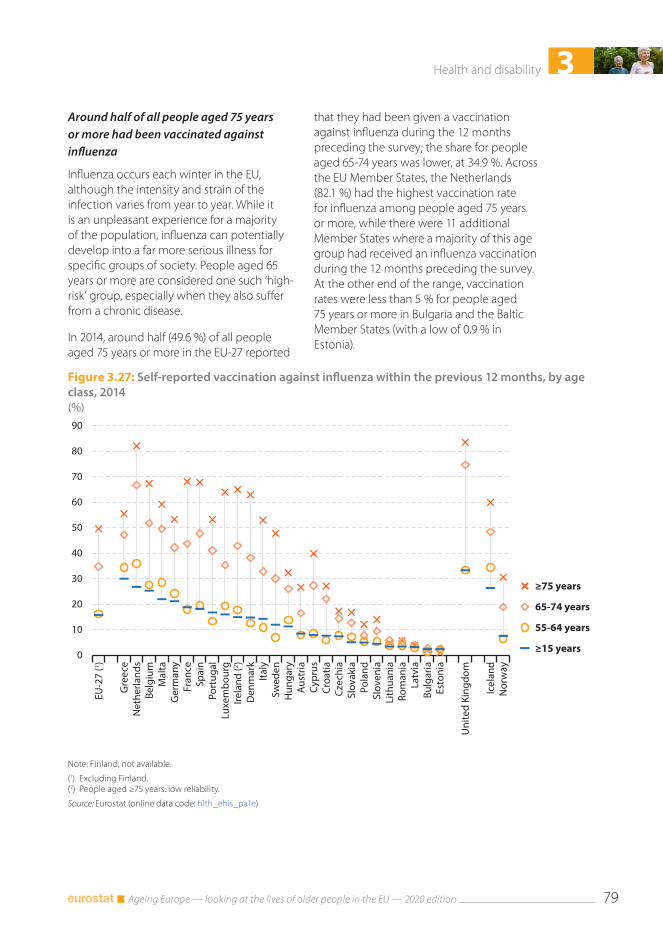
3Health and disability
Ageing Europe — looking at the lives of older people in the EU — 2020 edition 79
Figure 3.27: Self-reported vaccination against influenza within the previous 12 months, by age class, 2014(%)
0
10
20
30
40
50
60
70
80
90
EU-2
7 (1 )
Gre
ece
Net
herla
nds
Belg
ium
Mal
taG
erm
any
Fran
ceSp
ain
Port
ugal
Luxe
mbo
urg
Irela
nd (2 )
Den
mar
kIta
lySw
eden
Hun
gary
Aus
tria
Cypr
usCr
oatia
Czec
hia
Slov
akia
Pola
ndSl
oven
iaLi
thua
nia
Rom
ania
Latv
iaBu
lgar
iaEs
toni
a
Uni
ted
King
dom
Icel
and
Nor
way
≥75 years
65-74 years
55-64 years
≥15 years
Note: Finland, not available.
(1) Excluding Finland.(2) People aged ≥75 years: low reliability.
Source: Eurostat (online data code: hlth_ehis_pa1e)
Around half of all people aged 75 years or more had been vaccinated against influenza
Influenza occurs each winter in the EU, although the intensity and strain of the infection varies from year to year. While it is an unpleasant experience for a majority of the population, influenza can potentially develop into a far more serious illness for specific groups of society. People aged 65 years or more are considered one such ‘high-risk’ group, especially when they also suffer from a chronic disease.
In 2014, around half (49.6 %) of all people aged 75 years or more in the EU-27 reported
that they had been given a vaccination against influenza during the 12 months preceding the survey; the share for people aged 65-74 years was lower, at 34.9 %. Across the EU Member States, the Netherlands (82.1 %) had the highest vaccination rate for influenza among people aged 75 years or more, while there were 11 additional Member States where a majority of this age group had received an influenza vaccination during the 12 months preceding the survey. At the other end of the range, vaccination rates were less than 5 % for people aged 75 years or more in Bulgaria and the Baltic Member States (with a low of 0.9 % in Estonia).
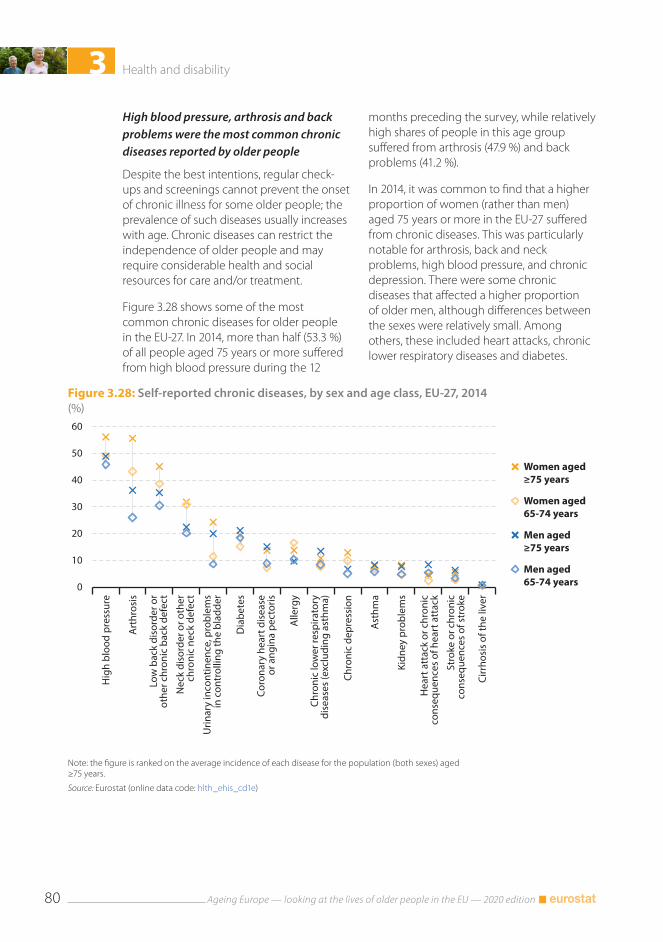
3 Health and disability
Ageing Europe — looking at the lives of older people in the EU — 2020 edition80
Figure 3.28: Self-reported chronic diseases, by sex and age class, EU-27, 2014(%)
0
10
20
30
40
50
60
Hig
h bl
ood
pres
sure
Art
hros
is
Lo
w b
ack
diso
rder
or
othe
r chr
onic
bac
k de
fect
Nec
k di
sord
er o
r oth
er
chr
onic
nec
k de
fect
Urin
ary
inco
ntin
ence
, pro
blem
s
in
cont
rolli
ng th
e bl
adde
r
Dia
bete
s
Coro
nary
hea
rt d
isea
se
or a
ngin
a pe
ctor
is
Alle
rgy
Chro
nic
low
er re
spira
tory
dise
ases
(exc
ludi
ng a
sthm
a)
Chro
nic
depr
essi
on
Ast
hma
Kidn
ey p
robl
ems
Hea
rt a
ttac
k or
chr
onic
cons
eque
nces
of h
eart
att
ack
Stro
ke o
r chr
onic
cons
eque
nces
of s
trok
e
Cirr
hosi
s of
the
liver
Women aged≥75 years
Women aged65-74 years
Men aged≥75 years
Men aged65-74 years
Note: the figure is ranked on the average incidence of each disease for the population (both sexes) aged ≥75 years.
Source: Eurostat (online data code: hlth_ehis_cd1e)
High blood pressure, arthrosis and back problems were the most common chronic diseases reported by older people
Despite the best intentions, regular check-ups and screenings cannot prevent the onset of chronic illness for some older people; the prevalence of such diseases usually increases with age. Chronic diseases can restrict the independence of older people and may require considerable health and social resources for care and/or treatment.
Figure 3.28 shows some of the most common chronic diseases for older people in the EU-27. In 2014, more than half (53.3 %) of all people aged 75 years or more suffered from high blood pressure during the 12
months preceding the survey, while relatively high shares of people in this age group suffered from arthrosis (47.9 %) and back problems (41.2 %).
In 2014, it was common to find that a higher proportion of women (rather than men) aged 75 years or more in the EU-27 suffered from chronic diseases. This was particularly notable for arthrosis, back and neck problems, high blood pressure, and chronic depression. There were some chronic diseases that affected a higher proportion of older men, although differences between the sexes were relatively small. Among others, these included heart attacks, chronic lower respiratory diseases and diabetes.
3Health and disability
Ageing Europe — looking at the lives of older people in the EU — 2020 edition 81
A relatively high share of people aged 75 years or more reported depressive symptoms
A range of common mental health disorders — depression, anxiety, panic attacks or phobias — may be linked to pressure at work, the stresses of everyday life, or loneliness. Figure 3.29 shows self-reported depressive symptoms among older people, by age and by sex. In 2014, some 7.1 % of people aged 55-64 years in the EU-27 had depressive symptoms during the 12 months preceding the survey, this share was lower (6.5 %) among people aged 65-74 years (when the majority of older people were already in retirement), but higher (13.1 %) among people aged 75 years or more (when there was an increased risk of living alone, losing personal independence and facing mobility issues).
This pattern — the highest share of depressive symptoms being recorded for people aged 75 years or more — was repeated in all but two of the 25 EU Member States for which data are available; the exceptions were Finland (where the highest prevalence of depressive symptoms was recorded among people aged 55-64 years) and Austria (where the highest share was recorded among people aged 65-74 years).
Older women aged 75 years or more were more prone (than older men) to experience depressive symptoms. In 2014, 15.8 % of women in this age group reported depressive symptoms, compared with a 9.2 % share among men of the same age; note than older women are more likely to be living alone than older men. Older women were much more likely than older men to report depressive symptoms in the southern EU Member States of Cyprus, Spain and Portugal, while Romania, Ireland, Finland and Austria were the only Member States where a higher share of older men reported depressive symptoms.
Very old people were more likely to visit hospital as an in-patient rather than as a day patient
A hospital discharge occurs when a hospital patient is formally released after an episode of care. The reasons for discharge include finalisation of the patient’s treatment, signing out against medical advice, a transfer to another healthcare institution, or death.
In 2018, older people were more likely than the population as a whole to be discharged from hospital; Figure 3.30 shows that this pattern held for in-patients in all 24 of the EU Member States for which data are available. The share of very old people (aged 85 years or more) being discharged from in-patient care was almost six times as high as the national average for the whole population in Finland and was 4.5-5.0 times as high in Malta (2017 data), Sweden, Cyprus and Luxembourg (2016 data). Equally, the share of very old people being discharged as in-patients was higher than the corresponding share for people aged 65-84 years in each of the Member States except for Romania.
Older people aged 65-84 years were more likely than the national average to be discharged from hospital after day care treatment in 2018. It was common to find that a higher share of people aged 65-84 years — compared with people aged 85 years or more — were discharged after day care treatment, perhaps reflecting mobility issues or the severity or nature of medical conditions among the very old; the only exceptions were Denmark (2016 data), Sweden and Germany (2017 data).
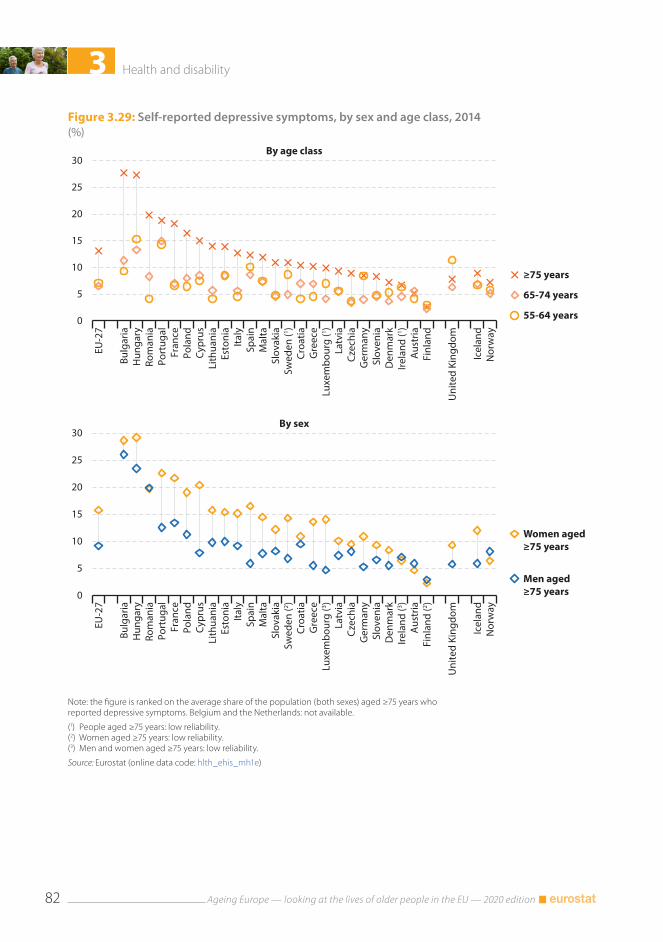
3 Health and disability
Ageing Europe — looking at the lives of older people in the EU — 2020 edition82
Figure 3.29: Self-reported depressive symptoms, by sex and age class, 2014(%)
0
5
10
15
20
25
30
EU-2
7
Bulg
aria
Hun
gary
Rom
ania
Port
ugal
Fran
cePo
land
Cypr
usLi
thua
nia
Esto
nia
Italy
Spai
nM
alta
Slov
akia
Swed
en (1 )
Croa
tiaG
reec
eLu
xem
bour
g (1 )
Latv
iaCz
echi
aG
erm
any
Slov
enia
Den
mar
kIre
land
(1 )A
ustr
iaFi
nlan
d
Uni
ted
King
dom
Icel
and
Nor
way
≥75 years
65-74 years
55-64 years
By age class
0
5
10
15
20
25
30
EU-2
7
Bulg
aria
Hun
gary
Rom
ania
Port
ugal
Fran
cePo
land
Cypr
usLi
thua
nia
Esto
nia
Italy
Spai
nM
alta
Slov
akia
Swed
en (2 )
Croa
tiaG
reec
eLu
xem
bour
g (3 )
Latv
iaCz
echi
aG
erm
any
Slov
enia
Den
mar
kIre
land
(3 )A
ustr
iaFi
nlan
d (2 )
Uni
ted
King
dom
Icel
and
Nor
way
Women aged≥75 years
Men aged≥75 years
By sex
Note: the figure is ranked on the average share of the population (both sexes) aged ≥75 years who reported depressive symptoms. Belgium and the Netherlands: not available.
(1) People aged ≥75 years: low reliability.(2) Women aged ≥75 years: low reliability.(3) Men and women aged ≥75 years: low reliability.
Source: Eurostat (online data code: hlth_ehis_mh1e)
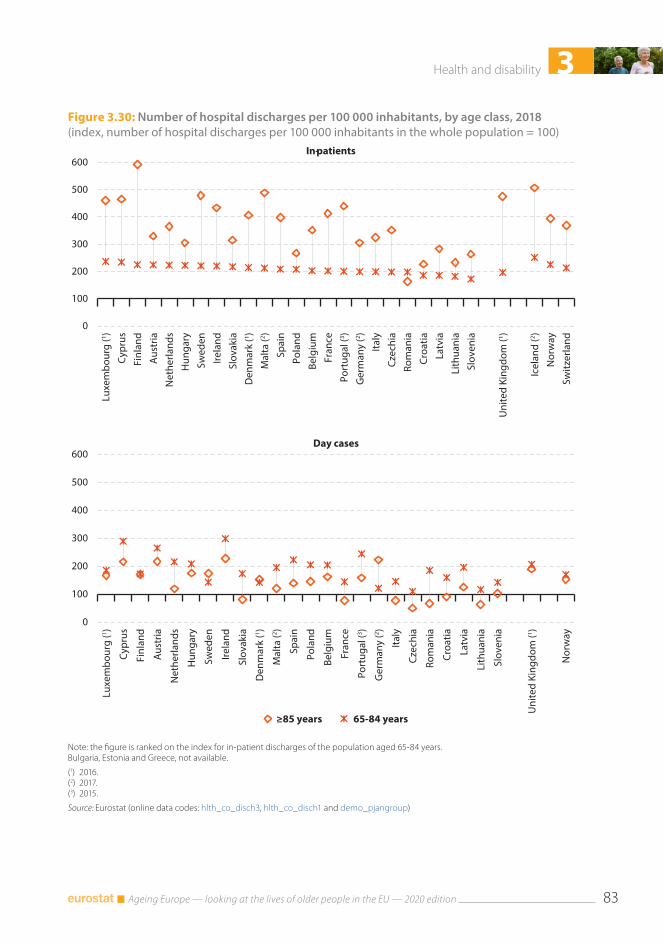
3Health and disability
Ageing Europe — looking at the lives of older people in the EU — 2020 edition 83
Figure 3.30: Number of hospital discharges per 100 000 inhabitants, by age class, 2018(index, number of hospital discharges per 100 000 inhabitants in the whole population = 100)
0
100
200
300
400
500
600
Luxe
mbo
urg
(1 )Cy
prus
Finl
and
Aus
tria
Net
herla
nds
Hun
gary
Swed
enIre
land
Slov
akia
Den
mar
k (1 )
Mal
ta (2 )
Spai
nPo
land
Belg
ium
Fran
cePo
rtug
al (3 )
Ger
man
y (2 )
Italy
Czec
hia
Rom
ania
Croa
tiaLa
tvia
Lith
uani
aSl
oven
ia
Uni
ted
King
dom
(1 )
Icel
and
(2 )N
orw
aySw
itzer
land
In-patients
0
100
200
300
400
500
600
Luxe
mbo
urg
(1 )
Cypr
us
Finl
and
Aus
tria
Net
herla
nds
Hun
gary
Swed
en
Irela
nd
Slov
akia
Den
mar
k (1 )
Mal
ta (2 )
Spai
n
Pola
nd
Belg
ium
Fran
ce
Port
ugal
(3 )
Ger
man
y (2 )
Italy
Czec
hia
Rom
ania
Croa
tia
Latv
ia
Lith
uani
a
Slov
enia
Uni
ted
King
dom
(1 )
Nor
way
≥85 years 65-84 years
Day cases
Note: the figure is ranked on the index for in-patient discharges of the population aged 65-84 years. Bulgaria, Estonia and Greece, not available.
(1) 2016.(2) 2017.(3) 2015.
Source: Eurostat (online data codes: hlth_co_disch3, hlth_co_disch1 and demo_pjangroup)
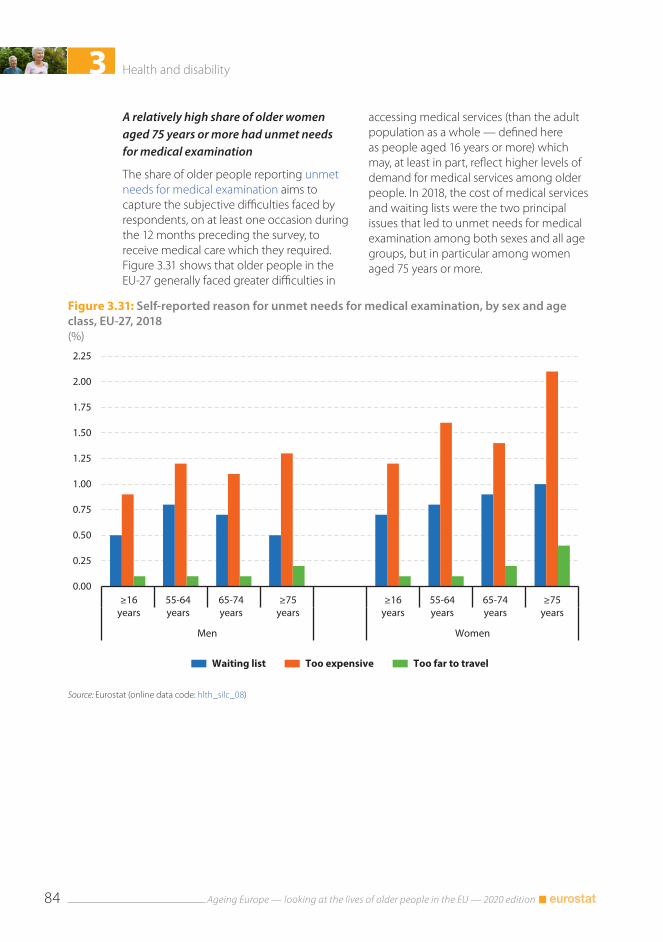
3 Health and disability
Ageing Europe — looking at the lives of older people in the EU — 2020 edition84
Figure 3.31: Self-reported reason for unmet needs for medical examination, by sex and age class, EU-27, 2018(%)
0.00
0.25
0.50
0.75
1.00
1.25
1.50
1.75
2.00
2.25
≥16years
55-64years
65-74years
≥75years
≥16years
55-64years
65-74years
≥75years
Men Women
Waiting list Too expensive Too far to travel
Source: Eurostat (online data code: hlth_silc_08)
A relatively high share of older women aged 75 years or more had unmet needs for medical examination
The share of older people reporting unmet needs for medical examination aims to capture the subjective difficulties faced by respondents, on at least one occasion during the 12 months preceding the survey, to receive medical care which they required. Figure 3.31 shows that older people in the EU-27 generally faced greater difficulties in
accessing medical services (than the adult population as a whole — defined here as people aged 16 years or more) which may, at least in part, reflect higher levels of demand for medical services among older people. In 2018, the cost of medical services and waiting lists were the two principal issues that led to unmet needs for medical examination among both sexes and all age groups, but in particular among women aged 75 years or more.
3Health and disability
Ageing Europe — looking at the lives of older people in the EU — 2020 edition 85
Causes of death among older people
Diseases of the circulatory system were the most common cause of death among people aged 75 years or more
As already shown in Chapter 1, women can expect to live longer than men; this is also borne out when studying the information presented in Figure 3.32. In 2016, the principal causes of death among people aged 55 years or more in the EU-27 were diseases of the circulatory system, cancer and diseases of the respiratory system. Cancer was the main cause of death both for men and for women between the ages of 55 and 74 years. From the age of 75 years onwards, the most common cause of death was diseases of the circulatory system.
In 2016, more men than women in the EU-27 died from the six principal causes of death that are highlighted in Figure 3.32; this pattern was repeated for each of five-year age groups between 55 and 79 years. Unsurprisingly therefore, the overall number of men still alive after the age of 80 was considerably lower than the total number of
women that were still alive. After the age of 80, these six causes of death accounted for more female (than male) deaths, reflecting changes in population structure and the higher number of women still alive. The difference was particularly pronounced for the final age category, as the total number of deaths (from these causes) among very old women aged 95 years or more was 3.3 times as high as the corresponding figure for very old men, as far fewer men had experienced such longevity.
The crude death rate is an alternative measure based on the number of deaths per 100 000 inhabitants. EU-27 crude death rates were higher for men than for women for each of the six main causes of death shown in Figure 3.32 and this pattern was repeated for most age categories. The only exceptions were: crude death rates for women aged 90-94 years and 95 years or more were higher than those for men of the same age for diseases of the nervous system and sense organs and for mental and behavioural disorders; the crude death rate for women aged 95 years or more was higher than that for men of the same age for diseases of the circulatory system.
Defining the cause of death
A cause of death is defined as the disease or injury which started the train (sequence) of morbid (disease-related) events which led directly to death, or the circumstances of the accident or violence which produced the fatal injury. This information may be used by health authorities to help determine the focus of their public actions (for example, where to launch health information programmes to prevent illness/disease, or where to increase/decrease health expenditure).
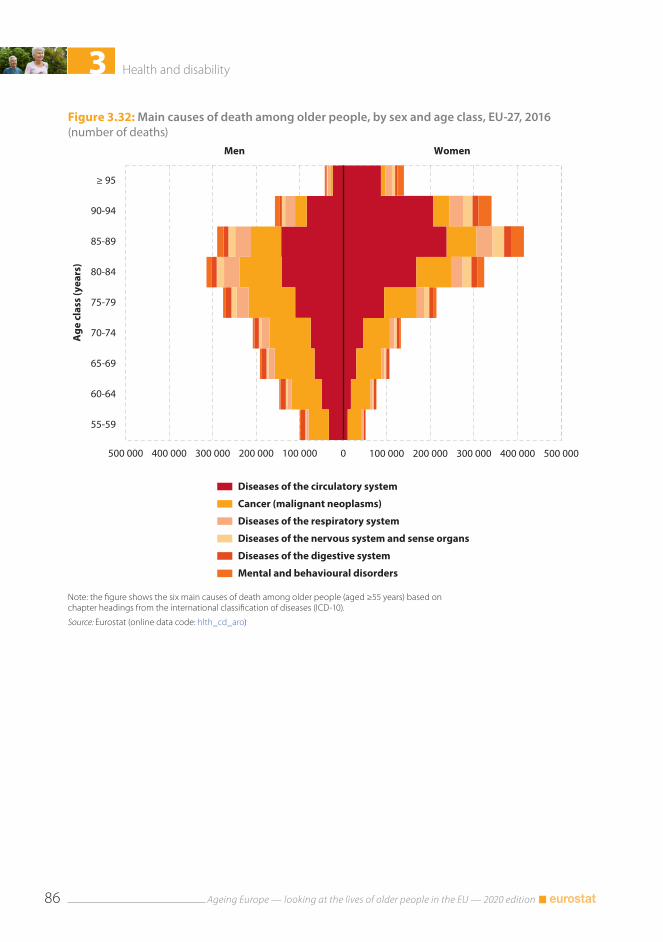
3 Health and disability
Ageing Europe — looking at the lives of older people in the EU — 2020 edition86
Figure 3.32: Main causes of death among older people, by sex and age class, EU-27, 2016(number of deaths)
500 000 400 000 300 000 200 000 100 000 0
55-59
60-64
65-69
70-74
75-79
80-84
85-89
90-94
≥ 95
Diseases of the circulatory system
Cancer (malignant neoplasms)
Diseases of the respiratory system
Diseases of the nervous system and sense organs
Diseases of the digestive system
Mental and behavioural disorders
Age
cla
ss (y
ears
)
Men
100 000 200 000 300 000 400 000 500 000
Women
Note: the figure shows the six main causes of death among older people (aged ≥55 years) based on chapter headings from the international classification of diseases (ICD-10).
Source: Eurostat (online data code: hlth_cd_aro)
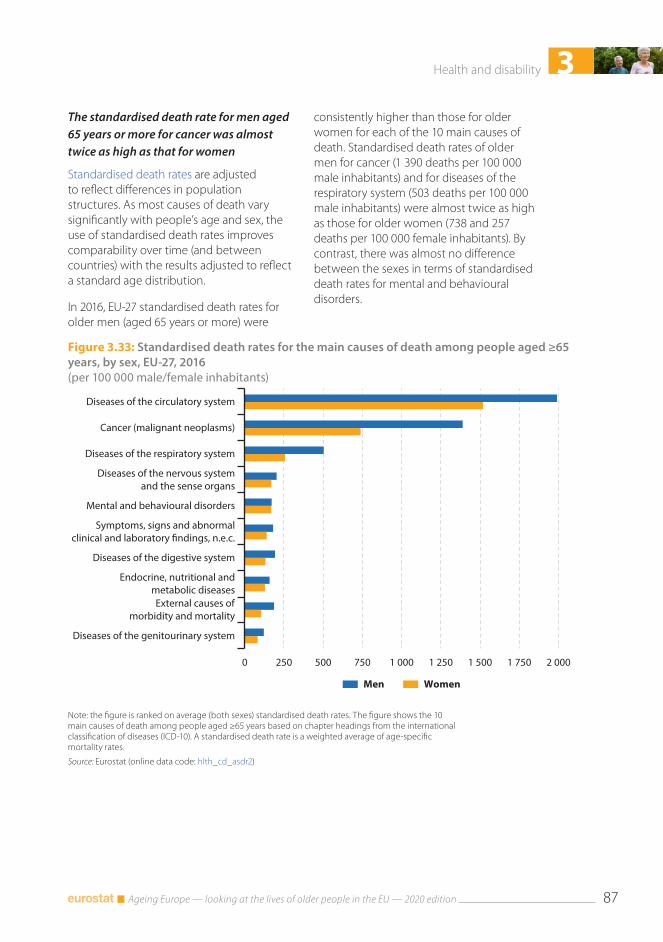
3Health and disability
Ageing Europe — looking at the lives of older people in the EU — 2020 edition 87
Figure 3.33: Standardised death rates for the main causes of death among people aged ≥65 years, by sex, EU-27, 2016(per 100 000 male/female inhabitants)
0 250 500 750 1 000 1 250 1 500 1 750 2 000
Diseases of the circulatory system
Cancer (malignant neoplasms)
Diseases of the respiratory system
Diseases of the nervous system and the sense organs
Mental and behavioural disorders
Symptoms, signs and abnormalclinical and laboratory �ndings, n.e.c.
Diseases of the digestive system
Endocrine, nutritional and metabolic diseases
External causes ofmorbidity and mortality
Diseases of the genitourinary system
Men Women
Note: the figure is ranked on average (both sexes) standardised death rates. The figure shows the 10 main causes of death among people aged ≥65 years based on chapter headings from the international classification of diseases (ICD-10). A standardised death rate is a weighted average of age-specific mortality rates.
Source: Eurostat (online data code: hlth_cd_asdr2)
The standardised death rate for men aged 65 years or more for cancer was almost twice as high as that for women
Standardised death rates are adjusted to reflect differences in population structures. As most causes of death vary significantly with people’s age and sex, the use of standardised death rates improves comparability over time (and between countries) with the results adjusted to reflect a standard age distribution.
In 2016, EU-27 standardised death rates for older men (aged 65 years or more) were
consistently higher than those for older women for each of the 10 main causes of death. Standardised death rates of older men for cancer (1 390 deaths per 100 000 male inhabitants) and for diseases of the respiratory system (503 deaths per 100 000 male inhabitants) were almost twice as high as those for older women (738 and 257 deaths per 100 000 female inhabitants). By contrast, there was almost no difference between the sexes in terms of standardised death rates for mental and behavioural disorders.
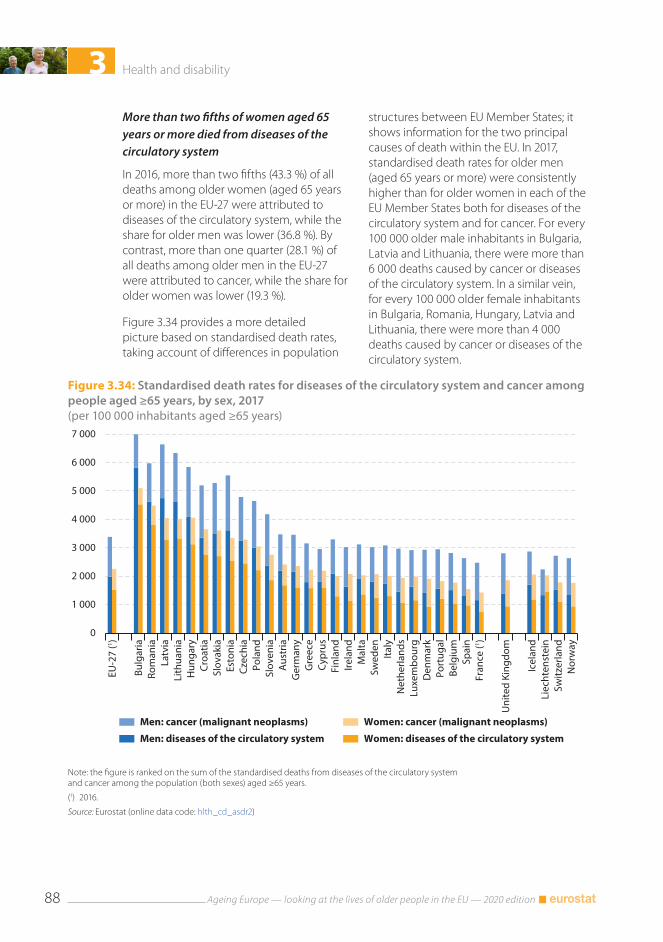
3 Health and disability
Ageing Europe — looking at the lives of older people in the EU — 2020 edition88
Figure 3.34: Standardised death rates for diseases of the circulatory system and cancer among people aged ≥65 years, by sex, 2017(per 100 000 inhabitants aged ≥65 years)
EU-2
7 (1 )
Bulg
aria
Rom
ania
Latv
iaLi
thua
nia
Hun
gary
Croa
tiaSl
ovak
iaEs
toni
aCz
echi
aPo
land
Slov
enia
Aus
tria
Ger
man
yG
reec
eCy
prus
Finl
and
Irela
ndM
alta
Swed
enIta
lyN
ethe
rland
sLu
xem
bour
gD
enm
ark
Port
ugal
Belg
ium
Spai
nFr
ance
(1 )
Uni
ted
King
dom
Icel
and
Liec
hten
stei
nSw
itzer
land
Nor
way
0
1 000
2 000
3 000
4 000
5 000
6 000
7 000
Men: cancer (malignant neoplasms)
Men: diseases of the circulatory system
Women: cancer (malignant neoplasms)
Women: diseases of the circulatory system
Note: the figure is ranked on the sum of the standardised deaths from diseases of the circulatory system and cancer among the population (both sexes) aged ≥65 years.
(1) 2016.
Source: Eurostat (online data code: hlth_cd_asdr2)
More than two fifths of women aged 65 years or more died from diseases of the circulatory system
In 2016, more than two fifths (43.3 %) of all deaths among older women (aged 65 years or more) in the EU-27 were attributed to diseases of the circulatory system, while the share for older men was lower (36.8 %). By contrast, more than one quarter (28.1 %) of all deaths among older men in the EU-27 were attributed to cancer, while the share for older women was lower (19.3 %).
Figure 3.34 provides a more detailed picture based on standardised death rates, taking account of differences in population
structures between EU Member States; it shows information for the two principal causes of death within the EU. In 2017, standardised death rates for older men (aged 65 years or more) were consistently higher than for older women in each of the EU Member States both for diseases of the circulatory system and for cancer. For every 100 000 older male inhabitants in Bulgaria, Latvia and Lithuania, there were more than 6 000 deaths caused by cancer or diseases of the circulatory system. In a similar vein, for every 100 000 older female inhabitants in Bulgaria, Romania, Hungary, Latvia and Lithuania, there were more than 4 000 deaths caused by cancer or diseases of the circulatory system.

4 Working and moving into retirement
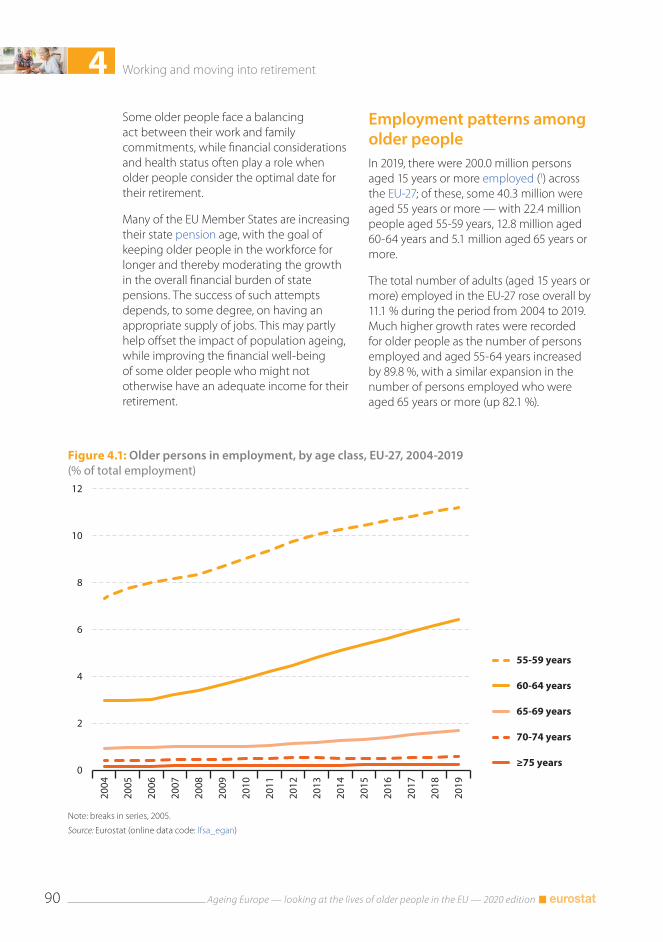
4 Working and moving into retirement
Ageing Europe — looking at the lives of older people in the EU — 2020 edition90
Figure 4.1: Older persons in employment, by age class, EU-27, 2004-2019(% of total employment)
0
2
4
6
8
10
12
2004
2005
2006
2007
2008
2009
2010
2011
2012
2013
2014
2015
2016
2017
2018
2019
55-59 years
60-64 years
65-69 years
70-74 years
≥75 years
Note: breaks in series, 2005.
Source: Eurostat (online data code: lfsa_egan)
Some older people face a balancing act between their work and family commitments, while financial considerations and health status often play a role when older people consider the optimal date for their retirement.
Many of the EU Member States are increasing their state pension age, with the goal of keeping older people in the workforce for longer and thereby moderating the growth in the overall financial burden of state pensions. The success of such attempts depends, to some degree, on having an appropriate supply of jobs. This may partly help offset the impact of population ageing, while improving the financial well-being of some older people who might not otherwise have an adequate income for their retirement.
Employment patterns among older peopleIn 2019, there were 200.0 million persons aged 15 years or more employed (1) across the EU-27; of these, some 40.3 million were aged 55 years or more — with 22.4 million people aged 55-59 years, 12.8 million aged 60-64 years and 5.1 million aged 65 years or more.
The total number of adults (aged 15 years or more) employed in the EU-27 rose overall by 11.1 % during the period from 2004 to 2019. Much higher growth rates were recorded for older people as the number of persons employed and aged 55-64 years increased by 89.8 %, with a similar expansion in the number of persons employed who were aged 65 years or more (up 82.1 %).
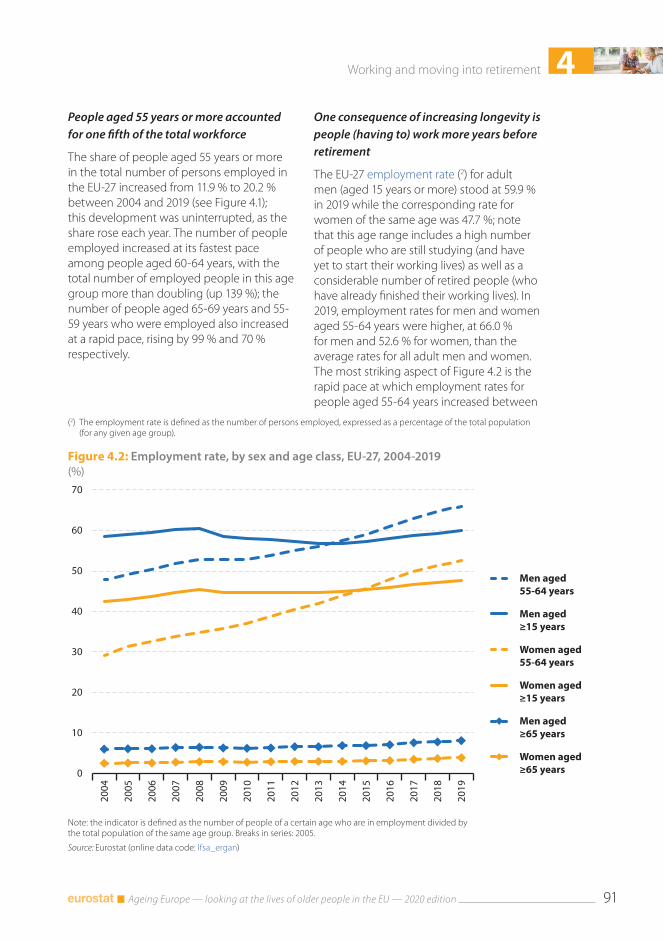
4Working and moving into retirement
Ageing Europe — looking at the lives of older people in the EU — 2020 edition 91
Figure 4.2: Employment rate, by sex and age class, EU-27, 2004-2019(%)
0
10
20
30
40
50
60
70
2004
2005
2006
2007
2008
2009
2010
2011
2012
2013
2014
2015
2016
2017
2018
2019
Men aged55-64 years
Men aged≥15 years
Women aged55-64 years
Women aged≥15 years
Men aged≥65 years
Women aged≥65 years
Note: the indicator is defined as the number of people of a certain age who are in employment divided by the total population of the same age group. Breaks in series: 2005.
Source: Eurostat (online data code: lfsa_ergan)
People aged 55 years or more accounted for one fifth of the total workforce
The share of people aged 55 years or more in the total number of persons employed in the EU-27 increased from 11.9 % to 20.2 % between 2004 and 2019 (see Figure 4.1); this development was uninterrupted, as the share rose each year. The number of people employed increased at its fastest pace among people aged 60-64 years, with the total number of employed people in this age group more than doubling (up 139 %); the number of people aged 65-69 years and 55-59 years who were employed also increased at a rapid pace, rising by 99 % and 70 % respectively.
(2) The employment rate is defined as the number of persons employed, expressed as a percentage of the total population (for any given age group).
One consequence of increasing longevity is people (having to) work more years before retirement
The EU-27 employment rate (2) for adult men (aged 15 years or more) stood at 59.9 % in 2019 while the corresponding rate for women of the same age was 47.7 %; note that this age range includes a high number of people who are still studying (and have yet to start their working lives) as well as a considerable number of retired people (who have already finished their working lives). In 2019, employment rates for men and women aged 55-64 years were higher, at 66.0 % for men and 52.6 % for women, than the average rates for all adult men and women. The most striking aspect of Figure 4.2 is the rapid pace at which employment rates for people aged 55-64 years increased between
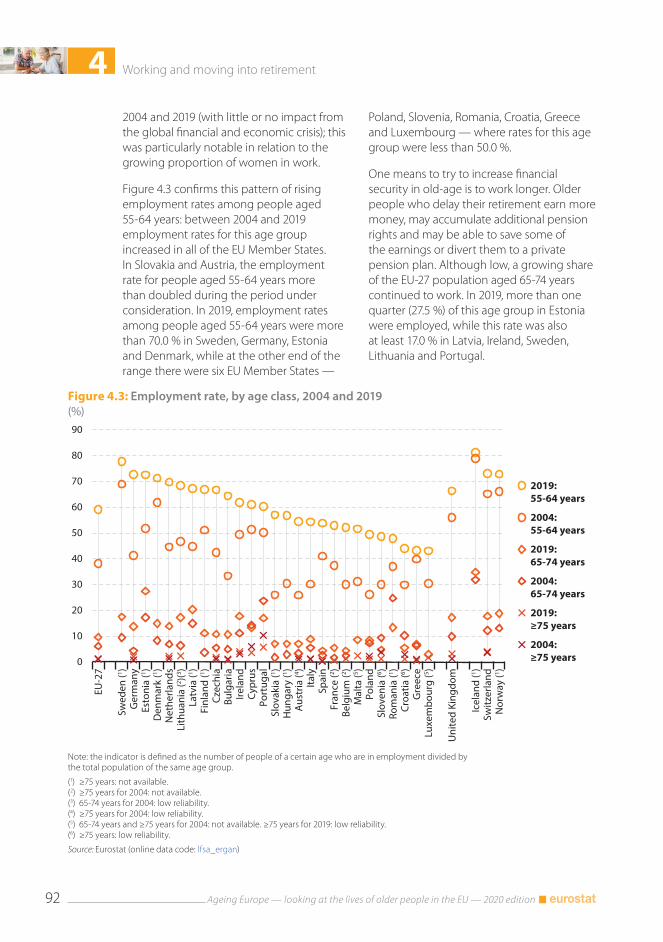
4 Working and moving into retirement
Ageing Europe — looking at the lives of older people in the EU — 2020 edition92
Figure 4.3: Employment rate, by age class, 2004 and 2019(%)
0
10
20
30
40
50
60
70
80
90
EU-2
7
Swed
en (1 )
Ger
man
yEs
toni
a (1 )
Den
mar
k (1 )
Net
herla
nds
Lith
uani
a (2 )(3 )
Latv
ia (1 )
Finl
and
(1 )Cz
echi
aBu
lgar
iaIre
land
Cypr
usPo
rtug
alSl
ovak
ia (1 )
Hun
gary
(1 )A
ustr
ia (4 )
Italy
Spai
nFr
ance
(2 )Be
lgiu
m (2 )
Mal
ta (5 )
Pola
ndSl
oven
ia (6 )
Rom
ania
(1 )Cr
oatia
(6 )G
reec
eLu
xem
bour
g (5 )
Uni
ted
King
dom
Icel
and
(1 )Sw
itzer
land
Nor
way
(1 )2019:55-64 years
2004:55-64 years
2019:65-74 years
2004:65-74 years
2019:≥75 years
2004:≥75 years
Note: the indicator is defined as the number of people of a certain age who are in employment divided by the total population of the same age group.
(1) ≥75 years: not available.(2) ≥75 years for 2004: not available.(3) 65-74 years for 2004: low reliability.(4) ≥75 years for 2004: low reliability.(5) 65-74 years and ≥75 years for 2004: not available. ≥75 years for 2019: low reliability.(6) ≥75 years: low reliability.
Source: Eurostat (online data code: lfsa_ergan)
2004 and 2019 (with little or no impact from the global financial and economic crisis); this was particularly notable in relation to the growing proportion of women in work.
Figure 4.3 confirms this pattern of rising employment rates among people aged 55-64 years: between 2004 and 2019 employment rates for this age group increased in all of the EU Member States. In Slovakia and Austria, the employment rate for people aged 55-64 years more than doubled during the period under consideration. In 2019, employment rates among people aged 55-64 years were more than 70.0 % in Sweden, Germany, Estonia and Denmark, while at the other end of the range there were six EU Member States —
Poland, Slovenia, Romania, Croatia, Greece and Luxembourg — where rates for this age group were less than 50.0 %.
One means to try to increase financial security in old-age is to work longer. Older people who delay their retirement earn more money, may accumulate additional pension rights and may be able to save some of the earnings or divert them to a private pension plan. Although low, a growing share of the EU-27 population aged 65-74 years continued to work. In 2019, more than one quarter (27.5 %) of this age group in Estonia were employed, while this rate was also at least 17.0 % in Latvia, Ireland, Sweden, Lithuania and Portugal.
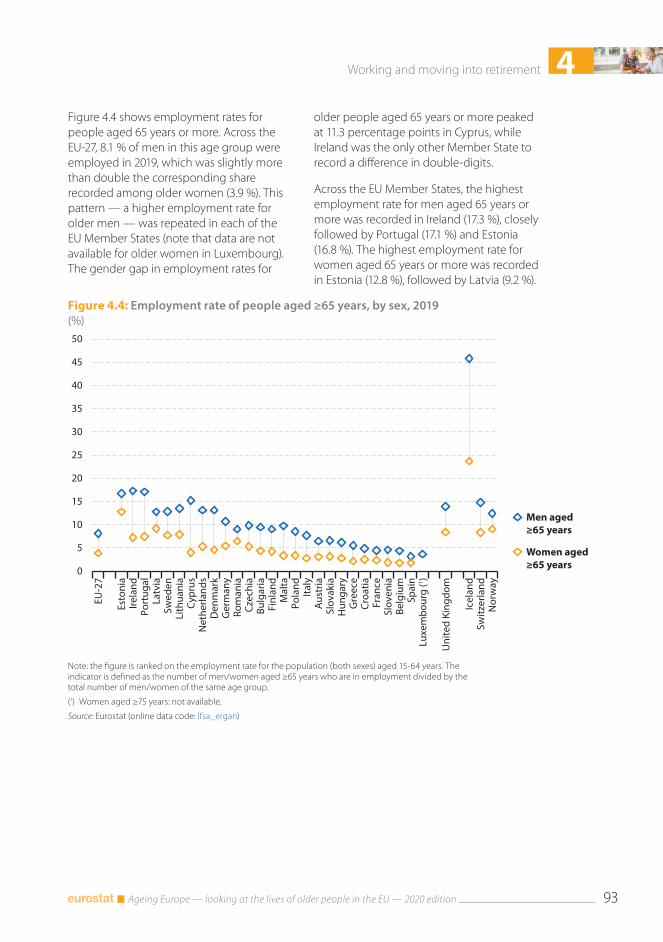
4Working and moving into retirement
Ageing Europe — looking at the lives of older people in the EU — 2020 edition 93
Figure 4.4: Employment rate of people aged ≥65 years, by sex, 2019(%)
0
5
10
15
20
25
30
35
40
45
50
EU-2
7
Esto
nia
Irela
ndPo
rtug
alLa
tvia
Swed
enLi
thua
nia
Cypr
usN
ethe
rland
sD
enm
ark
Ger
man
yRo
man
iaCz
echi
aBu
lgar
iaFi
nlan
dM
alta
Pola
ndIta
lyA
ustr
iaSl
ovak
iaH
unga
ryG
reec
eCr
oatia
Fran
ceSl
oven
iaBe
lgiu
mSp
ain
Luxe
mbo
urg
(1 )
Uni
ted
King
dom
Icel
and
Switz
erla
ndN
orw
ay
Men aged≥65 years
Women aged≥65 years
Note: the figure is ranked on the employment rate for the population (both sexes) aged 15-64 years. The indicator is defined as the number of men/women aged ≥65 years who are in employment divided by the total number of men/women of the same age group.
(1) Women aged ≥75 years: not available.
Source: Eurostat (online data code: lfsa_ergan)
Figure 4.4 shows employment rates for people aged 65 years or more. Across the EU-27, 8.1 % of men in this age group were employed in 2019, which was slightly more than double the corresponding share recorded among older women (3.9 %). This pattern — a higher employment rate for older men — was repeated in each of the EU Member States (note that data are not available for older women in Luxembourg). The gender gap in employment rates for
older people aged 65 years or more peaked at 11.3 percentage points in Cyprus, while Ireland was the only other Member State to record a difference in double-digits.
Across the EU Member States, the highest employment rate for men aged 65 years or more was recorded in Ireland (17.3 %), closely followed by Portugal (17.1 %) and Estonia (16.8 %). The highest employment rate for women aged 65 years or more was recorded in Estonia (12.8 %), followed by Latvia (9.2 %).
4 Working and moving into retirement
Ageing Europe — looking at the lives of older people in the EU — 2020 edition94
There was particularly rapid growth in the number of older foreign citizens in employment
The first part of Figure 4.5 presents information showing EU-27 population developments by age and citizenship. During the period from 2009 to 2019, the number of adults (defined here as people aged 15 years or more) who were foreign citizens living in the EU-27 increased at a much more rapid pace (up 26.6 % overall) than the number of national citizens (which was more or less unchanged; down 0.3 % overall). A closer examination reveals that the relative importance of older generations in both national and foreign citizens increased between 2009 and 2019; this was particularly the case for people aged 65 years or more.
The second part of Figure 4.5 presents similar data but for employment developments. During the period 2009 to 2019, the number of adults employed in the EU-27 rose at a somewhat faster pace than the number of inhabitants both for national and foreign citizens. The number of foreign citizens aged 55-64 years who were employed in the EU-27 rose by 83.3 % overall between 2009 and 2019, while the number of national citizens of the same age who were in employment increased by 48.9 %. Even higher rates of change were recorded among the relatively few people aged 65 years or more who remained in work, as the number of persons employed more than doubled for foreign citizens (up 188.0 %) and increased by 52.5 % for national citizens.
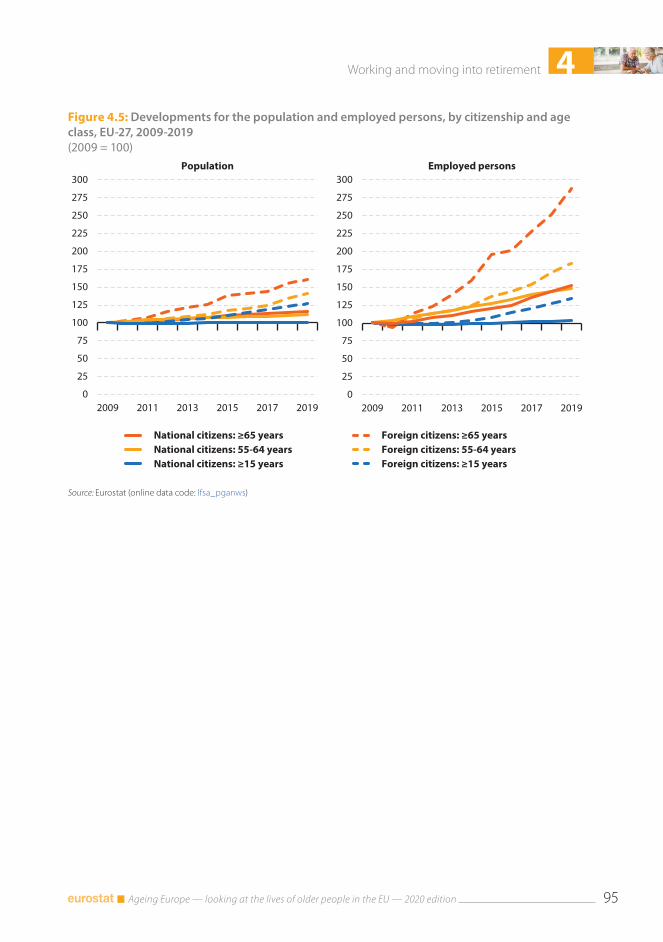
4Working and moving into retirement
Ageing Europe — looking at the lives of older people in the EU — 2020 edition 95
Figure 4.5: Developments for the population and employed persons, by citizenship and age class, EU-27, 2009-2019(2009 = 100)
0
25
50
75
100
125
150
175
200
225
250
275
300
2009 2011 2013 2015 2017 2019
Employed persons
0
25
50
75
100
125
150
175
200
225
250
275
300
2009 2011 2013 2015 2017 2019
National citizens: ≥65 years Foreign citizens: ≥65 yearsNational citizens: 55-64 years Foreign citizens: 55-64 yearsNational citizens: ≥15 years Foreign citizens: ≥15 years
Population
Source: Eurostat (online data code: lfsa_pganws)
4 Working and moving into retirement
Ageing Europe — looking at the lives of older people in the EU — 2020 edition96
More than half of the workforce aged 65 years or more was employed on a part-time basis
While the information presented so far has highlighted the quite rapid transformation of EU labour markets driven by a growing number of older people in work, policymakers stress the need for these developments to continue. Employers can try to stimulate the supply of older people available for employment by improving working conditions; employees can also try to avoid an abrupt end to their working lives. Increasing numbers of older people are choosing a phased retirement (for example, moving from working full-time to 60 % or 50 % of their normal working hours before moving permanently into retirement), while other older people who do retire may subsequently take on a part-time job or become self-employed or a freelancer.
In 2019, almost one fifth (18.3 %) of the EU-27 workforce aged 15-64 years was employed on a part-time basis, with much higher shares for women (29.9 %) than for men (8.4 %). Figure 4.6 indicates the extent to which part-time work is common for older people and, in particular, the relatively high rates recorded among those people aged 65 years or more: in 2019, almost half (47.6 %) of all working men in this age group were employed on a part-time basis, while the share for older women was higher still, at 60.2 %. In approximately half (13 out of 27) of the EU Member States, more than 50.0 % of all older people aged 65 years or more who remained in employment were found to be working on a part-time basis, with this share exceeding 75.0 % in Austria and the Netherlands.
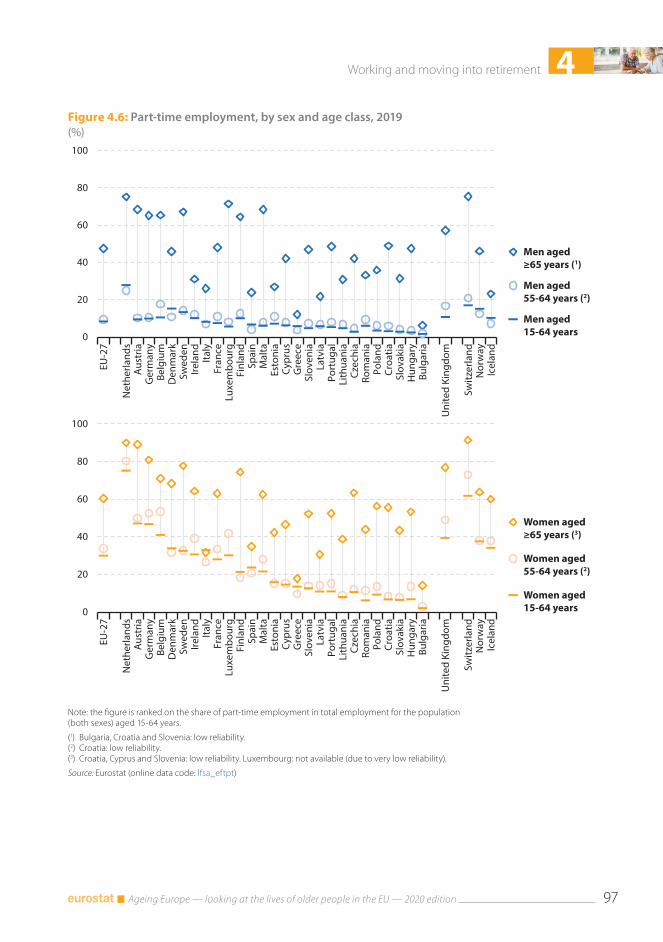
4Working and moving into retirement
Ageing Europe — looking at the lives of older people in the EU — 2020 edition 97
Figure 4.6: Part-time employment, by sex and age class, 2019(%)
0
20
40
60
80
100
EU-2
7
Net
herla
nds
Aus
tria
Ger
man
yBe
lgiu
mD
enm
ark
Swed
enIre
land
Italy
Fran
ceLu
xem
bour
gFi
nlan
dSp
ain
Mal
taEs
toni
aCy
prus
Gre
ece
Slov
enia
Latv
iaPo
rtug
alLi
thua
nia
Czec
hia
Rom
ania
Pola
ndCr
oatia
Slov
akia
Hun
gary
Bulg
aria
Uni
ted
King
dom
Switz
erla
ndN
orw
ayIc
elan
d
Men aged≥65 years (1)
Men aged55-64 years (2)
Men aged15-64 years
0
20
40
60
80
100
EU-2
7
Net
herla
nds
Aus
tria
Ger
man
yBe
lgiu
mD
enm
ark
Swed
enIre
land
Italy
Fran
ceLu
xem
bour
gFi
nlan
dSp
ain
Mal
taEs
toni
aCy
prus
Gre
ece
Slov
enia
Latv
iaPo
rtug
alLi
thua
nia
Czec
hia
Rom
ania
Pola
ndCr
oatia
Slov
akia
Hun
gary
Bulg
aria
Uni
ted
King
dom
Switz
erla
ndN
orw
ayIc
elan
d
Women aged≥65 years (3)
Women aged55-64 years (2)
Women aged15-64 years
Note: the figure is ranked on the share of part-time employment in total employment for the population (both sexes) aged 15-64 years.
(1) Bulgaria, Croatia and Slovenia: low reliability.(2) Croatia: low reliability.(3) Croatia, Cyprus and Slovenia: low reliability. Luxembourg: not available (due to very low reliability).
Source: Eurostat (online data code: lfsa_eftpt)
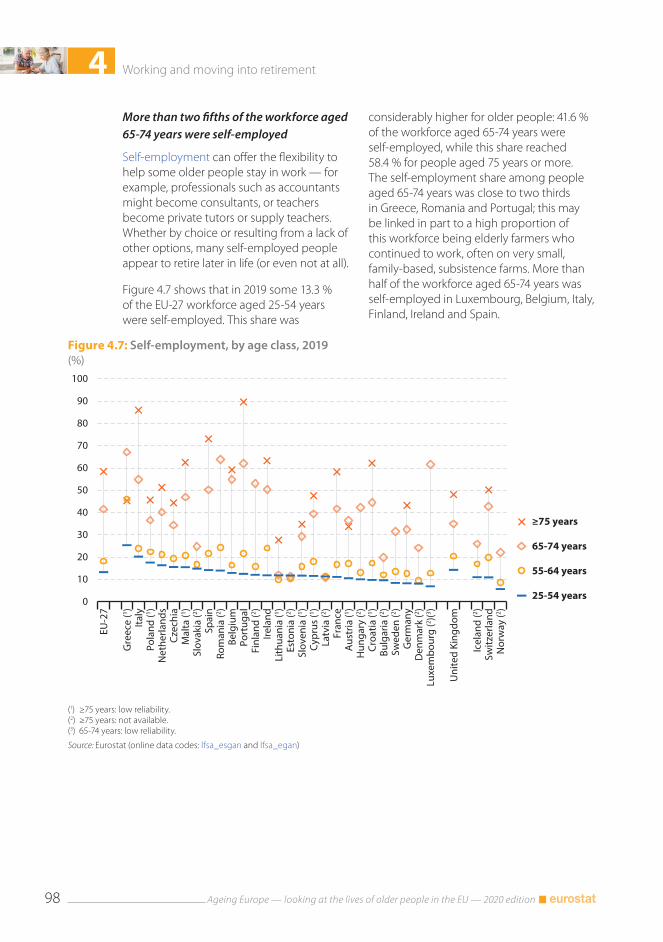
4 Working and moving into retirement
Ageing Europe — looking at the lives of older people in the EU — 2020 edition98
Figure 4.7: Self-employment, by age class, 2019(%)
0
10
20
30
40
50
60
70
80
90
100
EU-2
7
Gre
ece
(1 )Ita
lyPo
land
(1 )N
ethe
rland
sCz
echi
aM
alta
(1 )Sl
ovak
ia (2 )
Spai
nRo
man
ia (2 )
Belg
ium
Port
ugal
Finl
and
(2 )Ire
land
Lith
uani
a (1 )
Esto
nia
(2 )Sl
oven
ia (1 )
Cypr
us (1 )
Latv
ia (2 )
Fran
ceA
ustr
ia (1 )
Hun
gary
(2 )Cr
oatia
(1 )Bu
lgar
ia (2 )
Swed
en (2 )
Ger
man
yD
enm
ark
(2 )Lu
xem
bour
g (2 )(3 )
Uni
ted
King
dom
Icel
and
(2 )Sw
itzer
land
Nor
way
(2 )
≥75 years
65-74 years
55-64 years
25-54 years
(1) ≥75 years: low reliability.(2) ≥75 years: not available.(3) 65-74 years: low reliability.
Source: Eurostat (online data codes: lfsa_esgan and lfsa_egan)
More than two fifths of the workforce aged 65-74 years were self-employed
Self-employment can offer the flexibility to help some older people stay in work — for example, professionals such as accountants might become consultants, or teachers become private tutors or supply teachers. Whether by choice or resulting from a lack of other options, many self-employed people appear to retire later in life (or even not at all).
Figure 4.7 shows that in 2019 some 13.3 % of the EU-27 workforce aged 25-54 years were self-employed. This share was
considerably higher for older people: 41.6 % of the workforce aged 65-74 years were self-employed, while this share reached 58.4 % for people aged 75 years or more. The self-employment share among people aged 65-74 years was close to two thirds in Greece, Romania and Portugal; this may be linked in part to a high proportion of this workforce being elderly farmers who continued to work, often on very small, family-based, subsistence farms. More than half of the workforce aged 65-74 years was self-employed in Luxembourg, Belgium, Italy, Finland, Ireland and Spain.
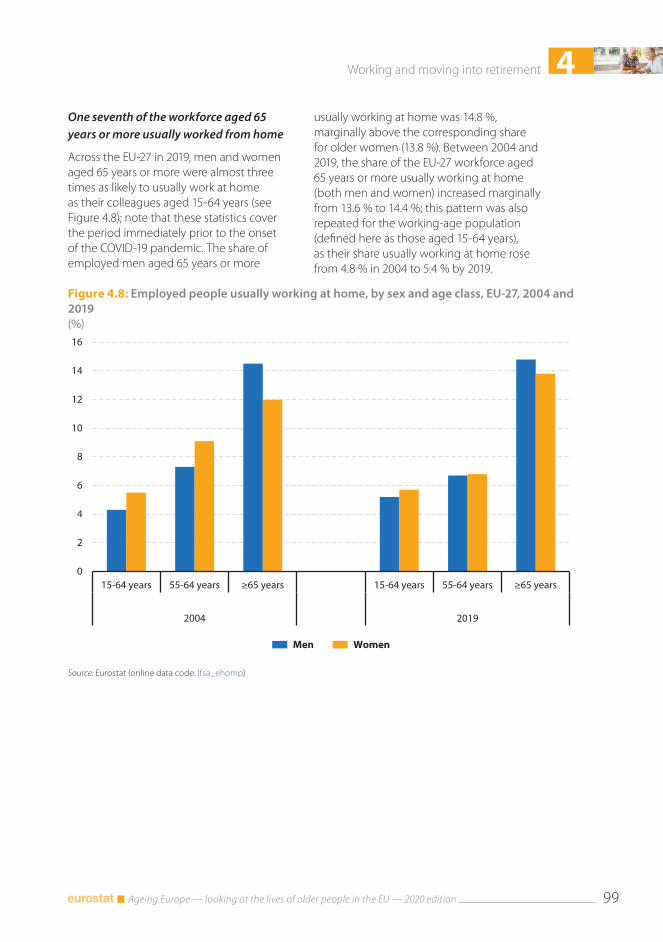
4Working and moving into retirement
Ageing Europe — looking at the lives of older people in the EU — 2020 edition 99
Figure 4.8: Employed people usually working at home, by sex and age class, EU-27, 2004 and 2019(%)
0
2
4
6
8
10
12
14
16
15-64 years 55-64 years ≥65 years 15-64 years 55-64 years ≥65 years
2004 2019
Men Women
Source: Eurostat (online data code: lfsa_ehomp)
One seventh of the workforce aged 65 years or more usually worked from home
Across the EU-27 in 2019, men and women aged 65 years or more were almost three times as likely to usually work at home as their colleagues aged 15-64 years (see Figure 4.8); note that these statistics cover the period immediately prior to the onset of the COVID-19 pandemic. The share of employed men aged 65 years or more
usually working at home was 14.8 %, marginally above the corresponding share for older women (13.8 %). Between 2004 and 2019, the share of the EU-27 workforce aged 65 years or more usually working at home (both men and women) increased marginally from 13.6 % to 14.4 %; this pattern was also repeated for the working-age population (defined here as those aged 15-64 years), as their share usually working at home rose from 4.8 % in 2004 to 5.4 % by 2019.
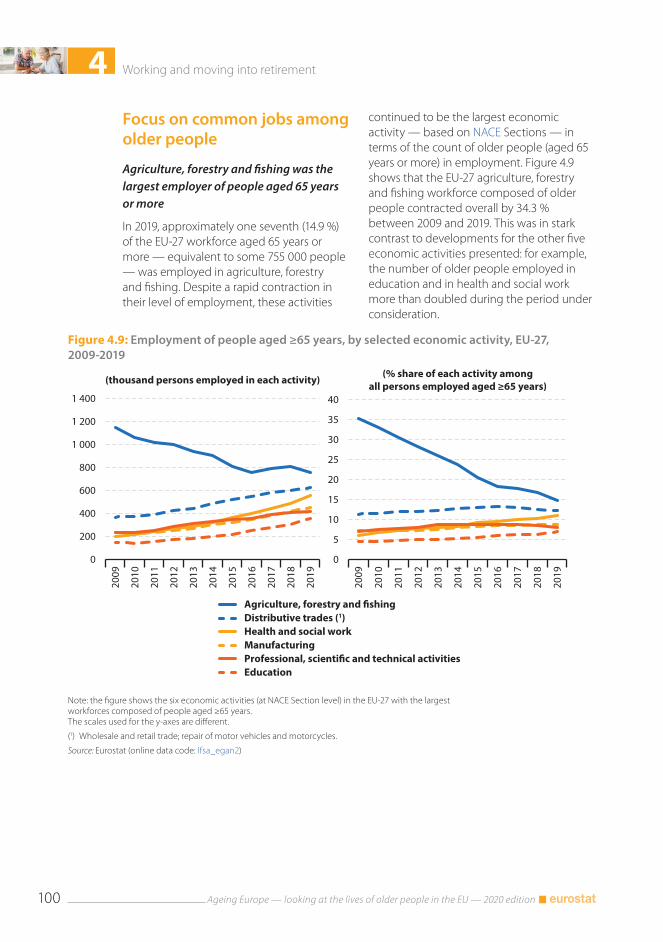
4 Working and moving into retirement
Ageing Europe — looking at the lives of older people in the EU — 2020 edition100
Figure 4.9: Employment of people aged ≥65 years, by selected economic activity, EU-27, 2009-2019
0
200
400
600
800
1 000
1 200
1 400
2009
2010
2011
2012
2013
2014
2015
2016
2017
2018
2019
Agriculture, forestry and �shingDistributive trades (1)Health and social workManufacturingProfessional, scienti�c and technical activitiesEducation
(thousand persons employed in each activity)
0
5
10
15
20
25
30
35
40
2009
2010
2011
2012
2013
2014
2015
2016
2017
2018
2019
(% share of each activity amongall persons employed aged ≥65 years)
Note: the figure shows the six economic activities (at NACE Section level) in the EU-27 with the largest workforces composed of people aged ≥65 years. The scales used for the y-axes are different.
(1) Wholesale and retail trade; repair of motor vehicles and motorcycles.
Source: Eurostat (online data code: lfsa_egan2)
Focus on common jobs among older people
Agriculture, forestry and fishing was the largest employer of people aged 65 years or more
In 2019, approximately one seventh (14.9 %) of the EU-27 workforce aged 65 years or more — equivalent to some 755 000 people — was employed in agriculture, forestry and fishing. Despite a rapid contraction in their level of employment, these activities
continued to be the largest economic activity — based on NACE Sections — in terms of the count of older people (aged 65 years or more) in employment. Figure 4.9 shows that the EU-27 agriculture, forestry and fishing workforce composed of older people contracted overall by 34.3 % between 2009 and 2019. This was in stark contrast to developments for the other five economic activities presented: for example, the number of older people employed in education and in health and social work more than doubled during the period under consideration.
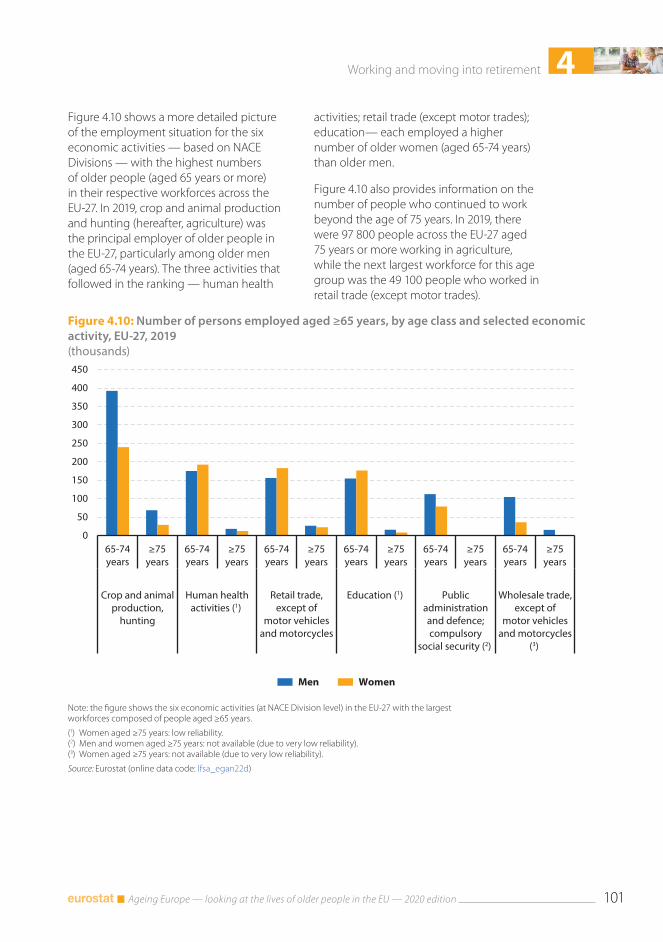
4Working and moving into retirement
Ageing Europe — looking at the lives of older people in the EU — 2020 edition 101
Figure 4.10: Number of persons employed aged ≥65 years, by age class and selected economic activity, EU-27, 2019(thousands)
0
50
100
150
200
250
300
350
400
450
65-74years
≥75 years
65-74years
≥75 years
65-74years
≥75 years
65-74years
≥75 years
65-74years
≥75 years
65-74years
≥75 years
Crop and animalproduction,
hunting
Human healthactivities (1)
Retail trade,except of
motor vehiclesand motorcycles
Education (1) Publicadministrationand defence;compulsory
social security (2)
Wholesale trade,except of
motor vehiclesand motorcycles
(3)
Men Women
Note: the figure shows the six economic activities (at NACE Division level) in the EU-27 with the largest workforces composed of people aged ≥65 years.
(1) Women aged ≥75 years: low reliability.(2) Men and women aged ≥75 years: not available (due to very low reliability).(3) Women aged ≥75 years: not available (due to very low reliability).
Source: Eurostat (online data code: lfsa_egan22d)
Figure 4.10 shows a more detailed picture of the employment situation for the six economic activities — based on NACE Divisions — with the highest numbers of older people (aged 65 years or more) in their respective workforces across the EU-27. In 2019, crop and animal production and hunting (hereafter, agriculture) was the principal employer of older people in the EU-27, particularly among older men (aged 65-74 years). The three activities that followed in the ranking — human health
activities; retail trade (except motor trades); education— each employed a higher number of older women (aged 65-74 years) than older men.
Figure 4.10 also provides information on the number of people who continued to work beyond the age of 75 years. In 2019, there were 97 800 people across the EU-27 aged 75 years or more working in agriculture, while the next largest workforce for this age group was the 49 100 people who worked in retail trade (except motor trades).
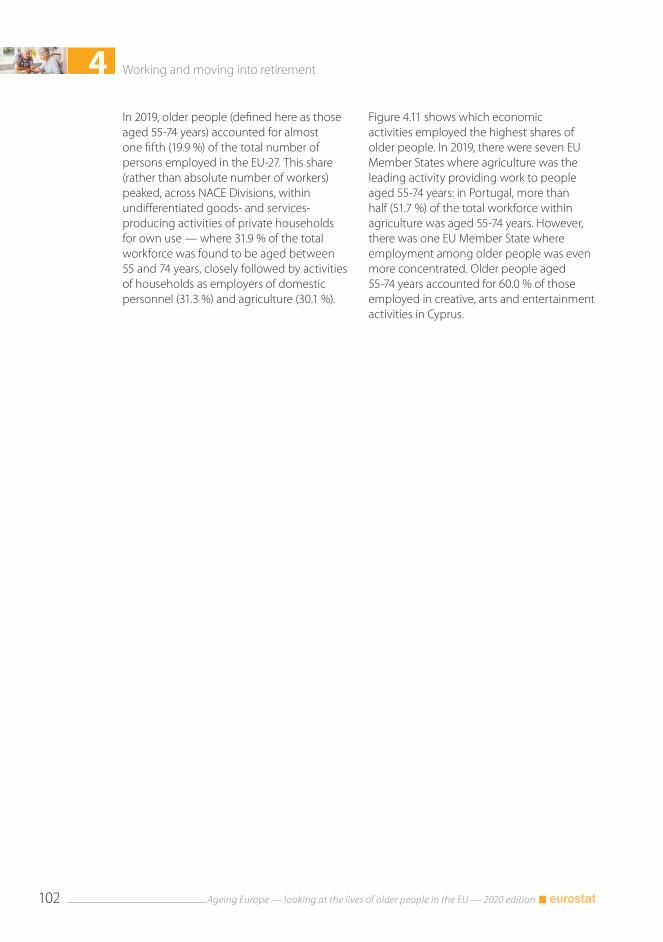
4 Working and moving into retirement
Ageing Europe — looking at the lives of older people in the EU — 2020 edition102
In 2019, older people (defined here as those aged 55-74 years) accounted for almost one fifth (19.9 %) of the total number of persons employed in the EU-27. This share (rather than absolute number of workers) peaked, across NACE Divisions, within undifferentiated goods- and services-producing activities of private households for own use — where 31.9 % of the total workforce was found to be aged between 55 and 74 years, closely followed by activities of households as employers of domestic personnel (31.3 %) and agriculture (30.1 %).
Figure 4.11 shows which economic activities employed the highest shares of older people. In 2019, there were seven EU Member States where agriculture was the leading activity providing work to people aged 55-74 years: in Portugal, more than half (51.7 %) of the total workforce within agriculture was aged 55-74 years. However, there was one EU Member State where employment among older people was even more concentrated. Older people aged 55-74 years accounted for 60.0 % of those employed in creative, arts and entertainment activities in Cyprus.
4Working and moving into retirement
Ageing Europe — looking at the lives of older people in the EU — 2020 edition 103
Figure 4.11: People aged 55-74 years in employment, 2019(% share of total number of persons employed)
EU-27
Belgium (1)
Bulgaria
Czechia
Denmark (1)
Germany
Estonia
Ireland
Greece
Spain
France
Croatia (1)
Italy
Cyprus (1)
Latvia
Lithuania
Luxembourg (1)
Hungary
Malta (1)
Netherlands
Austria
Poland
Portugal
Romania
Slovenia
Slovakia
Finland
Sweden
United Kingdom
Iceland
Norway
Switzerland
Undi�erentiated producing activities of private households for own use
Information service activities
Residential care activities
Security and investigation activities
Land transport and transport via pipelines
Activities of households as employers of domestic personnel
Real estate activities
Crop and animal production, hunting
Crop and animal production, hunting
Public administration and defence; compulsory social security
Activities of households as employers of domestic personnel
Manufacture of beverages
Forestry and logging
Creative, arts and entertainment activities
Real estate activities
Libraries, archives, museums and other cultural activities
Activities of households as employers of domestic personnel
Water collection, treatment and supply
Travel agency, tour operator and related activities
Repair of computers and personal and household goods
Crop and animal production, hunting
Security and investigation activities
Crop and animal production, hunting
Crop and animal production, hunting
Crop and animal production, hunting
Creative, arts and entertainment activities
Crop and animal production, hunting
Forestry and logging
Activities of households as employers of domestic personnel
Crop and animal production, hunting
Crop and animal production, hunting
Creative, arts and entertainment activities
0 20 40 60 80
All economic activitiesActivity where older people accounted for the highest share of the workforce
Note: the figure shows the economic activity (at NACE Division level) where older people aged 55-74 years accounted for the highest share of the overall workforce.
(1) Activity where older people accounted for the highest share of the workforce: low reliability.
Source: Eurostat (online data codes: lfsa_egan2 and lfsa_egan22d)
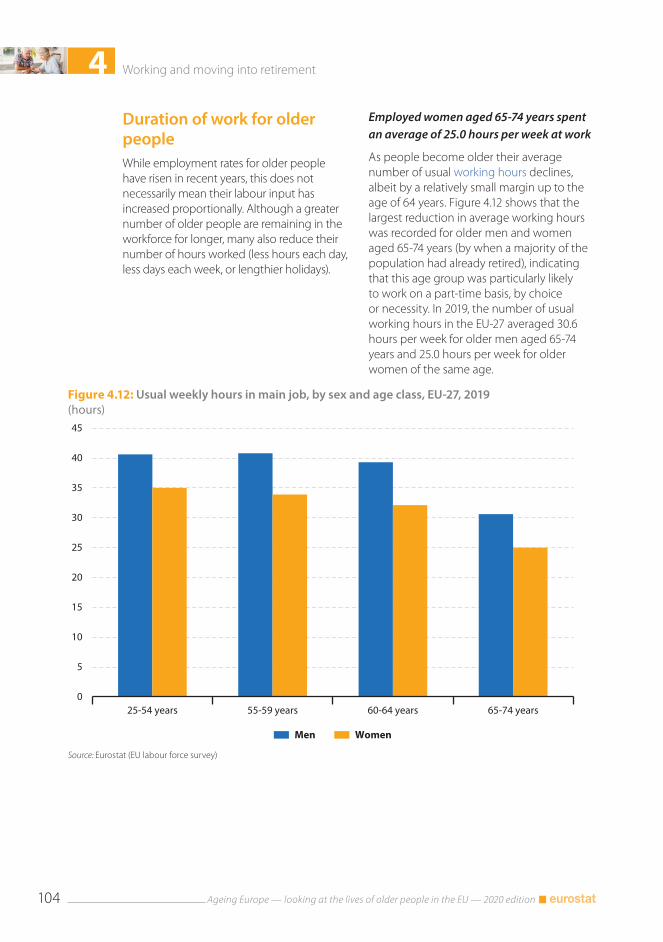
4 Working and moving into retirement
Ageing Europe — looking at the lives of older people in the EU — 2020 edition104
Figure 4.12: Usual weekly hours in main job, by sex and age class, EU-27, 2019(hours)
0
5
10
15
20
25
30
35
40
45
25-54 years 55-59 years 60-64 years 65-74 years
Men Women
Source: Eurostat (EU labour force survey)
Duration of work for older peopleWhile employment rates for older people have risen in recent years, this does not necessarily mean their labour input has increased proportionally. Although a greater number of older people are remaining in the workforce for longer, many also reduce their number of hours worked (less hours each day, less days each week, or lengthier holidays).
Employed women aged 65-74 years spent an average of 25.0 hours per week at work
As people become older their average number of usual working hours declines, albeit by a relatively small margin up to the age of 64 years. Figure 4.12 shows that the largest reduction in average working hours was recorded for older men and women aged 65-74 years (by when a majority of the population had already retired), indicating that this age group was particularly likely to work on a part-time basis, by choice or necessity. In 2019, the number of usual working hours in the EU-27 averaged 30.6 hours per week for older men aged 65-74 years and 25.0 hours per week for older women of the same age.
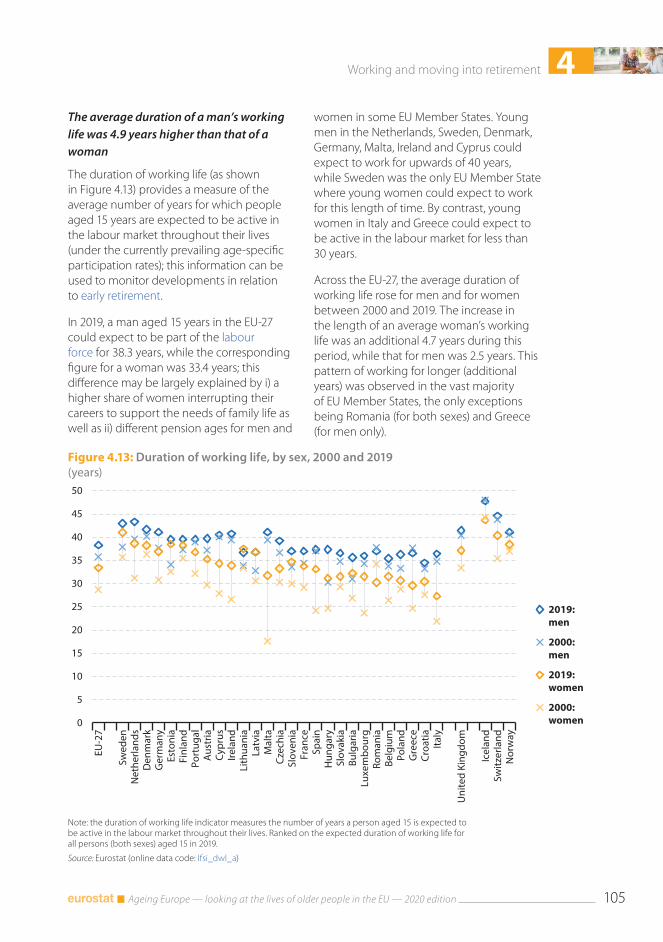
4Working and moving into retirement
Ageing Europe — looking at the lives of older people in the EU — 2020 edition 105
Figure 4.13: Duration of working life, by sex, 2000 and 2019(years)
0
5
10
15
20
25
30
35
40
45
50
EU-2
7
Swed
enN
ethe
rland
sD
enm
ark
Ger
man
yEs
toni
aFi
nlan
dPo
rtug
alA
ustr
iaCy
prus
Irela
ndLi
thua
nia
Latv
iaM
alta
Czec
hia
Slov
enia
Fran
ceSp
ain
Hun
gary
Slov
akia
Bulg
aria
Luxe
mbo
urg
Rom
ania
Belg
ium
Pola
ndG
reec
eCr
oatia
Italy
Uni
ted
King
dom
Icel
and
Switz
erla
ndN
orw
ay
2019:men
2000:men
2019:women
2000:women
Note: the duration of working life indicator measures the number of years a person aged 15 is expected to be active in the labour market throughout their lives. Ranked on the expected duration of working life for all persons (both sexes) aged 15 in 2019.
Source: Eurostat (online data code: lfsi_dwl_a)
The average duration of a man’s working life was 4.9 years higher than that of a woman
The duration of working life (as shown in Figure 4.13) provides a measure of the average number of years for which people aged 15 years are expected to be active in the labour market throughout their lives (under the currently prevailing age-specific participation rates); this information can be used to monitor developments in relation to early retirement.
In 2019, a man aged 15 years in the EU-27 could expect to be part of the labour force for 38.3 years, while the corresponding figure for a woman was 33.4 years; this difference may be largely explained by i) a higher share of women interrupting their careers to support the needs of family life as well as ii) different pension ages for men and
women in some EU Member States. Young men in the Netherlands, Sweden, Denmark, Germany, Malta, Ireland and Cyprus could expect to work for upwards of 40 years, while Sweden was the only EU Member State where young women could expect to work for this length of time. By contrast, young women in Italy and Greece could expect to be active in the labour market for less than 30 years.
Across the EU-27, the average duration of working life rose for men and for women between 2000 and 2019. The increase in the length of an average woman’s working life was an additional 4.7 years during this period, while that for men was 2.5 years. This pattern of working for longer (additional years) was observed in the vast majority of EU Member States, the only exceptions being Romania (for both sexes) and Greece (for men only).
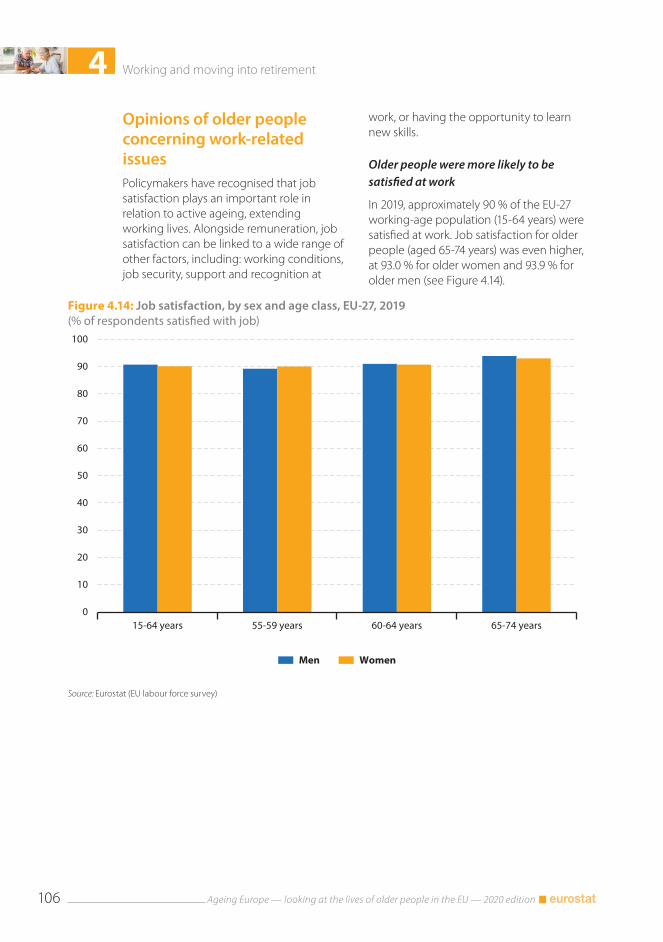
4 Working and moving into retirement
Ageing Europe — looking at the lives of older people in the EU — 2020 edition106
Figure 4.14: Job satisfaction, by sex and age class, EU-27, 2019(% of respondents satisfied with job)
0
10
20
30
40
50
60
70
80
90
100
15-64 years 55-59 years 60-64 years 65-74 years
Men Women
Source: Eurostat (EU labour force survey)
Opinions of older people concerning work-related issuesPolicymakers have recognised that job satisfaction plays an important role in relation to active ageing, extending working lives. Alongside remuneration, job satisfaction can be linked to a wide range of other factors, including: working conditions, job security, support and recognition at
work, or having the opportunity to learn new skills.
Older people were more likely to be satisfied at work
In 2019, approximately 90 % of the EU-27 working-age population (15-64 years) were satisfied at work. Job satisfaction for older people (aged 65-74 years) was even higher, at 93.0 % for older women and 93.9 % for older men (see Figure 4.14).
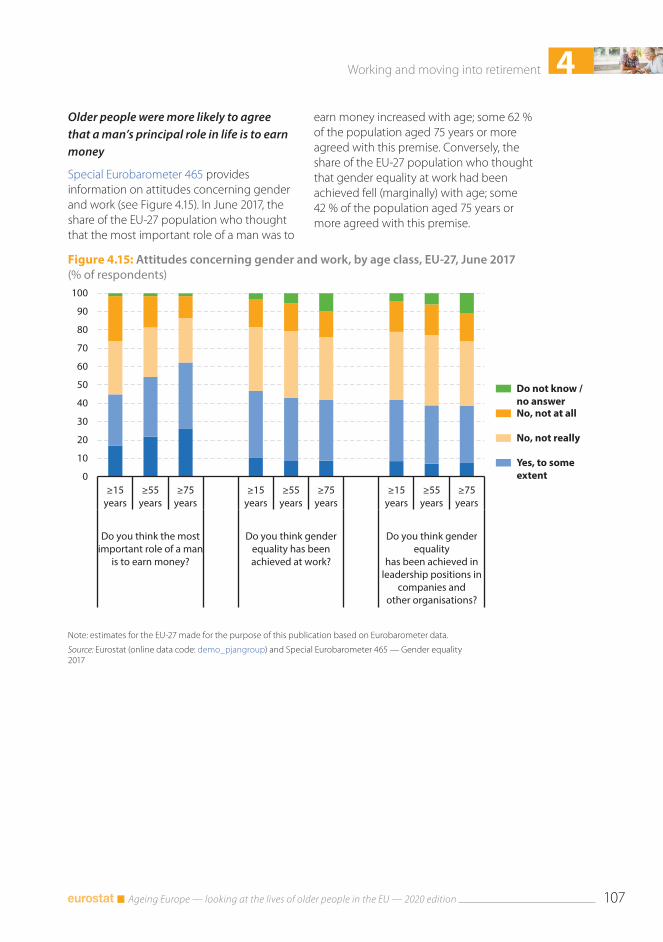
4Working and moving into retirement
Ageing Europe — looking at the lives of older people in the EU — 2020 edition 107
Figure 4.15: Attitudes concerning gender and work, by age class, EU-27, June 2017(% of respondents)
0
10
20
30
40
50
60
70
80
90
100
≥15 years
≥55 years
≥75 years
≥15 years
≥55 years
≥75 years
≥15 years
≥55 years
≥75 years
Do you think the mostimportant role of a man
is to earn money?
Do you think genderequality has beenachieved at work?
Do you think genderequality
has been achieved inleadership positions in
companies andother organisations?
Do not know /no answerNo, not at all
No, not really
Yes, to someextent
Note: estimates for the EU-27 made for the purpose of this publication based on Eurobarometer data.
Source: Eurostat (online data code: demo_pjangroup) and Special Eurobarometer 465 — Gender equality 2017
Older people were more likely to agree that a man’s principal role in life is to earn money
Special Eurobarometer 465 provides information on attitudes concerning gender and work (see Figure 4.15). In June 2017, the share of the EU-27 population who thought that the most important role of a man was to
earn money increased with age; some 62 % of the population aged 75 years or more agreed with this premise. Conversely, the share of the EU-27 population who thought that gender equality at work had been achieved fell (marginally) with age; some 42 % of the population aged 75 years or more agreed with this premise.
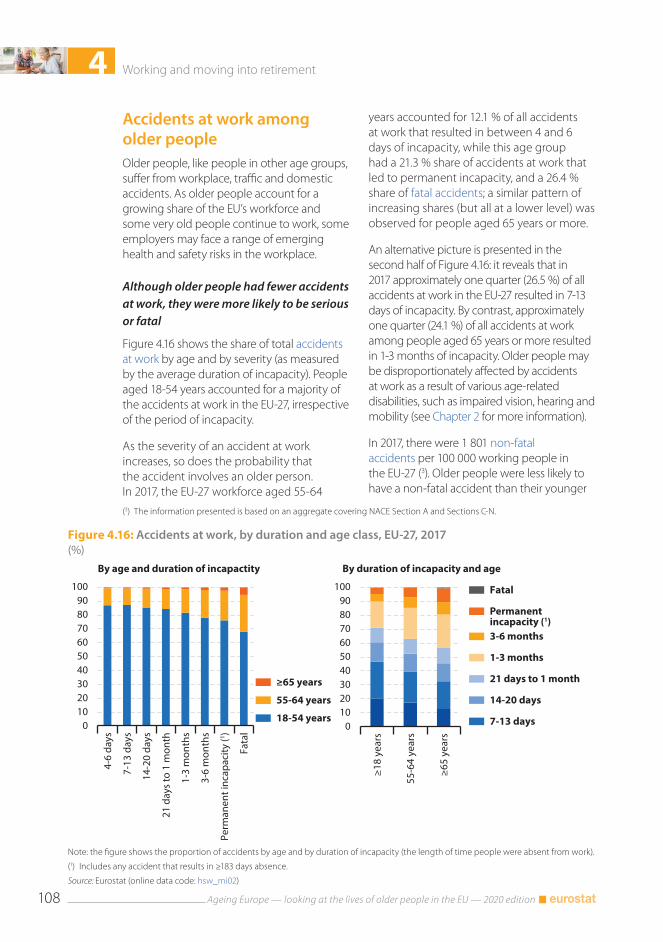
4 Working and moving into retirement
Ageing Europe — looking at the lives of older people in the EU — 2020 edition108
Figure 4.16: Accidents at work, by duration and age class, EU-27, 2017(%)
0102030405060708090
100
4-6
days
7-13
day
s
14-2
0 da
ys
21 d
ays
to 1
mon
th
1-3
mon
ths
3-6
mon
ths
Perm
anen
t inc
apac
ity (1 )
Fata
l
≥65 years
55-64 years
18-54 years
By age and duration of incapactity
0102030405060708090
100
≥18
year
s
55-6
4 ye
ars
≥65
year
s
Fatal
Permanentincapacity (1)3-6 months
1-3 months
21 days to 1 month
14-20 days
7-13 days
By duration of incapacity and age
Note: the figure shows the proportion of accidents by age and by duration of incapacity (the length of time people were absent from work).
(1) Includes any accident that results in ≥183 days absence.
Source: Eurostat (online data code: hsw_mi02)
Accidents at work among older peopleOlder people, like people in other age groups, suffer from workplace, traffic and domestic accidents. As older people account for a growing share of the EU’s workforce and some very old people continue to work, some employers may face a range of emerging health and safety risks in the workplace.
Although older people had fewer accidents at work, they were more likely to be serious or fatal
Figure 4.16 shows the share of total accidents at work by age and by severity (as measured by the average duration of incapacity). People aged 18-54 years accounted for a majority of the accidents at work in the EU-27, irrespective of the period of incapacity.
As the severity of an accident at work increases, so does the probability that the accident involves an older person. In 2017, the EU-27 workforce aged 55-64
(3) The information presented is based on an aggregate covering NACE Section A and Sections C-N.
years accounted for 12.1 % of all accidents at work that resulted in between 4 and 6 days of incapacity, while this age group had a 21.3 % share of accidents at work that led to permanent incapacity, and a 26.4 % share of fatal accidents; a similar pattern of increasing shares (but all at a lower level) was observed for people aged 65 years or more.
An alternative picture is presented in the second half of Figure 4.16: it reveals that in 2017 approximately one quarter (26.5 %) of all accidents at work in the EU-27 resulted in 7-13 days of incapacity. By contrast, approximately one quarter (24.1 %) of all accidents at work among people aged 65 years or more resulted in 1-3 months of incapacity. Older people may be disproportionately affected by accidents at work as a result of various age-related disabilities, such as impaired vision, hearing and mobility (see Chapter 2 for more information).
In 2017, there were 1 801 non-fatal accidents per 100 000 working people in the EU-27 (3). Older people were less likely to have a non-fatal accident than their younger
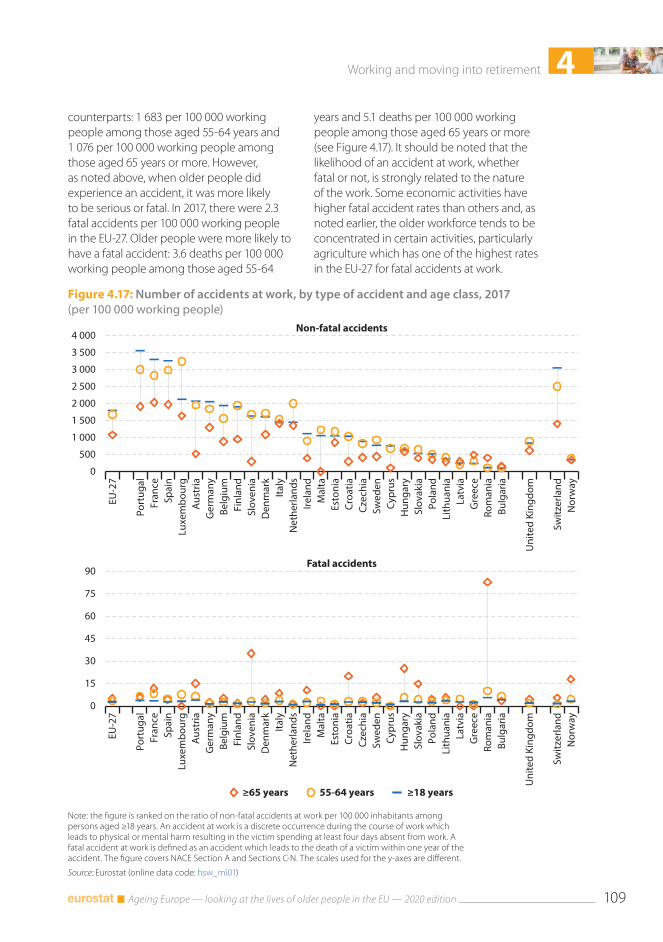
4Working and moving into retirement
Ageing Europe — looking at the lives of older people in the EU — 2020 edition 109
counterparts: 1 683 per 100 000 working people among those aged 55-64 years and 1 076 per 100 000 working people among those aged 65 years or more. However, as noted above, when older people did experience an accident, it was more likely to be serious or fatal. In 2017, there were 2.3 fatal accidents per 100 000 working people in the EU-27. Older people were more likely to have a fatal accident: 3.6 deaths per 100 000 working people among those aged 55-64
years and 5.1 deaths per 100 000 working people among those aged 65 years or more (see Figure 4.17). It should be noted that the likelihood of an accident at work, whether fatal or not, is strongly related to the nature of the work. Some economic activities have higher fatal accident rates than others and, as noted earlier, the older workforce tends to be concentrated in certain activities, particularly agriculture which has one of the highest rates in the EU-27 for fatal accidents at work.
Figure 4.17: Number of accidents at work, by type of accident and age class, 2017(per 100 000 working people)
0
500
1 000
1 500
2 000
2 500
3 000
3 500
4 000
EU-2
7
Port
ugal
Fran
ceSp
ain
Luxe
mbo
urg
Aus
tria
Ger
man
yBe
lgiu
mFi
nlan
dSl
oven
iaD
enm
ark
Italy
Net
herla
nds
Irela
ndM
alta
Esto
nia
Croa
tiaCz
echi
aSw
eden
Cypr
usH
unga
rySl
ovak
iaPo
land
Lith
uani
aLa
tvia
Gre
ece
Rom
ania
Bulg
aria
Uni
ted
King
dom
Switz
erla
ndN
orw
ay
Non-fatal accidents
0
15
30
45
60
75
90
EU-2
7
Port
ugal
Fran
ceSp
ain
Luxe
mbo
urg
Aus
tria
Ger
man
yBe
lgiu
mFi
nlan
dSl
oven
iaD
enm
ark
Italy
Net
herla
nds
Irela
ndM
alta
Esto
nia
Croa
tiaCz
echi
aSw
eden
Cypr
usH
unga
rySl
ovak
iaPo
land
Lith
uani
aLa
tvia
Gre
ece
Rom
ania
Bulg
aria
Uni
ted
King
dom
Switz
erla
ndN
orw
ay
≥65 years 55-64 years ≥18 years
Fatal accidents
Note: the figure is ranked on the ratio of non-fatal accidents at work per 100 000 inhabitants among persons aged ≥18 years. An accident at work is a discrete occurrence during the course of work which leads to physical or mental harm resulting in the victim spending at least four days absent from work. A fatal accident at work is defined as an accident which leads to the death of a victim within one year of the accident. The figure covers NACE Section A and Sections C-N. The scales used for the y-axes are different.
Source: Eurostat (online data code: hsw_mi01)
4 Working and moving into retirement
Ageing Europe — looking at the lives of older people in the EU — 2020 edition110
Older people moving into retirementMost people in work will at some point start to think about their retirement. While early retirement might sound like a good idea, it is likely that an early exit from the labour force will have consequences for future income. Phased retirements promote a flexible transition into retirement, while retaining some of the financial and social benefits of working.
Table 4.1 provides information on statutory pension ages across EU Member States; the pensionable age was frequently found to be higher for men than women. In 2020, the lowest statutory pension age was 60 years in Austria and Poland (for women only), while the highest was 67 years in Greece (for both men and women). Table 4.1 also provides a subjective indication as to the age when people would ideally continue working and until what age they thought they could continue to do their current job; this information refers to a survey carried out during February-September 2015. Contrary to the general pattern observed for
a majority of EU Member States, women in the Netherlands and Finland wanted to work until a later age than men.
Almost one third of older people who continued to work while receiving a pension did so for non-financial reasons
While some people frequently dream of their last day at work before being able to retire, others who already receive a pension continue working; note, this could be a survivors’ pension (due to the death of a spouse). In 2012, more than one third (37.5 %) of people aged 50-69 years in the EU-28 who received a pension but continued working did so in order to have sufficient income; a further 14.6 % did so to have sufficient income and to establish/increase their future pension entitlements and 6.8 % did so uniquely to establish/increase their future pension entitlements (see Figure 4.17). As such, almost three tenths (29.2 %) of people in the EU-28 who received a pension and continued to work cited non-financial reasons for continuing to work (for example, job satisfaction).
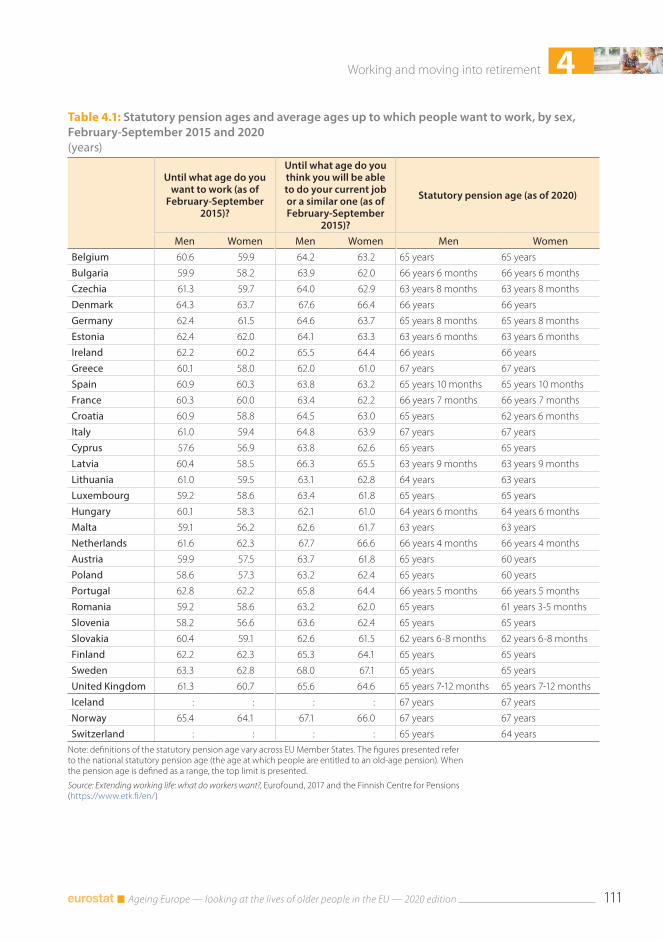
4Working and moving into retirement
Ageing Europe — looking at the lives of older people in the EU — 2020 edition 111
Table 4.1: Statutory pension ages and average ages up to which people want to work, by sex, February-September 2015 and 2020(years)
Until what age do you want to work (as of
February-September 2015)?
Until what age do you think you will be able to do your current job or a similar one (as of February-September
2015)?
Statutory pension age (as of 2020)
Men Women Men Women Men WomenBelgium 60.6 59.9 64.2 63.2 65 years 65 years
Bulgaria 59.9 58.2 63.9 62.0 66 years 6 months 66 years 6 months
Czechia 61.3 59.7 64.0 62.9 63 years 8 months 63 years 8 months
Denmark 64.3 63.7 67.6 66.4 66 years 66 years
Germany 62.4 61.5 64.6 63.7 65 years 8 months 65 years 8 months
Estonia 62.4 62.0 64.1 63.3 63 years 6 months 63 years 6 months
Ireland 62.2 60.2 65.5 64.4 66 years 66 years
Greece 60.1 58.0 62.0 61.0 67 years 67 years
Spain 60.9 60.3 63.8 63.2 65 years 10 months 65 years 10 months
France 60.3 60.0 63.4 62.2 66 years 7 months 66 years 7 months
Croatia 60.9 58.8 64.5 63.0 65 years 62 years 6 months
Italy 61.0 59.4 64.8 63.9 67 years 67 years
Cyprus 57.6 56.9 63.8 62.6 65 years 65 years
Latvia 60.4 58.5 66.3 65.5 63 years 9 months 63 years 9 months
Lithuania 61.0 59.5 63.1 62.8 64 years 63 years
Luxembourg 59.2 58.6 63.4 61.8 65 years 65 years
Hungary 60.1 58.3 62.1 61.0 64 years 6 months 64 years 6 months
Malta 59.1 56.2 62.6 61.7 63 years 63 years
Netherlands 61.6 62.3 67.7 66.6 66 years 4 months 66 years 4 months
Austria 59.9 57.5 63.7 61.8 65 years 60 years
Poland 58.6 57.3 63.2 62.4 65 years 60 years
Portugal 62.8 62.2 65.8 64.4 66 years 5 months 66 years 5 months
Romania 59.2 58.6 63.2 62.0 65 years 61 years 3-5 months
Slovenia 58.2 56.6 63.6 62.4 65 years 65 years
Slovakia 60.4 59.1 62.6 61.5 62 years 6-8 months 62 years 6-8 months
Finland 62.2 62.3 65.3 64.1 65 years 65 years
Sweden 63.3 62.8 68.0 67.1 65 years 65 years
United Kingdom 61.3 60.7 65.6 64.6 65 years 7-12 months 65 years 7-12 months
Iceland : : : : 67 years 67 years
Norway 65.4 64.1 67.1 66.0 67 years 67 years
Switzerland : : : : 65 years 64 years
Note: definitions of the statutory pension age vary across EU Member States. The figures presented refer to the national statutory pension age (the age at which people are entitled to an old-age pension). When the pension age is defined as a range, the top limit is presented.
Source: Extending working life: what do workers want?, Eurofound, 2017 and the Finnish Centre for Pensions (https://www.etk.fi/en/)
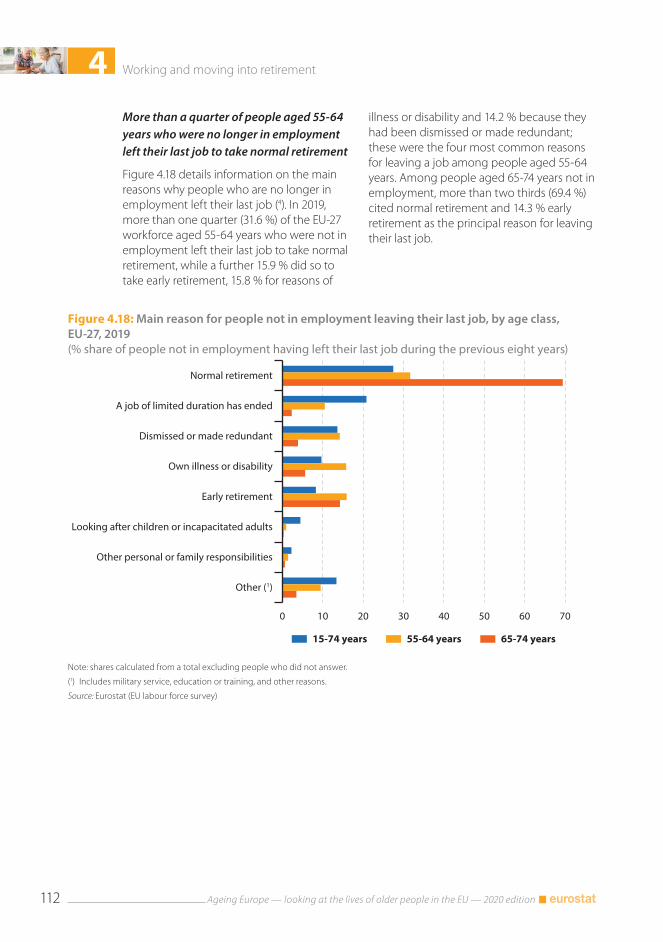
4 Working and moving into retirement
Ageing Europe — looking at the lives of older people in the EU — 2020 edition112
Figure 4.18: Main reason for people not in employment leaving their last job, by age class, EU-27, 2019(% share of people not in employment having left their last job during the previous eight years)
0 10 20 30 40 50 60 70
Normal retirement
A job of limited duration has ended
Dismissed or made redundant
Own illness or disability
Early retirement
Looking after children or incapacitated adults
Other personal or family responsibilities
Other (1)
15-74 years 55-64 years 65-74 years
Note: shares calculated from a total excluding people who did not answer.
(1) Includes military service, education or training, and other reasons.
Source: Eurostat (EU labour force survey)
More than a quarter of people aged 55-64 years who were no longer in employment left their last job to take normal retirement
Figure 4.18 details information on the main reasons why people who are no longer in employment left their last job (4). In 2019, more than one quarter (31.6 %) of the EU-27 workforce aged 55-64 years who were not in employment left their last job to take normal retirement, while a further 15.9 % did so to take early retirement, 15.8 % for reasons of
illness or disability and 14.2 % because they had been dismissed or made redundant; these were the four most common reasons for leaving a job among people aged 55-64 years. Among people aged 65-74 years not in employment, more than two thirds (69.4 %) cited normal retirement and 14.3 % early retirement as the principal reason for leaving their last job.
5 Pensions, income and expenditure
5 Pensions, income and expenditure
Ageing Europe — looking at the lives of older people in the EU — 2020 edition114
Demographic developments in the EU have stimulated considerable levels of debate around the economic implications of an ageing population. Two of the principal concerns of policymakers within this area concern:
• expenditure on pensions — which is expected to rise in both absolute terms and as a share of gross domestic product (GDP);
• pension adequacy — in other words, how current and future pensions may help prevent old-age poverty and maintain the income of older people for the duration of their retirement.
PensionsThe transition for individuals from work to retirement leads to a change in their source of livelihood, moving from paid income to a pension/retirement fund. Some older people slowly transition from one state to the other, by seeking to reduce their working hours gradually: in some cases they may remain in the workforce for longer than they really wish to because they fear not having enough money if they live to be very old. Other older people are unable or unwilling to carry on working (at least on a full-time basis), for example, because of an illness/disability or due to the provision of care to somebody else. Chapter 4 provides more information on the transition from work into retirement. However, it is common for older people to move directly from full-time work into retirement. Once retired, pensions provide older people with an income and thereby play a part in protecting them from poverty; they are the principal source of income for close to one quarter of the population in the EU-27.
It is projected that the number of pension beneficiaries will increase as the number of pension contributors declines
Population ageing has already resulted in a gradual increase in the number and share of
pensioners relative to the total population and this pattern is set to continue in the coming decades. In 2017, almost one quarter (23.5 %) of the total EU-27 population was a beneficiary of an old-age and/or survivors’ pension (a pension paid on death of a spouse to the surviving partner, as long as they remain single).
There were 11 EU Member States where at least one quarter of the total population was a beneficiary of a pension in 2017, with a peak of 30.0 % in Slovenia. At the other end of the range, pension beneficiaries accounted for less than one fifth of the total population in five Member States, with the lowest shares in Ireland (16.1 %), Cyprus and Malta (both 17.6 %).
Between 2008 and 2017, the share of pension beneficiaries in the total population rose across the vast majority of EU Member States; the only exceptions were Hungary and Italy. A falling share of pension beneficiaries could reflect a relatively high level of overall population growth, or might result from a change in pensions’ criteria leading to a lower number of beneficiaries.
The second half of Figure 5.1 shows that in 2017 the number of pension beneficiaries (for old-age and/or survivors’ pensions) was higher than the total number of people aged 65 years or more in all but three of the EU Member States; the exceptions were Belgium, Spain and Malta. This apparent anomaly is because recipients may start to receive a pension before the age of 65, for example, because they took early retirement, or alternatively because survivors’ pensions may be paid to descendants and/or spouses aged less than 65 years. Between 2008 and 2017, the ratio of pension beneficiaries receiving an old-age and/or survivors’ pension relative to the total number of people aged 65 years or more fell in all but five of the EU Member States; the exceptions were Ireland, Lithuania, Cyprus, Croatia and Luxembourg (note there is a break in series). This general decline in the coverage of pensions may in part reflect the introduction of pension reforms.
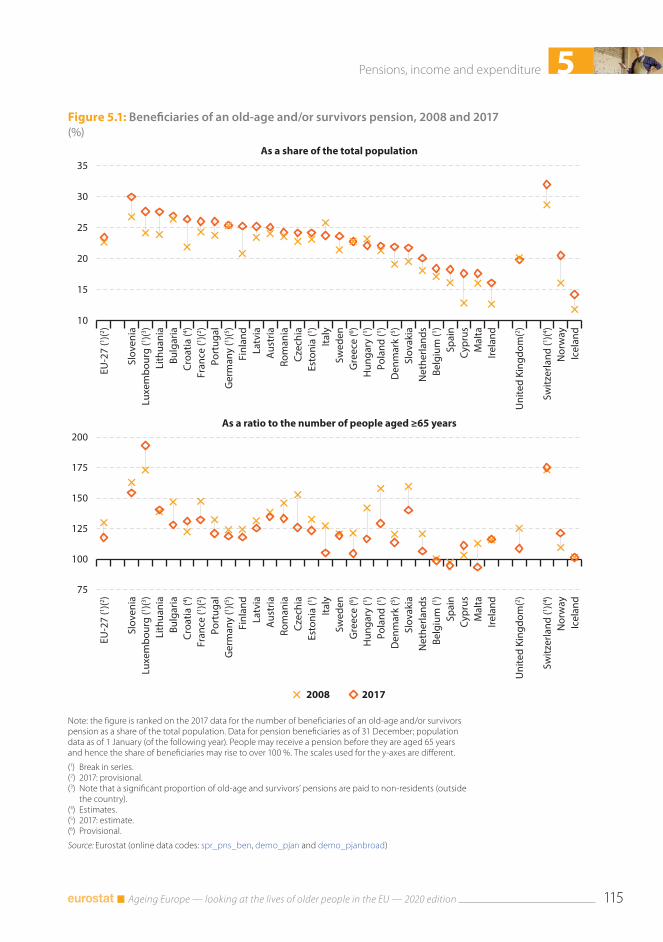
5Pensions, income and expenditure
Ageing Europe — looking at the lives of older people in the EU — 2020 edition 115
Figure 5.1: Beneficiaries of an old-age and/or survivors pension, 2008 and 2017(%)
10
15
20
25
30
35
EU-2
7 (1 )(2 )
Slov
enia
Luxe
mbo
urg
(1 )(3 )Li
thua
nia
Bulg
aria
Croa
tia (4 )
Fran
ce (1 )(2 )
Port
ugal
Ger
man
y (1 )(5 )
Finl
and
Latv
iaA
ustr
iaRo
man
iaCz
echi
aEs
toni
a (1 )
Italy
Swed
enG
reec
e (6 )
Hun
gary
(1 )Po
land
(1 )D
enm
ark
(5 )Sl
ovak
iaN
ethe
rland
sBe
lgiu
m (1 )
Spai
nCy
prus
Mal
taIre
land
Uni
ted
King
dom
(2 )
Switz
erla
nd (1 )(4 )
Nor
way
Icel
and
As a share of the total population
75
100
125
150
175
200
EU-2
7 (1 )(2 )
Slov
enia
Luxe
mbo
urg
(1 )(3 )Li
thua
nia
Bulg
aria
Croa
tia (4 )
Fran
ce (1 )(2 )
Port
ugal
Ger
man
y (1 )(5 )
Finl
and
Latv
iaA
ustr
iaRo
man
iaCz
echi
aEs
toni
a (1 )
Italy
Swed
enG
reec
e (6 )
Hun
gary
(1 )Po
land
(1 )D
enm
ark
(5 )Sl
ovak
iaN
ethe
rland
sBe
lgiu
m (1 )
Spai
nCy
prus
Mal
taIre
land
Uni
ted
King
dom
(2 )
Switz
erla
nd (1 )(4 )
Nor
way
Icel
and
2008 2017
As a ratio to the number of people aged ≥65 years
Note: the figure is ranked on the 2017 data for the number of beneficiaries of an old-age and/or survivors pension as a share of the total population. Data for pension beneficiaries as of 31 December; population data as of 1 January (of the following year). People may receive a pension before they are aged 65 years and hence the share of beneficiaries may rise to over 100 %. The scales used for the y-axes are different.
(1) Break in series.(2) 2017: provisional.(3) Note that a significant proportion of old-age and survivors’ pensions are paid to non-residents (outside
the country).(4) Estimates.(5) 2017: estimate.(6) Provisional.
Source: Eurostat (online data codes: spr_pns_ben, demo_pjan and demo_pjanbroad)
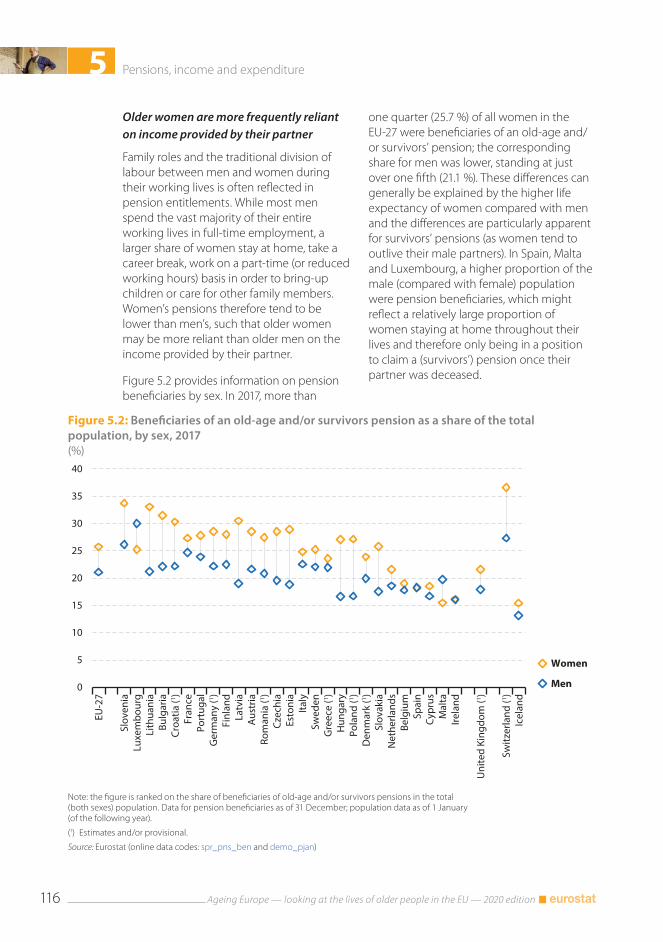
5 Pensions, income and expenditure
Ageing Europe — looking at the lives of older people in the EU — 2020 edition116
Figure 5.2: Beneficiaries of an old-age and/or survivors pension as a share of the total population, by sex, 2017(%)
0
5
10
15
20
25
30
35
40
EU-2
7
Slov
enia
Luxe
mbo
urg
Lith
uani
aBu
lgar
iaCr
oatia
(1 )Fr
ance
Port
ugal
Ger
man
y (1 )
Finl
and
Latv
iaA
ustr
iaRo
man
ia (1 )
Czec
hia
Esto
nia
Italy
Swed
enG
reec
e (1 )
Hun
gary
Pola
nd (1 )
Den
mar
k (1 )
Slov
akia
Net
herla
nds
Belg
ium
Spai
nCy
prus
Mal
taIre
land
Uni
ted
King
dom
(1 )
Switz
erla
nd (1 )
Icel
and
Women
Men
Note: the figure is ranked on the share of beneficiaries of old-age and/or survivors pensions in the total (both sexes) population. Data for pension beneficiaries as of 31 December; population data as of 1 January (of the following year).
(1) Estimates and/or provisional.
Source: Eurostat (online data codes: spr_pns_ben and demo_pjan)
Older women are more frequently reliant on income provided by their partner
Family roles and the traditional division of labour between men and women during their working lives is often reflected in pension entitlements. While most men spend the vast majority of their entire working lives in full-time employment, a larger share of women stay at home, take a career break, work on a part-time (or reduced working hours) basis in order to bring-up children or care for other family members. Women’s pensions therefore tend to be lower than men’s, such that older women may be more reliant than older men on the income provided by their partner.
Figure 5.2 provides information on pension beneficiaries by sex. In 2017, more than
one quarter (25.7 %) of all women in the EU-27 were beneficiaries of an old-age and/or survivors’ pension; the corresponding share for men was lower, standing at just over one fifth (21.1 %). These differences can generally be explained by the higher life expectancy of women compared with men and the differences are particularly apparent for survivors’ pensions (as women tend to outlive their male partners). In Spain, Malta and Luxembourg, a higher proportion of the male (compared with female) population were pension beneficiaries, which might reflect a relatively large proportion of women staying at home throughout their lives and therefore only being in a position to claim a (survivors’) pension once their partner was deceased.
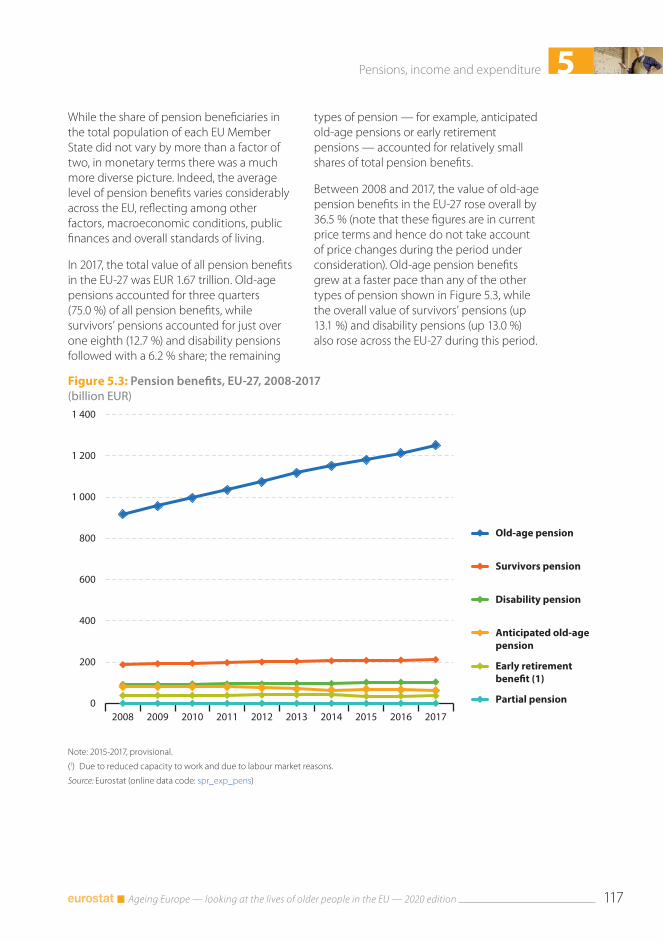
5Pensions, income and expenditure
Ageing Europe — looking at the lives of older people in the EU — 2020 edition 117
Figure 5.3: Pension benefits, EU-27, 2008-2017(billion EUR)
0
200
400
600
800
1 000
1 200
1 400
2008 2009 2010 2011 2012 2013 2014 2015 2016 2017
Old-age pension
Survivors pension
Disability pension
Anticipated old-agepension
Early retirementbene�t (1)
Partial pension
Note: 2015-2017, provisional.
(1) Due to reduced capacity to work and due to labour market reasons.
Source: Eurostat (online data code: spr_exp_pens)
While the share of pension beneficiaries in the total population of each EU Member State did not vary by more than a factor of two, in monetary terms there was a much more diverse picture. Indeed, the average level of pension benefits varies considerably across the EU, reflecting among other factors, macroeconomic conditions, public finances and overall standards of living.
In 2017, the total value of all pension benefits in the EU-27 was EUR 1.67 trillion. Old-age pensions accounted for three quarters (75.0 %) of all pension benefits, while survivors’ pensions accounted for just over one eighth (12.7 %) and disability pensions followed with a 6.2 % share; the remaining
types of pension — for example, anticipated old-age pensions or early retirement pensions — accounted for relatively small shares of total pension benefits.
Between 2008 and 2017, the value of old-age pension benefits in the EU-27 rose overall by 36.5 % (note that these figures are in current price terms and hence do not take account of price changes during the period under consideration). Old-age pension benefits grew at a faster pace than any of the other types of pension shown in Figure 5.3, while the overall value of survivors’ pensions (up 13.1 %) and disability pensions (up 13.0 %) also rose across the EU-27 during this period.
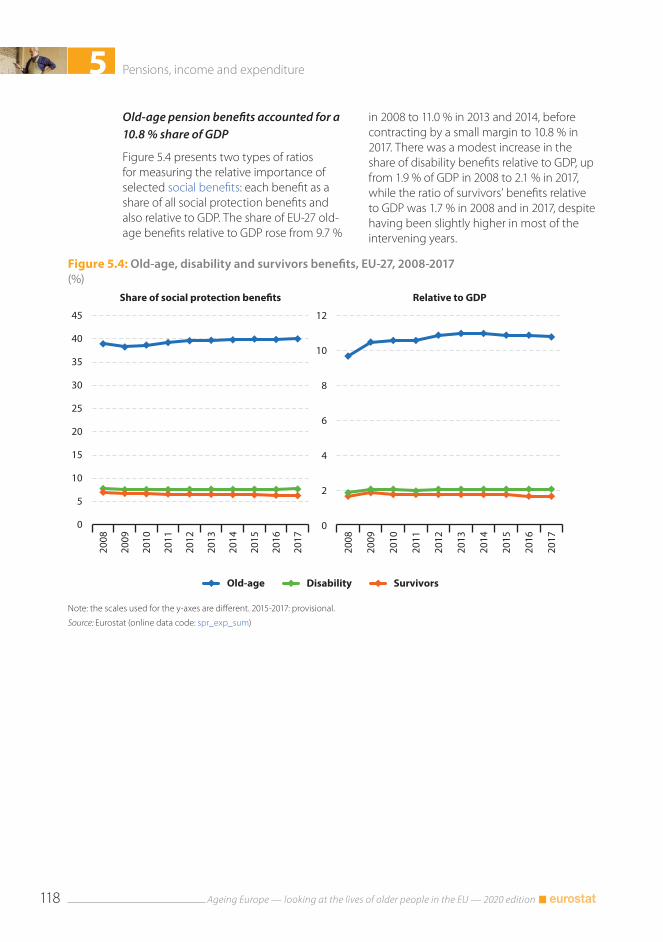
5 Pensions, income and expenditure
Ageing Europe — looking at the lives of older people in the EU — 2020 edition118
Figure 5.4: Old-age, disability and survivors benefits, EU-27, 2008-2017(%)
0
5
10
15
20
25
30
35
40
45
2008
2009
2010
2011
2012
2013
2014
2015
2016
2017
Old-age Disability Survivors
Share of social protection bene�ts
0
2
4
6
8
10
12
2008
2009
2010
2011
2012
2013
2014
2015
2016
2017
Relative to GDP
Note: the scales used for the y-axes are different. 2015-2017: provisional.
Source: Eurostat (online data code: spr_exp_sum)
Old-age pension benefits accounted for a 10.8 % share of GDP
Figure 5.4 presents two types of ratios for measuring the relative importance of selected social benefits: each benefit as a share of all social protection benefits and also relative to GDP. The share of EU-27 old-age benefits relative to GDP rose from 9.7 %
in 2008 to 11.0 % in 2013 and 2014, before contracting by a small margin to 10.8 % in 2017. There was a modest increase in the share of disability benefits relative to GDP, up from 1.9 % of GDP in 2008 to 2.1 % in 2017, while the ratio of survivors’ benefits relative to GDP was 1.7 % in 2008 and in 2017, despite having been slightly higher in most of the intervening years.
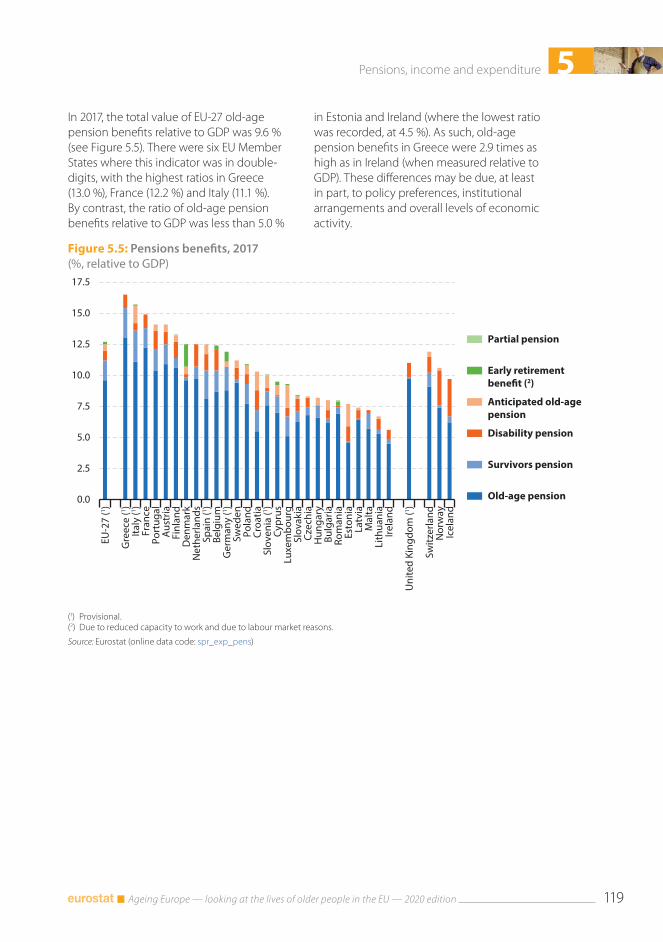
5Pensions, income and expenditure
Ageing Europe — looking at the lives of older people in the EU — 2020 edition 119
Figure 5.5: Pensions benefits, 2017(%, relative to GDP)
0.0
2.5
5.0
7.5
10.0
12.5
15.0
17.5
EU-2
7 (1 )
Gre
ece
(1 )Ita
ly (1 )
Fran
cePo
rtug
alA
ustr
iaFi
nlan
dD
enm
ark
Net
herla
nds
Spai
n (1 )
Belg
ium
Ger
man
y (1 )
Swed
enPo
land
Croa
tiaSl
oven
ia (1 )
Cypr
usLu
xem
bour
gSl
ovak
iaCz
echi
aH
unga
ryBu
lgar
iaRo
man
iaEs
toni
aLa
tvia
Mal
taLi
thua
nia
Irela
nd
Uni
ted
King
dom
(1 )
Switz
erla
ndN
orw
ayIc
elan
d
Partial pension
Early retirementbene�t (2)
Anticipated old-agepension
Disability pension
Survivors pension
Old-age pension
(1) Provisional.(2) Due to reduced capacity to work and due to labour market reasons.
Source: Eurostat (online data code: spr_exp_pens)
In 2017, the total value of EU-27 old-age pension benefits relative to GDP was 9.6 % (see Figure 5.5). There were six EU Member States where this indicator was in double-digits, with the highest ratios in Greece (13.0 %), France (12.2 %) and Italy (11.1 %). By contrast, the ratio of old-age pension benefits relative to GDP was less than 5.0 %
in Estonia and Ireland (where the lowest ratio was recorded, at 4.5 %). As such, old-age pension benefits in Greece were 2.9 times as high as in Ireland (when measured relative to GDP). These differences may be due, at least in part, to policy preferences, institutional arrangements and overall levels of economic activity.
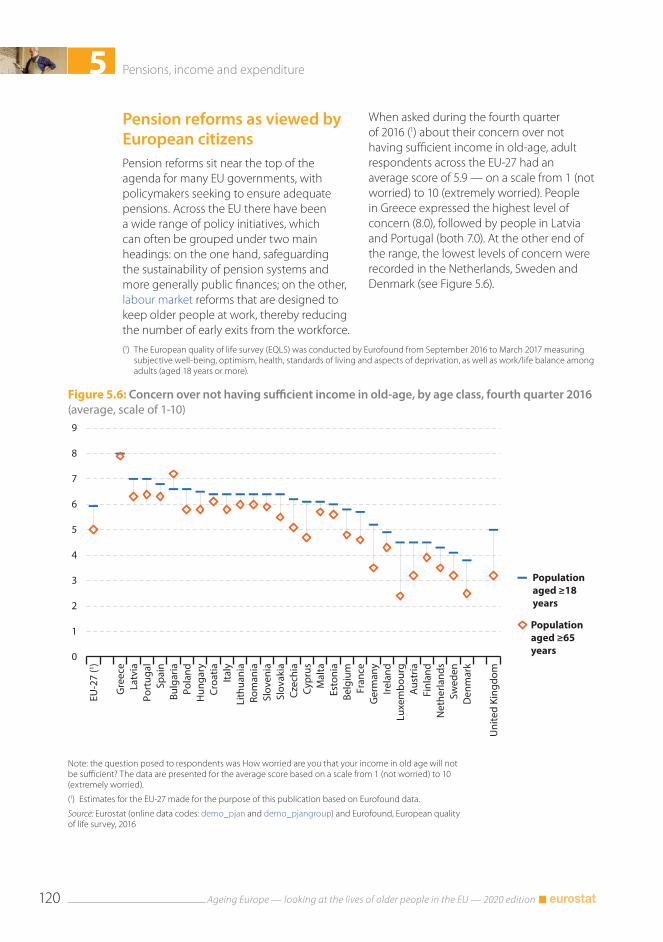
5 Pensions, income and expenditure
Ageing Europe — looking at the lives of older people in the EU — 2020 edition120
Figure 5.6: Concern over not having sufficient income in old-age, by age class, fourth quarter 2016(average, scale of 1-10)
0
1
2
3
4
5
6
7
8
9
EU-2
7 (1 )
Gre
ece
Latv
iaPo
rtug
alSp
ain
Bulg
aria
Pola
ndH
unga
ryCr
oatia
Italy
Lith
uani
aRo
man
iaSl
oven
iaSl
ovak
iaCz
echi
aCy
prus
Mal
taEs
toni
aBe
lgiu
mFr
ance
Ger
man
yIre
land
Luxe
mbo
urg
Aus
tria
Finl
and
Net
herla
nds
Swed
enD
enm
ark
Uni
ted
King
dom
Population aged ≥18 years
Population aged ≥65 years
Note: the question posed to respondents was How worried are you that your income in old age will not be sufficient? The data are presented for the average score based on a scale from 1 (not worried) to 10 (extremely worried).
(1) Estimates for the EU-27 made for the purpose of this publication based on Eurofound data.
Source: Eurostat (online data codes: demo_pjan and demo_pjangroup) and Eurofound, European quality of life survey, 2016
Pension reforms as viewed by European citizensPension reforms sit near the top of the agenda for many EU governments, with policymakers seeking to ensure adequate pensions. Across the EU there have been a wide range of policy initiatives, which can often be grouped under two main headings: on the one hand, safeguarding the sustainability of pension systems and more generally public finances; on the other, labour market reforms that are designed to keep older people at work, thereby reducing the number of early exits from the workforce.
(1) The European quality of life survey (EQLS) was conducted by Eurofound from September 2016 to March 2017 measuring subjective well-being, optimism, health, standards of living and aspects of deprivation, as well as work/life balance among adults (aged 18 years or more).
When asked during the fourth quarter of 2016 (1) about their concern over not having sufficient income in old-age, adult respondents across the EU-27 had an average score of 5.9 — on a scale from 1 (not worried) to 10 (extremely worried). People in Greece expressed the highest level of concern (8.0), followed by people in Latvia and Portugal (both 7.0). At the other end of the range, the lowest levels of concern were recorded in the Netherlands, Sweden and Denmark (see Figure 5.6).
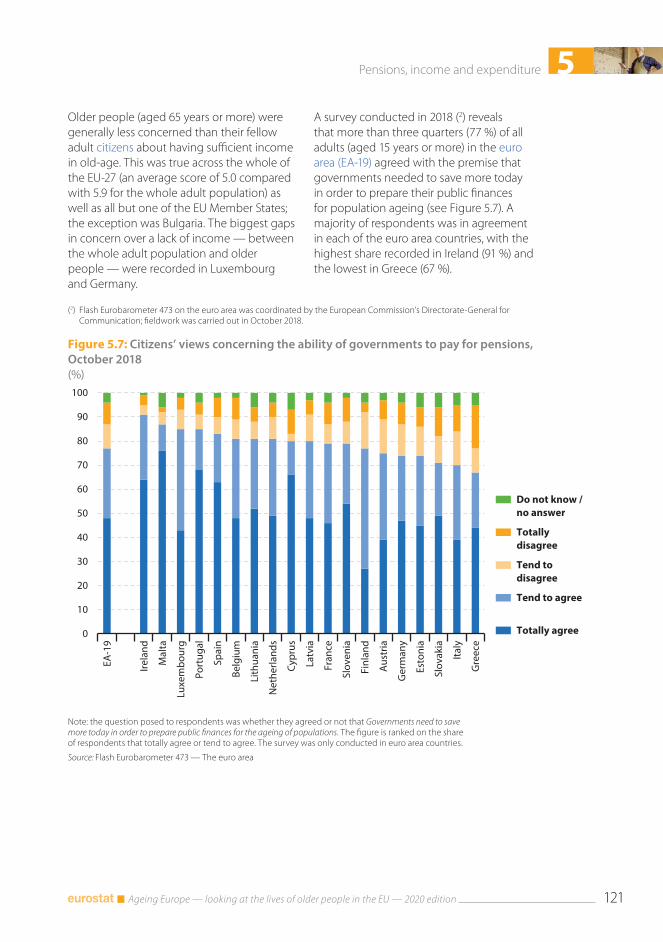
5Pensions, income and expenditure
Ageing Europe — looking at the lives of older people in the EU — 2020 edition 121
Figure 5.7: Citizens’ views concerning the ability of governments to pay for pensions, October 2018(%)
0
10
20
30
40
50
60
70
80
90
100
EA-1
9
Irela
nd
Mal
ta
Luxe
mbo
urg
Port
ugal
Spai
n
Belg
ium
Lith
uani
a
Net
herla
nds
Cypr
us
Latv
ia
Fran
ce
Slov
enia
Finl
and
Aus
tria
Ger
man
y
Esto
nia
Slov
akia
Italy
Gre
ece
Do not know /no answer
Totallydisagree
Tend todisagree
Tend to agree
Totally agree
Note: the question posed to respondents was whether they agreed or not that Governments need to save more today in order to prepare public finances for the ageing of populations. The figure is ranked on the share of respondents that totally agree or tend to agree. The survey was only conducted in euro area countries.
Source: Flash Eurobarometer 473 — The euro area
Older people (aged 65 years or more) were generally less concerned than their fellow adult citizens about having sufficient income in old-age. This was true across the whole of the EU-27 (an average score of 5.0 compared with 5.9 for the whole adult population) as well as all but one of the EU Member States; the exception was Bulgaria. The biggest gaps in concern over a lack of income — between the whole adult population and older people — were recorded in Luxembourg and Germany.
(2) Flash Eurobarometer 473 on the euro area was coordinated by the European Commission’s Directorate-General for Communication; fieldwork was carried out in October 2018.
A survey conducted in 2018 (2) reveals that more than three quarters (77 %) of all adults (aged 15 years or more) in the euro area (EA-19) agreed with the premise that governments needed to save more today in order to prepare their public finances for population ageing (see Figure 5.7). A majority of respondents was in agreement in each of the euro area countries, with the highest share recorded in Ireland (91 %) and the lowest in Greece (67 %).
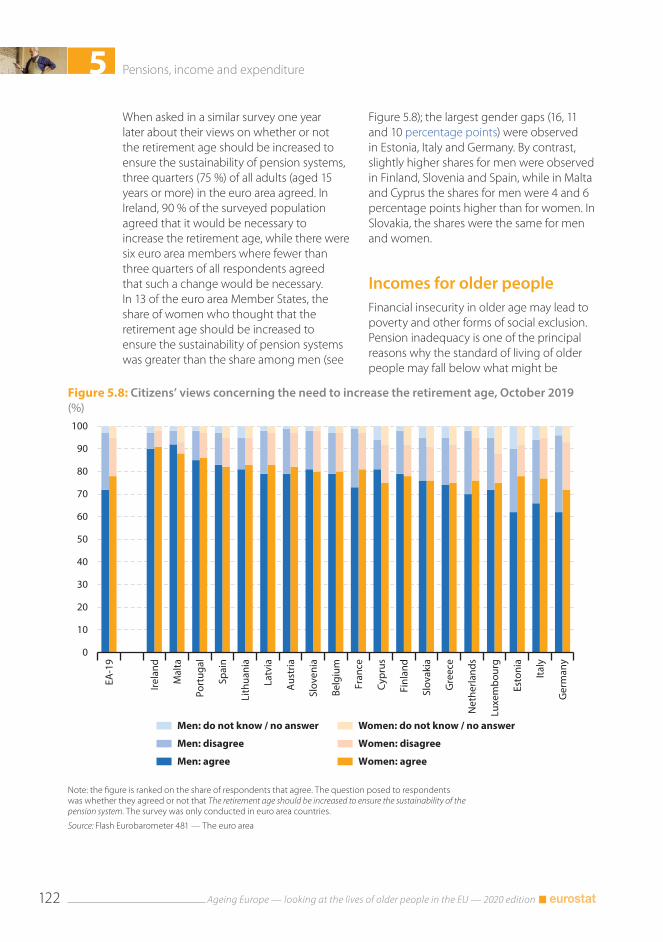
5 Pensions, income and expenditure
Ageing Europe — looking at the lives of older people in the EU — 2020 edition122
Figure 5.8: Citizens’ views concerning the need to increase the retirement age, October 2019(%)
EA-1
9
Irela
nd
Mal
ta
Port
ugal
Spai
n
Lith
uani
a
Latv
ia
Aus
tria
Slov
enia
Belg
ium
Fran
ce
Cypr
us
Finl
and
Slov
akia
Gre
ece
Net
herla
nds
Luxe
mbo
urg
Esto
nia
Italy
Ger
man
y
0
10
20
30
40
50
60
70
80
90
100
Men: do not know / no answer
Men: disagree
Men: agree
Women: do not know / no answer
Women: disagree
Women: agree
Note: the figure is ranked on the share of respondents that agree. The question posed to respondents was whether they agreed or not that The retirement age should be increased to ensure the sustainability of the pension system. The survey was only conducted in euro area countries.
Source: Flash Eurobarometer 481 — The euro area
When asked in a similar survey one year later about their views on whether or not the retirement age should be increased to ensure the sustainability of pension systems, three quarters (75 %) of all adults (aged 15 years or more) in the euro area agreed. In Ireland, 90 % of the surveyed population agreed that it would be necessary to increase the retirement age, while there were six euro area members where fewer than three quarters of all respondents agreed that such a change would be necessary. In 13 of the euro area Member States, the share of women who thought that the retirement age should be increased to ensure the sustainability of pension systems was greater than the share among men (see
Figure 5.8); the largest gender gaps (16, 11 and 10 percentage points) were observed in Estonia, Italy and Germany. By contrast, slightly higher shares for men were observed in Finland, Slovenia and Spain, while in Malta and Cyprus the shares for men were 4 and 6 percentage points higher than for women. In Slovakia, the shares were the same for men and women.
Incomes for older peopleFinancial insecurity in older age may lead to poverty and other forms of social exclusion. Pension inadequacy is one of the principal reasons why the standard of living of older people may fall below what might be
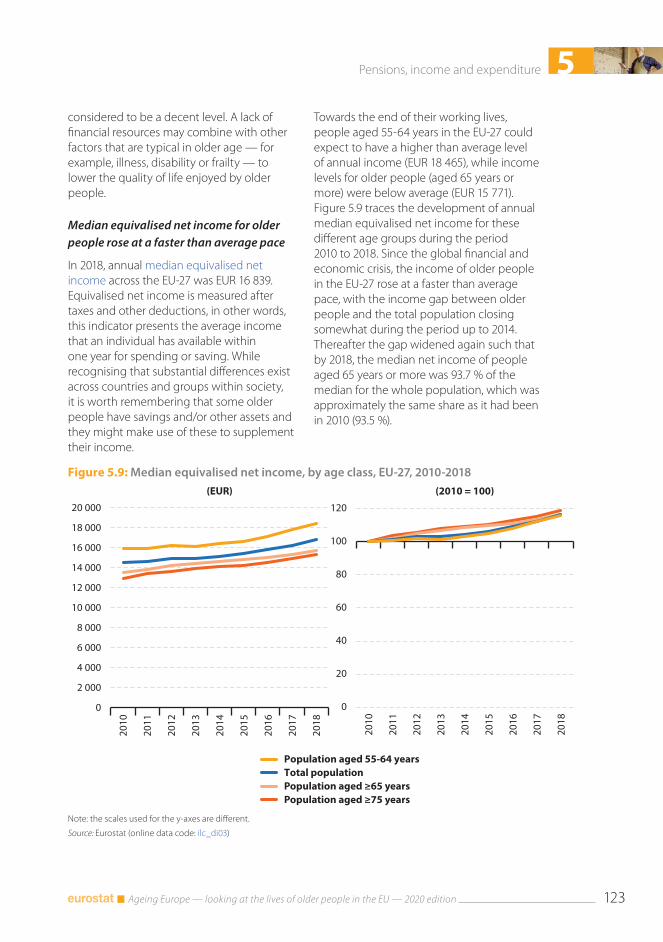
5Pensions, income and expenditure
Ageing Europe — looking at the lives of older people in the EU — 2020 edition 123
Figure 5.9: Median equivalised net income, by age class, EU-27, 2010-2018
0
2 000
4 000
6 000
8 000
10 000
12 000
14 000
16 000
18 000
20 000
2010
2011
2012
2013
2014
2015
2016
2017
2018
Population aged 55-64 yearsTotal populationPopulation aged ≥65 yearsPopulation aged ≥75 years
(EUR)
0
20
40
60
80
100
120
2010
2011
2012
2013
2014
2015
2016
2017
2018
(2010 = 100)
Note: the scales used for the y-axes are different.
Source: Eurostat (online data code: ilc_di03)
considered to be a decent level. A lack of financial resources may combine with other factors that are typical in older age — for example, illness, disability or frailty — to lower the quality of life enjoyed by older people.
Median equivalised net income for older people rose at a faster than average pace
In 2018, annual median equivalised net income across the EU-27 was EUR 16 839. Equivalised net income is measured after taxes and other deductions, in other words, this indicator presents the average income that an individual has available within one year for spending or saving. While recognising that substantial differences exist across countries and groups within society, it is worth remembering that some older people have savings and/or other assets and they might make use of these to supplement their income.
Towards the end of their working lives, people aged 55-64 years in the EU-27 could expect to have a higher than average level of annual income (EUR 18 465), while income levels for older people (aged 65 years or more) were below average (EUR 15 771). Figure 5.9 traces the development of annual median equivalised net income for these different age groups during the period 2010 to 2018. Since the global financial and economic crisis, the income of older people in the EU-27 rose at a faster than average pace, with the income gap between older people and the total population closing somewhat during the period up to 2014. Thereafter the gap widened again such that by 2018, the median net income of people aged 65 years or more was 93.7 % of the median for the whole population, which was approximately the same share as it had been in 2010 (93.5 %).
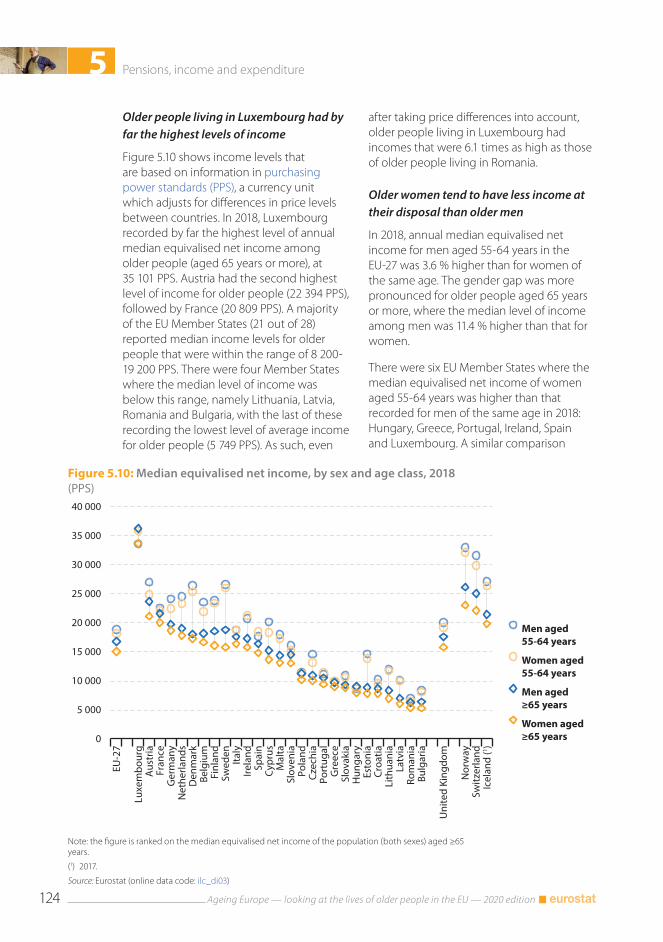
5 Pensions, income and expenditure
Ageing Europe — looking at the lives of older people in the EU — 2020 edition124
Figure 5.10: Median equivalised net income, by sex and age class, 2018(PPS)
0
5 000
10 000
15 000
20 000
25 000
30 000
35 000
40 000
EU-2
7
Luxe
mbo
urg
Aus
tria
Fran
ceG
erm
any
Net
herla
nds
Den
mar
kBe
lgiu
mFi
nlan
dSw
eden
Italy
Irela
ndSp
ain
Cypr
usM
alta
Slov
enia
Pola
ndCz
echi
aPo
rtug
alG
reec
eSl
ovak
iaH
unga
ryEs
toni
aCr
oatia
Lith
uani
aLa
tvia
Rom
ania
Bulg
aria
Uni
ted
King
dom
Nor
way
Switz
erla
ndIc
elan
d (1 )
Men aged55-64 years
Women aged55-64 years
Men aged≥65 years
Women aged≥65 years
Note: the figure is ranked on the median equivalised net income of the population (both sexes) aged ≥65 years.
(1) 2017.
Source: Eurostat (online data code: ilc_di03)
Older people living in Luxembourg had by far the highest levels of income
Figure 5.10 shows income levels that are based on information in purchasing power standards (PPS), a currency unit which adjusts for differences in price levels between countries. In 2018, Luxembourg recorded by far the highest level of annual median equivalised net income among older people (aged 65 years or more), at 35 101 PPS. Austria had the second highest level of income for older people (22 394 PPS), followed by France (20 809 PPS). A majority of the EU Member States (21 out of 28) reported median income levels for older people that were within the range of 8 200-19 200 PPS. There were four Member States where the median level of income was below this range, namely Lithuania, Latvia, Romania and Bulgaria, with the last of these recording the lowest level of average income for older people (5 749 PPS). As such, even
after taking price differences into account, older people living in Luxembourg had incomes that were 6.1 times as high as those of older people living in Romania.
Older women tend to have less income at their disposal than older men
In 2018, annual median equivalised net income for men aged 55-64 years in the EU-27 was 3.6 % higher than for women of the same age. The gender gap was more pronounced for older people aged 65 years or more, where the median level of income among men was 11.4 % higher than that for women.
There were six EU Member States where the median equivalised net income of women aged 55-64 years was higher than that recorded for men of the same age in 2018: Hungary, Greece, Portugal, Ireland, Spain and Luxembourg. A similar comparison
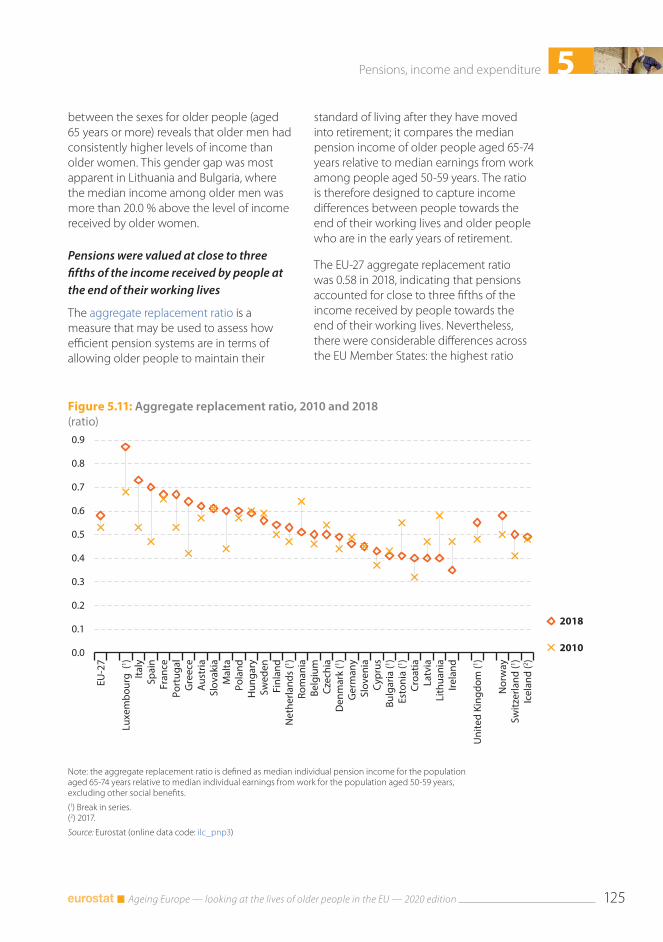
5Pensions, income and expenditure
Ageing Europe — looking at the lives of older people in the EU — 2020 edition 125
Figure 5.11: Aggregate replacement ratio, 2010 and 2018(ratio)
0.0
0.1
0.2
0.3
0.4
0.5
0.6
0.7
0.8
0.9
EU-2
7
Luxe
mbo
urg
(1 )Ita
lySp
ain
Fran
cePo
rtug
alG
reec
eA
ustr
iaSl
ovak
iaM
alta
Pola
ndH
unga
rySw
eden
Finl
and
Net
herla
nds
(1 )Ro
man
iaBe
lgiu
mCz
echi
aD
enm
ark
(1 )G
erm
any
Slov
enia
Cypr
usBu
lgar
ia (1 )
Esto
nia
(1 )Cr
oatia
Latv
iaLi
thua
nia
Irela
nd
Uni
ted
King
dom
(1 )
Nor
way
Switz
erla
nd (1 )
Icel
and
(2 )
2018
2010
Note: the aggregate replacement ratio is defined as median individual pension income for the population aged 65-74 years relative to median individual earnings from work for the population aged 50-59 years, excluding other social benefits.
(1) Break in series.(2) 2017.
Source: Eurostat (online data code: ilc_pnp3)
between the sexes for older people (aged 65 years or more) reveals that older men had consistently higher levels of income than older women. This gender gap was most apparent in Lithuania and Bulgaria, where the median income among older men was more than 20.0 % above the level of income received by older women.
Pensions were valued at close to three fifths of the income received by people at the end of their working lives
The aggregate replacement ratio is a measure that may be used to assess how efficient pension systems are in terms of allowing older people to maintain their
standard of living after they have moved into retirement; it compares the median pension income of older people aged 65-74 years relative to median earnings from work among people aged 50-59 years. The ratio is therefore designed to capture income differences between people towards the end of their working lives and older people who are in the early years of retirement.
The EU-27 aggregate replacement ratio was 0.58 in 2018, indicating that pensions accounted for close to three fifths of the income received by people towards the end of their working lives. Nevertheless, there were considerable differences across the EU Member States: the highest ratio
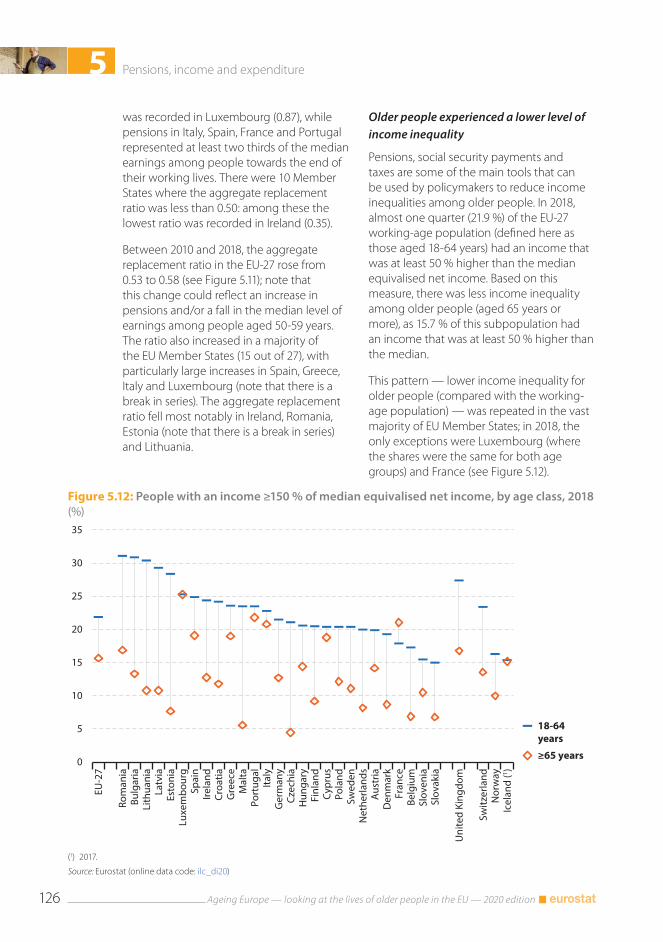
5 Pensions, income and expenditure
Ageing Europe — looking at the lives of older people in the EU — 2020 edition126
Figure 5.12: People with an income ≥150 % of median equivalised net income, by age class, 2018(%)
0
5
10
15
20
25
30
35
EU-2
7
Rom
ania
Bulg
aria
Lith
uani
aLa
tvia
Esto
nia
Luxe
mbo
urg
Spai
nIre
land
Croa
tiaG
reec
eM
alta
Port
ugal
Italy
Ger
man
yCz
echi
aH
unga
ryFi
nlan
dCy
prus
Pola
ndSw
eden
Net
herla
nds
Aus
tria
Den
mar
kFr
ance
Belg
ium
Slov
enia
Slov
akia
Uni
ted
King
dom
Switz
erla
ndN
orw
ayIc
elan
d (1 )
18-64years
≥65 years
(1) 2017.
Source: Eurostat (online data code: ilc_di20)
was recorded in Luxembourg (0.87), while pensions in Italy, Spain, France and Portugal represented at least two thirds of the median earnings among people towards the end of their working lives. There were 10 Member States where the aggregate replacement ratio was less than 0.50: among these the lowest ratio was recorded in Ireland (0.35).
Between 2010 and 2018, the aggregate replacement ratio in the EU-27 rose from 0.53 to 0.58 (see Figure 5.11); note that this change could reflect an increase in pensions and/or a fall in the median level of earnings among people aged 50-59 years. The ratio also increased in a majority of the EU Member States (15 out of 27), with particularly large increases in Spain, Greece, Italy and Luxembourg (note that there is a break in series). The aggregate replacement ratio fell most notably in Ireland, Romania, Estonia (note that there is a break in series) and Lithuania.
Older people experienced a lower level of income inequality
Pensions, social security payments and taxes are some of the main tools that can be used by policymakers to reduce income inequalities among older people. In 2018, almost one quarter (21.9 %) of the EU-27 working-age population (defined here as those aged 18-64 years) had an income that was at least 50 % higher than the median equivalised net income. Based on this measure, there was less income inequality among older people (aged 65 years or more), as 15.7 % of this subpopulation had an income that was at least 50 % higher than the median.
This pattern — lower income inequality for older people (compared with the working-age population) — was repeated in the vast majority of EU Member States; in 2018, the only exceptions were Luxembourg (where the shares were the same for both age groups) and France (see Figure 5.12).
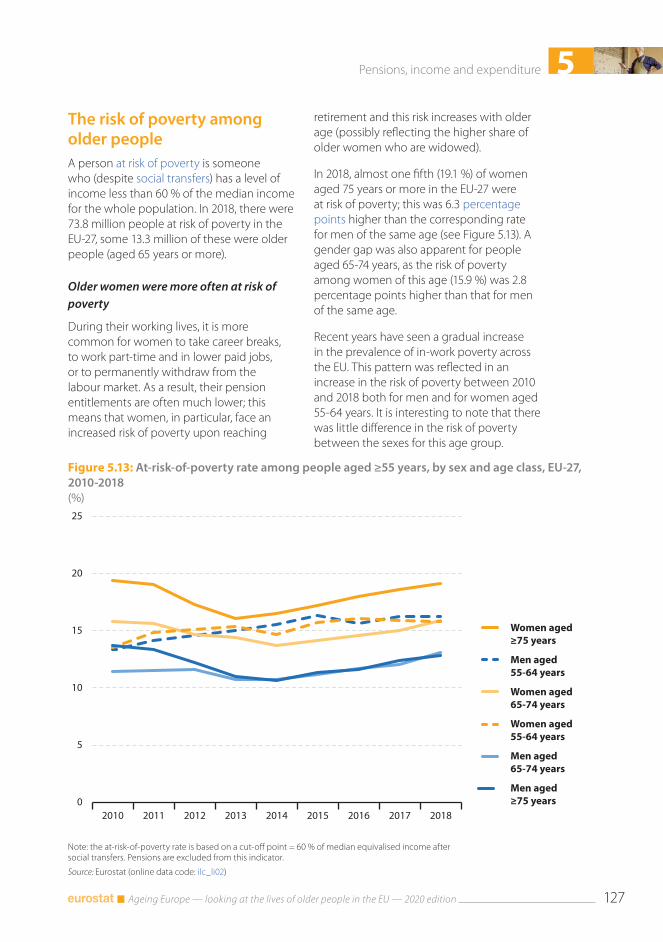
5Pensions, income and expenditure
Ageing Europe — looking at the lives of older people in the EU — 2020 edition 127
Figure 5.13: At-risk-of-poverty rate among people aged ≥55 years, by sex and age class, EU-27, 2010-2018(%)
0
5
10
15
20
25
2010 2011 2012 2013 2014 2015 2016 2017 2018
Women aged≥75 years
Men aged55-64 years
Women aged65-74 years
Women aged55-64 years
Men aged65-74 years
Men aged≥75 years
Note: the at-risk-of-poverty rate is based on a cut-off point = 60 % of median equivalised income after social transfers. Pensions are excluded from this indicator.
Source: Eurostat (online data code: ilc_li02)
The risk of poverty among older peopleA person at risk of poverty is someone who (despite social transfers) has a level of income less than 60 % of the median income for the whole population. In 2018, there were 73.8 million people at risk of poverty in the EU-27, some 13.3 million of these were older people (aged 65 years or more).
Older women were more often at risk of poverty
During their working lives, it is more common for women to take career breaks, to work part-time and in lower paid jobs, or to permanently withdraw from the labour market. As a result, their pension entitlements are often much lower; this means that women, in particular, face an increased risk of poverty upon reaching
retirement and this risk increases with older age (possibly reflecting the higher share of older women who are widowed).
In 2018, almost one fifth (19.1 %) of women aged 75 years or more in the EU-27 were at risk of poverty; this was 6.3 percentage points higher than the corresponding rate for men of the same age (see Figure 5.13). A gender gap was also apparent for people aged 65-74 years, as the risk of poverty among women of this age (15.9 %) was 2.8 percentage points higher than that for men of the same age.
Recent years have seen a gradual increase in the prevalence of in-work poverty across the EU. This pattern was reflected in an increase in the risk of poverty between 2010 and 2018 both for men and for women aged 55-64 years. It is interesting to note that there was little difference in the risk of poverty between the sexes for this age group.
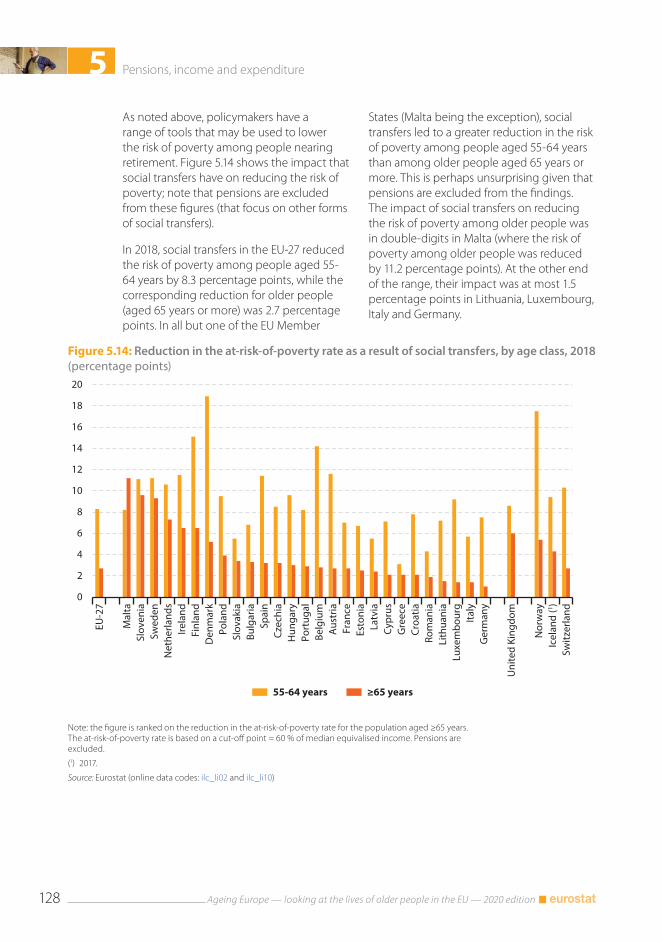
5 Pensions, income and expenditure
Ageing Europe — looking at the lives of older people in the EU — 2020 edition128
Figure 5.14: Reduction in the at-risk-of-poverty rate as a result of social transfers, by age class, 2018(percentage points)
0
2
4
6
8
10
12
14
16
18
20
EU-2
7
Mal
taSl
oven
iaSw
eden
Net
herla
nds
Irela
ndFi
nlan
dD
enm
ark
Pola
ndSl
ovak
iaBu
lgar
iaSp
ain
Czec
hia
Hun
gary
Port
ugal
Belg
ium
Aus
tria
Fran
ceEs
toni
aLa
tvia
Cypr
usG
reec
eCr
oatia
Rom
ania
Lith
uani
aLu
xem
bour
gIta
lyG
erm
any
Uni
ted
King
dom
Nor
way
Icel
and
(1 )Sw
itzer
land
55-64 years ≥65 years
Note: the figure is ranked on the reduction in the at-risk-of-poverty rate for the population aged ≥65 years. The at-risk-of-poverty rate is based on a cut-off point = 60 % of median equivalised income. Pensions are excluded.
(1) 2017.
Source: Eurostat (online data codes: ilc_li02 and ilc_li10)
As noted above, policymakers have a range of tools that may be used to lower the risk of poverty among people nearing retirement. Figure 5.14 shows the impact that social transfers have on reducing the risk of poverty; note that pensions are excluded from these figures (that focus on other forms of social transfers).
In 2018, social transfers in the EU-27 reduced the risk of poverty among people aged 55-64 years by 8.3 percentage points, while the corresponding reduction for older people (aged 65 years or more) was 2.7 percentage points. In all but one of the EU Member
States (Malta being the exception), social transfers led to a greater reduction in the risk of poverty among people aged 55-64 years than among older people aged 65 years or more. This is perhaps unsurprising given that pensions are excluded from the findings. The impact of social transfers on reducing the risk of poverty among older people was in double-digits in Malta (where the risk of poverty among older people was reduced by 11.2 percentage points). At the other end of the range, their impact was at most 1.5 percentage points in Lithuania, Luxembourg, Italy and Germany.
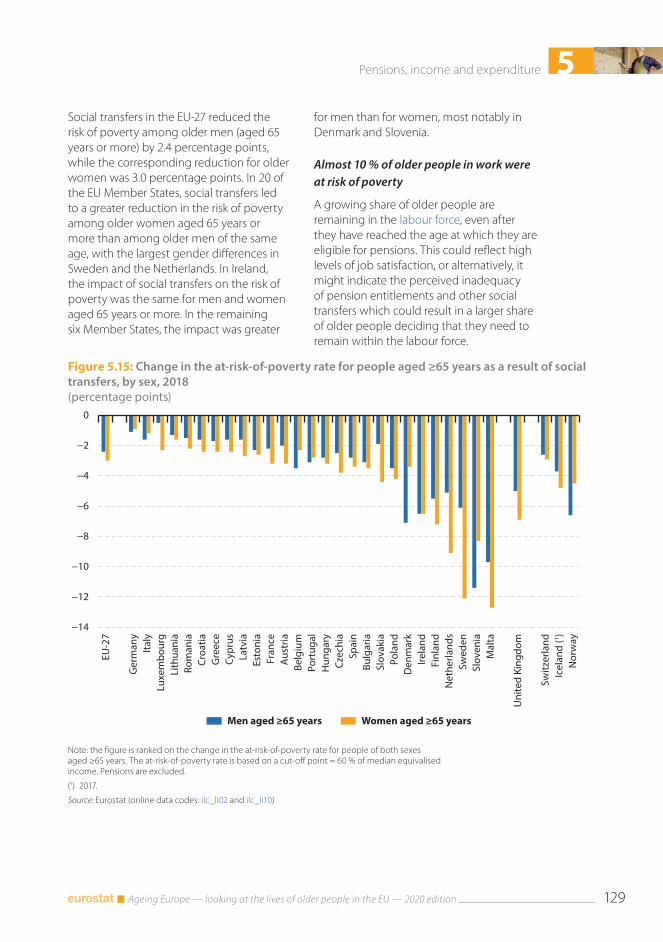
5Pensions, income and expenditure
Ageing Europe — looking at the lives of older people in the EU — 2020 edition 129
Figure 5.15: Change in the at-risk-of-poverty rate for people aged ≥65 years as a result of social transfers, by sex, 2018(percentage points)
−14
−12
−10
−8
−6
−4
−2
0
EU-2
7
Ger
man
yIta
lyLu
xem
bour
gLi
thua
nia
Rom
ania
Croa
tiaG
reec
eCy
prus
Latv
iaEs
toni
aFr
ance
Aus
tria
Belg
ium
Port
ugal
Hun
gary
Czec
hia
Spai
nBu
lgar
iaSl
ovak
iaPo
land
Den
mar
kIre
land
Finl
and
Net
herla
nds
Swed
enSl
oven
iaM
alta
Uni
ted
King
dom
Switz
erla
ndIc
elan
d (1 )
Nor
way
Men aged ≥65 years Women aged ≥65 years
Note: the figure is ranked on the change in the at-risk-of-poverty rate for people of both sexes aged ≥65 years. The at-risk-of-poverty rate is based on a cut-off point = 60 % of median equivalised income. Pensions are excluded.
(1) 2017.
Source: Eurostat (online data codes: ilc_li02 and ilc_li10)
Social transfers in the EU-27 reduced the risk of poverty among older men (aged 65 years or more) by 2.4 percentage points, while the corresponding reduction for older women was 3.0 percentage points. In 20 of the EU Member States, social transfers led to a greater reduction in the risk of poverty among older women aged 65 years or more than among older men of the same age, with the largest gender differences in Sweden and the Netherlands. In Ireland, the impact of social transfers on the risk of poverty was the same for men and women aged 65 years or more. In the remaining six Member States, the impact was greater
for men than for women, most notably in Denmark and Slovenia.
Almost 10 % of older people in work were at risk of poverty
A growing share of older people are remaining in the labour force, even after they have reached the age at which they are eligible for pensions. This could reflect high levels of job satisfaction, or alternatively, it might indicate the perceived inadequacy of pension entitlements and other social transfers which could result in a larger share of older people deciding that they need to remain within the labour force.
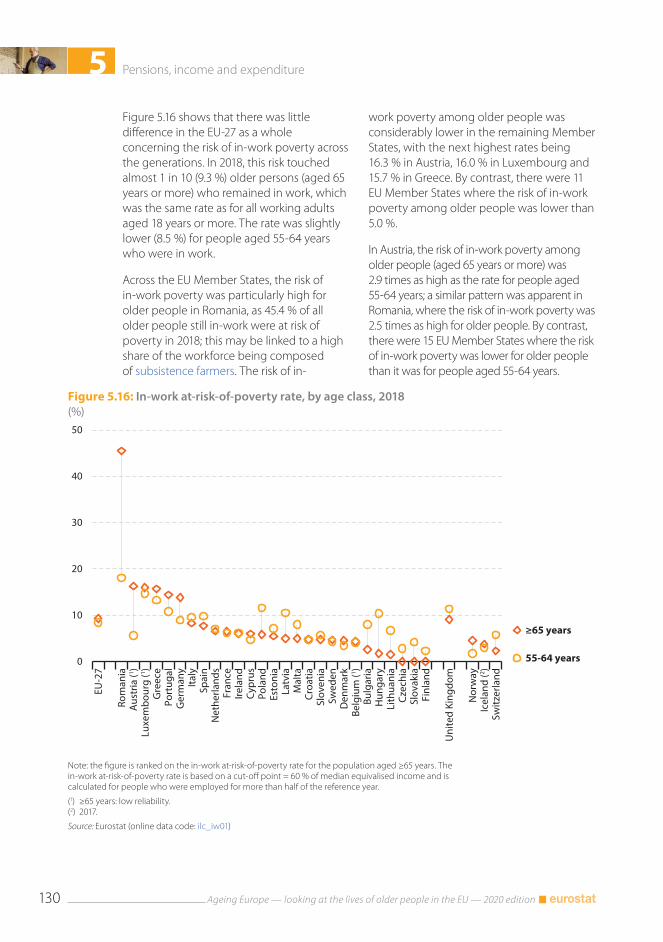
5 Pensions, income and expenditure
Ageing Europe — looking at the lives of older people in the EU — 2020 edition130
Figure 5.16: In-work at-risk-of-poverty rate, by age class, 2018(%)
0
10
20
30
40
50
EU-2
7
Rom
ania
Aus
tria
(1 )Lu
xem
bour
g (1 )
Gre
ece
Port
ugal
Ger
man
yIta
lySp
ain
Net
herla
nds
Fran
ceIre
land
Cypr
usPo
land
Esto
nia
Latv
iaM
alta
Croa
tiaSl
oven
iaSw
eden
Den
mar
kBe
lgiu
m (1 )
Bulg
aria
Hun
gary
Lith
uani
aCz
echi
aSl
ovak
iaFi
nlan
d
Uni
ted
King
dom
Nor
way
Icel
and
(2 )Sw
itzer
land
≥65 years
55-64 years
Note: the figure is ranked on the in-work at-risk-of-poverty rate for the population aged ≥65 years. The in-work at-risk-of-poverty rate is based on a cut-off point = 60 % of median equivalised income and is calculated for people who were employed for more than half of the reference year.
(1) ≥65 years: low reliability.(2) 2017.
Source: Eurostat (online data code: ilc_iw01)
Figure 5.16 shows that there was little difference in the EU-27 as a whole concerning the risk of in-work poverty across the generations. In 2018, this risk touched almost 1 in 10 (9.3 %) older persons (aged 65 years or more) who remained in work, which was the same rate as for all working adults aged 18 years or more. The rate was slightly lower (8.5 %) for people aged 55-64 years who were in work.
Across the EU Member States, the risk of in-work poverty was particularly high for older people in Romania, as 45.4 % of all older people still in-work were at risk of poverty in 2018; this may be linked to a high share of the workforce being composed of subsistence farmers. The risk of in-
work poverty among older people was considerably lower in the remaining Member States, with the next highest rates being 16.3 % in Austria, 16.0 % in Luxembourg and 15.7 % in Greece. By contrast, there were 11 EU Member States where the risk of in-work poverty among older people was lower than 5.0 %.
In Austria, the risk of in-work poverty among older people (aged 65 years or more) was 2.9 times as high as the rate for people aged 55-64 years; a similar pattern was apparent in Romania, where the risk of in-work poverty was 2.5 times as high for older people. By contrast, there were 15 EU Member States where the risk of in-work poverty was lower for older people than it was for people aged 55-64 years.
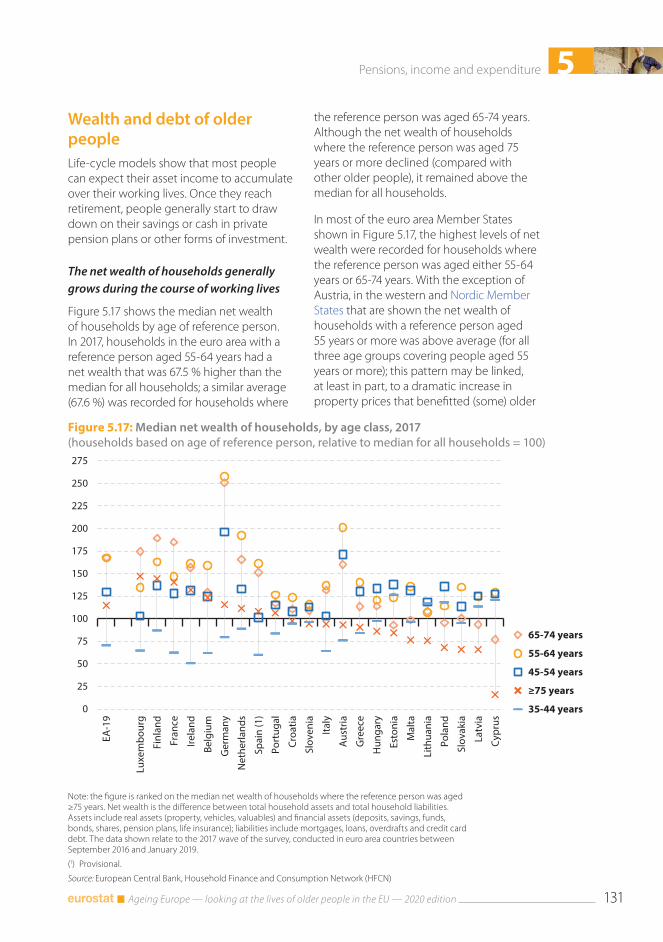
5Pensions, income and expenditure
Ageing Europe — looking at the lives of older people in the EU — 2020 edition 131
Figure 5.17: Median net wealth of households, by age class, 2017(households based on age of reference person, relative to median for all households = 100)
0
25
50
75
100
125
150
175
200
225
250
275
EA-1
9
Luxe
mbo
urg
Finl
and
Fran
ce
Irela
nd
Belg
ium
Ger
man
y
Net
herla
nds
Spai
n (1
)
Port
ugal
Croa
tia
Slov
enia
Italy
Aus
tria
Gre
ece
Hun
gary
Esto
nia
Mal
ta
Lith
uani
a
Pola
nd
Slov
akia
Latv
ia
Cypr
us
65-74 years
55-64 years
45-54 years
≥75 years
35-44 years
Note: the figure is ranked on the median net wealth of households where the reference person was aged ≥75 years. Net wealth is the difference between total household assets and total household liabilities. Assets include real assets (property, vehicles, valuables) and financial assets (deposits, savings, funds, bonds, shares, pension plans, life insurance); liabilities include mortgages, loans, overdrafts and credit card debt. The data shown relate to the 2017 wave of the survey, conducted in euro area countries between September 2016 and January 2019.
(1) Provisional.
Source: European Central Bank, Household Finance and Consumption Network (HFCN)
Wealth and debt of older peopleLife-cycle models show that most people can expect their asset income to accumulate over their working lives. Once they reach retirement, people generally start to draw down on their savings or cash in private pension plans or other forms of investment.
The net wealth of households generally grows during the course of working lives
Figure 5.17 shows the median net wealth of households by age of reference person. In 2017, households in the euro area with a reference person aged 55-64 years had a net wealth that was 67.5 % higher than the median for all households; a similar average (67.6 %) was recorded for households where
the reference person was aged 65-74 years. Although the net wealth of households where the reference person was aged 75 years or more declined (compared with other older people), it remained above the median for all households.
In most of the euro area Member States shown in Figure 5.17, the highest levels of net wealth were recorded for households where the reference person was aged either 55-64 years or 65-74 years. With the exception of Austria, in the western and Nordic Member States that are shown the net wealth of households with a reference person aged 55 years or more was above average (for all three age groups covering people aged 55 years or more); this pattern may be linked, at least in part, to a dramatic increase in property prices that benefitted (some) older
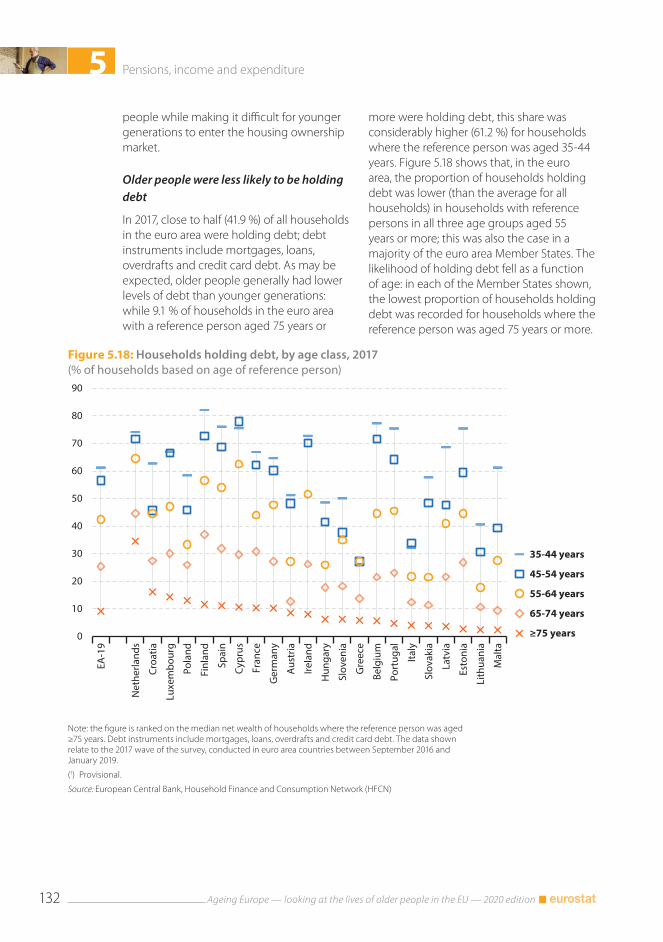
5 Pensions, income and expenditure
Ageing Europe — looking at the lives of older people in the EU — 2020 edition132
Figure 5.18: Households holding debt, by age class, 2017(% of households based on age of reference person)
0
10
20
30
40
50
60
70
80
90
EA-1
9
Net
herla
nds
Croa
tia
Luxe
mbo
urg
Pola
nd
Finl
and
Spai
n
Cypr
us
Fran
ce
Ger
man
y
Aus
tria
Irela
nd
Hun
gary
Slov
enia
Gre
ece
Belg
ium
Port
ugal
Italy
Slov
akia
Latv
ia
Esto
nia
Lith
uani
a
Mal
ta
35-44 years
45-54 years
55-64 years
65-74 years
≥75 years
Note: the figure is ranked on the median net wealth of households where the reference person was aged ≥75 years. Debt instruments include mortgages, loans, overdrafts and credit card debt. The data shown relate to the 2017 wave of the survey, conducted in euro area countries between September 2016 and January 2019.
(1) Provisional.
Source: European Central Bank, Household Finance and Consumption Network (HFCN)
people while making it difficult for younger generations to enter the housing ownership market.
Older people were less likely to be holding debt
In 2017, close to half (41.9 %) of all households in the euro area were holding debt; debt instruments include mortgages, loans, overdrafts and credit card debt. As may be expected, older people generally had lower levels of debt than younger generations: while 9.1 % of households in the euro area with a reference person aged 75 years or
more were holding debt, this share was considerably higher (61.2 %) for households where the reference person was aged 35-44 years. Figure 5.18 shows that, in the euro area, the proportion of households holding debt was lower (than the average for all households) in households with reference persons in all three age groups aged 55 years or more; this was also the case in a majority of the euro area Member States. The likelihood of holding debt fell as a function of age: in each of the Member States shown, the lowest proportion of households holding debt was recorded for households where the reference person was aged 75 years or more.
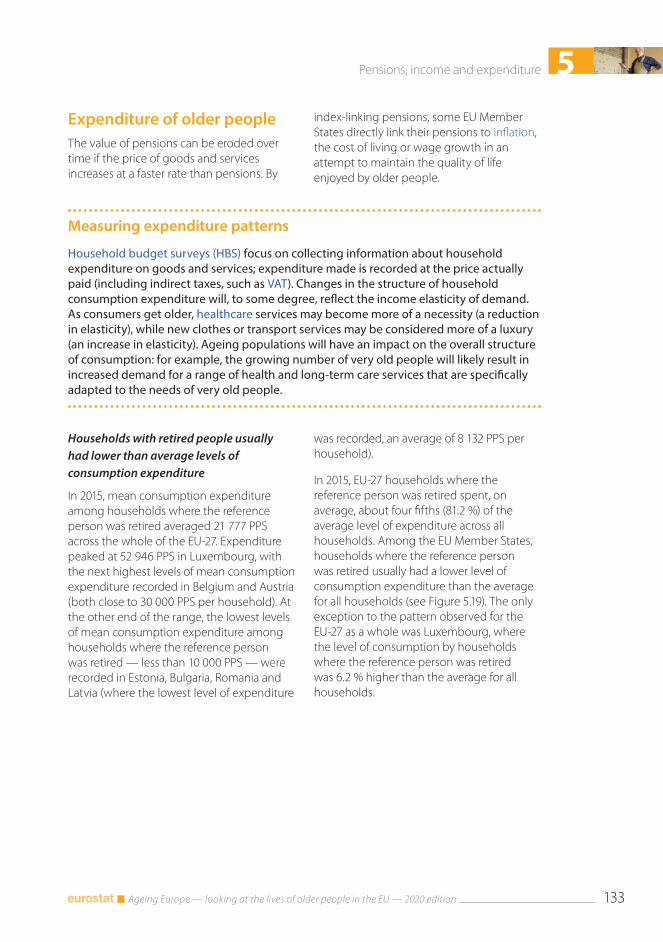
5Pensions, income and expenditure
Ageing Europe — looking at the lives of older people in the EU — 2020 edition 133
Expenditure of older peopleThe value of pensions can be eroded over time if the price of goods and services increases at a faster rate than pensions. By
index-linking pensions, some EU Member States directly link their pensions to inflation, the cost of living or wage growth in an attempt to maintain the quality of life enjoyed by older people.
Measuring expenditure patterns
Household budget surveys (HBS) focus on collecting information about household expenditure on goods and services; expenditure made is recorded at the price actually paid (including indirect taxes, such as VAT). Changes in the structure of household consumption expenditure will, to some degree, reflect the income elasticity of demand. As consumers get older, healthcare services may become more of a necessity (a reduction in elasticity), while new clothes or transport services may be considered more of a luxury (an increase in elasticity). Ageing populations will have an impact on the overall structure of consumption: for example, the growing number of very old people will likely result in increased demand for a range of health and long-term care services that are specifically adapted to the needs of very old people.
Households with retired people usually had lower than average levels of consumption expenditure
In 2015, mean consumption expenditure among households where the reference person was retired averaged 21 777 PPS across the whole of the EU-27. Expenditure peaked at 52 946 PPS in Luxembourg, with the next highest levels of mean consumption expenditure recorded in Belgium and Austria (both close to 30 000 PPS per household). At the other end of the range, the lowest levels of mean consumption expenditure among households where the reference person was retired — less than 10 000 PPS — were recorded in Estonia, Bulgaria, Romania and Latvia (where the lowest level of expenditure
was recorded, an average of 8 132 PPS per household).
In 2015, EU-27 households where the reference person was retired spent, on average, about four fifths (81.2 %) of the average level of expenditure across all households. Among the EU Member States, households where the reference person was retired usually had a lower level of consumption expenditure than the average for all households (see Figure 5.19). The only exception to the pattern observed for the EU-27 as a whole was Luxembourg, where the level of consumption by households where the reference person was retired was 6.2 % higher than the average for all households.
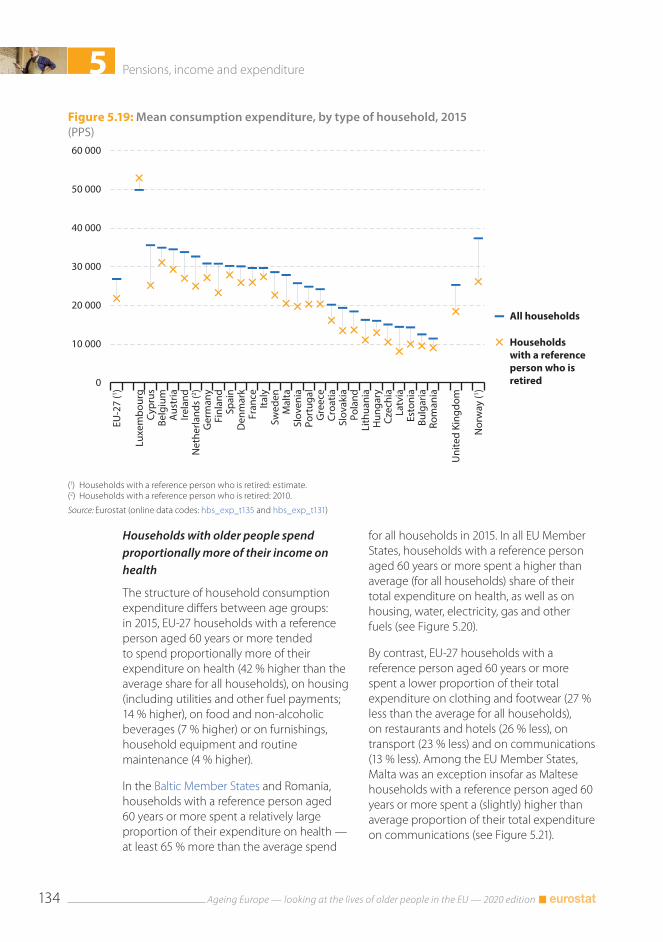
5 Pensions, income and expenditure
Ageing Europe — looking at the lives of older people in the EU — 2020 edition134
Households with older people spend proportionally more of their income on health
The structure of household consumption expenditure differs between age groups: in 2015, EU-27 households with a reference person aged 60 years or more tended to spend proportionally more of their expenditure on health (42 % higher than the average share for all households), on housing (including utilities and other fuel payments; 14 % higher), on food and non-alcoholic beverages (7 % higher) or on furnishings, household equipment and routine maintenance (4 % higher).
In the Baltic Member States and Romania, households with a reference person aged 60 years or more spent a relatively large proportion of their expenditure on health — at least 65 % more than the average spend
for all households in 2015. In all EU Member States, households with a reference person aged 60 years or more spent a higher than average (for all households) share of their total expenditure on health, as well as on housing, water, electricity, gas and other fuels (see Figure 5.20).
By contrast, EU-27 households with a reference person aged 60 years or more spent a lower proportion of their total expenditure on clothing and footwear (27 % less than the average for all households), on restaurants and hotels (26 % less), on transport (23 % less) and on communications (13 % less). Among the EU Member States, Malta was an exception insofar as Maltese households with a reference person aged 60 years or more spent a (slightly) higher than average proportion of their total expenditure on communications (see Figure 5.21).
Figure 5.19: Mean consumption expenditure, by type of household, 2015(PPS)
0
10 000
20 000
30 000
40 000
50 000
60 000
EU-2
7 (1 )
Luxe
mbo
urg
Cypr
usBe
lgiu
mA
ustr
iaIre
land
Net
herla
nds
(2 )G
erm
any
Finl
and
Spai
nD
enm
ark
Fran
ceIta
lySw
eden
Mal
taSl
oven
iaPo
rtug
alG
reec
eCr
oatia
Slov
akia
Pola
ndLi
thua
nia
Hun
gary
Czec
hia
Latv
iaEs
toni
aBu
lgar
iaRo
man
ia
Uni
ted
King
dom
Nor
way
(1 )
All households
Householdswith a referenceperson who isretired
(1) Households with a reference person who is retired: estimate.(2) Households with a reference person who is retired: 2010.
Source: Eurostat (online data codes: hbs_exp_t135 and hbs_exp_t131)
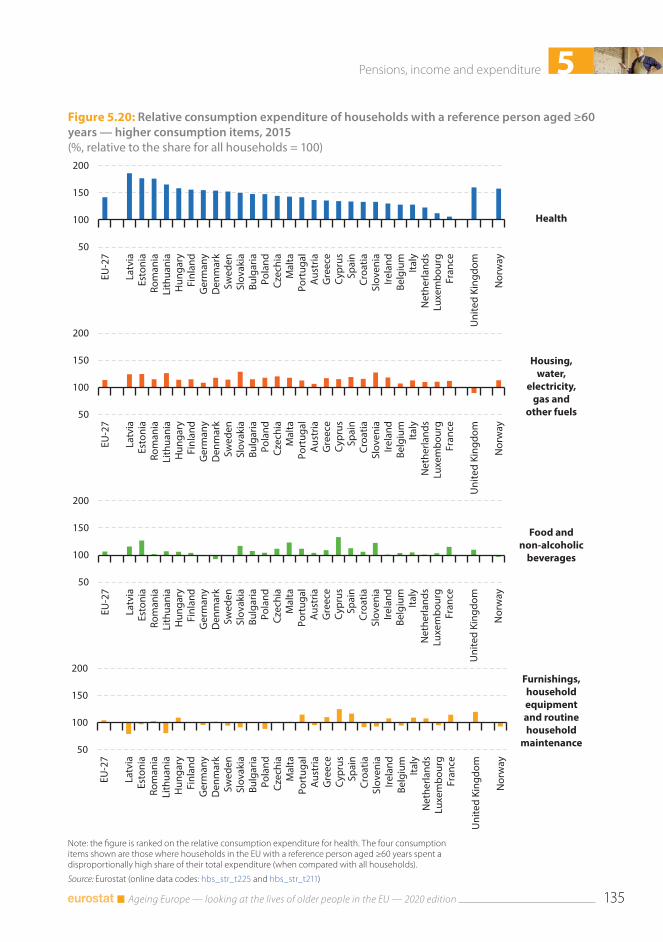
5Pensions, income and expenditure
Ageing Europe — looking at the lives of older people in the EU — 2020 edition 135
Figure 5.20: Relative consumption expenditure of households with a reference person aged ≥60 years — higher consumption items, 2015(%, relative to the share for all households = 100)
50
100
150
200
EU-2
7
Latv
iaEs
toni
aRo
man
iaLi
thua
nia
Hun
gary
Finl
and
Ger
man
yD
enm
ark
Swed
enSl
ovak
iaBu
lgar
iaPo
land
Czec
hia
Mal
taPo
rtug
alA
ustr
iaG
reec
eCy
prus
Spai
nCr
oatia
Slov
enia
Irela
ndBe
lgiu
mIta
lyN
ethe
rland
sLu
xem
bour
gFr
ance
Uni
ted
King
dom
Nor
way
Health
50
100
150
200
EU-2
7
Latv
iaEs
toni
aRo
man
iaLi
thua
nia
Hun
gary
Finl
and
Ger
man
yD
enm
ark
Swed
enSl
ovak
iaBu
lgar
iaPo
land
Czec
hia
Mal
taPo
rtug
alA
ustr
iaG
reec
eCy
prus
Spai
nCr
oatia
Slov
enia
Irela
ndBe
lgiu
mIta
lyN
ethe
rland
sLu
xem
bour
gFr
ance
Uni
ted
King
dom
Nor
way
Housing,water,
electricity,gas and
other fuels
50
100
150
200
EU-2
7
Latv
iaEs
toni
aRo
man
iaLi
thua
nia
Hun
gary
Finl
and
Ger
man
yD
enm
ark
Swed
enSl
ovak
iaBu
lgar
iaPo
land
Czec
hia
Mal
taPo
rtug
alA
ustr
iaG
reec
eCy
prus
Spai
nCr
oatia
Slov
enia
Irela
ndBe
lgiu
mIta
lyN
ethe
rland
sLu
xem
bour
gFr
ance
Uni
ted
King
dom
Nor
way
Food andnon-alcoholic
beverages
50
100
150
200
EU-2
7
Latv
iaEs
toni
aRo
man
iaLi
thua
nia
Hun
gary
Finl
and
Ger
man
yD
enm
ark
Swed
enSl
ovak
iaBu
lgar
iaPo
land
Czec
hia
Mal
taPo
rtug
alA
ustr
iaG
reec
eCy
prus
Spai
nCr
oatia
Slov
enia
Irela
ndBe
lgiu
mIta
lyN
ethe
rland
sLu
xem
bour
gFr
ance
Uni
ted
King
dom
Nor
way
Furnishings,householdequipmentand routinehousehold
maintenance
Note: the figure is ranked on the relative consumption expenditure for health. The four consumption items shown are those where households in the EU with a reference person aged ≥60 years spent a disproportionally high share of their total expenditure (when compared with all households).
Source: Eurostat (online data codes: hbs_str_t225 and hbs_str_t211)
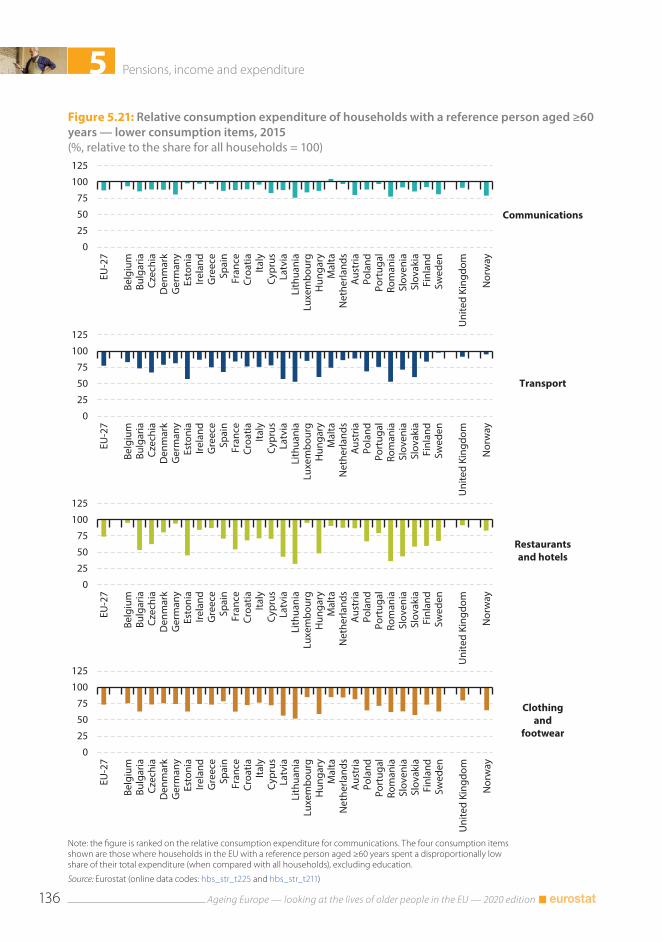
5 Pensions, income and expenditure
Ageing Europe — looking at the lives of older people in the EU — 2020 edition136
Figure 5.21: Relative consumption expenditure of households with a reference person aged ≥60 years — lower consumption items, 2015(%, relative to the share for all households = 100)
0
25
50
75
100
125
EU-2
7
Belg
ium
Bulg
aria
Czec
hia
Den
mar
kG
erm
any
Esto
nia
Irela
ndG
reec
eSp
ain
Fran
ceCr
oatia
Italy
Cypr
usLa
tvia
Lith
uani
aLu
xem
bour
gH
unga
ryM
alta
Net
herla
nds
Aus
tria
Pola
ndPo
rtug
alRo
man
iaSl
oven
iaSl
ovak
iaFi
nlan
dSw
eden
Uni
ted
King
dom
Nor
way
Communications
0
25
50
75
100
125
EU-2
7
Belg
ium
Bulg
aria
Czec
hia
Den
mar
kG
erm
any
Esto
nia
Irela
ndG
reec
eSp
ain
Fran
ceCr
oatia
Italy
Cypr
usLa
tvia
Lith
uani
aLu
xem
bour
gH
unga
ryM
alta
Net
herla
nds
Aus
tria
Pola
ndPo
rtug
alRo
man
iaSl
oven
iaSl
ovak
iaFi
nlan
dSw
eden
Uni
ted
King
dom
Nor
way
Transport
0
25
50
75
100
125
EU-2
7
Belg
ium
Bulg
aria
Czec
hia
Den
mar
kG
erm
any
Esto
nia
Irela
ndG
reec
eSp
ain
Fran
ceCr
oatia
Italy
Cypr
usLa
tvia
Lith
uani
aLu
xem
bour
gH
unga
ryM
alta
Net
herla
nds
Aus
tria
Pola
ndPo
rtug
alRo
man
iaSl
oven
iaSl
ovak
iaFi
nlan
dSw
eden
Uni
ted
King
dom
Nor
way
Restaurantsand hotels
0
25
50
75
100
125
EU-2
7
Belg
ium
Bulg
aria
Czec
hia
Den
mar
kG
erm
any
Esto
nia
Irela
ndG
reec
eSp
ain
Fran
ceCr
oatia
Italy
Cypr
usLa
tvia
Lith
uani
aLu
xem
bour
gH
unga
ryM
alta
Net
herla
nds
Aus
tria
Pola
ndPo
rtug
alRo
man
iaSl
oven
iaSl
ovak
iaFi
nlan
dSw
eden
Uni
ted
King
dom
Nor
way
Clothingand
footwear
Note: the figure is ranked on the relative consumption expenditure for communications. The four consumption items shown are those where households in the EU with a reference person aged ≥60 years spent a disproportionally low share of their total expenditure (when compared with all households), excluding education.
Source: Eurostat (online data codes: hbs_str_t225 and hbs_str_t211)
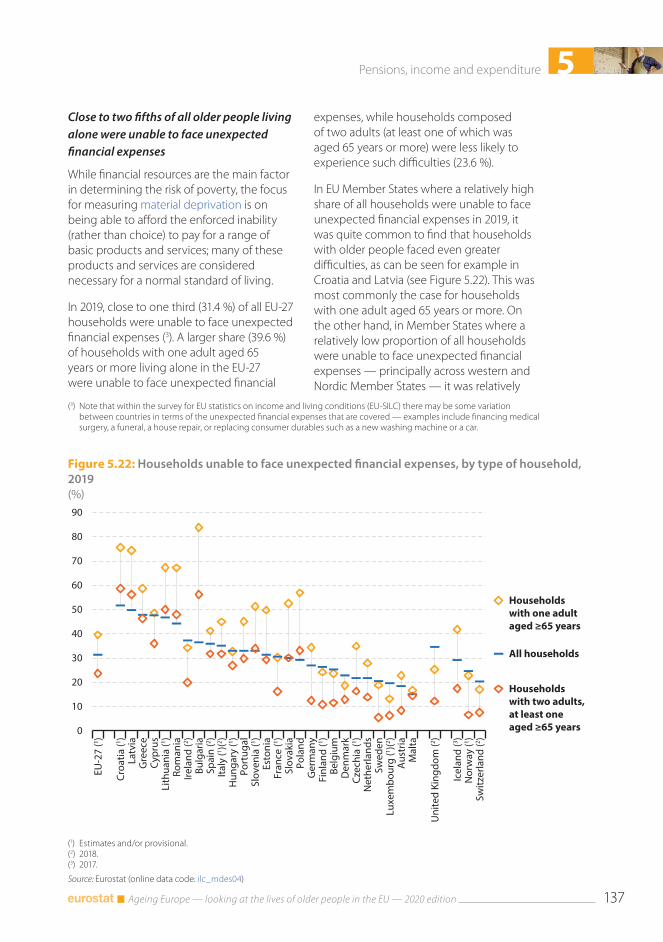
5Pensions, income and expenditure
Ageing Europe — looking at the lives of older people in the EU — 2020 edition 137
Figure 5.22: Households unable to face unexpected financial expenses, by type of household, 2019(%)
0
10
20
30
40
50
60
70
80
90
EU-2
7 (1 )
Croa
tia (1 )
Latv
iaG
reec
eCy
prus
Lith
uani
a (1 )
Rom
ania
Irela
nd (2 )
Bulg
aria
Spai
n (2 )
Italy
(1 )(2 )H
unga
ry (1 )
Port
ugal
Slov
enia
(1 )Es
toni
aFr
ance
(1 )Sl
ovak
iaPo
land
Ger
man
yFi
nlan
d (1 )
Belg
ium
Den
mar
kCz
echi
a (1 )
Net
herla
nds
Swed
enLu
xem
bour
g (1 )(2 )
Aus
tria
Mal
ta
Uni
ted
King
dom
(2 )
Icel
and
(3 )N
orw
ay (1 )
Switz
erla
nd (2 )
Households with one adult aged ≥65 years
Households with two adults,at least one aged ≥65 years
All households
(1) Estimates and/or provisional.(2) 2018.(3) 2017.
Source: Eurostat (online data code: ilc_mdes04)
Close to two fifths of all older people living alone were unable to face unexpected financial expenses
While financial resources are the main factor in determining the risk of poverty, the focus for measuring material deprivation is on being able to afford the enforced inability (rather than choice) to pay for a range of basic products and services; many of these products and services are considered necessary for a normal standard of living.
In 2019, close to one third (31.4 %) of all EU-27 households were unable to face unexpected financial expenses (3). A larger share (39.6 %) of households with one adult aged 65 years or more living alone in the EU-27 were unable to face unexpected financial
(3) Note that within the survey for EU statistics on income and living conditions (EU-SILC) there may be some variation between countries in terms of the unexpected financial expenses that are covered — examples include financing medical surgery, a funeral, a house repair, or replacing consumer durables such as a new washing machine or a car.
expenses, while households composed of two adults (at least one of which was aged 65 years or more) were less likely to experience such difficulties (23.6 %).
In EU Member States where a relatively high share of all households were unable to face unexpected financial expenses in 2019, it was quite common to find that households with older people faced even greater difficulties, as can be seen for example in Croatia and Latvia (see Figure 5.22). This was most commonly the case for households with one adult aged 65 years or more. On the other hand, in Member States where a relatively low proportion of all households were unable to face unexpected financial expenses — principally across western and Nordic Member States — it was relatively
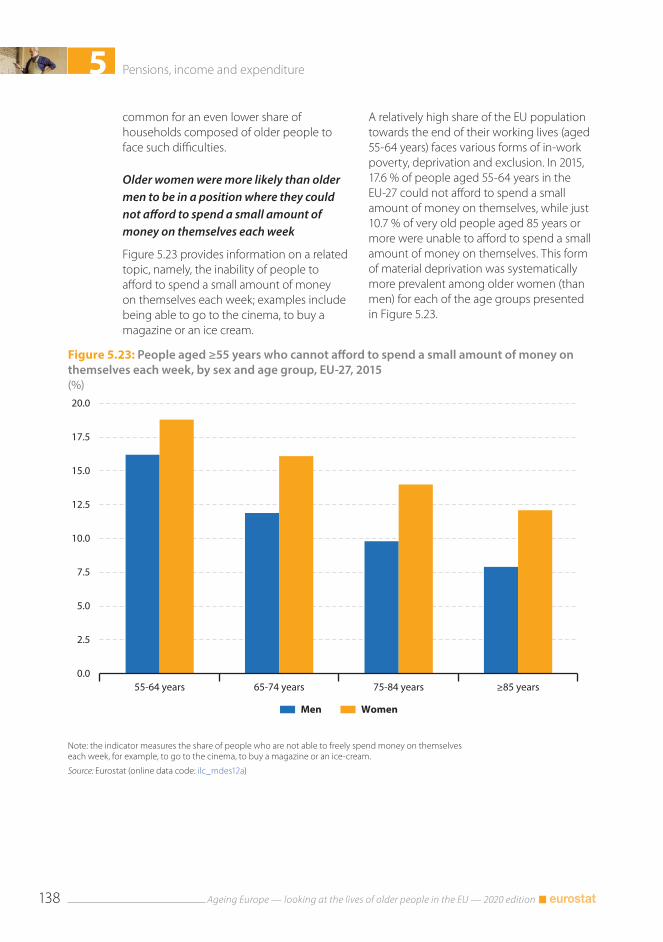
5 Pensions, income and expenditure
Ageing Europe — looking at the lives of older people in the EU — 2020 edition138
Figure 5.23: People aged ≥55 years who cannot afford to spend a small amount of money on themselves each week, by sex and age group, EU-27, 2015(%)
0.0
2.5
5.0
7.5
10.0
12.5
15.0
17.5
20.0
55-64 years 65-74 years 75-84 years ≥85 years
Men Women
Note: the indicator measures the share of people who are not able to freely spend money on themselves each week, for example, to go to the cinema, to buy a magazine or an ice-cream.
Source: Eurostat (online data code: ilc_mdes12a)
common for an even lower share of households composed of older people to face such difficulties.
Older women were more likely than older men to be in a position where they could not afford to spend a small amount of money on themselves each week
Figure 5.23 provides information on a related topic, namely, the inability of people to afford to spend a small amount of money on themselves each week; examples include being able to go to the cinema, to buy a magazine or an ice cream.
A relatively high share of the EU population towards the end of their working lives (aged 55-64 years) faces various forms of in-work poverty, deprivation and exclusion. In 2015, 17.6 % of people aged 55-64 years in the EU-27 could not afford to spend a small amount of money on themselves, while just 10.7 % of very old people aged 85 years or more were unable to afford to spend a small amount of money on themselves. This form of material deprivation was systematically more prevalent among older women (than men) for each of the age groups presented in Figure 5.23.
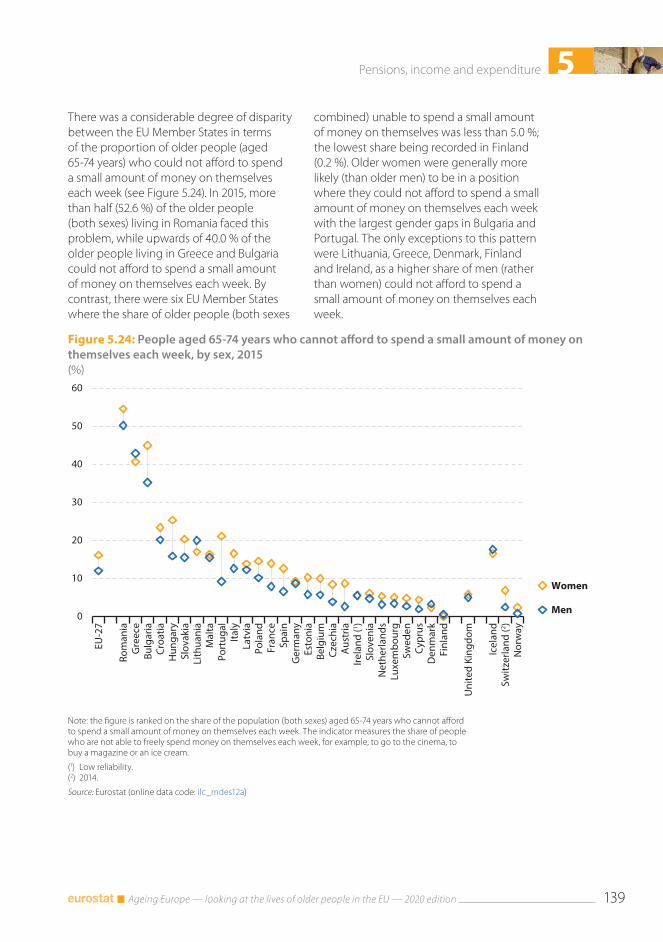
5Pensions, income and expenditure
Ageing Europe — looking at the lives of older people in the EU — 2020 edition 139
Figure 5.24: People aged 65-74 years who cannot afford to spend a small amount of money on themselves each week, by sex, 2015(%)
0
10
20
30
40
50
60
EU-2
7
Rom
ania
Gre
ece
Bulg
aria
Croa
tiaH
unga
rySl
ovak
iaLi
thua
nia
Mal
taPo
rtug
alIta
lyLa
tvia
Pola
ndFr
ance
Spai
nG
erm
any
Esto
nia
Belg
ium
Czec
hia
Aus
tria
Irela
nd (1 )
Slov
enia
Net
herla
nds
Luxe
mbo
urg
Swed
enCy
prus
Den
mar
kFi
nlan
d
Uni
ted
King
dom
Icel
and
Switz
erla
nd (2 )
Nor
way
Women
Men
Note: the figure is ranked on the share of the population (both sexes) aged 65-74 years who cannot afford to spend a small amount of money on themselves each week. The indicator measures the share of people who are not able to freely spend money on themselves each week, for example, to go to the cinema, to buy a magazine or an ice cream.
(1) Low reliability.(2) 2014.
Source: Eurostat (online data code: ilc_mdes12a)
There was a considerable degree of disparity between the EU Member States in terms of the proportion of older people (aged 65-74 years) who could not afford to spend a small amount of money on themselves each week (see Figure 5.24). In 2015, more than half (52.6 %) of the older people (both sexes) living in Romania faced this problem, while upwards of 40.0 % of the older people living in Greece and Bulgaria could not afford to spend a small amount of money on themselves each week. By contrast, there were six EU Member States where the share of older people (both sexes
combined) unable to spend a small amount of money on themselves was less than 5.0 %; the lowest share being recorded in Finland (0.2 %). Older women were generally more likely (than older men) to be in a position where they could not afford to spend a small amount of money on themselves each week with the largest gender gaps in Bulgaria and Portugal. The only exceptions to this pattern were Lithuania, Greece, Denmark, Finland and Ireland, as a higher share of men (rather than women) could not afford to spend a small amount of money on themselves each week.

6 Social life and opinions
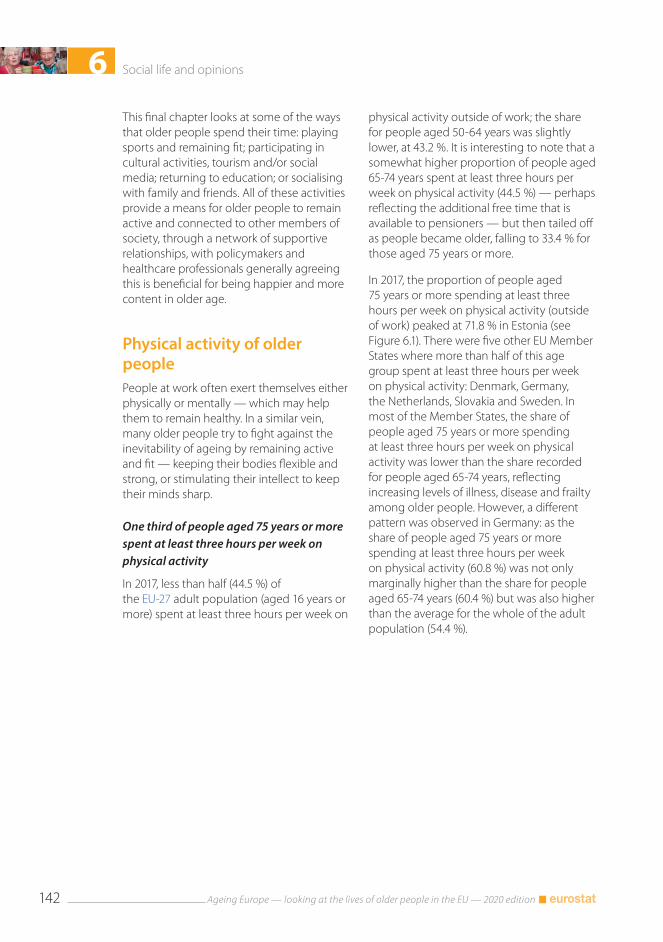
6 Social life and opinions
Ageing Europe — looking at the lives of older people in the EU — 2020 edition142
This final chapter looks at some of the ways that older people spend their time: playing sports and remaining fit; participating in cultural activities, tourism and/or social media; returning to education; or socialising with family and friends. All of these activities provide a means for older people to remain active and connected to other members of society, through a network of supportive relationships, with policymakers and healthcare professionals generally agreeing this is beneficial for being happier and more content in older age.
Physical activity of older peoplePeople at work often exert themselves either physically or mentally — which may help them to remain healthy. In a similar vein, many older people try to fight against the inevitability of ageing by remaining active and fit — keeping their bodies flexible and strong, or stimulating their intellect to keep their minds sharp.
One third of people aged 75 years or more spent at least three hours per week on physical activity
In 2017, less than half (44.5 %) of the EU-27 adult population (aged 16 years or more) spent at least three hours per week on
physical activity outside of work; the share for people aged 50-64 years was slightly lower, at 43.2 %. It is interesting to note that a somewhat higher proportion of people aged 65-74 years spent at least three hours per week on physical activity (44.5 %) — perhaps reflecting the additional free time that is available to pensioners — but then tailed off as people became older, falling to 33.4 % for those aged 75 years or more.
In 2017, the proportion of people aged 75 years or more spending at least three hours per week on physical activity (outside of work) peaked at 71.8 % in Estonia (see Figure 6.1). There were five other EU Member States where more than half of this age group spent at least three hours per week on physical activity: Denmark, Germany, the Netherlands, Slovakia and Sweden. In most of the Member States, the share of people aged 75 years or more spending at least three hours per week on physical activity was lower than the share recorded for people aged 65-74 years, reflecting increasing levels of illness, disease and frailty among older people. However, a different pattern was observed in Germany: as the share of people aged 75 years or more spending at least three hours per week on physical activity (60.8 %) was not only marginally higher than the share for people aged 65-74 years (60.4 %) but was also higher than the average for the whole of the adult population (54.4 %).
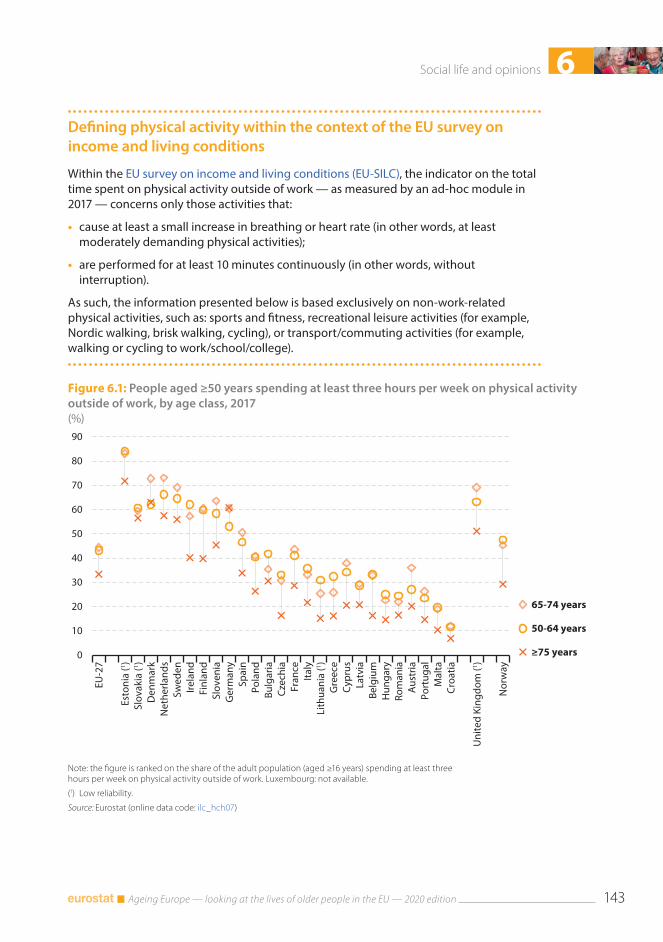
6Social life and opinions
Ageing Europe — looking at the lives of older people in the EU — 2020 edition 143
Figure 6.1: People aged ≥50 years spending at least three hours per week on physical activity outside of work, by age class, 2017(%)
0
10
20
30
40
50
60
70
80
90
EU-2
7
Esto
nia
(1 )Sl
ovak
ia (1 )
Den
mar
kN
ethe
rland
sSw
eden
Irela
ndFi
nlan
dSl
oven
iaG
erm
any
Spai
nPo
land
Bulg
aria
Czec
hia
Fran
ceIta
lyLi
thua
nia
(1 )G
reec
eCy
prus
Latv
iaBe
lgiu
mH
unga
ryRo
man
iaA
ustr
iaPo
rtug
alM
alta
Croa
tia
Uni
ted
King
dom
(1 )
Nor
way
65-74 years
50-64 years
≥75 years
Note: the figure is ranked on the share of the adult population (aged ≥16 years) spending at least three hours per week on physical activity outside of work. Luxembourg: not available.
(1) Low reliability.
Source: Eurostat (online data code: ilc_hch07)
Defining physical activity within the context of the EU survey on income and living conditions
Within the EU survey on income and living conditions (EU-SILC), the indicator on the total time spent on physical activity outside of work — as measured by an ad-hoc module in 2017 — concerns only those activities that:
• cause at least a small increase in breathing or heart rate (in other words, at least moderately demanding physical activities);
• are performed for at least 10 minutes continuously (in other words, without interruption).
As such, the information presented below is based exclusively on non-work-related physical activities, such as: sports and fitness, recreational leisure activities (for example, Nordic walking, brisk walking, cycling), or transport/commuting activities (for example, walking or cycling to work/school/college).
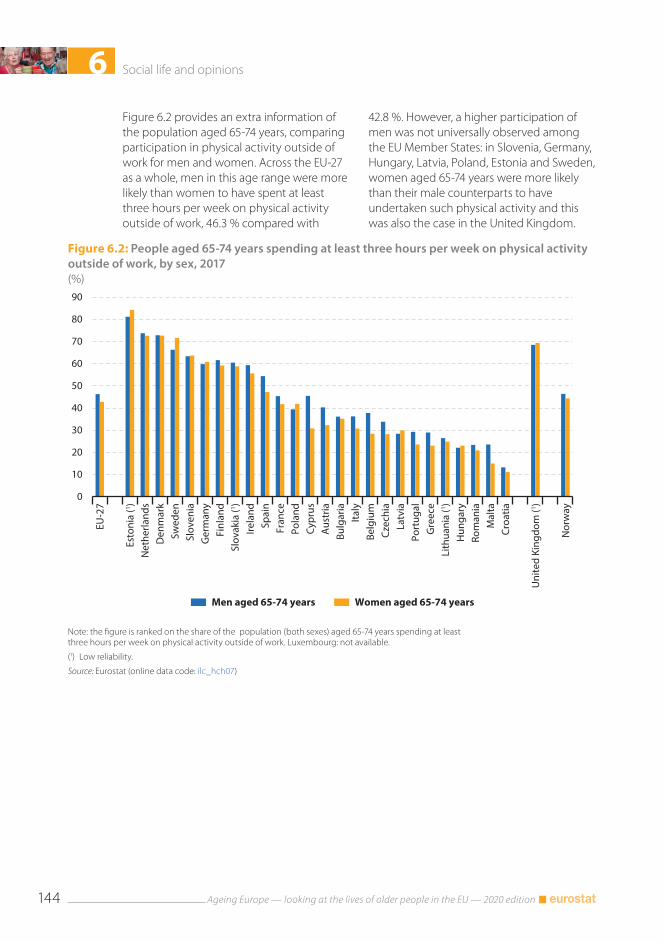
6 Social life and opinions
Ageing Europe — looking at the lives of older people in the EU — 2020 edition144
Figure 6.2: People aged 65-74 years spending at least three hours per week on physical activity outside of work, by sex, 2017(%)
0
10
20
30
40
50
60
70
80
90
EU-2
7
Esto
nia
(1 )N
ethe
rland
sD
enm
ark
Swed
enSl
oven
iaG
erm
any
Finl
and
Slov
akia
(1 )Ire
land
Spai
nFr
ance
Pola
ndCy
prus
Aus
tria
Bulg
aria
Italy
Belg
ium
Czec
hia
Latv
iaPo
rtug
alG
reec
eLi
thua
nia
(1 )H
unga
ryRo
man
iaM
alta
Croa
tia
Uni
ted
King
dom
(1 )
Nor
way
Men aged 65-74 years Women aged 65-74 years
Note: the figure is ranked on the share of the population (both sexes) aged 65-74 years spending at least three hours per week on physical activity outside of work. Luxembourg: not available.
(1) Low reliability.
Source: Eurostat (online data code: ilc_hch07)
Figure 6.2 provides an extra information of the population aged 65-74 years, comparing participation in physical activity outside of work for men and women. Across the EU-27 as a whole, men in this age range were more likely than women to have spent at least three hours per week on physical activity outside of work, 46.3 % compared with
42.8 %. However, a higher participation of men was not universally observed among the EU Member States: in Slovenia, Germany, Hungary, Latvia, Poland, Estonia and Sweden, women aged 65-74 years were more likely than their male counterparts to have undertaken such physical activity and this was also the case in the United Kingdom.
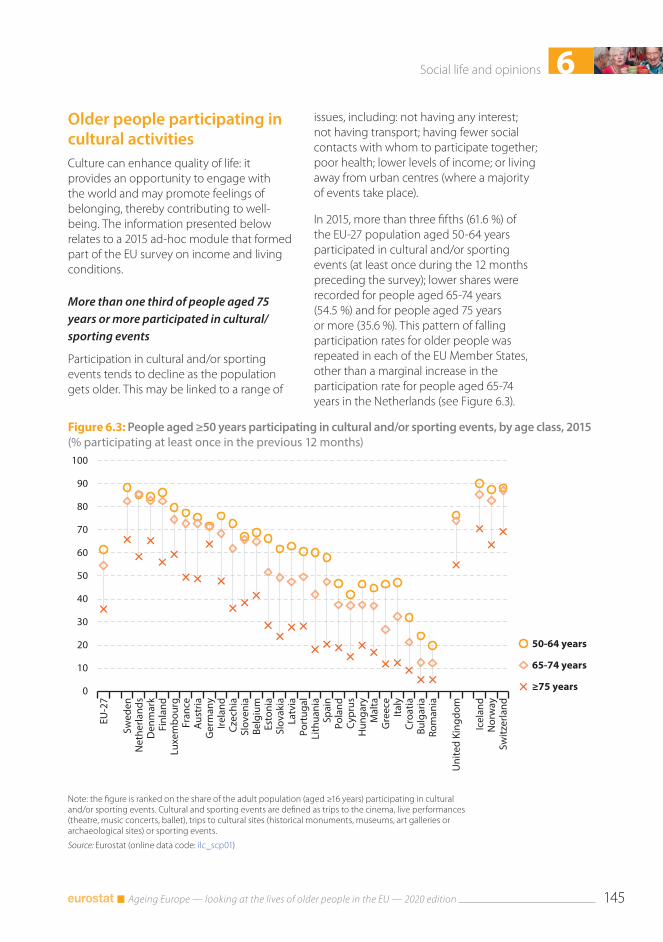
6Social life and opinions
Ageing Europe — looking at the lives of older people in the EU — 2020 edition 145
Figure 6.3: People aged ≥50 years participating in cultural and/or sporting events, by age class, 2015(% participating at least once in the previous 12 months)
0
10
20
30
40
50
60
70
80
90
100
EU-2
7
Swed
enN
ethe
rland
sD
enm
ark
Finl
and
Luxe
mbo
urg
Fran
ceA
ustr
iaG
erm
any
Irela
ndCz
echi
aSl
oven
iaBe
lgiu
mEs
toni
aSl
ovak
iaLa
tvia
Port
ugal
Lith
uani
aSp
ain
Pola
ndCy
prus
Hun
gary
Mal
taG
reec
eIta
lyCr
oatia
Bulg
aria
Rom
ania
Uni
ted
King
dom
Icel
and
Nor
way
Switz
erla
nd
50-64 years
65-74 years
≥75 years
Note: the figure is ranked on the share of the adult population (aged ≥16 years) participating in cultural and/or sporting events. Cultural and sporting events are defined as trips to the cinema, live performances (theatre, music concerts, ballet), trips to cultural sites (historical monuments, museums, art galleries or archaeological sites) or sporting events.
Source: Eurostat (online data code: ilc_scp01)
Older people participating in cultural activitiesCulture can enhance quality of life: it provides an opportunity to engage with the world and may promote feelings of belonging, thereby contributing to well-being. The information presented below relates to a 2015 ad-hoc module that formed part of the EU survey on income and living conditions.
More than one third of people aged 75 years or more participated in cultural/sporting events
Participation in cultural and/or sporting events tends to decline as the population gets older. This may be linked to a range of
issues, including: not having any interest; not having transport; having fewer social contacts with whom to participate together; poor health; lower levels of income; or living away from urban centres (where a majority of events take place).
In 2015, more than three fifths (61.6 %) of the EU-27 population aged 50-64 years participated in cultural and/or sporting events (at least once during the 12 months preceding the survey); lower shares were recorded for people aged 65-74 years (54.5 %) and for people aged 75 years or more (35.6 %). This pattern of falling participation rates for older people was repeated in each of the EU Member States, other than a marginal increase in the participation rate for people aged 65-74 years in the Netherlands (see Figure 6.3).
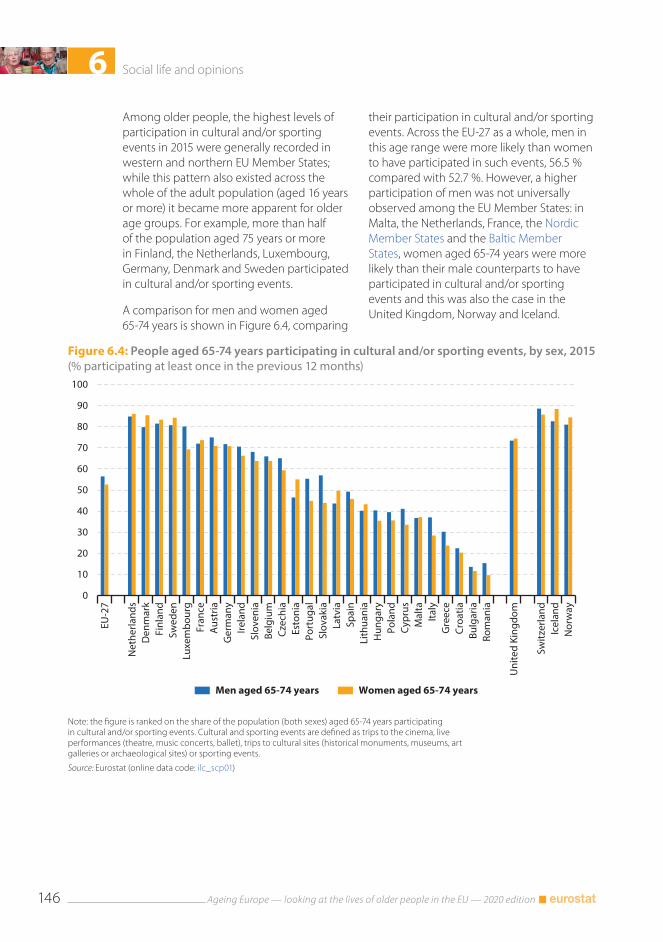
6 Social life and opinions
Ageing Europe — looking at the lives of older people in the EU — 2020 edition146
Figure 6.4: People aged 65-74 years participating in cultural and/or sporting events, by sex, 2015(% participating at least once in the previous 12 months)
0
10
20
30
40
50
60
70
80
90
100
EU-2
7
Net
herla
nds
Den
mar
kFi
nlan
dSw
eden
Luxe
mbo
urg
Fran
ceA
ustr
iaG
erm
any
Irela
ndSl
oven
iaBe
lgiu
mCz
echi
aEs
toni
aPo
rtug
alSl
ovak
iaLa
tvia
Spai
nLi
thua
nia
Hun
gary
Pola
ndCy
prus
Mal
taIta
lyG
reec
eCr
oatia
Bulg
aria
Rom
ania
Uni
ted
King
dom
Switz
erla
ndIc
elan
dN
orw
ay
Men aged 65-74 years Women aged 65-74 years
Note: the figure is ranked on the share of the population (both sexes) aged 65-74 years participating in cultural and/or sporting events. Cultural and sporting events are defined as trips to the cinema, live performances (theatre, music concerts, ballet), trips to cultural sites (historical monuments, museums, art galleries or archaeological sites) or sporting events.
Source: Eurostat (online data code: ilc_scp01)
Among older people, the highest levels of participation in cultural and/or sporting events in 2015 were generally recorded in western and northern EU Member States; while this pattern also existed across the whole of the adult population (aged 16 years or more) it became more apparent for older age groups. For example, more than half of the population aged 75 years or more in Finland, the Netherlands, Luxembourg, Germany, Denmark and Sweden participated in cultural and/or sporting events.
A comparison for men and women aged 65-74 years is shown in Figure 6.4, comparing
their participation in cultural and/or sporting events. Across the EU-27 as a whole, men in this age range were more likely than women to have participated in such events, 56.5 % compared with 52.7 %. However, a higher participation of men was not universally observed among the EU Member States: in Malta, the Netherlands, France, the Nordic Member States and the Baltic Member States, women aged 65-74 years were more likely than their male counterparts to have participated in cultural and/or sporting events and this was also the case in the United Kingdom, Norway and Iceland.
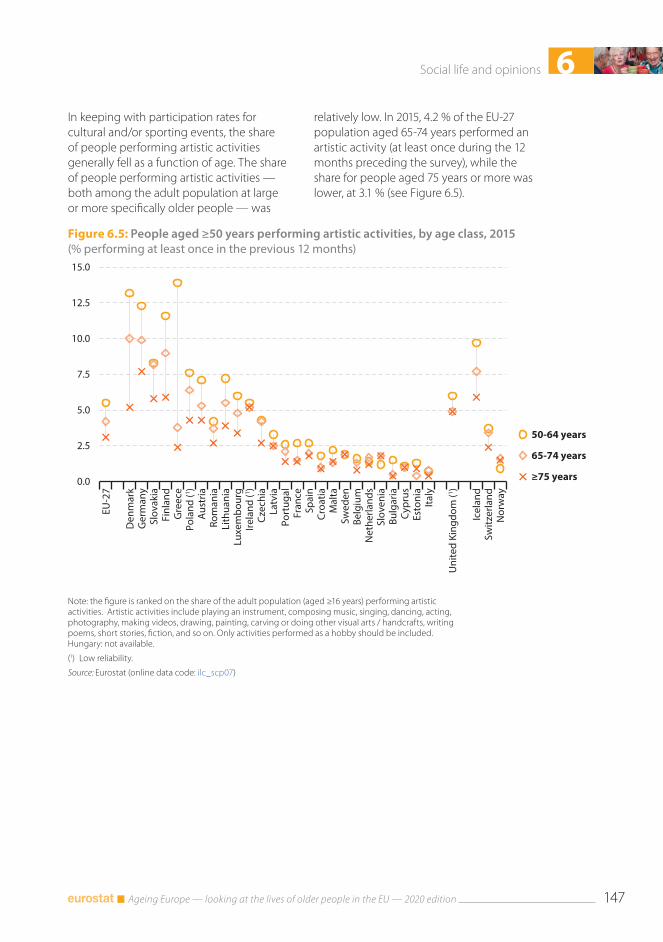
6Social life and opinions
Ageing Europe — looking at the lives of older people in the EU — 2020 edition 147
Figure 6.5: People aged ≥50 years performing artistic activities, by age class, 2015(% performing at least once in the previous 12 months)
0.0
2.5
5.0
7.5
10.0
12.5
15.0
EU-2
7
Den
mar
kG
erm
any
Slov
akia
Finl
and
Gre
ece
Pola
nd (1 )
Aus
tria
Rom
ania
Lith
uani
aLu
xem
bour
gIre
land
(1 )Cz
echi
aLa
tvia
Port
ugal
Fran
ceSp
ain
Croa
tiaM
alta
Swed
enBe
lgiu
mN
ethe
rland
sSl
oven
iaBu
lgar
iaCy
prus
Esto
nia
Italy
Uni
ted
King
dom
(1 )
Icel
and
Switz
erla
ndN
orw
ay
50-64 years
65-74 years
≥75 years
Note: the figure is ranked on the share of the adult population (aged ≥16 years) performing artistic activities. Artistic activities include playing an instrument, composing music, singing, dancing, acting, photography, making videos, drawing, painting, carving or doing other visual arts / handcrafts, writing poems, short stories, fiction, and so on. Only activities performed as a hobby should be included. Hungary: not available.
(1) Low reliability.
Source: Eurostat (online data code: ilc_scp07)
In keeping with participation rates for cultural and/or sporting events, the share of people performing artistic activities generally fell as a function of age. The share of people performing artistic activities — both among the adult population at large or more specifically older people — was
relatively low. In 2015, 4.2 % of the EU-27 population aged 65-74 years performed an artistic activity (at least once during the 12 months preceding the survey), while the share for people aged 75 years or more was lower, at 3.1 % (see Figure 6.5).
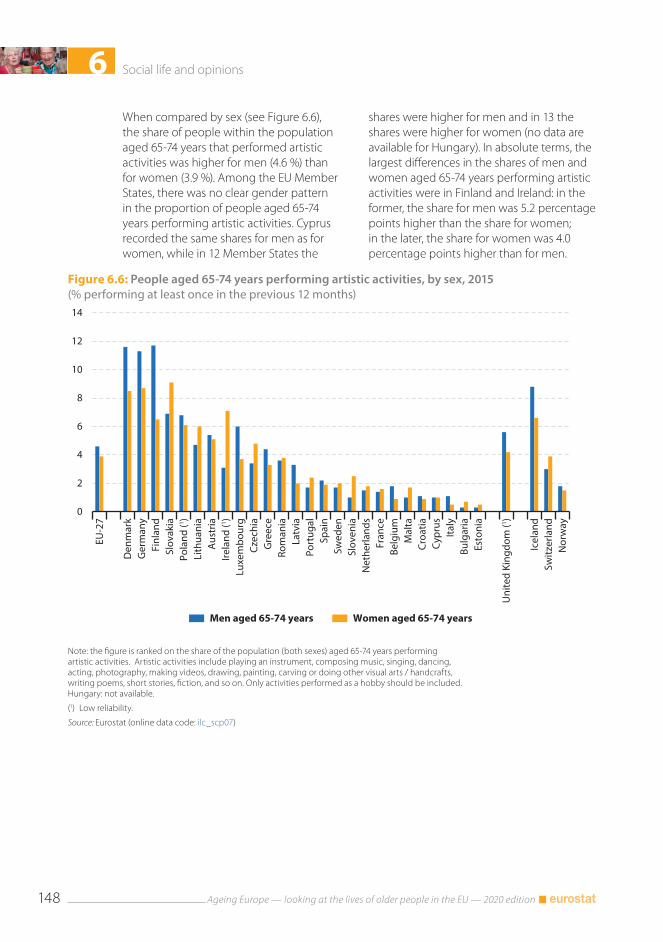
6 Social life and opinions
Ageing Europe — looking at the lives of older people in the EU — 2020 edition148
Figure 6.6: People aged 65-74 years performing artistic activities, by sex, 2015(% performing at least once in the previous 12 months)
0
2
4
6
8
10
12
14
EU-2
7
Den
mar
kG
erm
any
Finl
and
Slov
akia
Pola
nd (1 )
Lith
uani
aA
ustr
iaIre
land
(1 )Lu
xem
bour
gCz
echi
aG
reec
eRo
man
iaLa
tvia
Port
ugal
Spai
nSw
eden
Slov
enia
Net
herla
nds
Fran
ceBe
lgiu
mM
alta
Croa
tiaCy
prus
Italy
Bulg
aria
Esto
nia
Uni
ted
King
dom
(1 )
Icel
and
Switz
erla
ndN
orw
ay
Men aged 65-74 years Women aged 65-74 years
Note: the figure is ranked on the share of the population (both sexes) aged 65-74 years performing artistic activities. Artistic activities include playing an instrument, composing music, singing, dancing, acting, photography, making videos, drawing, painting, carving or doing other visual arts / handcrafts, writing poems, short stories, fiction, and so on. Only activities performed as a hobby should be included. Hungary: not available.
(1) Low reliability.
Source: Eurostat (online data code: ilc_scp07)
When compared by sex (see Figure 6.6), the share of people within the population aged 65-74 years that performed artistic activities was higher for men (4.6 %) than for women (3.9 %). Among the EU Member States, there was no clear gender pattern in the proportion of people aged 65-74 years performing artistic activities. Cyprus recorded the same shares for men as for women, while in 12 Member States the
shares were higher for men and in 13 the shares were higher for women (no data are available for Hungary). In absolute terms, the largest differences in the shares of men and women aged 65-74 years performing artistic activities were in Finland and Ireland: in the former, the share for men was 5.2 percentage points higher than the share for women; in the later, the share for women was 4.0 percentage points higher than for men.
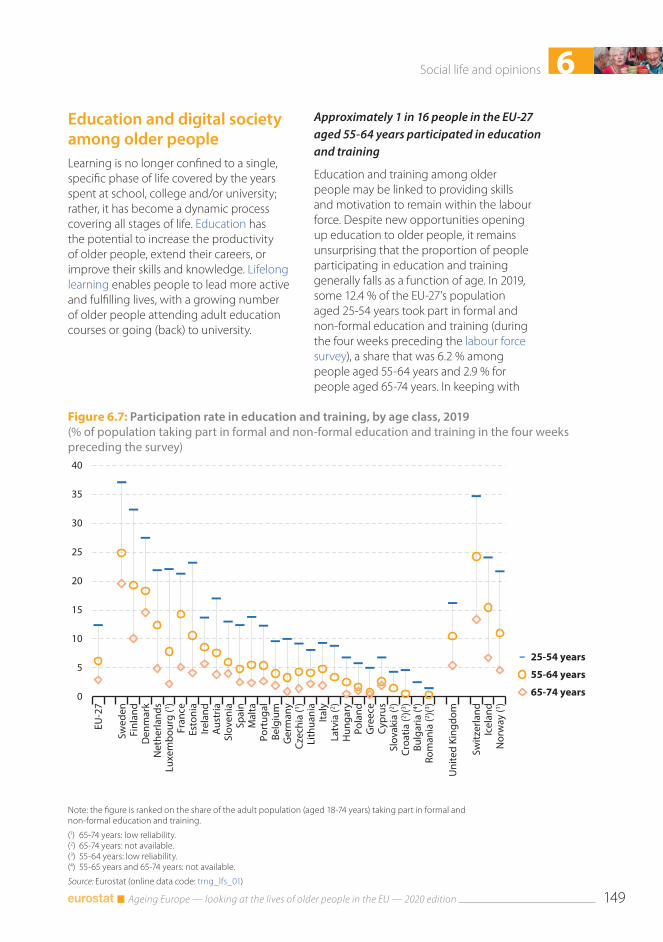
6Social life and opinions
Ageing Europe — looking at the lives of older people in the EU — 2020 edition 149
Figure 6.7: Participation rate in education and training, by age class, 2019(% of population taking part in formal and non-formal education and training in the four weeks preceding the survey)
0
5
10
15
20
25
30
35
40
EU-2
7
Swed
enFi
nlan
dD
enm
ark
Net
herla
nds
Luxe
mbo
urg
(1 )Fr
ance
Esto
nia
Irela
ndA
ustr
iaSl
oven
iaSp
ain
Mal
taPo
rtug
alBe
lgiu
mG
erm
any
Czec
hia
(1 )Li
thua
nia
Italy
Latv
ia (2 )
Hun
gary
Pola
ndG
reec
eCy
prus
Slov
akia
(2 )Cr
oatia
(2 )(3 )Bu
lgar
ia (4 )
Rom
ania
(2 )(3 )
Uni
ted
King
dom
Switz
erla
ndIc
elan
dN
orw
ay (1 )
25-54 years
55-64 years
65-74 years
Note: the figure is ranked on the share of the adult population (aged 18-74 years) taking part in formal and non-formal education and training.
(1) 65-74 years: low reliability.(2) 65-74 years: not available.(3) 55-64 years: low reliability.(4) 55-65 years and 65-74 years: not available.
Source: Eurostat (online data code: trng_lfs_01)
Education and digital society among older peopleLearning is no longer confined to a single, specific phase of life covered by the years spent at school, college and/or university; rather, it has become a dynamic process covering all stages of life. Education has the potential to increase the productivity of older people, extend their careers, or improve their skills and knowledge. Lifelong learning enables people to lead more active and fulfilling lives, with a growing number of older people attending adult education courses or going (back) to university.
Approximately 1 in 16 people in the EU-27 aged 55-64 years participated in education and training
Education and training among older people may be linked to providing skills and motivation to remain within the labour force. Despite new opportunities opening up education to older people, it remains unsurprising that the proportion of people participating in education and training generally falls as a function of age. In 2019, some 12.4 % of the EU-27’s population aged 25-54 years took part in formal and non-formal education and training (during the four weeks preceding the labour force survey), a share that was 6.2 % among people aged 55-64 years and 2.9 % for people aged 65-74 years. In keeping with
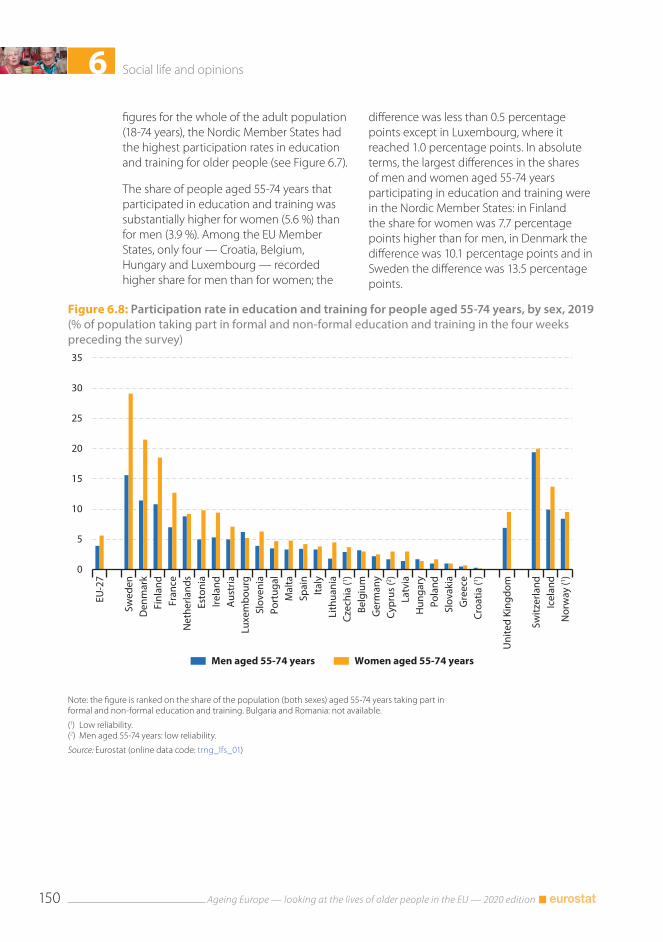
6 Social life and opinions
Ageing Europe — looking at the lives of older people in the EU — 2020 edition150
Figure 6.8: Participation rate in education and training for people aged 55-74 years, by sex, 2019(% of population taking part in formal and non-formal education and training in the four weeks preceding the survey)
0
5
10
15
20
25
30
35
EU-2
7
Swed
enD
enm
ark
Finl
and
Fran
ceN
ethe
rland
sEs
toni
aIre
land
Aus
tria
Luxe
mbo
urg
Slov
enia
Port
ugal
Mal
taSp
ain
Italy
Lith
uani
aCz
echi
a (1 )
Belg
ium
Ger
man
yCy
prus
(2 )La
tvia
Hun
gary
Pola
ndSl
ovak
iaG
reec
eCr
oatia
(1 )
Uni
ted
King
dom
Switz
erla
ndIc
elan
dN
orw
ay (1 )
Men aged 55-74 years Women aged 55-74 years
Note: the figure is ranked on the share of the population (both sexes) aged 55-74 years taking part in formal and non-formal education and training. Bulgaria and Romania: not available.
(1) Low reliability.(2) Men aged 55-74 years: low reliability.
Source: Eurostat (online data code: trng_lfs_01)
figures for the whole of the adult population (18-74 years), the Nordic Member States had the highest participation rates in education and training for older people (see Figure 6.7).
The share of people aged 55-74 years that participated in education and training was substantially higher for women (5.6 %) than for men (3.9 %). Among the EU Member States, only four — Croatia, Belgium, Hungary and Luxembourg — recorded higher share for men than for women; the
difference was less than 0.5 percentage points except in Luxembourg, where it reached 1.0 percentage points. In absolute terms, the largest differences in the shares of men and women aged 55-74 years participating in education and training were in the Nordic Member States: in Finland the share for women was 7.7 percentage points higher than for men, in Denmark the difference was 10.1 percentage points and in Sweden the difference was 13.5 percentage points.
6Social life and opinions
Ageing Europe — looking at the lives of older people in the EU — 2020 edition 151
More than two fifths of people aged 65-74 years had never used a computer …
There is a digital divide between the generations: this term describes the gap between age groups in terms of their access to and use of modern information and communications technologies (ICTs); such technologies typically include mobile telephones, personal computers, laptops, tablets, the internet and related services.
The information presented in this section is taken from the annual Community survey on ICT usage in households and by individuals. It reveals that older people are generally closing the digital divide; nevertheless, they remain relatively slow to adopt new technologies. Older men tend to be more likely than older women to make use of digital technologies; this may be linked to older men having been more exposed to new technologies in the workplace (either due to their choice of occupation or simply because a higher proportion of men than women work). These differences between the sexes may explain, at least in part, why the use of ICTs falls away for increasingly older age groups (a development that is magnified due to women accounting for a
much larger share of survivors within this age category). By contrast, there is less evidence of a digital divide between the sexes among younger generations, for example, almost all young men and women make use of the internet on a daily basis.
While younger generations may find it difficult to imagine life without a smartphone or a personal computer / laptop, there were still one quarter (25 %) of people aged 55-64 years and more than two fifths (44 %) of people aged 65-74 years in the EU-27 in 2017 who had never used a computer. Across the EU Member States, the share of people aged 65-74 years having never used a computer was just higher than two thirds in Italy and Romania, and nearer to three quarters in Croatia (73 %), Bulgaria (74 %) and Greece (78 %). Figure 6.9 shows that a lower proportion of older people in 2017 had never used a computer than was the case for their counterparts in 2008: between 2008 and 2017, the share of the EU-27 population aged 55-64 years never having used a computer fell from 47 % to 25 % (with a reduction recorded for every Member State) while for the age group 65-74 years the share fell from 70 % to 44 %.
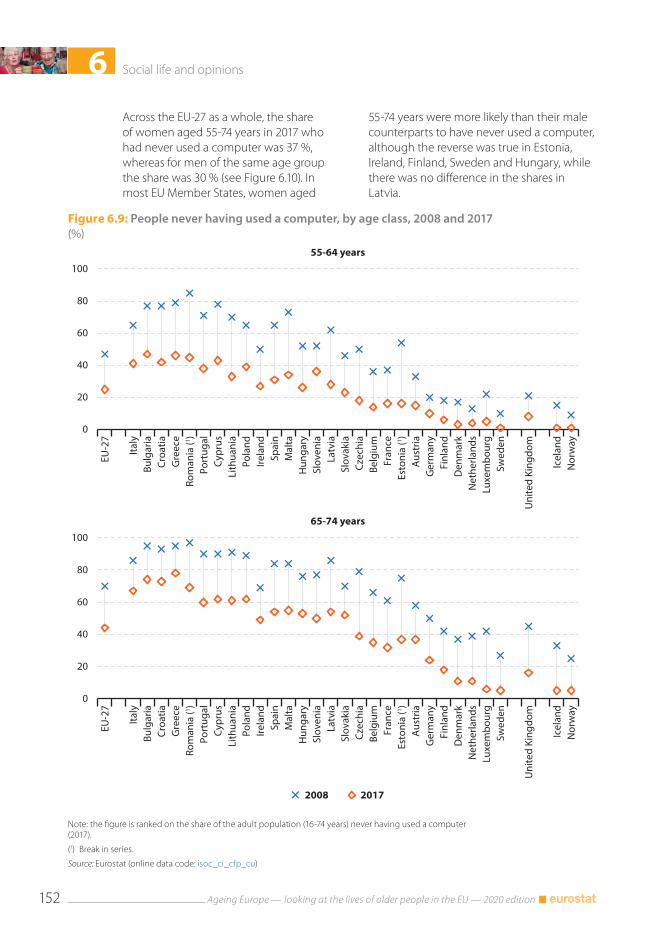
6 Social life and opinions
Ageing Europe — looking at the lives of older people in the EU — 2020 edition152
Figure 6.9: People never having used a computer, by age class, 2008 and 2017(%)
0
20
40
60
80
100
EU-2
7
Italy
Bulg
aria
Croa
tiaG
reec
eRo
man
ia (1 )
Port
ugal
Cypr
usLi
thua
nia
Pola
ndIre
land
Spai
nM
alta
Hun
gary
Slov
enia
Latv
iaSl
ovak
iaCz
echi
aBe
lgiu
mFr
ance
Esto
nia
(1 )A
ustr
iaG
erm
any
Finl
and
Den
mar
kN
ethe
rland
sLu
xem
bour
gSw
eden
Uni
ted
King
dom
Icel
and
Nor
way
55-64 years
0
20
40
60
80
100
EU-2
7
Italy
Bulg
aria
Croa
tiaG
reec
eRo
man
ia (1 )
Port
ugal
Cypr
usLi
thua
nia
Pola
ndIre
land
Spai
nM
alta
Hun
gary
Slov
enia
Latv
iaSl
ovak
iaCz
echi
aBe
lgiu
mFr
ance
Esto
nia
(1 )A
ustr
iaG
erm
any
Finl
and
Den
mar
kN
ethe
rland
sLu
xem
bour
gSw
eden
Uni
ted
King
dom
Icel
and
Nor
way
2008 2017
65-74 years
Note: the figure is ranked on the share of the adult population (16-74 years) never having used a computer (2017).
(1) Break in series.
Source: Eurostat (online data code: isoc_ci_cfp_cu)
Across the EU-27 as a whole, the share of women aged 55-74 years in 2017 who had never used a computer was 37 %, whereas for men of the same age group the share was 30 % (see Figure 6.10). In most EU Member States, women aged
55-74 years were more likely than their male counterparts to have never used a computer, although the reverse was true in Estonia, Ireland, Finland, Sweden and Hungary, while there was no difference in the shares in Latvia.
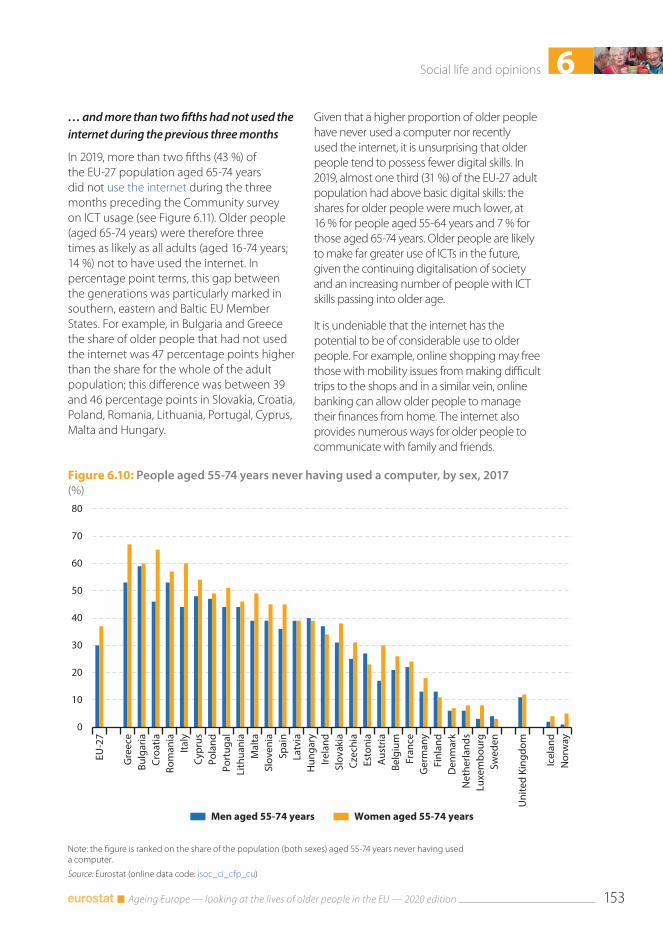
6Social life and opinions
Ageing Europe — looking at the lives of older people in the EU — 2020 edition 153
Figure 6.10: People aged 55-74 years never having used a computer, by sex, 2017(%)
0
10
20
30
40
50
60
70
80
EU-2
7
Gre
ece
Bulg
aria
Croa
tiaRo
man
iaIta
lyCy
prus
Pola
ndPo
rtug
alLi
thua
nia
Mal
taSl
oven
iaSp
ain
Latv
iaH
unga
ryIre
land
Slov
akia
Czec
hia
Esto
nia
Aus
tria
Belg
ium
Fran
ceG
erm
any
Finl
and
Den
mar
kN
ethe
rland
sLu
xem
bour
gSw
eden
Uni
ted
King
dom
Icel
and
Nor
way
Men aged 55-74 years Women aged 55-74 years
Note: the figure is ranked on the share of the population (both sexes) aged 55-74 years never having used a computer.
Source: Eurostat (online data code: isoc_ci_cfp_cu)
… and more than two fifths had not used the internet during the previous three months
In 2019, more than two fifths (43 %) of the EU-27 population aged 65-74 years did not use the internet during the three months preceding the Community survey on ICT usage (see Figure 6.11). Older people (aged 65-74 years) were therefore three times as likely as all adults (aged 16-74 years; 14 %) not to have used the internet. In percentage point terms, this gap between the generations was particularly marked in southern, eastern and Baltic EU Member States. For example, in Bulgaria and Greece the share of older people that had not used the internet was 47 percentage points higher than the share for the whole of the adult population; this difference was between 39 and 46 percentage points in Slovakia, Croatia, Poland, Romania, Lithuania, Portugal, Cyprus, Malta and Hungary.
Given that a higher proportion of older people have never used a computer nor recently used the internet, it is unsurprising that older people tend to possess fewer digital skills. In 2019, almost one third (31 %) of the EU-27 adult population had above basic digital skills: the shares for older people were much lower, at 16 % for people aged 55-64 years and 7 % for those aged 65-74 years. Older people are likely to make far greater use of ICTs in the future, given the continuing digitalisation of society and an increasing number of people with ICT skills passing into older age.
It is undeniable that the internet has the potential to be of considerable use to older people. For example, online shopping may free those with mobility issues from making difficult trips to the shops and in a similar vein, online banking can allow older people to manage their finances from home. The internet also provides numerous ways for older people to communicate with family and friends.
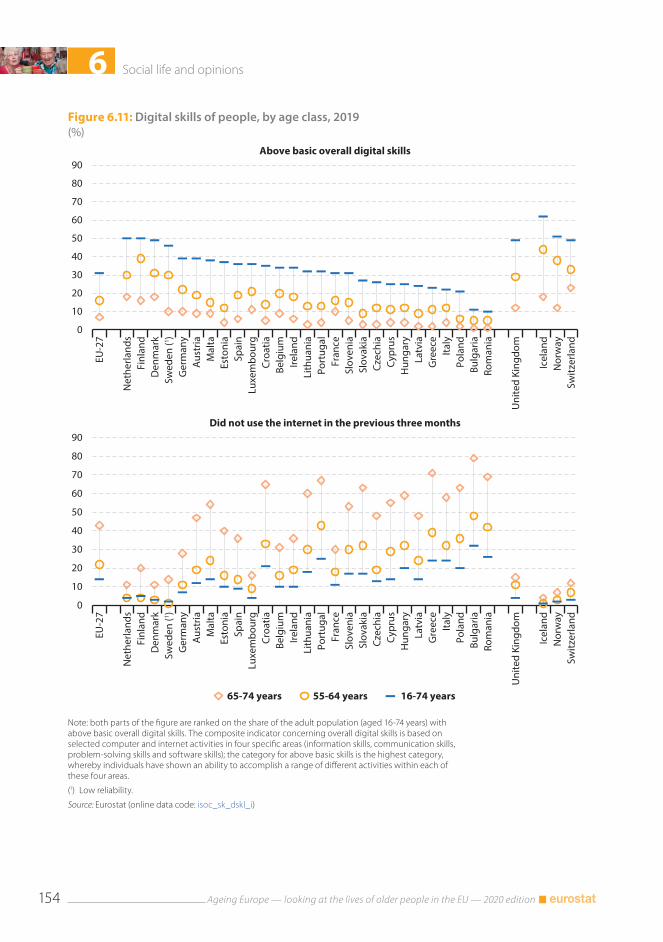
6 Social life and opinions
Ageing Europe — looking at the lives of older people in the EU — 2020 edition154
Figure 6.11: Digital skills of people, by age class, 2019(%)
0
10
20
30
40
50
60
70
80
90
EU-2
7
Net
herla
nds
Finl
and
Den
mar
kSw
eden
(1 )G
erm
any
Aus
tria
Mal
taEs
toni
aSp
ain
Luxe
mbo
urg
Croa
tiaBe
lgiu
mIre
land
Lith
uani
aPo
rtug
alFr
ance
Slov
enia
Slov
akia
Czec
hia
Cypr
usH
unga
ryLa
tvia
Gre
ece
Italy
Pola
ndBu
lgar
iaRo
man
ia
Uni
ted
King
dom
Icel
and
Nor
way
Switz
erla
nd
Above basic overall digital skills
0
10
20
30
40
50
60
70
80
90
EU-2
7
Net
herla
nds
Finl
and
Den
mar
kSw
eden
(1 )G
erm
any
Aus
tria
Mal
taEs
toni
aSp
ain
Luxe
mbo
urg
Croa
tiaBe
lgiu
mIre
land
Lith
uani
aPo
rtug
alFr
ance
Slov
enia
Slov
akia
Czec
hia
Cypr
usH
unga
ryLa
tvia
Gre
ece
Italy
Pola
ndBu
lgar
iaRo
man
ia
Uni
ted
King
dom
Icel
and
Nor
way
Switz
erla
nd
65-74 years 55-64 years 16-74 years
Did not use the internet in the previous three months
Note: both parts of the figure are ranked on the share of the adult population (aged 16-74 years) with above basic overall digital skills. The composite indicator concerning overall digital skills is based on selected computer and internet activities in four specific areas (information skills, communication skills, problem-solving skills and software skills); the category for above basic skills is the highest category, whereby individuals have shown an ability to accomplish a range of different activities within each of these four areas.
(1) Low reliability.
Source: Eurostat (online data code: isoc_sk_dskl_i)
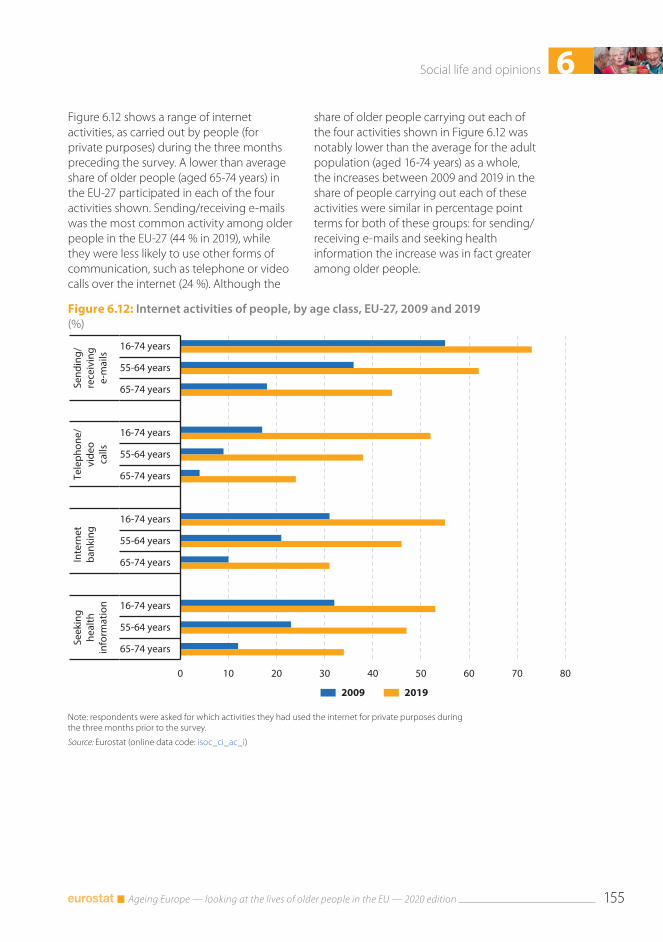
6Social life and opinions
Ageing Europe — looking at the lives of older people in the EU — 2020 edition 155
Figure 6.12: Internet activities of people, by age class, EU-27, 2009 and 2019(%)
0 10 20 30 40 50 60 70 80
16-74 years
55-64 years
65-74 years
16-74 years
55-64 years
65-74 years
16-74 years
55-64 years
65-74 years
16-74 years
55-64 years
65-74 years
Send
ing/
rece
ivin
ge-
mai
ls
Tele
phon
e/vi
deo
calls
Inte
rnet
bank
ing
Seek
ing
heal
thin
form
atio
n
2009 2019
Note: respondents were asked for which activities they had used the internet for private purposes during the three months prior to the survey.
Source: Eurostat (online data code: isoc_ci_ac_i)
Figure 6.12 shows a range of internet activities, as carried out by people (for private purposes) during the three months preceding the survey. A lower than average share of older people (aged 65-74 years) in the EU-27 participated in each of the four activities shown. Sending/receiving e-mails was the most common activity among older people in the EU-27 (44 % in 2019), while they were less likely to use other forms of communication, such as telephone or video calls over the internet (24 %). Although the
share of older people carrying out each of the four activities shown in Figure 6.12 was notably lower than the average for the adult population (aged 16-74 years) as a whole, the increases between 2009 and 2019 in the share of people carrying out each of these activities were similar in percentage point terms for both of these groups: for sending/receiving e-mails and seeking health information the increase was in fact greater among older people.
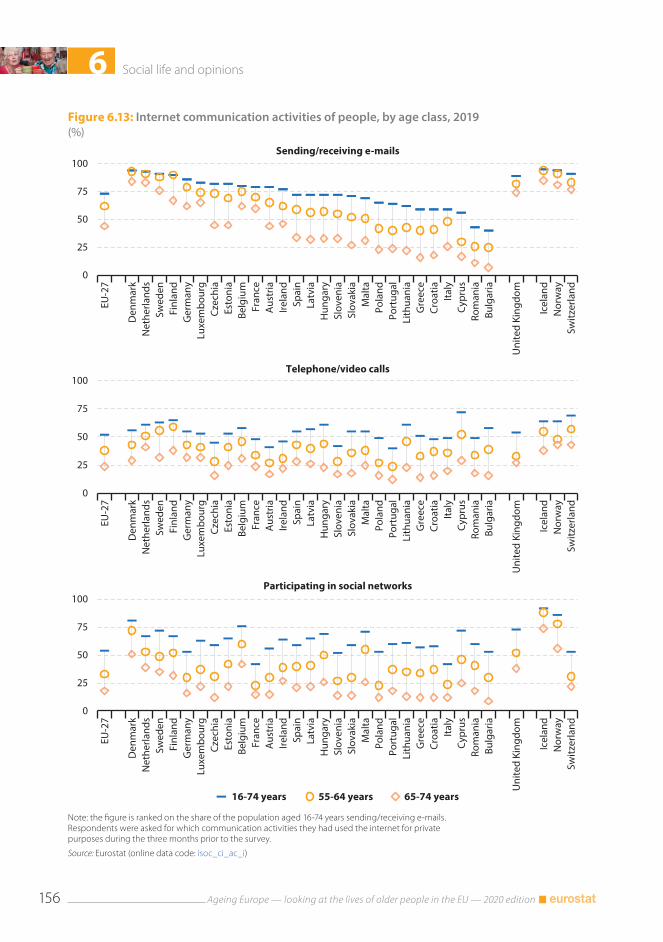
6 Social life and opinions
Ageing Europe — looking at the lives of older people in the EU — 2020 edition156
Figure 6.13: Internet communication activities of people, by age class, 2019(%)
0
25
50
75
100
EU-2
7
Den
mar
kN
ethe
rland
sSw
eden
Finl
and
Ger
man
yLu
xem
bour
gCz
echi
aEs
toni
aBe
lgiu
mFr
ance
Aus
tria
Irela
ndSp
ain
Latv
iaH
unga
rySl
oven
iaSl
ovak
iaM
alta
Pola
ndPo
rtug
alLi
thua
nia
Gre
ece
Croa
tiaIta
lyCy
prus
Rom
ania
Bulg
aria
Uni
ted
King
dom
Icel
and
Nor
way
Switz
erla
nd
Sending/receiving e-mails
0
25
50
75
100
EU-2
7
Den
mar
kN
ethe
rland
sSw
eden
Finl
and
Ger
man
yLu
xem
bour
gCz
echi
aEs
toni
aBe
lgiu
mFr
ance
Aus
tria
Irela
ndSp
ain
Latv
iaH
unga
rySl
oven
iaSl
ovak
iaM
alta
Pola
ndPo
rtug
alLi
thua
nia
Gre
ece
Croa
tiaIta
lyCy
prus
Rom
ania
Bulg
aria
Uni
ted
King
dom
Icel
and
Nor
way
Switz
erla
nd
Telephone/video calls
0
25
50
75
100
EU-2
7
Den
mar
kN
ethe
rland
sSw
eden
Finl
and
Ger
man
yLu
xem
bour
gCz
echi
aEs
toni
aBe
lgiu
mFr
ance
Aus
tria
Irela
ndSp
ain
Latv
iaH
unga
rySl
oven
iaSl
ovak
iaM
alta
Pola
ndPo
rtug
alLi
thua
nia
Gre
ece
Croa
tiaIta
lyCy
prus
Rom
ania
Bulg
aria
Uni
ted
King
dom
Icel
and
Nor
way
Switz
erla
nd
16-74 years 55-64 years 65-74 years
Participating in social networks
Note: the figure is ranked on the share of the population aged 16-74 years sending/receiving e-mails. Respondents were asked for which communication activities they had used the internet for private purposes during the three months prior to the survey.
Source: Eurostat (online data code: isoc_ci_ac_i)
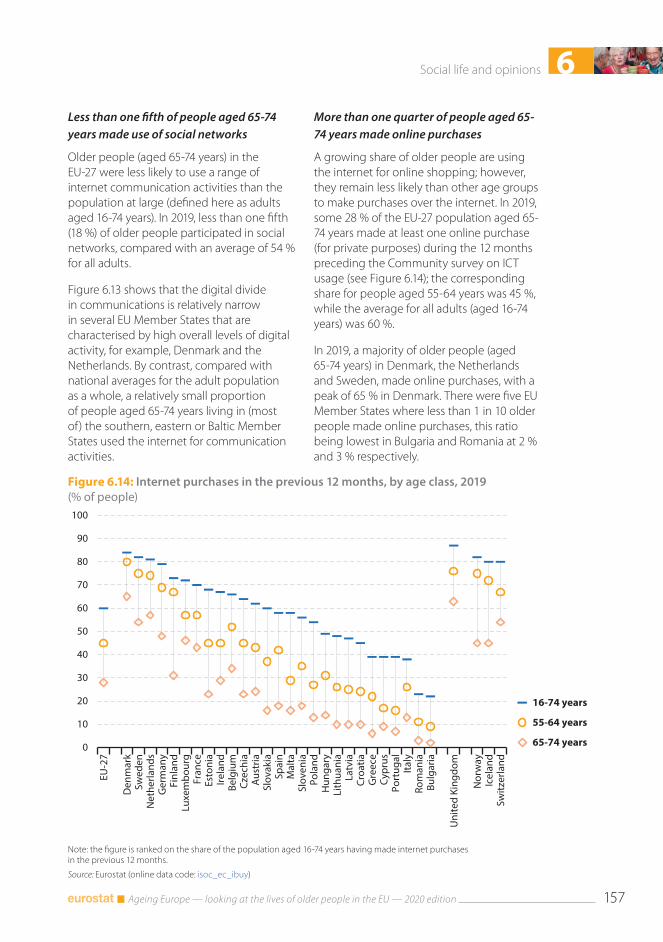
6Social life and opinions
Ageing Europe — looking at the lives of older people in the EU — 2020 edition 157
Figure 6.14: Internet purchases in the previous 12 months, by age class, 2019(% of people)
0
10
20
30
40
50
60
70
80
90
100
EU-2
7
Den
mar
kSw
eden
Net
herla
nds
Ger
man
yFi
nlan
dLu
xem
bour
gFr
ance
Esto
nia
Irela
ndBe
lgiu
mCz
echi
aA
ustr
iaSl
ovak
iaSp
ain
Mal
taSl
oven
iaPo
land
Hun
gary
Lith
uani
aLa
tvia
Croa
tiaG
reec
eCy
prus
Port
ugal
Italy
Rom
ania
Bulg
aria
Uni
ted
King
dom
Nor
way
Icel
and
Switz
erla
nd
16-74 years
55-64 years
65-74 years
Note: the figure is ranked on the share of the population aged 16-74 years having made internet purchases in the previous 12 months.
Source: Eurostat (online data code: isoc_ec_ibuy)
Less than one fifth of people aged 65-74 years made use of social networks
Older people (aged 65-74 years) in the EU-27 were less likely to use a range of internet communication activities than the population at large (defined here as adults aged 16-74 years). In 2019, less than one fifth (18 %) of older people participated in social networks, compared with an average of 54 % for all adults.
Figure 6.13 shows that the digital divide in communications is relatively narrow in several EU Member States that are characterised by high overall levels of digital activity, for example, Denmark and the Netherlands. By contrast, compared with national averages for the adult population as a whole, a relatively small proportion of people aged 65-74 years living in (most of) the southern, eastern or Baltic Member States used the internet for communication activities.
More than one quarter of people aged 65-74 years made online purchases
A growing share of older people are using the internet for online shopping; however, they remain less likely than other age groups to make purchases over the internet. In 2019, some 28 % of the EU-27 population aged 65-74 years made at least one online purchase (for private purposes) during the 12 months preceding the Community survey on ICT usage (see Figure 6.14); the corresponding share for people aged 55-64 years was 45 %, while the average for all adults (aged 16-74 years) was 60 %.
In 2019, a majority of older people (aged 65-74 years) in Denmark, the Netherlands and Sweden, made online purchases, with a peak of 65 % in Denmark. There were five EU Member States where less than 1 in 10 older people made online purchases, this ratio being lowest in Bulgaria and Romania at 2 % and 3 % respectively.
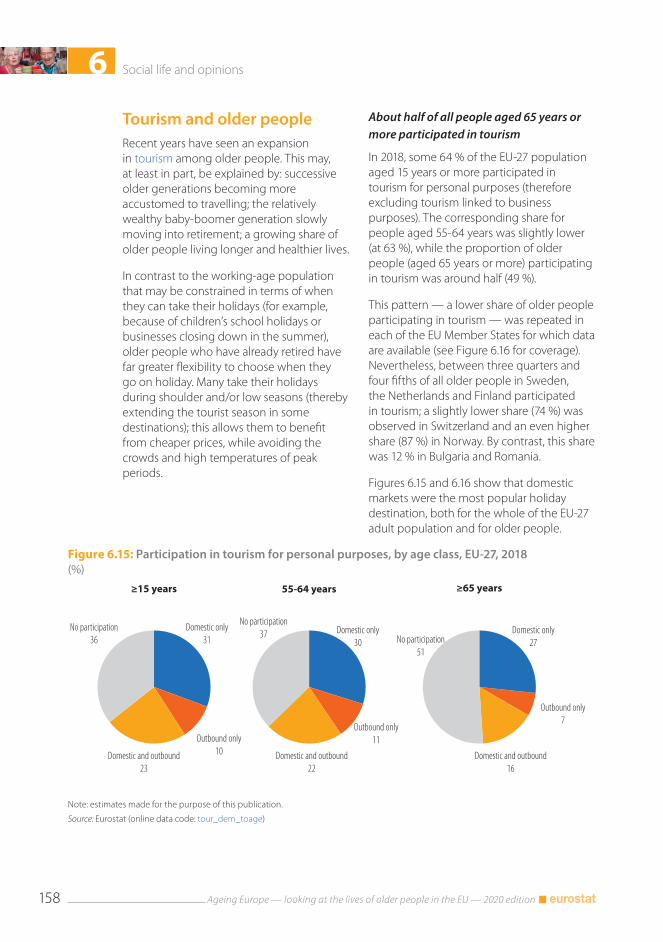
6 Social life and opinions
Ageing Europe — looking at the lives of older people in the EU — 2020 edition158
Figure 6.15: Participation in tourism for personal purposes, by age class, EU-27, 2018(%)
Domestic only31
Outbound only10Domestic and outbound
23
No participation36
≥15 years
Domestic only30
Outbound only11
Domestic and outbound22
No participation37
55-64 years
Domestic only27
Outbound only7
Domestic and outbound16
No participation51
≥65 years
Note: estimates made for the purpose of this publication.
Source: Eurostat (online data code: tour_dem_toage)
Tourism and older peopleRecent years have seen an expansion in tourism among older people. This may, at least in part, be explained by: successive older generations becoming more accustomed to travelling; the relatively wealthy baby-boomer generation slowly moving into retirement; a growing share of older people living longer and healthier lives.
In contrast to the working-age population that may be constrained in terms of when they can take their holidays (for example, because of children’s school holidays or businesses closing down in the summer), older people who have already retired have far greater flexibility to choose when they go on holiday. Many take their holidays during shoulder and/or low seasons (thereby extending the tourist season in some destinations); this allows them to benefit from cheaper prices, while avoiding the crowds and high temperatures of peak periods.
About half of all people aged 65 years or more participated in tourism
In 2018, some 64 % of the EU-27 population aged 15 years or more participated in tourism for personal purposes (therefore excluding tourism linked to business purposes). The corresponding share for people aged 55-64 years was slightly lower (at 63 %), while the proportion of older people (aged 65 years or more) participating in tourism was around half (49 %).
This pattern — a lower share of older people participating in tourism — was repeated in each of the EU Member States for which data are available (see Figure 6.16 for coverage). Nevertheless, between three quarters and four fifths of all older people in Sweden, the Netherlands and Finland participated in tourism; a slightly lower share (74 %) was observed in Switzerland and an even higher share (87 %) in Norway. By contrast, this share was 12 % in Bulgaria and Romania.
Figures 6.15 and 6.16 show that domestic markets were the most popular holiday destination, both for the whole of the EU-27 adult population and for older people.
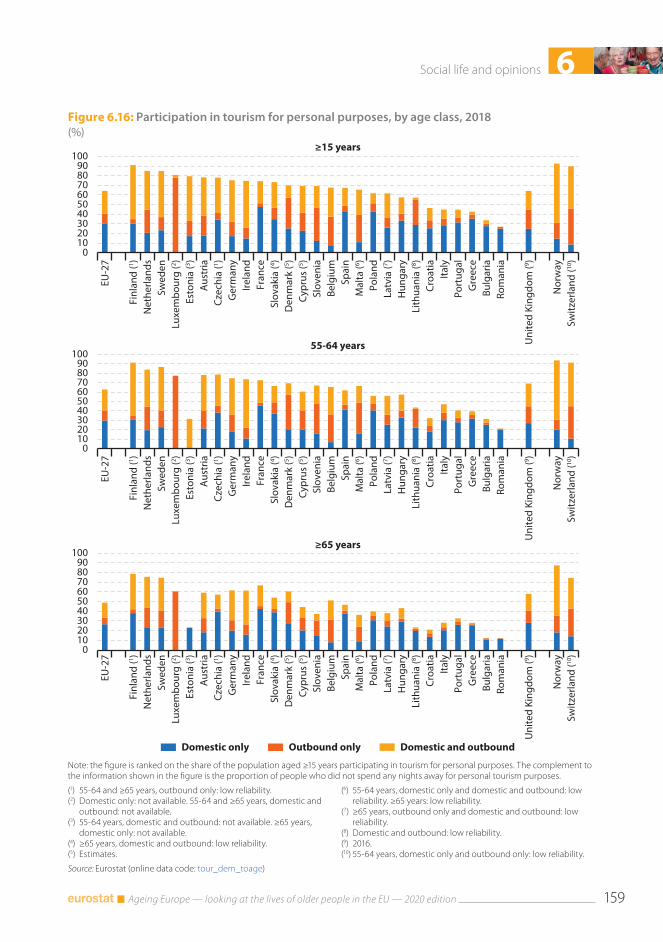
6Social life and opinions
Ageing Europe — looking at the lives of older people in the EU — 2020 edition 159
Figure 6.16: Participation in tourism for personal purposes, by age class, 2018(%)
0102030405060708090
100
EU-2
7
Finl
and
(1 )N
ethe
rland
sSw
eden
Luxe
mbo
urg
(2 )Es
toni
a (3 )
Aus
tria
Czec
hia
(1 )G
erm
any
Irela
ndFr
ance
Slov
akia
(4 )D
enm
ark
(5 )Cy
prus
(5 )Sl
oven
iaBe
lgiu
mSp
ain
Mal
ta (6 )
Pola
ndLa
tvia
(7 )H
unga
ryLi
thua
nia
(8 )Cr
oatia
Italy
Port
ugal
Gre
ece
Bulg
aria
Rom
ania
Uni
ted
King
dom
(9 )
Nor
way
Switz
erla
nd (10
)
≥15 years
0102030405060708090
100
EU-2
7
Finl
and
(1 )N
ethe
rland
sSw
eden
Luxe
mbo
urg
(2 )Es
toni
a (3 )
Aus
tria
Czec
hia
(1 )G
erm
any
Irela
ndFr
ance
Slov
akia
(4 )D
enm
ark
(5 )Cy
prus
(5 )Sl
oven
iaBe
lgiu
mSp
ain
Mal
ta (6 )
Pola
ndLa
tvia
(7 )H
unga
ryLi
thua
nia
(8 )Cr
oatia
Italy
Port
ugal
Gre
ece
Bulg
aria
Rom
ania
Uni
ted
King
dom
(9 )
Nor
way
Switz
erla
nd (10
)
55-64 years
0102030405060708090
100
EU-2
7
Finl
and
(1 )N
ethe
rland
sSw
eden
Luxe
mbo
urg
(2 )Es
toni
a (3 )
Aus
tria
Czec
hia
(1 )G
erm
any
Irela
ndFr
ance
Slov
akia
(4 )D
enm
ark
(5 )Cy
prus
(5 )Sl
oven
iaBe
lgiu
mSp
ain
Mal
ta (6 )
Pola
ndLa
tvia
(7 )H
unga
ryLi
thua
nia
(8 )Cr
oatia
Italy
Port
ugal
Gre
ece
Bulg
aria
Rom
ania
Uni
ted
King
dom
(9 )
Nor
way
Switz
erla
nd (10
)
Domestic and outboundOutbound onlyDomestic only
≥65 years
Note: the figure is ranked on the share of the population aged ≥15 years participating in tourism for personal purposes. The complement to the information shown in the figure is the proportion of people who did not spend any nights away for personal tourism purposes.
(1) 55-64 and ≥65 years, outbound only: low reliability.(2) Domestic only: not available. 55-64 and ≥65 years, domestic and
outbound: not available.(3) 55-64 years, domestic and outbound: not available. ≥65 years,
domestic only: not available.(4) ≥65 years, domestic and outbound: low reliability.(5) Estimates.
(6) 55-64 years, domestic only and domestic and outbound: low reliability. ≥65 years: low reliability.
(7) ≥65 years, outbound only and domestic and outbound: low reliability.
(8) Domestic and outbound: low reliability.(9) 2016.(10) 55-64 years, domestic only and outbound only: low reliability.
Source: Eurostat (online data code: tour_dem_toage)
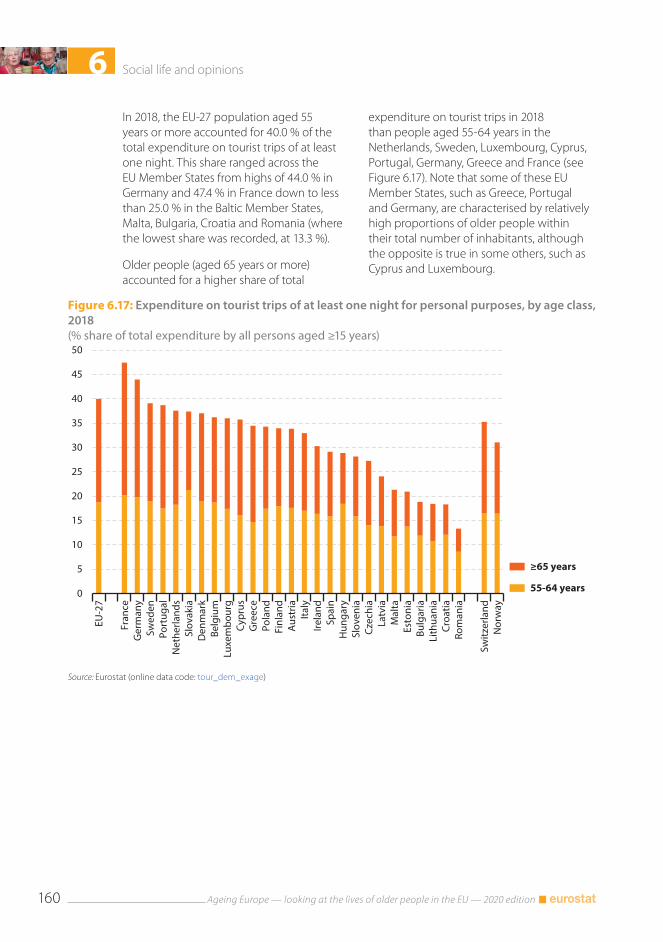
6 Social life and opinions
Ageing Europe — looking at the lives of older people in the EU — 2020 edition160
Figure 6.17: Expenditure on tourist trips of at least one night for personal purposes, by age class, 2018(% share of total expenditure by all persons aged ≥15 years)
0
5
10
15
20
25
30
35
40
45
50
EU-2
7
Fran
ceG
erm
any
Swed
enPo
rtug
alN
ethe
rland
sSl
ovak
iaD
enm
ark
Belg
ium
Luxe
mbo
urg
Cypr
usG
reec
ePo
land
Finl
and
Aus
tria
Italy
Irela
ndSp
ain
Hun
gary
Slov
enia
Czec
hia
Latv
iaM
alta
Esto
nia
Bulg
aria
Lith
uani
aCr
oatia
Rom
ania
Switz
erla
ndN
orw
ay
≥65 years
55-64 years
Source: Eurostat (online data code: tour_dem_exage)
In 2018, the EU-27 population aged 55 years or more accounted for 40.0 % of the total expenditure on tourist trips of at least one night. This share ranged across the EU Member States from highs of 44.0 % in Germany and 47.4 % in France down to less than 25.0 % in the Baltic Member States, Malta, Bulgaria, Croatia and Romania (where the lowest share was recorded, at 13.3 %).
Older people (aged 65 years or more) accounted for a higher share of total
expenditure on tourist trips in 2018 than people aged 55-64 years in the Netherlands, Sweden, Luxembourg, Cyprus, Portugal, Germany, Greece and France (see Figure 6.17). Note that some of these EU Member States, such as Greece, Portugal and Germany, are characterised by relatively high proportions of older people within their total number of inhabitants, although the opposite is true in some others, such as Cyprus and Luxembourg.
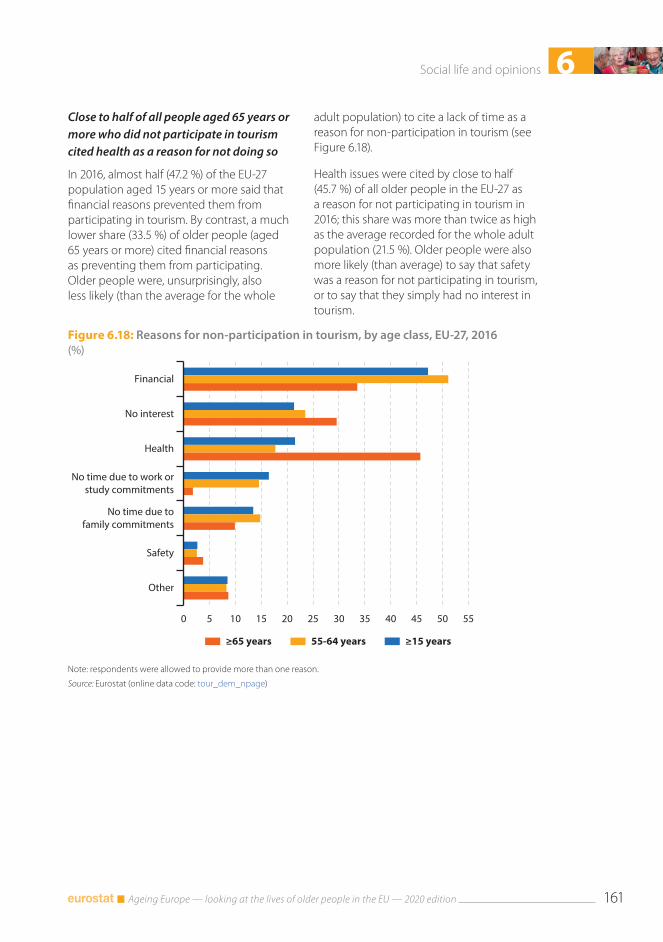
6Social life and opinions
Ageing Europe — looking at the lives of older people in the EU — 2020 edition 161
Figure 6.18: Reasons for non-participation in tourism, by age class, EU-27, 2016(%)
0 5 10 15 20 25 30 35 40 45 50 55
Financial
No interest
Health
No time due to work or study commitments
No time due tofamily commitments
Safety
Other
≥15 years55-64 years≥65 years
Note: respondents were allowed to provide more than one reason.
Source: Eurostat (online data code: tour_dem_npage)
Close to half of all people aged 65 years or more who did not participate in tourism cited health as a reason for not doing so
In 2016, almost half (47.2 %) of the EU-27 population aged 15 years or more said that financial reasons prevented them from participating in tourism. By contrast, a much lower share (33.5 %) of older people (aged 65 years or more) cited financial reasons as preventing them from participating. Older people were, unsurprisingly, also less likely (than the average for the whole
adult population) to cite a lack of time as a reason for non-participation in tourism (see Figure 6.18).
Health issues were cited by close to half (45.7 %) of all older people in the EU-27 as a reason for not participating in tourism in 2016; this share was more than twice as high as the average recorded for the whole adult population (21.5 %). Older people were also more likely (than average) to say that safety was a reason for not participating in tourism, or to say that they simply had no interest in tourism.
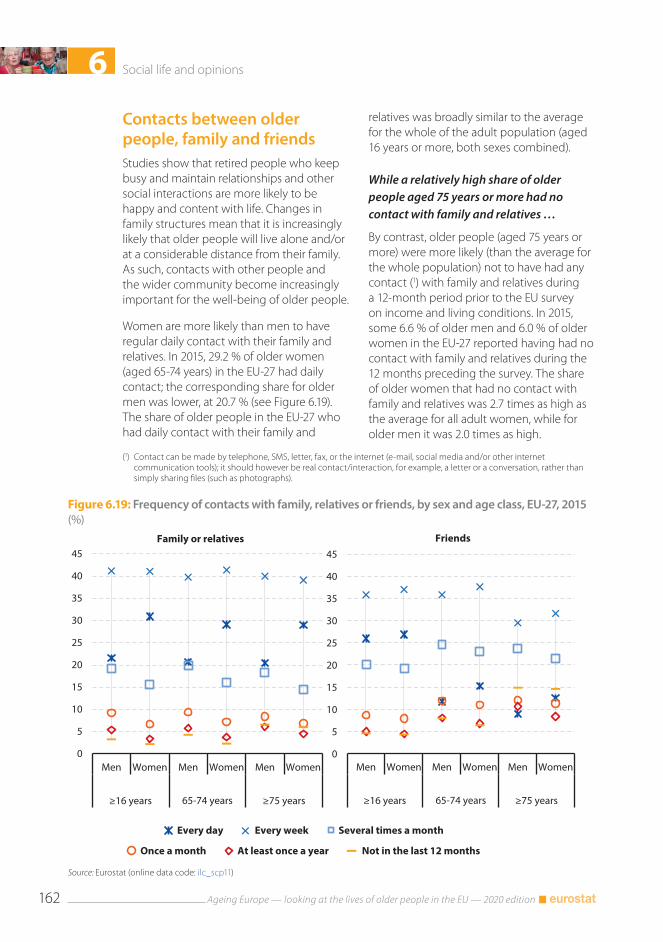
6 Social life and opinions
Ageing Europe — looking at the lives of older people in the EU — 2020 edition162
Figure 6.19: Frequency of contacts with family, relatives or friends, by sex and age class, EU-27, 2015(%)
0
5
10
15
20
25
30
35
40
45
Men Women Men Women Men Women
≥16 years 65-74 years ≥75 years
Family or relatives
Once a month At least once a year Not in the last 12 months
Every day Several times a monthEvery week
0
5
10
15
20
25
30
35
40
45
Men Women Men Women Men Women
≥16 years 65-74 years ≥75 years
Friends
Source: Eurostat (online data code: ilc_scp11)
Contacts between older people, family and friendsStudies show that retired people who keep busy and maintain relationships and other social interactions are more likely to be happy and content with life. Changes in family structures mean that it is increasingly likely that older people will live alone and/or at a considerable distance from their family. As such, contacts with other people and the wider community become increasingly important for the well-being of older people.
Women are more likely than men to have regular daily contact with their family and relatives. In 2015, 29.2 % of older women (aged 65-74 years) in the EU-27 had daily contact; the corresponding share for older men was lower, at 20.7 % (see Figure 6.19). The share of older people in the EU-27 who had daily contact with their family and
(1) Contact can be made by telephone, SMS, letter, fax, or the internet (e-mail, social media and/or other internet communication tools); it should however be real contact/interaction, for example, a letter or a conversation, rather than simply sharing files (such as photographs).
relatives was broadly similar to the average for the whole of the adult population (aged 16 years or more, both sexes combined).
While a relatively high share of older people aged 75 years or more had no contact with family and relatives …
By contrast, older people (aged 75 years or more) were more likely (than the average for the whole population) not to have had any contact (1) with family and relatives during a 12-month period prior to the EU survey on income and living conditions. In 2015, some 6.6 % of older men and 6.0 % of older women in the EU-27 reported having had no contact with family and relatives during the 12 months preceding the survey. The share of older women that had no contact with family and relatives was 2.7 times as high as the average for all adult women, while for older men it was 2.0 times as high.
6Social life and opinions
Ageing Europe — looking at the lives of older people in the EU — 2020 edition 163
… they were more likely to get together with family or relatives on daily basis
Figures 6.20 and 6.21 develop these findings by looking at the frequency of actually getting together with family and friends (rather than simply making contact). The information presented shows that older people (aged 75 years or more) were more likely to get together with family or relatives (2) every day than was typical for the adult population (aged 16 years or more) as a whole. In 2015, daily contacts were observed for more than one fifth (21.4 %) of older people in the EU-27, compared with an average of 16.8 % for the whole adult population.
In 2015, the highest shares of older people (aged 75 years or more) getting together with family or relatives on a daily basis were usually found in southern EU Member States. This was in keeping with general patterns observed for the total population (as a greater share of people in southern Europe tend to socialise), with Cyprus (60.5 %) and Greece (43.8 %) recording the highest proportions of older people aged 75 years or more getting together with family or relatives on a daily basis. By contrast, there were five Member States where the share of older people getting together on a daily basis with family or relatives was lower than the average recorded for the whole population: this pattern was observed in Slovakia, Germany, Bulgaria, Croatia and particularly Romania (18.8 % for older people aged 75 years or more compared with an average of 25.3 % for all adults).
(2) Family or relatives should be understood in its widest meaning: father, mother, children, siblings, grandparents, aunts, uncles, cousins, nephews, nieces, and families-in-law.
Older people in southern Europe were more likely to get together on a daily basis with friends …
In 2015, some 15.5 % of the EU-27 adult population (aged 16 years or more) got together with friends on a daily basis. As people age their circle of friends tends to diminish, while work and family commitments often make it more difficult to socialise; the share of the EU-27 population aged 50-64 years who got together with friends every day was 9.9 %. Retired people tend to have more free time than people at the end of their working careers and this may be one reason why a higher proportion of older people (than people aged 50-64 years) got together on a daily basis with friends — 11.3 % among those aged 65-74 years and 11.0 % among those aged 75 years or more (see Figure 6.21).
… but they were also more likely to be living in isolation
In 2015, almost one tenth (9.3 %) of older people aged 75 years or more in the EU-27 failed to get together with friends during the 12 months preceding the survey; this share was just over three times as high as the average for the whole of the adult population (2.9 %).
While the southern EU Member States recorded some of the highest shares of older people aged 75 years or more getting together with friends on a daily basis, they also recorded some of the highest shares of older people that did not get together with friends during the 12 months preceding the survey — for example, in Malta (32.2 %), Italy (17.4 %) or Spain (14.9 %). As such, while older people in these countries often had a higher level of contact and potential support from family, there was also a sizeable group of the elderly population having little social contact outside of their family circle.

6 Social life and opinions
Ageing Europe — looking at the lives of older people in the EU — 2020 edition164
Figure 6.20: Frequency of getting together with family or relatives, by age class, 2015(%)
0
10
20
30
40
50
60
70
EU-2
7
Cypr
usSl
ovak
iaG
reec
eM
alta
Port
ugal
Croa
tiaRo
man
iaIta
lySp
ain
Bulg
aria
Irela
nd (1 )
Belg
ium
Hun
gary
Luxe
mbo
urg
Czec
hia
Ger
man
yFr
ance
Slov
enia
Finl
and
Aus
tria
Pola
nd (1 )
Net
herla
nds
Swed
enEs
toni
aLa
tvia
Den
mar
kLi
thua
nia
Uni
ted
King
dom
(1 )
Nor
way
Switz
erla
ndIc
elan
d
Every day
0
1
2
3
4
5
6
7
EU-2
7
Cypr
usSl
ovak
iaG
reec
eM
alta
Port
ugal
Croa
tiaRo
man
iaIta
lySp
ain
Bulg
aria
Irela
nd (1 )
Belg
ium
Hun
gary
Luxe
mbo
urg
Czec
hia
Ger
man
yFr
ance
Slov
enia
Finl
and
Aus
tria
Pola
nd (1 )
Net
herla
nds
Swed
enEs
toni
aLa
tvia
Den
mar
kLi
thua
nia
Uni
ted
King
dom
(1 )
Nor
way
Switz
erla
ndIc
elan
d
≥75 years 65-74 years ≥16 years
Not in the last 12 months
Note: both parts of the fhe figure are ranked on the share of the adult population (aged ≥16 years) getting together with family or relatives every day. The scales used for the y-axes are different.
(1) Low reliability.
Source: Eurostat (online data code: ilc_scp09)
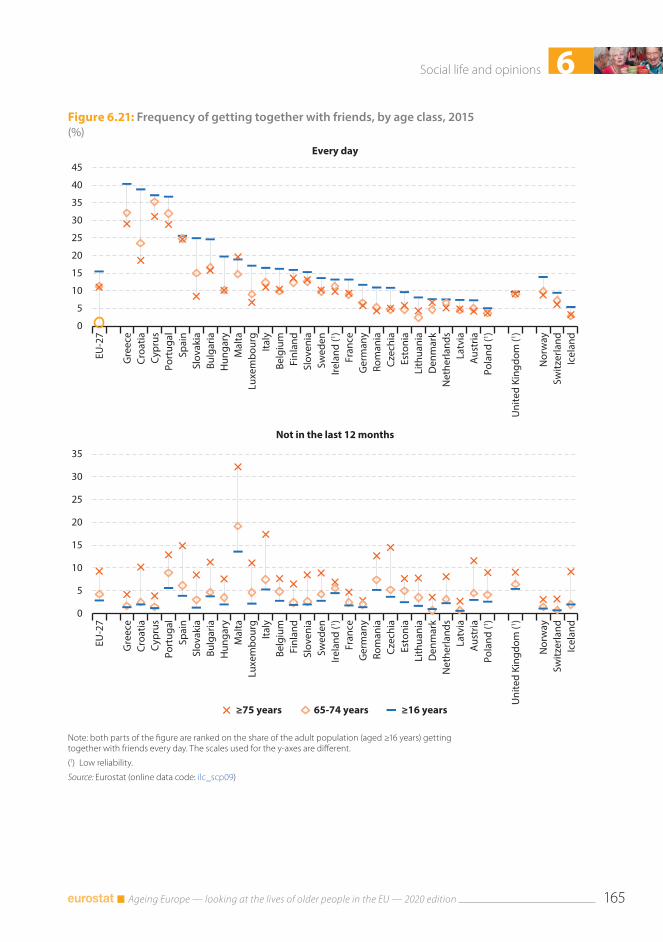
6Social life and opinions
Ageing Europe — looking at the lives of older people in the EU — 2020 edition 165
Figure 6.21: Frequency of getting together with friends, by age class, 2015(%)
0
5
10
15
20
25
30
35
40
45
EU-2
7
Gre
ece
Croa
tiaCy
prus
Port
ugal
Spai
nSl
ovak
iaBu
lgar
iaH
unga
ryM
alta
Luxe
mbo
urg
Italy
Belg
ium
Finl
and
Slov
enia
Swed
enIre
land
(1 )Fr
ance
Ger
man
yRo
man
iaCz
echi
aEs
toni
aLi
thua
nia
Den
mar
kN
ethe
rland
sLa
tvia
Aus
tria
Pola
nd (1 )
Uni
ted
King
dom
(1 )
Nor
way
Switz
erla
ndIc
elan
d
Every day
0
5
10
15
20
25
30
35
EU-2
7
Gre
ece
Croa
tiaCy
prus
Port
ugal
Spai
nSl
ovak
iaBu
lgar
iaH
unga
ryM
alta
Luxe
mbo
urg
Italy
Belg
ium
Finl
and
Slov
enia
Swed
enIre
land
(1 )Fr
ance
Ger
man
yRo
man
iaCz
echi
aEs
toni
aLi
thua
nia
Den
mar
kN
ethe
rland
sLa
tvia
Aus
tria
Pola
nd (1 )
Uni
ted
King
dom
(1 )
Nor
way
Switz
erla
ndIc
elan
d
≥75 years 65-74 years ≥16 years
Not in the last 12 months
Note: both parts of the figure are ranked on the share of the adult population (aged ≥16 years) getting together with friends every day. The scales used for the y-axes are different.
(1) Low reliability.
Source: Eurostat (online data code: ilc_scp09)
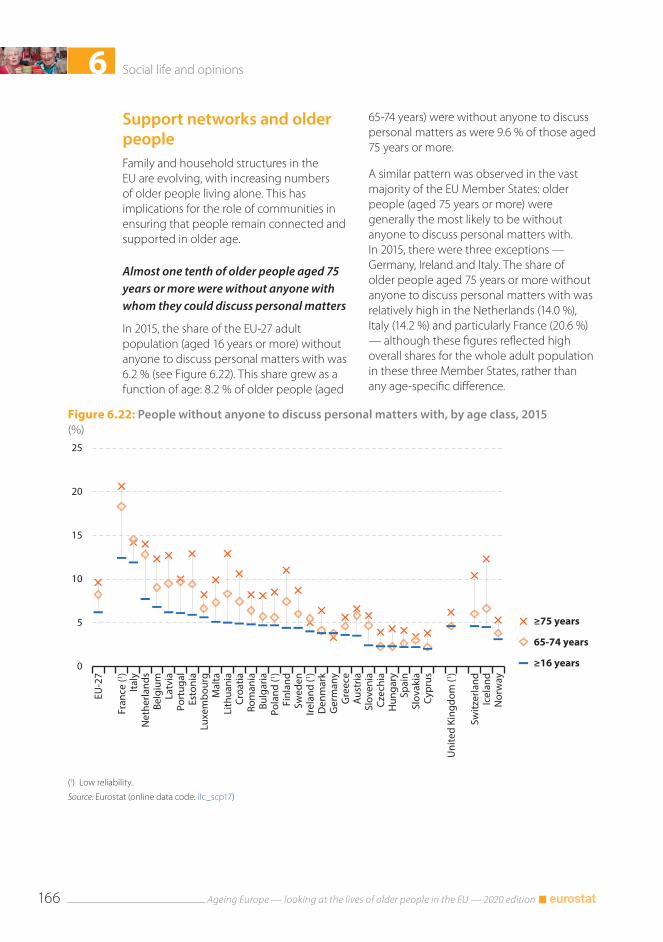
6 Social life and opinions
Ageing Europe — looking at the lives of older people in the EU — 2020 edition166
Figure 6.22: People without anyone to discuss personal matters with, by age class, 2015(%)
0
5
10
15
20
25
EU-2
7
Fran
ce (1 )
Italy
Net
herla
nds
Belg
ium
Latv
iaPo
rtug
alEs
toni
aLu
xem
bour
gM
alta
Lith
uani
aCr
oatia
Rom
ania
Bulg
aria
Pola
nd (1 )
Finl
and
Swed
enIre
land
(1 )D
enm
ark
Ger
man
yG
reec
eA
ustr
iaSl
oven
iaCz
echi
aH
unga
rySp
ain
Slov
akia
Cypr
us
Uni
ted
King
dom
(1 )
Switz
erla
ndIc
elan
dN
orw
ay
≥75 years
65-74 years
≥16 years
(1) Low reliability.
Source: Eurostat (online data code: ilc_scp17)
Support networks and older peopleFamily and household structures in the EU are evolving, with increasing numbers of older people living alone. This has implications for the role of communities in ensuring that people remain connected and supported in older age.
Almost one tenth of older people aged 75 years or more were without anyone with whom they could discuss personal matters
In 2015, the share of the EU-27 adult population (aged 16 years or more) without anyone to discuss personal matters with was 6.2 % (see Figure 6.22). This share grew as a function of age: 8.2 % of older people (aged
65-74 years) were without anyone to discuss personal matters as were 9.6 % of those aged 75 years or more.
A similar pattern was observed in the vast majority of the EU Member States: older people (aged 75 years or more) were generally the most likely to be without anyone to discuss personal matters with. In 2015, there were three exceptions — Germany, Ireland and Italy. The share of older people aged 75 years or more without anyone to discuss personal matters with was relatively high in the Netherlands (14.0 %), Italy (14.2 %) and particularly France (20.6 %) — although these figures reflected high overall shares for the whole adult population in these three Member States, rather than any age-specific difference.
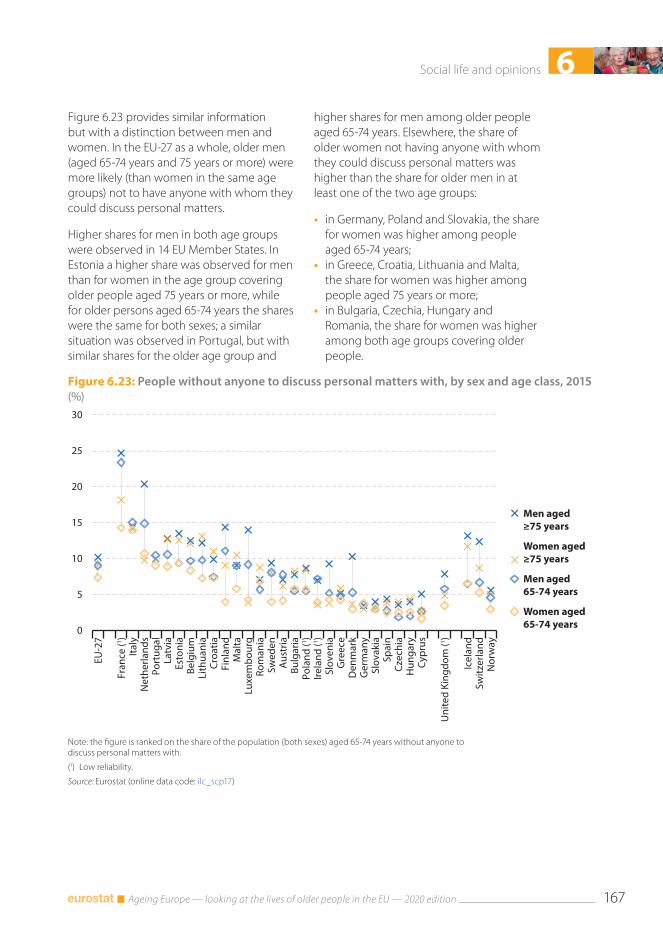
6Social life and opinions
Ageing Europe — looking at the lives of older people in the EU — 2020 edition 167
Figure 6.23: People without anyone to discuss personal matters with, by sex and age class, 2015(%)
0
5
10
15
20
25
30
EU-2
7
Fran
ce (1 )
Italy
Net
herla
nds
Port
ugal
Latv
iaEs
toni
aBe
lgiu
mLi
thua
nia
Croa
tiaFi
nlan
dM
alta
Luxe
mbo
urg
Rom
ania
Swed
enA
ustr
iaBu
lgar
iaPo
land
(1 )Ire
land
(1 )Sl
oven
iaG
reec
eD
enm
ark
Ger
man
ySl
ovak
iaSp
ain
Czec
hia
Hun
gary
Cypr
us
Uni
ted
King
dom
(1 )
Icel
and
Switz
erla
ndN
orw
ay
Men aged≥75 years
Women aged≥75 years
Men aged65-74 years
Women aged65-74 years
Note: the figure is ranked on the share of the population (both sexes) aged 65-74 years without anyone to discuss personal matters with.
(1) Low reliability.
Source: Eurostat (online data code: ilc_scp17)
Figure 6.23 provides similar information but with a distinction between men and women. In the EU-27 as a whole, older men (aged 65-74 years and 75 years or more) were more likely (than women in the same age groups) not to have anyone with whom they could discuss personal matters.
Higher shares for men in both age groups were observed in 14 EU Member States. In Estonia a higher share was observed for men than for women in the age group covering older people aged 75 years or more, while for older persons aged 65-74 years the shares were the same for both sexes; a similar situation was observed in Portugal, but with similar shares for the older age group and
higher shares for men among older people aged 65-74 years. Elsewhere, the share of older women not having anyone with whom they could discuss personal matters was higher than the share for older men in at least one of the two age groups:
• in Germany, Poland and Slovakia, the share for women was higher among people aged 65-74 years;
• in Greece, Croatia, Lithuania and Malta, the share for women was higher among people aged 75 years or more;
• in Bulgaria, Czechia, Hungary and Romania, the share for women was higher among both age groups covering older people.
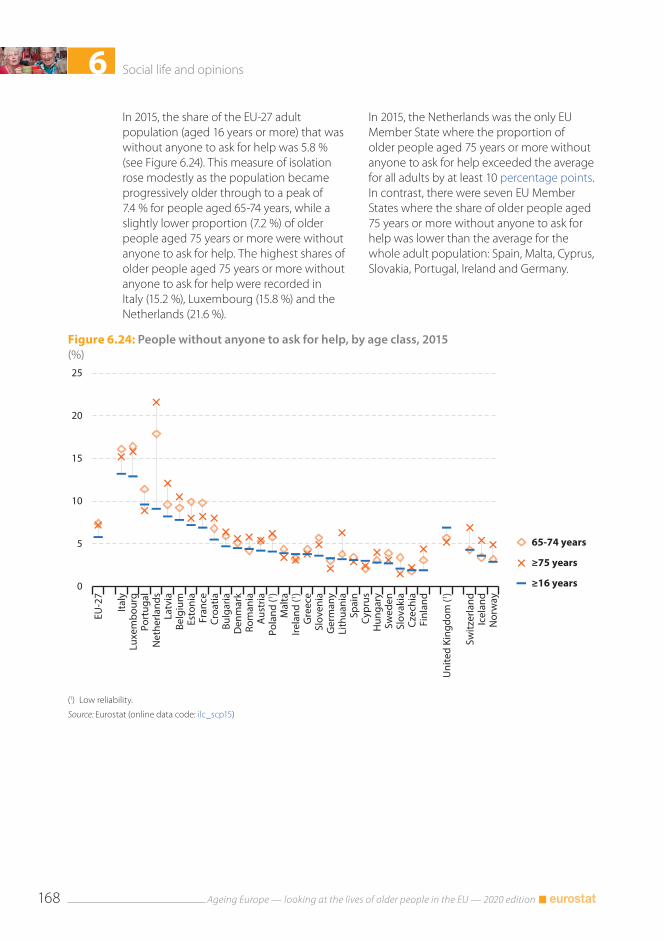
6 Social life and opinions
Ageing Europe — looking at the lives of older people in the EU — 2020 edition168
Figure 6.24: People without anyone to ask for help, by age class, 2015(%)
0
5
10
15
20
25
EU-2
7
Italy
Luxe
mbo
urg
Port
ugal
Net
herla
nds
Latv
iaBe
lgiu
mEs
toni
aFr
ance
Croa
tiaBu
lgar
iaD
enm
ark
Rom
ania
Aus
tria
Pola
nd (1 )
Mal
taIre
land
(1 )G
reec
eSl
oven
iaG
erm
any
Lith
uani
aSp
ain
Cypr
usH
unga
rySw
eden
Slov
akia
Czec
hia
Finl
and
Uni
ted
King
dom
(1 )
Switz
erla
ndIc
elan
dN
orw
ay
65-74 years
≥75 years
≥16 years
(1) Low reliability.
Source: Eurostat (online data code: ilc_scp15)
In 2015, the share of the EU-27 adult population (aged 16 years or more) that was without anyone to ask for help was 5.8 % (see Figure 6.24). This measure of isolation rose modestly as the population became progressively older through to a peak of 7.4 % for people aged 65-74 years, while a slightly lower proportion (7.2 %) of older people aged 75 years or more were without anyone to ask for help. The highest shares of older people aged 75 years or more without anyone to ask for help were recorded in Italy (15.2 %), Luxembourg (15.8 %) and the Netherlands (21.6 %).
In 2015, the Netherlands was the only EU Member State where the proportion of older people aged 75 years or more without anyone to ask for help exceeded the average for all adults by at least 10 percentage points. In contrast, there were seven EU Member States where the share of older people aged 75 years or more without anyone to ask for help was lower than the average for the whole adult population: Spain, Malta, Cyprus, Slovakia, Portugal, Ireland and Germany.
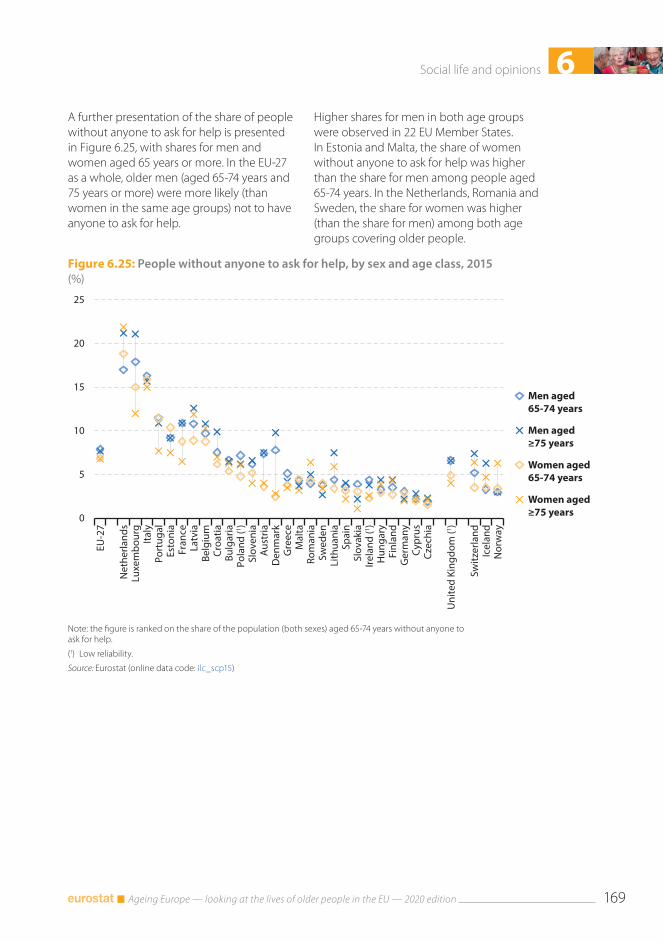
6Social life and opinions
Ageing Europe — looking at the lives of older people in the EU — 2020 edition 169
Figure 6.25: People without anyone to ask for help, by sex and age class, 2015(%)
0
5
10
15
20
25
EU-2
7
Net
herla
nds
Luxe
mbo
urg
Italy
Port
ugal
Esto
nia
Fran
ceLa
tvia
Belg
ium
Croa
tiaBu
lgar
iaPo
land
(1 )Sl
oven
iaA
ustr
iaD
enm
ark
Gre
ece
Mal
taRo
man
iaSw
eden
Lith
uani
aSp
ain
Slov
akia
Irela
nd (1 )
Hun
gary
Finl
and
Ger
man
yCy
prus
Czec
hia
Uni
ted
King
dom
(1 )
Switz
erla
ndIc
elan
dN
orw
ay
Men aged65-74 years
Men aged≥75 years
Women aged65-74 years
Women aged≥75 years
Note: the figure is ranked on the share of the population (both sexes) aged 65-74 years without anyone to ask for help.
(1) Low reliability.
Source: Eurostat (online data code: ilc_scp15)
A further presentation of the share of people without anyone to ask for help is presented in Figure 6.25, with shares for men and women aged 65 years or more. In the EU-27 as a whole, older men (aged 65-74 years and 75 years or more) were more likely (than women in the same age groups) not to have anyone to ask for help.
Higher shares for men in both age groups were observed in 22 EU Member States. In Estonia and Malta, the share of women without anyone to ask for help was higher than the share for men among people aged 65-74 years. In the Netherlands, Romania and Sweden, the share for women was higher (than the share for men) among both age groups covering older people.
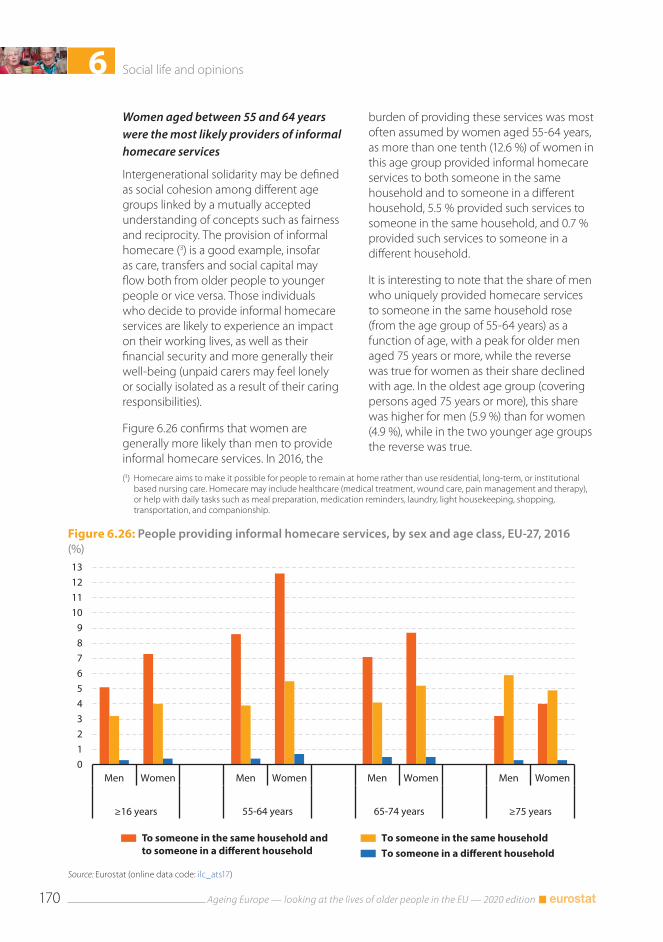
6 Social life and opinions
Ageing Europe — looking at the lives of older people in the EU — 2020 edition170
Figure 6.26: People providing informal homecare services, by sex and age class, EU-27, 2016(%)
0123456789
10111213
Men Women Men Women Men Women Men Women
≥16 years 55-64 years 65-74 years ≥75 years
To someone in the same household andto someone in a di�erent household
To someone in the same householdTo someone in a di�erent household
Source: Eurostat (online data code: ilc_ats17)
Women aged between 55 and 64 years were the most likely providers of informal homecare services
Intergenerational solidarity may be defined as social cohesion among different age groups linked by a mutually accepted understanding of concepts such as fairness and reciprocity. The provision of informal homecare (3) is a good example, insofar as care, transfers and social capital may flow both from older people to younger people or vice versa. Those individuals who decide to provide informal homecare services are likely to experience an impact on their working lives, as well as their financial security and more generally their well-being (unpaid carers may feel lonely or socially isolated as a result of their caring responsibilities).
Figure 6.26 confirms that women are generally more likely than men to provide informal homecare services. In 2016, the
(3) Homecare aims to make it possible for people to remain at home rather than use residential, long-term, or institutional based nursing care. Homecare may include healthcare (medical treatment, wound care, pain management and therapy), or help with daily tasks such as meal preparation, medication reminders, laundry, light housekeeping, shopping, transportation, and companionship.
burden of providing these services was most often assumed by women aged 55-64 years, as more than one tenth (12.6 %) of women in this age group provided informal homecare services to both someone in the same household and to someone in a different household, 5.5 % provided such services to someone in the same household, and 0.7 % provided such services to someone in a different household.
It is interesting to note that the share of men who uniquely provided homecare services to someone in the same household rose (from the age group of 55-64 years) as a function of age, with a peak for older men aged 75 years or more, while the reverse was true for women as their share declined with age. In the oldest age group (covering persons aged 75 years or more), this share was higher for men (5.9 %) than for women (4.9 %), while in the two younger age groups the reverse was true.
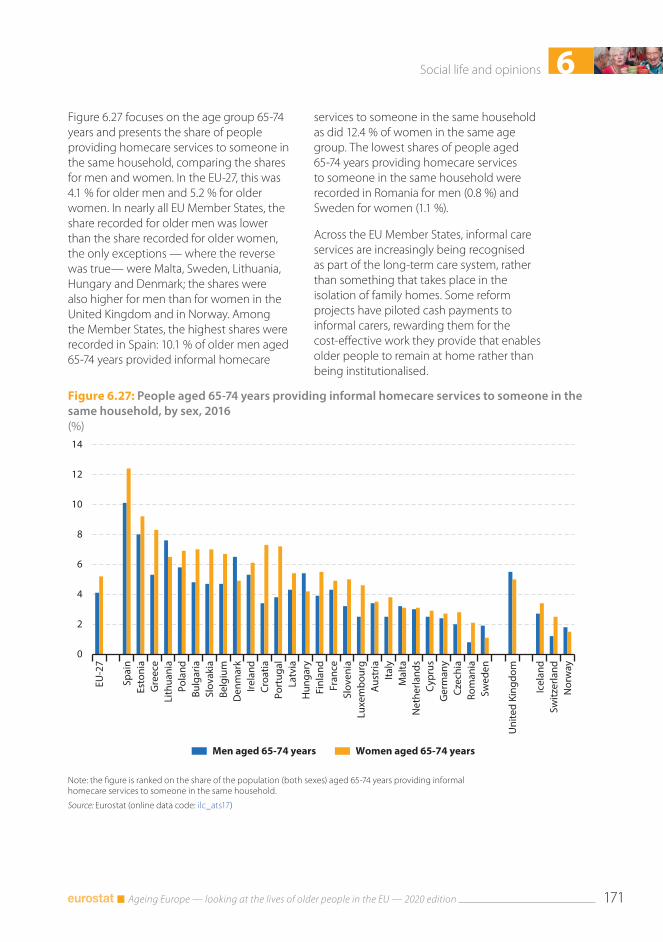
6Social life and opinions
Ageing Europe — looking at the lives of older people in the EU — 2020 edition 171
Figure 6.27: People aged 65-74 years providing informal homecare services to someone in the same household, by sex, 2016(%)
0
2
4
6
8
10
12
14
EU-2
7
Spai
nEs
toni
aG
reec
eLi
thua
nia
Pola
ndBu
lgar
iaSl
ovak
iaBe
lgiu
mD
enm
ark
Irela
ndCr
oatia
Port
ugal
Latv
iaH
unga
ryFi
nlan
dFr
ance
Slov
enia
Luxe
mbo
urg
Aus
tria
Italy
Mal
taN
ethe
rland
sCy
prus
Ger
man
yCz
echi
aRo
man
iaSw
eden
Uni
ted
King
dom
Icel
and
Switz
erla
ndN
orw
ay
Men aged 65-74 years Women aged 65-74 years
Note: the figure is ranked on the share of the population (both sexes) aged 65-74 years providing informal homecare services to someone in the same household.
Source: Eurostat (online data code: ilc_ats17)
Figure 6.27 focuses on the age group 65-74 years and presents the share of people providing homecare services to someone in the same household, comparing the shares for men and women. In the EU-27, this was 4.1 % for older men and 5.2 % for older women. In nearly all EU Member States, the share recorded for older men was lower than the share recorded for older women, the only exceptions — where the reverse was true— were Malta, Sweden, Lithuania, Hungary and Denmark; the shares were also higher for men than for women in the United Kingdom and in Norway. Among the Member States, the highest shares were recorded in Spain: 10.1 % of older men aged 65-74 years provided informal homecare
services to someone in the same household as did 12.4 % of women in the same age group. The lowest shares of people aged 65-74 years providing homecare services to someone in the same household were recorded in Romania for men (0.8 %) and Sweden for women (1.1 %).
Across the EU Member States, informal care services are increasingly being recognised as part of the long-term care system, rather than something that takes place in the isolation of family homes. Some reform projects have piloted cash payments to informal carers, rewarding them for the cost-effective work they provide that enables older people to remain at home rather than being institutionalised.
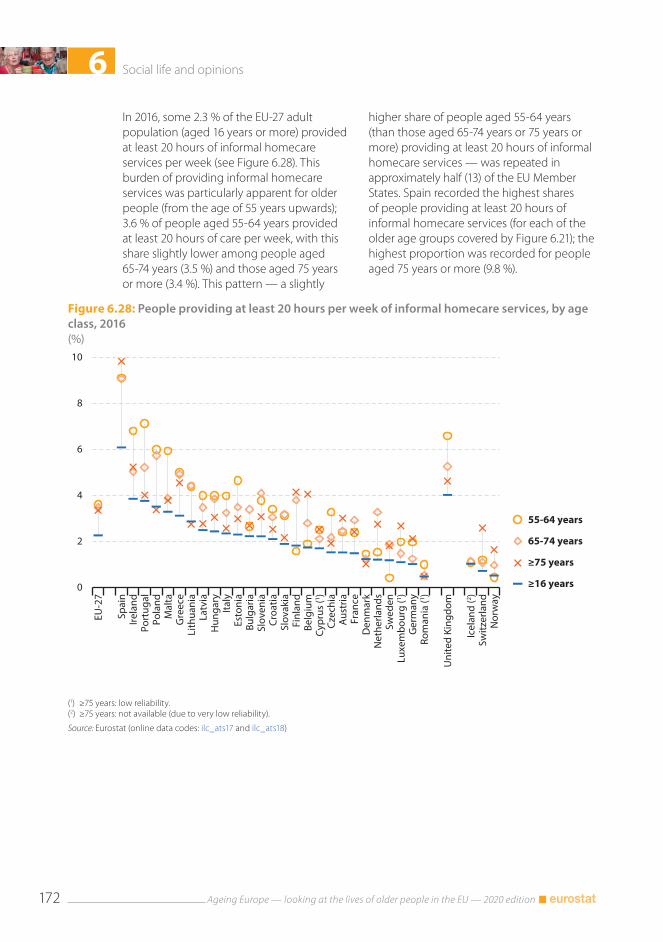
6 Social life and opinions
Ageing Europe — looking at the lives of older people in the EU — 2020 edition172
Figure 6.28: People providing at least 20 hours per week of informal homecare services, by age class, 2016(%)
0
2
4
6
8
10
EU-2
7
Spai
nIre
land
Port
ugal
Pola
ndM
alta
Gre
ece
Lith
uani
aLa
tvia
Hun
gary
Italy
Esto
nia
Bulg
aria
Slov
enia
Croa
tiaSl
ovak
iaFi
nlan
dBe
lgiu
mCy
prus
(1 )Cz
echi
aA
ustr
iaFr
ance
Den
mar
kN
ethe
rland
sSw
eden
Luxe
mbo
urg
(1 )G
erm
any
Rom
ania
(1 )
Uni
ted
King
dom
Icel
and
(2 )Sw
itzer
land
Nor
way
55-64 years
65-74 years
≥75 years
≥16 years
(1) ≥75 years: low reliability.(2) ≥75 years: not available (due to very low reliability).
Source: Eurostat (online data codes: ilc_ats17 and ilc_ats18)
In 2016, some 2.3 % of the EU-27 adult population (aged 16 years or more) provided at least 20 hours of informal homecare services per week (see Figure 6.28). This burden of providing informal homecare services was particularly apparent for older people (from the age of 55 years upwards); 3.6 % of people aged 55-64 years provided at least 20 hours of care per week, with this share slightly lower among people aged 65-74 years (3.5 %) and those aged 75 years or more (3.4 %). This pattern — a slightly
higher share of people aged 55-64 years (than those aged 65-74 years or 75 years or more) providing at least 20 hours of informal homecare services — was repeated in approximately half (13) of the EU Member States. Spain recorded the highest shares of people providing at least 20 hours of informal homecare services (for each of the older age groups covered by Figure 6.21); the highest proportion was recorded for people aged 75 years or more (9.8 %).
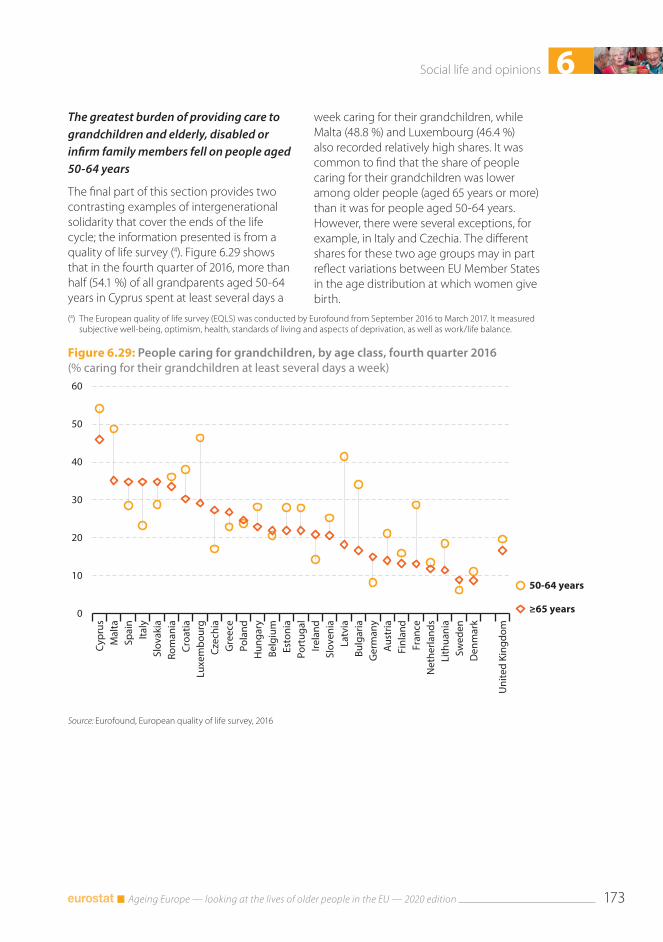
6Social life and opinions
Ageing Europe — looking at the lives of older people in the EU — 2020 edition 173
Figure 6.29: People caring for grandchildren, by age class, fourth quarter 2016(% caring for their grandchildren at least several days a week)
0
10
20
30
40
50
60
Cypr
usM
alta
Spai
nIta
lySl
ovak
iaRo
man
iaCr
oatia
Luxe
mbo
urg
Czec
hia
Gre
ece
Pola
ndH
unga
ryBe
lgiu
mEs
toni
aPo
rtug
alIre
land
Slov
enia
Latv
iaBu
lgar
iaG
erm
any
Aus
tria
Finl
and
Fran
ceN
ethe
rland
sLi
thua
nia
Swed
enD
enm
ark
Uni
ted
King
dom
50-64 years
≥65 years
Source: Eurofound, European quality of life survey, 2016
The greatest burden of providing care to grandchildren and elderly, disabled or infirm family members fell on people aged 50-64 years
The final part of this section provides two contrasting examples of intergenerational solidarity that cover the ends of the life cycle; the information presented is from a quality of life survey (4). Figure 6.29 shows that in the fourth quarter of 2016, more than half (54.1 %) of all grandparents aged 50-64 years in Cyprus spent at least several days a
(4) The European quality of life survey (EQLS) was conducted by Eurofound from September 2016 to March 2017. It measured subjective well-being, optimism, health, standards of living and aspects of deprivation, as well as work/life balance.
week caring for their grandchildren, while Malta (48.8 %) and Luxembourg (46.4 %) also recorded relatively high shares. It was common to find that the share of people caring for their grandchildren was lower among older people (aged 65 years or more) than it was for people aged 50-64 years. However, there were several exceptions, for example, in Italy and Czechia. The different shares for these two age groups may in part reflect variations between EU Member States in the age distribution at which women give birth.
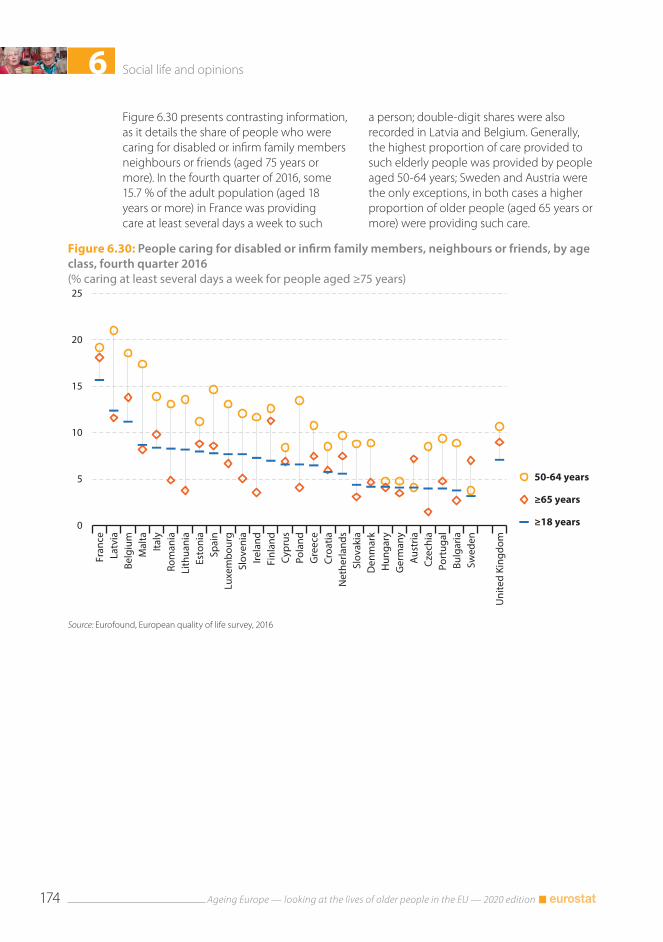
6 Social life and opinions
Ageing Europe — looking at the lives of older people in the EU — 2020 edition174
Figure 6.30: People caring for disabled or infirm family members, neighbours or friends, by age class, fourth quarter 2016(% caring at least several days a week for people aged ≥75 years)
0
5
10
15
20
25
Fran
ceLa
tvia
Belg
ium
Mal
taIta
lyRo
man
iaLi
thua
nia
Esto
nia
Spai
nLu
xem
bour
gSl
oven
iaIre
land
Finl
and
Cypr
usPo
land
Gre
ece
Croa
tiaN
ethe
rland
sSl
ovak
iaD
enm
ark
Hun
gary
Ger
man
yA
ustr
iaCz
echi
aPo
rtug
alBu
lgar
iaSw
eden
Uni
ted
King
dom
50-64 years
≥65 years
≥18 years
Source: Eurofound, European quality of life survey, 2016
Figure 6.30 presents contrasting information, as it details the share of people who were caring for disabled or infirm family members neighbours or friends (aged 75 years or more). In the fourth quarter of 2016, some 15.7 % of the adult population (aged 18 years or more) in France was providing care at least several days a week to such
a person; double-digit shares were also recorded in Latvia and Belgium. Generally, the highest proportion of care provided to such elderly people was provided by people aged 50-64 years; Sweden and Austria were the only exceptions, in both cases a higher proportion of older people (aged 65 years or more) were providing such care.
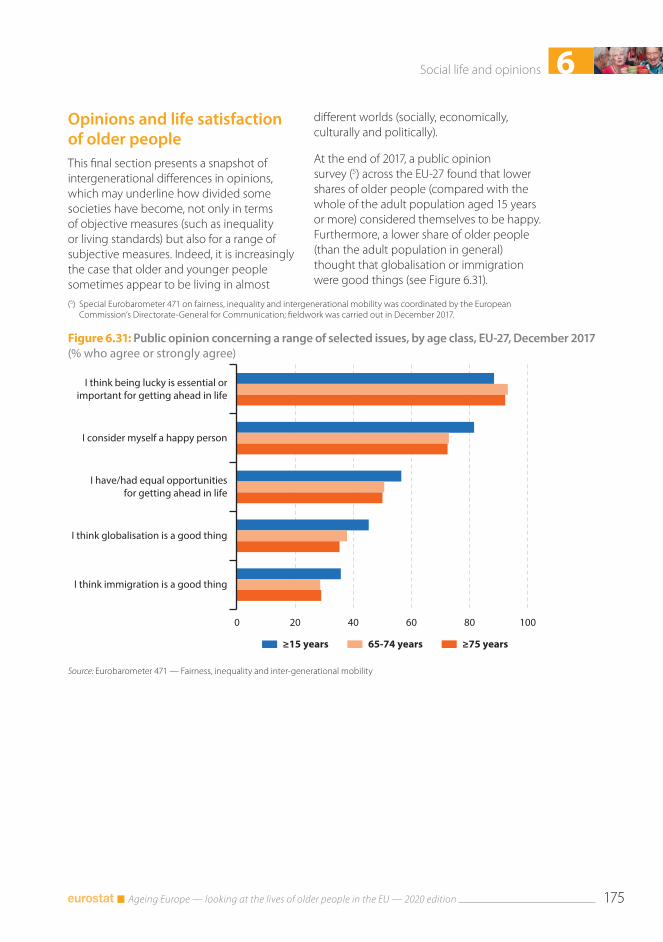
6Social life and opinions
Ageing Europe — looking at the lives of older people in the EU — 2020 edition 175
Figure 6.31: Public opinion concerning a range of selected issues, by age class, EU-27, December 2017(% who agree or strongly agree)
0 20 40 60 80 100
I think being lucky is essential orimportant for getting ahead in life
I consider myself a happy person
I have/had equal opportunities for getting ahead in life
I think globalisation is a good thing
I think immigration is a good thing
≥15 years 65-74 years ≥75 years
Source: Eurobarometer 471 — Fairness, inequality and inter-generational mobility
Opinions and life satisfaction of older peopleThis final section presents a snapshot of intergenerational differences in opinions, which may underline how divided some societies have become, not only in terms of objective measures (such as inequality or living standards) but also for a range of subjective measures. Indeed, it is increasingly the case that older and younger people sometimes appear to be living in almost
(5) Special Eurobarometer 471 on fairness, inequality and intergenerational mobility was coordinated by the European Commission’s Directorate-General for Communication; fieldwork was carried out in December 2017.
different worlds (socially, economically, culturally and politically).
At the end of 2017, a public opinion survey (5) across the EU-27 found that lower shares of older people (compared with the whole of the adult population aged 15 years or more) considered themselves to be happy. Furthermore, a lower share of older people (than the adult population in general) thought that globalisation or immigration were good things (see Figure 6.31).
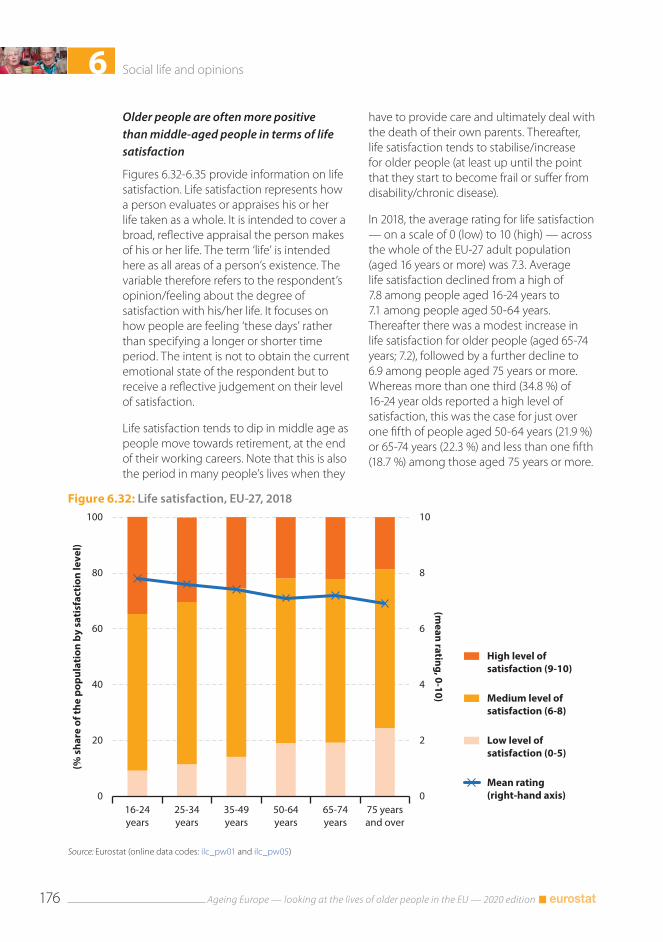
6 Social life and opinions
Ageing Europe — looking at the lives of older people in the EU — 2020 edition176
Figure 6.32: Life satisfaction, EU-27, 2018
0
2
4
6
8
10
0
20
40
60
80
100
16-24years
25-34years
35-49years
50-64years
65-74years
75 yearsand over
(mean rating, 0-10)
(% s
hare
of t
he p
opul
atio
n by
sat
isfa
ctio
n le
vel)
High level ofsatisfaction (9-10)
Medium level ofsatisfaction (6-8)
Low level ofsatisfaction (0-5)
Mean rating(right-hand axis)
Source: Eurostat (online data codes: ilc_pw01 and ilc_pw05)
Older people are often more positive than middle-aged people in terms of life satisfaction
Figures 6.32-6.35 provide information on life satisfaction. Life satisfaction represents how a person evaluates or appraises his or her life taken as a whole. It is intended to cover a broad, reflective appraisal the person makes of his or her life. The term ‘life’ is intended here as all areas of a person’s existence. The variable therefore refers to the respondent’s opinion/feeling about the degree of satisfaction with his/her life. It focuses on how people are feeling ‘these days’ rather than specifying a longer or shorter time period. The intent is not to obtain the current emotional state of the respondent but to receive a reflective judgement on their level of satisfaction.
Life satisfaction tends to dip in middle age as people move towards retirement, at the end of their working careers. Note that this is also the period in many people’s lives when they
have to provide care and ultimately deal with the death of their own parents. Thereafter, life satisfaction tends to stabilise/increase for older people (at least up until the point that they start to become frail or suffer from disability/chronic disease).
In 2018, the average rating for life satisfaction — on a scale of 0 (low) to 10 (high) — across the whole of the EU-27 adult population (aged 16 years or more) was 7.3. Average life satisfaction declined from a high of 7.8 among people aged 16-24 years to 7.1 among people aged 50-64 years. Thereafter there was a modest increase in life satisfaction for older people (aged 65-74 years; 7.2), followed by a further decline to 6.9 among people aged 75 years or more. Whereas more than one third (34.8 %) of 16-24 year olds reported a high level of satisfaction, this was the case for just over one fifth of people aged 50-64 years (21.9 %) or 65-74 years (22.3 %) and less than one fifth (18.7 %) among those aged 75 years or more.
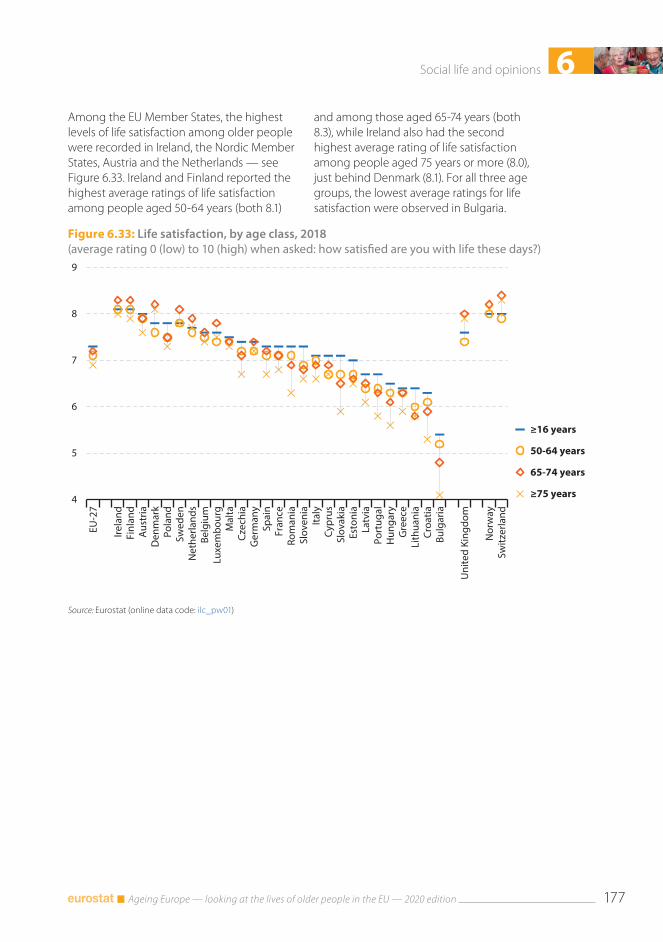
6Social life and opinions
Ageing Europe — looking at the lives of older people in the EU — 2020 edition 177
Figure 6.33: Life satisfaction, by age class, 2018(average rating 0 (low) to 10 (high) when asked: how satisfied are you with life these days?)
4
5
6
7
8
9
EU-2
7
Irela
ndFi
nlan
dA
ustr
iaD
enm
ark
Pola
ndSw
eden
Net
herla
nds
Belg
ium
Luxe
mbo
urg
Mal
taCz
echi
aG
erm
any
Spai
nFr
ance
Rom
ania
Slov
enia
Italy
Cypr
usSl
ovak
iaEs
toni
aLa
tvia
Port
ugal
Hun
gary
Gre
ece
Lith
uani
aCr
oatia
Bulg
aria
Uni
ted
King
dom
Nor
way
Switz
erla
nd
≥16 years
50-64 years
65-74 years
≥75 years
Source: Eurostat (online data code: ilc_pw01)
Among the EU Member States, the highest levels of life satisfaction among older people were recorded in Ireland, the Nordic Member States, Austria and the Netherlands — see Figure 6.33. Ireland and Finland reported the highest average ratings of life satisfaction among people aged 50-64 years (both 8.1)
and among those aged 65-74 years (both 8.3), while Ireland also had the second highest average rating of life satisfaction among people aged 75 years or more (8.0), just behind Denmark (8.1). For all three age groups, the lowest average ratings for life satisfaction were observed in Bulgaria.
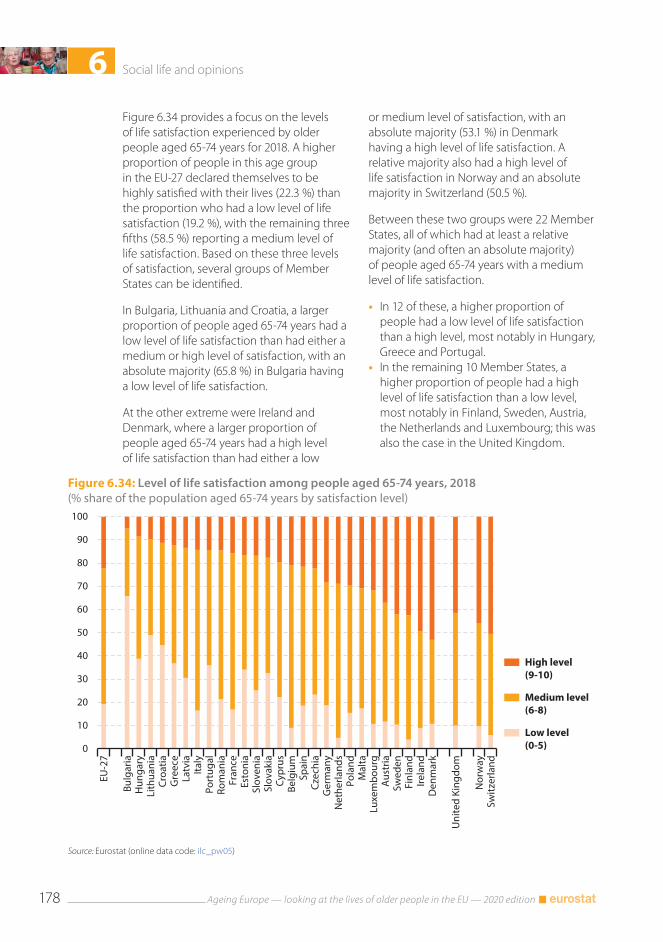
6 Social life and opinions
Ageing Europe — looking at the lives of older people in the EU — 2020 edition178
Figure 6.34: Level of life satisfaction among people aged 65-74 years, 2018(% share of the population aged 65-74 years by satisfaction level)
0
10
20
30
40
50
60
70
80
90
100
EU-2
7
Bulg
aria
Hun
gary
Lith
uani
aCr
oatia
Gre
ece
Latv
iaIta
lyPo
rtug
alRo
man
iaFr
ance
Esto
nia
Slov
enia
Slov
akia
Cypr
usBe
lgiu
mSp
ain
Czec
hia
Ger
man
yN
ethe
rland
sPo
land
Mal
taLu
xem
bour
gA
ustr
iaSw
eden
Finl
and
Irela
ndD
enm
ark
Uni
ted
King
dom
Nor
way
Switz
erla
nd
High level(9-10)
Medium level(6-8)
Low level(0-5)
Source: Eurostat (online data code: ilc_pw05)
Figure 6.34 provides a focus on the levels of life satisfaction experienced by older people aged 65-74 years for 2018. A higher proportion of people in this age group in the EU-27 declared themselves to be highly satisfied with their lives (22.3 %) than the proportion who had a low level of life satisfaction (19.2 %), with the remaining three fifths (58.5 %) reporting a medium level of life satisfaction. Based on these three levels of satisfaction, several groups of Member States can be identified.
In Bulgaria, Lithuania and Croatia, a larger proportion of people aged 65-74 years had a low level of life satisfaction than had either a medium or high level of satisfaction, with an absolute majority (65.8 %) in Bulgaria having a low level of life satisfaction.
At the other extreme were Ireland and Denmark, where a larger proportion of people aged 65-74 years had a high level of life satisfaction than had either a low
or medium level of satisfaction, with an absolute majority (53.1 %) in Denmark having a high level of life satisfaction. A relative majority also had a high level of life satisfaction in Norway and an absolute majority in Switzerland (50.5 %).
Between these two groups were 22 Member States, all of which had at least a relative majority (and often an absolute majority) of people aged 65-74 years with a medium level of life satisfaction.
• In 12 of these, a higher proportion of people had a low level of life satisfaction than a high level, most notably in Hungary, Greece and Portugal.
• In the remaining 10 Member States, a higher proportion of people had a high level of life satisfaction than a low level, most notably in Finland, Sweden, Austria, the Netherlands and Luxembourg; this was also the case in the United Kingdom.
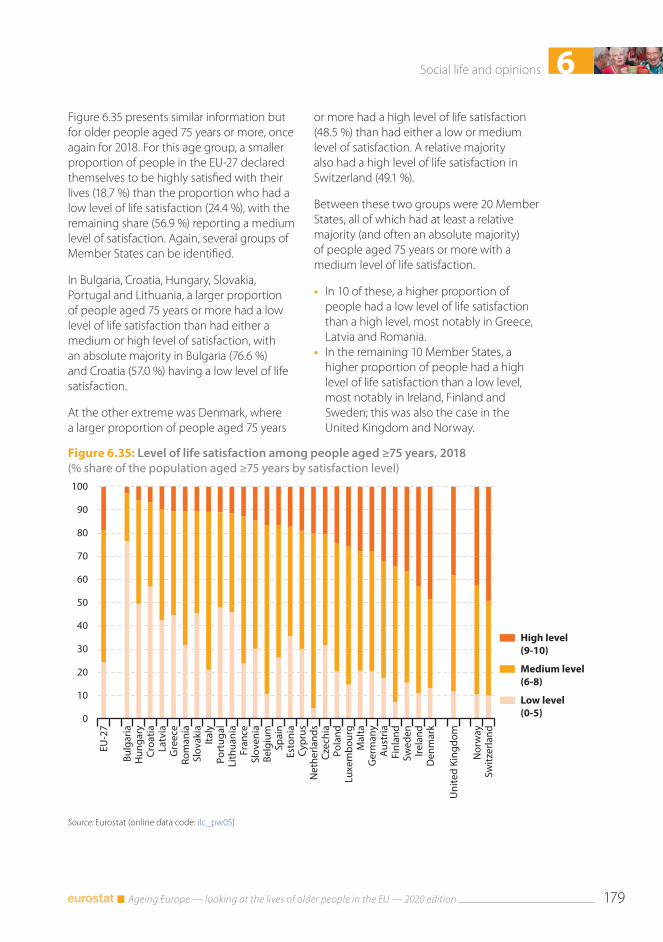
6Social life and opinions
Ageing Europe — looking at the lives of older people in the EU — 2020 edition 179
Figure 6.35: Level of life satisfaction among people aged ≥75 years, 2018(% share of the population aged ≥75 years by satisfaction level)
0
10
20
30
40
50
60
70
80
90
100
EU-2
7
Bulg
aria
Hun
gary
Croa
tiaLa
tvia
Gre
ece
Rom
ania
Slov
akia
Italy
Port
ugal
Lith
uani
aFr
ance
Slov
enia
Belg
ium
Spai
nEs
toni
aCy
prus
Net
herla
nds
Czec
hia
Pola
ndLu
xem
bour
gM
alta
Ger
man
yA
ustr
iaFi
nlan
dSw
eden
Irela
ndD
enm
ark
Uni
ted
King
dom
Nor
way
Switz
erla
nd
High level(9-10)
Medium level(6-8)
Low level(0-5)
Source: Eurostat (online data code: ilc_pw05)
Figure 6.35 presents similar information but for older people aged 75 years or more, once again for 2018. For this age group, a smaller proportion of people in the EU-27 declared themselves to be highly satisfied with their lives (18.7 %) than the proportion who had a low level of life satisfaction (24.4 %), with the remaining share (56.9 %) reporting a medium level of satisfaction. Again, several groups of Member States can be identified.
In Bulgaria, Croatia, Hungary, Slovakia, Portugal and Lithuania, a larger proportion of people aged 75 years or more had a low level of life satisfaction than had either a medium or high level of satisfaction, with an absolute majority in Bulgaria (76.6 %) and Croatia (57.0 %) having a low level of life satisfaction.
At the other extreme was Denmark, where a larger proportion of people aged 75 years
or more had a high level of life satisfaction (48.5 %) than had either a low or medium level of satisfaction. A relative majority also had a high level of life satisfaction in Switzerland (49.1 %).
Between these two groups were 20 Member States, all of which had at least a relative majority (and often an absolute majority) of people aged 75 years or more with a medium level of life satisfaction.
• In 10 of these, a higher proportion of people had a low level of life satisfaction than a high level, most notably in Greece, Latvia and Romania.
• In the remaining 10 Member States, a higher proportion of people had a high level of life satisfaction than a low level, most notably in Ireland, Finland and Sweden; this was also the case in the United Kingdom and Norway.


Getting in touch with the EUIn person
All over the European Union there are hundreds of Europe Direct information centres. You can find the address of the centre nearest to you at: https://europa.eu/european-union/contact_en
On the phone or by email
Europe Direct is a service that answers your questions about the European Union. You can contact this service:• by freephone: 00 800 6 7 8 9 10 11 (certain operators may charge for these calls),• at the following standard number: +32 22999696 or• by email via: https://europa.eu/european-union/contact_en
Finding information about the EUOnline
Information about the European Union in all the official languages of the EU is available on the Europa website at: https://europa.eu/european-union/index_en
EU publications
You can download or order free and priced EU publications at: https://publications.europa.eu/en/publications. Multiple copies of free publications may be obtained by contacting Europe Direct or your local information centre (see https://europa.eu/european-union/contact_en).
EU law and related documents
For access to legal information from the EU, including all EU law since 1952 in all the official language versions, go to EUR-Lex at: https://eur-lex.europa.eu
Open data from the EU
The EU Open Data Portal (https://data.europa.eu/euodp/en) provides access to datasets from the EU. Data can be downloaded and reused for free, for both commercial and non-commercial purposes.
KS-02-20-655-EN-N
ISBN 978-92-76-21520-2
Ageing EuropeLOOKING AT THE LIVES OF OLDER PEOPLE IN THE EU
Ageing Europe — looking at the lives of older people in the EU is a Eurostat publication providing a broad range of statistics that describe the everyday lives of the European Union’s (EU) older generations.
Each chapter presents statistical information in tables, figures and maps, accompanied by a descriptive text highlighting the main findings. Statistical indicators are presented for the following six subjects: population developments; housing and living conditions; health and disability; working and moving into retirement; pensions, income and expenditure; social life and opinions.
For more informationhttps://ec.europa.eu/eurostat/