Embed Size (px)
Citation preview
Age and Sex composition
CDC 103 – Lecture 4 – February 26, 2012
Importance of Age and Sex Composition
Why classifying population by age and sex is important in the study of demography?
Separate data for males and females and for ages are important in themselves, for the analysis of other types of data, and for the evaluation of the completeness and accuracy of the census counts of population.
Age and sex composition of population are important in planning for economic and social service provision.
Breaking down population by age and sex enables researchers to analyze variations of social phenomena by specific groups of population such as infants and children, youth, adults, and the elderly.
Importance of Age and Sex Composition
Why classifying population by age and sex is important in the study of demography?
Age is the most important variable in the study of mortality, fertility, nuptiality, and certain other areas of demographic analysis.
The tabulation of population by sex is useful in the evaluation of census and survey data.
Definitions and Classification The definition of sex is easy, while the definition of age is
more complicated. In some countries, individuals provide their age in terms of a
lunar-based calendar. China is an example Under the lunar-based Chinese calendar system, an individual
is assigned an age of 1 at birth. While age at birth is commonlyzero under the Western definition.
Also in Islamic country that use the lunar (Hijri) calendar, the year is 11 days less than the solar year.
The United Nations recommendations favor the Western approach, defining age as “the interval of time between the date of birth and the date of the census, expressed in completed solar years.”
Definitions and Classification
The date-of birth gives more accurate data rather than asking about age in the last birthday (in complete years).
When date-of-birth information is collected in a census or sample survey, the recommended method for converting it to age at last birthday is to subtract the exact date of birth fromthe date of the census or survey.
The resulting ages, in complete years, could then be tabulated by single years or classified into age groups, as desired.
Sources of Data on Age and Sex
Data on Age and sex are collected in the censuses and surveys all over the world.
Comparable data by country can be found in the UN Demographic Yearbook – available in the CDC library.
Quality of Data on Age and Sex
The principal problem relating to the quality of the data on sexcollected in censuses concerns the difference in the completeness of coverage of the two sexes.
Errors in the tabulated data on age may arise from the following types of errors of enumeration: Coverage errors, Failure to record age, and Misreporting of age.
Analysis of Sex Composition

Numerical Measures
The numerical measures of sex composition are few and simple to compute.
They are: (1) the percentage of males in the population, or the masculinity
proportion; (2) the sex ratio, or the masculinity ratio; and (3) the ratio of the excess or deficit of males to the total population.
The Masculinity Proportion
The masculinity proportion (or percentage male) is the measure of sex composition most often used.
The formula for the masculinity proportion is:
Where Pm represents the number of males and Pt the total population.
Sex Ratio
The sex ratio is the main measure of sex composition used in demography.
The sex ratio is usually defined as the number of males per 100 females.
The formula for the sex ratio is:
Where Pm represents the number of males and Pf the number of females.
Sex Ratio
One hundred is the point of balance of the sexes according to this measure.
A sex ratio above 100 denotes an excess of males, and a sex ratio below 100 denotes an excess of females.
Accordingly, the greater the excess of males, the higher the sex ratio; the greater the excess of females, the lower the sex ratio.
The Ratio of the Excess or Deficit of Males to the Total Population
The the excess (or deficit) of males as a percentage of the total population, is calculated using the following formula:
Where Pm represents the number of males, Pf the number of females, and Pt the total population.
Analysis of Sex Ratios in Terms of Population Subgroups
Because the sex ratio may vary widely from one population subgroup to another, it is frequently desirable to consider separately the sex ratios of the important component subgroups in any detailed analysis of the sex composition of a population group.
Subgroups may include: Geographical areas Analysis by race Analysis by origin Sex ratio among migrants and citizens
Analysis of Change
It is frequently desired to explain in demographic terms the change in the sex composition of the population from one census to another.
What is called for is a quantitative indication of how the components of population change - births, deaths, migration -contributed to the change in sex composition.
Gulf countries as an example
A Spreadsheet to Calculate Sex Ratio
Analysis of Deficiencies in Age Data
We will consider the types of deficiencies in census tabulations of age under four general headings: errors in single years of age, errors in grouped data, reporting of extreme old age, and failure to report age.
Errors in Single Years of Age
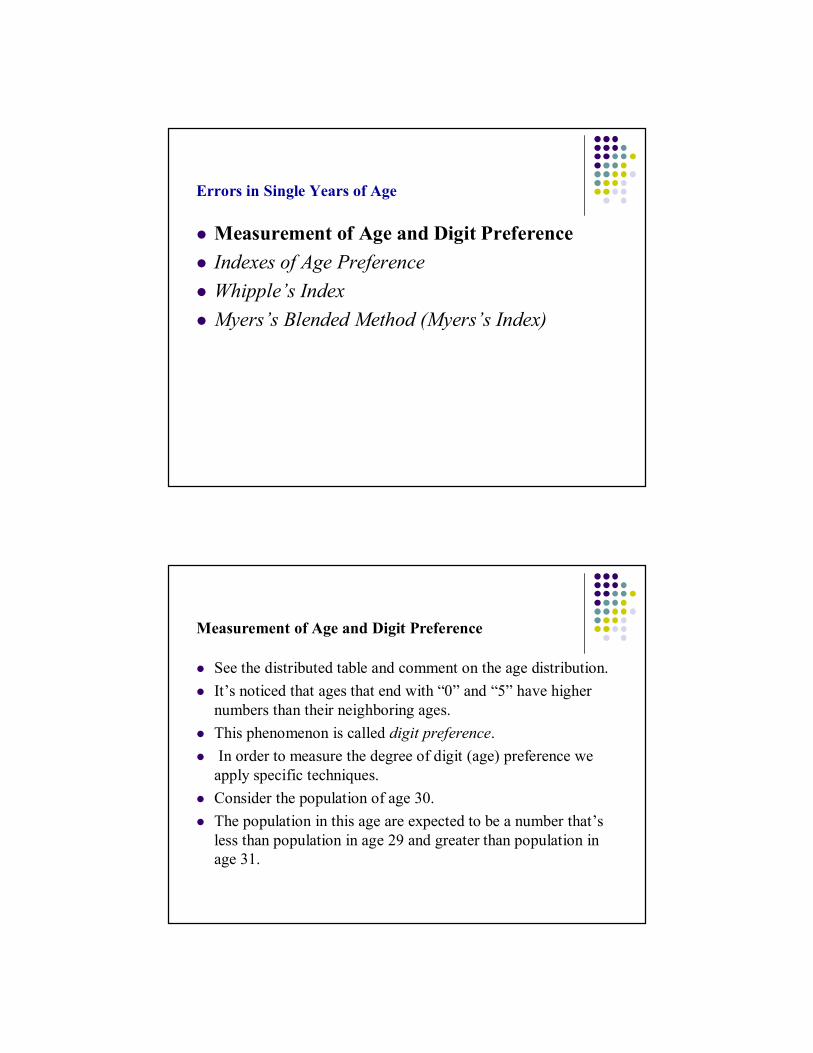
Measurement of Age and Digit Preference Indexes of Age Preference Whipple’s Index Myers’s Blended Method (Myers’s Index)
Measurement of Age and Digit Preference
See the distributed table and comment on the age distribution. It’s noticed that ages that end with “0” and “5” have higher
numbers than their neighboring ages. This phenomenon is called digit preference. In order to measure the degree of digit (age) preference we
apply specific techniques. Consider the population of age 30. The population in this age are expected to be a number that’s
less than population in age 29 and greater than population in age 31.
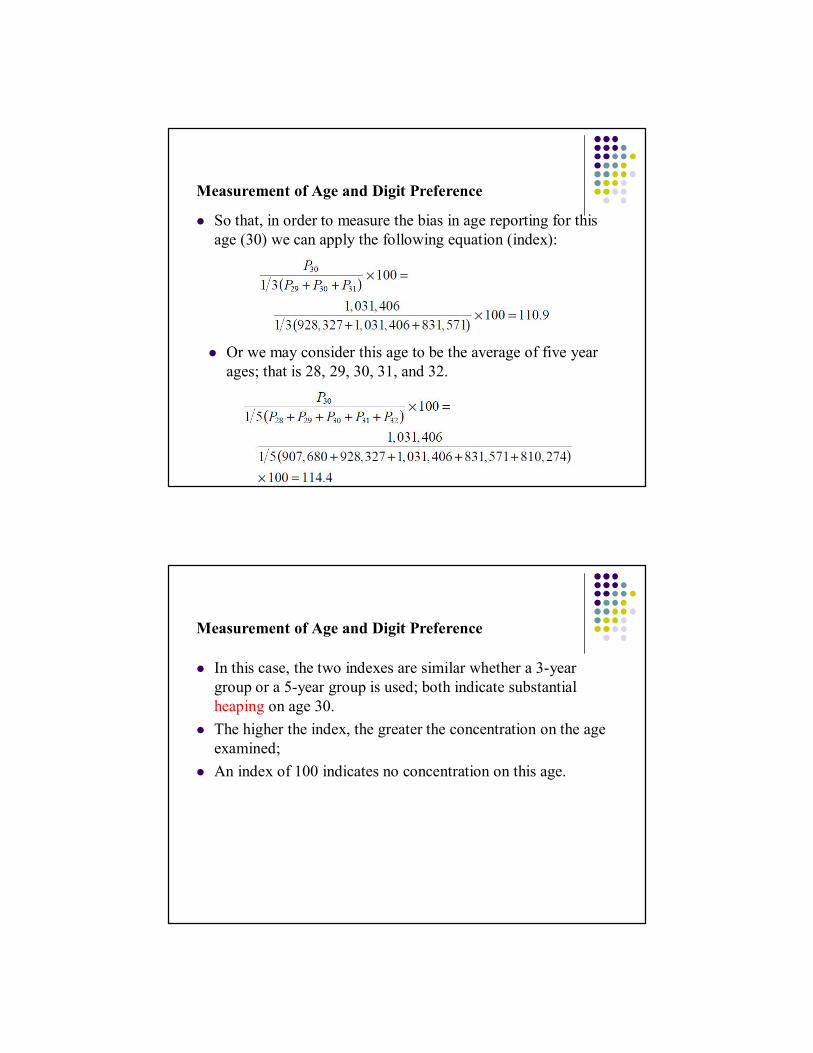
Measurement of Age and Digit Preference
So that, in order to measure the bias in age reporting for this age (30) we can apply the following equation (index):
Or we may consider this age to be the average of five year ages; that is 28, 29, 30, 31, and 32.
Measurement of Age and Digit Preference
In this case, the two indexes are similar whether a 3-year group or a 5-year group is used; both indicate substantial heaping on age 30.
The higher the index, the greater the concentration on the age examined;
An index of 100 indicates no concentration on this age.
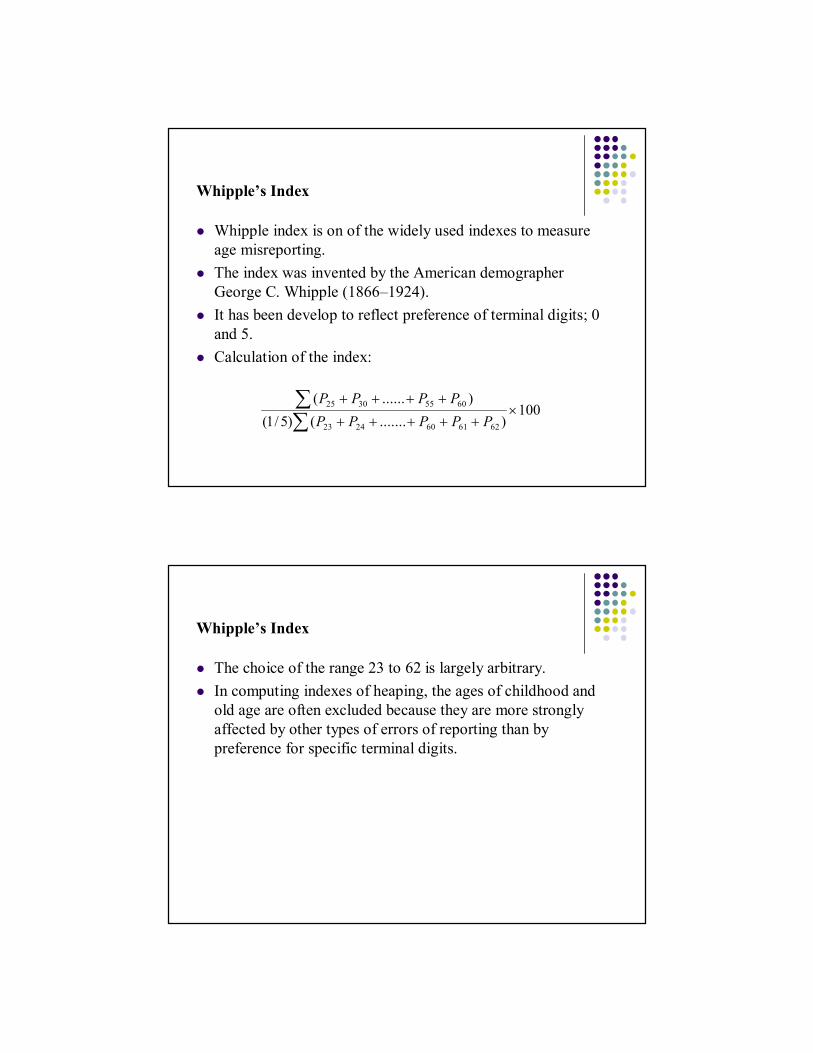
Whipple’s Index
Whipple index is on of the widely used indexes to measure age misreporting.
The index was invented by the American demographer George C. Whipple (1866–1924).
It has been develop to reflect preference of terminal digits; 0 and 5.
Calculation of the index:
100).......()5/1(
)......(
6261602423
60553025
PPPPPPPPP
Whipple’s Index
The choice of the range 23 to 62 is largely arbitrary. In computing indexes of heaping, the ages of childhood and
old age are often excluded because they are more strongly affected by other types of errors of reporting than by preference for specific terminal digits.
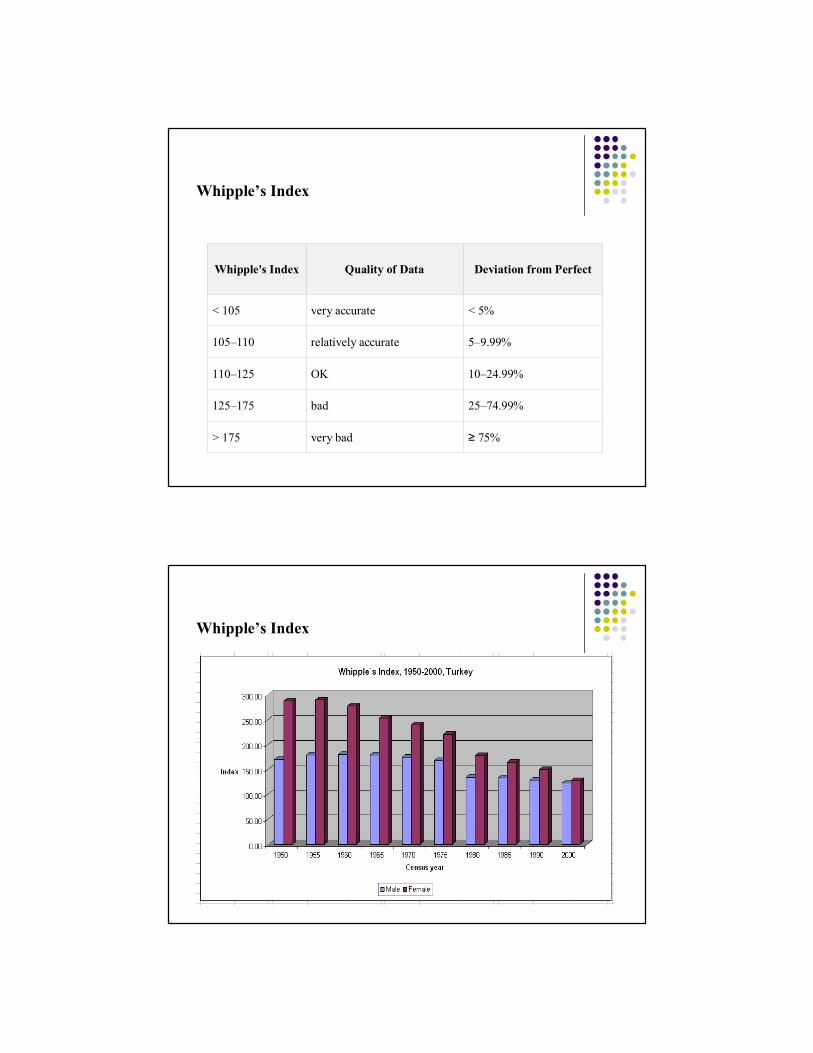
Whipple’s Index
≥ 75%very bad> 175
25–74.99%bad125–175
10–24.99%OK110–125
5–9.99%relatively accurate105–110
< 5%very accurate< 105
Deviation from PerfectQuality of DataWhipple's Index
Whipple’s Index
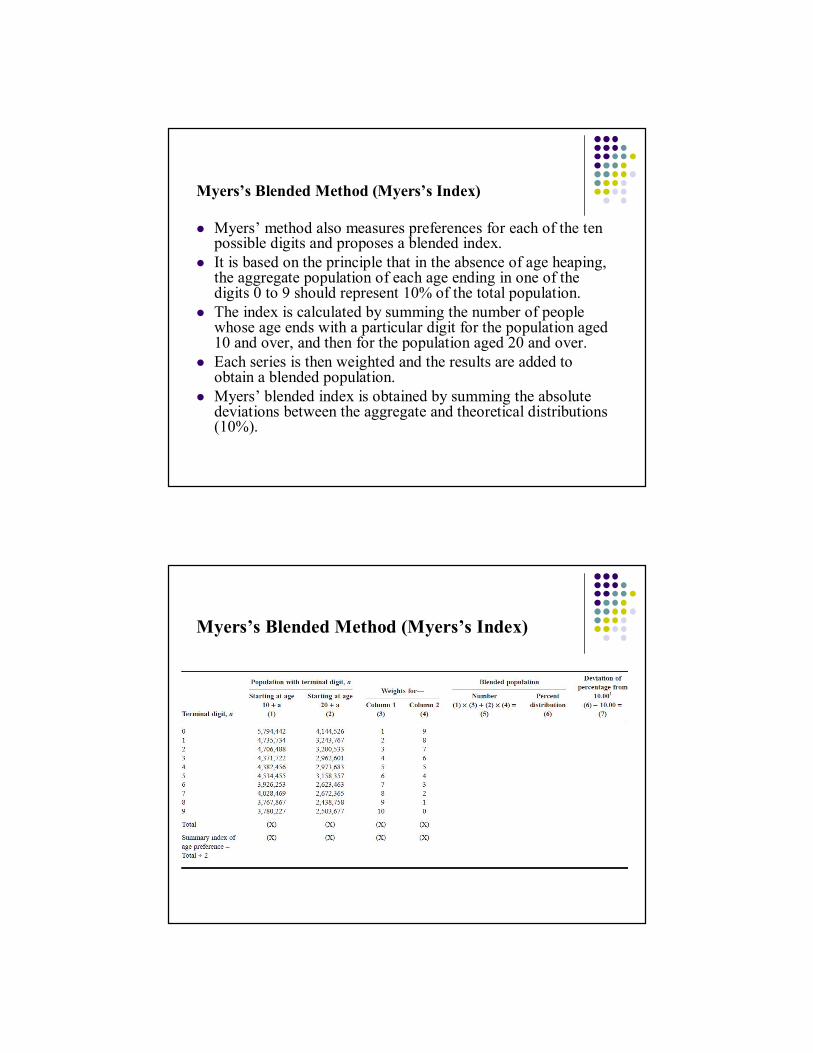
Myers’s Blended Method (Myers’s Index)
Myers’ method also measures preferences for each of the ten possible digits and proposes a blended index.
It is based on the principle that in the absence of age heaping,the aggregate population of each age ending in one of the digits 0 to 9 should represent 10% of the total population.
The index is calculated by summing the number of people whose age ends with a particular digit for the population aged 10 and over, and then for the population aged 20 and over.
Each series is then weighted and the results are added to obtain a blended population.
Myers’ blended index is obtained by summing the absolute deviations between the aggregate and theoretical distributions (10%).
Myers’s Blended Method (Myers’s Index)
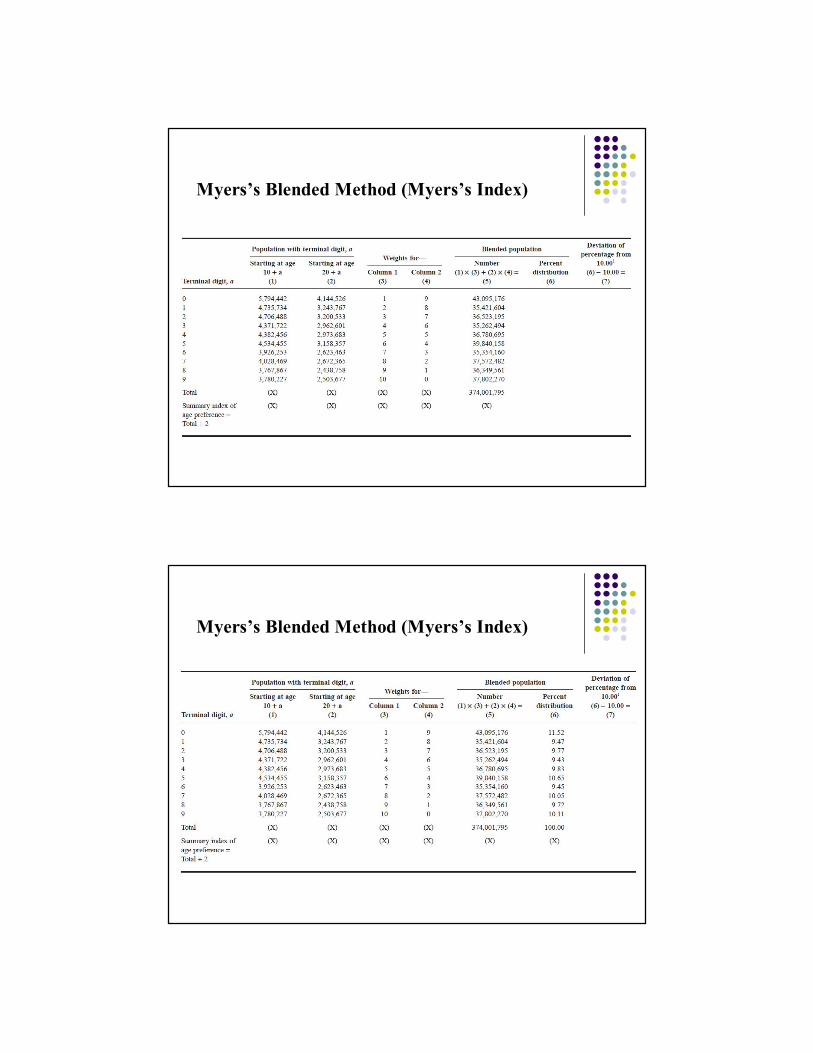
Myers’s Blended Method (Myers’s Index)
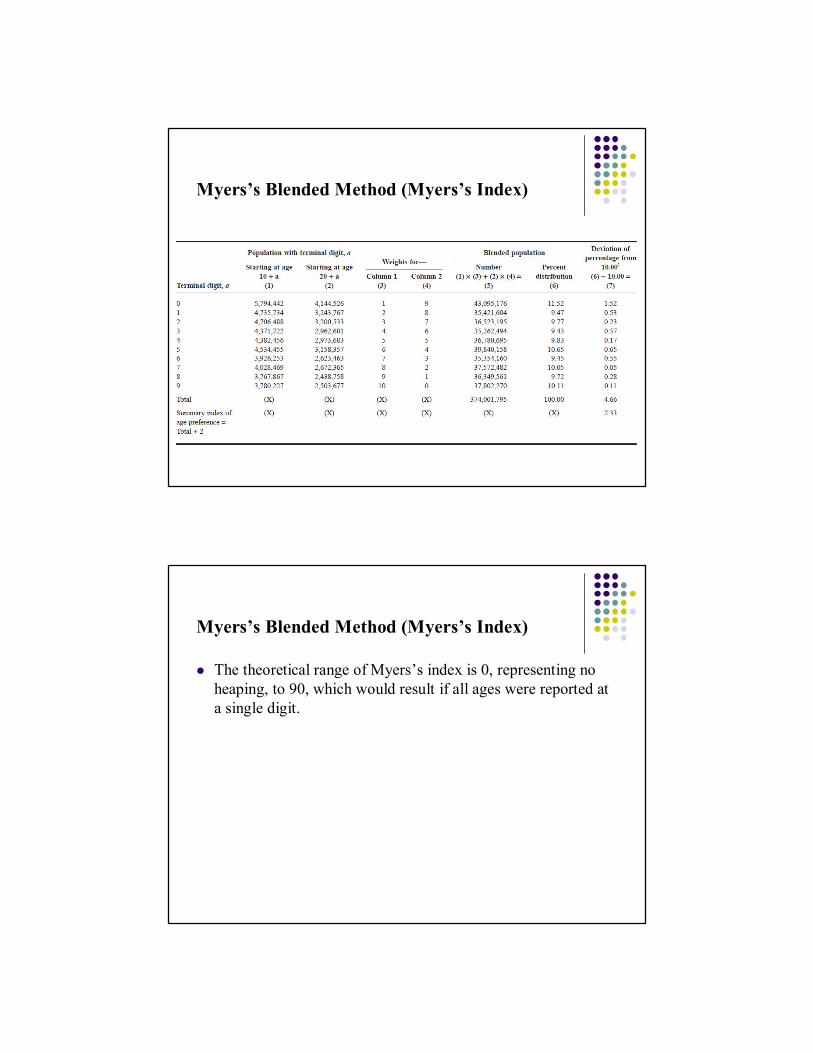
Myers’s Blended Method (Myers’s Index)
Myers’s Blended Method (Myers’s Index)
Myers’s Blended Method (Myers’s Index)
The theoretical range of Myers’s index is 0, representing no heaping, to 90, which would result if all ages were reported at a single digit.
A Spreadsheet to calculate Whipple and Myers indexes
Errors in Grouped Data
Intercensal Cohort Analysis: Intercensal means between two successive censuses. If we are dealing with a closed population (no migration), the
difference between the total number of population in two successive censuses will be solely attributed to births (increase) and deaths (decrease).
The basics: Population Increases by births and decreases by deaths Population increases by immigrants and decreased by emigrants
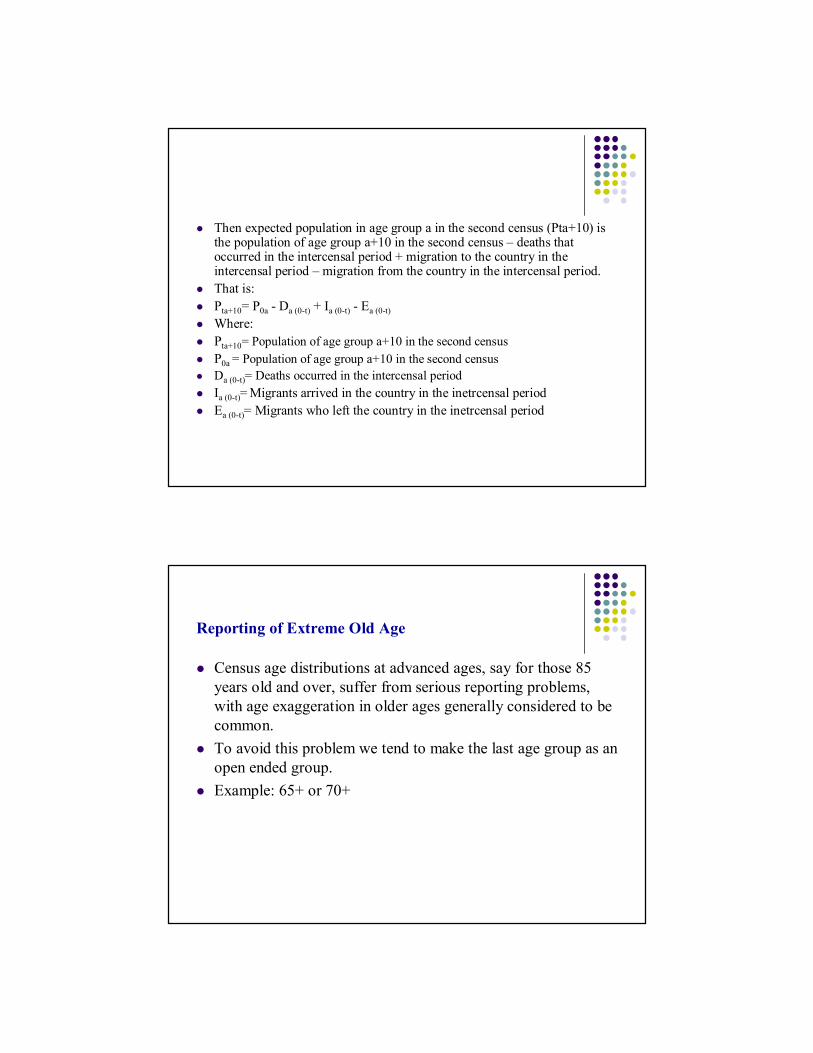
Then expected population in age group a in the second census (Pta+10) is the population of age group a+10 in the second census – deaths that occurred in the intercensal period + migration to the country in the intercensal period – migration from the country in the intercensal period.
That is: Pta+10= P0a - Da (0-t) + Ia (0-t) - Ea (0-t)
Where: Pta+10= Population of age group a+10 in the second census P0a = Population of age group a+10 in the second census Da (0-t)= Deaths occurred in the intercensal period Ia (0-t)= Migrants arrived in the country in the inetrcensal period Ea (0-t)= Migrants who left the country in the inetrcensal period
Reporting of Extreme Old Age
Census age distributions at advanced ages, say for those 85 years old and over, suffer from serious reporting problems, with age exaggeration in older ages generally considered to be common.
To avoid this problem we tend to make the last age group as an open ended group.
Example: 65+ or 70+
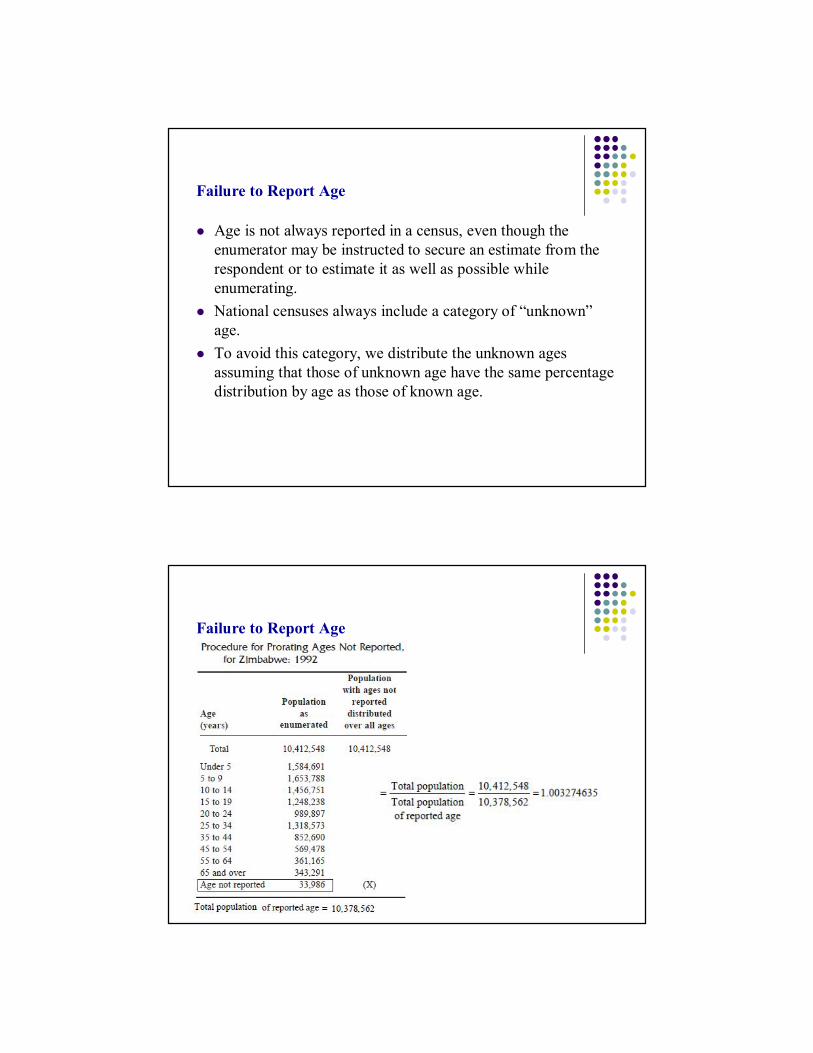
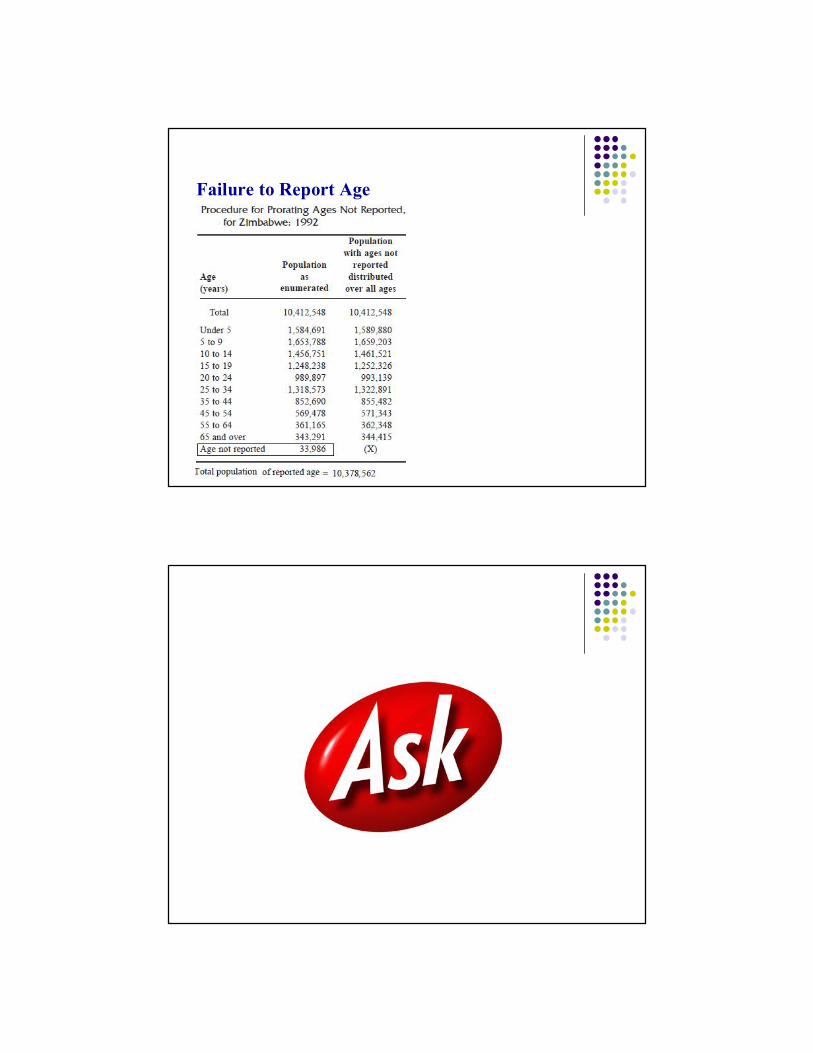
Failure to Report Age
Age is not always reported in a census, even though the enumerator may be instructed to secure an estimate from the respondent or to estimate it as well as possible while enumerating.
National censuses always include a category of “unknown”age.
To avoid this category, we distribute the unknown ages assuming that those of unknown age have the same percentage distribution by age as those of known age.
Failure to Report Age
Failure to Report Age


![CAPE SOCIOLOGY Age and sex structure[1]](https://img.pdfslide.us/doc/110x75/55851841d8b42aff298b5070/cape-sociology-age-and-sex-structure1.jpg)