Embed Size (px)
Citation preview
W&M ScholarWorks W&M ScholarWorks
VIMS Articles Virginia Institute of Marine Science
2002
Age And Growth Of The Smooth Dogfish (Mustelus canis) In The Age And Growth Of The Smooth Dogfish (Mustelus canis) In The
Northwest Atlantic Ocean Northwest Atlantic Ocean
Christina L. Conrath Virginia Institute of Marine Science
J Gelsleichter
John A. Musick Virginia Institute of Marine Science
Follow this and additional works at: https://scholarworks.wm.edu/vimsarticles
Part of the Aquaculture and Fisheries Commons
Recommended Citation Recommended Citation Conrath, Christina L.; Gelsleichter, J; and Musick, John A., Age And Growth Of The Smooth Dogfish (Mustelus canis) In The Northwest Atlantic Ocean (2002). Fishery Bulletin, 100(4), 674-682. https://scholarworks.wm.edu/vimsarticles/576
This Article is brought to you for free and open access by the Virginia Institute of Marine Science at W&M ScholarWorks. It has been accepted for inclusion in VIMS Articles by an authorized administrator of W&M ScholarWorks. For more information, please contact [email protected].
674
The smooth dogfi sh, Mustelus canis, is a small shark species found throughout the western Atlantic Ocean from Mas-sachusetts to Florida, and in the north-ern Gulf of Mexico, including Cuba, Jamaica, Barbados, Bermuda, Baha-mas, and southern Brazil to northern Argentina. Smooth dogfi sh are demer-sal and typically are found in inshore continental shelf and slope waters (Compagno, 1984). Several discrete pop-ulations of smooth dogfi sh likely exist, separated by large geographic areas; and there appears to be little intermi-gration between the different popula-tions (Bigelow and Schroeder, 1948). The northwest Atlantic population of smooth dogfi sh ranges from Cape Cod, Massachusetts, to South Carolina and migrates seasonally in response to changing water temperatures (Bigelow and Schroeder, 1948; Castro, 1983).
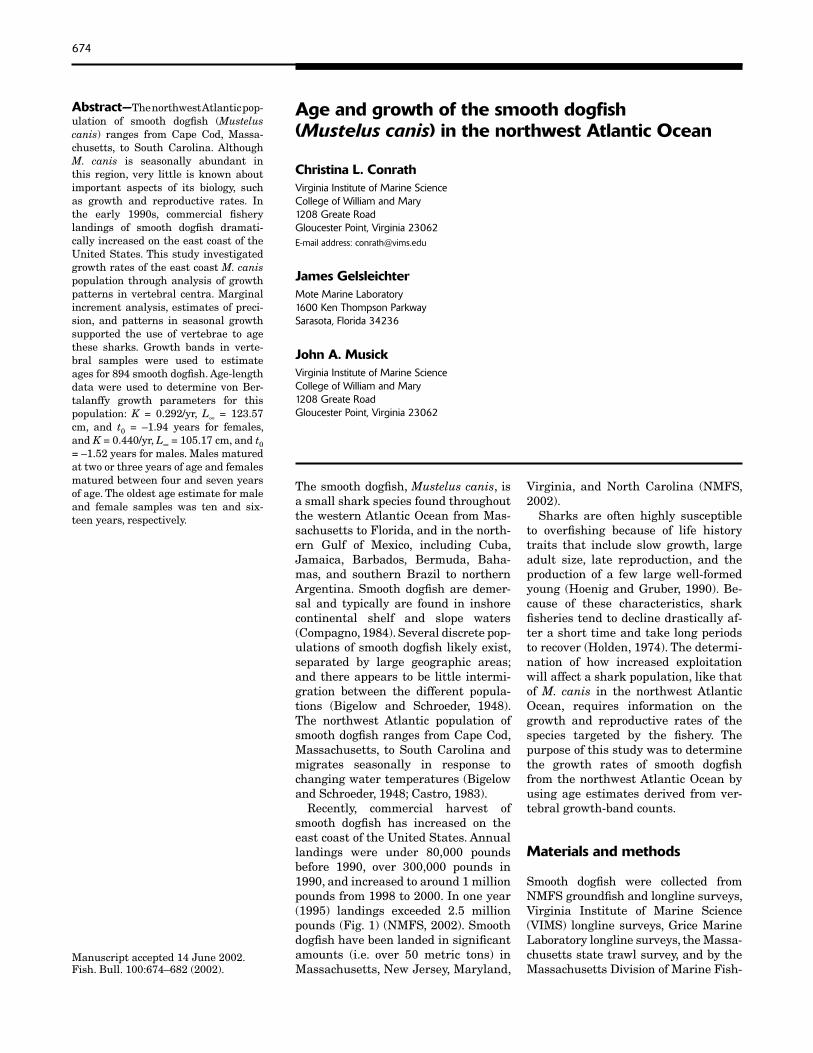
Recently, commercial harvest of smooth dogfi sh has increased on the east coast of the United States. Annual landings were under 80,000 pounds before 1990, over 300,000 pounds in 1990, and increased to around 1 million pounds from 1998 to 2000. In one year (1995) landings exceeded 2.5 million pounds (Fig. 1) (NMFS, 2002). Smooth dogfi sh have been landed in signifi cant amounts (i.e. over 50 metric tons) in Massachusetts, New Jersey, Maryland,
Age and growth of the smooth dogfi sh (Mustelus canis) in the northwest Atlantic Ocean
Christina L. ConrathVirginia Institute of Marine ScienceCollege of William and Mary1208 Greate RoadGloucester Point, Virginia 23062E-mail address: [email protected]
James Gelsleichter Mote Marine Laboratory1600 Ken Thompson ParkwaySarasota, Florida 34236
John A. MusickVirginia Institute of Marine ScienceCollege of William and Mary1208 Greate RoadGloucester Point, Virginia 23062
Virginia, and North Carolina (NMFS, 2002).
Sharks are often highly susceptible to overfi shing because of life history traits that include slow growth, large adult size, late reproduction, and the production of a few large well-formed young (Hoenig and Gruber, 1990). Be-cause of these characteristics, shark fi sheries tend to decline drastically af-ter a short time and take long periods to recover (Holden, 1974). The determi-nation of how increased exploitation will affect a shark population, like that of M. canis in the northwest Atlantic Ocean, requires information on the growth and reproductive rates of the species targeted by the fi shery. The purpose of this study was to determine the growth rates of smooth dogfi sh from the northwest Atlantic Ocean by using age estimates derived from ver-tebral growth-band counts.
Materials and methods
Smooth dogfi sh were collected from NMFS groundfi sh and longline surveys, Virginia Institute of Marine Science (VIMS) longline surveys, Grice Marine Laboratory longline surveys, the Massa-chusetts state trawl survey, and by the Massachusetts Division of Marine Fish-
Manuscript accepted 14 June 2002.Fish. Bull. 100:674–682 (2002).
Abstract—The northwest Atlantic pop-ulation of smooth dogfi sh (Mustelus canis) ranges from Cape Cod, Massa-chusetts, to South Carolina. Although M. canis is seasonally abundant in this region, very little is known about important aspects of its biology, such as growth and reproductive rates. In the early 1990s, commercial fi shery landings of smooth dogfi sh dramati-cally increased on the east coast of the United States. This study investigated growth rates of the east coast M. canis population through analysis of growth patterns in vertebral centra. Marginal increment analysis, estimates of preci-sion, and patterns in seasonal growth supported the use of vertebrae to age these sharks. Growth bands in verte-bral samples were used to estimate ages for 894 smooth dogfi sh. Age-length data were used to determine von Ber-talanffy growth parameters for this population: K = 0.292/yr, L∞ = 123.57 cm, and t0 = –1.94 years for females, and K = 0.440/yr, L∞ = 105.17 cm, and t0 = –1.52 years for males. Males matured at two or three years of age and females matured between four and seven years of age. The oldest age estimate for male and female samples was ten and six-teen years, respectively.
675Conrath et al.: Age and growth of Mustelus canis
0
200
400
600
800
1000
1200
1400
1981
1982
1983
1984
1985
1986
1987
1988
1989
1990
1991
1992
1993
1994
1995
1996
1997
1998
1999
2000
Year
Land
ings
(met
ricto
ns)
Figure 1Reported smooth dogfi sh landings from National Marine Fisheries Service com-mercial catch statistics for the Atlantic and Gulf states, from 1981 to 2000.
eries (MDMF). Total length (TL), precaudal length (PCL), and male clasper length (CL) were measured, and sex was recorded at the time of collection. A section of the vertebral column containing eight to twelve vertebrae was removed from directly under the fi rst dorsal fi n and stored frozen. Reproductive samples were taken from smooth dogfi sh at this time and maturity state was assessed from these samples.
Vertebral samples were cleaned, soaked in 70% ETOH for 24 hours, and air-dried for 24 hours. Dried vertebrae were sagitally sectioned through the focus with an Isomet rotary diamond saw (Bue-hler, Lake Bluff, IL). Afterwards, vertebral sections were affi xed to microscope slides with mounting medium and polished with wet fi ne-grit sand paper to a thickness of about 0.5 mm. The vertebrae were viewed under a binocular dissecting microscope with transmitted light.
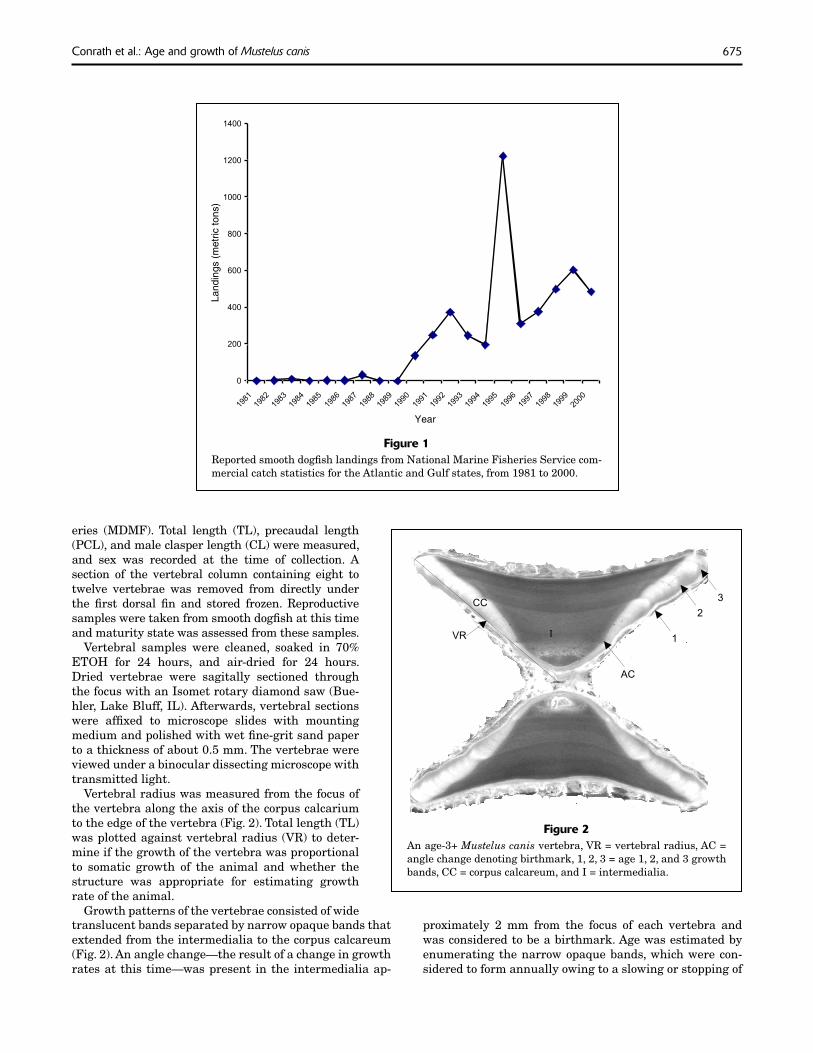
Vertebral radius was measured from the focus of the vertebra along the axis of the corpus calcarium to the edge of the vertebra (Fig. 2). Total length (TL) was plotted against vertebral radius (VR) to deter-mine if the growth of the vertebra was proportional to somatic growth of the animal and whether the structure was appropriate for estimating growth rate of the animal.
Growth patterns of the vertebrae consisted of wide
AC
1
2
3
VR I
CC
Figure 2An age-3+ Mustelus canis vertebra, VR = vertebral radius, AC = angle change denoting birthmark, 1, 2, 3 = age 1, 2, and 3 growth bands, CC = corpus calcareum, and I = intermedialia.
proximately 2 mm from the focus of each vertebra and was considered to be a birthmark. Age was estimated by enumerating the narrow opaque bands, which were con-sidered to form annually owing to a slowing or stopping of
translucent bands separated by narrow opaque bands that extended from the intermedialia to the corpus calcareum (Fig. 2). An angle change—the result of a change in growth rates at this time—was present in the intermedialia ap-
676 Fishery Bulletin 100(4)
AC
MW
PBW
MIR = MW/PBW
AC
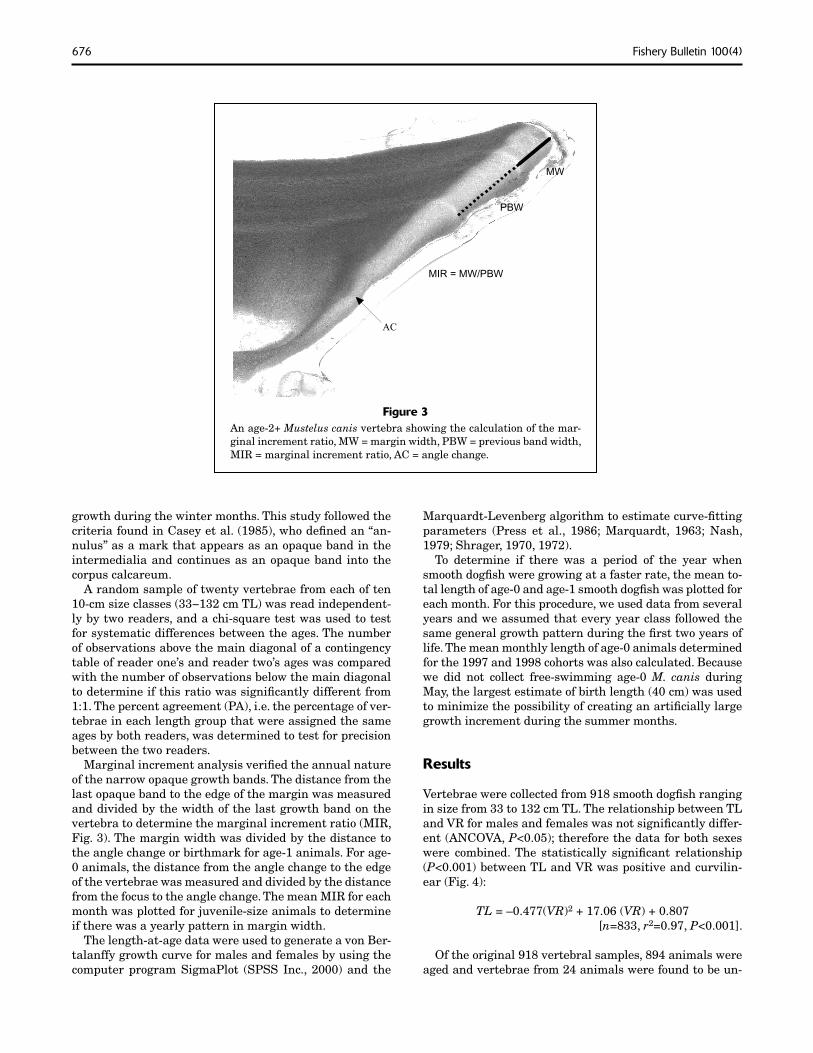
Figure 3An age-2+ Mustelus canis vertebra showing the calculation of the mar-ginal increment ratio, MW = margin width, PBW = previous band width, MIR = marginal increment ratio, AC = angle change.
growth during the winter months. This study followed the criteria found in Casey et al. (1985), who defi ned an “an-nulus” as a mark that appears as an opaque band in the intermedialia and continues as an opaque band into the corpus calcareum.
A random sample of twenty vertebrae from each of ten 10-cm size classes (33−132 cm TL) was read independent-ly by two readers, and a chi-square test was used to test for systematic differences between the ages. The number of observations above the main diagonal of a contingency table of reader one’s and reader two’s ages was compared with the number of observations below the main diagonal to determine if this ratio was signifi cantly different from 1:1. The percent agreement (PA), i.e. the percentage of ver-tebrae in each length group that were assigned the same ages by both readers, was determined to test for precision between the two readers.
Marginal increment analysis verifi ed the annual nature of the narrow opaque growth bands. The distance from the last opaque band to the edge of the margin was measured and divided by the width of the last growth band on the vertebra to determine the marginal increment ratio (MIR, Fig. 3). The margin width was divided by the distance to the angle change or birthmark for age-1 animals. For age-0 animals, the distance from the angle change to the edge of the vertebrae was measured and divided by the distance from the focus to the angle change. The mean MIR for each month was plotted for juvenile-size animals to determine if there was a yearly pattern in margin width.
The length-at-age data were used to generate a von Ber-talanffy growth curve for males and females by using the computer program SigmaPlot (SPSS Inc., 2000) and the
Marquardt-Levenberg algorithm to estimate curve-fi tting parameters (Press et al., 1986; Marquardt, 1963; Nash, 1979; Shrager, 1970, 1972).
To determine if there was a period of the year when smooth dogfi sh were growing at a faster rate, the mean to-tal length of age-0 and age-1 smooth dogfi sh was plotted for each month. For this procedure, we used data from several years and we assumed that every year class followed the same general growth pattern during the fi rst two years of life. The mean monthly length of age-0 animals determined for the 1997 and 1998 cohorts was also calculated. Because we did not collect free-swimming age-0 M. canis during May, the largest estimate of birth length (40 cm) was used to minimize the possibility of creating an artifi cially large growth increment during the summer months.
Results
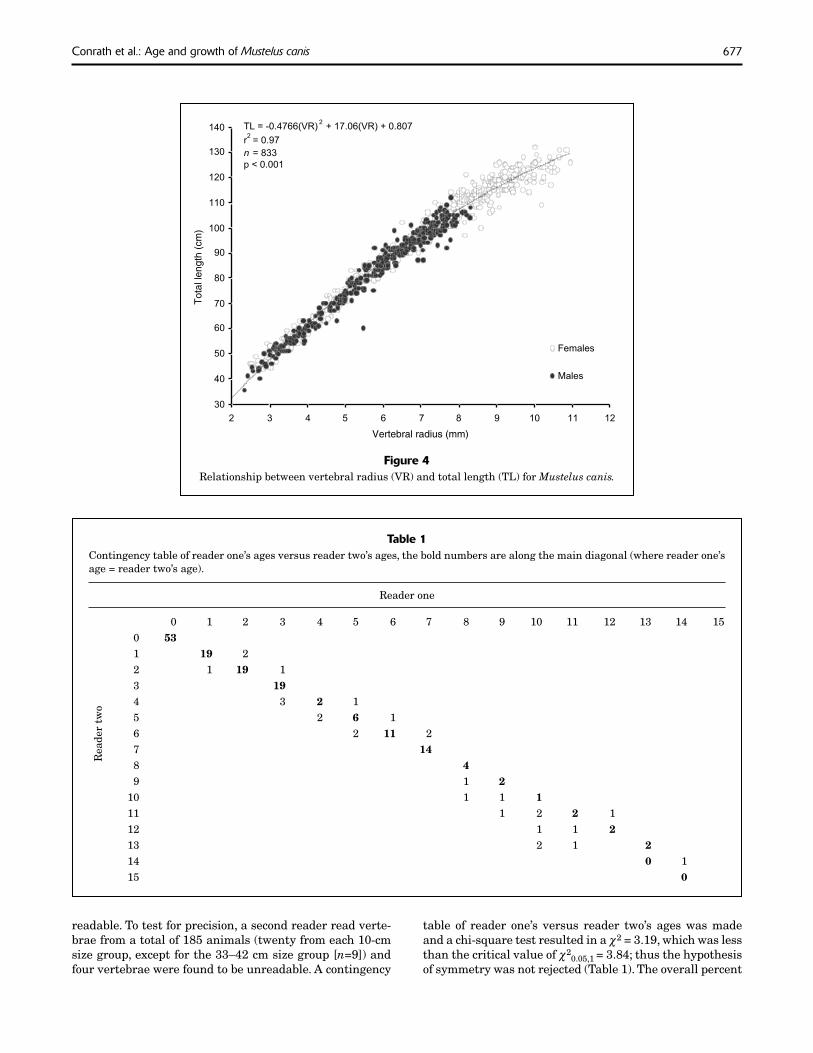
Vertebrae were collected from 918 smooth dogfi sh ranging in size from 33 to 132 cm TL. The relationship between TL and VR for males and females was not signifi cantly differ-ent (ANCOVA, P<0.05); therefore the data for both sexes were combined. The statistically signifi cant relationship (P<0.001) between TL and VR was positive and curvilin-ear (Fig. 4):
TL = –0.477(VR)2 + 17.06 (VR) + 0.807[n=833, r2=0.97, P<0.001].
Of the original 918 vertebral samples, 894 animals were aged and vertebrae from 24 animals were found to be un-
677Conrath et al.: Age and growth of Mustelus canis
Table 1Contingency table of reader one’s ages versus reader two’s ages, the bold numbers are along the main diagonal (where reader one’s age = reader two’s age).
Reader one
0 1 2 3 4 5 6 7 8 9 10 11 12 13 14 15 0 53 1 19 2 2 1 19 1 3 19 4 3 2 1 5 2 6 1 6 2 11 2 7 14 8 4 9 1 2 10 1 1 1 11 1 2 2 1 12 1 1 2 13 2 1 2 14 0 1 15 0
Rea
der
two
30
40
50
60
70
80
90
100
110
120
130
140
2 3 4 5 6 7 8 9 10 11 12
Vertebral radius (mm)
Tot
alle
ngth
(cm
)
Females
Males
TL = -0.4766(VR)2+ 17.06(VR) + 0.807
r2= 0.97
n = 833
p < 0.001
Figure 4Relationship between vertebral radius (VR) and total length (TL) for Mustelus canis.
readable. To test for precision, a second reader read verte-brae from a total of 185 animals (twenty from each 10-cm size group, except for the 33–42 cm size group [n=9]) and four vertebrae were found to be unreadable. A contingency
table of reader one’s versus reader two’s ages was made and a chi-square test resulted in a χ2 = 3.19, which was less than the critical value of χ2
0.05,1 = 3.84; thus the hypothesis of symmetry was not rejected (Table 1). The overall percent
678 Fishery Bulletin 100(4)
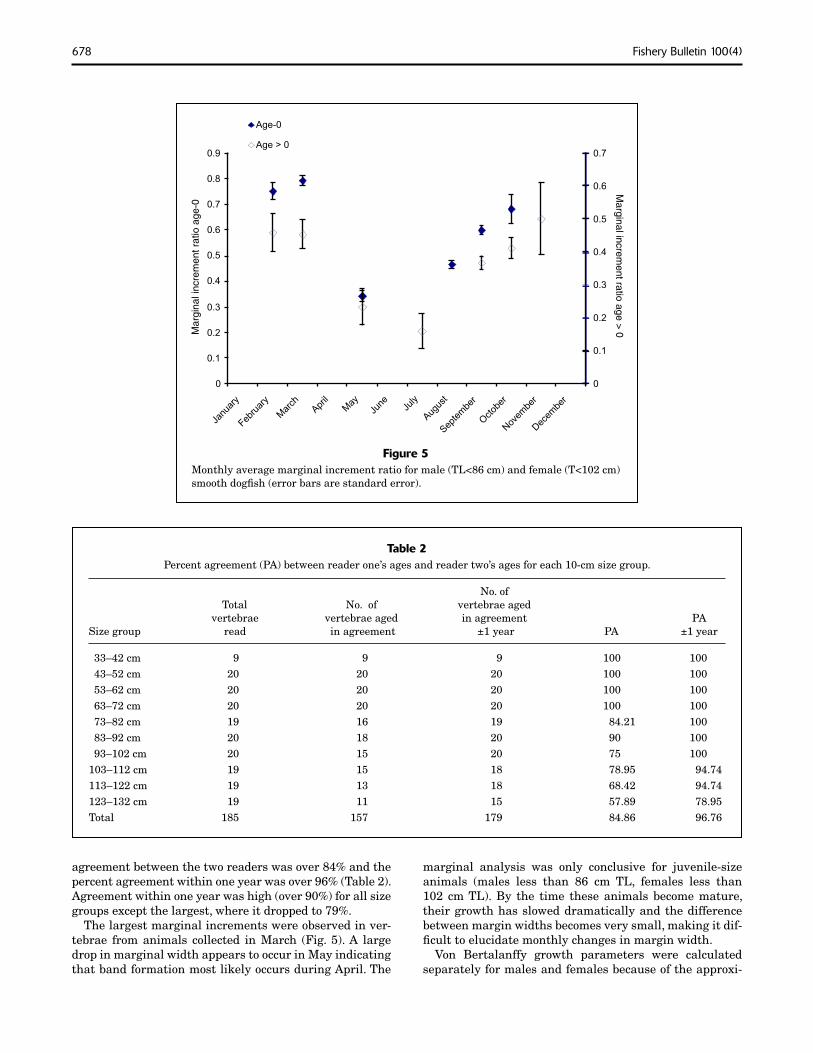
Figure 5Monthly average marginal increment ratio for male (TL<86 cm) and female (T<102 cm) smooth dogfi sh (error bars are standard error).
0
0.1
0.2
0.3
0.4
0.5
0.6
0.7
0.8
0.9
January
February
March
April
May
June Ju
ly
August
September
October
November
December
Mar
gina
linc
rem
entr
atio
age-
0
0
0.1
0.2
0.3
0.4
0.5
0.6
0.7
Marginalincrem
entratioage
>0
Age-0
Age > 0
agreement between the two readers was over 84% and the percent agreement within one year was over 96% (Table 2). Agreement within one year was high (over 90%) for all size groups except the largest, where it dropped to 79%.
The largest marginal increments were observed in ver-tebrae from animals collected in March (Fig. 5). A large drop in marginal width appears to occur in May indicating that band formation most likely occurs during April. The
Table 2Percent agreement (PA) between reader one’s ages and reader two’s ages for each 10-cm size group.
No. of Total No. of vertebrae aged vertebrae vertebrae aged in agreement PASize group read in agreement ±1 year PA ±1 year
33–42 cm 9 9 9 100 100 43–52 cm 20 20 20 100 100 53–62 cm 20 20 20 100 100 63–72 cm 20 20 20 100 100 73–82 cm 19 16 19 84.21 100 83–92 cm 20 18 20 90 100 93–102 cm 20 15 20 75 100103–112 cm 19 15 18 78.95 94.74113–122 cm 19 13 18 68.42 94.74123–132 cm 19 11 15 57.89 78.95Total 185 157 179 84.86 96.76
marginal analysis was only conclusive for juvenile-size animals (males less than 86 cm TL, females less than 102 cm TL). By the time these animals become mature, their growth has slowed dramatically and the difference between margin widths becomes very small, making it dif-fi cult to elucidate monthly changes in margin width.
Von Bertalanffy growth parameters were calculated separately for males and females because of the approxi-
679Conrath et al.: Age and growth of Mustelus canis
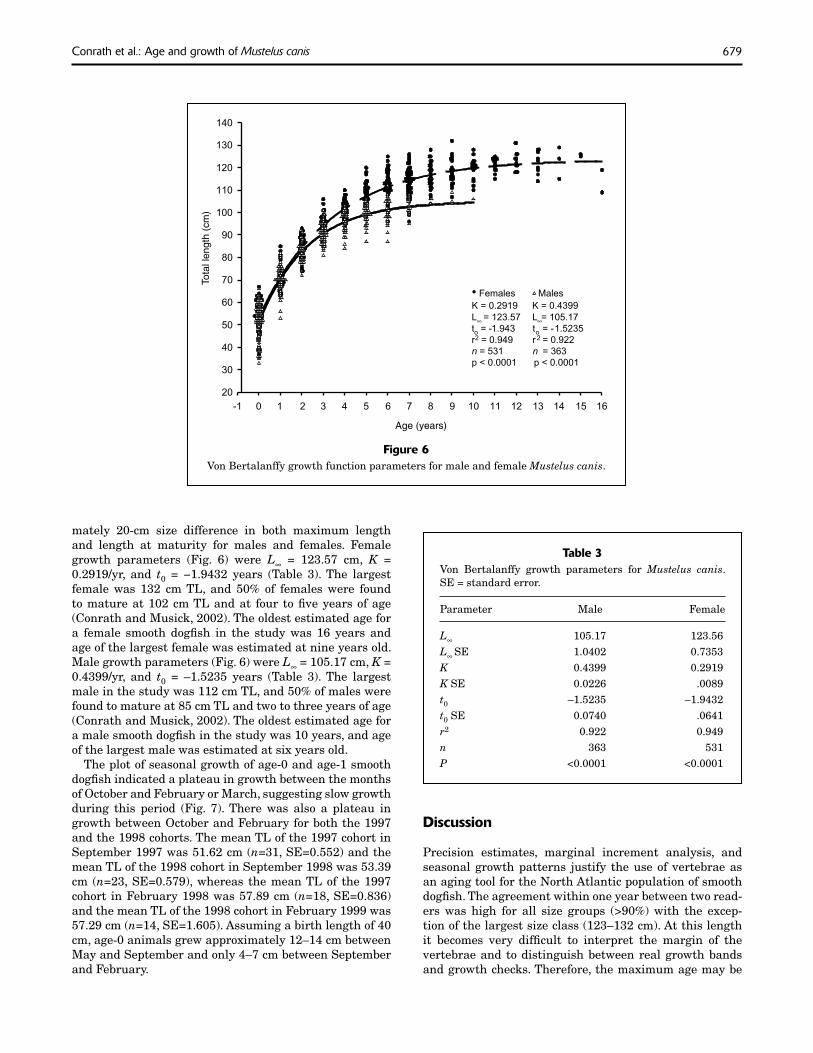
mately 20-cm size difference in both maximum length and length at maturity for males and females. Female growth parameters (Fig. 6) were L∞ = 123.57 cm, K = 0.2919/yr, and t0 = −1.9432 years (Table 3). The largest female was 132 cm TL, and 50% of females were found to mature at 102 cm TL and at four to fi ve years of age (Conrath and Musick, 2002). The oldest estimated age for a female smooth dogfi sh in the study was 16 years and age of the largest female was estimated at nine years old. Male growth parameters (Fig. 6) were L∞ = 105.17 cm, K = 0.4399/yr, and t0 = –1.5235 years (Table 3). The largest male in the study was 112 cm TL, and 50% of males were found to mature at 85 cm TL and two to three years of age (Conrath and Musick, 2002). The oldest estimated age for a male smooth dogfi sh in the study was 10 years, and age of the largest male was estimated at six years old.
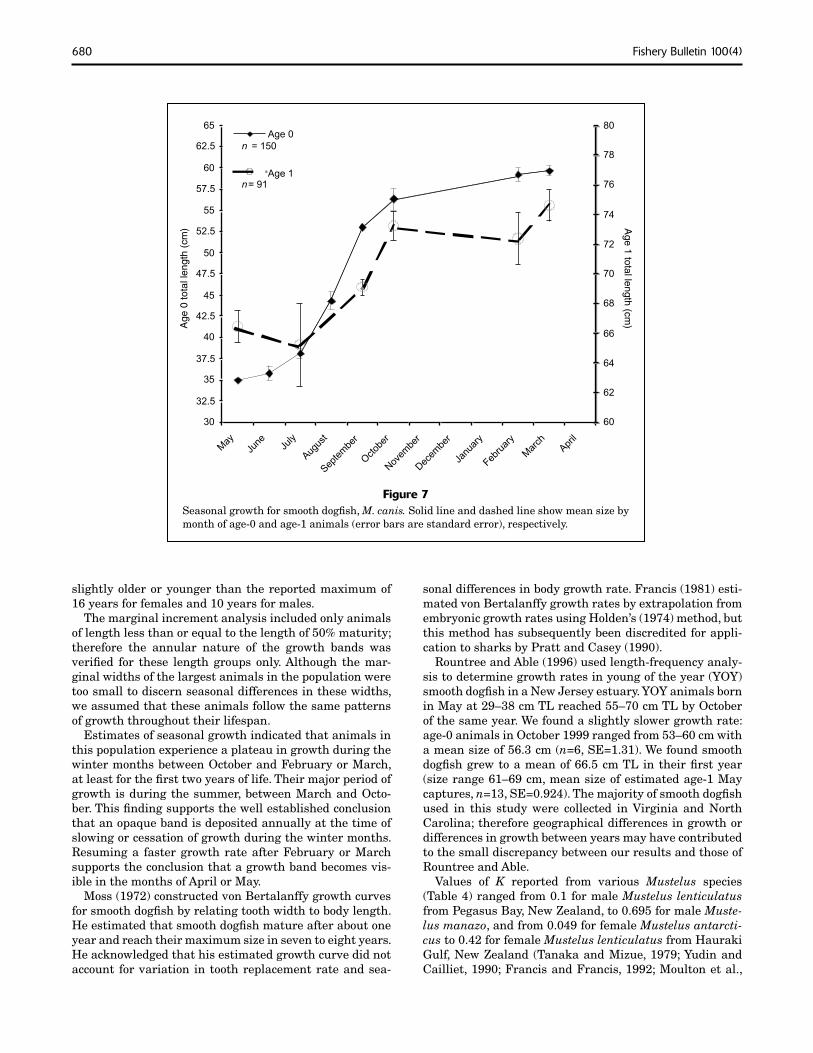
The plot of seasonal growth of age-0 and age-1 smooth dogfi sh indicated a plateau in growth between the months of October and February or March, suggesting slow growth during this period (Fig. 7). There was also a plateau in growth between October and February for both the 1997 and the 1998 cohorts. The mean TL of the 1997 cohort in September 1997 was 51.62 cm (n=31, SE=0.552) and the mean TL of the 1998 cohort in September 1998 was 53.39 cm (n=23, SE=0.579), whereas the mean TL of the 1997 cohort in February 1998 was 57.89 cm (n=18, SE=0.836) and the mean TL of the 1998 cohort in February 1999 was 57.29 cm (n=14, SE=1.605). Assuming a birth length of 40 cm, age-0 animals grew approximately 12–14 cm between May and September and only 4–7 cm between September and February.
Table 3Von Bertalanffy growth parameters for Mustelus canis. SE = standard error.
Parameter Male Female
L∞ 105.17 123.56L∞ SE 1.0402 0.7353K 0.4399 0.2919K SE 0.0226 .0089t0 –1.5235 –1.9432t0 SE 0.0740 .0641r2 0.922 0.949n 363 531P <0.0001 <0.0001
Discussion
Precision estimates, marginal increment analysis, and seasonal growth patterns justify the use of vertebrae as an aging tool for the North Atlantic population of smooth dogfi sh. The agreement within one year between two read-ers was high for all size groups (>90%) with the excep-tion of the largest size class (123–132 cm). At this length it becomes very diffi cult to interpret the margin of the vertebrae and to distinguish between real growth bands and growth checks. Therefore, the maximum age may be
Figure 6Von Bertalanffy growth function parameters for male and female Mustelus canis.
Age (years)
-1 0 1 2 3 4 5 6 7 8 9 10 11 12 13 14 15 16
20
30
40
50
60
70
80
90
100
110
120
130
140
• Females Males
K = 0.2919 K = 0.4399
L∞ ∞= 123.57 L = 105.17
to = -1.943 to = -1.5235
r2 = 0.949 r 2 = 0.922
n = 531 n = 363
p < 0.0001 p < 0.0001
Tota
l len
gth
(cm
)
680 Fishery Bulletin 100(4)
slightly older or younger than the reported maximum of 16 years for females and 10 years for males.
The marginal increment analysis included only animals of length less than or equal to the length of 50% maturity; therefore the annular nature of the growth bands was verifi ed for these length groups only. Although the mar-ginal widths of the largest animals in the population were too small to discern seasonal differences in these widths, we assumed that these animals follow the same patterns of growth throughout their lifespan.
Estimates of seasonal growth indicated that animals in this population experience a plateau in growth during the winter months between October and February or March, at least for the fi rst two years of life. Their major period of growth is during the summer, between March and Octo-ber. This fi nding supports the well established conclusion that an opaque band is deposited annually at the time of slowing or cessation of growth during the winter months. Resuming a faster growth rate after February or March supports the conclusion that a growth band becomes vis-ible in the months of April or May.
Moss (1972) constructed von Bertalanffy growth curves for smooth dogfi sh by relating tooth width to body length. He estimated that smooth dogfi sh mature after about one year and reach their maximum size in seven to eight years. He acknowledged that his estimated growth curve did not account for variation in tooth replacement rate and sea-
sonal differences in body growth rate. Francis (1981) esti-mated von Bertalanffy growth rates by extrapolation from embryonic growth rates using Holden’s (1974) method, but this method has subsequently been discredited for appli-cation to sharks by Pratt and Casey (1990).
Rountree and Able (1996) used length-frequency analy-sis to determine growth rates in young of the year (YOY) smooth dogfi sh in a New Jersey estuary. YOY animals born in May at 29–38 cm TL reached 55–70 cm TL by October of the same year. We found a slightly slower growth rate: age-0 animals in October 1999 ranged from 53–60 cm with a mean size of 56.3 cm (n=6, SE=1.31). We found smooth dogfi sh grew to a mean of 66.5 cm TL in their fi rst year (size range 61–69 cm, mean size of estimated age-1 May captures, n=13, SE=0.924). The majority of smooth dogfi sh used in this study were collected in Virginia and North Carolina; therefore geographical differences in growth or differences in growth between years may have contributed to the small discrepancy between our results and those of Rountree and Able.
Values of K reported from various Mustelus species (Table 4) ranged from 0.1 for male Mustelus lenticulatus from Pegasus Bay, New Zealand, to 0.695 for male Muste-lus manazo, and from 0.049 for female Mustelus antarcti-cus to 0.42 for female Mustelus lenticulatus from Hauraki Gulf, New Zealand (Tanaka and Mizue, 1979; Yudin and Cailliet, 1990; Francis and Francis, 1992; Moulton et al.,
Figure 7Seasonal growth for smooth dogfi sh, M. canis. Solid line and dashed line show mean size by month of age-0 and age-1 animals (error bars are standard error), respectively.
30
32.5
35
37.5
40
42.5
45
47.5
50
52.5
55
57.5
60
62.5
65
May
June Ju
ly
August
September
October
November
December
January
February
March
April
60
62
64
66
68
70
72
74
76
78
80Age 0
Age 1n= 91
n = 150
Age
0 to
tal l
engt
h (c
m) A
ge 1 total length (cm)
681Conrath et al.: Age and growth of Mustelus canis
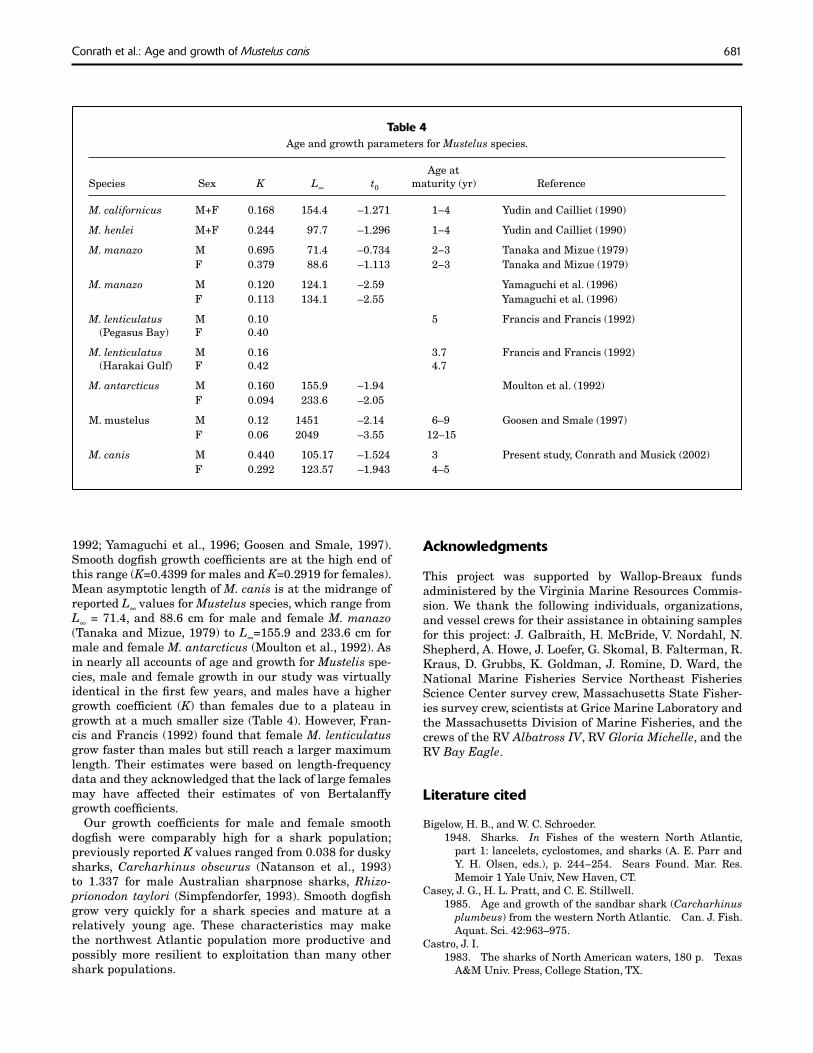
Table 4Age and growth parameters for Mustelus species.
Age at Species Sex K L∞ t0 maturity (yr) Reference
M. californicus M+F 0.168 154.4 –1.271 1−4 Yudin and Cailliet (1990)
M. henlei M+F 0.244 97.7 –1.296 1−4 Yudin and Cailliet (1990)
M. manazo M 0.695 71.4 –0.734 2−3 Tanaka and Mizue (1979) F 0.379 88.6 –1.113 2−3 Tanaka and Mizue (1979)
M. manazo M 0.120 124.1 –2.59 Yamaguchi et al. (1996) F 0.113 134.1 –2.55 Yamaguchi et al. (1996)
M. lenticulatus M 0.10 5 Francis and Francis (1992) (Pegasus Bay) F 0.40
M. lenticulatus M 0.16 3.7 Francis and Francis (1992) (Harakai Gulf) F 0.42 4.7
M. antarcticus M 0.160 155.9 –1.94 Moulton et al. (1992) F 0.094 233.6 –2.05
M. mustelus M 0.12 1451 –2.14 6–9 Goosen and Smale (1997) F 0.06 2049 –3.55 12–15
M. canis M 0.440 105.17 –1.524 3 Present study, Conrath and Musick (2002) F 0.292 123.57 –1.943 4–5
1992; Yamaguchi et al., 1996; Goosen and Smale, 1997). Smooth dogfi sh growth coeffi cients are at the high end of this range (K=0.4399 for males and K=0.2919 for females). Mean asymptotic length of M. canis is at the midrange of reported L∞ values for Mustelus species, which range from L∞ = 71.4, and 88.6 cm for male and female M. manazo (Tanaka and Mizue, 1979) to L∞=155.9 and 233.6 cm for male and female M. antarcticus (Moulton et al., 1992). As in nearly all accounts of age and growth for Mustelis spe-cies, male and female growth in our study was virtually identical in the fi rst few years, and males have a higher growth coeffi cient (K) than females due to a plateau in growth at a much smaller size (Table 4). However, Fran-cis and Francis (1992) found that female M. lenticulatus grow faster than males but still reach a larger maximum length. Their estimates were based on length-frequency data and they acknowledged that the lack of large females may have affected their estimates of von Bertalanffy growth coeffi cients.
Our growth coeffi cients for male and female smooth dogfi sh were comparably high for a shark population; previously reported K values ranged from 0.038 for dusky sharks, Carcharhinus obscurus (Natanson et al., 1993) to 1.337 for male Australian sharpnose sharks, Rhizo-prionodon taylori (Simpfendorfer, 1993). Smooth dogfi sh grow very quickly for a shark species and mature at a relatively young age. These characteristics may make the northwest Atlantic population more productive and possibly more resilient to exploitation than many other shark populations.
Acknowledgments
This project was supported by Wallop-Breaux funds administered by the Virginia Marine Resources Commis-sion. We thank the following individuals, organizations, and vessel crews for their assistance in obtaining samples for this project: J. Galbraith, H. McBride, V. Nordahl, N. Shepherd, A. Howe, J. Loefer, G. Skomal, B. Falterman, R. Kraus, D. Grubbs, K. Goldman, J. Romine, D. Ward, the National Marine Fisheries Service Northeast Fisheries Science Center survey crew, Massachusetts State Fisher-ies survey crew, scientists at Grice Marine Laboratory and the Massachusetts Division of Marine Fisheries, and the crews of the RV Albatross IV, RV Gloria Michelle, and the RV Bay Eagle.
Literature cited
Bigelow, H. B., and W. C. Schroeder. 1948. Sharks. In Fishes of the western North Atlantic,
part 1: lancelets, cyclostomes, and sharks (A. E. Parr and Y. H. Olsen, eds.), p. 244−254. Sears Found. Mar. Res. Memoir 1 Yale Univ, New Haven, CT.
Casey, J. G., H. L. Pratt, and C. E. Stillwell. 1985. Age and growth of the sandbar shark (Carchar hinus
plum beus) from the western North Atlantic. Can. J. Fish. Aquat. Sci. 42:963–975.
Castro, J. I. 1983. The sharks of North American waters, 180 p. Texas
A&M Univ. Press, College Station, TX.
682 Fishery Bulletin 100(4)
Compagno, L. J. V. 1984. Sharks of the world. An annotated and illustrated cat-
alogue of shark species known to date. FAO Species Cata-logue, vol 4, part 2. FAO Fish. Synop., p. 404–406. FAO, Rome.
Conrath, C. L., and J. A. Musick.2002. Reproductive biology of the smooth dogfi sh, Mustelus
canis, in the northwest Atlantic Ocean. Environ. Biol. Fishes 64:367–377.
Francis, M. P. 1981. Von Bertalanffy growth rates in species of Mustelus
(Elasmobranchii: Triakidae). Copeia 1981:189–192.Francis, M. P., and R. I. C. C. Francis.
1992. Growth rate estimates for New Zealand rig (Muste -lus lenticulatus). Aust. J. Mar. Freshwater Res. 43:1157–1176.
Goosen, A. J. J., and M. J. Smale. 1997. A preliminary study of age and growth of the smooth-
hound shark Mustelus mustelus (Triakidae). S. Afr. J. Mar. Sci. 18:85–91.
Hoenig, J. M., and S. H. Gruber. 1990. Life history patterns in the elasmobranchs: implica-
tions for fi sheries management. In Elasmobranchs as living resources: advances in biology, ecology, systematics, and status of the fi sheries (H. L. Pratt Jr., S. H. Gruber, and T. Taniuchi, eds.), p. 1–16. U.S. Dep. Commer., NOAA Tech. Rep. NMFS 90.
Holden, M. J. 1974. Problems in the rational exploitation of elasmobranch
populations and some suggested solutions. In Sea fi sher-ies research (F. R. Harden Jones, ed.), p. 117–137. J. Wiley and Sons, New York, NY.
Marquardt, D. W. 1963. An algorithm for least squares estimation of para-
meters. J. Soc. Industrial and Applied Mathematics 11:431–441.
Moss, S. A. 1972. Tooth replacement and body growth rates in the
smooth dogfi sh, Mustelus canis (Mitchill). Copeia 1972:808−811.
Moulton, P. L., T. I. Walker, and S. R. Saddlier. 1992. Age and growth studies of gummy shark, Mustelus
antarcticus Gunther, and school shark, Galeorhinus galeus (Linnaeus), from southern Australian waters. Aust. J. Mar. Freshwater Res. 43:1241–1267.
Nash, J. C. 1979. Compact mumerical methods for computers: linear
algebra and function minimization, 292 p. John Wiley & Sons, Inc., New York, NY.
Natanson, L. J., J. G. Casey, and N. E. Kohler. 1993. Age and growth estimates for the dusky shark, Car-
charhinus obscurus, in the western North Atlantic Ocean. Fish. Bull. 93:116–126.
National Marine Fisheries Service. 2002. Commercial fi shery statistics. Internet. August 28,
2001. [Available from http://www.st.nmfs.gov/st1/commercial/landings/annual_landings.html. Search terms: species: shark, smooth dogfi sh and shark, dogfi sh; from: 1980 to 2000; state area: Atlantic and Gulf by state. Access date: 2 June, 2002.]
Pratt, H. L., Jr., and J. G. Casey. 1990. Shark reproductive strategies as a limiting factor
in directed fi sheries, with a review of Holden’s method of estimating growth parameters. In Elasmobranchs as living resources: advances in biology, ecology, systematics and status of the fi sheries (H. L. Pratt Jr., S. H. Gruber, and T. Taniuchi, eds.), p. 97–109. U.S. Dep. Commer., NOAA Tech. Rep. NMFS 90.
Press, W. H., B. P. Flannery, S. A. Teukolsky, and W. T. Vetterling. 1986. Numerical recipes. Cambridge Univ. Press, Cam-
bridge.Rountree, R. A., and K. W. Able.
1996. Seasonal abundance, growth, and foraging habits of juvenile smooth dogfi sh, Mustelus canis, in a New Jersey estuary. Fish. Bull. 94:522–534.
Shrager, R. I. 1970. Regression with linear constraints: an extension of
the magnifi ed diagonal method. J. Assoc. Computing Machinery 17:446−452.
1972. Quadratic programming for N. Communications of the ACM 15:41–45.
SPSS, Inc.2000. SigmaPlot 2000 user’s quide, 435 p. SPSS, Inc., Chi-
cago, IL.Simpfendorfer, C. A.
1993. Age and growth of the Australian sharpnose shark, Rhizoprionodon taylori, from north Queensland, Australia. Environ. Biol. Fishes 36:233–241.
Tanaka, S., and K. Mizue. 1979. Age and growth of Japanese dogfi sh Mustelus manazo
Bleeker in the East China Sea. Bull. Jpn. Soc. Sci. Fish. 45:43–50.
Yamaguchi, A., T. Taniuchi, and M. Shimizu. 1996. Age and growth of the starspotted dogfi sh, Mustelus
manazo, from Tokyo Bay, Japan. Fish. Sci. 62:919–922.Yudin, K. G., and G. M. Cailliet.
1990. Age and growth of the gray smoothhound, Mustelus californicus, and the brown smoothhound, Mustelus henlei, sharks from central California. Copeia 1990:191−204.