Embed Size (px)
Citation preview

, .. .
~ a g a ~ ~ . ~ ~ / y Region Tel: 905-685-1 571 Toll-free: 1-800-263-721 5
Fax: 905-687-4977 [email protected]
- www.regional.niagara.on.ca
April 17,2008
Ms. Carolyn Kett Municipal Clerk Town of Fort Erie Fort Erie, ON L2A 2S6
CL 7-2008, April 10,2008 CSC 5-2008, April 2,2008 Report 33-2008 2008 Tax Policy and Tax Rates
RECEIVED
The Council of the Regional Municipality of Niagara, at its meeting of April 10, 2008, approved the following recommendations of its Corporate Services Committee:
"That Report CSD 33-2008, March 12,2008, respecting 2008 Tax Policy and Tax Rates be approved and adopted, as amended.
1) That the tax ratios and tax rates contained in Schedule 1 of this report be adopted for the taxation year 2008.
2) That the Area Municipal Councils be informed of Regional Council's decision to utilize the recommended tax ratios and be directed to apply the same tax ratios in determining their 2008 tax rates for their purposes.
3) That the 2008 capping program reflect the following criteria: a) An annual cap set at:
i) the greater of: (1) An amount representing an increase of 10% of the previous year's annualized
tax, or (2) An amount representing an increase of 5% of the previous year's Current
Value Assessment (CVA) tax limit, b) And, that following the application of the capping program all properties within +/-
$250 threshold of the CVA taxes be moved directly to CVA taxation.
4) That the new to class/new construction treatment, under subsection 331(20) of the Municipal Act, be phased out by establishing CVA tax responsibility at 100% in 2008.
5) That the 2008 capping program be funded by claw back from within respective classes pursuant to section 330 of the Municipal Act. - - - - -
Building Community. Building Lives.

Page 2......
6) That the Area Municipal Treasurers be requested to include in the standardized tax bill a separate tax rate as calculated for the Region's contribution to the Regional Programs, (which include Niagara Regional Cancer Centre, Cardiac Catheterization Centre and Longer-Term Mental Health Centre) to be housed within Niagara Health System's New Health Care Complex in St. Catharines, in addition to the tax rates for general Regional services and education purposes.
7) That the Regional Clerk be requested to prepare the necessary by-laws for consideration and adoption by Regional Council.
8) That this report be received and circulated to the Councils of the Area Municipalities for information."
A copy of background report CSD 33-2008 and By-laws No. 37-2008 and 38-2008 are attached for your information.
For further information on this matter, please contact John Bergsma, Commissioner, Corporate Services, at (905) 685-4225, ext. 3292.
Yours truly,
&% Pam Gilroy Regional Clerk cc: J. Bergsma, Commissioner, Corporate Services

CSD 33-2008 March 12,2008
Amended
Niagara s!Jf Region
REPORT TO: Chair and Members of the Property Assessment and Taxation Reform Adhoc Committee
SUBJECT: 2008 Tax Policy and Tax Rates
RECOMMENDATION
That this Committee recommend to Regional Council:
That the following recommendations be approved and adopted:
1) That the tax ratios and tax rates contained in Schedule 1 of this report be adopted for the taxation year 2008.
2) That the Area Municipal Councils be informed of Regional Council's decision to utilize the recommended tax ratios and be directed to apply the same tax ratios in determining their 2008 tax rates for their purposes.
3) That the 2008 capping program reflect the following criteria: a) An annual cap set at:
i) the greater of: (1) An amount representing an increase of 10% of the previous year's
annualized tax, or (2) An amount representing an increase of 5% of the previous year's Current
Value Assessment (CVA) tax limit, b) And, that following the application of the capping program all properties within +/-
$250 threshold of the CVA taxes be moved directly to CVA taxation.
4) That the new to class/new construction treatment, under subsection 331(20) of the Municipal Act, be phased out by establishing CVA tax responsibility at 100% in 2008.
5) That the 2008 capping program be funded by claw back from within respective classes pursuant to section 330 of the Municipal Act.
6) That the Area Municipal Treasurers be requested to include in the standardized tax bill a separate .tax rate as calculated for the Region's contribution to the Regional Programs, (which include Niagara Regional Cancer Centre, Cardiac Catheterization Centre and Longer-Term Mental Health Centre) to .be housed within Niagara Health

CSD 33-2008 March 12,2008
Amended
System's New Health Care Complex in St. Catharines, in addition to the tax rates for general Regional services and education purposes.
7) That the Regional Clerk be requested to prepare the necessary by-laws for consideration and adoption by Regional Council.
8) That this report be received and circulated to the Councils of the Area Municipalities for information.
PURPOSE
This report is intended to provide Committee and Council with an analysis of tax ratios and the resulting tax rates for 2008 property tax policy.
- EXECUTIVE SUMMARY
The Municipal Act requires upper tier municipalities to approve property tax policies and by-laws related to ratio setting, tax rates, and mechanisms to fund the mandatory property tax cap for the multi-residential, commercial and industrial property classes by April 30, 2008. To meet this deadline Regional Council must approve the tax policies at the April 10, 2008 scheduled meeting.
As with the 2008 Budget exercise the main focus of 2008 tax policy analysis was residential "taxpayer affordability". Results of the 2007 BMA Study were used to determine the tax burden competitiveness of each property class in Niagara Region. The recommended scenario, which does not include any tax mitigation, has been prepared with a net residential impact of $0.29 and $0.49 on properties valued at $190,000 and $31 5,000 respectively.
In addition, mechanisms to fund the mandatory property tax cap for the multi-residential, commercial and industrial property classes must be considered and a by-law passed by April 30,2008.
FINANCIAL IMPLICATIONS
There are no immediate financial implications to the Region. However, there are financial implications to the various property classes.
BACKGROUND
The tax policy recommendations set out in this Report and the impacts have been formulated using information presented in the final year-end assessment roll delivered by the Municipal Property Assessment Corporation (MPAC).

CSD 33-2008 March 12,2008
Amended
For the 2008 taxation year, the Province requires the approval of property tax policy by- laws by April 30, 2008. The following tax policies must be approved by Regional Council:
Tax Ratio By-Law Upper-tier Tax Rate By-Law Capping By-law
REPORT
A) Tax Policy Review
To undertake the analysis leading to recommended tax ratios and tax rates it is necessary to examine four important areas. These are:
I. Provincial announcements, 2. the Province's strategy for tax ratios (Ranges of Fairness), 3. the results of the 2007 Municipal Tax Study, and 4. each property class situation.
These areas are discussed below.
1. Provincial Announcements
The Ministry of Finance has announced that education tax rates will remain unchanged from 2007. This is consistent with the province's policy of not updating education rates in a non-reassessment year. In addition, the province will continue its policy of providing business education tax cuts to match municipal tax reductions. As in previous years all matching reductions will be addressed on a case-by-case basis.
It is anticipated that Niagara's industrial education tax rate will be reduced as part of the business education tax (BET) reduction plan announced in the 2007 Ontario Budget. Under this plan BET rates are to be reduced to a target maximum of 1.6% by the year 2014. Table A below indicates that the BET reduction program will only apply to Niagara's industrial class. Niagara's commercial education rate is currently below the 1.6% target.
Table A
Business Education Tax Reduction
Property Class Commercial Industrial
2008
Ed Tax Cut Program
No Yes
Education Tax Rate 1.592891 % 2.586498%
Target 1.6% 1.6%

CSD 33-2008 March 12,2008
Amended
Annual ceiling rates have been established by the province in order to move BET rates to the 2014 target of 1.6% Reductions occur in one of two ways depending on whether the BET rate is above or below the annual ceiling rate.
1. Above - The BET rate is reduced to the ceiling rate. 2. Below - The BET rate is reduced by 2% of the amount by which it exceeds 1.6%.
For the taxation years 2008 and 2009 Niagara's industrial BET rate is "below" the annual ceiling rates. Therefore the 2% reduction will apply. Thereafter, for the years 2010 to 2014, Niagara's industrial BET rate will be moved to the annual ceiling rate. The annual ceiling rates and Niagara's projected industrial BET rate progression is provided in the following table.
Table B
The education rates will be considered preliminary until prescribed in regulation.
2. Tax Ratios
Tax ratios establish the relative municipal tax burden for each property class, based on the residential class ratio set to one. Each year Regional Council, as part of its mandate sets tax ratios which also apply to each of the 12 area municipalities. Tax ratios must be established prior to passing the tax rate by-law. The deadline for establishing both by-laws is April 30, 2008.
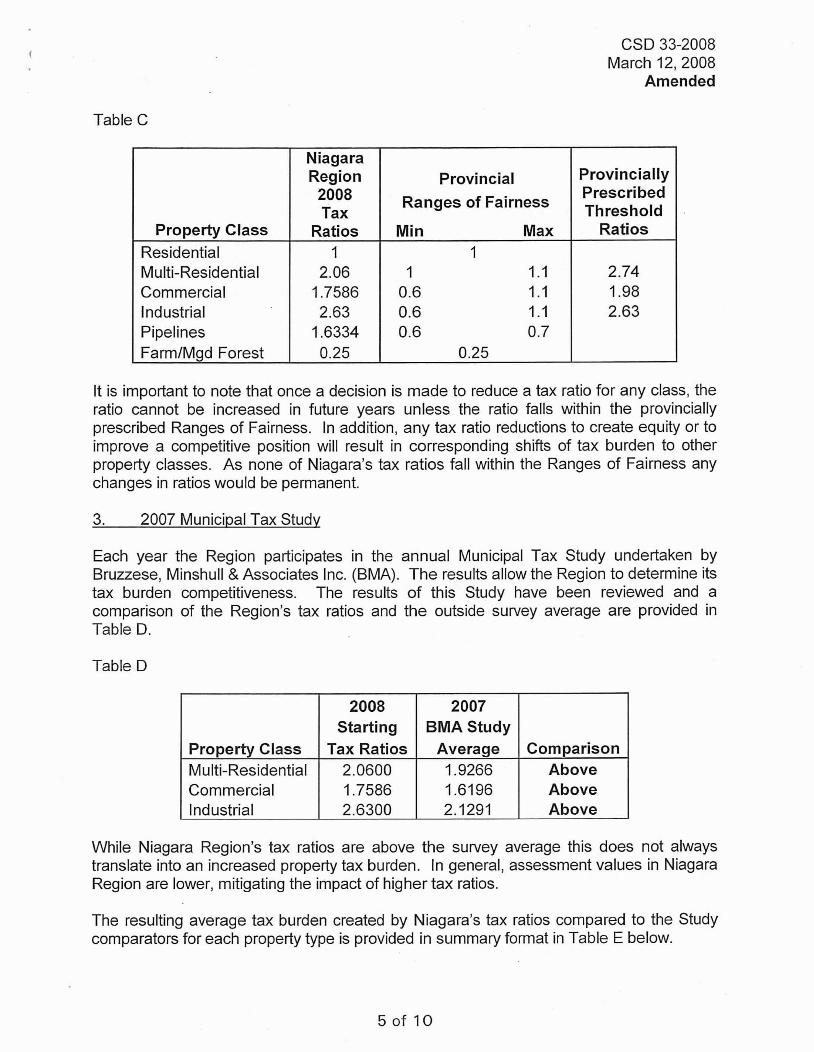
As indicated in Table C, while Niagara Region's tax ratios are above the provincially defined Ranges of Fairness they are at or below the provincial threshold ratios. The threshold ratios were set by the Province to further mitigate tax increases in the business classes of property. Municipalities are prohibited from levying municipal tax increases on multi-residential, commercial, and industrial property classes if their respective tax ratios exceed the Provincial threshold.
CSD 33-2008 March 12,2008
Amended
Table C
It is important to note that once a decision is made to reduce a tax ratio for any class, the ratio cannot be increased in future years unless the ratio falls within the provincially prescribed Ranges of Fairness. In addition, any tax ratio reductions to create equity or to improve a competitive position will result in corresponding shifts of tax burden to other property classes. As none of Niagara's tax ratios fall within the Ranges of Fairness any changes in ratios would be permanent.
3. 2007 Municipal Tax Studv
Provincially Prescribed Threshold
Ratios
2.74 1.98 2.63
Property Class Residential Multi-Residential Commercial Industrial Pipelines FarmIMgd Forest
Each year the Region participates in the annual Municipal Tax Study undertaken by Bruzzese, Minshull & Associates Inc. (BMA). The results allow the Region to determine its tax burden competitiveness. The results of this Study have been reviewed and a comparison of the Region's tax ratios and the outside survey average are provided in Table D.
Table D
Niagara Region 2008 Tax
Ratios 1
2.06 1.7586 2.63
1.6334 0.25
Provincial Ranges of Fairness
Min Max 1
1 I .I 0.6 I .I 0.6 1.1 0.6 0.7
0.25
While Niagara Region's tax ratios are above the survey average this does not always translate into an increased property tax burden. In general, assessment values in Niagara Region are lower, mitigating the impact of higher tax ratios.
The resulting average tax burden created by Niagara's tax ratios compared to the Study comparators for each property type is provided in summary format in Table E below.
5 o f 10
Comparison Above Above Above
2007 BMA Study
Average 1.9266 1.6196 2.1291
Property Class Multi-Residential Commercial Industrial
2008 Starting
Tax Ratios 2.0600 1.7586 2.6300

CSD 33-2008 March 12,2008
Amended
Table E
Note: Education impact is excluded.
2007 Municipal Tax Study
4. Propertv Class Discussion
Property Class Residential
Multi-Res
Commercial
industrial
Multi-residential Class
Niagara Region's multi-residential tax ratio is currently 2.0600, somewhat above the Study average of 1.9266. As can be seen in Table E, the results of the Study indicate that the tax burden for the multi-residential class remains in a competitive position. Since 1998 the multi-residential tax ratio has been reduced from 2.5568 to 2.0600.
Property Type Bungalow Condo Executive Walk-up MidlHig h-rise Office Buildings Neighbourhood Shopping Hotels Motels Industrial Vacant Land Residual Industrial Large Industrial
Commercial Class
The Study indicated that Niagara's commercial tax burden is competitive in the Ofice Building and Motels property types. The remaining property types, Hotels and to a lesser degree Neighbourhood Shopping, are above average. The tax burden for hotels is high in Niagara due to high assessments experienced in the tourism sector. Niagara's commercial tax ratio at 1.7586 is above the survey average of 1.61 96.
lndustrial Class
Comparison per1
Unit Unit
Sq. Foot Sq. Foot
Unit Unit Acre
Sq. Foot Sq. Foot
Due to the Region's tax mitigation plan and the Province's mandated hard cap the industrial tax ratio has decreased significantly since 1998.
Outside Niagara $2,740 $1,852 $5,027 $1,320 $1,483 $1.56 $1.77 $1,036 $731
$1,516 $1.00 $0.73
Average Niagara $2,812 $1,947 $5,154 $1,269 $1,375
$1.30 $1.82 $1.318 $725
$1,250 $0.98 $0.64
Regardless, the Study indicates that the Region's industrial tax ratio at 2.63 remains considerable higher than the Study average of 2.1291. However, Niagara's industrial tax burden impact is lower than the Study average (Table E). Over the years industrial
Comparison of Niagara vs
Outside Above 2.63% Above 5.13% Above 2.53% Below -3.86% Below -7.28% Below -16.67% Above 2.82% Above 27.22% Below -0.82% Below -17.55% Below -2.00% Below -12.33%

CSD 33-2008 March 12,2008
Amended
assessments across Niagara Region have declined due to Assessment Review Board (ARB) decisions and MPAC's devaluation of properties caused by age and obsolescence.
Residential Class
The residential class has been absorbing multi-residential and industrial tax ratio reductions since 1999. These impacts have been the result of Niagara's tax mitigation plans and the Province's mandatory tax levy restriction.
The Study results indicate that Niagara's residential burden is now above average in each property type and given Niagara's below average level of household income taxpayers will find it more difficult to absorb further tax rate increases. According to the Study, Niagara's households spend on average 3.2% of their income for property tax which is similar to the average for taxpayers in other jurisdictions.
Future Studies will be carefully reviewed and analyzed in order to monitor the competitive position of each of Niagara's property classes.
5. 2008 Property Tax Levy
The total net tax levy, as adopted by Regional Council for the 2008 budget year, to be raised by all classes for regional purposes amounts to $273,498,068. Each property class's share of this increase is provided in the following Table.
Table F
While the residential class experienced tax growth of $2.5 million this amount has been offset by its allotment of the 2008 Regional levy increase. The Regional levy was approved at an increase of $3.5 million or 1.34% over 2007. The residential class's share of this increase is $2.5 million.
The net shift onto the residential class is approximately $69 thousand leaving no opportunity for the class to absorb further tax ratio reductions without requiring a tax rate increase.
Property Class Residential Multi-Residential Commercial Industrial Pipelines FarmlandslMgd Forests Total
Assessment Growth
(b) $2,466,672
($1 2,079) $978,864 $22,378
($80,234) $14,438
$3,390,038
Impact after Assessment
Growth (a) - (b)
$69,389 ($6,698) $65,922 $2,135
$427 $1,043
$132,218
Levy by Property Class
2007 $190,022,577 $1 3,390,375 $52,080,329 $1 1,024,873 $1,980,692 $1,476,965
$269,975,811
2008 $192,558,637 $13,371,598 $53,125,115 $1 1,049,387 $1,900,885 $1,492,446
$273,498,068
Levy Impact
(a) $2,536,061
($1 8,777) $1,044,786
$24,513 ($79,807)
$15,481 $3,522,257

CSD 33-2008 March 12,2008
Amended
B) Recommended Tax Ratios
The recommended tax ratios for the 2008 tax year are the same as those contained in Niagara Region's 2007 tax ratio by-law. Impacts by class on a property assessed at $1 90,000 and $31 5,000 are provided in Tables H and I respectively.
Table H
Residential Multi-res Commercial Industrial 2007 Regional Property Tax $1,313.21 $2,705.22 $2,309.42 $3,453.75
Assessment Growth ($16.62) ($34.24) ($29.23) ($43.72) 2008 Levy Increase $1 6.92 $34.85 $29.75 $44.49 Impact $0.29 $0.60 $0.52 $0.77
2008 Regional Property Tax $1,313.51 $2,705.83 $2,309.93 $3,454.53
Table I
Residential Multi-res Commercial Industrial 2007 Regional Property Tax $2,177.1 7 $4,484.97 $3,828.77 $5,725.96
Assessment Growth ($27.56) ($56.77) ($48.47) ($72.48) 2008 Levy Increase $28.05 $57.77 $49.32 $73.76 Impact $0.49 $1 .OO $0.85 $1.28
2008 Regional Property Tax
As can be seen, the 2008 levy increase at 1.34% slightly more than offsets the assessment growth increase of 1.3%. The associated tax ratios and tax rates are provided in Schedule 1.
C ) cap pin^ Options
Optional capping parameters were introduced in the 2005 taxation year. The Region is not required to implement any of the capping options, however if a by-law is not passed by April 30, 2008, the capping parameters will be limited to 5% of the previous year's annualized tax.

CSD 33-2008 March 12,2008 mended
For each capped class, the Region has the option of continuing with the annual 5%- capping program or adopting any of the following options independently or in combination, and the ability to apply them differently by class.
1. Current annual cap may be established from 5% to 10% of the previous year's annualized taxes.
2. An annual cap increase of 0% to 5% of previous year's annualized CVA-level taxes.
3. Move capped and claw-backed properties directly to their full CVA taxes if they are within $250 (or a lower specified amount).
4. Establish a threshold for properties which become eligible for New ConstructioniNew to Class treatment at 100%.
These options were adopted at the maximum levels for the 2005, 2006 and 2007 taxation years and are being recommended for 2008.
Submitted by: Approved by:
/
~ b m & e r ~ s m a / Commissioner of Corporate Services
Attachments
This reporf was prepared by Debbie Williams Senior Financiai Analyst.
CSD 33-2008 March 12,2008
Amended
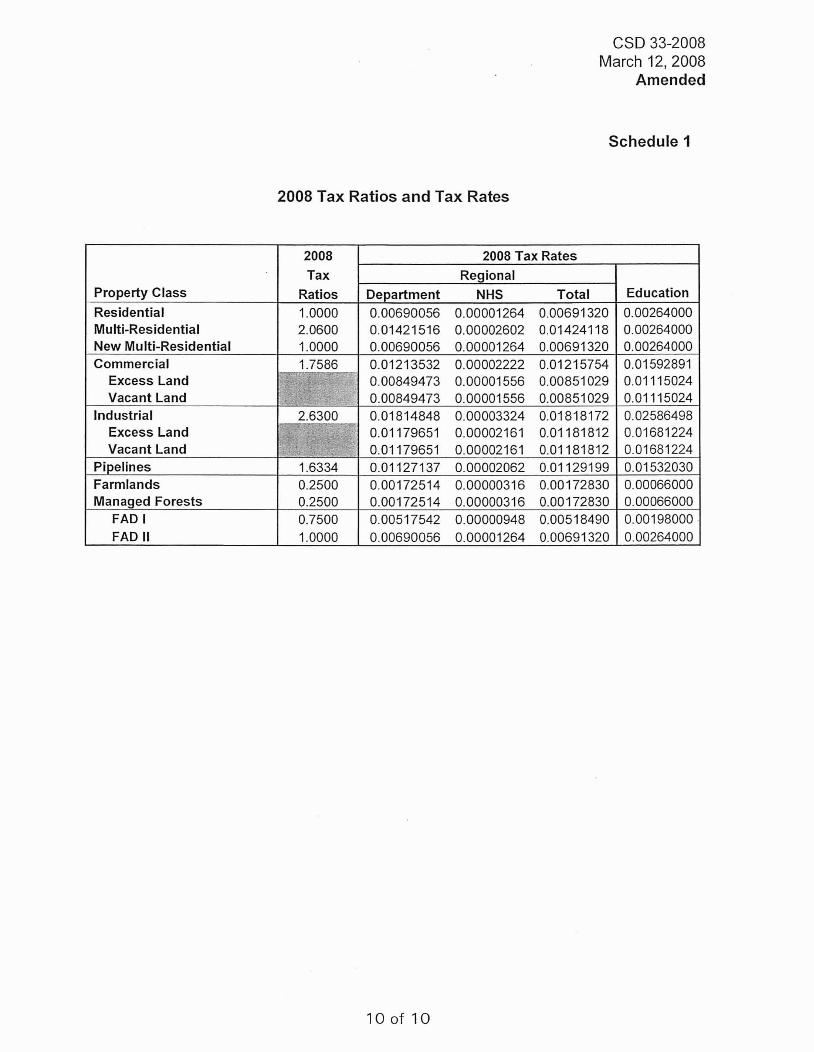
Schedule 1
2008 Tax Ratios and Tax Rates
Property Class Residential Multi-Residential New Multi-Residential Commercial
Excess Land Vacant Land
Industrial ExcessLand Vacant Land
Pipelines Farmlands Managed Forests
FAD l FAD II
2008 Tax
Ratios 1 .OOOO 2.0600 1 .OOOO 1.7586
FfmFp-'~
2 6300 .-*- " - --
0.2500 0.2500 0.7500 1 .OOOO
2008 Tax Rates Regional
Department NHS Total 0.00690056 0.00001 264 0.00691 320 0 01421 516 0.00002602 0.014241 18 0.00690056 0.00001 264 0.00691 320 0.01213532 0.00002222 0.01 215754 0.00849473 0.00001556 0.00851 029 0.00849473 0.00001 556 0.00851 029 0.01814848 0.00003324 0 01818172 0.01 179651 0.00002161 0.01 181812 0.01 179651 0.00002161 0.01 181812 0.01 1271 37 0.00002062 0.01 1291 99 0.00172514 0.00000316 0.00172830 0.00172514 0.00000316 0.00172830 0.00517542 0.00000948 0.00518490 0.00690056 0.00001264 0.00691 320
Education
0.00264000 0.00264000 0.00264000 0.01 592891 0.01 115024 0.01 115024 0.02586498 0.01681224 0 01681224 0.01 532030 0.00066000 0.00066000 0.00198000 0.00264000

Bill 37
THE REGIONAL MUNICIPALITY OF NIAGARA
BY-LAW NO. 37-2008
I A BY-LAW TO SET TAX RATIOS AND TAX RATE REDUCTIONS FOR PRESCRIBED PROPERTY SUBCLASSES FOR REGIONAL
PURPOSES AND AREA MUNICIPAL PURPOSES FOR THE YEAR 2008
WHEREAS pursuant to Section 308(5) of the Municipal Act, 2001, S.O. 2001, c. 25, as amended, the Regional Municipality of Niagara may establish the tax ratios for The Regional Corporation and the Area Municipalities;
AND WHEREAS the tax ratios determine the relative amount of taxation to be borne by each property class;
AND WHEREAS the property classes have been prescribed by the Minister of Finance pursuant to Section 7 of the Assessment Act, R.S.O. 1990, c. A.31, as amended;
AND WHEREAS pursuant to Section 313(1) of the Municipal Act, the Regional Municipality of Niagara may establish tax reductions for prescribed property subclasses for the Regional Corporation and the Area Municipalities;
AND WHEREAS the property subclasses for which tax rate reductions are to be established are in accordance with Section 8 of the Assessment Act;
AND WHEREAS Section 311(25) of the Municipal Act provides that the tax rate reductions may be lower than would otherwise be permitted to be levied for municipal purposes.
THEREFORE the Council of The Regional Municipality of Niagara enacts as follows:
That the tax ratio for property in:
a) the residential property class is 1.0000; b) the multi-residential property class is 2.0600; c) the new multi-residential property class is 1.0000; d) the commercial property class is 1.7586; e) the industrial property class is 2.6300; 9 the pipelines property class is 1.6334; g) the farmlands property class is 0.2500; h) the managed forests property class is 0.2500. .
Page I' of 2 . . . .

Bill 37
2. That the tax reduction for:
a) the vacant land and excess land subclasses in the commercial property class is 30%;
b) the vacant land and excess land subclasses in the industrial property class is 35%;
c) the first class of farmland awaiting development in the residential, multi- residential, commercial or industrial property classes is 25%;
d) the second class of farmland awaiting development in the residential, multi-residential, commercial or industrial property classes is 0%.
3. That for the purposes of this by-law:
a) the industrial property class includes all properties classified as industrial, and large industrial, as per Ontario Regulation 282198;
b) the first class of farmland awaiting development and the second class of farmland awaiting development consist of land as defined in accordance with Ontario Regulation 282198.
4. That this by-law shall come into force on the day upon which it is passed.
THE REGIONAL MUNICIPALITY OF NIAGARA
(pamela Gilroy, Regional CI@
Passed: April 10,2008
Page 2 of 2

Bill 38 <
THE REGIONAL MUNICIPALITY OF NIAGARA
BY-LAW NO. 38-2008
A BY-LAW TO SET AND LEVY THE RATES OF TAXATION FOR REGIONAL GENERAL AND SPECIAL PURPOSES
FOR THE YEAR 2008
WHEREAS the Regional Council of The Regional Municipality of Niagara (hereinafter referred to as "The Regional Corporation") has prepared and adopted a budget including estimates of all sums it requires during the year 2008 for the purposes of the Regional Corporation pursuant to Section 289(1) of the Municipal Act, 2001, S.O. 2001, c. 25, as amended (hereinafter referred to as the "Municipal Act");
AND WHEREAS ~ e ~ i o n a l Council by By-Law 09-2008, adopted' the 2008 Current Budget;
AND WHEREAS for the purposes of raising the general levy for the Regional Corporation, the Regional Corporation shall pass a by-law directing each Lower-Tier Municipali~ to levy a separate tax rate, as specified in the by-law, on the assessment in each property class in the Lower-Tier Municipality rateable for the purposes of the
" Regional Corporation, pursuant to Section 31 1 (2) of the Municipal Act;
AND WHEREAS the tax ratios and the tax rate reductions for prescribed property classes for the 2008 taxation year have been set out in By-law 37-2008 of the Regional Corporation dated the 1 oth of April, 2008;
AND WHEREAS, the Regional Corporation is responsible for providing Waste Management services pursuant to By-laws 8280-96, 8281-96, 8282-96 and 8283-96;
AND WHEREAS, Regional Council is desirous of imposing a special levy for Waste Management purposes and the sums required by taxation in the year 2008 for the said purposes are to be levied by separate rates by the applicable Area Municipalities as directed by Regional by-law pursuant to Subsection 31 1 (4) of the Municipal Ad, 2001; ,
AND WHEREAS it is necessary for the Regional Corporation, pursuant to Section 257.12.1(3) of the Education Act, R.S.0.1990, C.E. 2, to levy tax rates required to raise the sums requisitioned by the Province against each Lower-Tier Municipality for the year 2008;
AND WHEREAS Regional Council established tax rates for property classes, and other decisions consistent with setting and levying rates of taxation for regional purposes for 2008,
Page 1 of 12

Bill 38
THEREFORE THE COUNCIL OF THE REGIONAL MUNICIPALITY OF NIAGARA ENACTS AS FOLLOWS
1. That for the year 2008 in The Regional Municipality of Niagara the lower-tier municipalities shall levy upon the property tax classes set out below the property tax rates appl.icable thereto
As set out in detail in Schedule "A" to this By-law.
2. That for the year 2008 in The Regional Municipality of Niagara, the Town of Niagara-on-the-Lake be required to pay $1,094,633 to the Regional Corporation the charges for Waste Management p~irposes set out in Schedule "C". The remaining area municipalities shall levy upon the property tax classes and applicable subclasses the tax rates for Waste Management purposes set out in Schedule "C" attached to this by-law.
Page 2 of 12

I Bill 38
3. That the Regional Corporation, as required by the Province of Ontario, establish the following education tax rates:
Vacant Land Commercial 0.01 592891 0.01 1 15024
0.02586498 0.01681224
4. That the Regional Corporation, as required by the Province of Ontario, establish the following education tax rates for the remaining property classes:
5. That the Regional Council directs that the.Council of each lower-tier municipality levy for Region31 purposes, general Regional tax rates, and the education tax rates as specified herein, and set out in detail on Schedule "A", attached to this by-law.
Property Class Residential Multi-Residential New Multi-residential Pipelines Farmlands Managed Forests Farmland Awaiting Development I Farmland Awaiting Development II
6. That the Regional Council 'direct that the property tax levy for school board purposes as levied against each lower-tier municipality be paid in accordance with the provisions of The Education Act and the Regulations passed thereunder.
. 0.00264000 0.00264000 0.00264000 0.01532030 0.00066000 0.00066000 0.001 98000 0.00264000
7. That payment of all amounts directed to be levied pursuant to the provisions of this by-law and due to the Regional Municipality of Niagara shall be due and payable in the amounts and at the times shown on Schedule " B attached to this by-law.
Page 3 of 12

Bill 38
8. If a lower-tier municipality fails to make any payment or portion thereof as provided in this by-law, the lower-tier municipality shall pay to the Regional Corporation interest due on the amount in default at the rate of fifteen (15) per cent per annum from the due date of the payment until the payment is made.
9. That this by-law shall come into force and take effect on the date upon which it is passed.
THE REGIONAL MUNICIPALITY OF NIAGARA
Passed: April 10.2008
CERJrlFlED A TRUE COPY
Page 4 of 12

I . . . , . .

Bill 38
Schedule B
The Regional-Municipality of Niagara 2008 Levy Dates
and Amounts
Page 6 of 12
Municipality Niagara Falls Port Colborne 'St. Catharines Thorold Welland Fort Erie Grimsby Lincoln Niagara-on-the-Lake Pelham Wainfleet West Lincoln Totals
I N T E R I M Payment Due
March 17,2008 $14,678,486.00 $2,502,776.00
$19,562,118.25 $2,725,498.75 $5,778,845.00 $4,876,709.75 $4,031,406.75 $3,511,780.00 $4,482,887.00 $2,658,973.25 $1,000,776.25 $1,683,695.75
$67,493,952.75
2008 Approved
Levy $60,062,363.00 $1 0,076,562.00 $78,578,585.00 $1 0,892,037.00 $23,365,598.00 $1 9,684,168.00 $1 6,540,251 .OO $14,236,652.00 $1 8,210,288.00 $1 0,803,674.00 $4,062,131 .OO $6,985,759.00
$273,498,068.00
Payment Due May 20,2008 $14,678,486.00
$2,502,775.00 $19,562,118.25 $2,725,498.75 $5,778,846.00 $4,876,709.75 $4,031,405.75 $3,511,780.00 $4,482,887.00 $2,658,974.25 $1,000,775.25 $1,683,696.75
$67,493,952.75
F I N A L Payment Due
August 11,2008 $1 5,352,695.50 $2,535,505.50
$19,727,174.25 $2,720,519.75 $5,903,953.50 $4,965,374.25 $4,238,719.25 $3,606,546.00 $4,622,257.00 $2,742,863.25 $1,030,289.75 $1,809,183.25
$69,255,081.25
Payment Due October 20,2008
$1 5,352,695.50 $2,535,505.50
$1 9,727,174.25 $2,720,519.75 $5,903,953.50 $4,965,374.25 $4,238,719.25 $3,606,546.00 $4,622,257.00 $2,742,863.25 $1,030,289.75 $1,809,183.25
$69,255,081.25

Bill 38
Schedule C
Calculation of the 2008 Waste Manageinent Tax Rates & Levy
Area Municipality - Niagara Falls
Residential & Farm MultPResidential New Multi-residential Commercial
Excess land Vacant land
lndustrial Excess land Vacant land
Pipelines Farmlands Managed Forests
Farmland I Farmland I1
Totals
Assessment $4,766,671,087
$207,012,065 $929,000
$1,769,912,634 $14,822,479 $73,174,590 $74,497,046 $3,654,221
$1 0,399,470 $28,699,000 $24,748,668
$471,800 $0 $0
$6,974,992,060
Area Municipality - Port Colborne
Residential & Farm Multi-Residential New Multi-residential Commercial
~xcess land Vacant land
Industrial Excess land Vacant land
Pipelines Farmlands .
Managed Forests Farmland I Farmland II -
Totals
Assessment $1,068,434,786
$35,836,330 $0
$79,053,784 $605,675
$1,218,440 $57,593,411 $1,653,328
$862,800 $7,538,000
$20,439,965 $255,100
$1,063,600 $0
$1,274,555,219
Waste Management Tax Rate Levy
0.00070957 $3,382,287 0.001461 72 $302,594 0.00070957 $659 0.00124783 $2,208,550 0.00087349 $12,947 0.00087349 $63,917 0.001 8661 8 $139,025 0.00121300 $4,433 0.00121300 $12,615 0.001 15901 $33,262 0.00017739 $4,390 0.00017739 $84 0.00053217 $0 0.00070957 + $0
$6,164,763
Waste Management Tax Rate Levy
0.00126325 $1,349,700 0.00260230 $93,257 0.001 26325 $0 0.002221 57 $1 75,624 0.001 55509 $942 0.00155509 $1,895 0.00332237 . $191,347 0.0021 5953 $3,570 0.00215953 $1,863 0.00206340 $1 5,554 0.00031 581 $6,455 0.00031581 $81 0.00094744 $1,008 0.001 26325 $0
$1,841,296
. . Page 7 of. 12

. . Bill 38
Schedule C
Calculation of the 2008 Waste Management Tax ~ a t e s & ' ~ e v y
Area Municipality - St. ~atharines
Residential & Farm Multi-Residential New Multi-residential Commercial
Excess land Vacant land
Industrial Excess land Vacant land
Pipelines Farmlands Managed-Forests
Farmland I Farmland II
Totals
Assessment $7,911,168,367
$450,527,635 $2,638,110
$1,141,849,769 $9,202,066
$16,127,835 $157,283,707
$3,777,484 $7,427,540
$22,887,000 $60,529,865
$0 $0 $0
$9,783,419,378
~ r e a Municipality - Thorold
Residential & Farm Multi-Residential New Multi-residential Commercial
Excess land Vacant land
Industrial ~xcess land vacant land
Pipelines Farmlands Managed Forests
Farmland I Farmland II
Totals
Assessment $1,093,569,913
$25,691,675 $0
$1 12,632,169 $2,406,979 $3,320,800
$68,274,982 $2,828,877 $5,054,945
$1 5,487,000 $22,075,085
$263,100 / $0
Waste Management Tax Rate L ~ V Y
0.00084563 $6,689,921 0.00174200 $784,819 0.00084563 $2,231 0.00148713 $1,698,079 0.001 04099 $9,579 0.001 04099 $16,789 0.00222401 $349,801 0.00144561 $5,461 0.00144561 $1 0,737 0.001 381 25 $31,613 0.00021 141 $12,797 0.00021 141 $0 0.00063422 $0 0.00084563 $0
$9,611,827
Waste Management Tax Rate Levy
0.00073227 $800,788 0.001 50847 $38,755 0.00073227 $0 0.001 28775 $145,042 0.00090143 $2,170 0.00090143 $2,993 0.001 92584 $1 31,487 0.00125181 $3,541 0.001251 81 $6,328 0.001 19608 $1 8,524 0.0001 8307 $4,041 0.0001 8307 $48 0.00054920 $0 0.00073227 $0
$1,153,717
Page 8 of 12

Bill -38
Schedule C
Calculation of the 2008 Waste Management Tax Rates & Levy
Area Municipality - Welland
Residential & Farm Multi-Residential New Multi-residential Commercial
Excess land Vacant land
Industrial Excess land Vacant land
Pipelines Farmlands Managed Forests
Farmland I Farmland I1
Totals
Assessment $2,470,294,845
$121,733,755 $0
$249,197,985 $20,700,024 $7,001,700
$60,046,248 $1,266,123 $1,275,700
$1 3,831,000 $6,114,895
$235,600 $0 $0
Area Municipality - Fort Erie
Residential & Farm Multi-Residential New Multi-residential Commercial
Excess land Vacant land
Industrial Excess land Vacant land
Pipelines Farmlands ~anaged' Forests
Farmland I Farmland II
Totals
Assessment $2,211,056,165
$33,709,630 $0
$229,521,857 $5,324,055
$1 5,547,800 $40,761,836 $1,030,157 $2,272,400,
$1 1,956,000 $20,085,305
$412,100 $0 $0 .
$2,571,677,305
Waste Management Tax Rate Levy
0.001 13813 . $2,811,517 0.00234452 : $285,407 0.001 13813 $0 0.00200149 $498,767 0.00140106 $29,002 0.00140106 $9,810 0.00299326 $179,734 0.001 94563 $2,463 0.00194563 $2,482 0.001 85902 $25,712 0.00028453 $1,740 0.00028453 $67 0.00085359 $0 0.001 13813 $0
$3,846,701
Waste Management Tax Rate Levy
0.00081414 $1,800,109 0.00167712 $56,535 0.00081414 $0 0.00143173 $328,613 0.001 00222 $5,336 0.001 00222 $1 5,582 0.002141 18 $87,278 0.00139177 $1,434 0.00139177 $3,163 0.00132981 $1 5,899 0.00020353 $4,088 0.00020353 $84 0.00061060 $0 0.00081414 $0
$2,318,121
Page 9 of 12

Bill 38 1
Schedule C
Calculation of the 2008 Waste Management Tax Rates & Levy
Area Municipality - Grimsby
Residential & Farm Multi-Residential New Multi-residential Commercial
Excess land Vacant land
lndustrial Excess land Vacant land
Pipelines Farmlands Managed Forests
Farmland I Farmland II
Assessment $1,999,031,074
$21,350,000 $0
$140,409,616 $4,387,405 $6,801,830
$24,721,086 $2,019,603 $1,385,200 $5,844,000
$33,728,210 $143,200
$0 $0
Totals $2,239,821,224
Area Municipality - Lincoln 1
Residential & Farm Multi-Residential New Multi-residential Commercial
Excess land Vacant land
lndustrial Excess land Vacant land
Pipelines Farmlands Managed Forests
Farmland I Farmland II
Totals
Assessment $1,597,707,829
$1 2,005,950 $0
$1 16,631,416 $1,898,285 $3,589,200
$55,946,915 - $1,709,540 $1,061,000
$14,276,000 $1 99,241,660
$1 39,300 $0 $0
Waste Management Tax Rate Levy
0.00059300 $1,185,425 0.001 221 58 $26,081 0.00059300 $0 0.001 04285 $146,426 0.00073000 $3,203 0.00073000 $4,965 0.00155959 $38,555 0.00101373 $2,047 0.001 01373 $1,404 0.00096861 $5,661 0.00014825 $5,000 0.00014825 $2 1 0.00044475 $0 0.00059300 $0
$1,418,788
Waste Management Tax Rate Levy
0.00059682 $953,544 0.00122946 $14,761 0.00059682 $0 0.001 04959 $122,415 0.00073470 $1,395 0.00073470 $2,637 0.001 56966 $87,818 0.001 02027 $1,744 0.001 02027 $1,083 0.00097485 $13,917 0.00014922 $29,731 0.00014922 $21 0.00044762 $0 0.00059682 $0
$1,229,066
Page 10 of 12

I Bill 38
Schedule C
Calculation of the 2008 Waste Management Tax Rates & Levy
Area Municipality - ~iagara-on-t'he-~ake
Residential & Farm Multi-Residential New Multi-residential Commercial
Excess land Vacant land
Industrial Excess land Vacant land
Pipelines Farmlands Managed Forests
Farmland I Farmland II
Totals
Assessment $1,966,188,848
$1 1,390,820 $0
$297,095,486 $2,364,560 $1,476,500 $1 5,817,560
$356,584 $4,515,000 $12,336,000 $1 88,486,562
$31 8,700 $0 $0
$2,500,346,620
Area Municipality - Pelham
Residential & Farm Multi-Residential New Multi-residential Commercial
Excess land Vacant land
lndustiial ~xcess land Vacant land
Pipelines arm lands Managed Forests
Farmland I Farmland II -
Totals
Assessment $1,406,757,120
$13,474,750 $0
$49,361,226 $451,849 $1 80,000
$2,450,878 $0
$49,000 $1 1,514,000 $60,883,367
$413,600 $0 $0
$1,545,535,790
Waste Management Tax Rate Levy
nla - $0 nla $0 nla $0 nla $0 nla $0 nla $0 nla $0 nla $0 nla $0 nla $0 nla $0 nla $0 nla $0 nla $0
$1,094,633
Waste Management Tax Rate Levy 0.00063427 $892,264 0.001 30660 $17,606 0.00063427 $0 0.001 11543 $55,059 0.00078080 $353 0.00078080 $141 0.00166814 $4,088 0.001 08429 $0 0.001 08429 $53 0.00103602 $1 1,929 0.0001 5858 $9,655 0.0001 5858 $66 0.00047570 $0 0.00063427 $0
$991,214
Page 11. of 12

Bill 38
Schedule C
~alculation of the 2008 Waste Management Tax Rates & L&!
-Area Municipality - Wainfleet I
Residential & Farm Multi-Residential New Multi-residential Commercial
Excess land Vacant land
Industrial Excess land , Vacant land
Pipelines Farmlands Managed Forests
Farmland I Farmland II -
Totals
Assessment $535,044,652
$260,000 $0
$1 1,896,935 $922,035 $61,000
$2,381,591 $144,759 $20,600
$3,676,000 $68,747,775
$562,725 $0 $0
$623,718,072
Area Municipality - west.Lincoln
Residential & Farm Multi-Residential New Multi-residential Commercial
Excess land Vacant land
Industrial Excess land Vacant land
. Pipelines ~armbnds Managed Forests
Farmland I Farmland I1
Totals
Assessment $827,845,983
$4,214,160 $0
$37,227,501 $493,350 $681,000
$1 3,183,296 $216,068 $498,500
$20,294,800 $1 51,773,822
$272,900 $0 $0
$1,056,701,380
Waste Management Tax Rate Levy
0.00074160 $396,789 0.001 52770 $397 0.00074160 $0 0.001 30418 $15,516 0.00091293 $842 0.00091 293 $56 0.001 95042 $4,645 0.001 26777 $184 0.00126777 $26 0.00121 133 $4,453 0.0001 8540 $12,746 0.00018540 $1 04 0.00055620 $0 0.00074160 $0
$435,758
Waste Management Tax Rate Levy
0.00062528 $517,636 0.00128807 $5,428 0.00062528 $0 0.00109960 $40,935 0.00076973 $380 0.00076973 $524 0.00164448 $21,680 0.001 06891 $231 0.001 06891 $533 0.001 02133 $20,728 0.0001 5630 $23,722 0.00015630 $43 0.00046896 $0 0.00062528 $0
$631,840
Page 12 of 12