Embed Size (px)
Citation preview
AGA Financial ForumMay 2012May 2012
May 2012
About This Presentation
This presentation contains forward-looking statements which management believes to be reasonable as of today’s date only. Actual results may differ significantlyto be reasonable as of today s date only. Actual results may differ significantly because of risks and uncertainties that are difficult to predict and many of which are beyond management’s control. Among them are adverse weather conditions, cost volatility and availability of all energy products, including propane, natural gas,
l t i it d f l il i d t ti th i t felectricity and fuel oil, increased customer conservation measures, the impact of pending and future legal proceedings, domestic and international political, regulatory and economic conditions including currency exchange rate fluctuations (particularly the euro), the timing and development of Marcellus Shale gas production, the timing ), g p g p , gand success of our acquisitions, commercial initiatives, and investments to grow our business and our ability to successfully integrate acquired businesses and achieve anticipated synergies. You should read UGI’s Annual Report on Form 10-K for a more extensive list of factors that could affect results UGI undertakes no obligationmore extensive list of factors that could affect results. UGI undertakes no obligation to release revisions to its forward-looking statements to reflect events or circumstances occurring after today.
May 2012 2
About UGI Corporation
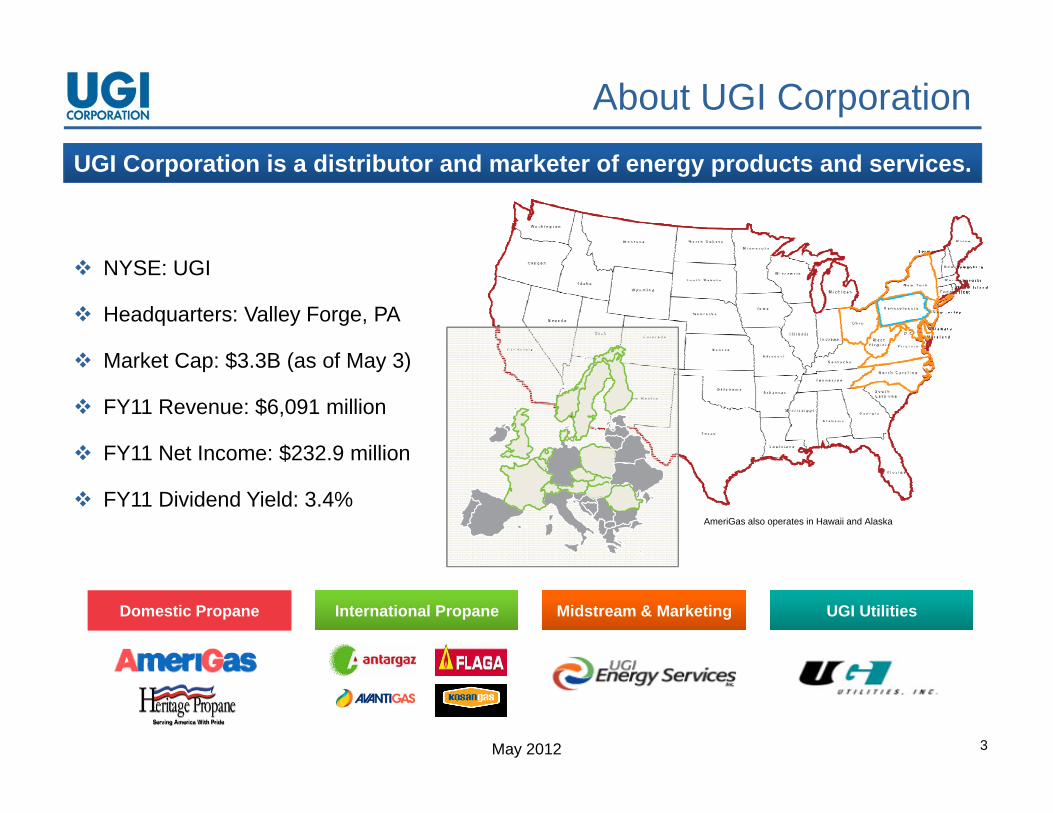
UGI Corporation is a distributor and marketer of energy products and services.
NYSE: UGI
Headquarters: Valley Forge, PA
M k t C $3 3B ( f M 3) Market Cap: $3.3B (as of May 3)
FY11 Revenue: $6,091 million
FY11 Net Income: $232 9 million FY11 Net Income: $232.9 million
FY11 Dividend Yield: 3.4%AmeriGas also operates in Hawaii and Alaska
Domestic PropaneDomestic Propane International PropaneInternational Propane UGI UtilitiesUGI UtilitiesMidstream & MarketingMidstream & Marketing
May 2012 3
Investment Highlights
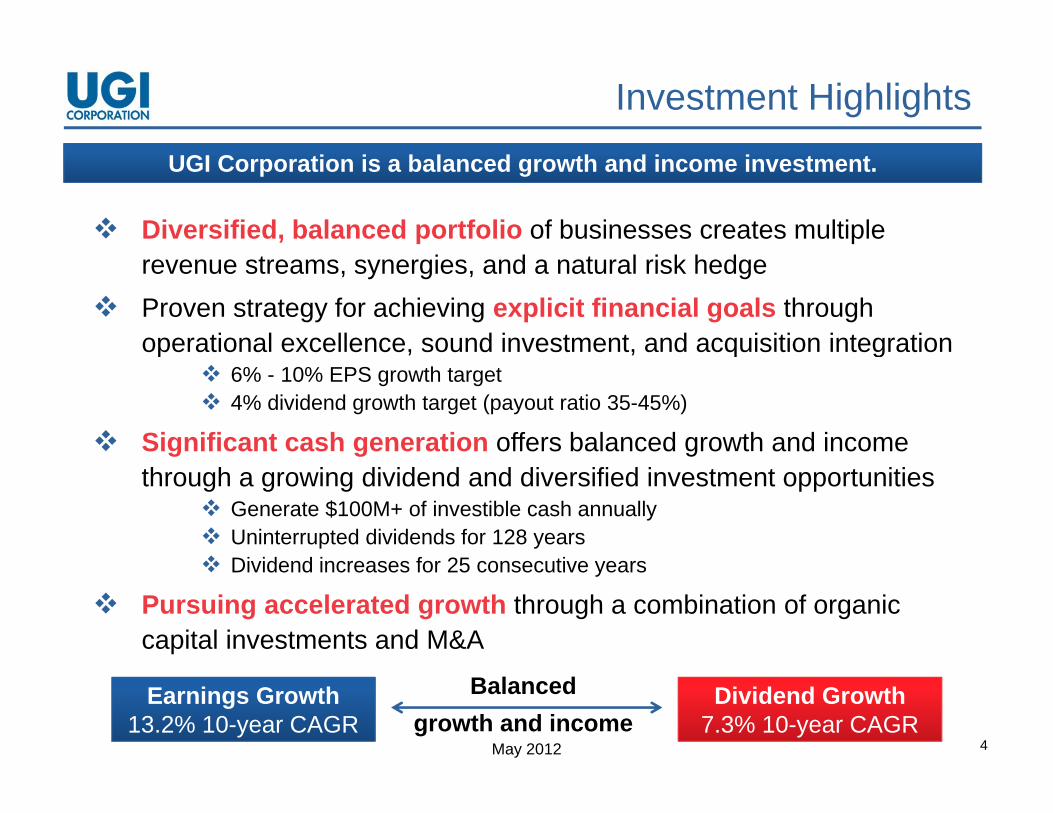
UGI Corporation is a balanced growth and income investment.
Diversified, balanced portfolio of businesses creates multiple revenue streams, synergies, and a natural risk hedge
Proven strategy for achieving explicit financial goals through operational excellence, sound investment, and acquisition integrationp , , q g
6% - 10% EPS growth target 4% dividend growth target (payout ratio 35-45%)
Significant cash generation offers balanced growth and income through a growing dividend and diversified investment opportunities
Generate $100M+ of investible cash annually Uninterrupted dividends for 128 years Di id d i f 25 ti Dividend increases for 25 consecutive years
Pursuing accelerated growth through a combination of organic capital investments and M&A
May 2012 4
Earnings Growth13.2% 10-year CAGR
Dividend Growth7.3% 10-year CAGR
Balanced growth and income

A Balanced Growth and Income Investment
Adjusted EPS1 GrowthDividend Growth
UGI Corporation has an established record of dividend and earnings growth.
$2.20
$2.40
$1.00
$1.10
$1 40
$1.60
$1.80
$2.00
$0.80
$0.90
$0 80
$1.00
$1.20
$1.40
$0.60
$0.70
$0.40
$0.60
$0.80
002
003
004
005
006
007
008
009
010
011
$0.40
$0.50
002
003
004
005
006
007
008
009
010
011
May 2012 5
20 20 20 20 20 20 20 20 20 2020 20 20 20 20 20 20 20 20 20
(1) See reconciliation of Adjusted EPS to GAAP EPS in Appendix
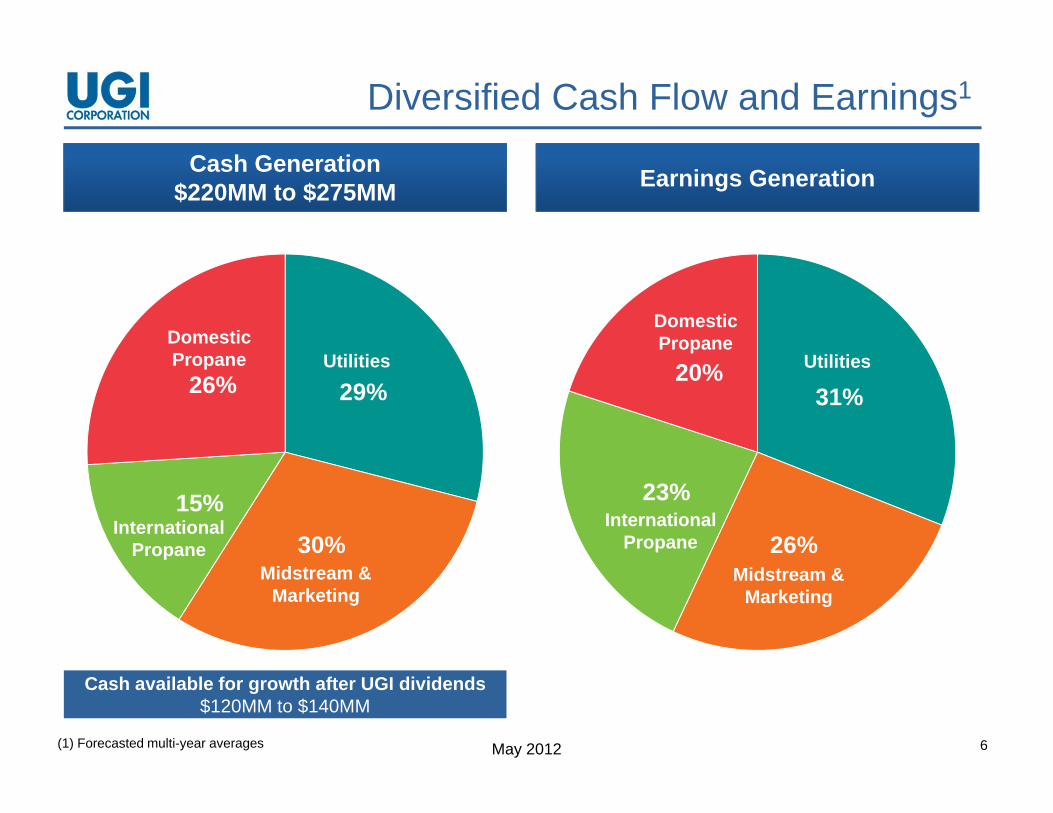
Diversified Cash Flow and Earnings1
Cash Generation$220MM to $275MM Earnings Generation
UtilitiDomestic P Utiliti
Domestic Propane
29%26%UtilitiesPropane
31%20% Utilities
30%
15%International
Propane 26%
23%International
PropaneMidstream &
MarketingMidstream &
Marketing
May 2012 6(1) Forecasted multi-year averages
Cash available for growth after UGI dividends$120MM to $140MM
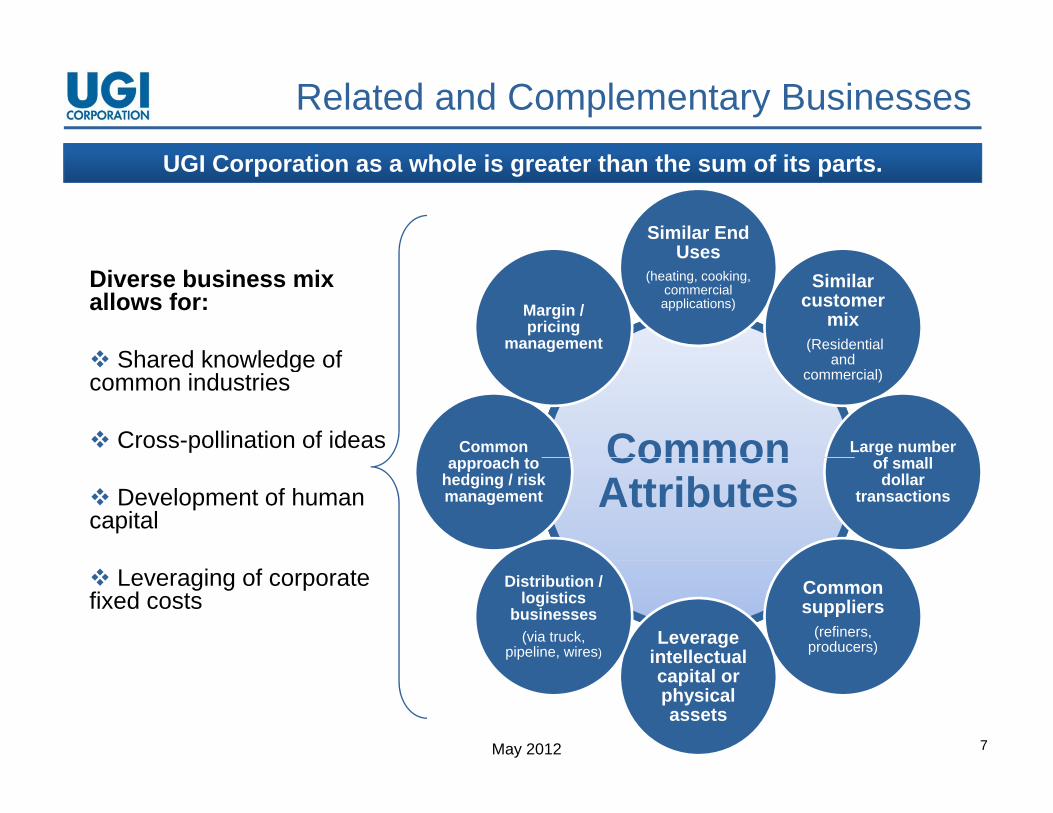
Related and Complementary Businesses
Similar End Uses
UGI Corporation as a whole is greater than the sum of its parts.
Uses(heating, cooking,
commercial applications)
Similar customer
mix(Residential
d
Margin / pricing
management
Diverse business mix allows for:
Shared knowledge of
Common
and commercial)
Large number f ll
Common h t
Shared knowledge of common industries
Cross-pollination of ideas Common Attributes
of small dollar
transactions
approach to hedging / risk management Development of human
capital
Common suppliers
(refiners, producers)Leverage
intellectual
Distribution / logistics
businesses(via truck,
pipeline, wires)
Leveraging of corporate fixed costs
May 2012 7
te ectuacapital or physical assets
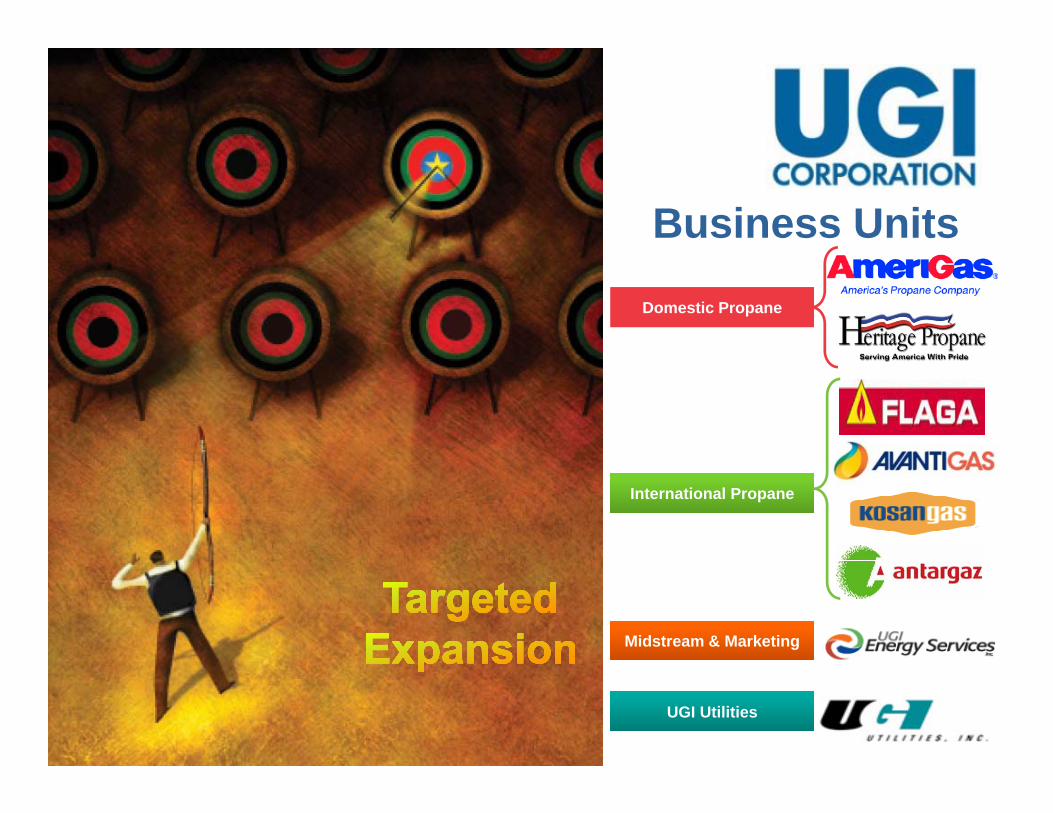
Business Units
Domestic PropaneDomestic Propane
International PropaneInternational Propane
Midstream & MarketingMidstream & Marketing
May 2012
UGI UtilitiesUGI Utilities
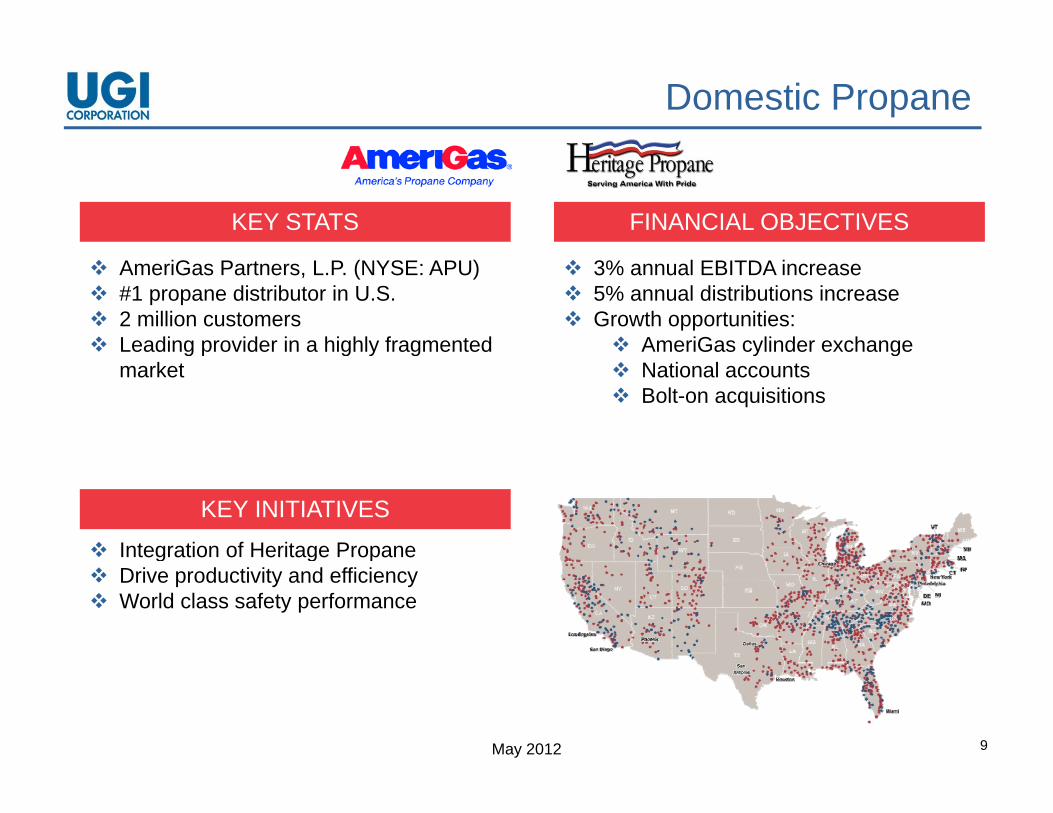
Domestic Propane
KEY STATS FINANCIAL OBJECTIVES
AmeriGas Partners, L.P. (NYSE: APU) #1 propane distributor in U.S. 2 million customers Leading provider in a highly fragmented
3% annual EBITDA increase 5% annual distributions increase Growth opportunities:
AmeriGas cylinder exchangeg p g y gmarket
y g National accounts Bolt-on acquisitions
KEY INITIATIVES
Integration of Heritage Propaneg g p Drive productivity and efficiency World class safety performance
May 2012 9
Domestic Propane: Heritage Acquisition Update
Targeting a minimum of $50 million total synergies by fiscal 20131 Targeting a minimum of $50 million total synergies by fiscal 2013
Creates a stronger, more diversified, propane company
Extends AmeriGas’s geographic coverage
Tangible benefits to shareholders:
AmeriGas increased its distribution by 5% at its board meeting in April, which resulted in an annualized distribution rate of $3 20 per limited unitwhich resulted in an annualized distribution rate of $3.20 per limited unit
This followed the 3% distribution increase after the closing of the Heritage Propane acquisition in January
I t ti h d f h d l d t th Integration progress ahead of schedule due to warm weather
May 2012 10(1) Synergies are net of customer attrition and exclude transition expenses
International Propane
KEY STATS FINANCIAL OBJECTIVES
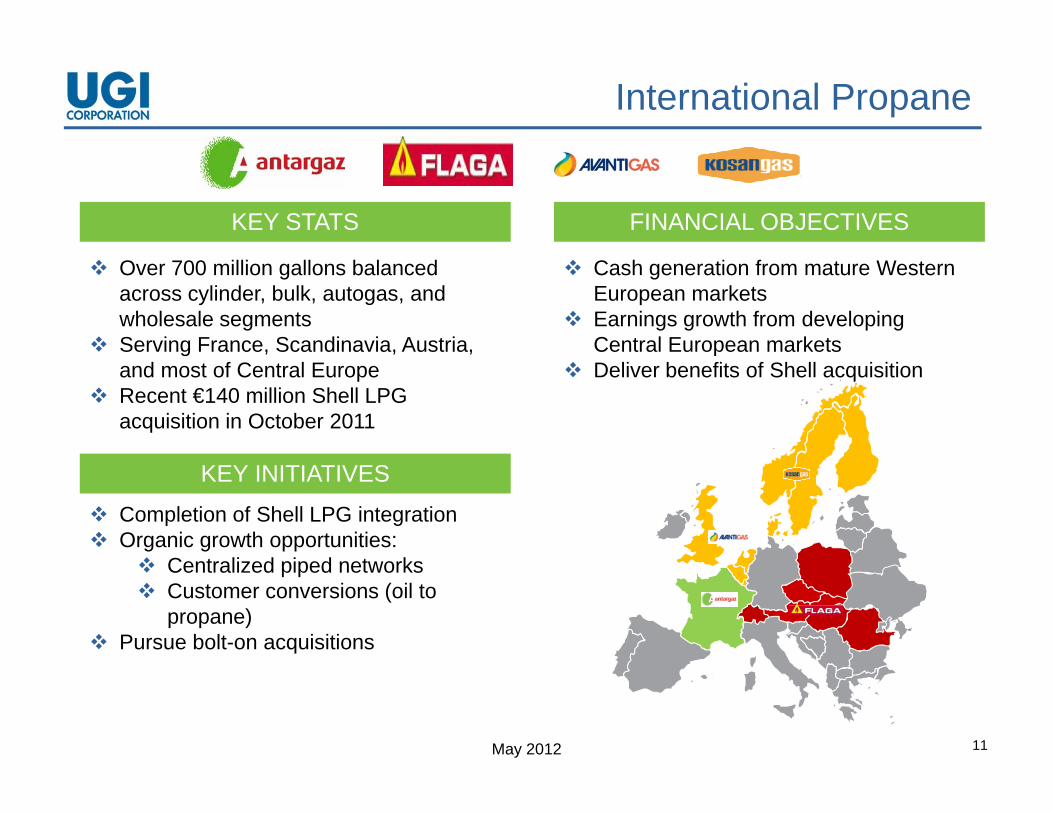
Over 700 million gallons balanced across cylinder, bulk, autogas, and wholesale segments
Serving France, Scandinavia, Austria,
Cash generation from mature Western European markets
Earnings growth from developing Central European marketsg
and most of Central Europe Recent €140 million Shell LPG
acquisition in October 2011
p Deliver benefits of Shell acquisition
KEY INITIATIVES
Completion of Shell LPG integration Organic growth opportunities:
C t li d i d t k Centralized piped networks Customer conversions (oil to
propane) Pursue bolt-on acquisitions
May 2012 11
UGI Utilities
KEY STATS FINANCIAL OBJECTIVES
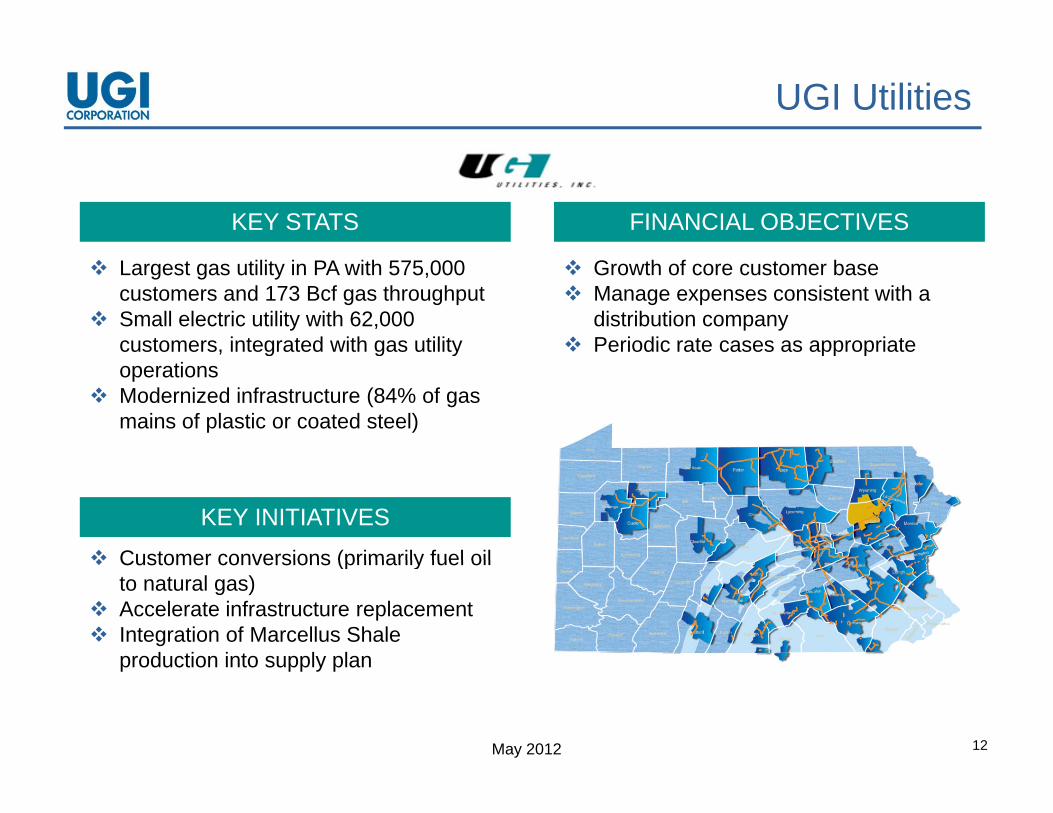
Largest gas utility in PA with 575,000 customers and 173 Bcf gas throughput
Small electric utility with 62,000 customers, integrated with gas utility
Growth of core customer base Manage expenses consistent with a
distribution company Periodic rate cases as appropriateg g y
operations Modernized infrastructure (84% of gas
mains of plastic or coated steel)
pp p
KEY INITIATIVES
Customer conversions (primarily fuel oil Customer conversions (primarily fuel oil to natural gas)
Accelerate infrastructure replacement Integration of Marcellus Shale
production into supply plan
May 2012 12
production into supply plan
UGI Utilities: Customer ConversionsHeating Sources in 4 9M PA Homes1
Gas Conversions/Upgrades
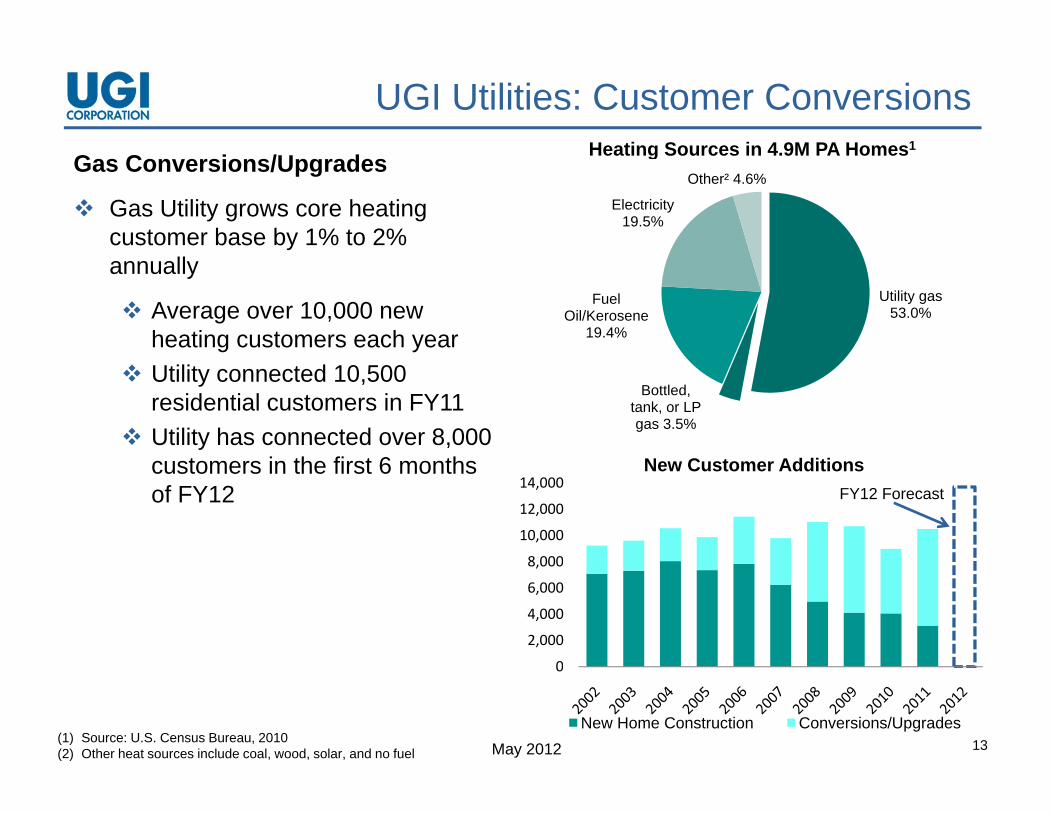
Gas Utility grows core heating customer base by 1% to 2%
Electricity 19.5%
Other² 4.6%
Heating Sources in 4.9M PA Homes
annually
Average over 10,000 new heating customers each year
Utility gas 53.0%
Fuel Oil/Kerosene
19.4%
Utility connected 10,500 residential customers in FY11
Utility has connected over 8,000 t i th fi t 6 th
Bottled, tank, or LP gas 3.5%
N C Addi icustomers in the first 6 months of FY12
8 000
10,000
12,000
14,000New Customer Additions
FY12 Forecast
0
2,000
4,000
6,000
8,000
May 2012 13(1) Source: U.S. Census Bureau, 2010(2) Other heat sources include coal, wood, solar, and no fuel
0
New Home Construction Conversions/Upgrades
Midstream & Marketing
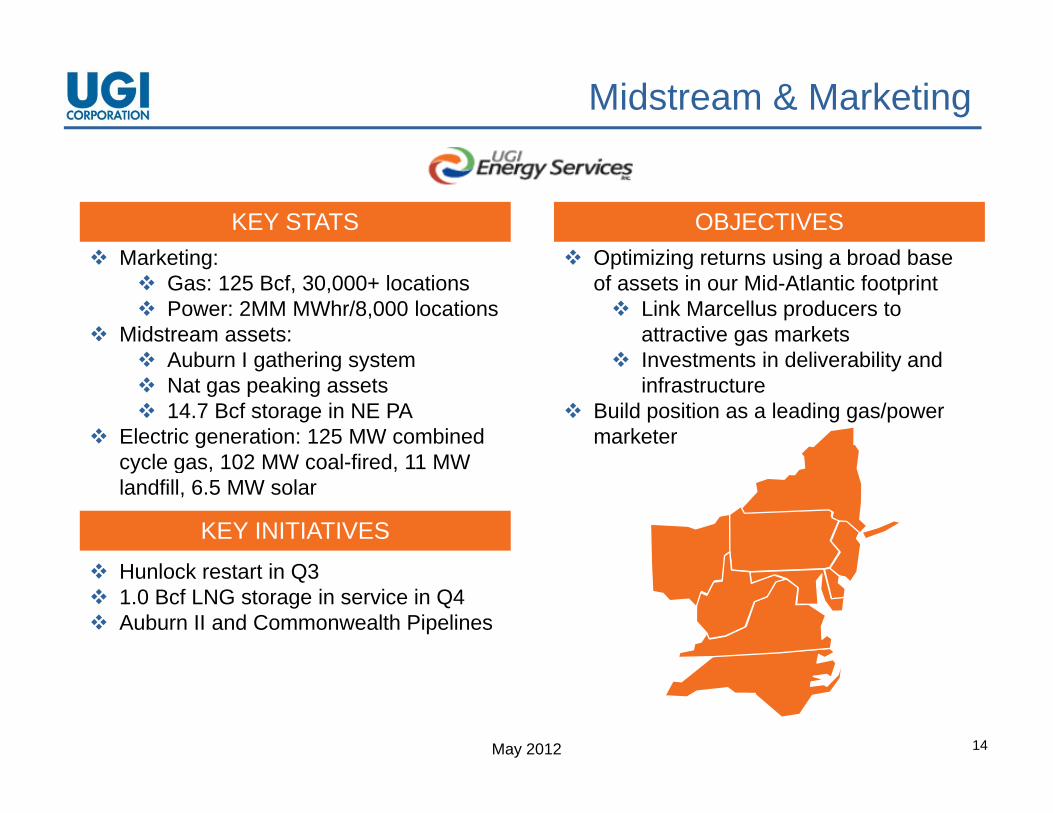
KEY STATS OBJECTIVES M k ti O ti i i t i b d b Marketing:
Gas: 125 Bcf, 30,000+ locations Power: 2MM MWhr/8,000 locations
Midstream assets: A b I th i t
Optimizing returns using a broad base of assets in our Mid-Atlantic footprint Link Marcellus producers to
attractive gas markets I t t i d li bilit d Auburn I gathering system
Nat gas peaking assets 14.7 Bcf storage in NE PA
Electric generation: 125 MW combined c cle gas 102 MW coal fired 11 MW
Investments in deliverability and infrastructure
Build position as a leading gas/power marketer
KEY INITIATIVES
cycle gas, 102 MW coal-fired, 11 MW landfill, 6.5 MW solar
Hunlock restart in Q3 1.0 Bcf LNG storage in service in Q4 Auburn II and Commonwealth Pipelines
May 2012 14
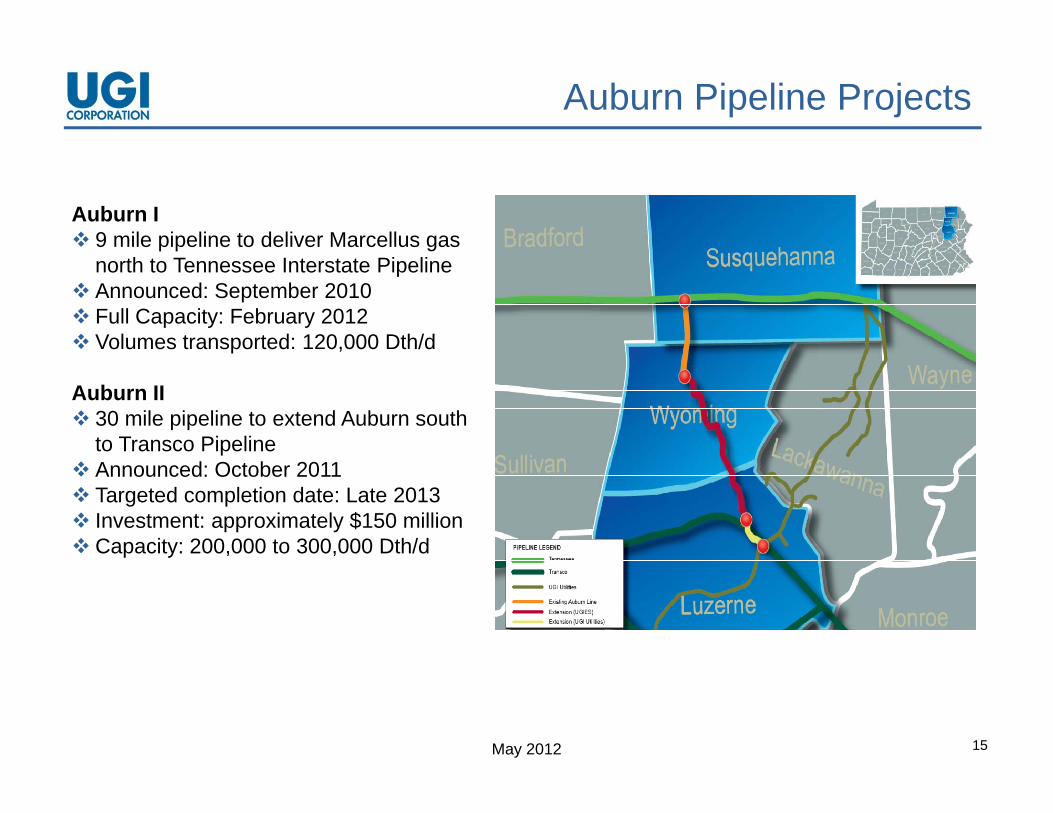
Auburn Pipeline Projects
Auburn I 9 mile pipeline to deliver Marcellus gas
north to Tennessee Interstate Pipeline Announced: September 2010 Full Capacity: February 2012 Volumes transported: 120,000 Dth/d
Auburn II 30 mile pipeline to extend Auburn south
to Transco Pipeline Announced: October 2011 Targeted completion date: Late 2013 Investment: approximately $150 million Capacity: 200,000 to 300,000 Dth/d
May 2012 15
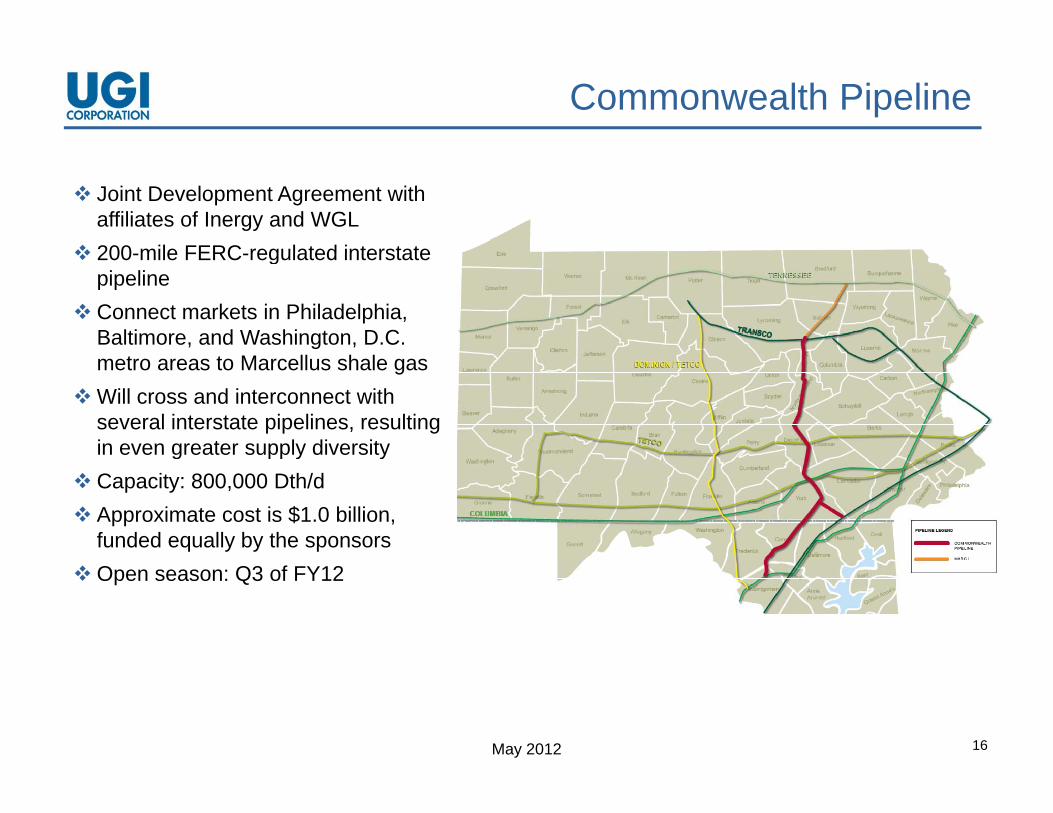
Commonwealth Pipeline
Joint Development Agreement with affiliates of Inergy and WGL
200 mile FERC regulated interstate 200-mile FERC-regulated interstate pipeline
Connect markets in Philadelphia, Baltimore, and Washington, D.C.
t t M ll h lmetro areas to Marcellus shale gasWill cross and interconnect with
several interstate pipelines, resulting in even greater supply diversityg pp y y
Capacity: 800,000 Dth/d Approximate cost is $1.0 billion,
funded equally by the sponsorsOpen season: Q3 of FY12
May 2012 16
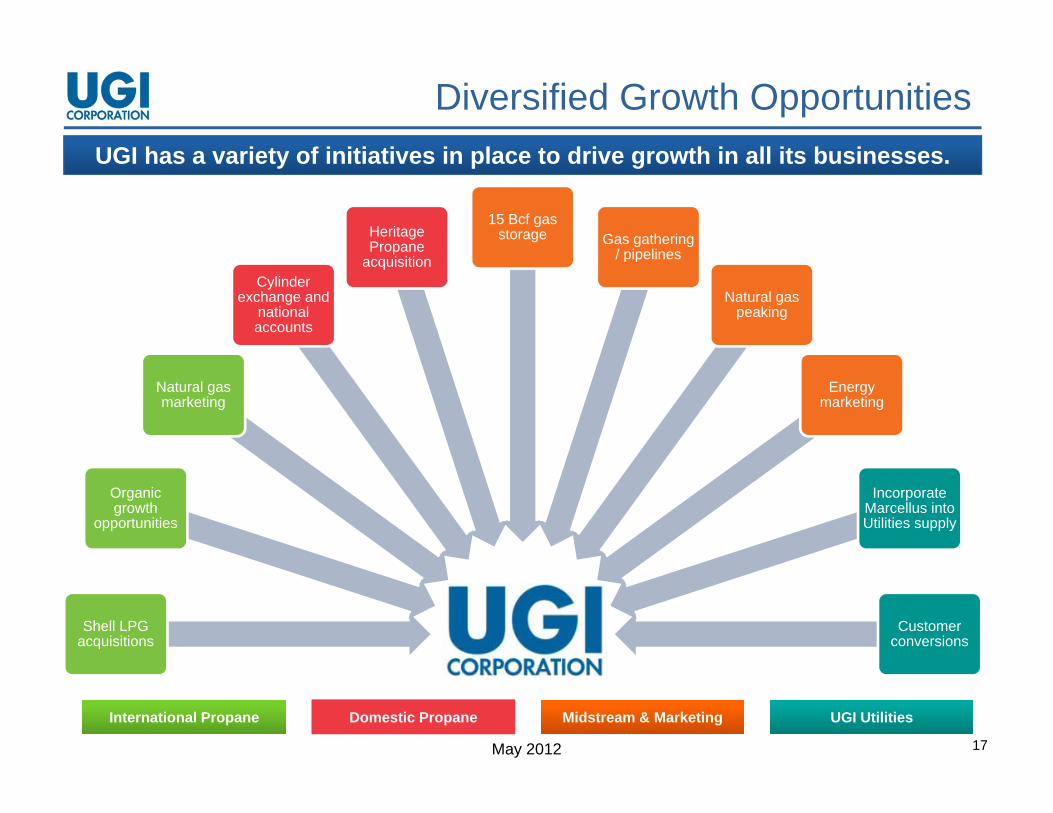
Diversified Growth OpportunitiesUGI h i t f i iti ti i l t d i th i ll it b i
Heritage Propane
15 Bcf gas storage Gas gathering
/ pipelines
UGI has a variety of initiatives in place to drive growth in all its businesses.
Cylinder exchange and
national accounts
pacquisition / pipelines
Natural gas peaking
Natural gas marketing
Energy marketing
Organic growth
opportunities
Incorporate Marcellus into Utilities supply
UGI CorpShell LPG acquisitions
Customer conversions
May 2012 17
Domestic PropaneDomestic PropaneInternational PropaneInternational Propane UGI UtilitiesUGI UtilitiesMidstream & MarketingMidstream & Marketing
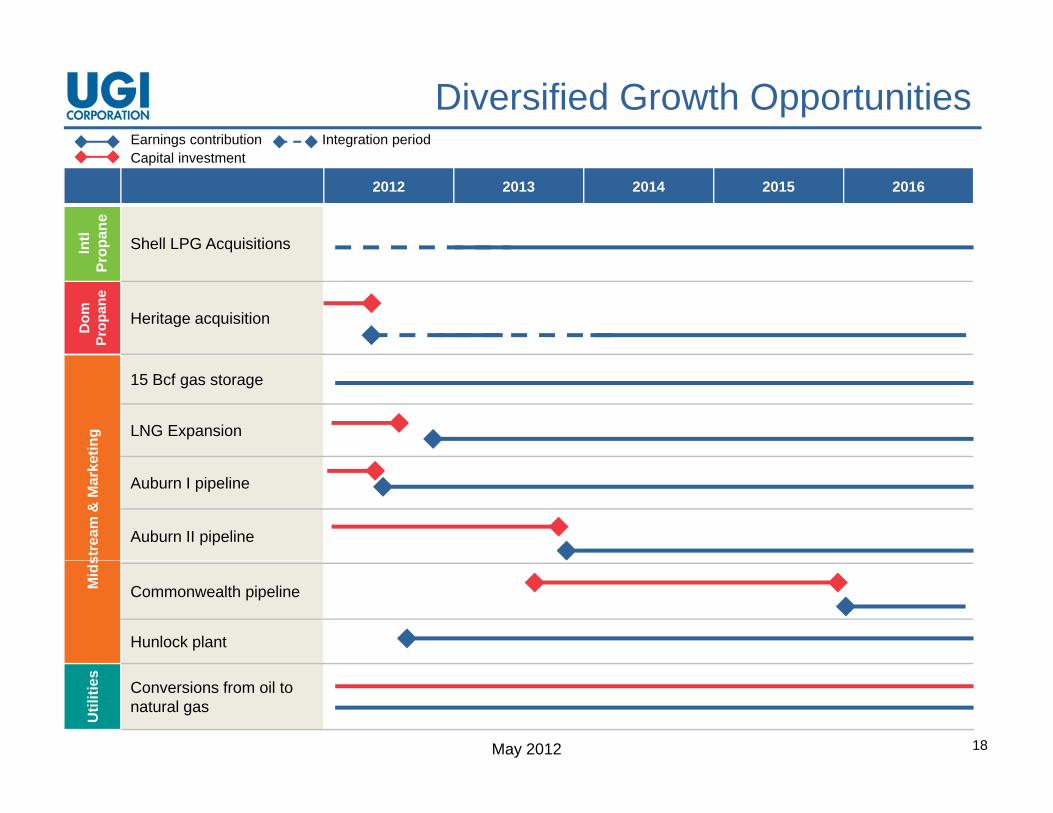
Diversified Growth OpportunitiesEarnings contribution Integration period
2012 2013 2014 2015 2016
Intl
opan
e
Shell LPG Acquisitions
Capital investment
IPr
oD
om
Prop
ane
Heritage acquisition
etin
g
15 Bcf gas storage
LNG Expansion
stre
am &
Mar
ke
Auburn I pipeline
Auburn II pipeline
Mid
s
Commonwealth pipeline
Hunlock plant
May 2012 18
Util
ities Conversions from oil to natural gas
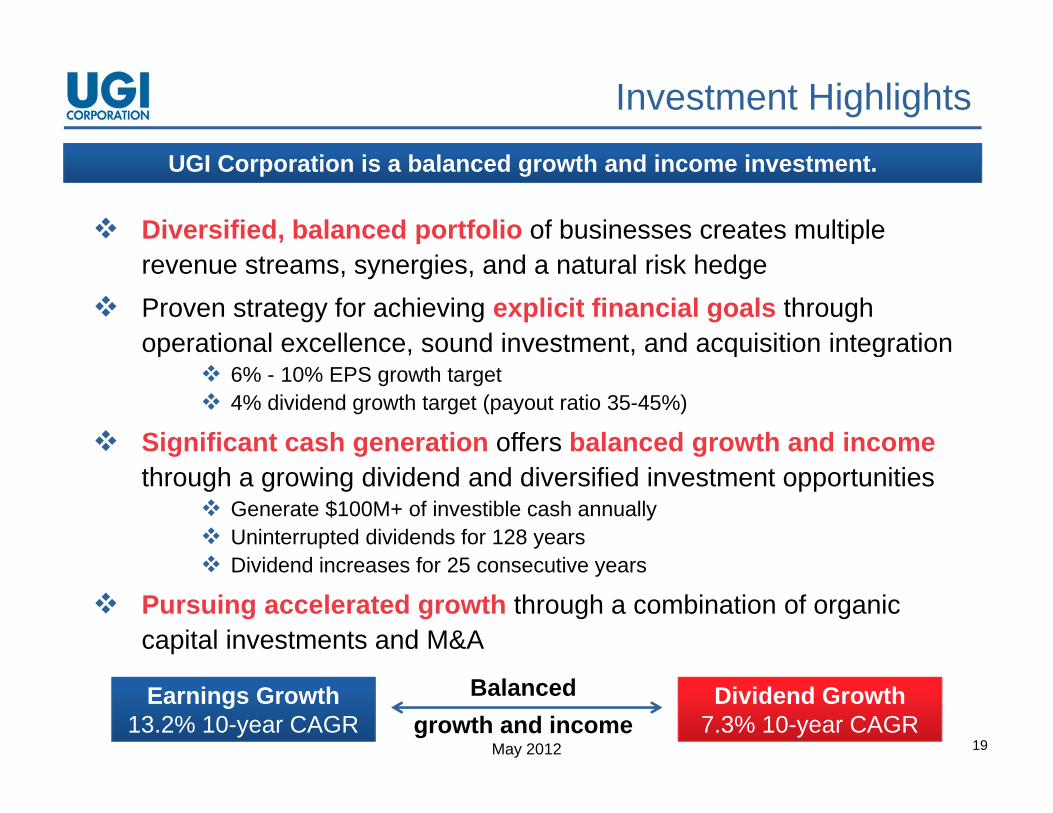
Investment Highlights
UGI Corporation is a balanced growth and income investment.
Diversified, balanced portfolio of businesses creates multiple revenue streams, synergies, and a natural risk hedge
Proven strategy for achieving explicit financial goals through operational excellence, sound investment, and acquisition integrationp , , q g
6% - 10% EPS growth target 4% dividend growth target (payout ratio 35-45%)
Significant cash generation offers balanced growth and incomethrough a growing dividend and diversified investment opportunities
Generate $100M+ of investible cash annually Uninterrupted dividends for 128 years Di id d i f 25 ti Dividend increases for 25 consecutive years
Pursuing accelerated growth through a combination of organic capital investments and M&A
May 2012 19
Earnings Growth13.2% 10-year CAGR
Dividend Growth7.3% 10-year CAGR
Balanced growth and income
Contact
P.O. Box 858Valley Forge, PA 19482Tel: 610-337-1000www ugicorp comwww.ugicorp.com
TreasurerHugh Gallagher (x1029)gallagherh@ugicorp [email protected]
Investor RelationsSimon Bowman (x3645)[email protected]
May 2012
@ g p
Finance AssistantShelly Oates (x3202)[email protected]
Supplemental Data
May 2012
UGI Corporation EPS Reconciliation
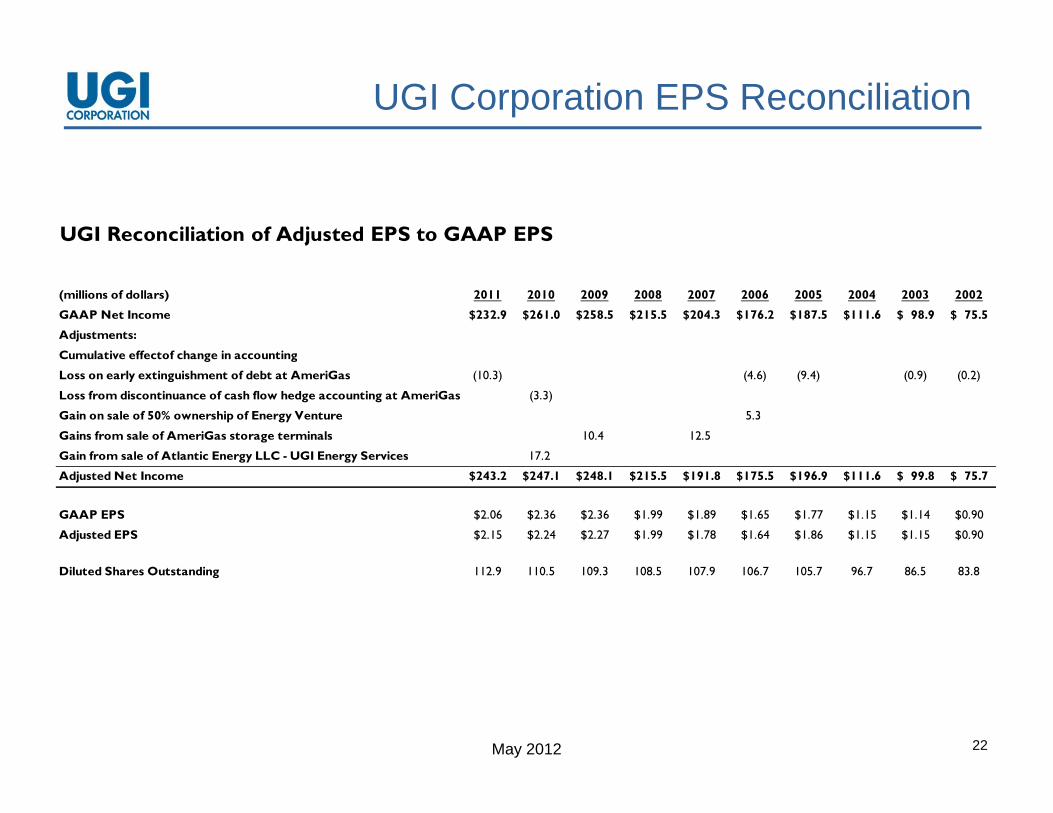
UGI Reconciliation of Adjusted EPS to GAAP EPS
(millions of dollars) 2011 2010 2009 2008 2007 2006 2005 2004 2003 2002
GAAP Net Income 232.9$ 261.0$ 258.5$ 215.5$ 204.3$ 176.2$ 187.5$ 111.6$ 98.9$ 75.5$
Adjustments:
Cumulative effectof change in accountingCumulative effectof change in accounting
Loss on early extinguishment of debt at AmeriGas (10.3) (4.6) (9.4) (0.9) (0.2)
Loss from discontinuance of cash flow hedge accounting at AmeriGas (3.3)
Gain on sale of 50% ownership of Energy Venture 5.3
Gains from sale of AmeriGas storage terminals 10.4 12.5
Gain from sale of Atlantic Energy LLC - UGI Energy Services 17 2Gain from sale of Atlantic Energy LLC UGI Energy Services 17.2
Adjusted Net Income 243.2$ 247.1$ 248.1$ 215.5$ 191.8$ 175.5$ 196.9$ 111.6$ 99.8$ 75.7$
GAAP EPS $2.06 $2.36 $2.36 $1.99 $1.89 $1.65 $1.77 $1.15 $1.14 $0.90
Adjusted EPS $2.15 $2.24 $2.27 $1.99 $1.78 $1.64 $1.86 $1.15 $1.15 $0.90
Diluted Shares Outstanding 112.9 110.5 109.3 108.5 107.9 106.7 105.7 96.7 86.5 83.8
May 2012 22
Common Stock Data
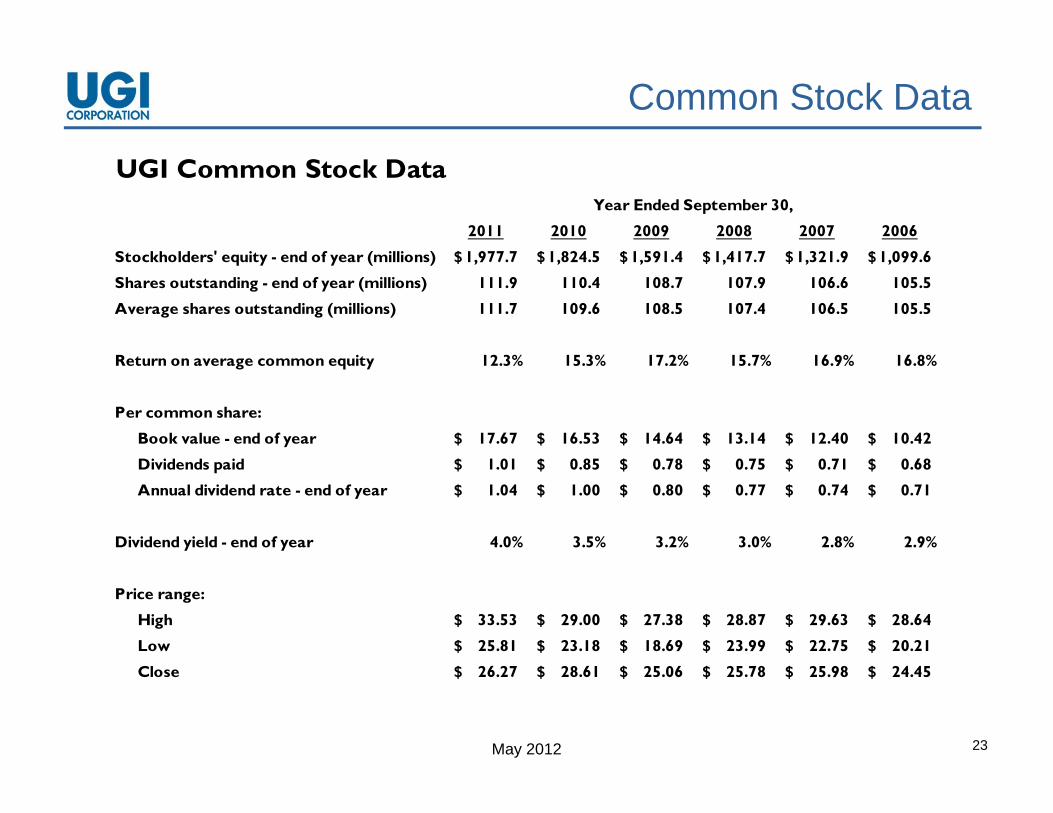
UGI Common Stock Data
2011 2010 2009 2008 2007 2006
St kh ld ' it d f ( illi ) 1 977 7$ 1 824 5$ 1 591 4$ 1 417 7$ 1 321 9$ 1 099 6$
Year Ended September 30,
Stockholders' equity - end of year (millions) 1,977.7$ 1,824.5$ 1,591.4$ 1,417.7$ 1,321.9$ 1,099.6$
Shares outstanding - end of year (millions) 111.9 110.4 108.7 107.9 106.6 105.5
Average shares outstanding (millions) 111.7 109.6 108.5 107.4 106.5 105.5
R i 12 3% 15 3% 17 2% 15 7% 16 9% 16 8%Return on average common equity 12.3% 15.3% 17.2% 15.7% 16.9% 16.8%
Per common share:
Book value - end of year 17.67$ 16.53$ 14.64$ 13.14$ 12.40$ 10.42$
Dividends paid 1.01$ 0.85$ 0.78$ 0.75$ 0.71$ 0.68$
Annual dividend rate - end of year 1.04$ 1.00$ 0.80$ 0.77$ 0.74$ 0.71$
Dividend yield - end of year 4.0% 3.5% 3.2% 3.0% 2.8% 2.9%
Price range:
High 33.53$ 29.00$ 27.38$ 28.87$ 29.63$ 28.64$
Low 25.81$ 23.18$ 18.69$ 23.99$ 22.75$ 20.21$
May 2012 23
Close 26.27$ 28.61$ 25.06$ 25.78$ 25.98$ 24.45$
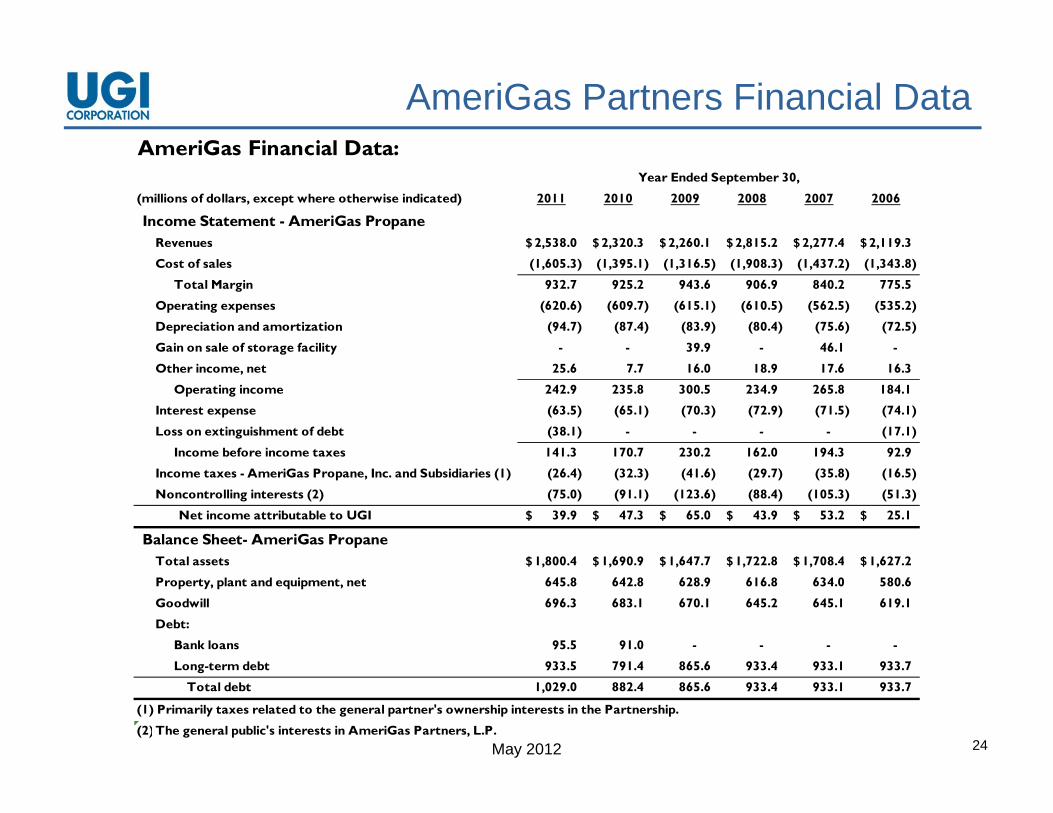
AmeriGas Partners Financial DataAmeriGas Financial Data:AmeriGas Financial Data:
(millions of dollars, except where otherwise indicated) 2011 2010 2009 2008 2007 2006
Income Statement - AmeriGas PropaneRevenues 2,538.0$ 2,320.3$ 2,260.1$ 2,815.2$ 2,277.4$ 2,119.3$
Year Ended September 30,
Cost of sales (1,605.3) (1,395.1) (1,316.5) (1,908.3) (1,437.2) (1,343.8)
Total Margin 932.7 925.2 943.6 906.9 840.2 775.5
Operating expenses (620.6) (609.7) (615.1) (610.5) (562.5) (535.2)
Depreciation and amortization (94.7) (87.4) (83.9) (80.4) (75.6) (72.5)
Gain on sale of storage facility - - 39.9 - 46.1 -
Other income, net 25.6 7.7 16.0 18.9 17.6 16.3
Operating income 242.9 235.8 300.5 234.9 265.8 184.1
Interest expense (63.5) (65.1) (70.3) (72.9) (71.5) (74.1)
Loss on extinguishment of debt (38.1) - - - - (17.1)
Income before income taxes 141.3 170.7 230.2 162.0 194.3 92.9
Income taxes - AmeriGas Propane, Inc. and Subsidiaries (1) (26.4) (32.3) (41.6) (29.7) (35.8) (16.5)
Noncontrolling interests (2) (75.0) (91.1) (123.6) (88.4) (105.3) (51.3)
Net income attributable to UGI 39.9$ 47.3$ 65.0$ 43.9$ 53.2$ 25.1$
Balance Sheet- AmeriGas PropaneTotal assets 1 800 4$ 1 690 9$ 1 647 7$ 1 722 8$ 1 708 4$ 1 627 2$ Total assets 1,800.4$ 1,690.9$ 1,647.7$ 1,722.8$ 1,708.4$ 1,627.2$
Property, plant and equipment, net 645.8 642.8 628.9 616.8 634.0 580.6
Goodwill 696.3 683.1 670.1 645.2 645.1 619.1
Debt:
Bank loans 95.5 91.0 - - - -
L t d bt 933 5 791 4 865 6 933 4 933 1 933 7
May 2012 24
Long-term debt 933.5 791.4 865.6 933.4 933.1 933.7
Total debt 1,029.0 882.4 865.6 933.4 933.1 933.7
(1) Primarily taxes related to the general partner's ownership interests in the Partnership.
(2)The general public's interests in AmeriGas Partners, L.P.
AmeriGas Partners EPS Reconciliation
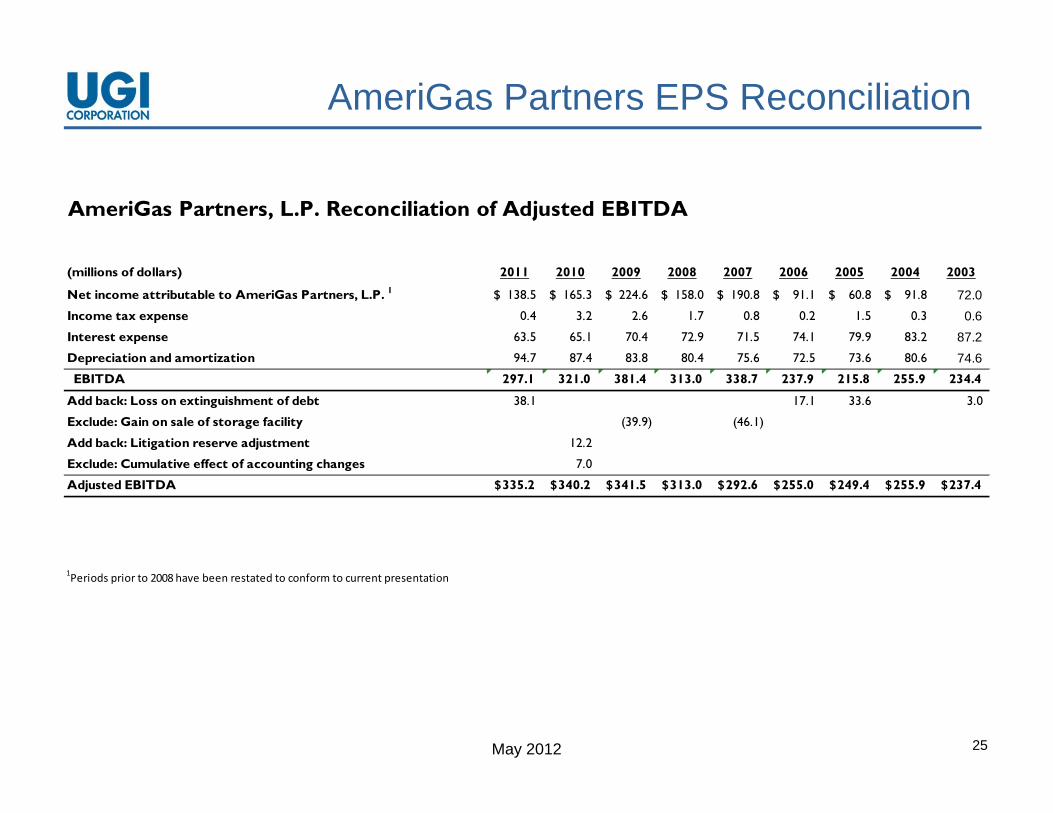
AmeriGas Partners, L.P. Reconciliation of Adjusted EBITDA
(millions of dollars) 2011 2010 2009 2008 2007 2006 2005 2004 2003
Net income attributable to AmeriGas Partners, L.P. 1 138.5$ 165.3$ 224.6$ 158.0$ 190.8$ 91.1$ 60.8$ 91.8$ 72.0 Income tax expense 0.4 3.2 2.6 1.7 0.8 0.2 1.5 0.3 0.6 Interest expense 63.5 65.1 70.4 72.9 71.5 74.1 79.9 83.2 87.2 D i ti d ti ti 94 7 87 4 83 8 80 4 75 6 72 5 73 6 80 6 74 6Depreciation and amortization 94.7 87.4 83.8 80.4 75.6 72.5 73.6 80.6 74.6 EBITDA 297.1 321.0 381.4 313.0 338.7 237.9 215.8 255.9 234.4
Add back: Loss on extinguishment of debt 38.1 17.1 33.6 3.0
Exclude: Gain on sale of storage facility (39.9) (46.1)
Add back: Litigation reserve adjustment 12.2
Exclude: Cumulative effect of accounting changes 7.0
Adjusted EBITDA 335.2$ 340.2$ 341.5$ 313.0$ 292.6$ 255.0$ 249.4$ 255.9$ 237.4$
1Periods prior to 2008 have been restated to conform to current presentation
May 2012 25
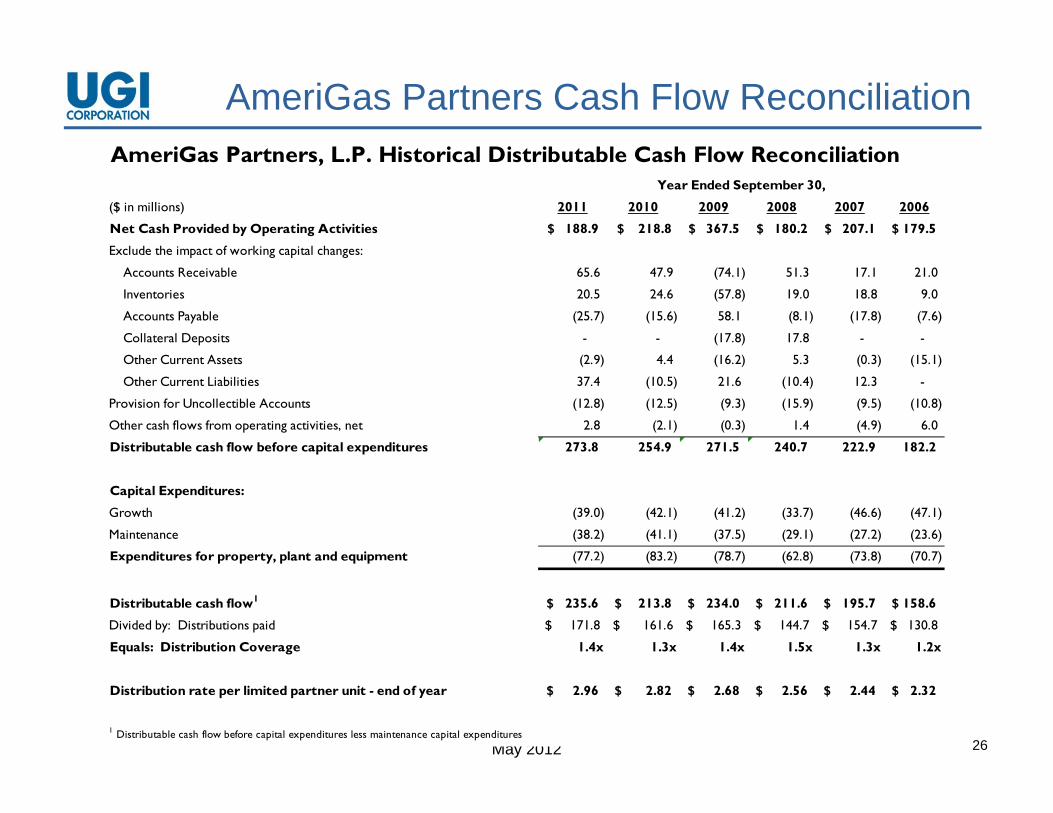
AmeriGas Partners Cash Flow ReconciliationA iG P t L P Hi t i l Di t ib t bl C h Fl R ili tiAmeriGas Partners, L.P. Historical Distributable Cash Flow Reconciliation
($ in millions) 2011 2010 2009 2008 2007 2006
Net Cash Provided by Operating Activities 188.9$ 218.8$ 367.5$ 180.2$ 207.1$ 179.5$
Exclude the impact of working capital changes:
Year Ended September 30,
Exclude the impact of working capital changes:
Accounts Receivable 65.6 47.9 (74.1) 51.3 17.1 21.0
Inventories 20.5 24.6 (57.8) 19.0 18.8 9.0
Accounts Payable (25.7) (15.6) 58.1 (8.1) (17.8) (7.6)
Collateral Deposits - - (17.8) 17.8 - -
O h C A (2 9) 4 4 (16 2) 5 3 (0 3) (15 1) Other Current Assets (2.9) 4.4 (16.2) 5.3 (0.3) (15.1)
Other Current Liabilities 37.4 (10.5) 21.6 (10.4) 12.3 -
Provision for Uncollectible Accounts (12.8) (12.5) (9.3) (15.9) (9.5) (10.8)
Other cash flows from operating activities, net 2.8 (2.1) (0.3) 1.4 (4.9) 6.0
Distributable cash flow before capital expenditures 273.8 254.9 271.5 240.7 222.9 182.2
Capital Expenditures:
Growth (39.0) (42.1) (41.2) (33.7) (46.6) (47.1)
Maintenance (38.2) (41.1) (37.5) (29.1) (27.2) (23.6)
Expenditures for property, plant and equipment (77.2) (83.2) (78.7) (62.8) (73.8) (70.7) pe d tu es o p ope ty, p a t a d equ p e t (77. ) (83. ) (78.7) (6 .8) (73.8) (70.7)
Distributable cash flow1 235.6$ 213.8$ 234.0$ 211.6$ 195.7$ 158.6$
Divided by: Distributions paid 171.8$ 161.6$ 165.3$ 144.7$ 154.7$ 130.8$
Equals: Distribution Coverage 1.4x 1.3x 1.4x 1.5x 1.3x 1.2x
May 2012 26
Distribution rate per limited partner unit - end of year 2.96$ 2.82$ 2.68$ 2.56$ 2.44$ 2.32$
1 Distributable cash flow before capital expenditures less maintenance capital expenditures
AmeriGas Supplemental Information: Footnotes
The enclosed supplemental information contains a reconciliation of Earnings before interest expense, income taxes, depreciation and amortization ("EBITDA"), Adjusted EBITDA to Net Income and Distributable Cash Flow to Cash Flow from Operations.
EBITDA, Adjusted EBITDA and Distributable Cash Flow are not measures of performance or financial condition under accounting principles generally accepted in the United States ("GAAP") Management believes EBITDA Adjusted EBITDAaccounting principles generally accepted in the United States ( GAAP ). Management believes EBITDA, Adjusted EBITDA and Distributable Cash Flow are meaningful non-GAAP financial measures used by investors to (1) compare the Partnership's operating performance with that of other companies within the propane industry and (2) assess the Partnership’s ability to pay distributions and meet its loan covenants. The Partnership's definitions of EBITDA, Adjusted EBITDA and Distributable Cash Flow may be different from those used by other companies.
EBITDA and Adjusted EBITDA should not be considered as alternatives to net income (loss) attributable to AmeriGas EBITDA and Adjusted EBITDA should not be considered as alternatives to net income (loss) attributable to AmeriGas Partners, L.P. Management uses EBITDA to compare year-over-year profitability of the business without regard to capital structure as well as to compare the relative performance of the Partnership to that of other master limited partnerships without regard to their financing methods, capital structure, income taxes or historical cost basis. Management uses Adjusted EBITDA to exclude from AmeriGas Partners’ EBITDA gains and losses that competitors do not necessarily have to provide additional insight into the comparison of year-over-year profitability to that of other master limited partnerships. In view of the omission of interest, income taxes, depreciation and amortization from EBITDA and Adjusted EBITDA,
t l th fit bilit f th b i b i t i tt ib t bl t A iG P tmanagement also assesses the profitability of the business by comparing net income attributable to AmeriGas Partners, L.P. for the relevant years. Management also uses EBITDA to assess the Partnership's profitability because its parent, UGI Corporation, uses the Partnership's EBITDA to assess the profitability of the Partnership, which is one of UGI Corporation’s industry segments. UGI Corporation discloses the Partnership's EBITDA in its disclosures about its industry segments as the profitability measure for its domestic propane segment.
Distributable cash flow as defined herein should not be considered an alternative to cash flows from operating activities or Distributable cash flow as defined herein should not be considered an alternative to cash flows from operating activities or any other measure of financial performance calculated in accordance with generally accepted accounting principles as those items are used to measure operating performance, liquidity, or the ability to service debt obligations. Management believes that distributable cash flow provides additional information for evaluating our ability to declare and pay distributions to unitholders.
May 2012 27
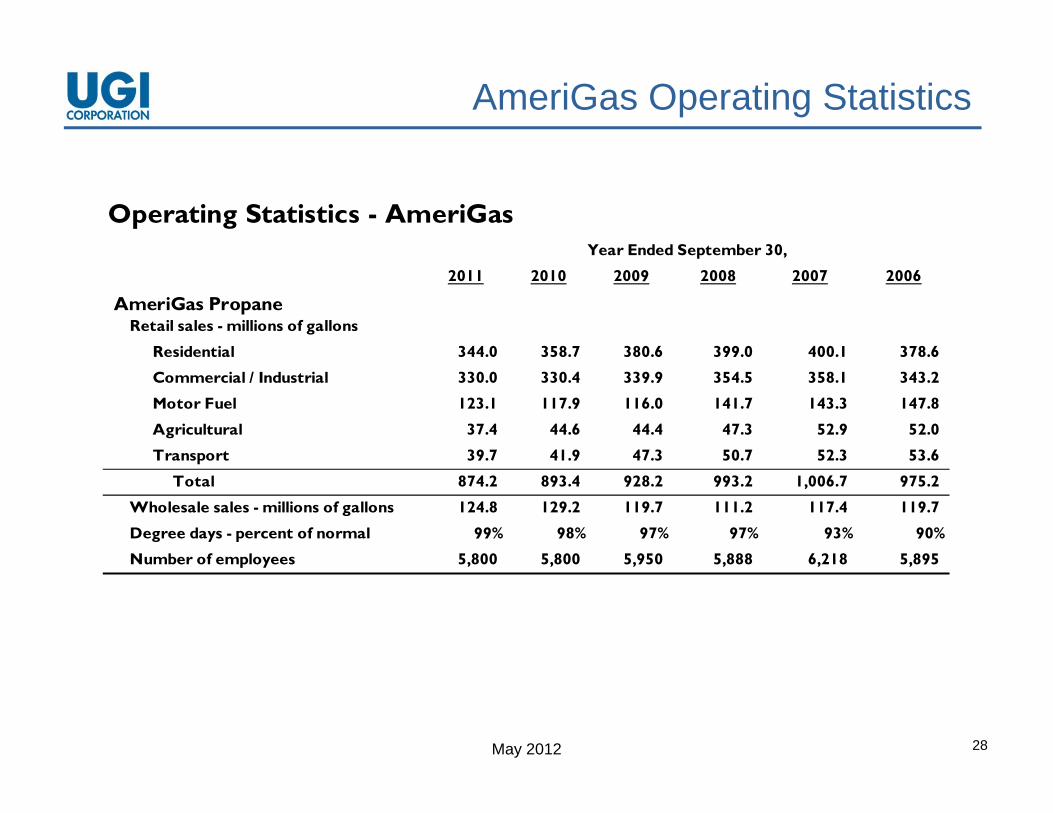
AmeriGas Operating Statistics
Operating Statistics - AmeriGasYear Ended September 30,
2011 2010 2009 2008 2007 2006
AmeriGas PropaneRetail sales - millions of gallons
Residential 344.0 358.7 380.6 399.0 400.1 378.6
Year Ended September 30,
Residential 344.0 358.7 380.6 399.0 400.1 378.6
Commercial / Industrial 330.0 330.4 339.9 354.5 358.1 343.2
Motor Fuel 123.1 117.9 116.0 141.7 143.3 147.8
Agricultural 37.4 44.6 44.4 47.3 52.9 52.0
Transport 39.7 41.9 47.3 50.7 52.3 53.6 Transport 39.7 41.9 47.3 50.7 52.3 53.6
Total 874.2 893.4 928.2 993.2 1,006.7 975.2
Wholesale sales - millions of gallons 124.8 129.2 119.7 111.2 117.4 119.7
Degree days - percent of normal 99% 98% 97% 97% 93% 90%
Number of employees 5 800 5 800 5 950 5 888 6 218 5 895 Number of employees 5,800 5,800 5,950 5,888 6,218 5,895
May 2012 28
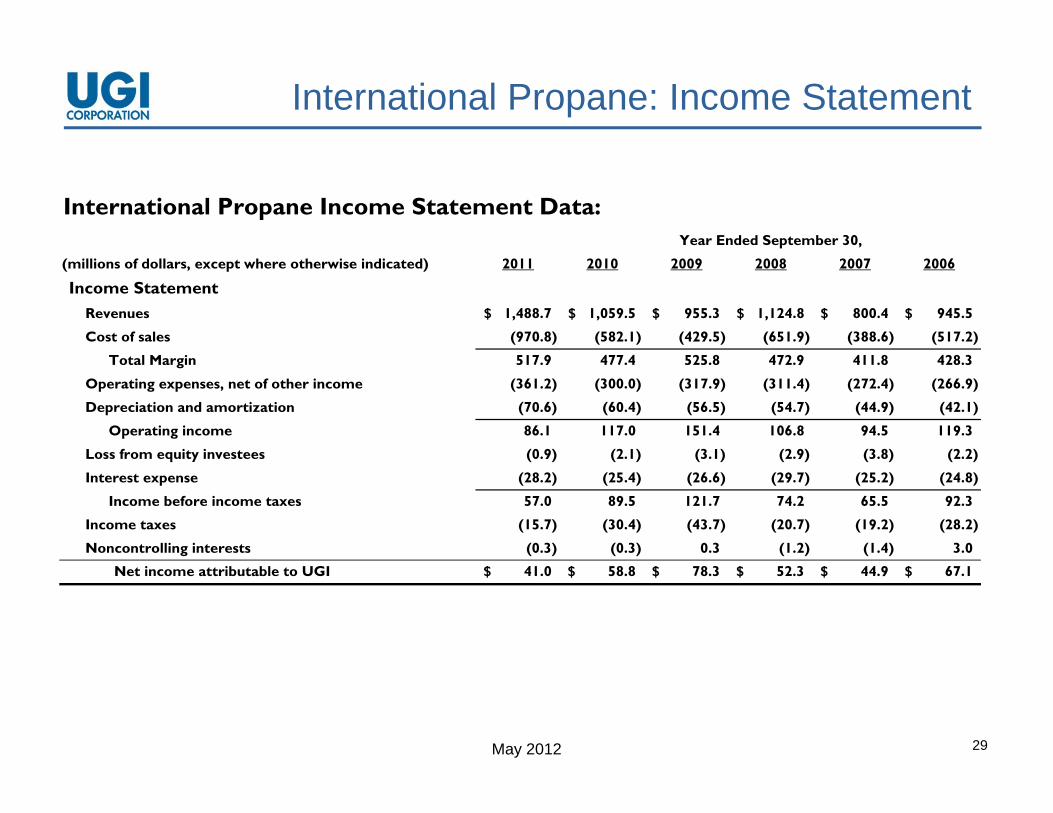
International Propane: Income Statement
International Propane Income Statement Data:Year Ended September 30,
(millions of dollars, except where otherwise indicated) 2011 2010 2009 2008 2007 2006
Income StatementRevenues 1,488.7$ 1,059.5$ 955.3$ 1,124.8$ 800.4$ 945.5$
Cost of sales (970.8) (582.1) (429.5) (651.9) (388.6) (517.2)
T l M i 517 9 477 4 525 8 472 9 411 8 428 3 Total Margin 517.9 477.4 525.8 472.9 411.8 428.3
Operating expenses, net of other income (361.2) (300.0) (317.9) (311.4) (272.4) (266.9)
Depreciation and amortization (70.6) (60.4) (56.5) (54.7) (44.9) (42.1)
Operating income 86.1 117.0 151.4 106.8 94.5 119.3
Loss from equity investees (0.9) (2.1) (3.1) (2.9) (3.8) (2.2) Loss from equity investees (0.9) (2.1) (3.1) (2.9) (3.8) (2.2)
Interest expense (28.2) (25.4) (26.6) (29.7) (25.2) (24.8)
Income before income taxes 57.0 89.5 121.7 74.2 65.5 92.3
Income taxes (15.7) (30.4) (43.7) (20.7) (19.2) (28.2)
Noncontrolling interests (0.3) (0.3) 0.3 (1.2) (1.4) 3.0
Net income attributable to UGI 41.0$ 58.8$ 78.3$ 52.3$ 44.9$ 67.1$
May 2012 29
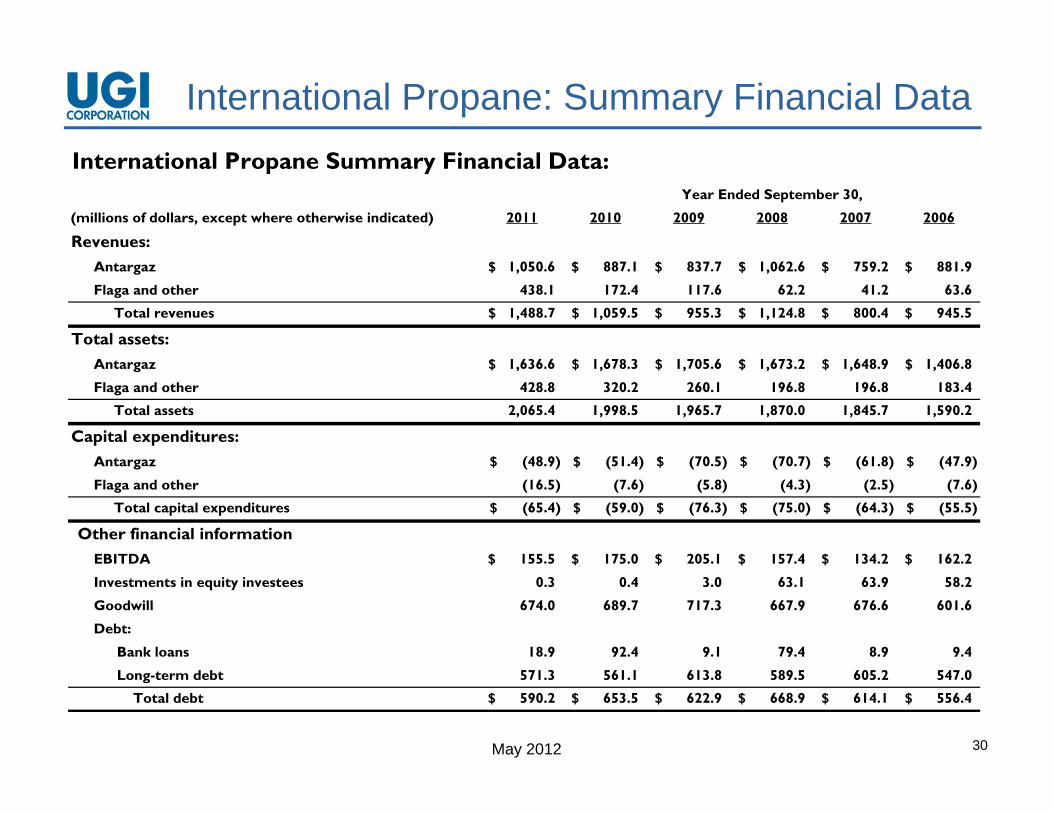
International Propane: Summary Financial DataInternational Propane Summary Financial Data:
(millions of dollars, except where otherwise indicated) 2011 2010 2009 2008 2007 2006
Revenues:
Year Ended September 30,
Antargaz 1,050.6$ 887.1$ 837.7$ 1,062.6$ 759.2$ 881.9$
Flaga and other 438.1 172.4 117.6 62.2 41.2 63.6
Total revenues 1,488.7$ 1,059.5$ 955.3$ 1,124.8$ 800.4$ 945.5$
Total assets:Antargaz 1,636.6$ 1,678.3$ 1,705.6$ 1,673.2$ 1,648.9$ 1,406.8$
Flaga and other 428.8 320.2 260.1 196.8 196.8 183.4
Total assets 2,065.4 1,998.5 1,965.7 1,870.0 1,845.7 1,590.2
Capital expenditures:A t (48 9)$ (51 4)$ (70 5)$ (70 7)$ (61 8)$ (47 9)$ Antargaz (48.9)$ (51.4)$ (70.5)$ (70.7)$ (61.8)$ (47.9)$
Flaga and other (16.5) (7.6) (5.8) (4.3) (2.5) (7.6)
Total capital expenditures (65.4)$ (59.0)$ (76.3)$ (75.0)$ (64.3)$ (55.5)$
Other financial informationEBITDA 155 5$ 175 0$ 205 1$ 157 4$ 134 2$ 162 2$ EBITDA 155.5$ 175.0$ 205.1$ 157.4$ 134.2$ 162.2$
Investments in equity investees 0.3 0.4 3.0 63.1 63.9 58.2
Goodwill 674.0 689.7 717.3 667.9 676.6 601.6
Debt:
Bank loans 18.9 92.4 9.1 79.4 8.9 9.4
May 2012 30
Long-term debt 571.3 561.1 613.8 589.5 605.2 547.0
Total debt 590.2$ 653.5$ 622.9$ 668.9$ 614.1$ 556.4$
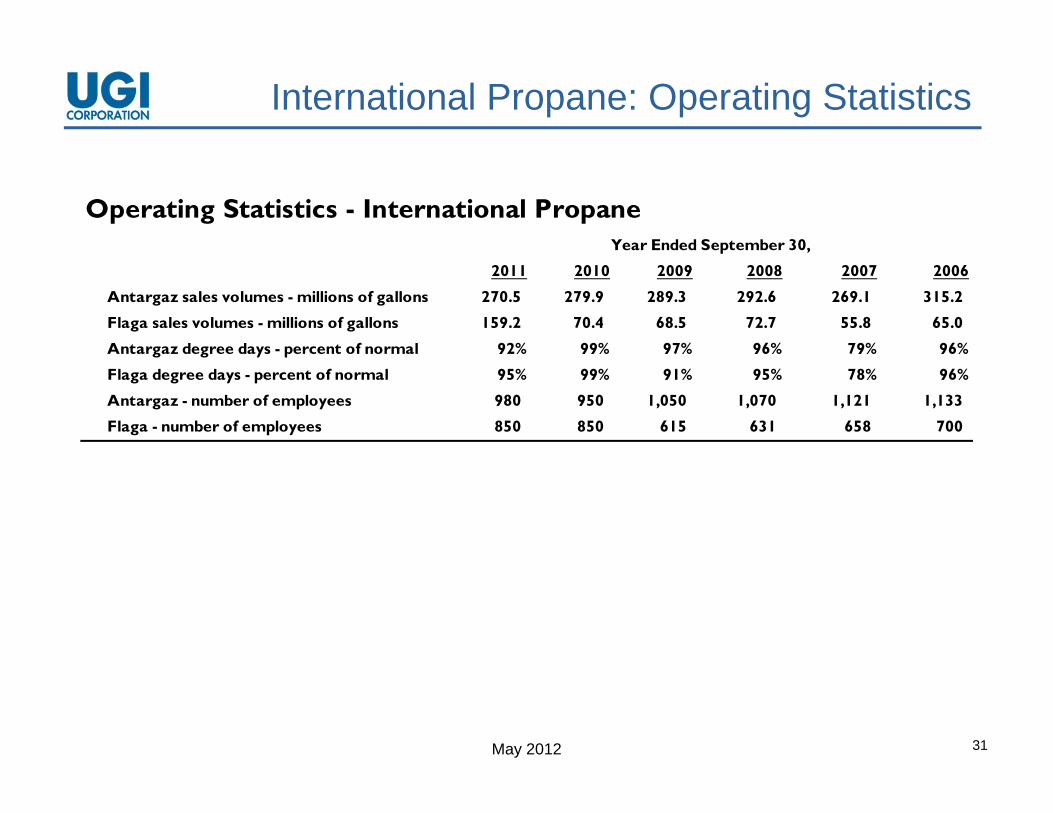
International Propane: Operating Statistics
Operating Statistics - International PropaneYear Ended September 30,
2011 2010 2009 2008 2007 2006
Antargaz sales volumes - millions of gallons 270.5 279.9 289.3 292.6 269.1 315.2
Flaga sales volumes - millions of gallons 159.2 70.4 68.5 72.7 55.8 65.0
Antargaz degree days - percent of normal 92% 99% 97% 96% 79% 96%
p
g g y p
Flaga degree days - percent of normal 95% 99% 91% 95% 78% 96%
Antargaz - number of employees 980 950 1,050 1,070 1,121 1,133
Flaga - number of employees 850 850 615 631 658 700
May 2012 31
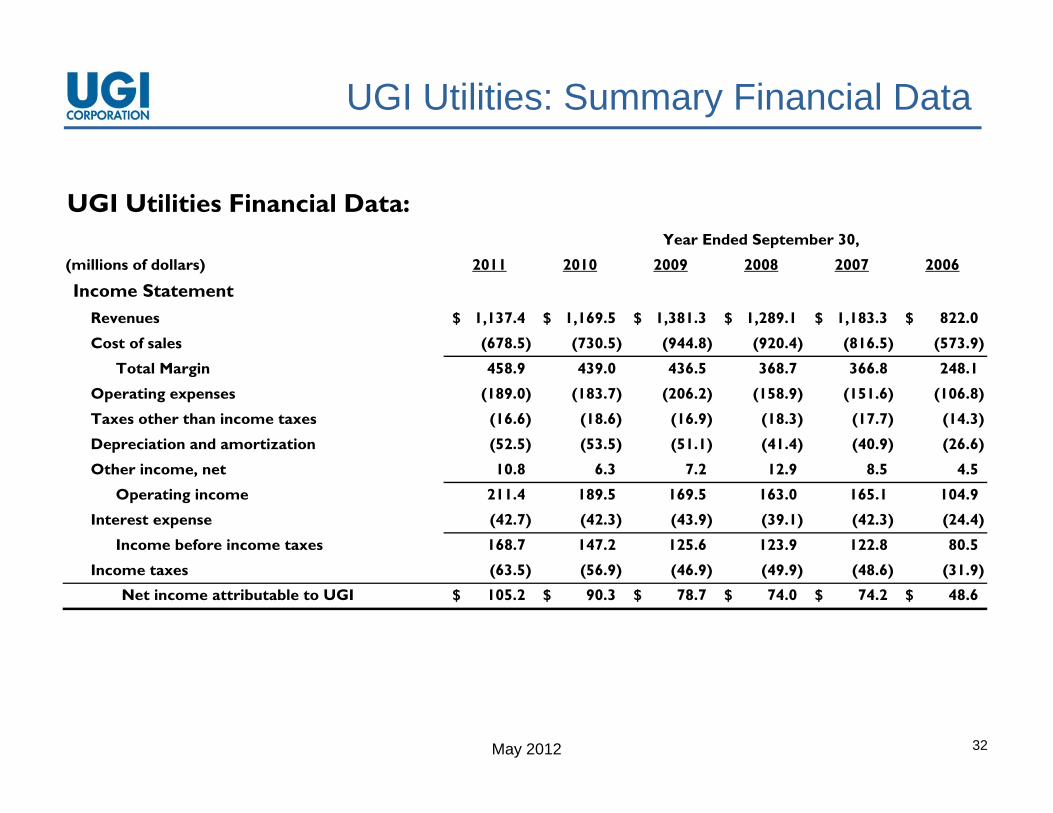
UGI Utilities: Summary Financial Data
UGI Utilities Financial Data:Year Ended September 30,
(millions of dollars) 2011 2010 2009 2008 2007 2006
Income StatementRevenues 1,137.4$ 1,169.5$ 1,381.3$ 1,289.1$ 1,183.3$ 822.0$
Cost of sales (678.5) (730.5) (944.8) (920.4) (816.5) (573.9)
Total Margin 458.9 439.0 436.5 368.7 366.8 248.1
Operating expenses (189.0) (183.7) (206.2) (158.9) (151.6) (106.8)
Taxes other than income taxes (16.6) (18.6) (16.9) (18.3) (17.7) (14.3)
Depreciation and amortization (52.5) (53.5) (51.1) (41.4) (40.9) (26.6)
Other income, net 10.8 6.3 7.2 12.9 8.5 4.5
Operating income 211.4 189.5 169.5 163.0 165.1 104.9
Interest expense (42.7) (42.3) (43.9) (39.1) (42.3) (24.4)
Income before income taxes 168.7 147.2 125.6 123.9 122.8 80.5
Income taxes (63.5) (56.9) (46.9) (49.9) (48.6) (31.9)
Net income attributable to UGI 105.2$ 90.3$ 78.7$ 74.0$ 74.2$ 48.6$
May 2012 32
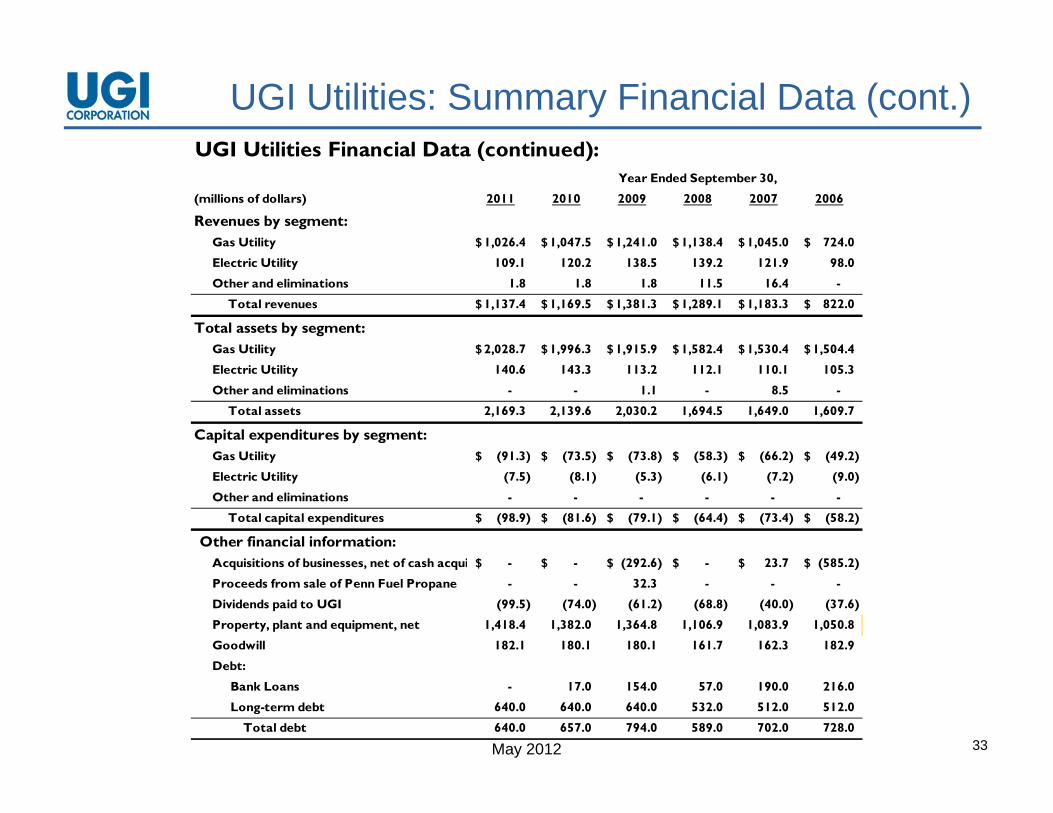
UGI Utilities: Summary Financial Data (cont.)UGI Utilities Financial Data (continued):UGI Utilities Financial Data (continued):
(millions of dollars) 2011 2010 2009 2008 2007 2006
Revenues by segment:Gas Utility 1,026.4$ 1,047.5$ 1,241.0$ 1,138.4$ 1,045.0$ 724.0$
Year Ended September 30,
Electric Utility 109.1 120.2 138.5 139.2 121.9 98.0
Other and eliminations 1.8 1.8 1.8 11.5 16.4 -
Total revenues 1,137.4$ 1,169.5$ 1,381.3$ 1,289.1$ 1,183.3$ 822.0$
Total assets by segment:Gas Utility 2,028.7$ 1,996.3$ 1,915.9$ 1,582.4$ 1,530.4$ 1,504.4$ y
Electric Utility 140.6 143.3 113.2 112.1 110.1 105.3
Other and eliminations - - 1.1 - 8.5 -
Total assets 2,169.3 2,139.6 2,030.2 1,694.5 1,649.0 1,609.7
Capital expenditures by segment:Gas Utility (91.3)$ (73.5)$ (73.8)$ (58.3)$ (66.2)$ (49.2)$ Gas Utility (91.3)$ (73.5)$ (73.8)$ (58.3)$ (66.2)$ (49.2)$
Electric Utility (7.5) (8.1) (5.3) (6.1) (7.2) (9.0)
Other and eliminations - - - - - -
Total capital expenditures (98.9)$ (81.6)$ (79.1)$ (64.4)$ (73.4)$ (58.2)$
Other financial information:A i iti f b i t f h i $ $ (292 6)$ $ 23 7$ (585 2)$ Acquisitions of businesses, net of cash acqui -$ -$ (292.6)$ -$ 23.7$ (585.2)$
Proceeds from sale of Penn Fuel Propane - - 32.3 - - -
Dividends paid to UGI (99.5) (74.0) (61.2) (68.8) (40.0) (37.6)
Property, plant and equipment, net 1,418.4 1,382.0 1,364.8 1,106.9 1,083.9 1,050.8
Goodwill 182.1 180.1 180.1 161.7 162.3 182.9
D bt
May 2012 33
Debt:
Bank Loans - 17.0 154.0 57.0 190.0 216.0
Long-term debt 640.0 640.0 640.0 532.0 512.0 512.0
Total debt 640.0 657.0 794.0 589.0 702.0 728.0
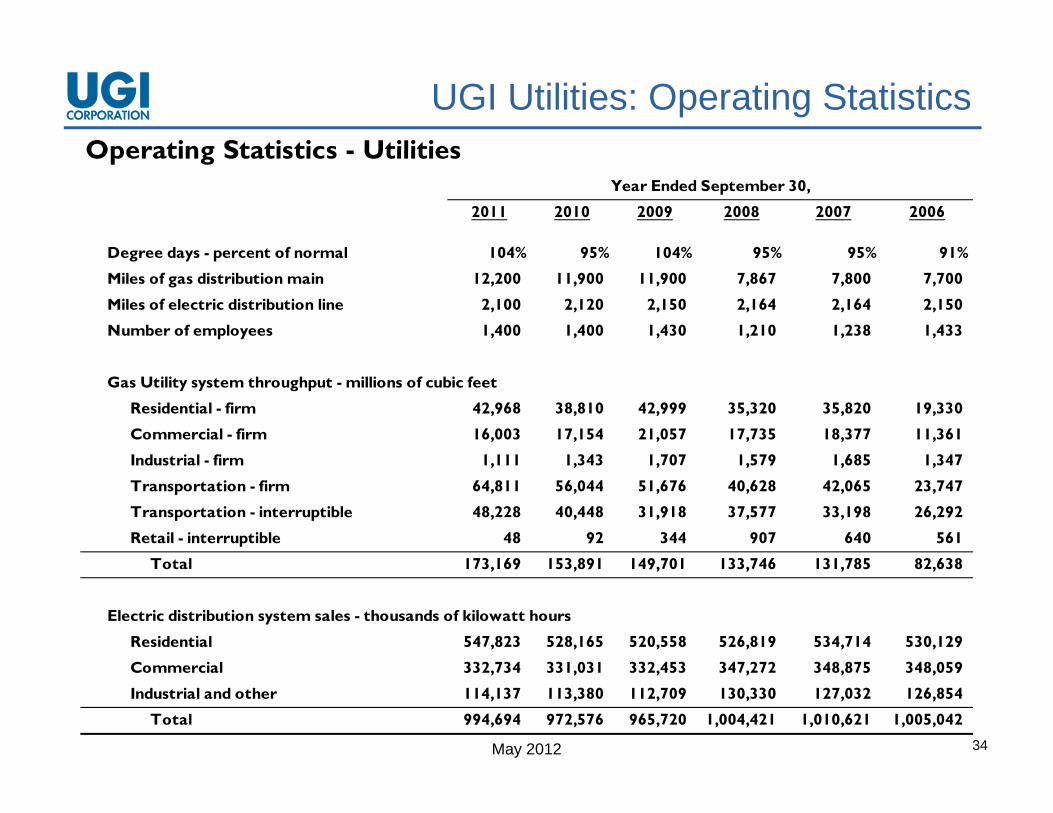
UGI Utilities: Operating StatisticsOperating Statistics UtilitiesOperating Statistics - Utilities
2011 2010 2009 2008 2007 2006
Degree days percent of normal 104% 95% 104% 95% 95% 91%
Year Ended September 30,
Degree days - percent of normal 104% 95% 104% 95% 95% 91%
Miles of gas distribution main 12,200 11,900 11,900 7,867 7,800 7,700
Miles of electric distribution line 2,100 2,120 2,150 2,164 2,164 2,150
Number of employees 1,400 1,400 1,430 1,210 1,238 1,433
Gas Utility system throughput - millions of cubic feet
Residential - firm 42,968 38,810 42,999 35,320 35,820 19,330
Commercial - firm 16,003 17,154 21,057 17,735 18,377 11,361
Industrial firm 1 111 1 343 1 707 1 579 1 685 1 347 Industrial - firm 1,111 1,343 1,707 1,579 1,685 1,347
Transportation - firm 64,811 56,044 51,676 40,628 42,065 23,747
Transportation - interruptible 48,228 40,448 31,918 37,577 33,198 26,292
Retail - interruptible 48 92 344 907 640 561
T t l 173 169 153 891 149 701 133 746 131 785 82 638 Total 173,169 153,891 149,701 133,746 131,785 82,638
Electric distribution system sales - thousands of kilowatt hours
Residential 547,823 528,165 520,558 526,819 534,714 530,129
C i l 332 734 331 031 332 453 347 272 348 875 348 059
May 2012 34
Commercial 332,734 331,031 332,453 347,272 348,875 348,059
Industrial and other 114,137 113,380 112,709 130,330 127,032 126,854
Total 994,694 972,576 965,720 1,004,421 1,010,621 1,005,042
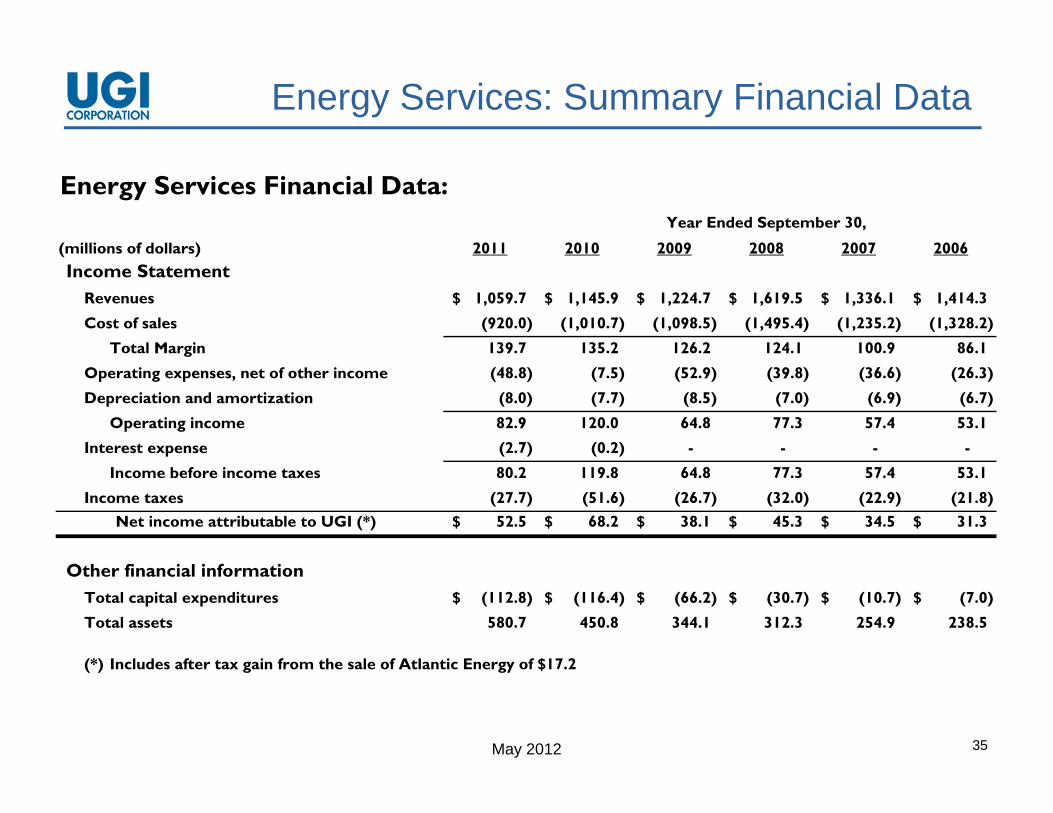
Energy Services: Summary Financial Data
Energy Services Financial Data:
(millions of dollars) 2011 2010 2009 2008 2007 2006
Year Ended September 30,
(millions of dollars) 2011 2010 2009 2008 2007 2006Income Statement
Revenues 1,059.7$ 1,145.9$ 1,224.7$ 1,619.5$ 1,336.1$ 1,414.3$ Cost of sales (920.0) (1,010.7) (1,098.5) (1,495.4) (1,235.2) (1,328.2)
Total Margin 139.7 135.2 126.2 124.1 100.9 86.1 gOperating expenses, net of other income (48.8) (7.5) (52.9) (39.8) (36.6) (26.3) Depreciation and amortization (8.0) (7.7) (8.5) (7.0) (6.9) (6.7)
Operating income 82.9 120.0 64.8 77.3 57.4 53.1 Interest expense (2.7) (0.2) - - - -
Income before income taxes 80.2 119.8 64.8 77.3 57.4 53.1 Income taxes (27.7) (51.6) (26.7) (32.0) (22.9) (21.8)
Net income attributable to UGI (*) 52.5$ 68.2$ 38.1$ 45.3$ 34.5$ 31.3$
Other financial informationTotal capital expenditures (112.8)$ (116.4)$ (66.2)$ (30.7)$ (10.7)$ (7.0)$ Total assets 580.7 450.8 344.1 312.3 254.9 238.5
(*) Includes after tax gain from the sale of Atlantic Energy of $17 2
May 2012 35
(*) Includes after tax gain from the sale of Atlantic Energy of $17.2


![Data Book AGA 60 D · Aluminium for version AGA 076 - AGA 106 [8] With gasket in NBR only for version single phase AGA 106 . CENTRIFUGAL PUMPS AGA CONSTRUCTIONS 60Hz 301 EBARA Pumps](https://img.pdfslide.us/doc/110x75/5e694725e04bf5741b5a9b0e/data-book-aga-60-d-aluminium-for-version-aga-076-aga-106-8-with-gasket-in-nbr.jpg)