Embed Size (px)
Citation preview
FASAB Updatep
Virginia Peninsula Chapter of the Association of g pGovernment Accountants (AGA) and Hampton
Roads Chapter of the American Society of Military Comptrollers (ASMC)Comptrollers (ASMC)
Professional Development Conference (PDC)
Domenic N. Savini, CPA, CMA, CGMA, MSAAssistant DirectorMarch 15, 2012

Disclaimer
• Views expressed are those of the speaker. TheViews expressed are those of the speaker. The Board expresses its views in official publications.

Who is FASAB? There are 9 board members t d b E ti Di t d 6 t ffsupported by an Executive Director and 6 staff.
Tom Allen Wendy Payne
Mark Reger
Chairman(Former GASB Chair)
y yExecutive Director –
Non-voting
g
TreasuryTo be Announced
OMB
Sam M. McCall Bob DaceyGAO
Hal Steinberg Alan Schumacher
Michael Granof Scott Showalter
Bios available at www.fasab.govCurrent as of Feb 2012

Financial Statements• “Traditional” with some twists
– Statement of Net Cost– Statement of Operations and Changes in Net PositionStatement of Operations and Changes in Net Position– Balance Sheet
• Budgetary– Reconciliations of Net Operating Cost and DeficitReconciliations of Net Operating Cost and Deficit– Statement of Changes in Cash Balances from Deficit and Other
Activities• Prospective
– Statement of Long-Term Fiscal Projections (SFFAS 36)
– Statement of Social Insurance (SFFAS 17, 25, 26, 28)
– Statement of Changes in Social Insurance (SFFAS 37)

OverviewR l C l d P jRecently Completed Projects
• SFFAS 38, Accounting for Federal Oil and Gas Resources (April 2010)
• SFFAS 39, Subsequent Events: Codification of Accounting and Financial Reporting Standards Contained in the AICPA Statement on Auditing Standards (Aug 2010)
• SFFAS 40, Deferred Maintenance and Repairs: Definitional Changes(May 11)
• SFFAS 41, Deferral of the Effective Date of SFFAS 38, Accounting for F d l Oil d G R (J l 2011)Federal Oil and Gas Resources (July 2011)
• SFFAC 7, Measurement of the Elements of Accrual-Basis Financial Statements in Periods After Initial Recording (Aug 2011)
• SFFAS 42, Deferred Maintenance and Repairs; Amending Statements of Federal Financial Accounting Standards 6, 14, 29 and 32 (pending Principal and Congressional approval; circa May 2012)

OverviewR l C l d P jRecently Completed Projects
• Technical Release 12 - Accrual Estimates for Grant Programs (Aug 2010)
• Technical Release 13 - Implementation Guide for Estimating the Historical Cost of General Property, Plant & Equipment (Jun 2011)p y, q p ( )
• Technical Release 14 - Implementation Guidance on the Accounting for the Disposal of General Property, Plant & Equipment (Oct 2011)
TB 2011 1 A ti f F d l N t l R Oth Th• TB 2011-1, Accounting for Federal Natural Resources Other Than Oil and Gas (Jul 2011)
• TB 2011-2, Extended Deferral of the Effective Date of Technical Bulletin 2006-1, Recognition and Measurement of Asbestos-Related Cleanup Costs (Sept 2011)

SFFAS 36 - Comprehensive Long term Fiscal ProjectionsLong-term Fiscal Projections
_______________________________________________________• Basic Information (audited)( )
– Reporting is RSI for FY 2010-2012 and will become basic in 2013
– the present value of projected receipts and non-p p j pinterest spending under current policy without change including its relationship to projected GDPh i th t l f j t d– changes in the present value of projected
receipts and non-interest spending from the prior year
– the assumptions underlying the projections– the assumptions underlying the projections– factors influencing trends– significant changes in the projections from period
to periodto period

SFFAS 36 - Comprehensive Long term Fiscal Projections contLong-term Fiscal Projections, cont. _______________________________________________________
• Required Supplemental Informationq pp– the projected trends in:
• the relationship between receipts and spendingspending
• deficits or surpluses• Treasury debt held by the public as a share of
GDPGDP– possible results using alternative
scenariosthe likely impact of delaying corrective– the likely impact of delaying corrective action when a fiscal gap exists (“cost of delay”)

The Sustainability of Fiscal Policy
An important purpose of the Financial Report is to help citizens and policymakers assess whether current fiscal policy is sustainable and, if it is not, the urgency and magnitude of policy reforms necessary to make it sustainable. A sustainable policy is one where the ratio of debt held by the public to GDP (debt to GDP) is stable over time. The discussion below focuses on balancing revenues and expenditures over time, and does not consider fairness or efficiency implications of the reforms necessary to achieve sustainability. It is shown below that, under current policy, the y y , p y,ratio of debt to GDP is projected to rise only 1.2 percent from 2013 to 2022, before resuming faster growth over the remainder of the 75- year window, eventually exceeding 280 percent by 2086. The continuing rise in this ratio by the end of the 75-year horizon means that current policy is unsustainable If these projections75-year horizon means that current policy is unsustainable. If these projections were extended beyond 2086, deficits excluding interest would persist as the population continues to age and if the other assumptions made for the 75-year horizon continue to hold. Persistence of the primary deficit beyond the 75-year horizon implies that the ratio of debt to GDP would continue to grow beyond the 75horizon implies that the ratio of debt to GDP would continue to grow beyond the 75-year horizon.
FY2011 Financial Report of the US Government

SOURCE: 2010 CFR - The 2010 projection is lower primarily due toprojection is lower primarily due to the projected savings from the Affordable Care Act; lowers Medicare spending and raises receipts. “…there is uncertainty about whether the projected cost reductions in health care will be fully achieved.”

Source 2011 CFR: Page 153.

Source 2011 CFR: Page 156.

SFFAS 37 - Social Insurance –Additional RequirementsAdditional Requirements
_______________________________________________________
F f d l fi i l i i l i• For federal financial reporting, social insurance comprises five programs – Social Security, Medicare, Railroad Retirement, Black Lung, and Unemployment Insurance
• Together in one section in management’s discussion and analysis -- critical information about costs, assets and liabilities, social insurance commitments, budget flows, and the long-term fiscal , g , gprojections
• A new summary section within the statement of social insurance displaying open and closed group measuresmeasures
• A new basic financial statement to present the reasons for changes during the reporting period in the open group measure reported on the statement of social insuranceof social insurance

FINANCIAL STATEMENTS
48
United States Government Statements of Social Insurance (Note 26), continued Present Value of Long-Range (75 Years, except Black Lung) Actuarial Projections (In billions of dollars) 2011 2010 2009 2008 2007 Social Insurance Summary: 14
Participants who have attained eligibility age: Revenue (e.g., Contributions and earmarked taxes) ......... 1,737 1,628 1,427 1,333 1,260Expenditures for scheduled future benefits ....................... (14,688) (13,661) (13,262) (12,369) (11,608)
Present value of future expenditures in excess of future revenue ............................................................. (12,951) (12,033) (11,835) (11,036) (10,348)
Participants who have not attained eligibility age: Revenue (e.g., Contributions and earmarked taxes) ......... 33,620 32,263 30,621 29,851 28,342 Expenditures for scheduled future benefits ....................... (66,942) (63,287) (70,931) (67,950) (63,056)
Present value of future expenditures in excess of future revenue ............................................................. (33,322) (31,024) (40,310) (38,099) (34,714)
Closed-group – Total present value of future expenditures in excess of future revenue ........................ (46,272) (43,057) (52,145) (49,135) (45,062)
Future participants:
Revenue (e.g., Contributions and earmarked taxes) ......... 29,037 28,075 25,491 24,743 22,828Expenditures for scheduled future benefits ....................... (16,594) (15,875) (19,224) (18,578) (18,714)
Present value of future revenue in excess of future expenditures ................................................................ 12,443 12,200 6,267 6,165 4,114
Open-group – Total present value of future
expenditures in excess of future revenue........................ (33,830) (30,857) (45,878) (42,970) (40,948)
1 The projection period is 1/1/2011 -12/31/2085 and the valuation date is 1/1/2011. 2 The projection period is 1/1/2010 -12/31/2084 and the valuation date is 1/1/2010. 3 The projection period is 1/1/2009 -12/31/2083 and the valuation date is 1/1/2009. 4 The projection period is 1/1/2008 -12/31/2082 and the valuation date is 1/1/2008. 5 The projection period is 1/1/2007 -12/31/2081 and the valuation date is 1/1/2007. 6 These amounts represent the present value of the future transfers from the General Fund of the Treasury to the Supplementary Medical Insurance Trust Fund. These future intragovernmental transfers are included as income in both HHS’ and the Centers for Medicare & Medicaid Services’ Financial Reports but are not income from the Governmentwide perspective of this report.
7 These amounts approximate the present value of the future financial interchange and the future transfers from the General Fund of the Treasury to the Social Security Equivalent Benefit Account (see discussion of Railroad Retirement Program in the unaudited supplemental information section of this report). They are included as income in the Railroad Retirement Financial Report but are not income from the Governmentwide perspective of this report. 8 Does not include interest expense accruing on the outstanding debt.
9 The projection period is 9/30/2011 -9/30/2040 and the valuation date is 9/30/2011.
10 The projection period is 9/30/2010 -9/30/2040 and the valuation date is 9/30/2010. 11 The projection period is 9/30/2009 -9/30/2040 and the valuation date is 9/30/2009. 12 The projection period is 9/30/2008 -9/30/2040 and the valuation date is 9/30/2008. 13 The projection period is 9/30/2007 -9/30/2040 and the valuation date is 9/30/2007. 14 Participants for the Social Security and Medicare programs are assumed to be the “closed-group” of individuals who are at least 15 years of age at the start of the projection period, and are participating as either taxpayers, beneficiaries, or both, except for the 2007 Medicare programs for which current participants are assumed to be at least 18 instead of 15 years of age. Totals may not equal the sum of components due to rounding. The accompanying notes are an integral part of these financial statements.

FINANCIAL STATEMENTS
49
United States Government Statement of Changes in Social Insurance Amounts for the Year Ended September 30, 2011 (Note 26)
(In billions of dollars) Social
Security Medicare
HI Medicare
SMI
Other (e.g. Railroad
Retirement) Total Net present value (NPV) of future
revenue less future expenditures for current and future participants (the “open group”) over the next 75 years, beginning of the year ..................................... (7,947) (2,683) (20,130) (97) (30,857)
Reasons for changes in the NPV during the year:
Changes in valuation period ..................... (436) (112) (968) (2) (1,518)
Changes in demographic data and assumptions ........................................... (688) (112) (59) (0) (859)
Changes in economic data and assumptions ........................................... (143) 0 - (2) (145)
Changes in law or policy ........................... - - (14) - (14)
Changes in methodology and programmatic data ................................. 56 - - - 56
Changes in economic and other healthcare assumptions ......................... - 185 (648) - (463)
Change in projection base ........................ - (531) 500 - (31)
Net change in open group measure ............ (1,211) (570) (1,189) (4) (2,974)
Open group measure, end of year............... (9,157) (3,252) (21,320) (101) (33,830)
Totals may not equal the sum of components due to rounding. The accompanying notes are an integral part of these financial statements.
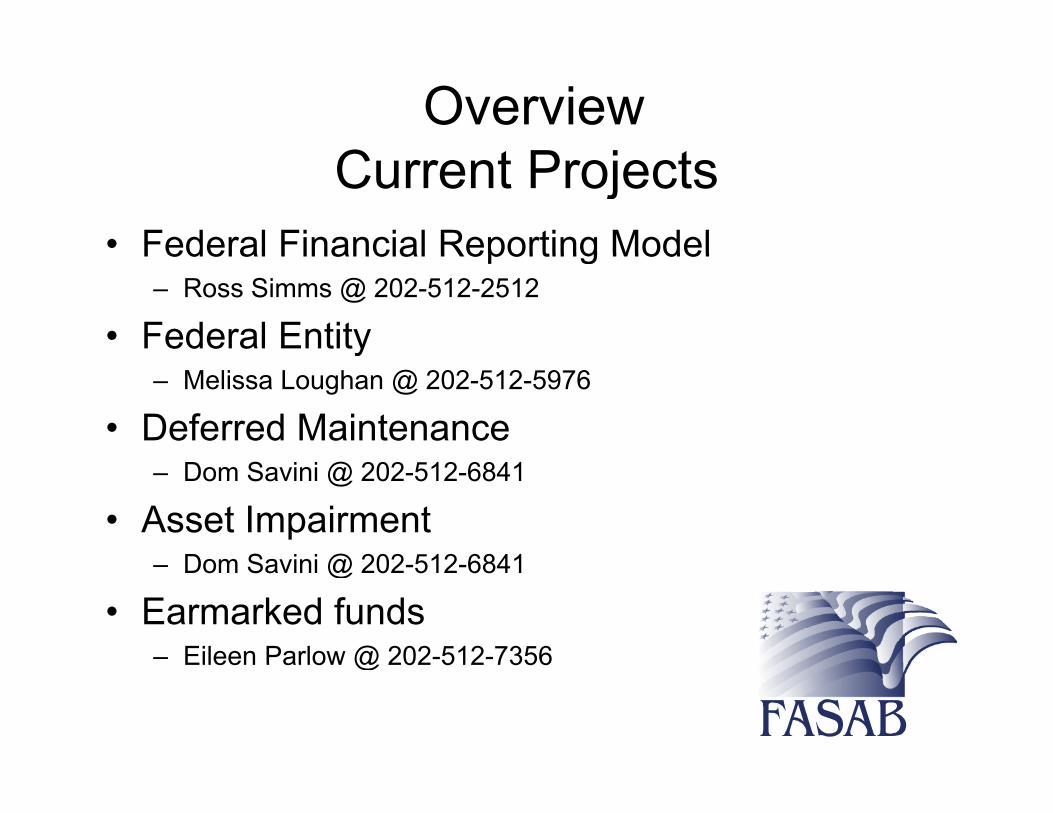
Overview C P jCurrent Projects
• Federal Financial Reporting ModelFederal Financial Reporting Model– Ross Simms @ 202-512-2512
• Federal Entityy– Melissa Loughan @ 202-512-5976
• Deferred Maintenance– Dom Savini @ 202-512-6841
• Asset ImpairmentDom Savini @ 202 512 6841– Dom Savini @ 202-512-6841
• Earmarked funds– Eileen Parlow @ 202-512-7356Eileen Parlow @ 202 512 7356

Federal Reporting Model -FASAB A il 2010 U N d St dFASAB April 2010 User Needs Study
• Concerns exist regarding the benefits of accrual basis F/S’ g grelative to the cost of preparing them.
• User Needs Study results:Citi d ti d t d diffi lt i– Citizens and some executives and managers noted difficulty in understanding information in financial reports.
– Congress seeks timely, easy to understand information to address particular issuesparticular issues.
– Citizens not aware that audited financial statements exist and some executives and managers had not seen their agency’s financial statements.
– Some executives and managers noted that they need training in financial Management.

Federal Reporting Model -FASAB A il 2010 U N d St dFASAB April 2010 User Needs Study
• User Needs Study results(continued):User Needs Study results(continued):– Congress seeks financial information about specific issues of the day
and uses many sources to obtain the information.
C k i f ti b t th b d t ff t f l i l ti– Congress seeks information about the budgetary effect of legislative proposals on the budget and the cumulative effects of legislation.
– Executives and managers use multiple systems, cuff systems, or other systemssystems.
– Both cash and accrual basis accounting appears to be needed to provide the information users need.
– Executives and managers need information at least monthly, but timelier, if possible. However, some did not believe that timelier information was possible.

Federal Reporting Model -FASAB T k F R t D b 2010FASAB Task Force Report December 2010• Task Force Recommendations:
– Web delivery model– Government-wide performance information– Net cost and spending by function– Statement of spending requirements– Intergovernmental financial dependency– Intergovernmental financial dependency– Improved reconciliation of deficit and operating cost– Reclassify the reconciliation of cash and debt changes– Re-orient the balance sheet and improve stakeholder link– Explain the difference between net liabilities and fiscal gap
E t bli h b it f t d i i th– Establish a web-site for reports and raise awareness in the near-term

Federal Reporting Model –The Chief Financial Officers Act of 1990 – 20 Years Later:
Report to the CongressReport to the Congressand the Comptroller General.
• The July 2011 CFO Act Report offered the following• The July 2011 CFO Act Report offered the following recommendations to Congress:
– Enhance role of the CFO by standardizing the portfolio to include l d hi ibilit f b d t f l ti d tileadership responsibility for budget formulation and execution, planning and performance, risk management and internal controls, financial systems, and accounting.
P id D t CFO ith th b dth f ibiliti– Provide Deputy CFOs with the same breadth of responsibilities as their respective CFOs to provide continuity between appointments.
– Direct OMB, GAO, and FASAB, in consultation with CIGIE, to evolve the financial reporting model by examining the entire process with an eye toward how to further improve and streamline current reporting requirements and to better meet the needs of all stakeholdersstakeholders.

Federal Reporting Model -N SNext Steps
• Consider implications of user needs study andConsider implications of user needs study and task force recommendations for existing concepts
• Consider input from the CFO Council/CIGIE joint study of the CFO Act at 20 years
• Study of component entity reporting model

Federal EntityFederal Entity
• FASAB established concepts in mid-90’sFASAB established concepts in mid 90 s• Standards now being developed• Questions:Questions:
– What to include in CFR (all entities “established by” the federal government or a subset)?
– How to present information (all consolidated, some separately displayed or disclosed)?B d b t “ l t d” ti d– Boundary between “related” parties, core and non-core entities?

Asset ImpairmentAsset Impairment• Asset impairment standards built from GASB and p
IPSASB standards– Assets held in-use
I di t f t ti l i i t– Indicators of potential impairment – Techniques for measuring potential impairment– Recognition guidance vs adjusting estimates or NBVRecognition guidance vs. adjusting estimates or NBV
• Significant & permanent declines in service utility• Should be limited & rare cases• Should be limited & rare cases
– Prominent events– Entities not required to “search or hunt”q

Earmarked FundsEarmarked Funds• Changing the name from “Earmarked Funds” to “Funds g g
from Dedicated Collections”• Excluding funds:
– supporting federal employee benefits– predominantly financed from general funds rather than a
dedicated collection
• Amending SFFAS 27 to allow combined or consolidated amounts to be presented

Earmarked FundsEarmarked Funds
• Providing component entities twoProviding component entities two presentation options:
• continue current presentation• continue current presentation• present amounts for key line items
parentheticallyparenthetically• Provides guidance for funds with mixed
sources of funding (only partially fundedsources of funding (only partially funded by dedicated collections)

Emerging IssuesEmerging Issues• Risk Assumed• Leases• Investments in non-federal securities• Public Private Partnerships
C f f &• AAPC – Determining the full cost of PP&E– Capacity challenges in a more constrained environment…
Contact and Website InformationContact and Website Information
• General inquiries can be directed to [email protected]
• Phone: 202 512-7350• www.FASAB.gov
– ListservE D ft– Exposure Drafts
– Active Projects • I can be reached at savinid@fasab gov orI can be reached at [email protected] or 202 512-6841

Staff Contact InformationStaff Contact Information
• Melissa Loughan @ 202-512-5976Melissa Loughan @ 202 512 5976• Eileen Parlow @ 202-512-7356• Wendy Payne @ 202-512-7357Wendy Payne @ 202-512-7357• Julian Ranagan @ 202-512-7377• Dom Savini @ 202 512 6841• Dom Savini @ 202-512-6841• Ross Simms @ 202-512-2512• Monica Valentine @ 202 512 7362• Monica Valentine @ 202-512-7362