Embed Size (px)
Citation preview

AFRL-RZ-WP-TP-2010-2143
HIGHLY LOADED LOW-PRESSURE TURBINE: DESIGN, NUMERICAL AND EXPERIMENTAL ANALYSIS (Preprint) J.P. Clark, P.J. Koch, and S.L. Puterbaugh
Turbine Branch Turbine Engine Division J.T. Schmitz, S.C. Morris, R. Ma, and T.C. Corke
University of Notre Dame JUNE 2010 Interim Report
Approved for public release; distribution unlimited.
See additional restrictions described on inside pages
STINFO COPY
©2010 ASME
AIR FORCE RESEARCH LABORATORY PROPULSION DIRECTORATE
WRIGHT-PATTERSON AIR FORCE BASE, OH 45433-7251 AIR FORCE MATERIEL COMMAND
UNITED STATES AIR FORCE

i
REPORT DOCUMENTATION PAGE Form Approved OMB No. 0704-0188
The public reporting burden for this collection of information is estimated to average 1 hour per response, including the time for reviewing instructions, searching existing data sources, gathering and maintaining the data needed, and completing and reviewing the collection of information. Send comments regarding this burden estimate or any other aspect of this collection of information, including suggestions for reducing this burden, to Department of Defense, Washington Headquarters Services, Directorate for Information Operations and Reports (0704-0188), 1215 Jefferson Davis Highway, Suite 1204, Arlington, VA 22202-4302. Respondents should be aware that notwithstanding any other provision of law, no person shall be subject to any penalty for failing to comply with a collection of information if it does not display a currently valid OMB control number. PLEASE DO NOT RETURN YOUR FORM TO THE ABOVE ADDRESS.
1. REPORT DATE (DD-MM-YY) 2. REPORT TYPE 3. DATES COVERED (From - To) June 2010 Conference Paper Preprint 06 June 2008 – 05 June 2010
4. TITLE AND SUBTITLE
HIGHLY LOADED LOW-PRESSURE TURBINE: DESIGN, NUMERICAL AND EXPERIMENTAL ANALYSIS (Preprint)
5a. CONTRACT NUMBER IN HOUSE
5b. GRANT NUMBER
5c. PROGRAM ELEMENT NUMBER 62203F
6. AUTHOR(S)
J.P. Clark, P.J. Koch, and S.L. Puterbaugh (Turbine Engine Division, Turbine Branch (AFRL/RZTT)) J.T. Schmitz, S.C. Morris, R. Ma, and T.C. Corke (University of Notre Dame)
5d. PROJECT NUMBER 3066
5e. TASK NUMBER 06
5f. WORK UNIT NUMBER
306606W8 7. PERFORMING ORGANIZATION NAME(S) AND ADDRESS(ES) 8. PERFORMING ORGANIZATION
REPORT NUMBER Turbine Branch (AFRL/RZTT) Turbine Engine Division, Air Force Research Laboratory, Propulsion Directorate Wright-Patterson Air Force Base, OH 45433-7251 Air Force Materiel Command United States Air Force
University of Notre Dame Dept. of Aerospace and
Mechanical Engineering
AFRL-RZ-WP-TP-2010-2143
9. SPONSORING/MONITORING AGENCY NAME(S) AND ADDRESS(ES) 10. SPONSORING/MONITORING AGENCY ACRONYM(S)
Air Force Research Laboratory Propulsion Directorate Wright-Patterson Air Force Base, OH 45433-7251 Air Force Materiel Command United States Air Force
AFRL/RZTT 11. SPONSORING/MONITORING AGENCY REPORT NUMBER(S)
AFRL-RZ-WP-TP-2009-2143
12. DISTRIBUTION/AVAILABILITY STATEMENT Approved for public release; distribution unlimited.
13. SUPPLEMENTARY NOTES PAO Case Number: 88 ABW-2009-5169; Clearance Date: 10 December 2009. ©2010 ASME. The U.S. Government is joint author of the work and has the right to use, modify, reproduce, release, perform, display, or disclose the work. To be presented at the ASME Turbo Expo: Power for Land, Sea, and Air, June 14-18, 2010, Glasgow, Scotland. Paper contains color.
14. ABSTRACT The performance and detailed flow physics of a highly loaded, transonic, low-pressure turbine stage has been investigated numerically and experimentally. The mean rotor Zweifel coefficient was 1.35, with a work coefficient of 2.8, and a total pressure ratio of 1.75. The aerodynamic design was based on recent developments in boundary layer transition modeling. Steady and unsteady numerical solutions were used to design the blade geometry as well as to predict the design and off-design performance. Measurements were acquired in a recently developed, high-speed, rotating turbine facility. The nozzle-vane only and full stage characteristics were measured with varied mass flow, Reynolds number, and free-stream turbulence. The efficiency calculated from torque at the design speed and pressure ratio of the turbine was found to be 90.6%. This compared favorably to the meanline target value of 90.5%. This paper will describe the measurements and numerical solutions in detail for both design and off-design conditions.
15. SUBJECT TERMS
turbomachinery, turbines, high lift airfoils, high work turbines 16. SECURITY CLASSIFICATION OF: 17. LIMITATION
OF ABSTRACT: SAR
18. NUMBER OF PAGES
20
19a. NAME OF RESPONSIBLE PERSON (Monitor) a. REPORT Unclassified
b. ABSTRACT Unclassified
c. THIS PAGE Unclassified
Dr. John Clark 19b. TELEPHONE NUMBER (Include Area Code)
N/A
Standard Form 298 (Rev. 8-98) Prescribed by ANSI Std. Z39-18

Proceedings of GT2010ASME TURBO EXPO: Power for Land, Sea, and Air
June 14-18, 2010, Glasgow, Scotland
DRAFT GT2010-23591
HIGHLY LOADED LOW-PRESSURE TURBINE:DESIGN, NUMERICAL, AND EXPERIMENTAL ANALYSIS
J. T. Schmitz, S. C. Morris∗, R. Ma, and T. C. CorkeDept. of Aerospace and Mechanical Engineering
University of Notre DameNotre Dame, IN, USA
Email: [email protected]
J. P. Clark, P. J. Koch, and S. L. PuterbaughPropulsion Directorate
Air Force Research LaboratoryBuilding 18, Room 136D
1950 5th St., WPAFB, OH 45433 [email protected]
ABSTRACTThe performance and detailed flow physics of a highly
loaded, transonic, low-pressure turbine stage has been investi-gated numerically and experimentally. The mean rotor Zweifelcoefficient was 1.35, with dh/U2 = 2.8, and a total pressure ra-tio of 1.75. The aerodynamic design was based on recent de-velopments in boundary layer transition modeling. Steady andunsteady numerical solutions were used to design the blade ge-ometry as well as to predict the design and off-design perfor-mance. Measurements were acquired in a recently developed,high-speed, rotating turbine facility. The nozzle-vane only andfull stage characteristics were measured with varied mass flow,Reynolds number, and free-stream turbulence. The efficiencycalculated from torque at the design speed and pressure ratio ofthe turbine was found to be 90.6%. This compared favorably tothe meanline target value of 90.5%. This paper will describe themeasurements and numerical solutions in detail for both designand off-design conditions.
NOMENCLATUREbx Rotor Axial Chordvx Vane Axial Chordcp Specific heat at constant pressureZw Incompressible Zweifel load coefficientRe Reynolds number (inlet conditions and true chord)
∗Address all correspondence to this author.
η Efficiencyh EnthalpyU Rotor VelocityA AreaN Rotor Speed (rpm)Tu Turbulence IntensityPt,in Total inlet pressureTt,in Total inlet temperatureND Notre DameHiLT Highly Loaded Turbine
INTRODUCTIONMost modern gas-turbine engines utilize a multi-shaft de-
sign with a separate high pressure turbine and low pressure (LP)turbine. The LP turbine is often used to power a low-pressurecompressor and/or fan in the case of a turbo-fan engine, or can bedirectly connected to a rotor-drive for rotary-wing and power ap-plications. The LPT is therefore an important component in thedetermination of the overall engine performance and efficiency.Current LP turbines operate with efficiencies above 90%, and socontinued increases in efficiency through better aerodynamic de-sign are difficult to obtain [1].
The LPT often has a large diameter in order to obtain themaximum possible power at a fixed rotational speed. As a re-sult, the weight of the LPT can be up 30 percent of the totalweight of an aircraft engine [2], and may contain as many as
1 Copyright c⃝ 2010 by ASME
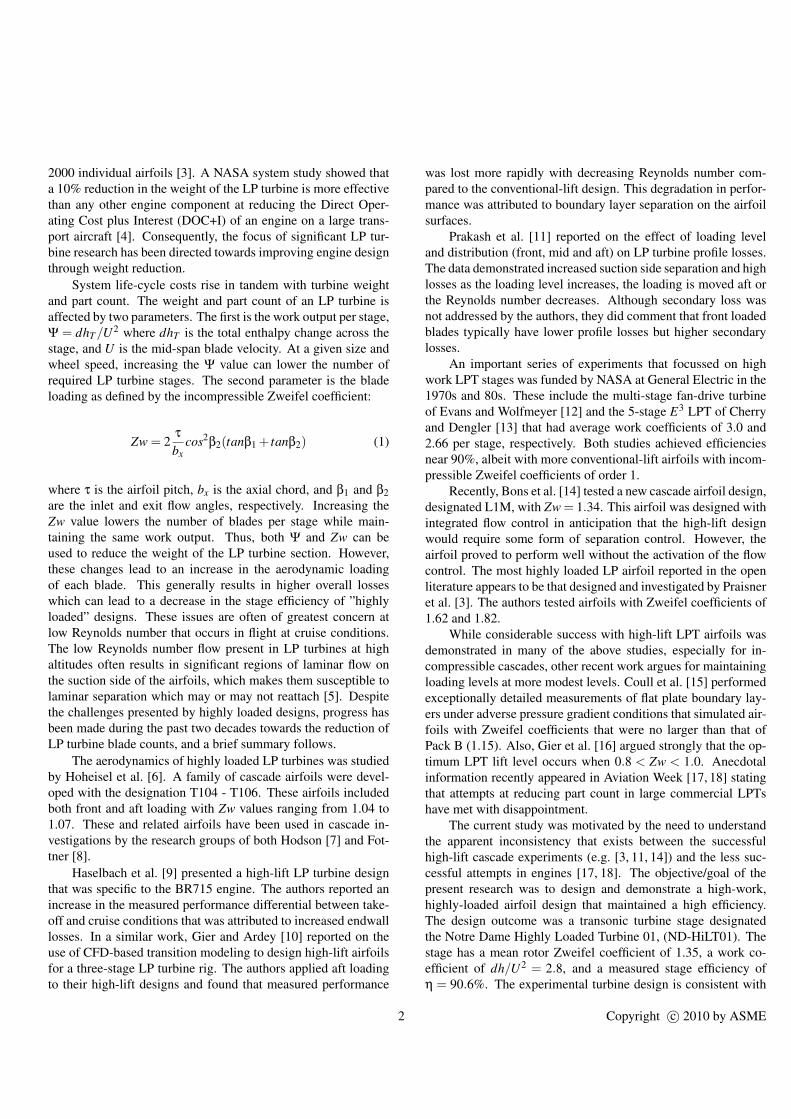
2000 individual airfoils [3]. A NASA system study showed thata 10% reduction in the weight of the LP turbine is more effectivethan any other engine component at reducing the Direct Oper-ating Cost plus Interest (DOC+I) of an engine on a large trans-port aircraft [4]. Consequently, the focus of significant LP tur-bine research has been directed towards improving engine designthrough weight reduction.
System life-cycle costs rise in tandem with turbine weightand part count. The weight and part count of an LP turbine isaffected by two parameters. The first is the work output per stage,Ψ = dhT/U2 where dhT is the total enthalpy change across thestage, and U is the mid-span blade velocity. At a given size andwheel speed, increasing the Ψ value can lower the number ofrequired LP turbine stages. The second parameter is the bladeloading as defined by the incompressible Zweifel coefficient:
Zw = 2τbx
cos2β2(tanβ1 + tanβ2) (1)
where τ is the airfoil pitch, bx is the axial chord, and β1 and β2are the inlet and exit flow angles, respectively. Increasing theZw value lowers the number of blades per stage while main-taining the same work output. Thus, both Ψ and Zw can beused to reduce the weight of the LP turbine section. However,these changes lead to an increase in the aerodynamic loadingof each blade. This generally results in higher overall losseswhich can lead to a decrease in the stage efficiency of ”highlyloaded” designs. These issues are often of greatest concern atlow Reynolds number that occurs in flight at cruise conditions.The low Reynolds number flow present in LP turbines at highaltitudes often results in significant regions of laminar flow onthe suction side of the airfoils, which makes them susceptible tolaminar separation which may or may not reattach [5]. Despitethe challenges presented by highly loaded designs, progress hasbeen made during the past two decades towards the reduction ofLP turbine blade counts, and a brief summary follows.
The aerodynamics of highly loaded LP turbines was studiedby Hoheisel et al. [6]. A family of cascade airfoils were devel-oped with the designation T104 - T106. These airfoils includedboth front and aft loading with Zw values ranging from 1.04 to1.07. These and related airfoils have been used in cascade in-vestigations by the research groups of both Hodson [7] and Fot-tner [8].
Haselbach et al. [9] presented a high-lift LP turbine designthat was specific to the BR715 engine. The authors reported anincrease in the measured performance differential between take-off and cruise conditions that was attributed to increased endwalllosses. In a similar work, Gier and Ardey [10] reported on theuse of CFD-based transition modeling to design high-lift airfoilsfor a three-stage LP turbine rig. The authors applied aft loadingto their high-lift designs and found that measured performance
was lost more rapidly with decreasing Reynolds number com-pared to the conventional-lift design. This degradation in perfor-mance was attributed to boundary layer separation on the airfoilsurfaces.
Prakash et al. [11] reported on the effect of loading leveland distribution (front, mid and aft) on LP turbine profile losses.The data demonstrated increased suction side separation and highlosses as the loading level increases, the loading is moved aft orthe Reynolds number decreases. Although secondary loss wasnot addressed by the authors, they did comment that front loadedblades typically have lower profile losses but higher secondarylosses.
An important series of experiments that focussed on highwork LPT stages was funded by NASA at General Electric in the1970s and 80s. These include the multi-stage fan-drive turbineof Evans and Wolfmeyer [12] and the 5-stage E3 LPT of Cherryand Dengler [13] that had average work coefficients of 3.0 and2.66 per stage, respectively. Both studies achieved efficienciesnear 90%, albeit with more conventional-lift airfoils with incom-pressible Zweifel coefficients of order 1.
Recently, Bons et al. [14] tested a new cascade airfoil design,designated L1M, with Zw = 1.34. This airfoil was designed withintegrated flow control in anticipation that the high-lift designwould require some form of separation control. However, theairfoil proved to perform well without the activation of the flowcontrol. The most highly loaded LP airfoil reported in the openliterature appears to be that designed and investigated by Praisneret al. [3]. The authors tested airfoils with Zweifel coefficients of1.62 and 1.82.
While considerable success with high-lift LPT airfoils wasdemonstrated in many of the above studies, especially for in-compressible cascades, other recent work argues for maintainingloading levels at more modest levels. Coull et al. [15] performedexceptionally detailed measurements of flat plate boundary lay-ers under adverse pressure gradient conditions that simulated air-foils with Zweifel coefficients that were no larger than that ofPack B (1.15). Also, Gier et al. [16] argued strongly that the op-timum LPT lift level occurs when 0.8 < Zw < 1.0. Anecdotalinformation recently appeared in Aviation Week [17, 18] statingthat attempts at reducing part count in large commercial LPTshave met with disappointment.
The current study was motivated by the need to understandthe apparent inconsistency that exists between the successfulhigh-lift cascade experiments (e.g. [3, 11, 14]) and the less suc-cessful attempts in engines [17, 18]. The objective/goal of thepresent research was to design and demonstrate a high-work,highly-loaded airfoil design that maintained a high efficiency.The design outcome was a transonic turbine stage designatedthe Notre Dame Highly Loaded Turbine 01, (ND-HiLT01). Thestage has a mean rotor Zweifel coefficient of 1.35, a work co-efficient of dh/U2 = 2.8, and a measured stage efficiency ofη = 90.6%. The experimental turbine design is consistent with
2 Copyright c⃝ 2010 by ASME

both a reduction in stage count in a gas turbine engine and a de-crease in the part count of an individual airfoil row. The test datapresented here provide further validation of the transition mod-eling system presented by Praisner and Clark [19] and Praisneret al. [20] since the same design, analysis, and modeling tech-niques used to design previous airfoils (See e.g. [14]) were usedhere. That is, the modeling techniques used previously for in-compressible cascades have been demonstrated adequate in a ro-tating, compressible environment. The following sections willoutline the design process, both steady and unsteady CFD re-sults, and a complete set of experimental measurements for theND-HiLT01 obtained in a high-speed rotating turbine rig.
LOW PRESSURE TURBINE STAGE DESIGNThe ND-HiLT01 geometry design was based on a turbine
design loop that is described in detail by Clark et al. [21] andillustrated in Fig. 1. Initially, engine cycle data were used to setthe basic parameters for the turbine (i.e. pressure ratio, rotationalspeed, and power requirements). These were used to define stagevelocity triangles through a 1D meanline design and analysis tooldeveloped by Huber (described in more detail in [21]). The 2Dairfoil profiles were created via a shape generation algorithm alsodescribed by Huber [21] and analyzed with 2- and 3-D RANScalculations. Design-optimization techniques were used at theprofile-definition level to achieve a low-loss design. The designloop was iterative, so a return to a less rigorous level of analysiswas possible as design changes were made. The current stagerequired 12 iterations through the analysis.
Cycle Requirement and Design Velocity TrianglesThe turbine stage basic cycle parameters are shown in Ta-
ble 1. The work coefficient was initially set to be 2.8, which canbe considered high relative to a state-of-the-art large commercialengine. This led to a high degree of blade turning and a targetefficiency level that was slightly above ninety percent. These de-sign targets were set mainly through considerations of the overallgoal of the program: to demonstrate acceptable aerodynamic per-formance, if possible, while reducing the effective part count ofa notional LPT.
To set the design velocity triangles of the machine, themeanline trade space was explored considering the wheel speed,airfoil Zweifel coefficients, and stage reaction. A shrouded stagewas designed and trailing-edge diameters and airfoil taper ratioswere set to constant levels that were consistent with state-of-the-art turbines. Since the main research goal of the stage was todetermine whether it was possible to achieve a high-lift (i.e. lowairfoil count) rotating airfoil design without sacrificing stage per-formance, it was decided to place all aerodynamic technologyin the blade row only with the vane row having modest designgoals. So, while the Zweifel coefficient of the blade row was set
Figure 1. Turbine design loop used to define the ND-HiLT01 stage.
to a level of 1.35, the vane row was set to 0.89 (near the optimumdefined by Gier et al [16]).
2D Profile Design, Analysis, and OptimizationAirfoil shapes for the stage were designed to meet mean-
line turning requirements using the profile generator of Huber(again, see [21]). The algorithm was similar to one describedby Casey [22] in that it used Bezier curves in conjunction withtypical leading- and trailing-edge specifications (e.g. wedge an-gles, edge radii of curvature, gage areas, and uncovered turning)to define airfoil shapes using a small number of control points.Once the profile was defined, the grid generator and RANS solverdescribed by Dorney and Davis [23] were used along with anad hoc implementation of the transition models of Praisner andClark [19] to determine airfoil performance. Graphical User In-terfaces (GUI) were employed to alter the specification of theairfoil shape as well as parameters used to define both the gen-eration of the grid and the operation of the flow solver. In ad-dition, design optimization (Sequential Quadratic Programming,SQP [24]) and design-of-experiments techniques (Latin hyper-
3 Copyright c⃝ 2010 by ASME

Table 1. Meanline Design Parameters for ND-HiLT01
Parameter Vane Blade Stage
Tt,in K 358 — —
Pt,in kPa 97.9 — —
Inlet Flow Param. [ (kg/s)K1/2
kPa ] 0.957 — —
Corrected Flow (kg/s) 5.71 — —
Work Coefficient [ ∆hU2
mean] — 2.80 —
Energy Function [ JkgK ] — 134 —
Flow Coefficient [Cx,exitUmean
] — 0.78 —
Efficiency — — 90.5
Pressure Ratio (total-total) — — 1.75
Reaction (%) — — 38N
T 1/2t,in
(rpm/K1/2) — 332 —
Corrected Speed (rpm) — 5630 —
AN2x10−6 (m rpm)2 — 3.35 —
Exit Mach Number 0.76 0.78 (rel) —
Airfoil Count 60 70 —
Zweifel Coefficient 0.88 1.35 —
Overall Turning (deg) 96 123 —
Gas Angle (deg) (inlet/exit) 26.7/69.6 54.7/67.8 49.5
cube sampling [25]) were used to define low-loss profiles withacceptable loading distributions. Each airfoil was designed as aset of 2D profiles at radii equal to the root, midspan, and tip loca-tions in the flowpath. The blade shape was also designed at 25%and 75% of span. In the course of stage design, more than 3500candidate profiles were analyzed at the 2-D RANS level in orderto achieve the final geometry.
Previous High-Lift Cascade Airfoils. The profile de-sign of the stage considered the results of several previous cas-cade studies. Specifically, a recently developed family of LP tur-bine airfoils were designed to study low Reynolds-number, high-lift aerodynamics. Several profiles of these previous designs aswell as the ND-HiLT01 profile are shown in Fig. 2. Like thecurrent stage profiles, all airfoils were designed with a combina-tion of GUI-driven design iterations and optimization techniques.All of the geometries shown were derived using the transition
modeling studies of Praisner and Clark [19]. Additionally, allthe airfoils have velocity triangles in keeping with the Pratt &Whitney Pack B geometry. A pair of airfoils was designed to anincompressible Zweifel coefficient of 1.34, and these airfoils dif-fered markedly in the loading convention used for the respectivedesigns. The first airfoil, dubbed the L1M (level one increasein lift, mid-loaded), was shown by Bons et al. [14] to have asignificantly better loss characteristics at low Reynolds numbercompared to the Pack B airfoil, while having 17% higher load-ing. The airfoil was also used by Gross and Fasel [26] as well asBons et al. [27] to assess the physics of flow control for such ahigh-lift airfoil.
Pack BL1ML1AL2FND−HiLT01
Figure 2. A family of high lift LPT airfoils designed at AFRL, as comparedto the Pack B and ND-HiLT01 profile.
More recently another airfoil called the L1A (aft-loaded)was designed to the same pitch-to-chord ratio as the L1M, andit has been studied at several universities under the NASA Fun-damental Aeronautics Program [e.g. [28], [29]] by researchersworking on various aspects of low Reynolds-number LPT flowsand/or flow control in highly-loaded LPTs. Whereas the L1Mairfoil had an exceptionally good Reynolds-lapse characteristic,the L1A airfoil was designed to have a significant degradation inperformance at low Reynolds numbers. The L1A is therefore amuch better platform for the study of flow-control physics thanthe L1M. Additionally, because it is more aft-loaded the impactof the high lift level on secondary losses is expected to be reducedrelative to that of the L1M.
The final cascade geometry designed with the current systemand tested is the L2F airfoil of McQuilling [29]. The L2F is morefront-loaded than either the L1M or the L1A airfoils, and it has39% greater lift than the Pack B airfoil at high Reynolds num-bers. This airfoil was designed to test the limits of high lift, lowReynolds-number operation enabled by increases in transition
4 Copyright c⃝ 2010 by ASME
modeling fidelity. As predicted, the airfoil did have improvedlapse characteristics over the Pack B, even at this extreme levelof loading.
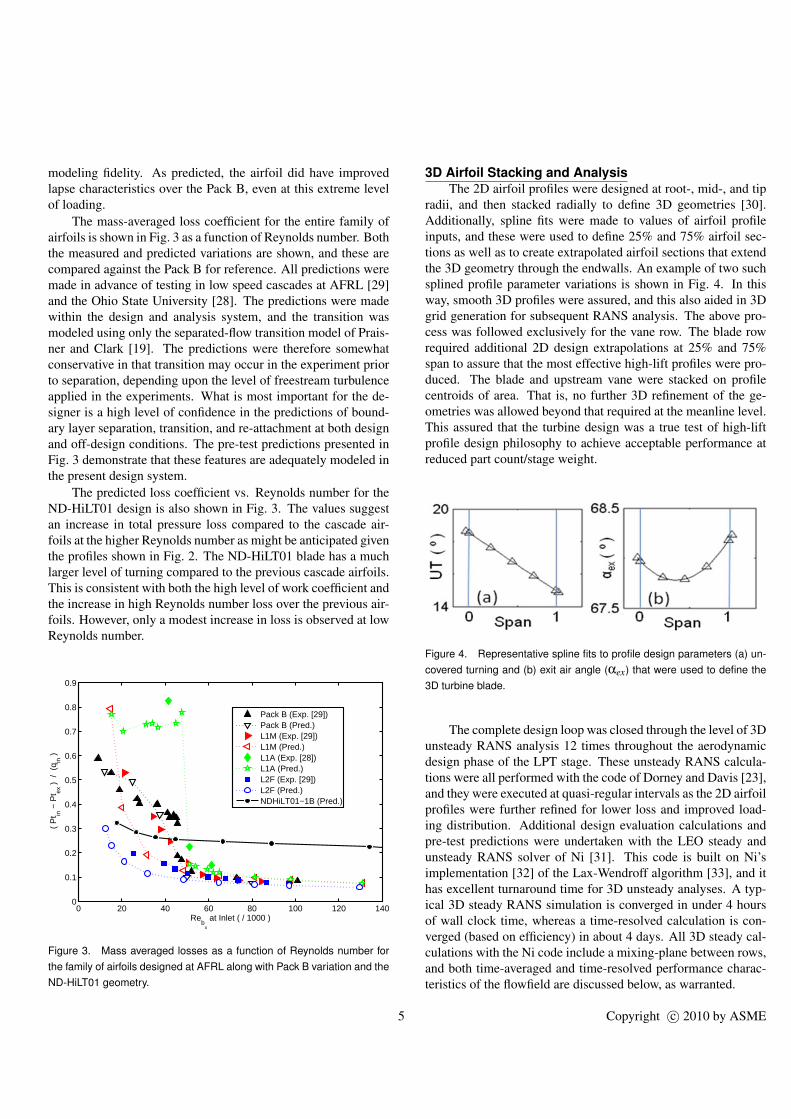
The mass-averaged loss coefficient for the entire family ofairfoils is shown in Fig. 3 as a function of Reynolds number. Boththe measured and predicted variations are shown, and these arecompared against the Pack B for reference. All predictions weremade in advance of testing in low speed cascades at AFRL [29]and the Ohio State University [28]. The predictions were madewithin the design and analysis system, and the transition wasmodeled using only the separated-flow transition model of Prais-ner and Clark [19]. The predictions were therefore somewhatconservative in that transition may occur in the experiment priorto separation, depending upon the level of freestream turbulenceapplied in the experiments. What is most important for the de-signer is a high level of confidence in the predictions of bound-ary layer separation, transition, and re-attachment at both designand off-design conditions. The pre-test predictions presented inFig. 3 demonstrate that these features are adequately modeled inthe present design system.
The predicted loss coefficient vs. Reynolds number for theND-HiLT01 design is also shown in Fig. 3. The values suggestan increase in total pressure loss compared to the cascade air-foils at the higher Reynolds number as might be anticipated giventhe profiles shown in Fig. 2. The ND-HiLT01 blade has a muchlarger level of turning compared to the previous cascade airfoils.This is consistent with both the high level of work coefficient andthe increase in high Reynolds number loss over the previous air-foils. However, only a modest increase in loss is observed at lowReynolds number.
0 20 40 60 80 100 120 1400
0.1
0.2
0.3
0.4
0.5
0.6
0.7
0.8
0.9
Reb
x
at Inlet ( / 1000 )
( P
t in −
Pt ex
) /
(q in
)
Pack B (Exp. [29])Pack B (Pred.)L1M (Exp. [29])L1M (Pred.)L1A (Exp. [28])L1A (Pred.)L2F (Exp. [29])L2F (Pred.)NDHiLT01−1B (Pred.)
Figure 3. Mass averaged losses as a function of Reynolds number forthe family of airfoils designed at AFRL along with Pack B variation and theND-HiLT01 geometry.
3D Airfoil Stacking and AnalysisThe 2D airfoil profiles were designed at root-, mid-, and tip
radii, and then stacked radially to define 3D geometries [30].Additionally, spline fits were made to values of airfoil profileinputs, and these were used to define 25% and 75% airfoil sec-tions as well as to create extrapolated airfoil sections that extendthe 3D geometry through the endwalls. An example of two suchsplined profile parameter variations is shown in Fig. 4. In thisway, smooth 3D profiles were assured, and this also aided in 3Dgrid generation for subsequent RANS analysis. The above pro-cess was followed exclusively for the vane row. The blade rowrequired additional 2D design extrapolations at 25% and 75%span to assure that the most effective high-lift profiles were pro-duced. The blade and upstream vane were stacked on profilecentroids of area. That is, no further 3D refinement of the ge-ometries was allowed beyond that required at the meanline level.This assured that the turbine design was a true test of high-liftprofile design philosophy to achieve acceptable performance atreduced part count/stage weight.
Figure 4. Representative spline fits to profile design parameters (a) un-covered turning and (b) exit air angle (αex) that were used to define the3D turbine blade.
The complete design loop was closed through the level of 3Dunsteady RANS analysis 12 times throughout the aerodynamicdesign phase of the LPT stage. These unsteady RANS calcula-tions were all performed with the code of Dorney and Davis [23],and they were executed at quasi-regular intervals as the 2D airfoilprofiles were further refined for lower loss and improved load-ing distribution. Additional design evaluation calculations andpre-test predictions were undertaken with the LEO steady andunsteady RANS solver of Ni [31]. This code is built on Ni’simplementation [32] of the Lax-Wendroff algorithm [33], and ithas excellent turnaround time for 3D unsteady analyses. A typ-ical 3D steady RANS simulation is converged in under 4 hoursof wall clock time, whereas a time-resolved calculation is con-verged (based on efficiency) in about 4 days. All 3D steady cal-culations with the Ni code include a mixing-plane between rows,and both time-averaged and time-resolved performance charac-teristics of the flowfield are discussed below, as warranted.
5 Copyright c⃝ 2010 by ASME

De-Swirler Airfoil Design Because the turbine de-signed was consistent with an embedded stage of a multi-rowLPT, the flow discharged from the turbine stage was highlyskewed, especially near the inner annulus. Also, a significantrange in air angle occurred over the span. In order to pass thisflow through a set of large struts located less than 2 annulusheights downstream of the turbine, a set of outlet guide vaneswas designed. The constraints on the design were that the axialextent of the blade row must be 66 mm or less and the inner andouter annulus walls must remain cylindrical. This design spacenecessarily resulted in very highly loaded airfoils - particularlynear the annulus ID. Fortunately, reducing total pressure loss wasnot a first order design criteria for this application. The main goalwas to reduce the swirl to a level of less than twenty degrees overthe entire span at the exit.
To meet this design goal, a streamline curvature code(UD0300M) developed by USAF [34] for compressor airfoilswas used to establish initial aerodynamic performance and gen-erate a 3D blade shape. Then, the performance of the airfoil wasassessed using 3D unsteady RANS and adjustments to the bladeshape were made using UD0300M (See the final airfoil in Fig. 1).NACA 65 series airfoils were employed and radial leading andtrailing edges were used to decrease complexity. The spanwisesolidity distribution varied from 2.6 at the ID, to 1.8 at midspan,to 1.6 at the OD (35 vanes) and the aspect ratio was approxi-mately 1. The thickness of the airfoils was 7% of chord.
The biggest challenge in the design was handling the sec-ondary flows that resulted from the highly loaded airfoils nearthe annulus ID. Initial design iterations indicated highly sepa-rated flow near the annulus ID on the airfoil suction side, someseparation on the suction surface near the leading edge towardthe annulus OD, and significant overturning near midspan due tosecondary flow. In order to improve the separation near the IDby diverting higher energy flow inward, the vane was tilted cir-cumferentially 15 degrees with the tip moving into the directionof incoming flow. The separation near the OD was improved byincreasing the leading edge airfoil thickness to 0.7% of chord. Fi-nally, the overturning near the midspan was reduced by adjustingthe deviation model in UD0300M by the amount dictated by theCFD results. Additional performance optimization was possible,but not required for the application.
EXPERIMENTAL FACILITYThe data presented in this paper were obtained from the tran-
sonic axial turbine facility at the University of Notre Dame. Thefacility was designed to accommodate a wide range of turbinestage designs. A diagram of the mechanical and flow layout ofthe turbine is shown in Figure 5. The turbine is coupled to ashaft that is levitated on active magnetic bearings. During opera-tion the bearing system held the rotor center line to ±10 micronsradially and ±5 microns axially.The turbine shaft is connected
through a torque meter to a speed reducing gearbox. The gear-box output shaft is connected to a variable speed AC motor drivewhich is connected to a centrifugal compressor. Note that themotor is in a “load-sharing” configuration such that the combi-nation of the turbine power and electrical power are used to drivethe compressor.
The flow path is a partial-closed-loop system. The airflowinto the turbine is at approximately atmospheric pressure, and adesign temperature of 95 degrees Celsius. The turbine exit flowis at sub-atmospheric pressure and nominally room temperature(depending on the design of the turbine). The flow from the tur-bine enters a settling chamber and a fast acting safety valve. Theflow then moves through a Venturi mass flow meter before enter-ing the compressor inlet. The uncertainty in the measured massflow rate based on error propagation was estimated to be ±0.3%,and was found to be repeatable to within ±0.05%. The flow thenenters the compressor, and exits at roughly atmospheric pressureand elevated temperature. The compressor utilizes variable inletand exit guide vanes. A portion of this exit air is recycled to theturbine inlet in order to maintain a constant, elevated turbine inlettemperature. A large settling chamber and inlet duct are locatedjust upstream of the test turbine. Further details of the facility aredescribed by Ma et. al [35].
Figure 5. Schematic of the Notre Dame Turbine Facility
The ND-HiLT01 stage described in the previous section wasinstalled into the facility test section. A schematic of the flowcross section is shown in Figure 6. Inlet hub and tip diametersare 0.32m and 0.43m, respectively. The respective rotor exit di-ameters are 0.33m and 0.47m. The 60 blade nozzle and 70 bladerotor were each machined from solid Aluminum forgings. Therotor design included a shroud with a 5-fin outer rim seal. Thefore and aft rim seal cavities were isolated to ensure no rim sealflows were present during testing.
Total pressure Kiel and total temperature rakes were in-stalled 2vx upstream of the stage inlet and 1bx downstream of
6 Copyright c⃝ 2010 by ASME

Figure 6. Schematic of the ND-HiLT01 Experimental Setup
the stage exit. There were 6 inlet and 8 exit, equal area spacedsensor locations. The radial position of each sensor was dupli-cated at a 180 deg offset, for a total of 12 inlet and 16 exit probes.To avoid possible heat transfer from the casing to the rakes, ny-lon inserts were used to isolate each rake from the aluminumcasing. Also, to avoid large inlet thermal boundary layers, anelectric coil heating unit preheats the stage inlet casing to matchthe inlet air temperature. The pressures were measured withan Esterline NetScanner 9816/98RK-1 pressure scanner with anoperating range of ±6.9 kPa. The temperature measurementswere acquired with a National Instruments CFP-CB-3 CompactFieldpoint unit, equipped with CFP-TC-120 modules and K-typethermocouples. The reference pressures for the differential mea-surements were acquired with Setra Model 270 absolute pressuretransducers having a range of 0-137.9 kPa. Uncertainties for thetotal pressure probe measurements due to calibration, linearity,and hysteresis are estimated to be ±0.1% of full scale range, and±0.4 K for the total temperature.
A removable, perforated plate turbulence grid was installed89mm upstream of the stage inlet. A single wire hotwireanemometer (AA Lab Systems model AN-1003) was used tomeasure the freestream turbulence intensity (FSTI). The turbu-lence scales were computed according to the methods of Bernardand Wallace [36]. The without grid FSTI and integral lengthscale without the grid were 3.0% and 12mm, respectively. Thevalues with the grid were 5.5% and 8mm.
A Torquetronics ET2350 phase shift torquemeter is installedbetween the turbine and turbine gearbox. This location, and useof magnetic bearings, allows for a measurement of the turbinetorque and speed that does not require modification due to bear-ing losses. The estimated uncertainty in torque and speed are±0.1% and ±0.04%, respectively. The power was also estimatedusing the total temperature measurements and mass flow rate,and assuming adiabatic conditions. These power values agreed to
within 0.25%, which provides an estimate for the bias errors thatmay be present in the measurements. The adiabatic and torque-based efficiency values had an overall estimated uncertainty of±0.4%. The efficiency values presented later in this paper werederived using the power estimated from the torque and rotationalspeed.
NOZZLE ANALYSISA series of nozzle-only test data were obtained at various
Reynolds numbers and two FSTI levels. The intent was to ver-ify the nozzle design and to document the characteristics of therotor inlet flow. The rotor was removed and replaced with flowpath casing parts. A Kiel total pressure probe was then traversed0.24vx downstream of the nozzle exit. This location is the nom-inal location of the rotor blades leading edge. The traverse con-sisted of 21 radial points and 0.5 degree spacing in the azimuthaldirection.
The nozzle loss was quantified with a total pressure loss co-efficient defined as
CP =PT,CL −PT,exit
QCL(2)
where CP is the wake loss coefficient, PT,CL is the inlet centerlinetotal pressure, PT,exit is the nozzle exit total pressure and QCL isthe inlet centerline dynamic pressure. These values were areaaveraged in order to provide the net loss coefficient
CP,A =1A
∫ PT,CL −PT,exit
QCLdA (3)
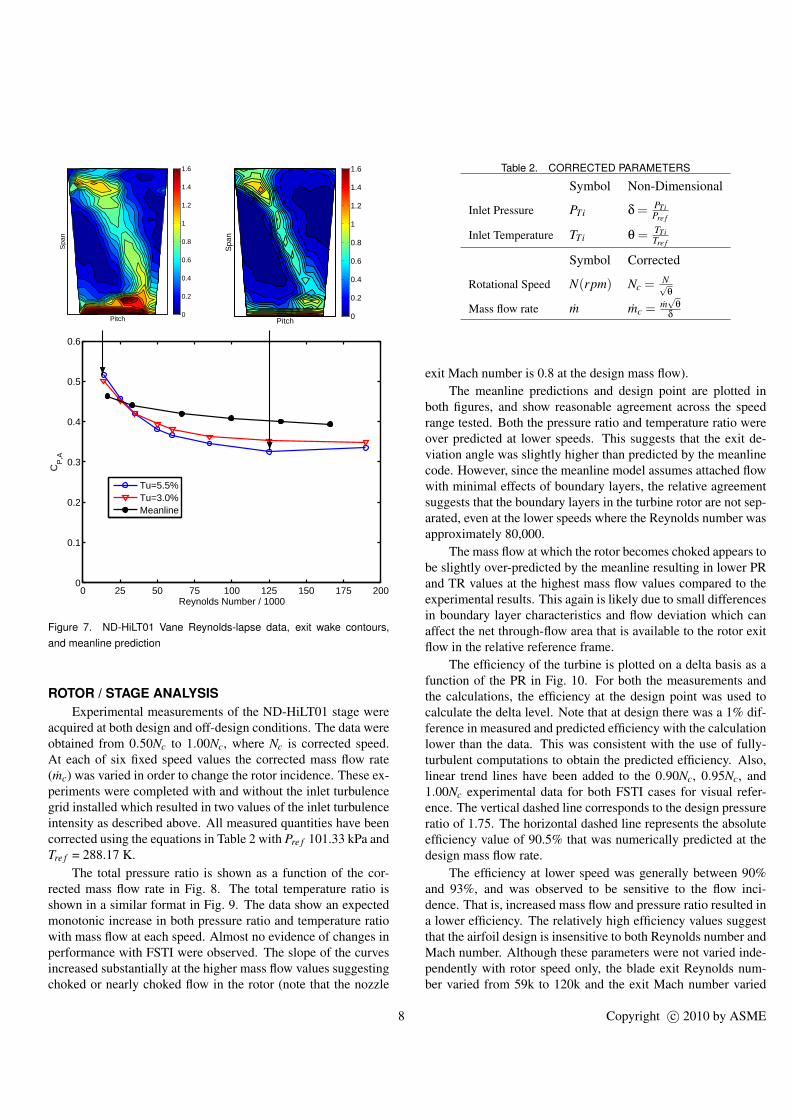
These values are shown for both inlet turbulence values as a func-tion of the Reynolds number in Fig. 7. The losses decreased byabout ∼ 30% as the Reynolds number was increased from 14,000to 190,000. The values were similar for the two turbulence inten-sity magnitudes measured, showing only a slight increase in theCP,A value for the Tu=3.0% case at higher Reynolds number. Ameanline study was conducted using the nozzle geometry. Theresults from these calculations are also shown in Fig. 7. The pre-dicted losses were higher overall, but the airfoil did not appear tobe susceptible to separation.
Two example contour plots of the wake loss coefficient areshown in the figure inset for the Re = 14,000 and 125,000 caseswith Tu=5.5%. The blade wake is well defined in both cases withthe lower Reynolds number case showing that the increase in theCP,A value is primarily due to an increase in the width of the wakeat the lower Reynolds number. Also, at all Reynolds numbers themajority of the losses were found to be concentrated in the end-wall regions, where local maxima in CP were observed. Theseare presumed to be related to the passage vortex structure as de-scribed by Langston et al. [37].
7 Copyright c⃝ 2010 by ASME
0 25 50 75 100 125 150 175 2000
0.1
0.2
0.3
0.4
0.5
0.6
Reynolds Number / 1000
CP
,A
Tu=5.5%Tu=3.0%Meanline
Pitch
Spa
n
0
0.2
0.4
0.6
0.8
1
1.2
1.4
1.6
Pitch
Spa
n
0
0.2
0.4
0.6
0.8
1
1.2
1.4
1.6
?
?
Figure 7. ND-HiLT01 Vane Reynolds-lapse data, exit wake contours,and meanline prediction
ROTOR / STAGE ANALYSISExperimental measurements of the ND-HiLT01 stage were
acquired at both design and off-design conditions. The data wereobtained from 0.50Nc to 1.00Nc, where Nc is corrected speed.At each of six fixed speed values the corrected mass flow rate(mc) was varied in order to change the rotor incidence. These ex-periments were completed with and without the inlet turbulencegrid installed which resulted in two values of the inlet turbulenceintensity as described above. All measured quantities have beencorrected using the equations in Table 2 with Pre f 101.33 kPa andTre f = 288.17 K.
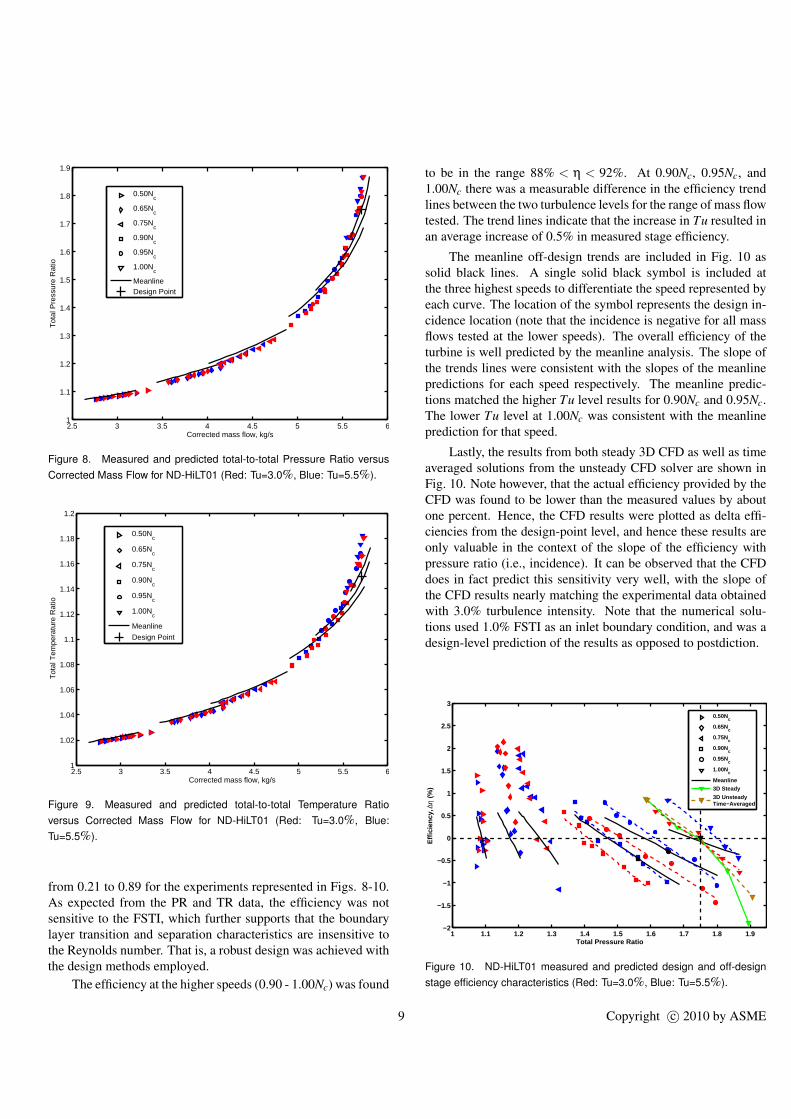
The total pressure ratio is shown as a function of the cor-rected mass flow rate in Fig. 8. The total temperature ratio isshown in a similar format in Fig. 9. The data show an expectedmonotonic increase in both pressure ratio and temperature ratiowith mass flow at each speed. Almost no evidence of changes inperformance with FSTI were observed. The slope of the curvesincreased substantially at the higher mass flow values suggestingchoked or nearly choked flow in the rotor (note that the nozzle
Table 2. CORRECTED PARAMETERS
Symbol Non-Dimensional
Inlet Pressure PTi δ = PTiPre f
Inlet Temperature TTi θ = TTiTre f
Symbol Corrected
Rotational Speed N(rpm) Nc =N√
θ
Mass flow rate m mc =m√
θδ
exit Mach number is 0.8 at the design mass flow).The meanline predictions and design point are plotted in
both figures, and show reasonable agreement across the speedrange tested. Both the pressure ratio and temperature ratio wereover predicted at lower speeds. This suggests that the exit de-viation angle was slightly higher than predicted by the meanlinecode. However, since the meanline model assumes attached flowwith minimal effects of boundary layers, the relative agreementsuggests that the boundary layers in the turbine rotor are not sep-arated, even at the lower speeds where the Reynolds number wasapproximately 80,000.
The mass flow at which the rotor becomes choked appears tobe slightly over-predicted by the meanline resulting in lower PRand TR values at the highest mass flow values compared to theexperimental results. This again is likely due to small differencesin boundary layer characteristics and flow deviation which canaffect the net through-flow area that is available to the rotor exitflow in the relative reference frame.
The efficiency of the turbine is plotted on a delta basis as afunction of the PR in Fig. 10. For both the measurements andthe calculations, the efficiency at the design point was used tocalculate the delta level. Note that at design there was a 1% dif-ference in measured and predicted efficiency with the calculationlower than the data. This was consistent with the use of fully-turbulent computations to obtain the predicted efficiency. Also,linear trend lines have been added to the 0.90Nc, 0.95Nc, and1.00Nc experimental data for both FSTI cases for visual refer-ence. The vertical dashed line corresponds to the design pressureratio of 1.75. The horizontal dashed line represents the absoluteefficiency value of 90.5% that was numerically predicted at thedesign mass flow rate.
The efficiency at lower speed was generally between 90%and 93%, and was observed to be sensitive to the flow inci-dence. That is, increased mass flow and pressure ratio resulted ina lower efficiency. The relatively high efficiency values suggestthat the airfoil design is insensitive to both Reynolds number andMach number. Although these parameters were not varied inde-pendently with rotor speed only, the blade exit Reynolds num-ber varied from 59k to 120k and the exit Mach number varied
8 Copyright c⃝ 2010 by ASME
2.5 3 3.5 4 4.5 5 5.5 61
1.1
1.2
1.3
1.4
1.5
1.6
1.7
1.8
1.9
Corrected mass flow, kg/s
Tot
al P
ress
ure
Rat
io
0.50Nc
0.65Nc
0.75Nc
0.90Nc
0.95Nc
1.00Nc
MeanlineDesign Point
Figure 8. Measured and predicted total-to-total Pressure Ratio versusCorrected Mass Flow for ND-HiLT01 (Red: Tu=3.0%, Blue: Tu=5.5%).
2.5 3 3.5 4 4.5 5 5.5 61
1.02
1.04
1.06
1.08
1.1
1.12
1.14
1.16
1.18
1.2
Corrected mass flow, kg/s
Tot
al T
empe
ratu
re R
atio
0.50Nc
0.65Nc
0.75Nc
0.90Nc
0.95Nc
1.00Nc
Meanline
Design Point
Figure 9. Measured and predicted total-to-total Temperature Ratioversus Corrected Mass Flow for ND-HiLT01 (Red: Tu=3.0%, Blue:Tu=5.5%).
from 0.21 to 0.89 for the experiments represented in Figs. 8-10.As expected from the PR and TR data, the efficiency was notsensitive to the FSTI, which further supports that the boundarylayer transition and separation characteristics are insensitive tothe Reynolds number. That is, a robust design was achieved withthe design methods employed.
The efficiency at the higher speeds (0.90 - 1.00Nc) was found
to be in the range 88% < η < 92%. At 0.90Nc, 0.95Nc, and1.00Nc there was a measurable difference in the efficiency trendlines between the two turbulence levels for the range of mass flowtested. The trend lines indicate that the increase in Tu resulted inan average increase of 0.5% in measured stage efficiency.
The meanline off-design trends are included in Fig. 10 assolid black lines. A single solid black symbol is included atthe three highest speeds to differentiate the speed represented byeach curve. The location of the symbol represents the design in-cidence location (note that the incidence is negative for all massflows tested at the lower speeds). The overall efficiency of theturbine is well predicted by the meanline analysis. The slope ofthe trends lines were consistent with the slopes of the meanlinepredictions for each speed respectively. The meanline predic-tions matched the higher Tu level results for 0.90Nc and 0.95Nc.The lower Tu level at 1.00Nc was consistent with the meanlineprediction for that speed.
Lastly, the results from both steady 3D CFD as well as timeaveraged solutions from the unsteady CFD solver are shown inFig. 10. Note however, that the actual efficiency provided by theCFD was found to be lower than the measured values by aboutone percent. Hence, the CFD results were plotted as delta effi-ciencies from the design-point level, and hence these results areonly valuable in the context of the slope of the efficiency withpressure ratio (i.e., incidence). It can be observed that the CFDdoes in fact predict this sensitivity very well, with the slope ofthe CFD results nearly matching the experimental data obtainedwith 3.0% turbulence intensity. Note that the numerical solu-tions used 1.0% FSTI as an inlet boundary condition, and was adesign-level prediction of the results as opposed to postdiction.
1 1.1 1.2 1.3 1.4 1.5 1.6 1.7 1.8 1.9−2
−1.5
−1
−0.5
0
0.5
1
1.5
2
2.5
3
Total Pressure Ratio
Effi
cien
cy,
∆η (
%)
0.50Nc
0.65Nc
0.75Nc
0.90Nc
0.95Nc
1.00Nc
Meanline3D Steady
3D UnsteadyTime−Averaged
Figure 10. ND-HiLT01 measured and predicted design and off-designstage efficiency characteristics (Red: Tu=3.0%, Blue: Tu=5.5%).
9 Copyright c⃝ 2010 by ASME
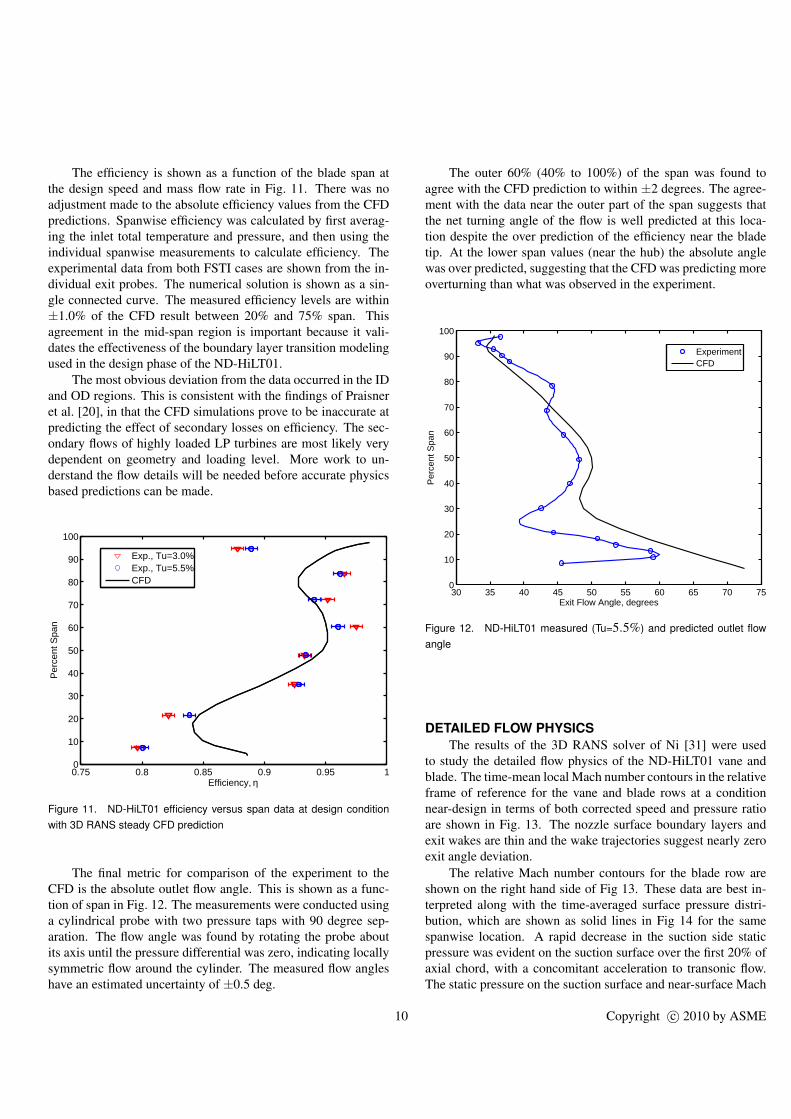
The efficiency is shown as a function of the blade span atthe design speed and mass flow rate in Fig. 11. There was noadjustment made to the absolute efficiency values from the CFDpredictions. Spanwise efficiency was calculated by first averag-ing the inlet total temperature and pressure, and then using theindividual spanwise measurements to calculate efficiency. Theexperimental data from both FSTI cases are shown from the in-dividual exit probes. The numerical solution is shown as a sin-gle connected curve. The measured efficiency levels are within±1.0% of the CFD result between 20% and 75% span. Thisagreement in the mid-span region is important because it vali-dates the effectiveness of the boundary layer transition modelingused in the design phase of the ND-HiLT01.
The most obvious deviation from the data occurred in the IDand OD regions. This is consistent with the findings of Praisneret al. [20], in that the CFD simulations prove to be inaccurate atpredicting the effect of secondary losses on efficiency. The sec-ondary flows of highly loaded LP turbines are most likely verydependent on geometry and loading level. More work to un-derstand the flow details will be needed before accurate physicsbased predictions can be made.
0.75 0.8 0.85 0.9 0.95 10
10
20
30
40
50
60
70
80
90
100
Efficiency, η
Per
cent
Spa
n
Exp., Tu=3.0%Exp., Tu=5.5%CFD
Figure 11. ND-HiLT01 efficiency versus span data at design conditionwith 3D RANS steady CFD prediction
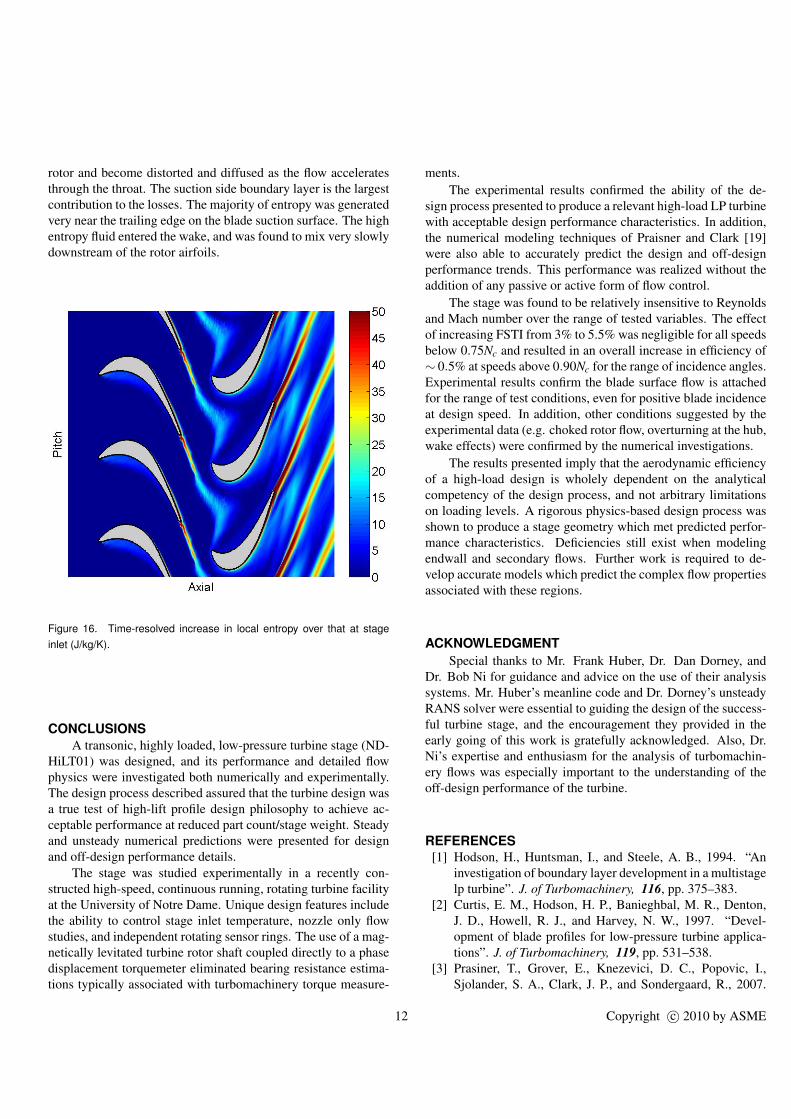
The final metric for comparison of the experiment to theCFD is the absolute outlet flow angle. This is shown as a func-tion of span in Fig. 12. The measurements were conducted usinga cylindrical probe with two pressure taps with 90 degree sep-aration. The flow angle was found by rotating the probe aboutits axis until the pressure differential was zero, indicating locallysymmetric flow around the cylinder. The measured flow angleshave an estimated uncertainty of ±0.5 deg.
The outer 60% (40% to 100%) of the span was found toagree with the CFD prediction to within ±2 degrees. The agree-ment with the data near the outer part of the span suggests thatthe net turning angle of the flow is well predicted at this loca-tion despite the over prediction of the efficiency near the bladetip. At the lower span values (near the hub) the absolute anglewas over predicted, suggesting that the CFD was predicting moreoverturning than what was observed in the experiment.
30 35 40 45 50 55 60 65 70 750
10
20
30
40
50
60
70
80
90
100
Exit Flow Angle, degrees
Per
cent
Spa
n
ExperimentCFD
Figure 12. ND-HiLT01 measured (Tu=5.5%) and predicted outlet flowangle
DETAILED FLOW PHYSICSThe results of the 3D RANS solver of Ni [31] were used
to study the detailed flow physics of the ND-HiLT01 vane andblade. The time-mean local Mach number contours in the relativeframe of reference for the vane and blade rows at a conditionnear-design in terms of both corrected speed and pressure ratioare shown in Fig. 13. The nozzle surface boundary layers andexit wakes are thin and the wake trajectories suggest nearly zeroexit angle deviation.
The relative Mach number contours for the blade row areshown on the right hand side of Fig 13. These data are best in-terpreted along with the time-averaged surface pressure distri-bution, which are shown as solid lines in Fig 14 for the samespanwise location. A rapid decrease in the suction side staticpressure was evident on the suction surface over the first 20% ofaxial chord, with a concomitant acceleration to transonic flow.The static pressure on the suction surface and near-surface Mach
10 Copyright c⃝ 2010 by ASME

Figure 13. Time-mean Mach number contours at 74% span at 99% de-sign speed and a total-to-total pressure ratio of 1.75.
number were observed to be nearly constant from 20% to 80%of axial chord. Note that there was no sharp local minima inthe suction side pressure distribution, and the pressure is roughlyconstant over the uncovered portion of suction surface from 60%to 80% of axial chord. At higher pressure ratios, there is a decel-eration of the flow downstream of the point of minimum pressurethat is associated with a weak cross-passage shock wave. Thesuction side pressure did increase gradually to the trailing edge,and was accompanied by some boundary layer growth. This leadto a deviation angle of 1.7 degrees, but no flow separation.
The pressure side passage Mach number was less than 0.2for 50% of blade pitch, with a mean pressure distribution thatwas nearly uniform over the first 60% of axial chord. Near thetrailing edge of the turbine the flow was observed to be transonicover the entire throat, which is in agreement with the large slopeobserved in Fig. 8 and 9 at high corrected flow suggesting chokedflow.
The peak-to-peak unsteady surface pressure is shown inFig 14 as dashed lines around the mean pressure data. A Fourieranalysis of the time series indicated that over 95% of the RMS ofthe unsteady pressure was found at the vane-passing frequency.Contours of the unsteady loading evaluated at this frequency areshown in Fig. 15 for both the pressure and suction sides of the air-foil. The largest contribution to the unsteady loading was foundon the suction side of the airfoil near the outer half of the span,and between 20% and 30% of axial chord. Additional analysisusing space-time correlations of the surface pressure indicatedthat the disturbances that led to the unsteadiness traveled with a
0 0.1 0.2 0.3 0.4 0.5 0.6 0.7 0.8 0.9 1
0.3
0.5
0.6
0.7
0.8
0.9
1
1.1
x / bx
P /
Pt,i
n
PR = 1.59PR = 1.75PR = 1.91
Figure 14. Unsteady loading variations at 99% speed. Solid lines aretime-mean variations and dashed lines are peak-to-peak variations over2 vane passings at 74% span on the blade.
time scale proportional to the fluid convection speed. This fur-ther suggests that the unsteadiness was simply wake passing, andnot a compressible (i.e., acoustic or shock-induced) effect.
Figure 15. Unsteady pressure magnitudes normalized by stage-inlet to-tal pressure at the fundamental upstream vane-passing frequency (L:Pressure side, R: Suction side.
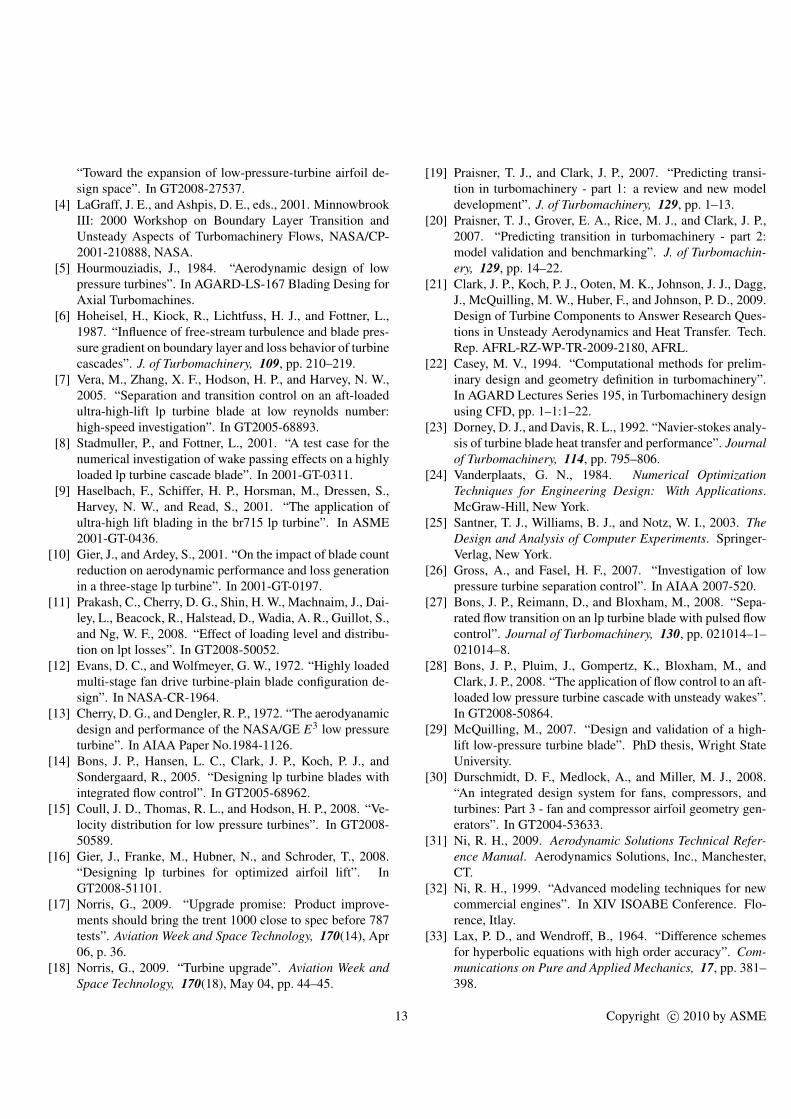
Contours of time-resolved increase in entropy over stage in-let conditions are shown in Fig. 16 which illustrate the wakeinteractions with the rotor blades. These results show how thelosses generated in the vane and blade rows are distributed atone instant. The vane wakes were observed to convect into the
11 Copyright c⃝ 2010 by ASME
rotor and become distorted and diffused as the flow acceleratesthrough the throat. The suction side boundary layer is the largestcontribution to the losses. The majority of entropy was generatedvery near the trailing edge on the blade suction surface. The highentropy fluid entered the wake, and was found to mix very slowlydownstream of the rotor airfoils.
Figure 16. Time-resolved increase in local entropy over that at stageinlet (J/kg/K).
CONCLUSIONSA transonic, highly loaded, low-pressure turbine stage (ND-
HiLT01) was designed, and its performance and detailed flowphysics were investigated both numerically and experimentally.The design process described assured that the turbine design wasa true test of high-lift profile design philosophy to achieve ac-ceptable performance at reduced part count/stage weight. Steadyand unsteady numerical predictions were presented for designand off-design performance details.
The stage was studied experimentally in a recently con-structed high-speed, continuous running, rotating turbine facilityat the University of Notre Dame. Unique design features includethe ability to control stage inlet temperature, nozzle only flowstudies, and independent rotating sensor rings. The use of a mag-netically levitated turbine rotor shaft coupled directly to a phasedisplacement torquemeter eliminated bearing resistance estima-tions typically associated with turbomachinery torque measure-
ments.The experimental results confirmed the ability of the de-
sign process presented to produce a relevant high-load LP turbinewith acceptable design performance characteristics. In addition,the numerical modeling techniques of Praisner and Clark [19]were also able to accurately predict the design and off-designperformance trends. This performance was realized without theaddition of any passive or active form of flow control.
The stage was found to be relatively insensitive to Reynoldsand Mach number over the range of tested variables. The effectof increasing FSTI from 3% to 5.5% was negligible for all speedsbelow 0.75Nc and resulted in an overall increase in efficiency of∼ 0.5% at speeds above 0.90Nc for the range of incidence angles.Experimental results confirm the blade surface flow is attachedfor the range of test conditions, even for positive blade incidenceat design speed. In addition, other conditions suggested by theexperimental data (e.g. choked rotor flow, overturning at the hub,wake effects) were confirmed by the numerical investigations.
The results presented imply that the aerodynamic efficiencyof a high-load design is wholely dependent on the analyticalcompetency of the design process, and not arbitrary limitationson loading levels. A rigorous physics-based design process wasshown to produce a stage geometry which met predicted perfor-mance characteristics. Deficiencies still exist when modelingendwall and secondary flows. Further work is required to de-velop accurate models which predict the complex flow propertiesassociated with these regions.
ACKNOWLEDGMENTSpecial thanks to Mr. Frank Huber, Dr. Dan Dorney, and
Dr. Bob Ni for guidance and advice on the use of their analysissystems. Mr. Huber’s meanline code and Dr. Dorney’s unsteadyRANS solver were essential to guiding the design of the success-ful turbine stage, and the encouragement they provided in theearly going of this work is gratefully acknowledged. Also, Dr.Ni’s expertise and enthusiasm for the analysis of turbomachin-ery flows was especially important to the understanding of theoff-design performance of the turbine.
REFERENCES[1] Hodson, H., Huntsman, I., and Steele, A. B., 1994. “An
investigation of boundary layer development in a multistagelp turbine”. J. of Turbomachinery, 116, pp. 375–383.
[2] Curtis, E. M., Hodson, H. P., Banieghbal, M. R., Denton,J. D., Howell, R. J., and Harvey, N. W., 1997. “Devel-opment of blade profiles for low-pressure turbine applica-tions”. J. of Turbomachinery, 119, pp. 531–538.
[3] Prasiner, T., Grover, E., Knezevici, D. C., Popovic, I.,Sjolander, S. A., Clark, J. P., and Sondergaard, R., 2007.
12 Copyright c⃝ 2010 by ASME
“Toward the expansion of low-pressure-turbine airfoil de-sign space”. In GT2008-27537.
[4] LaGraff, J. E., and Ashpis, D. E., eds., 2001. MinnowbrookIII: 2000 Workshop on Boundary Layer Transition andUnsteady Aspects of Turbomachinery Flows, NASA/CP-2001-210888, NASA.
[5] Hourmouziadis, J., 1984. “Aerodynamic design of lowpressure turbines”. In AGARD-LS-167 Blading Desing forAxial Turbomachines.
[6] Hoheisel, H., Kiock, R., Lichtfuss, H. J., and Fottner, L.,1987. “Influence of free-stream turbulence and blade pres-sure gradient on boundary layer and loss behavior of turbinecascades”. J. of Turbomachinery, 109, pp. 210–219.
[7] Vera, M., Zhang, X. F., Hodson, H. P., and Harvey, N. W.,2005. “Separation and transition control on an aft-loadedultra-high-lift lp turbine blade at low reynolds number:high-speed investigation”. In GT2005-68893.
[8] Stadmuller, P., and Fottner, L., 2001. “A test case for thenumerical investigation of wake passing effects on a highlyloaded lp turbine cascade blade”. In 2001-GT-0311.
[9] Haselbach, F., Schiffer, H. P., Horsman, M., Dressen, S.,Harvey, N. W., and Read, S., 2001. “The application ofultra-high lift blading in the br715 lp turbine”. In ASME2001-GT-0436.
[10] Gier, J., and Ardey, S., 2001. “On the impact of blade countreduction on aerodynamic performance and loss generationin a three-stage lp turbine”. In 2001-GT-0197.
[11] Prakash, C., Cherry, D. G., Shin, H. W., Machnaim, J., Dai-ley, L., Beacock, R., Halstead, D., Wadia, A. R., Guillot, S.,and Ng, W. F., 2008. “Effect of loading level and distribu-tion on lpt losses”. In GT2008-50052.
[12] Evans, D. C., and Wolfmeyer, G. W., 1972. “Highly loadedmulti-stage fan drive turbine-plain blade configuration de-sign”. In NASA-CR-1964.
[13] Cherry, D. G., and Dengler, R. P., 1972. “The aerodyanamicdesign and performance of the NASA/GE E3 low pressureturbine”. In AIAA Paper No.1984-1126.
[14] Bons, J. P., Hansen, L. C., Clark, J. P., Koch, P. J., andSondergaard, R., 2005. “Designing lp turbine blades withintegrated flow control”. In GT2005-68962.
[15] Coull, J. D., Thomas, R. L., and Hodson, H. P., 2008. “Ve-locity distribution for low pressure turbines”. In GT2008-50589.
[16] Gier, J., Franke, M., Hubner, N., and Schroder, T., 2008.“Designing lp turbines for optimized airfoil lift”. InGT2008-51101.
[17] Norris, G., 2009. “Upgrade promise: Product improve-ments should bring the trent 1000 close to spec before 787tests”. Aviation Week and Space Technology, 170(14), Apr06, p. 36.
[18] Norris, G., 2009. “Turbine upgrade”. Aviation Week andSpace Technology, 170(18), May 04, pp. 44–45.
[19] Praisner, T. J., and Clark, J. P., 2007. “Predicting transi-tion in turbomachinery - part 1: a review and new modeldevelopment”. J. of Turbomachinery, 129, pp. 1–13.
[20] Praisner, T. J., Grover, E. A., Rice, M. J., and Clark, J. P.,2007. “Predicting transition in turbomachinery - part 2:model validation and benchmarking”. J. of Turbomachin-ery, 129, pp. 14–22.
[21] Clark, J. P., Koch, P. J., Ooten, M. K., Johnson, J. J., Dagg,J., McQuilling, M. W., Huber, F., and Johnson, P. D., 2009.Design of Turbine Components to Answer Research Ques-tions in Unsteady Aerodynamics and Heat Transfer. Tech.Rep. AFRL-RZ-WP-TR-2009-2180, AFRL.
[22] Casey, M. V., 1994. “Computational methods for prelim-inary design and geometry definition in turbomachinery”.In AGARD Lectures Series 195, in Turbomachinery designusing CFD, pp. 1–1:1–22.
[23] Dorney, D. J., and Davis, R. L., 1992. “Navier-stokes analy-sis of turbine blade heat transfer and performance”. Journalof Turbomachinery, 114, pp. 795–806.
[24] Vanderplaats, G. N., 1984. Numerical OptimizationTechniques for Engineering Design: With Applications.McGraw-Hill, New York.
[25] Santner, T. J., Williams, B. J., and Notz, W. I., 2003. TheDesign and Analysis of Computer Experiments. Springer-Verlag, New York.
[26] Gross, A., and Fasel, H. F., 2007. “Investigation of lowpressure turbine separation control”. In AIAA 2007-520.
[27] Bons, J. P., Reimann, D., and Bloxham, M., 2008. “Sepa-rated flow transition on an lp turbine blade with pulsed flowcontrol”. Journal of Turbomachinery, 130, pp. 021014–1–021014–8.
[28] Bons, J. P., Pluim, J., Gompertz, K., Bloxham, M., andClark, J. P., 2008. “The application of flow control to an aft-loaded low pressure turbine cascade with unsteady wakes”.In GT2008-50864.
[29] McQuilling, M., 2007. “Design and validation of a high-lift low-pressure turbine blade”. PhD thesis, Wright StateUniversity.
[30] Durschmidt, D. F., Medlock, A., and Miller, M. J., 2008.“An integrated design system for fans, compressors, andturbines: Part 3 - fan and compressor airfoil geometry gen-erators”. In GT2004-53633.
[31] Ni, R. H., 2009. Aerodynamic Solutions Technical Refer-ence Manual. Aerodynamics Solutions, Inc., Manchester,CT.
[32] Ni, R. H., 1999. “Advanced modeling techniques for newcommercial engines”. In XIV ISOABE Conference. Flo-rence, Itlay.
[33] Lax, P. D., and Wendroff, B., 1964. “Difference schemesfor hyperbolic equations with high order accuracy”. Com-munications on Pure and Applied Mechanics, 17, pp. 381–398.
13 Copyright c⃝ 2010 by ASME

[34] Law, C. H., and Puterbaugh, S. L., 1982. A ComputerProgram for Axial Compressor Design (UD0300M). Tech.Rep. AFWAL-TR-82-2074, AFRL.
[35] Ma, R., Morris, S. C., and Corke, T. C., 2006. “Design of atransonic research turbine facility”. In AIAA 2006-1311.
[36] Bernard, P., and Wallace, J., 2002. Turbulent Flow: Anal-ysis, Measurement, and Prediction. John Wiley and Sons,Inc., Hoboken, New Jersey.
[37] Langston, L. S., Nice, M. L., and Hooper, R. M., 1977.“Three-dimensional flow in a turbine cascade passage”.ASME Journal of Engineering for Power, 99(1).
14 Copyright c⃝ 2010 by ASME