Embed Size (px)
Citation preview
ii
AFRICAN DEVELOPMENT BANK GROUP
UNION OF THE COMOROS
COUNTRY STRATEGY PAPER
2011-2015
November 2011
Task Team
Steve KAYIZZI-MUGERWA, Regional Director, OREB
Solomane KONE, Lead Economist, OREB
Donatien KOUASSI, Principal Programme Officer, OREB
Philippe TRAPE, Senior Country Economist (Task Manager), OREB
Peer Reviewers
Alain Fabrice EKPO, Principal Macroeconomist, OSGE 1
Korka DIALLO, Principal Programme Officer, ORWA
Kalidou DIALLO, Senior Country Economist, ORCE
Toussaint HOUENINVO, Principal Country Economist, ORWB
iii
Table of Contents Page Acronyms, Abbreviations and Currency Equivalents v
I. INTRODUCTION…………………………………………………............ 1
II COUNTRY CONTEXT AND PROSPECTS………................................ 1
2.1. Political, Economic and Social Context…………………..……………… 1
2.1.1 Political Context……….………………………………………........... 1
2.1.2 Economic Context………..…………………………………………... 2
2.1.3 Social and Crosscutting Aspects……………………………………... 8
2.2 Strategic Options………………………………………………………….. 9
2.2.1 Country Strategic Framework………………………………………... 9
2.2.2 Challenges and Weaknesses………………………………………….. 9
2.2.3 Strengths and Opportunities………………………………………...... 10
2.3 Recent Aid Coordination/Harmonization Developments and Bank
Group’s Current Positioning………...........................................................
11
2.3.1 Aid Coordination………………………………………………........... 11
2.3.2 Bank’s Positioning in the Country…………………………………… 12
2.3.3 Assessment and Lessons from Previous Strategy………………….. 13
III. BANK GROUP STRATEGY FOR COMOROS FOR 2011-2015……... 14
3.1 Rationale for Bank Group’s Involvement……………….......................... 14
3.2 Pillar for Bank Group Strategy………………………………………….. 15
3.3 Deliverables and Targets…………………………………………............. 16
3.4 Potential Risks and Mitigation Measures….……………………………. 18
3.5 Monitoring and Evaluation…………………………………………......... 18
IV. CONCLUSIONS AND RECOMMENDATIONS………………………. 18
Bibliography……………………………………………………………………………… 20
iv
List of Tables, Graphs and Boxes
Table 1 Export Trend, 2008-2010 ……………………………………………………. 3
Table 2 Agricultural Production Trend 2007-2010…………………………………… 3
Table 3 Selected Macroeconomic Indicators………………………………………….. 4
Table 4 Key Public Finance Indicators………………………………………………... 5
Table 5 Trend of Governance Indicators in the Indian Ocean (1998-2010)…………... 6
Table 6 Business Climate in the Indian Ocean………………………………………... 7
Graph 1 Real GDP Growth Rate (%)………………………………………………….. 2
Graph 2 Population Growth Trend…………………………………………………….. 2
Graph 3 GDP Breakdown in 2010……………………………………………………... 3
Graph 4 Inflation Rate Trend…………………………………………………………... 4
Box 1 Energy Constraint in the Comoros 10
Box 2 Bank’s Support to Economic Reforms and Institutional Capacity Building in
the Comoros…………………………………………………………………...
14
Box 3 Consultation with Stakeholders………………………………………………. 17
List of Annexes
Annex 1 2011-2015 CSP Results Framework………………………………………….. 23
Annex 2 Bank’s Indicative Program for 2011-2015…………………………………… 24
Annex 3 Comoros - MDG Status………………………………………………………. 25
Annex 4 Portfolio Performance Review and Status of Bank’s Operations……………. 28
Annex 5 Rationale for Use of FSF Resources to Support Reforms……………………. 35
Annex 6 Breakdown of Commitments of Main Multilateral and Bilateral Partners…... 38
Annex 7 Comparative Socio-Economic Indicators…………………………………….. 39
Annex 8 Key Macroeconomic Indicators………………………………………………. 40
Annex 9 Map of the Comoros………………………………………………………….. 41
v
Acronyms, Abbreviations and Currency Equivalents
ADB African Development Bank
ADF African Development Fund
AFD French Development Agency
ALSF African Legal Support Facility
AU African Union
AWF African Water Facility
BCC Central Bank of the Comoros
BPW Building and Public Works
CAR Commitments at Risk
CCG Comoro Combined Group
CCIA Chamber of Commerce, Industry and Agriculture
CET Common External Tariff
CGH Comoro Gulf Holding
CGP General Planning Commission
COMESA Common Market for Eastern and Southern Africa
CSP Country Strategy Paper
DWSSP Drinking Water Supply and Sanitation Project
ECF Extended Credit Facility
EDA Anjouan Power Utility
EIM Comprehensive Household Survey
EPCA Emergency Post-Conflict Assistance
EU European Union
FSF Fragile States Facility
GDP Gross Domestic Product
GEF Global Environment Facility
HDI Human Development Index
HIPCI Heavily Indebted Poor Countries’ Initiative
ICP International Comparison Programme ICT Information and Communication Technologies
I-CSP Interim Country Strategy Paper
ILO International Labour Organization
IMF International Monetary Fund
IOC Indian Ocean Commission
KMF Comorian Franc
LCE Law on Economic Citizenship
MDG Millennium Development Goals
MDRI Multilateral Debt Relief Initiative
MSME Micro-, Small- and Medium-Sized Enterprise
MTS Medium-Term Strategy
NAPCC National Action Plan on Climate Change
PAR Portfolio at Risk
PAREGF Economic Reform Support and Financial Governance Programme PFM Public Finance Management
PMU Project Management Unit
PPIP Portfolio Performance Improvement Plan
PPP Public-Private Partnership
PRCI Institutional Capacity Building Project
PRGS Poverty Reduction and Growth Strategy
RISP Regional Integration Strategy Paper
RWSSI Rural Water Supply and Sanitation Initiative
SNAC National Union of Comorian Farmers
UA Unit of Account
vi
UNDP United Nations Development Programme
UNEP United Nations Environment Programme
UNICEF United Nations Children’s Fund
USD
VAT
United States Dollar
Value-Added Tax.
Currency Equivalents, April 2011
UA 1= KMF 560.96
EUR 1 = USD 1.36
EUR 1 = KMF 491.97
Fiscal Year
1 January - 31 December
This report was prepared following a dialogue mission from 10 to 18 September 2011 led by Mr. Steve
KAYIZZI-MUGERWA, Regional Director, East Africa II (OREB), it included Mr. Philippe TRAPE, Senior
Country Economist for the Comoros, OREB, Mr. Donatien KOUASSI, Principal Programme Officer, OREB
and Mrs. Anouchka NICOLET, Principal Financial Analyst, OSFU participated. Messrs. Solomane KONE,
Lead Economist, OREB, Koffi Marc KOUAKOU and Nirina LETSARA, Statisticians, ESTA, Michel
MALLBERG, Principal Economist, OSGE and Jean Louis KROMER, Principal Natural Resources Management
Officer, OSAN, also contributed to the report preparation. The content of this strategy was discussed with the
Comorian authorities at a workshop held in Moroni on 12 September 2011 and has been shared with the
Comorian civil society and private sector representatives.

1
I. INTRODUCTION
1.1 The Comoros provides a good
illustration of the challenges and
opportunities facing countries emerging
from domestic crisis and the
capacity/determination of the international
community to effectively assist them.
1.2 Following the Bank’s re-
engagement in the Comoros in 2009, the
previous 2009-2010 Interim Country
Strategy Paper (I-CSP) was designed as a
flexible and rapid intervention instrument to
effectively address the post-crisis situations
characterized by institutional, economic and
financial fragility. The I-CSP was also
designed as a transitional instrument aimed
at supporting and building the
Government’s capacity to update its 2009-
2014 Poverty Reduction and Growth
Strategy (PRGS).
1.3 To that end, and in order to meet
the country’s many needs, the Bank Group
focused the I-CSP on two pillars: (i)
building economic and financial
governance capacity; and (ii) support to the
drinking water supply and sanitation
strategy.
1.4 Over the period covered by the I-
CSP, the Comoros made progress in the
areas of macroeconomic management and
growth, with development partner support.
However, the situation of fragility persists
and the progress made remains insufficient
as a basis for a sustainable and long-lasting
development process. In this context, the
Comoros is unlikely to achieve the bulk of
the Millennium Development Goals
(MDG).
1.5 Moreover, the macroeconomic
management and governance efforts should
be strengthened. The Comoros must also
speed up actions aimed at creating the
appropriate conditions for a structural
change in the economy, in particular by
improving the business climate and
establishing strategic infrastructure.
1.6 This 2011-2015 CSP, which will
cover the ADF-12 cycle and part of the
ADF-13 cycle, is aligned with the Poverty
Reduction and Growth Strategy (PRGS). It
aims to provide an adequate, targeted
response to the country’s many challenges
in order to consolidate peace, diversify the
economy and create jobs. Its
implementation will also benefit from the
resources of Pillar 1 of the Fragile States
Facility (FEF), the Comoros’ eligibility for
which was approved by the Boards in
September 20111.
II. COUNTRY CONTEXT AND
PROSPECTS
2.1 Political, Economic and Social
Context
2.1.1 Political Context
2.1.1.1 Over the 1997-2007 period, the
Comoros faced a major political and
economic crisis which contributed to the
country’s international isolation, the
migration of young people and the
reversion to the informal sector and
subsistence activities. The end of the
Anjouan separatist crisis in 2007 laid the
foundations for the gradual normalization
of political life in the country after more
than a decade marked by a serious
institutional crisis.
2.1.1.2 However, this process was put to
the test following the decision taken by
President Ahmed Abdallah Sambi to extend
his term of office which expired on 26 May
2010 by an additional eighteen (18) months
after a disputed constitutional reform and an
opposition boycott of Congress. In
particular, this reform aimed at ensuring
that the election of the President of the
Union coincided with that of the Governors
of the three islands (Grande Comore,
Anjouan and Moheli) on 27 November
2011.
1 Refer to: ‘Second Cycle Assessment for
Eligibility of Countries to the Fragile States Facility
(FSF) Supplemental Support Funding’ – Revised
Version (ADB/BD/WP/2011/120/Rev.1 and
ADF/BD/WP/2011/74/Rev.1)
2
2.1.1.3 Following African Union (AU)
mediation, an agreement was reached
between the parties to hold the Presidential
election on 27 December 2010. The winner
was Ikililou Dhoinine, outgoing Vice-
President of the Union, who was officially
sworn in on 26 May 2011. A new
Government was appointed by Decree on 1
June 2011.
2.1.2 Economic Context
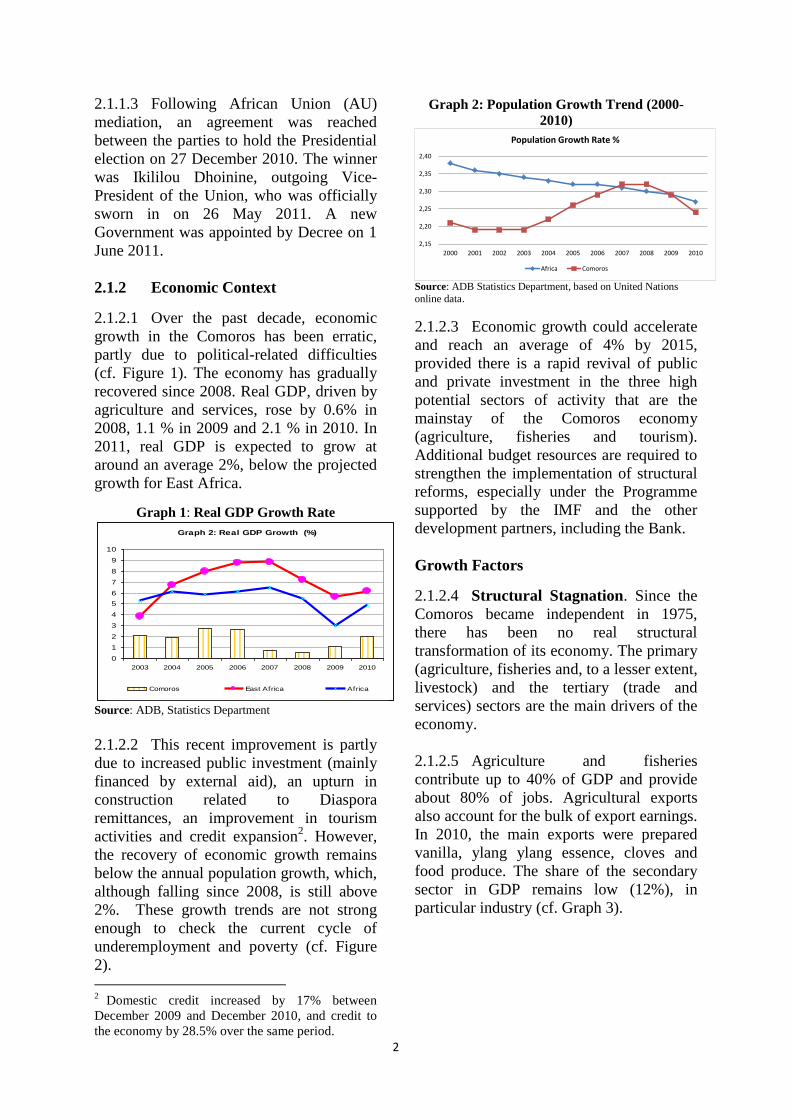
2.1.2.1 Over the past decade, economic
growth in the Comoros has been erratic,
partly due to political-related difficulties
(cf. Figure 1). The economy has gradually
recovered since 2008. Real GDP, driven by
agriculture and services, rose by 0.6% in
2008, 1.1 % in 2009 and 2.1 % in 2010. In
2011, real GDP is expected to grow at
around an average 2%, below the projected
growth for East Africa.
Graph 1: Real GDP Growth Rate
Graph 2: Real GDP Growth (%)
0
1
2
3
4
5
6
7
8
9
10
2003 2004 2005 2006 2007 2008 2009 2010
Comoros East Africa Africa
Source: ADB, Statistics Department
2.1.2.2 This recent improvement is partly
due to increased public investment (mainly
financed by external aid), an upturn in
construction related to Diaspora
remittances, an improvement in tourism
activities and credit expansion2. However,
the recovery of economic growth remains
below the annual population growth, which,
although falling since 2008, is still above
2%. These growth trends are not strong
enough to check the current cycle of
underemployment and poverty (cf. Figure
2).
2 Domestic credit increased by 17% between
December 2009 and December 2010, and credit to
the economy by 28.5% over the same period.
Graph 2: Population Growth Trend (2000-
2010)
2,15
2,20
2,25
2,30
2,35
2,40
2000 2001 2002 2003 2004 2005 2006 2007 2008 2009 2010
Population Growth Rate %
Africa Comoros
Source: ADB Statistics Department, based on United Nations
online data.
2.1.2.3 Economic growth could accelerate
and reach an average of 4% by 2015,
provided there is a rapid revival of public
and private investment in the three high
potential sectors of activity that are the
mainstay of the Comoros economy
(agriculture, fisheries and tourism).
Additional budget resources are required to
strengthen the implementation of structural
reforms, especially under the Programme
supported by the IMF and the other
development partners, including the Bank.
Growth Factors
2.1.2.4 Structural Stagnation. Since the
Comoros became independent in 1975,
there has been no real structural
transformation of its economy. The primary
(agriculture, fisheries and, to a lesser extent,
livestock) and the tertiary (trade and
services) sectors are the main drivers of the
economy.
2.1.2.5 Agriculture and fisheries
contribute up to 40% of GDP and provide
about 80% of jobs. Agricultural exports
also account for the bulk of export earnings.
In 2010, the main exports were prepared
vanilla, ylang ylang essence, cloves and
food produce. The share of the secondary
sector in GDP remains low (12%), in
particular industry (cf. Graph 3).

3
Graph 3: GDP Breakdown in 2010 (%)
Agriculture
40%
Industry
12%
Services
48%
Source: ADB, Statistics Department
2.1.2.6 Structural Crisis. For several
years, the agricultural sector has
experienced a major structural crisis
affecting the cash crop sub-sector,
especially vanilla, production volumes of
which have dropped sharply3. The
Comoros’ share of the international vanilla
market, currently estimated at 3,000 tonnes,
now only represents 2% of world exports.
Table 1: Export Trend 2008- 2010
∆ 2008-2010 (%)
Quantities Prices
Vanilla - 17.14 - 48.06
Cloves 373.62 5.71
Ylang Ylang 10.42 - 8.54
Other products 279.66 15872 Source: Central Bank of the Comoros, 2011
2.1.2.7 With regard to ylang-ylang, of
which Comoros is the world’s top producer,
production volumes have been less severely
affected by the uncertainties of the
international economic situation and
reached 45 tonnes in 2010. Clove
production is mainly counter-cyclical and
was 1,700 tonnes in 2009, compared with
3,500 tonnes in 2007, despite the
maintenance of producer prices at about
KMF 800/kg.
2.1.2.8 These unfavourable trends result
from a combination of factors, in particular
falling global demand, keen competition
from artificial flavours and fragrances in the
world agro-food and cosmetics industry, as
3 In 1990, vanilla production was 200 tonnes
compared with 30 tonnes in 2010, which represents
a six-fold drop in production in 20 years.
well as the liberalization of the sector in
2007. This situation has brought about a
significant on-going change in the
Comorian agricultural sector.
2.1.2.9 Intra-sector Change. In recent
years, the structural crisis in the cash crop
sub-sector has resulted in a shift by
producers towards food crops (+40%
between 2007 and 2010), which are more
remunerative, and for which there is
sustained demand both for domestic
consumption and export, the latter
especially to Mayotte (cf. Table 2).
2.1.2.10 The fisheries and tourism sectors
represent another potential growth
challenge for the Comorian economy.
Currently, only 45% of estimated fishery
potential of 33,000 tonnes is tapped
annually.
Table 2
Agricultural Production Trend, 2007-2010
(Tonnes)
2007 2010 ∆ (%)
Tubers 79 108 37
Legumes 10.3 11.9 16
Bananas 68 75 10
Vegetables 956 1531.60 60
Fruits 3696 5000 35
Total 4809.3 6726.5 39.8 Source: SNAC, 2010
2.1.2.11 The tourism potential is also
greatly under exploited. Its market share is
marginal in relation to regional and
international demand for tourism products
in the sub-region in Mauritius and the
Seychelles and, to a lesser extent,
Madagascar. These two sectors could
considerably increase their contributions to
the economy and constitute a major vehicle
for value added and employment.
Therefore, there is urgent need to define
appropriate investment plans and strategies.
2.1.2.12 On the demand side, the
Comorian economy is structurally
dependent on private consumption, which
represented 91.3% of GDP in 2010 and the
de facto main GDP counterpart.
4
Table 3
Selected Macroeconomic Indicators
(% of GDP)
2008 2009 2010 (a)
GDP Growth (%) 0.6 1.1 2.1
Domestic Investment 14.2 12.9 16.0
Public Investment 6.4 5.9 8.6
Private Investment 7.8 7.0 7.4
Current Account Balance -13.6 -7.8 -9.4
Total External Debt 63.5 53.4 44.8
External Debt Service 4.5 10.5 11.8
Source: ADB, Statistics Department,
(a) Provisional figures
Macroeconomic Management
2.1.2.13 Since the resolution of the
Anjouan crisis, and despite the resumption
of technical and financial cooperation with
the donors, the macroeconomic situation in
the Comoros remains fragile.
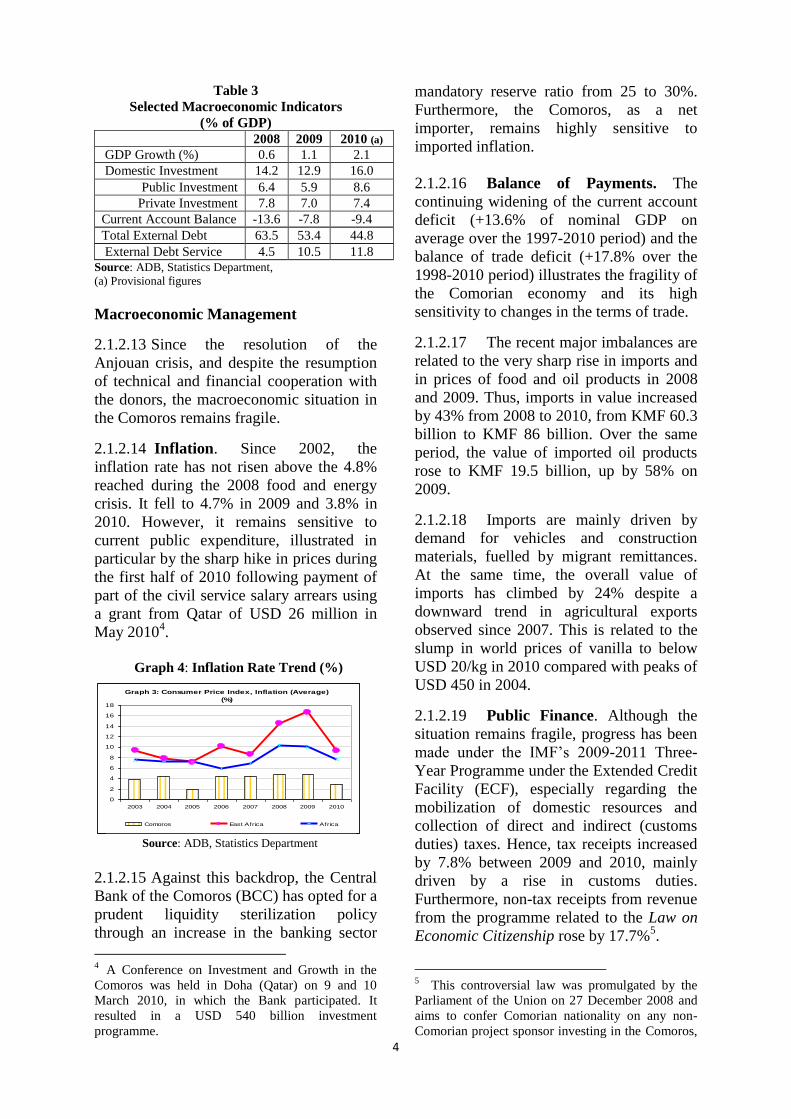
2.1.2.14 Inflation. Since 2002, the
inflation rate has not risen above the 4.8%
reached during the 2008 food and energy
crisis. It fell to 4.7% in 2009 and 3.8% in
2010. However, it remains sensitive to
current public expenditure, illustrated in
particular by the sharp hike in prices during
the first half of 2010 following payment of
part of the civil service salary arrears using
a grant from Qatar of USD 26 million in
May 20104.
Graph 4: Inflation Rate Trend (%)
Source: ADB, Statistics Department
2.1.2.15 Against this backdrop, the Central
Bank of the Comoros (BCC) has opted for a
prudent liquidity sterilization policy
through an increase in the banking sector
4 A Conference on Investment and Growth in the
Comoros was held in Doha (Qatar) on 9 and 10
March 2010, in which the Bank participated. It
resulted in a USD 540 billion investment
programme.
mandatory reserve ratio from 25 to 30%.
Furthermore, the Comoros, as a net
importer, remains highly sensitive to
imported inflation.
2.1.2.16 Balance of Payments. The
continuing widening of the current account
deficit (+13.6% of nominal GDP on
average over the 1997-2010 period) and the
balance of trade deficit (+17.8% over the
1998-2010 period) illustrates the fragility of
the Comorian economy and its high
sensitivity to changes in the terms of trade.
2.1.2.17 The recent major imbalances are
related to the very sharp rise in imports and
in prices of food and oil products in 2008
and 2009. Thus, imports in value increased
by 43% from 2008 to 2010, from KMF 60.3
billion to KMF 86 billion. Over the same
period, the value of imported oil products
rose to KMF 19.5 billion, up by 58% on
2009.
2.1.2.18 Imports are mainly driven by
demand for vehicles and construction
materials, fuelled by migrant remittances.
At the same time, the overall value of
imports has climbed by 24% despite a
downward trend in agricultural exports
observed since 2007. This is related to the
slump in world prices of vanilla to below
USD 20/kg in 2010 compared with peaks of
USD 450 in 2004.
2.1.2.19 Public Finance. Although the
situation remains fragile, progress has been
made under the IMF’s 2009-2011 Three-
Year Programme under the Extended Credit
Facility (ECF), especially regarding the
mobilization of domestic resources and
collection of direct and indirect (customs
duties) taxes. Hence, tax receipts increased
by 7.8% between 2009 and 2010, mainly
driven by a rise in customs duties.
Furthermore, non-tax receipts from revenue
from the programme related to the Law on
Economic Citizenship rose by 17.7%5.
5 This controversial law was promulgated by the
Parliament of the Union on 27 December 2008 and
aims to confer Comorian nationality on any non-
Comorian project sponsor investing in the Comoros,
Graph 3: Consumer Price Index, Inflation (Average)
(%)
0
2
4
6
8
10
12
14
16
18
2003 2004 2005 2006 2007 2008 2009 2010
Comoros East Africa Africa
5
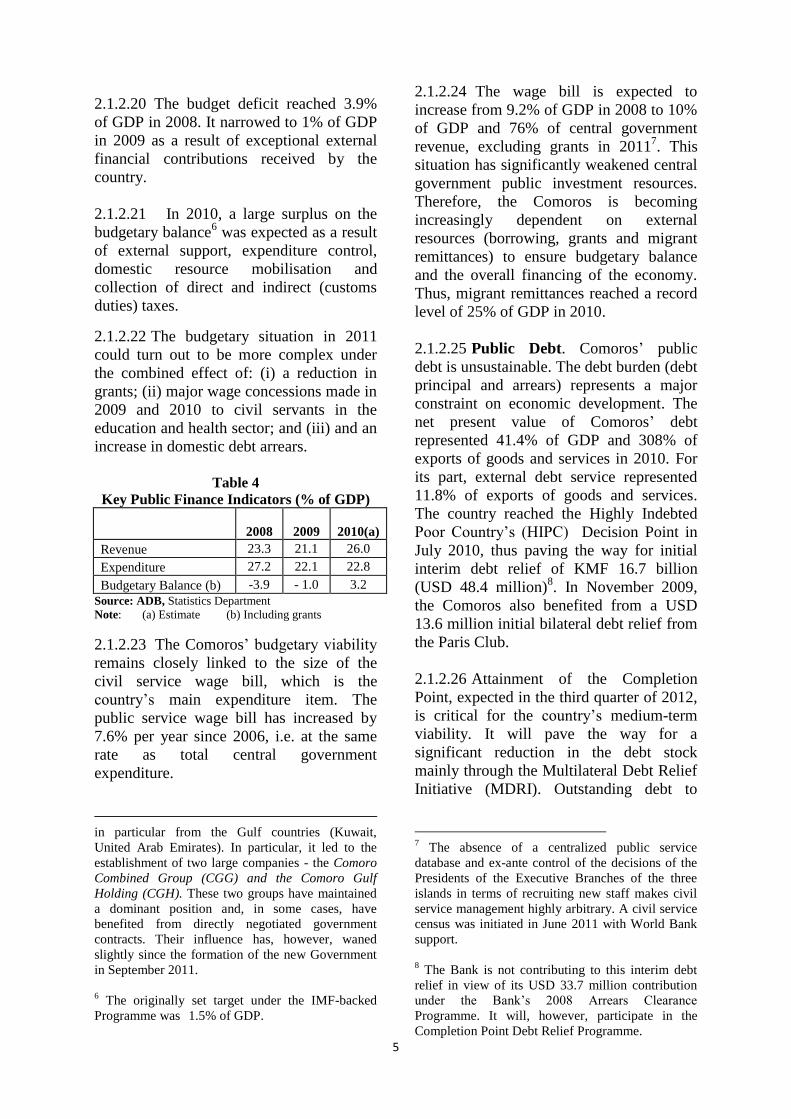
2.1.2.20 The budget deficit reached 3.9%
of GDP in 2008. It narrowed to 1% of GDP
in 2009 as a result of exceptional external
financial contributions received by the
country.
2.1.2.21 In 2010, a large surplus on the
budgetary balance6 was expected as a result
of external support, expenditure control,
domestic resource mobilisation and
collection of direct and indirect (customs
duties) taxes.
2.1.2.22 The budgetary situation in 2011
could turn out to be more complex under
the combined effect of: (i) a reduction in
grants; (ii) major wage concessions made in
2009 and 2010 to civil servants in the
education and health sector; and (iii) and an
increase in domestic debt arrears.
Table 4
Key Public Finance Indicators (% of GDP)
2008 2009
2010(a)
Revenue 23.3 21.1 26.0
Expenditure 27.2 22.1 22.8
Budgetary Balance (b) -3.9 - 1.0 3.2
Source: ADB, Statistics Department
Note: (a) Estimate (b) Including grants
2.1.2.23 The Comoros’ budgetary viability
remains closely linked to the size of the
civil service wage bill, which is the
country’s main expenditure item. The
public service wage bill has increased by
7.6% per year since 2006, i.e. at the same
rate as total central government
expenditure.
in particular from the Gulf countries (Kuwait,
United Arab Emirates). In particular, it led to the
establishment of two large companies - the Comoro
Combined Group (CGG) and the Comoro Gulf
Holding (CGH). These two groups have maintained
a dominant position and, in some cases, have
benefited from directly negotiated government
contracts. Their influence has, however, waned
slightly since the formation of the new Government
in September 2011.
6 The originally set target under the IMF-backed
Programme was 1.5% of GDP.
2.1.2.24 The wage bill is expected to
increase from 9.2% of GDP in 2008 to 10%
of GDP and 76% of central government
revenue, excluding grants in 20117. This
situation has significantly weakened central
government public investment resources.
Therefore, the Comoros is becoming
increasingly dependent on external
resources (borrowing, grants and migrant
remittances) to ensure budgetary balance
and the overall financing of the economy.
Thus, migrant remittances reached a record
level of 25% of GDP in 2010.
2.1.2.25 Public Debt. Comoros’ public
debt is unsustainable. The debt burden (debt
principal and arrears) represents a major
constraint on economic development. The
net present value of Comoros’ debt
represented 41.4% of GDP and 308% of
exports of goods and services in 2010. For
its part, external debt service represented
11.8% of exports of goods and services.
The country reached the Highly Indebted
Poor Country’s (HIPC) Decision Point in
July 2010, thus paving the way for initial
interim debt relief of KMF 16.7 billion
(USD 48.4 million)8. In November 2009,
the Comoros also benefited from a USD
13.6 million initial bilateral debt relief from
the Paris Club.
2.1.2.26 Attainment of the Completion
Point, expected in the third quarter of 2012,
is critical for the country’s medium-term
viability. It will pave the way for a
significant reduction in the debt stock
mainly through the Multilateral Debt Relief
Initiative (MDRI). Outstanding debt to
7 The absence of a centralized public service
database and ex-ante control of the decisions of the
Presidents of the Executive Branches of the three
islands in terms of recruiting new staff makes civil
service management highly arbitrary. A civil service
census was initiated in June 2011 with World Bank
support.
8 The Bank is not contributing to this interim debt
relief in view of its USD 33.7 million contribution
under the Bank’s 2008 Arrears Clearance
Programme. It will, however, participate in the
Completion Point Debt Relief Programme.
6
exports of goods and services will be
brought down to 86%.
2.1.2.27 Furthermore, special attention
should be paid to arrears on central
government domestic debt owed to the
private sector (suppliers) and public
enterprises. Representing KMF 864 million
(i.e. 0.5% of GDP) in early 2010, they
constitute a serious handicap for the
economic development and financial
viability of Comorian operators.
Governance, Business Climate and
Competitiveness
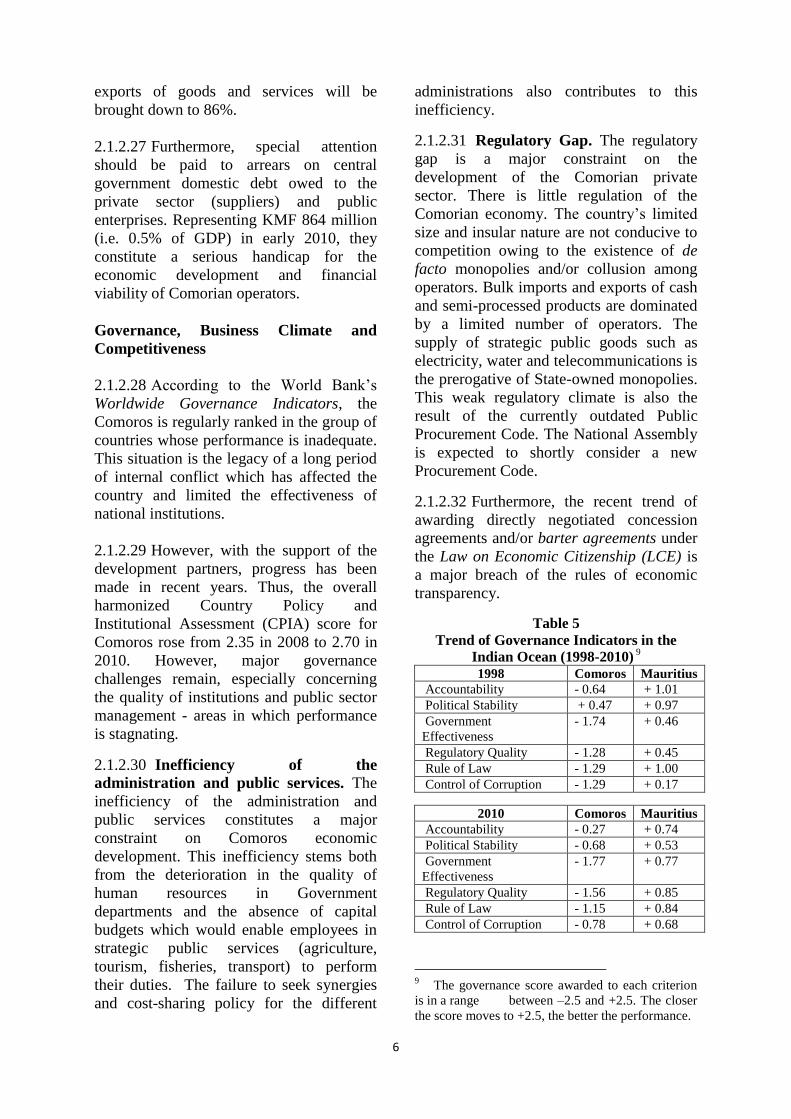
2.1.2.28 According to the World Bank’s
Worldwide Governance Indicators, the
Comoros is regularly ranked in the group of
countries whose performance is inadequate.
This situation is the legacy of a long period
of internal conflict which has affected the
country and limited the effectiveness of
national institutions.
2.1.2.29 However, with the support of the
development partners, progress has been
made in recent years. Thus, the overall
harmonized Country Policy and
Institutional Assessment (CPIA) score for
Comoros rose from 2.35 in 2008 to 2.70 in
2010. However, major governance
challenges remain, especially concerning
the quality of institutions and public sector
management - areas in which performance
is stagnating.
2.1.2.30 Inefficiency of the
administration and public services. The
inefficiency of the administration and
public services constitutes a major
constraint on Comoros economic
development. This inefficiency stems both
from the deterioration in the quality of
human resources in Government
departments and the absence of capital
budgets which would enable employees in
strategic public services (agriculture,
tourism, fisheries, transport) to perform
their duties. The failure to seek synergies
and cost-sharing policy for the different
administrations also contributes to this
inefficiency.
2.1.2.31 Regulatory Gap. The regulatory
gap is a major constraint on the
development of the Comorian private
sector. There is little regulation of the
Comorian economy. The country’s limited
size and insular nature are not conducive to
competition owing to the existence of de
facto monopolies and/or collusion among
operators. Bulk imports and exports of cash
and semi-processed products are dominated
by a limited number of operators. The
supply of strategic public goods such as
electricity, water and telecommunications is
the prerogative of State-owned monopolies.
This weak regulatory climate is also the
result of the currently outdated Public
Procurement Code. The National Assembly
is expected to shortly consider a new
Procurement Code.
2.1.2.32 Furthermore, the recent trend of
awarding directly negotiated concession
agreements and/or barter agreements under
the Law on Economic Citizenship (LCE) is
a major breach of the rules of economic
transparency.
Table 5
Trend of Governance Indicators in the
Indian Ocean (1998-2010) 9
1998 Comoros Mauritius
Accountability - 0.64 + 1.01
Political Stability + 0.47 + 0.97
Government
Effectiveness
- 1.74 + 0.46
Regulatory Quality - 1.28 + 0.45
Rule of Law - 1.29 + 1.00
Control of Corruption - 1.29 + 0.17
2010 Comoros Mauritius
Accountability - 0.27 + 0.74
Political Stability - 0.68 + 0.53
Government
Effectiveness
- 1.77 + 0.77
Regulatory Quality - 1.56 + 0.85
Rule of Law - 1.15 + 0.84
Control of Corruption - 0.78 + 0.68
9 The governance score awarded to each criterion
is in a range between –2.5 and +2.5. The closer
the score moves to +2.5, the better the performance.

7
Source: World Bank, Worldwide Governance Indicators,
various years
2.1.2.33 Business Climate and
Competitiveness. In the World Bank’s
2010 Doing Business Report, the Comoros
was ranked 162nd
out of 183 countries, two
positions lower than in 2009. In addition to
the governance-related constraints, potential
national or foreign investors face many
difficulties relating to starting or closing
businesses, recruitment, taxation as well as
access to financing and contract execution.
2.1.2.34 In addition, the lack of
independence and the arbitrary nature of
court rulings as well as the absence of
courts of arbitration competent to settle
trade disputes also constitute factors of
insecurity for investors. The absence of a
Supreme Court represents a major handicap
for business.
2.1.2.35 The significant infrastructure
gaps are likely to exacerbate human and
institutional-related constraints. The poor
state of basic transport (maritime, road and
air) infrastructure and high factor costs
(electricity, water, labour and
communications) is contributing to the
weakening of Comoros’ economic
competitiveness in relation to the regional
average and its immediate neighbours
(Madagascar, Mauritius and the
Seychelles).
Table 6
Business Climate in the Indian Ocean Criteria Comoros Mauritius
Ranking 159 20
Starting a Business 168 12
Dealing with Licenses 68 39
Registering Property 99 69
Getting Credit 168 89
Protecting Investors 132 12
Paying Taxes 96 12
Trading Across
Borders 135 22
Enforcing Contracts 152 61
Closing a Business 183 71 Source: World Bank, Doing Business 2011
Regional Integration and Trade
2.1.2.36 The Comoros is a member of the
Indian Ocean Commission (IOC) and
COMESA10
. The country also joined the
League of Arab States (LAS) in 1993. At
Bank level, it should be noted that the
Comoros forms part of the thirteen
countries of the 2011-2013 Regional
Integration Strategy Paper (RISP) for
Eastern Africa, approved in September
201111
.
2.1.2.37 Regional integration offers
tremendous opportunities for a small island
country like the Comoros in terms of access
to a large regional market for exports and
imports. The challenge lies in integrating
the Comoros into the regional market in
particular, through policy harmonization
and infrastructure development.
2.1.2.38 With regard to policies, the
Comoros has been a member of the
COMESA free-trade zone since 2006. The
Comoros has adopted the COMESA
Common External Tariff (CET) which has
been beneficial, in particular with regard to
customs modernization.
2.1.2.39 The operation entailed the
replacement of trade taxes by excise duties
and a consumption tax. However, Comoros’
trade with COMESA member countries
remains marginal and is currently only
about 1.5% of exports and less than 10% of
imports, mainly oil products from South
Africa.
10
COMESA comprises 23 countries, 18 of which
are Eastern and Southern African and Indian Ocean
States. The IOC, an intergovernmental organization
established in 1984, has 5 members: the Comoros,
Madagascar, Mauritius, the Seychelles and Reunion.
11
The twelve other countries comprise seven (7)
COMESA member countries (Djibouti, Eritrea,
Ethiopia, Kenya, Uganda, Seychelles and Sudan).
The remaining five (5) countries are Burundi,
Rwanda and Tanzania (members of the East African
Community), Somalia (IGAD) and the newly
independent State of South Sudan.
8
2.1.2.40 The changes resulting from the
CET could foreshadow the adoption by the
Comoros of a Value Added Tax (VAT)
intended to replace the consumption tax.
This trend could, in time, provide the basis
for the development of a manufacturing
industry due to the proximity of the growth
markets of South Africa, Reunion and
Mauritius. With regard to infrastructure, the
RISP retains the improvement of transport
(by water, air and sea ports) as essential for
island countries.
2.1.2.41 Of the four seaports in the
Comoros (Mutsamudu, Moroni, Fomboni
and Moheli), only the Mutsamudu Port has
deep water facilities. All four require
upgrading.
2.1.2.42 Information and Communication
Technologies (ICT) and renewable energies
are also potential sectors for improving
Comoros’ competitiveness.
2.1.2.43 IOC’s role in regional integration
remains confined to technical cooperation
and partnership. The Bank has initiated the
preparation of a flagship publication for the
Indian Ocean countries, which will serve as
an instrument for the closer involvement of
the island states in regional operations.
2.1.3 Social and Crosscutting Aspects
2.1.3.1 Poverty. With a Human
Development Index (HDI) of 0.428 in
2010, Comoros is ranked in the ‘low’
category in 139th
position out of 182
countries and 50th
in Africa in the UNDP
2010 Human Development Report. Over
70% of the population is affected by
poverty, in particular, rural youths and
women. According to the 2004
Comprehensive Household Survey (EIM)
which is currently the most recent reference
survey, 44.8% of the Comorian population
was living below the poverty threshold
estimated, per capita, at KMF 285,144 (i.e.
about EUR 580). This poverty rate varies,
depending on the island, the residential
environment and economic activities of
household heads. It is higher in Anjouan
and Moheli than on Grande Comore.
2.1.3.2 MDGs. Progress towards
achievement of the MDGs remains limited
and particularly inhibited by the lack of
investment in both social and economic
infrastructure (health and education).
Without additional financial resources,
most of the MDG are unlikely to be
achieved by 2015 (cf. Annex 3).
Gender and Social Equity
2.1.3.3 The Comorian Government
recognizes the importance of
mainstreaming the gender dimension and
women’s full participation in the
development process. Therefore, there is no
significant gender gap in terms of human
development.
2.1.3.4 However, wide disparities persist,
especially in the labour market. Women’s
employment in the Comoros remains low
with only 13.7% of wage earners, 69.2% of
whom are in jobs with little social
protection. The civil service only employs
30% of women; principally in junior
positions. Of the unemployed, 47% are
women. Their low level of instruction and
illiteracy also constitutes a major constraint
to women’s integration into Comoros’
economic and social life.
Environment and Climate Change
2.1.3.5 The Comoros has rich land and
marine-based biodiversity. It constitutes a
potential to be safeguarded and developed
from a tourism standpoint. On the global
scale, the Comoros is part of twenty islands
or archipelagos characterized by their
significant endemic diversity, which is now
seriously threatened by human activity and
demographic pressure. The geographical
specificities of the islands, which have
steep slopes liable to erosion, make them
particularly vulnerable.
2.1.3.6 It is estimated that 58% of the
arable land is degraded and pressure on the
9
last remaining forest areas is steadily
increasing. The environment has also been
made fragile by the archipelago’s climatic
conditions, characterized by heavy rains,
pronounced dry seasons and the occurrence
of cyclones.
2.1.3.7 With regard to climate change,
currently available data reveals, in
particular, a rise in the annual average
temperature of about 1.5°C over the last
forty years and a trend towards increasing
irregularity of rainfall, coupled with a
shortening of the rainy season and an
impact on local micro-climates.
2.1.3.8 A National Action Plan on Climate
Change Adaptation (NAPCCA) was
prepared in 2006. It highlights the
vulnerability of the Comoros to climate
change, and the estimated economic impact.
It also defines priority actions12
.
2.2 Strategic Options
2.2.1 Country Strategic Framework. In September 2009, the full-fledged Poverty
Reduction and Growth Strategy Paper
(PRGSP) over five (5) years (2009-2014)
was presented to the development partners.
The strategy’s main thrusts concern: (i) the
promotion of macroeconomic stability; (ii)
activity in the productive sectors,
agriculture, fisheries and tourism; (iii)
governance; and (iv) human development.
The Government, with Bank support,
initiated a prioritization operation in the
first quarter of 2011 aimed at
operationalizing the strategy and
maximizing the expected impact of
activities planned.
2.2.2 Challenges and Weaknesses. The
Comoros faces several economic and social
development-related challenges and
weaknesses.
12
To-date none of the projects identified has been
implemented. An initial Water Resource
Management Project in Anjouan has been retained
for financing by the Global Environment Facility
(GEF), and implementation by UNDP/UNEP.
2.2.2.1 Persistence of a high un-
employment rate. The unemployment rate
is estimated at an average 14% of the work
force, but it is likely that this figure is
underestimated because of weaknesses of
the statistics system. It is higher on Grande
Comore (14.9 %) and Moheli (15.0 %) than
on Anjouan (12.1 %). The dependency rate
is reported to be 3.4, implying that an
individual in work supports an average of
3.4 inactive or unemployed persons.
2.2.2.2 Creation of the necessary
conditions to diversify the sources of
growth and employment now represents the
main challenge facing the Union. Weak
labour supply is mainly related to the
structural crisis in the traditional sources of
growth and lack of diversification of the
economy, in particular the absence of a real
industrial base.
2.2.2.3 Weak capacity. Weak institutional
capacity represents the second major
challenge for the Comoros. Due to lack of
appropriate budgetary resources, the
intervention capacity of most of the
ministries responsible for economic action
(agriculture, fisheries, tourism, etc.) is
extremely limited in terms of resources
(including human resources) and represents
a handicap for support to economic
development.
2.2.2.4 Structural weakness of the
investment rate and degradation of basic
infrastructure. As previously mentioned,
the lack of investment in basic
infrastructure (roads, ports, energy, water)
over the past two decades has buttressed
the structural weakness of the economy,
notably the rate of investment has remained
low, which represents a major constraint
on economic development. It is the result
of: (i) a low public investment rate linked to
serious budgetary constraints; (ii) low
private investment rates constrained by a
banking sector that is insufficiently
developed; and (iii) a restrictive business
climate.
10
2.2.2.5 This situation has resulted in the
degradation of basic infrastructure and an
increase in factor costs. In particular, the
high cost of energy affects public finances
and constitutes a major obstacle for water
production, business operations and for
improving the population’s living
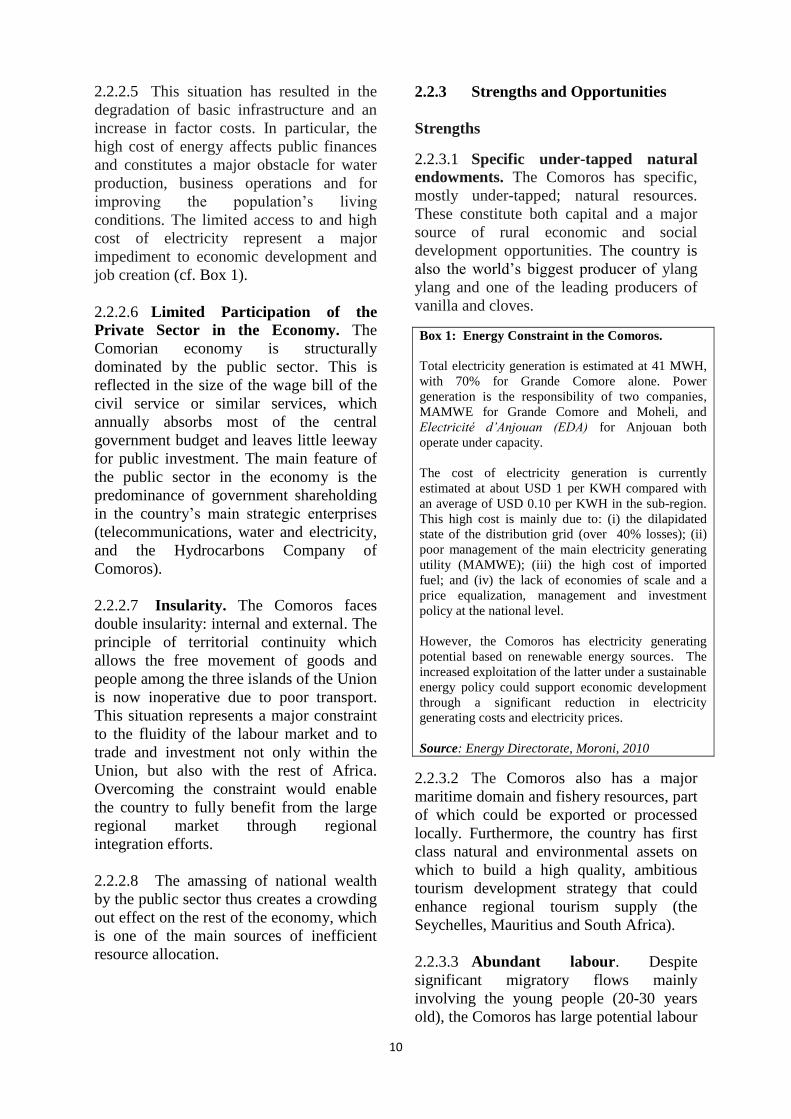
conditions. The limited access to and high
cost of electricity represent a major
impediment to economic development and
job creation (cf. Box 1).
2.2.2.6 Limited Participation of the
Private Sector in the Economy. The
Comorian economy is structurally
dominated by the public sector. This is
reflected in the size of the wage bill of the
civil service or similar services, which
annually absorbs most of the central
government budget and leaves little leeway
for public investment. The main feature of
the public sector in the economy is the
predominance of government shareholding
in the country’s main strategic enterprises
(telecommunications, water and electricity,
and the Hydrocarbons Company of
Comoros).
2.2.2.7 Insularity. The Comoros faces
double insularity: internal and external. The
principle of territorial continuity which
allows the free movement of goods and
people among the three islands of the Union
is now inoperative due to poor transport.
This situation represents a major constraint
to the fluidity of the labour market and to
trade and investment not only within the
Union, but also with the rest of Africa.
Overcoming the constraint would enable
the country to fully benefit from the large
regional market through regional
integration efforts.
2.2.2.8 The amassing of national wealth
by the public sector thus creates a crowding
out effect on the rest of the economy, which
is one of the main sources of inefficient
resource allocation.
2.2.3 Strengths and Opportunities
Strengths
2.2.3.1 Specific under-tapped natural
endowments. The Comoros has specific,
mostly under-tapped; natural resources.
These constitute both capital and a major
source of rural economic and social
development opportunities. The country is
also the world’s biggest producer of ylang
ylang and one of the leading producers of
vanilla and cloves.
Box 1: Energy Constraint in the Comoros.
Total electricity generation is estimated at 41 MWH,
with 70% for Grande Comore alone. Power
generation is the responsibility of two companies,
MAMWE for Grande Comore and Moheli, and
Electricité d’Anjouan (EDA) for Anjouan both
operate under capacity.
The cost of electricity generation is currently
estimated at about USD 1 per KWH compared with
an average of USD 0.10 per KWH in the sub-region.
This high cost is mainly due to: (i) the dilapidated
state of the distribution grid (over 40% losses); (ii)
poor management of the main electricity generating
utility (MAMWE); (iii) the high cost of imported
fuel; and (iv) the lack of economies of scale and a
price equalization, management and investment
policy at the national level.
However, the Comoros has electricity generating
potential based on renewable energy sources. The
increased exploitation of the latter under a sustainable
energy policy could support economic development
through a significant reduction in electricity
generating costs and electricity prices.
Source: Energy Directorate, Moroni, 2010
2.2.3.2 The Comoros also has a major
maritime domain and fishery resources, part
of which could be exported or processed
locally. Furthermore, the country has first
class natural and environmental assets on
which to build a high quality, ambitious
tourism development strategy that could
enhance regional tourism supply (the
Seychelles, Mauritius and South Africa).
2.2.3.3 Abundant labour. Despite
significant migratory flows mainly
involving the young people (20-30 years
old), the Comoros has large potential labour
11
reserves that could be mobilized, subject to
providing training courses to build their
capacity and ensure their professional
integration.
Opportunities
2.2.3.4 Private sector and regional
integration promotion present vast
opportunities for the Comoros, especially as
a means of expanding the economic base
and market. In this respect, structural
reforms and strategic infrastructure (energy,
water, transport and telecommunications)
should be strengthened to support
diversification.
2.2.3.5 The effect of such strategic options
will be to widen access and lower factor
costs with a view to promoting private
activities in sectors with strong potential.
2.2.3.6 There are huge investment
opportunities especially in the areas of: (i)
commercial agriculture (management of
vanilla, ylang ylang and clove plantations
by private companies) and agro-industrial
processing (distilleries); (ii) industrial
fishing, including the possibility of initial
processing on the spot (fish cutting
workshops); (iii) inter-island sea transport
and maritime infrastructure (modernization
of fishing ports); and (iv) tourist receptive
facilities.
2.2.3.7 Furthermore, the acceleration of
structural reforms would create significant
opportunities for investment related to the
privatization process involving the main
public enterprises, in particular, the
Hydrocarbons Company of Comoros,
MAMWE (water and electricity), and
Comores Telecom.
2.3 Recent Aid Coordination-
Harmonization Developments and Bank
Group’s Current Positioning
2.3.1 Aid Coordination.
2.3.1.1 In 2009, the Comoros received
USD 50.6 million in official development
assistance (ODA) from the international
community, compared with USD 22.8
million in 2005, i.e. a doubling in five (5)
years. Traditionally, aid provided to the
Comoros comes from bilateral sources,
which represents 56% of total ODA, in
particular from France (80%) and Japan
(19%)13
.
2.3.1.2 However, the March 2010 Doha
Conference significantly modified the ODA
landscape in the Comoros with the arrival
of non-traditional donors from the Gulf
countries. The involvement of these new
actors, in particular concessional non-
governmental organizations (NGOs), the
operating methods of which differ
considerably from the traditional
cooperation agencies, is fortunate for the
Comoros.
2.3.1.3 However, it also represents a major
challenge with regard to coordination with
the Government and the development
partner community.
2.3.1.4 Coordination of aid to the
Comoros remains limited. It is particularly
complicated due to the lack of donor
representation in the country. Among the
multilateral donors, only the United Nations
System and, since September 2011, the
European Union, have representations in
Moroni. The lack of representation is not
conducive to the organization of sector
thematic working groups (transport, water,
energy, agriculture, etc.) which could
reinforce strategic dialogue with the
Government.
2.3.1.5 The above notwithstanding, recent
progress has been recorded regarding aid
coordination. UNDP organizes aid
coordination meetings on a fairly regular
basis. At sector level, a Water Committee
was established under the Bank-financed
Drinking Water Supply and Sanitation
Project (DWSSP). Moreover, despite the
13
Source: OECD/DAC, 2011
12
absence of a formal budget support group,
frequent discussions were held among the
main active partners in the area, namely the
IMF, Bank, World Bank and the EU.
2.3.1.6 On the Government side, aid
coordination is the responsibility of the
General Planning Commission (CGP).
However, its human, technical and financial
resources remain limited. The Bank has
provided support to the CGP through FSF.
The EU also has an aid coordination
support programme.
2.3.1.7 In the spirit of the Paris
Declaration, aid coordination and
harmonization and its alignment with the
country’s priority and budgetary
requirements reflected in the 2009-2014
PRSP constitute a key objective. In
coordination with the other partners, the
Bank will contribute to the consolidation of
recent initiatives, in particular through
dialogue and capacity building.
2.3.2 Bank’s Positioning in the
Country.
2.3.2.1 Since it started activities in the
Comoros in 1977, the Bank Group has
approved fifteen (15) operations representing
cumulated net commitments of UA 58.88
million, of which 83.6% from ADF
resources. A port infrastructure project was
financed using the ADB window for a net
UA 9.67 million. These operations all
targeted the public sector. Infrastructure
accounts for the highest share (57%),
including transport (40%), water and
sanitation (17%), followed by multi-sector
interventions (26%), the agricultural sector
(11%) and the education sector (6%).
2.3.2.2 Bank cooperation with the Comoros
was suspended in 1993 due to arrears. The
Bank re-engaged in 2009 in a difficult crisis-
exit context. The I-CSP was prepared and led
to the implementation of 4 operations, one of
which was completed in December 2010.
Preparation of this CSP has provided an
opportunity to assess portfolio performance
and draw lessons to improve project
implementation.
2.3.2.3 Despite some difficulties related to
start-up and the country’s fragile situation,
significant progress has been noted.
However, major challenges must be
addressed, in particular: (i) building the
capacity of project executing agencies and
implementation units; (ii) the length of time
taken to fulfil the conditions precedent to
effectiveness and first disbursement; (iii)
compliance with reporting and audit
requirements; and (iv) aid coordination. In
light of these achievements and lessons from
implementing the I-CSP as well as its
comparative advantage, the Bank will
reinforce its presence in the infrastructure
sector, while strengthening the reforms
already initiated.
2.3.2.4 Portfolio Performance. As at 30
September 2011, the active portfolio,
excluding emergency aid, comprised three
(3) operations for a total amount net of
commitments of UA 18.36 million, focused
on the water and sanitation sector (54.5%)
and multi-sector operations (45.5%).
2.3.2.5 Over the 2009-2010 I-CSP period,
two emergency assistance grants were also
awarded to the Comoros under the Bank’s
Africa Food Crisis Response Initiative in
2008 (UA 1.5 million) and Humanitarian
Assistance to Flood Victims in 2009 (UA
0.64 million). The overall average
cumulative portfolio disbursement rate is
13.13% (excluding emergency aid).
2.3.2.6 This fairly low rate is consistent
with the context. It is partially due to the
portfolio’s relatively young age (average age:
1.3 years), on the one hand, and fragility-
related constraints, on the other, although
such constraints have been largely mitigated
by the measures implemented. Portfolio
performance has a satisfactory rating of 2.09.
To address the constraints identified, a
Portfolio Performance Improvement Plan
(PPIP) was prepared and discussed during
the CSP preparation (Annex 4).

13
2.3.3 Assessment and Lessons
Learned from Previous Strategy
2.3.3.1 The 2009-2010 I-CSP covered the
last two years of ADF-11. The resources
mobilized amounted to UA 20.36 million,
including UA 5.86 million under the ADF
country allocation, UA 12.5 million under
FSF (Pillars 1 and 3) and UA 2 million
under RWSSI. These resources were used
to implement a grant programme
comprising four operations: (i) the
Institutional Capacity Building Support
Project (PRCI); (ii) the Drinking Water
Supply and Sanitation Project (DWSSP);
(iii) the Capacity Building Programme and;
(iv) the Economic Reform Support and
Financial Governance Programme
(PAREGF)14
(cf. Box 2)
Lessons
2.3.3.2 Catalytic Role. The Bank’s
resources have played a beneficial role for
the country. In particular, they contributed
to the mobilization of supplementary
resources to the tune of UA 10.9 million
towards the co-financing of the DWSS
Project by the development partners, in
particular the French Development Agency
(AFD), the UNDP and UNICEF.
2.3.3.3 Consideration of the Fragility
Dimension. The I-CSP was implemented in
a post-crisis context, particularly
characterized by a serious lack of
operational capacity in government
departments and qualified skills on the
labour market that could be recruited by
Bank-financed projects15
.
14
PAREGF aimed to support the stabilization of the
economy and implementation of structural reforms
under the Extended Credit Facility (ECF)-backed
Programme.
15
Specifically, this situation has delayed recruitment
of staff qualified in financial management and
procurement for the Project Management Unit
(PMU); this has led to the postponement of the
DWSS Project’s entry into force.
2.3.3.4 The Bank has mitigated this
constraint through rapid, flexible and
targeted operations, mainly thanks to FSF
resources. This approach has produced
results with respect to capacity building.
However, implementation of the I-CSP has
been affected by some slippage on the
DWSS Project, due to underestimation of
the lack of qualified skills. These start-up
difficulties have finally been resolved and
the conditions met for satisfactory
implementation of the project.
2.3.3.5 The new strategy will focus more
closely on quality at entry in a fragile
situation and develop in situ and qualifying
training to meet the different requirements
in qualified skills and improve the Bank’s
portfolio performance.
2.3.3.6 Selectivity Regarding the Pillars
of Intervention. The two I-CSP pillars
focused on governance and drinking water
supply were also relevant in light of
challenges facing the Comoros. However,
the assessment reveals a need to strengthen
selectivity around one pillar in order to
maximize synergy between strategic
infrastructure requirements and the need for
reforms, with a view to enhancing their
development impact. Indeed, the reforms
may be carefully designed and articulated to
provide greater infrastructure development
support.
2.3.3.7 Importance of Improving
Knowledge on Development Constraints.
The budgetary difficulties facing the
Comoros since its independence have had
an impact on the production and updating
of the main medium-term public decision-
making assistance tools such as sector
strategies and strategic and prospective
studies. This situation is compounded by a
lack of specialized skills and economic
analytical capacity16
.
16
The University of Moroni does not have an
operational economic research unit on which the
Government could possibly rely for economic policy
advice. This skill is systematically imported from
abroad.
14
2.3.3.8 The new strategy should be able to
close this knowledge gap in the short-term
while putting in place the resources
required for the gradual ownership of the
main tools and mechanisms required for the
economic development knowledge building
process by the Comoros.
Box 2: Bank Support to Economic Reforms and
Institutional Capacity Building in the Comoros.
In 2009, the Bank approved two grant operations: (i)
the Economic Reform Support and Financial
Governance Programme (PAREGF) under FSF; and
(ii) the Institutional Capacity Building Project (PRCI)
under ADF, complemented by FSF Pillar 3 targeted
support.
The main PAREGF contributions are: (i) attainment
of the HIPCI decision point; (ii) adoption of key
regulatory texts on public finance reforms, including
a Ten-Year Strategy (2009-2019) and a Three-Year
Priority Action Programme for implementation.
The two years of PRCI implementation have resulted
in: (i) regular publication of price statistics; (ii)
progress in the preparation of national accounts, in
the finalization phase; (iii) long training courses for
Ministry of Finance officials; and (iv) preparation of
the Public Procurement Code being discussed in
Parliament. The remaining activities will strengthen
domestic resource mobilization, cash flow and debt
management, socio-economic statistics and
monitoring of the PRGS.
FSF’s major contribution was its rapidity and
flexibility to provide better operational support,
thereby creating appropriate conditions for the
speedy implementation of operations. Critical
activities have been speeded up, in particular
finalization of the PRSP and ranking of priorities,
strengthening of planning and coordination functions
and the establishment of tools (Revision of the
Revised Tax Code, the Taxpayers’ Charter and
reorganization of tax administration).
The main lessons learnt are: (i) the innovative and
targeted combination of Bank instruments (ADF and
FSF) against a backdrop of fragility and crisis exit;
(ii) close coordination and search for synergy with
the other donors (World Bank, IMF, EU, UNDP and
France); and (iii) synergy and the need to support the
reforms with targeted institutional support operations.
2.3.3.9 Private Sector Development-
related Concerns. It is essential to take the
private sector’s role more closely into
account in order to enhance the leverage
effect, and lay the foundations for inclusive
growth and a credible alternative to public
sector employment. The aim of this new
strategy is to create an enabling
environment for private sector development
and, consequently, envisage support to
specific operations.
2.3.3.10 Consideration of the Regional
Dimension. Although undeniable as
discussed above, this dimension was totally
neglected under the I-CSP. The 2011-2015
RISP for Eastern Africa and preparation of
the flagship publication for the OIC will
provide opportunities to ensure that
regional integration is taken more closely
into account in the case of the Comoros.
2.3.3.11 Consideration of the sensitivities
of the three islands and the maintenance of
a permanent institutional balance. This
concern should also constitute one of the
factors of success of the Bank’s operations
strategy.
III. BANK GROUP STRATEGY
FOR COMOROS FOR 2011-2015
3.1 Rationale for Bank Group’s
Involvement
3.1.1 Rationale. Despite the progress
made regarding domestic resource
mobilization, Comoros’ requirements in
external financing, technical assistance and
advisory services are expected to remain
substantial in the medium- and long-term,
especially with a view to reaching the
HIPCI Completion point in 2012 and
achievement of the MDG.
3.1.2 In addition, the limited progress
made regarding growth and public finance
management over the 2009-2010 should be
consolidated. Such progress will require
fresh momentum from the Government to
implement the structural reforms (public
enterprise management, the business
climate, development of private initiative,
upgrading of strategic support
15
infrastructure17
of the economy) that will
strengthen competitiveness and economic
growth.
3.1.3 The Bank has a comparative
advantage on all the different projects and
themes and will be able to mobilize its
appropriate windows (ADF, ADB, FSF and
Trust Funds) by acting in a selective and
catalytic manner, in synergy with the donor
community operating in the Comoros.
3.1.4 Resources and Instruments. The
2011-2015 strategy will cover two (2) ADF
cycles, namely ADF 12 (2011-2013) and
ADF 13 (2014-2016).
3.1.5 The initial ADF-12 resources
amount to UA 15.6 million, comprising UA
5.6 million under the ADF-12 country
allocation and UA 10 million under FSF
Pillar 1. Other resources are expected from
the Global Environment Facility (GEF) and
the African Legal Support Facility (ALSF).
3.1.6 Two other windows likely to have
a significant leverage effect on Comoros’
economic development strategy will also be
required to contribute: (i) the private sector
window; and (ii) the regional operations
window. Resources from the Bank’s private
sector window could be mobilized either
for direct financing or under public-private
partnerships (PPPs).
3.1.7 The identification of regionally-
focused projects will be carried out
following the conclusions and
recommendations of the flagship study on
the regional integration strategy for Indian
Ocean Commission Countries (IOC), which
is expected to be completed by end 2011.
3.2 Pillar for Bank Group Strategy
3.2.1 The Comorian institutions and
economy continue to be weakened by the
country’s fragility and a series of structural
constraints that impede its growth. This is
17
Roads, telecommunications, ports, secondary
airports, etc.
preventing the initiation of a self-sustained
development process that will create
permanent jobs.
3.2.2 The preliminary diagnosis of
Comoros’ sources of growth carried out in
2010 with Bank assistance, showed that the
medium-term revival of economic
development in the Comoros will require
focus on the development of the energy
sector. It will also require in turn: (i)
rehabilitation of strategic economic
infrastructure; (ii) improvement of
economic governance and available
resource allocation; (iii) reduction in the
importance of the State in the economy and
private sector promotion; and, (iv) rapid
recovery of investment in the economy’s
key sectors and sub-sectors namely
agriculture, fisheries and tourism.
3.2.3 To achieve sustainable economic
growth, it is also necessary to develop
Comoros’ industrial base and implement an
active diversification policy, based in
particular on the establishment of value
chains derived from the above-mentioned
growth-bearing sectors.
3.2.4 The development of industrial
activities mainly based on the processing of
agriculture and fisheries products, assumes
the continuation and deepening of the
structural reforms embarked upon since
2009 to improve the business climate. It is
also urgent to make investments aimed at
significantly reducing factor costs
(especially electricity, water and
telecommunications), with a view to
creating an environment which is likely to
attract foreign direct investment (FDI) as
well as domestic investments.
3.2.5 Bank intervention in the water and
sanitation sector since 2009, alongside
other development partners, will help to
improve the sector’s management and
productivity by 2015, thus fostering access
and price reductions in the three islands.
3.2.6 However, analyses indicate that
the key single constraint to economic
16
diversification in Comoros is access to
modern energy supply. The Government
and other stakeholders have underlined the
urgency of carrying out investments and
reforms of the energy sector. The Bank has
been urged to use its expertise and
experience from other countries to assist
Comoros in developing its energy
resources.
3.2.7 A well-functioning energy supply,
mainly electricity, has many advantages for
the economy. It will result in a rapid and
lasting fall in production costs and lower
the average tariff throughout the Comorian
territory. Water production will also benefit
given the links between energy and water.
Importantly, it will also impact positively
the nascent fisheries industry, which will
require energy for refrigeration and other
capacities, to enable exports of fish to
external markets. Also important will be the
impact on the tourist sector and other
service industries, notably the public
services.
3.2.8 However, the scale of the
financing requirements related to the
restructuring of the energy sector and
scaling up its output presupposes the
concentration of available Bank resources
to maximize their impact and keen efforts
to collaborate with other financiers. Also
important will be a good deal of economic
dialogue to ensure good governance and
credible policy and project implementation.
3.2.9 In light of the foregoing, it is
proposed to focus the Bank Group’s
strategy for the Comoros for the period
2011-2015 on a single pillar entitled
Energy Sector Development in Support of
Economic Diversification.
3.2.10 The pillar comprises key elements
of the focus and competences underlined in
the Bank Group’s Medium-Term Strategy
(2008-2012), analyses of the Regional
Integration Strategy Paper for Eastern
Africa and the existing Bank Group sector
strategies. The pillar draws on the
Government’s recent emphasis on
economic reforms and the need for rapid
diversification of the economy.
3.2.11 Above all, the pillar takes into
account the lessons acquired from the I-
CSP and different consultations with the
Government and other stakeholders on the
major challenges facing the economy in the
medium to long-term.
3.2.12 In looking ahead, the pillar
envisages the following interrelated policy
and sector impacts: (i) enhanced private
sector competitiveness and economic
diversification, by improving the quality of
energy service delivery; and (ii) better
economic governance, through structural
reforms, improved public finance
management (PFM) and fiduciary
framework, and an enhanced private sector
institutional framework.
3.2.13 The second set of items will be a
key feature of the Bank’s effort, since
energy sector development and economic
diversification will require dedicated policy
dialogue, involving all stakeholders. Policy
dialogue will be critical to the country’s
reaching of the Completion Point under the
HIPC Initiative in 2012, and the implied
reduction in indebtedness. Without this, all
efforts at economic diversification will not
succeed.
3.3 Deliverables and Targets
Indicative Lending Programme
3.3.1 The indicative pipeline of projects
(cf. Annex 2) comprises: (i) an energy
sector support project; (ii) a fisheries sector
institutional support project; and (iii) a
budget support operation18
. The
development of the fisheries sector, as
already indicated, will draw heavily on our
support to the energy sector. Likewise,
progress on the economic diversification
front and policy reforms in energy will
18
Cf. Annex 5 on the justification, conditions and
criteria for budget support eligibility, especially in
Fragile States.
17
require dedicated policy dialogue—in
which all stakeholders will participate.
3.3.2 Hence all the three operations
envisaged above have a common theme—
contributing to successful reform and
economic diversification and development
in the Comoros. These operations will be
backed by ADF-12 and FSF Pillar 1
resources. Future operations under the
grant programme of the first two years of
ADF-13 (2014 and 2015) will be fine-tuned
in accordance with the evolution of
Government’s priorities under the 2009-
2014 PRGS (cf. Box 3) and the 2011-2015
CSP mid-term review in 2013.
Box 3: Consultations with Stakeholders
The 2011-2015 CSP was the subject of broad-
based consultations and validation by the
stakeholders, including a workshop organized on
12 September in Moroni as well as sector and
bilateral discussions.
The Bank’s Pillar targeting the energy sector as its
priority has been welcomed by all the stakeholders.
The importance of strengthening the reforms by
targeting governance and the business framework
was emphasized.
Civil society and the private sector wanted the
specific concerns of the three islands, notably
employment, to be taken into consideration to
ensure their smooth development.
The private sector noted that the constraints
affecting it are not sufficiently taken into account
in the national development strategy, especially
access to credit and advisory services.
The Donors raised the importance of presence on
the ground and strengthening coordination among
donors. Cost-sharing mechanisms were also raised.
Analytical Work Programme
3.3.3 The Bank Group will also support
the Government through dedicated studies
and analytical work, the objective of which
will be to support the implementation of the
strategy, provide advice on economic
and/or sector policies, and facilitate
dialogue between the Comorian
Government and the development partners.
3.3.4 The analytical work will help the
Bank to generate a database of information
and economic intelligence with which to
identify and improve the quality at entry of
future operations in Comoros.
3.3.5 The indicative analytical work
programme will include: (i) the second
phase of the diagnosis on sources of
growth; (ii) a private sector profile; and (iii)
strategic studies and master plans for
sectors such as agriculture, tourism and
manufacturing.
Country Dialogue Issues
3.3.6 Throughout the implementation of
the 2011-2015 CSP, the Bank will maintain
permanent dialogue with the Comorian
authorities and the other stakeholders.
3.3.7 The main dialogue topics will be:
(i) strengthening of economic governance
in the broad sense, including the
macroeconomic aspects, structural reforms
and improvement of the business climate;
(ii) revival of the cash crop sub-sectors and
diversification of the economy; (iii)
opportunities for, and strengthening of
regional integration; (iv) strengthening of
coordination and aid effectiveness,
including co-financing opportunities; and,
(v) management and improvement of the
portfolio, in particular monitoring the
implementation of the PIP.
3.3.8 The Bank will consider sustainable
modalities for strengthening its presence on
the ground, in order to enhance dialogue,
portfolio management and donor
coordination. The envisaged modalities will
take into account the Nairobi Regional
Service Centre and the outcome of the
assessment of the Country Programme
Office experience. A cost-sharing
18
mechanism, in which some donors have
expressed interest, will also be envisaged.
3.4 Potential Risks and Mitigation
Measures
3.4.1 Three types of risks could
jeopardize the impact of the Bank’s
strategy.
3.4.2 Political Risk. Countries exiting
crises need time to ease the social tensions
stemming from periods of conflict. The
Comoros has made undeniable progress
regarding the political and social climate.
However, despite the political
normalization, tensions remain.
3.4.3 The creation of social safety nets
and reconversion mechanisms will be
required due, in particular, to the necessary
adjustments to the civil service with a view
to reaching the HIPC completion point in
2012. The provision of targeted budget
support and assistance to economic
diversification and private sector
development should help to prevent this
risk.
3.4.4 Macroeconomic Risk. This risk,
related to the lack of political will to
successfully implement the reforms, could
threaten the attainment of the HIPCI
Completion Point in 2012 and indefinitely
postpone Comoros’ eligibility for MDRI.
This situation could delay the creation of
conditions to improve competitiveness and
diversification with a view to inclusive
economic growth. Through permanent
dialogue and budget support, the Bank
could help to mitigate this risk alongside
the other development partners.
3.4.5 Climate Risk. There could be
cyclone-related floods as well as landslides
caused by erosion, which could weaken the
agriculture sector - currently the main
driver of economic activity in the Union.
The Bank will encourage consultations with
the Government and development partners
with experience in this area. The Bank’s
operations will also incorporate early
warning mechanisms to limit the impact of
climate change-related risks.
3.5 Monitoring and Evaluation
3.5.1 The weakness of the statistics
system and data collection base currently
represents a major constraint with regard to
the monitoring and evaluation of the 2010-
2014 Poverty Reduction and Growth
Strategy (PRGS).
3.5.2 The Bank has provided support for
the development of statistics in the
Comoros, especially under the International
Comparison Programme for Africa (ICP-
Africa) for the 2004-2007 period. This
support has continued under the PRCI and
has led to the production of price statistics
and major progress in the preparation of
national accounts.
3.5.3 During the implementation of the
2011-2015 CSP, the Bank, in synergy with
the other partners, will continue to
participate in strengthening the Comoros
monitoring and evaluation mechanism. In
addition, this aspect will be incorporated
and strengthened in the Bank’s portfolio, in
order to systematize the measuring and
monitoring of outcomes.
3.5.4 The 2011-2015 CSP Result
Framework in Annex 1 will serve as an
instrument for monitoring and evaluation.
The Bank will carry out the CSP mid-term
review during the second quarter of 2013.
This review will assess the progress and
propose, as required, the necessary
adjustments to guarantee the achievement
of outcomes. The CSP completion report
will be prepared in 2015.
IV. CONCLUSIONS AND
RECOMMENDATIONS
4.1 The 2011-2015 CSP for the
Comoros is aligned on the priorities of the
Government’s 2009-2014 Poverty
Reduction and Growth Strategy (PRGS),
the objective of which is to reduce poverty
19
by reviving the economy and promoting
more equitable growth.
4.2 The 2009-2014 PRGS is an
appropriate platform for supporting
Comoros’ development efforts. The
resumption of dialogue with the
international financial community in 2009
laid the foundations for a development
strategy focused on growth and poverty
reduction, the establishment of a
macroeconomic stabilization programme
and the attainment of the HIPCI Decision
Point in June 2011.
4.3 There has been progress in the area
of economic management. However, these
efforts must be pursued and deepened in
order to provide the necessary fresh impetus
to restructure the economy and enable the
Comoros to lay the foundations of
sustainable endogenous development
through inclusive growth.
4.4 The CSP for the 2011-2015 period
is based on a single pillar focused on
energy sector development in support of
economic diversification as the cornerstone
of the Bank’s intervention in the Comoros.
In addition to the resources of the ADF
country allocation and FSF Pillar 1, support
in respect of regional integration and the
private sector will complement the single
pillar to enhance the Bank’s impact on
Comoros’ development.
4.5 The Boards are invited to consider and
approve this 2011-2015 Country Strategy
Paper (CSP) for the Union of the Comoros.
20
Bibliography
*
* *
Ahamada (M.) (2003) “Stratégies le lutte
contre la pauvreté aux Comores’’ [Poverty
Reduction Strategies for Comoros]
Dissertation for Master’s Degree in Economic
Science, The Kofi Annan University of
Guinea, Conakry
Arab Authority for Agricultural Investment
and Development (2007) “Fisheries Sector
Development Strategy’’, August
African Development Bank (2011) ‘’Second
Cycle Assessment for Eligibility of Countries
to the Fragile States Facility (FSF)
Supplemental Support Funding’’, September
African Development Bank (2010)
“Preliminary Diagnosis of Growth Sources’’,
December
African Development Bank (2009) “Gender
Profile of the Union of the Comoros’’,
December
African Development Bank (2009a)
“Economic Reform Support and Financial
Governance Programme (PAREGF)”,
Appraisal Report, July
African Development Bank (2009b)
“Institutional Capacity Building Project
(PRCI)’’, Appraisal Report, May
African Development Bank (2009c) ‘’Interim
Country Strategy Paper (2009-2010)’’, March
African Development Bank (2008)
“Operations Guidelines of the Fragile States
Facility (FSF)’’, July
Central Bank of Comoros (2011) “Evolution
de la situation économique, financière et
monétaire des Comores en 2010’’ [Trend of
Economic, Financial and Monetary Situation
in the Comoros in 2010], April
Bank of France (2010) “Franc Zone Annual
Report’’, Paris
Banque de France (2005) “Migrant
Remittances to Comoros’’, Franc Zone Annual
Report, Paris
World Bank (2009) “Worldwide Governance
Indicators - 2006-2008’’, Governance Matters,
Washington
General Planning Commission (2009 Poverty
Reduction and Growth Strategy (PRGS, 2010-
2014), August
General Planning Commission (2003)
“Document d’orientation pour la relance du
secteur privé aux Comores’’ [‘Guidance
Document on Private Sector Recovery in the
Comoros\]
Da Cruz (V.), Fengler (W.) and Schwartzman
(A.) (2004) “Remittances to Comoros,
Volume, Trends, Impact and Implications’’,
World Bank, Africa Region Working Paper
Series, no. 75
International Monetary Fund (2011) “2010
Article IV Consultation and Second Review
under the Extended Credit Facility’’,
Washington
Idi-Mohamed (A.) (2007) “Tourism Sector
Study’’, report written in the context of the
preparation of the Poverty Reduction and
Growth Strategy, July
Kassimo (M.) (2007) “Agriculture Sector
Diagnostic Study’’, United Nations
Development Programme, Moroni
Ministry of Labour and Employment (2007)
“Framework Document on the National
Employment Policy in the Comoros’’, Moroni
Ministry of Environment (2005) “Energy
Sector Note’’, Conference of the partners of
the Union of the Comoros, December
Ministry of Finance, Budget and Economy
(2009) “Economic and Financial Policy
Memorandum’’, September
Naji (M.); and Youssouf (A.) (2007)
“Fisheries Sector Report” report written in the
context of the Poverty Reduction and Growth
Strategy, June
21
Food and Agriculture Organization of the
United Nations (2004) “Fisheries
Development Strategy’’, Rome
United Nations Development Programme
(2007) “Comoros Diagnostic Trade
Integration Study’’, Moroni
United Nations Development Programme
(2005) “Impact Study on Microcredit’s and
Activity Sectors in the Comoros’’, Moroni
United Nations Development Programme
(2005) “Study on Malfunctions of Inter-Island
Trade in Agricultural and Fishery Products’’,
Moroni
Rocher (E.), Pelletier (N.) (2008) “Migrant
Workers’ Remittances: What is the Impact on
the Economic and Financial Development of
Sub-Saharan African Countries” Bank of
France Bulletin no. 173, May–June
United Nations System (2008) “United
Nations Development Assistance Framework
Action Plan for 2008-2012’’, Moroni.

22
ANNEXES
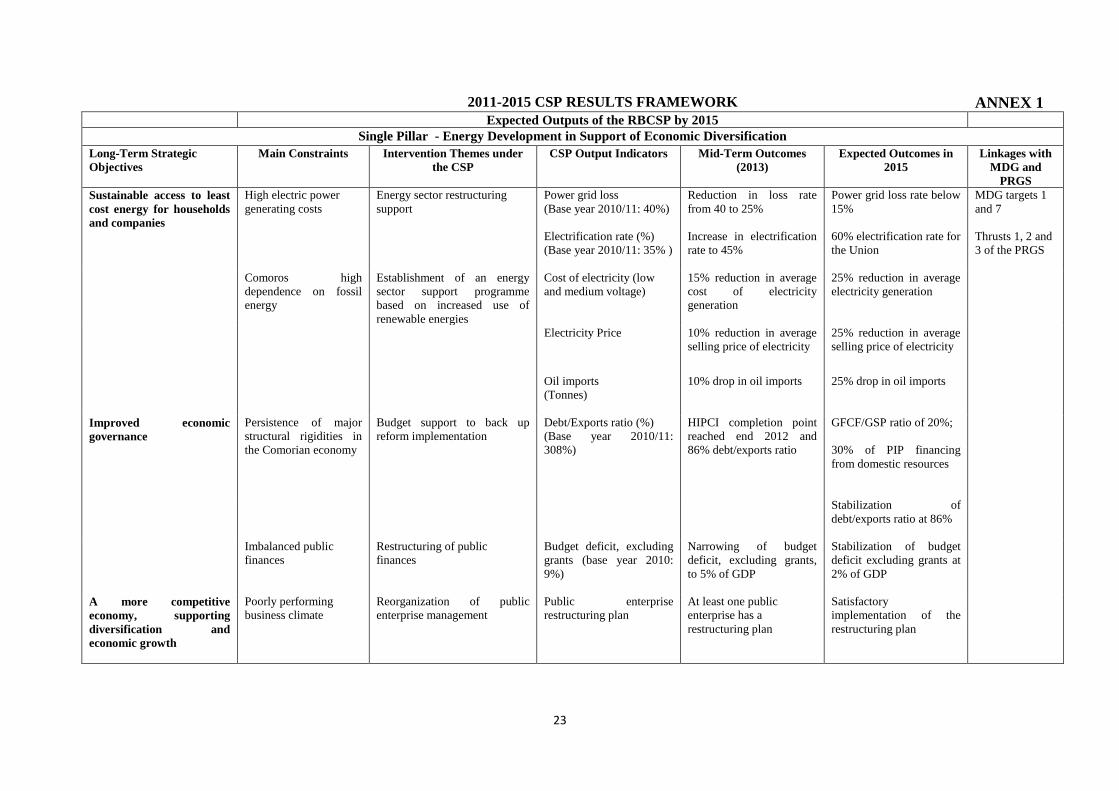
23
2011-2015 CSP RESULTS FRAMEWORK ANNEX 1
Expected Outputs of the RBCSP by 2015
Single Pillar - Energy Development in Support of Economic Diversification
Long-Term Strategic
Objectives
Main Constraints Intervention Themes under
the CSP
CSP Output Indicators Mid-Term Outcomes
(2013)
Expected Outcomes in
2015
Linkages with
MDG and
PRGS
Sustainable access to least
cost energy for households
and companies
High electric power
generating costs
Energy sector restructuring
support
Power grid loss
(Base year 2010/11: 40%)
Electrification rate (%)
(Base year 2010/11: 35% )
Reduction in loss rate
from 40 to 25%
Increase in electrification
rate to 45%
Power grid loss rate below
15%
60% electrification rate for
the Union
MDG targets 1
and 7
Thrusts 1, 2 and
3 of the PRGS
Comoros high
dependence on fossil
energy
Establishment of an energy
sector support programme
based on increased use of
renewable energies
Cost of electricity (low
and medium voltage)
15% reduction in average
cost of electricity
generation
25% reduction in average
electricity generation
Electricity Price
10% reduction in average
selling price of electricity
25% reduction in average
selling price of electricity
Oil imports
(Tonnes)
10% drop in oil imports 25% drop in oil imports
Improved economic
governance
Persistence of major
structural rigidities in
the Comorian economy
Budget support to back up
reform implementation
Debt/Exports ratio (%)
(Base year 2010/11:
308%)
HIPCI completion point
reached end 2012 and
86% debt/exports ratio
GFCF/GSP ratio of 20%;
30% of PIP financing
from domestic resources
Stabilization of
debt/exports ratio at 86%
Imbalanced public
finances
Restructuring of public
finances
Budget deficit, excluding
grants (base year 2010:
9%)
Narrowing of budget
deficit, excluding grants,
to 5% of GDP
Stabilization of budget
deficit excluding grants at
2% of GDP
A more competitive
economy, supporting
diversification and
economic growth
Poorly performing
business climate
Reorganization of public
enterprise management
Public enterprise
restructuring plan
At least one public
enterprise has a
restructuring plan
Satisfactory
implementation of the
restructuring plan
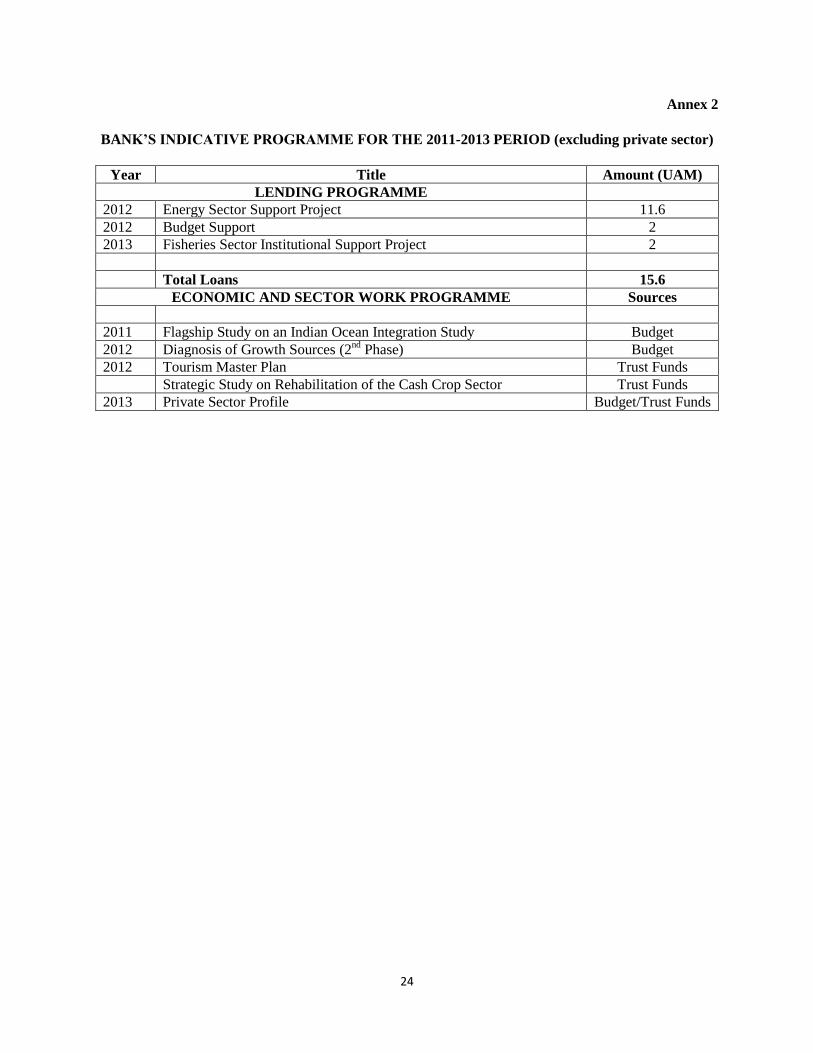
24
Annex 2
BANK’S INDICATIVE PROGRAMME FOR THE 2011-2013 PERIOD (excluding private sector)
Year Title Amount (UAM)
LENDING PROGRAMME
2012 Energy Sector Support Project 11.6
2012 Budget Support 2
2013 Fisheries Sector Institutional Support Project 2
Total Loans 15.6
ECONOMIC AND SECTOR WORK PROGRAMME Sources
2011 Flagship Study on an Indian Ocean Integration Study Budget
2012 Diagnosis of Growth Sources (2nd
Phase) Budget
2012 Tourism Master Plan Trust Funds
Strategic Study on Rehabilitation of the Cash Crop Sector Trust Funds
2013 Private Sector Profile Budget/Trust Funds
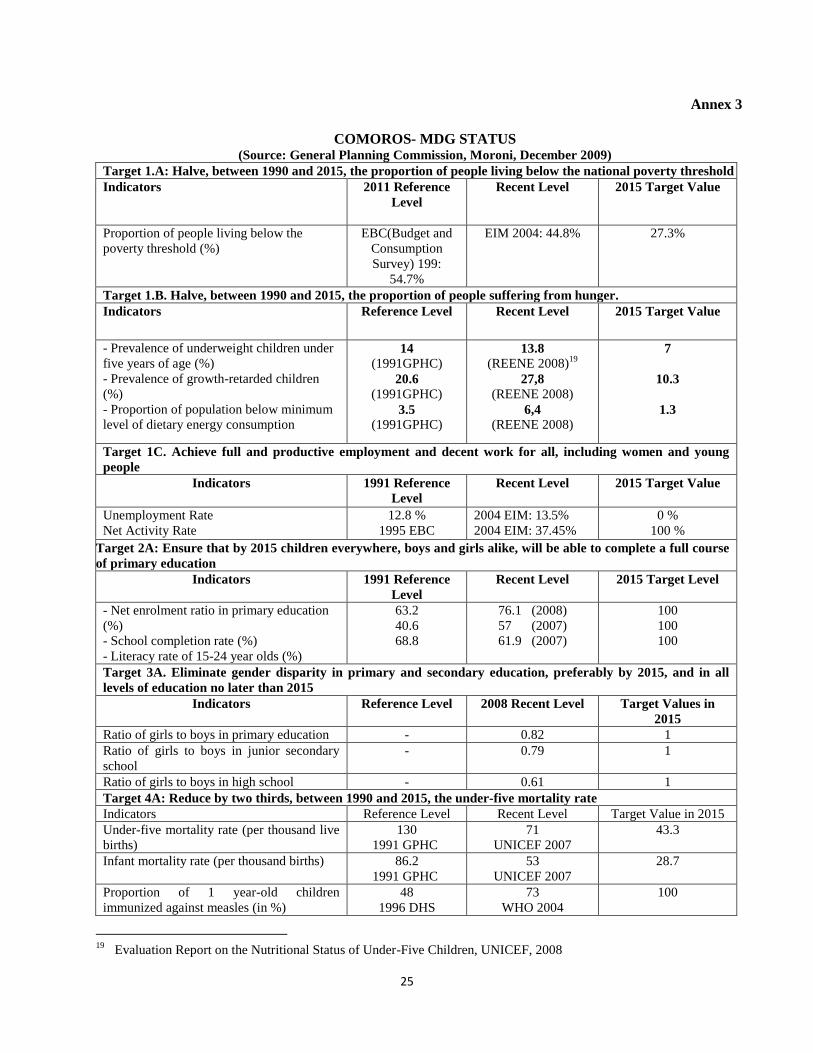
25
Annex 3
COMOROS- MDG STATUS
(Source: General Planning Commission, Moroni, December 2009)
Target 1.A: Halve, between 1990 and 2015, the proportion of people living below the national poverty threshold
Indicators 2011 Reference
Level
Recent Level
2015 Target Value
Proportion of people living below the
poverty threshold (%)
EBC(Budget and
Consumption
Survey) 199:
54.7%
EIM 2004: 44.8% 27.3%
Target 1.B. Halve, between 1990 and 2015, the proportion of people suffering from hunger.
Indicators Reference Level Recent Level 2015 Target Value
- Prevalence of underweight children under
five years of age (%)
- Prevalence of growth-retarded children
(%)
- Proportion of population below minimum
level of dietary energy consumption
14
(1991GPHC)
20.6
(1991GPHC)
3.5
(1991GPHC)
13.8
(REENE 2008)19
27,8
(REENE 2008)
6,4
(REENE 2008)
7
10.3
1.3
Target 1C. Achieve full and productive employment and decent work for all, including women and young
people
Indicators 1991 Reference
Level
Recent Level 2015 Target Value
Unemployment Rate
Net Activity Rate
12.8 %
1995 EBC
2004 EIM: 13.5%
2004 EIM: 37.45%
0 %
100 %
Target 2A: Ensure that by 2015 children everywhere, boys and girls alike, will be able to complete a full course
of primary education
Indicators 1991 Reference
Level
Recent Level 2015 Target Level
- Net enrolment ratio in primary education
(%)
- School completion rate (%)
- Literacy rate of 15-24 year olds (%)
63.2
40.6
68.8
76.1 (2008)
57 (2007)
61.9 (2007)
100
100
100
Target 3A. Eliminate gender disparity in primary and secondary education, preferably by 2015, and in all
levels of education no later than 2015
Indicators Reference Level 2008 Recent Level Target Values in
2015
Ratio of girls to boys in primary education - 0.82 1
Ratio of girls to boys in junior secondary
school
- 0.79 1
Ratio of girls to boys in high school - 0.61 1
Target 4A: Reduce by two thirds, between 1990 and 2015, the under-five mortality rate
Indicators Reference Level Recent Level Target Value in 2015
Under-five mortality rate (per thousand live
births)
130
1991 GPHC
71
UNICEF 2007
43.3
Infant mortality rate (per thousand births) 86.2
1991 GPHC
53
UNICEF 2007
28.7
Proportion of 1 year-old children
immunized against measles (in %)
48
1996 DHS
73
WHO 2004
100
19
Evaluation Report on the Nutritional Status of Under-Five Children, UNICEF, 2008
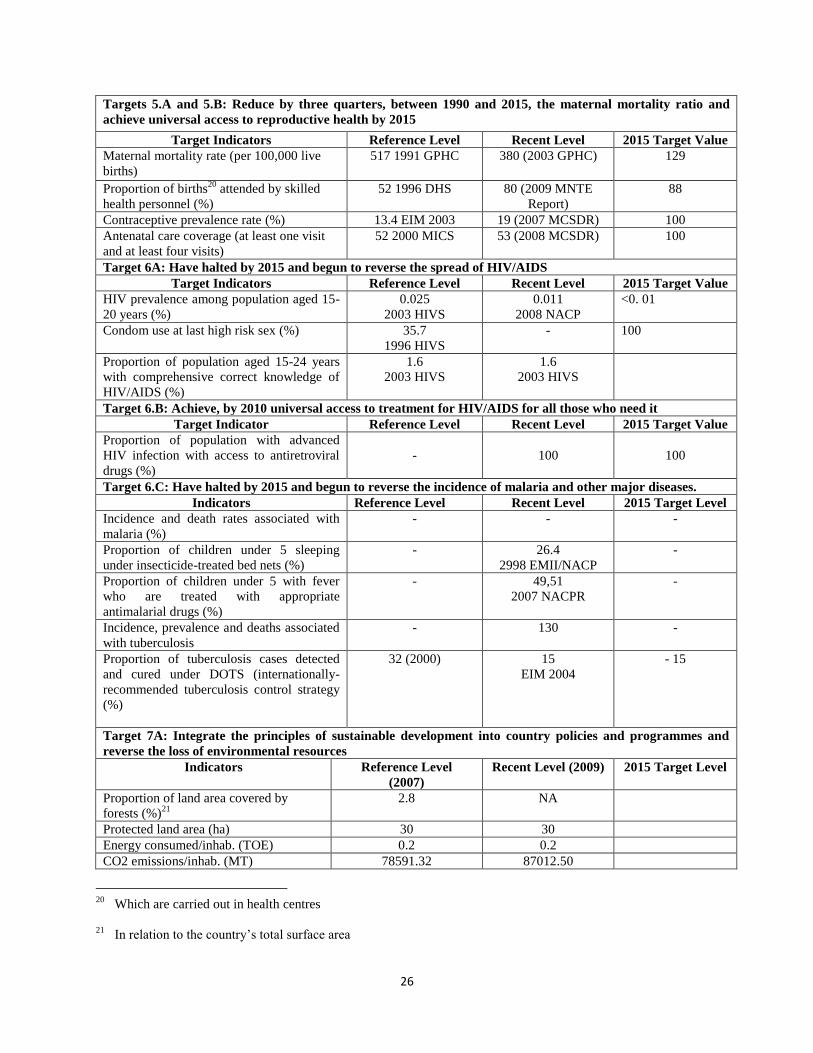
26
Targets 5.A and 5.B: Reduce by three quarters, between 1990 and 2015, the maternal mortality ratio and
achieve universal access to reproductive health by 2015
Target Indicators Reference Level Recent Level 2015 Target Value
Maternal mortality rate (per 100,000 live
births)
517 1991 GPHC 380 (2003 GPHC) 129
Proportion of births20
attended by skilled
health personnel (%)
52 1996 DHS 80 (2009 MNTE
Report)
88
Contraceptive prevalence rate (%) 13.4 EIM 2003 19 (2007 MCSDR) 100
Antenatal care coverage (at least one visit
and at least four visits)
52 2000 MICS 53 (2008 MCSDR) 100
Target 6A: Have halted by 2015 and begun to reverse the spread of HIV/AIDS
Target Indicators Reference Level Recent Level 2015 Target Value
HIV prevalence among population aged 15-
20 years (%)
0.025
2003 HIVS
0.011
2008 NACP
<0. 01
Condom use at last high risk sex (%) 35.7
1996 HIVS
- 100
Proportion of population aged 15-24 years
with comprehensive correct knowledge of
HIV/AIDS (%)
1.6
2003 HIVS
1.6
2003 HIVS
Target 6.B: Achieve, by 2010 universal access to treatment for HIV/AIDS for all those who need it
Target Indicator Reference Level Recent Level 2015 Target Value
Proportion of population with advanced
HIV infection with access to antiretroviral
drugs (%)
-
100
100
Target 6.C: Have halted by 2015 and begun to reverse the incidence of malaria and other major diseases.
Indicators Reference Level Recent Level 2015 Target Level
Incidence and death rates associated with
malaria (%)
- - -
Proportion of children under 5 sleeping
under insecticide-treated bed nets (%)
- 26.4
2998 EMII/NACP
-
Proportion of children under 5 with fever
who are treated with appropriate
antimalarial drugs (%)
- 49,51
2007 NACPR
-
Incidence, prevalence and deaths associated
with tuberculosis
- 130 -
Proportion of tuberculosis cases detected
and cured under DOTS (internationally-
recommended tuberculosis control strategy
(%)
32 (2000) 15
EIM 2004
- 15
Target 7A: Integrate the principles of sustainable development into country policies and programmes and
reverse the loss of environmental resources
Indicators Reference Level
(2007)
Recent Level (2009) 2015 Target Level
Proportion of land area covered by
forests (%)21
2.8 NA
Protected land area (ha) 30 30
Energy consumed/inhab. (TOE) 0.2 0.2
CO2 emissions/inhab. (MT) 78591.32 87012.50
20
Which are carried out in health centres
21
In relation to the country’s total surface area
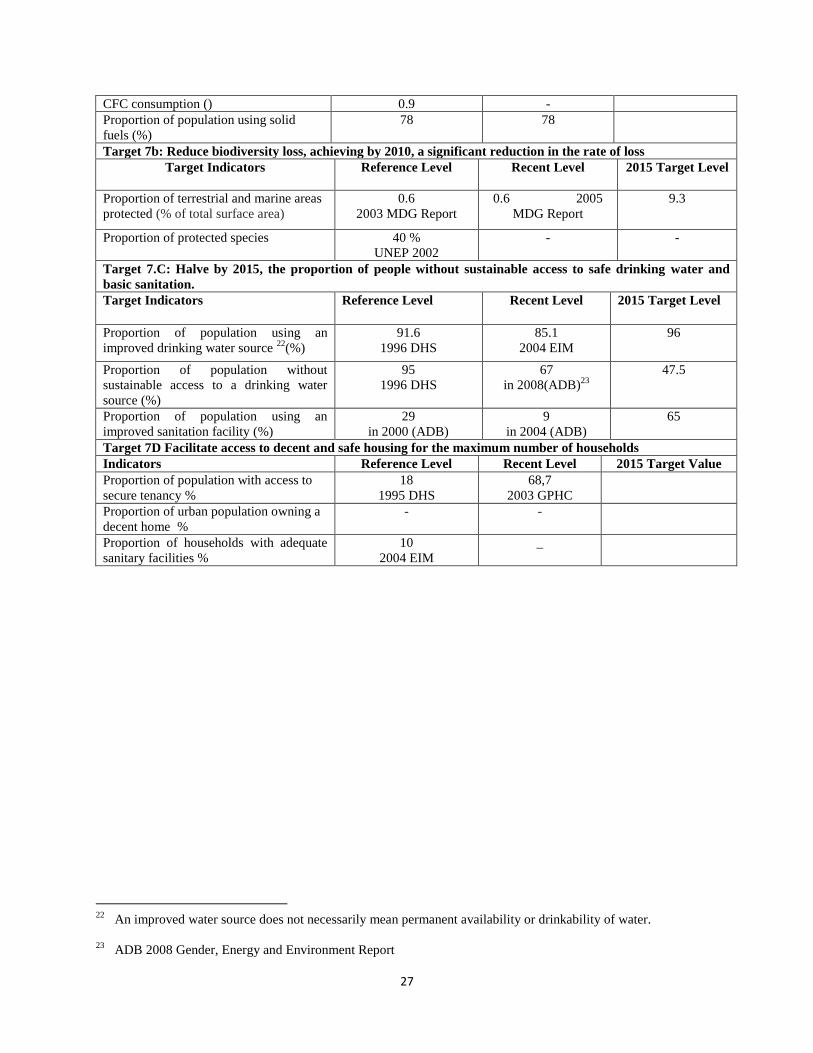
27
CFC consumption () 0.9 -
Proportion of population using solid
fuels (%)
78 78
Target 7b: Reduce biodiversity loss, achieving by 2010, a significant reduction in the rate of loss
Target Indicators
Reference Level
Recent Level
2015 Target Level
Proportion of terrestrial and marine areas
protected (% of total surface area)
0.6
2003 MDG Report
0.6 2005
MDG Report
9.3
Proportion of protected species 40 %
UNEP 2002
- -
Target 7.C: Halve by 2015, the proportion of people without sustainable access to safe drinking water and
basic sanitation.
Target Indicators Reference Level Recent Level 2015 Target Level
Proportion of population using an
improved drinking water source 22
(%)
91.6
1996 DHS
85.1
2004 EIM
96
Proportion of population without
sustainable access to a drinking water
source (%)
95
1996 DHS
67
in 2008(ADB)23
47.5
Proportion of population using an
improved sanitation facility (%)
29
in 2000 (ADB)
9
in 2004 (ADB)
65
Target 7D Facilitate access to decent and safe housing for the maximum number of households
Indicators Reference Level Recent Level 2015 Target Value
Proportion of population with access to
secure tenancy %
18
1995 DHS
68,7
2003 GPHC
Proportion of urban population owning a
decent home %
- -
Proportion of households with adequate
sanitary facilities %
10
2004 EIM
_
22
An improved water source does not necessarily mean permanent availability or drinkability of water.
23
ADB 2008 Gender, Energy and Environment Report
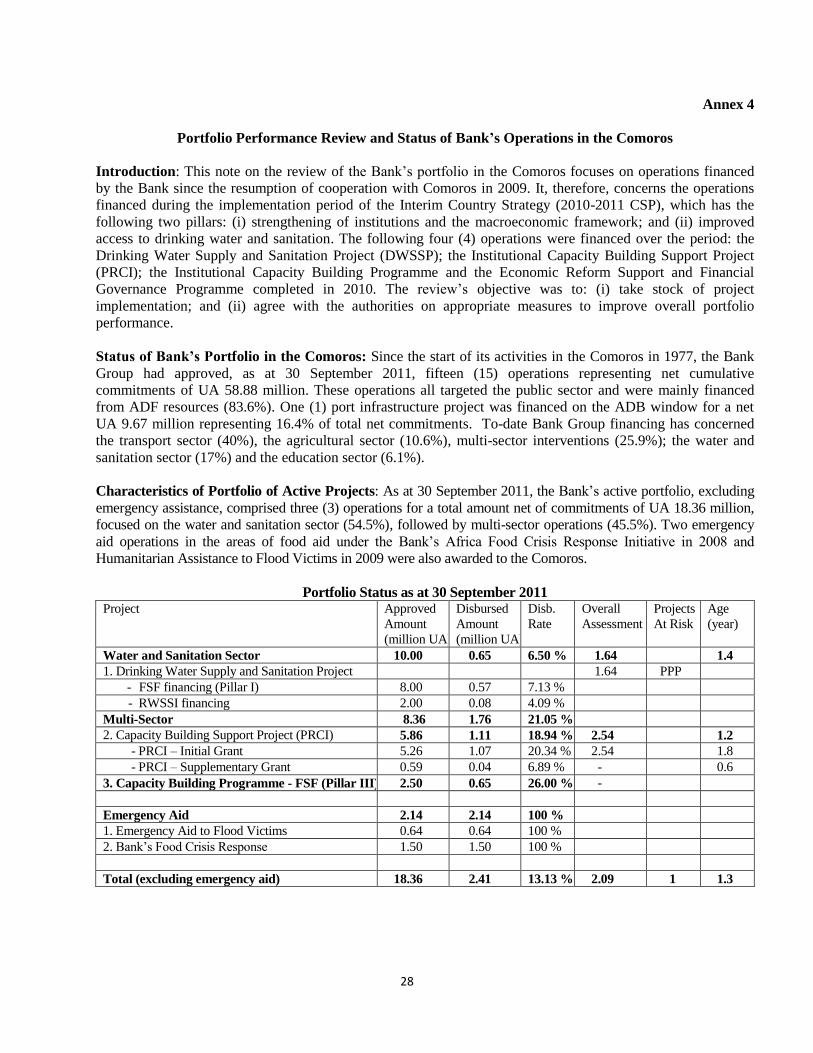
28
Annex 4
Portfolio Performance Review and Status of Bank’s Operations in the Comoros
Introduction: This note on the review of the Bank’s portfolio in the Comoros focuses on operations financed
by the Bank since the resumption of cooperation with Comoros in 2009. It, therefore, concerns the operations
financed during the implementation period of the Interim Country Strategy (2010-2011 CSP), which has the
following two pillars: (i) strengthening of institutions and the macroeconomic framework; and (ii) improved
access to drinking water and sanitation. The following four (4) operations were financed over the period: the
Drinking Water Supply and Sanitation Project (DWSSP); the Institutional Capacity Building Support Project
(PRCI); the Institutional Capacity Building Programme and the Economic Reform Support and Financial
Governance Programme completed in 2010. The review’s objective was to: (i) take stock of project
implementation; and (ii) agree with the authorities on appropriate measures to improve overall portfolio
performance.
Status of Bank’s Portfolio in the Comoros: Since the start of its activities in the Comoros in 1977, the Bank
Group had approved, as at 30 September 2011, fifteen (15) operations representing net cumulative
commitments of UA 58.88 million. These operations all targeted the public sector and were mainly financed
from ADF resources (83.6%). One (1) port infrastructure project was financed on the ADB window for a net
UA 9.67 million representing 16.4% of total net commitments. To-date Bank Group financing has concerned
the transport sector (40%), the agricultural sector (10.6%), multi-sector interventions (25.9%); the water and
sanitation sector (17%) and the education sector (6.1%).
Characteristics of Portfolio of Active Projects: As at 30 September 2011, the Bank’s active portfolio, excluding
emergency assistance, comprised three (3) operations for a total amount net of commitments of UA 18.36 million,
focused on the water and sanitation sector (54.5%), followed by multi-sector operations (45.5%). Two emergency
aid operations in the areas of food aid under the Bank’s Africa Food Crisis Response Initiative in 2008 and
Humanitarian Assistance to Flood Victims in 2009 were also awarded to the Comoros.
Portfolio Status as at 30 September 2011 Project Approved
Amount
(million UA)
Disbursed
Amount
(million UA)
Disb.
Rate
Overall
Assessment
Projects
At Risk
Age
(year)
Water and Sanitation Sector 10.00 0.65 6.50 % 1.64 1.4
1. Drinking Water Supply and Sanitation Project 1.64 PPP
- FSF financing (Pillar I) 8.00 0.57 7.13 %
- RWSSI financing 2.00 0.08 4.09 %
Multi-Sector 8.36 1.76 21.05 %
2. Capacity Building Support Project (PRCI) 5.86 1.11 18.94 % 2.54 1.2
- PRCI – Initial Grant 5.26 1.07 20.34 % 2.54 1.8
- PRCI – Supplementary Grant 0.59 0.04 6.89 % - 0.6
3. Capacity Building Programme - FSF (Pillar III) 2.50 0.65 26.00 % -
Emergency Aid 2.14 2.14 100 %
1. Emergency Aid to Flood Victims 0.64 0.64 100 %
2. Bank’s Food Crisis Response 1.50 1.50 100 %
Total (excluding emergency aid) 18.36 2.41 13.13 % 2.09 1 1.3
29
Portfolio Performance: The overall cumulative average disbursement rate of the active portfolio as at 30
September 2011 was 13.13% (excluding emergency aid). This disbursement rate is below the Bank Group’s
average of 27% for 2010. This low rate is partially due to implementation difficulties and the fairly young age of the
portfolio (average age: 1.3 years, excluding emergency assistance).
The Drinking Water Supply and Sanitation Project appears to be a potentially problematic project (PPP) because of
the delay in fulfilling the conditions precedent to disbursement and the poor implementation performance achieved.
Consequently, the portfolio at risk (PAR) of Bank operations in the Comoros was 33% as at 30 September 2011,
with commitments at risk (CAR) representing 55% of the total portfolio.
With a score of 2.09, the portfolio performance is rated satisfactory overall. This performance must, however,
be seen in perspective, in view of the difficulties encountered and challenges to be addressed.
The Project Portfolio Performance Review revealed the main problems impeding the smooth implementation of
projects in the Comoros. These mainly affect the Drinking Water Supply and Sanitation Project (DWSSP) and
concern: (i) long gaps between loan approval, effectiveness and first disbursement; (ii) the weak capacity of
executing agencies and implementation units, especially regarding the procurement of goods and services and
disbursement; (iii) non-compliance with reporting requirements (conduct of audits, particularly regarding
emergency food aid); (iv) lack of communication between project implementation units; (v) abnormally long time
taken to process documents at the Bank; and (vi) weak coordination and lack of consultation between the different
entities involved in monitoring Bank-financed projects.
Main Recommendations
To address the difficulties encountered in operations implementation, the Bank and the Government have agreed on
the following recommendations incorporated into the Portfolio Performance Improvement Plan (PPIP):
At Government level
Intensify monitoring of the ADB portfolio by designating a specific resource person at the
General Planning Commission (CGP) responsible for interface between the Project
Coordinator, the oversight bodies and the Bank;
Organize regular ADB portfolio monitoring meetings to identify and present problems
upstream and keep the Bank informed;
Take measures to fulfil the loan and grant conditions precedent to disbursement within
the stipulated timeframes; and comply with the Bank’s reporting and audit requirements.
At Bank level
Carry out close portfolio monitoring by organizing quarterly videoconference monitoring
meetings;
Increase the number of project supervision missions to three (3) missions per year; and
Implement a training programme for project officers.

30
Specific Recommendations were also formulated for each operation and concern:
1. Institutional Capacity Building Operation (PRCI)
For the Government:
Accelerate the pace of public finance reforms in accordance with the Government’s
commitments to the IMF and the thrusts of the Programme supported by the Extended
Credit Facility in order to be able to reach the HIPCI Completion Point;
Speed up activities under the PRCI supplementary grant; and
Clarify relations as well as the method of coordination between the projects of the
different donors intervening in the governance sector.
For the Bank:
Act diligently in processing non-objection opinions relating to the activities planned
under the PRCI supplementary grant
2. Drinking Water Supply and Sanitation Project
For the Government:
Step up project monitoring by the oversight authorities and the General Planning
Commission (CGP);
Intensify exchanges of experiences and collaboration between the PRCI and DWSSP
regarding the preparation of bidding documents; and
Speed up the conduct of the MAMWE technical and financial audit in order to fulfil the
conditions of the structural reform programme supported by the IMF and development
partners
For the Bank
Speed up the processing of documents, in particular, procurement-related non-objection
opinions;
Carry out a project supervision mission in the fourth quarter of 2011 and maintain at least
2 the number of supervisions in 2012 and 2013;
3. Emergency Humanitarian Aid to Flood Victims
For the Government:

31
Ensure close monitoring of the final implementation phase of the UNICEF project;
4. Bank’s Africa Food Crisis Response
For the Government:
Conduct a food aid audit and submit the report to the Bank by end 2011.
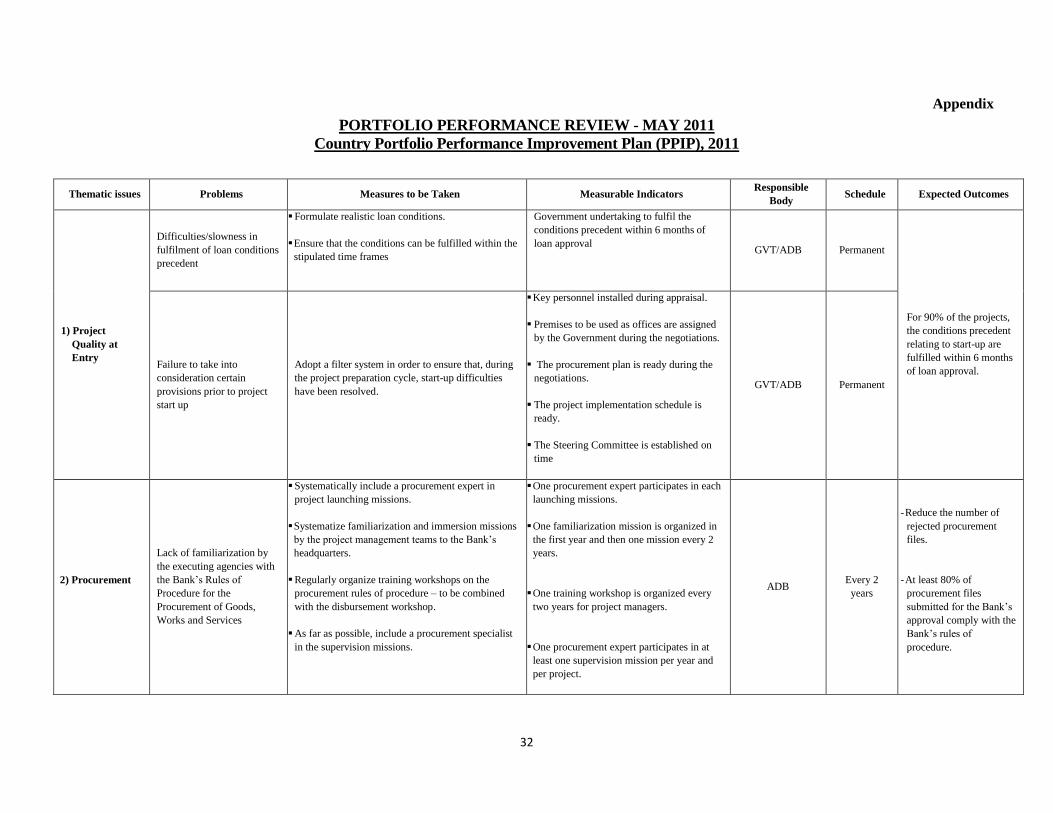
32
Appendix
PORTFOLIO PERFORMANCE REVIEW - MAY 2011
Country Portfolio Performance Improvement Plan (PPIP), 2011
Thematic issues Problems Measures to be Taken Measurable Indicators Responsible
Body Schedule Expected Outcomes
1) Project
Quality at
Entry
Difficulties/slowness in
fulfilment of loan conditions
precedent
Formulate realistic loan conditions.
Ensure that the conditions can be fulfilled within the
stipulated time frames
Government undertaking to fulfil the
conditions precedent within 6 months of
loan approval GVT/ADB Permanent
For 90% of the projects,
the conditions precedent
relating to start-up are
fulfilled within 6 months
of loan approval. Failure to take into
consideration certain
provisions prior to project
start up
Adopt a filter system in order to ensure that, during
the project preparation cycle, start-up difficulties
have been resolved.
Key personnel installed during appraisal.
Premises to be used as offices are assigned
by the Government during the negotiations.
The procurement plan is ready during the
negotiations.
The project implementation schedule is
ready.
The Steering Committee is established on
time
GVT/ADB Permanent
2) Procurement
Lack of familiarization by
the executing agencies with
the Bank’s Rules of
Procedure for the
Procurement of Goods,
Works and Services
Systematically include a procurement expert in
project launching missions.
Systematize familiarization and immersion missions
by the project management teams to the Bank’s
headquarters.
Regularly organize training workshops on the
procurement rules of procedure – to be combined
with the disbursement workshop.
As far as possible, include a procurement specialist
in the supervision missions.
One procurement expert participates in each
launching missions.
One familiarization mission is organized in
the first year and then one mission every 2
years.
One training workshop is organized every
two years for project managers.
One procurement expert participates in at
least one supervision mission per year and
per project.
ADB Every 2
years
- Reduce the number of
rejected procurement
files.
- At least 80% of
procurement files
submitted for the Bank’s
approval comply with the
Bank’s rules of
procedure.
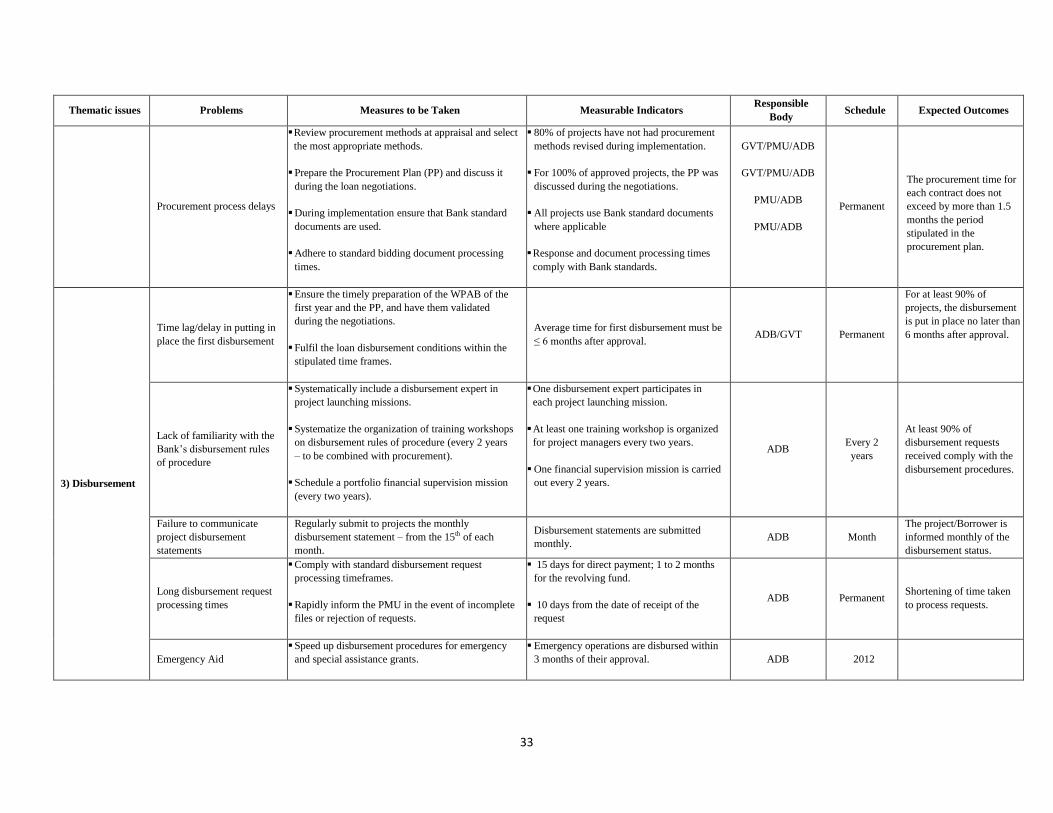
33
Thematic issues Problems Measures to be Taken Measurable Indicators Responsible
Body Schedule Expected Outcomes
Procurement process delays
Review procurement methods at appraisal and select
the most appropriate methods.
Prepare the Procurement Plan (PP) and discuss it
during the loan negotiations.
During implementation ensure that Bank standard
documents are used.
Adhere to standard bidding document processing
times.
80% of projects have not had procurement
methods revised during implementation.
For 100% of approved projects, the PP was
discussed during the negotiations.
All projects use Bank standard documents
where applicable
Response and document processing times
comply with Bank standards.
GVT/PMU/ADB
GVT/PMU/ADB
PMU/ADB
PMU/ADB
Permanent
The procurement time for
each contract does not
exceed by more than 1.5
months the period
stipulated in the
procurement plan.
3) Disbursement
Time lag/delay in putting in
place the first disbursement
Ensure the timely preparation of the WPAB of the
first year and the PP, and have them validated
during the negotiations.
Fulfil the loan disbursement conditions within the
stipulated time frames.
Average time for first disbursement must be
≤ 6 months after approval. ADB/GVT Permanent
For at least 90% of
projects, the disbursement
is put in place no later than
6 months after approval.
Lack of familiarity with the
Bank’s disbursement rules
of procedure
Systematically include a disbursement expert in
project launching missions.
Systematize the organization of training workshops
on disbursement rules of procedure (every 2 years
– to be combined with procurement).
Schedule a portfolio financial supervision mission
(every two years).
One disbursement expert participates in
each project launching mission.
At least one training workshop is organized
for project managers every two years.
One financial supervision mission is carried
out every 2 years.
ADB Every 2
years
At least 90% of
disbursement requests
received comply with the
disbursement procedures.
Failure to communicate
project disbursement
statements
Regularly submit to projects the monthly
disbursement statement – from the 15th of each
month.
Disbursement statements are submitted
monthly. ADB Month
The project/Borrower is
informed monthly of the
disbursement status.
Long disbursement request
processing times
Comply with standard disbursement request
processing timeframes.
Rapidly inform the PMU in the event of incomplete
files or rejection of requests.
15 days for direct payment; 1 to 2 months
for the revolving fund.
10 days from the date of receipt of the
request
ADB Permanent Shortening of time taken
to process requests.
Emergency Aid Speed up disbursement procedures for emergency
and special assistance grants.
Emergency operations are disbursed within
3 months of their approval. ADB 2012
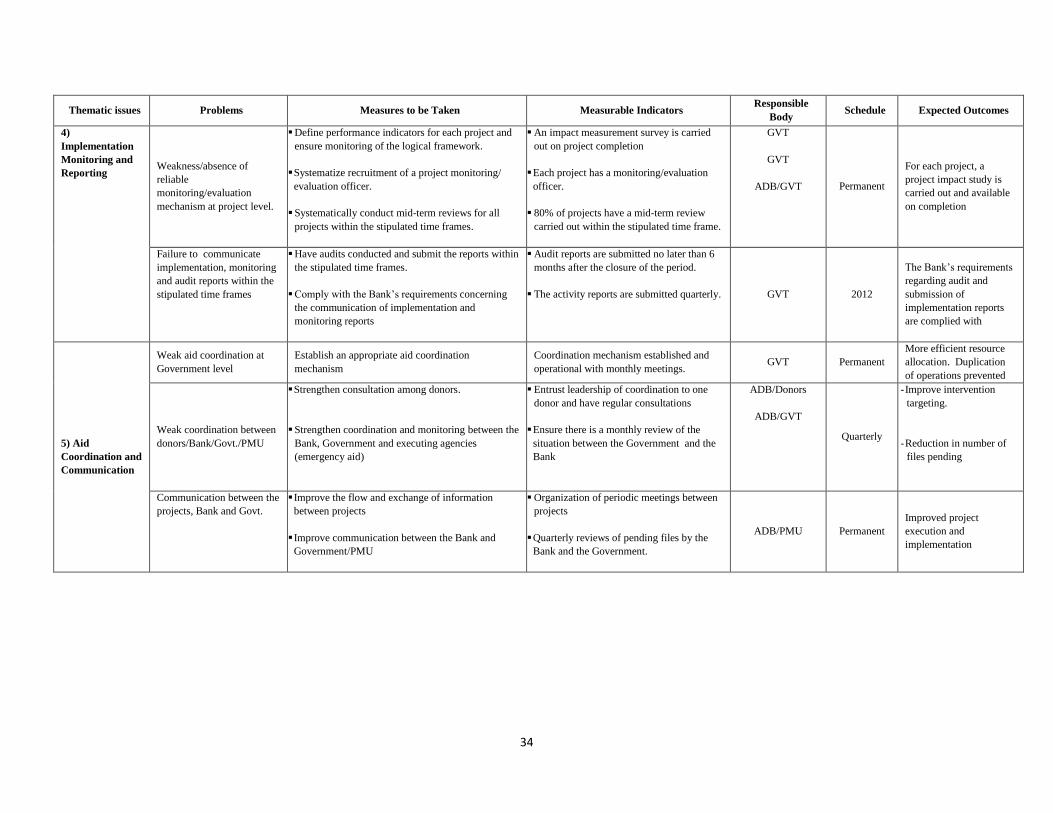
34
Thematic issues Problems Measures to be Taken Measurable Indicators Responsible
Body Schedule Expected Outcomes
4)
Implementation
Monitoring and
Reporting Weakness/absence of
reliable
monitoring/evaluation
mechanism at project level.
Define performance indicators for each project and
ensure monitoring of the logical framework.
Systematize recruitment of a project monitoring/
evaluation officer.
Systematically conduct mid-term reviews for all
projects within the stipulated time frames.
An impact measurement survey is carried
out on project completion
Each project has a monitoring/evaluation
officer.
80% of projects have a mid-term review
carried out within the stipulated time frame.
GVT
GVT
ADB/GVT Permanent
For each project, a
project impact study is
carried out and available
on completion
Failure to communicate
implementation, monitoring
and audit reports within the
stipulated time frames
Have audits conducted and submit the reports within
the stipulated time frames.
Comply with the Bank’s requirements concerning
the communication of implementation and
monitoring reports
Audit reports are submitted no later than 6
months after the closure of the period.
The activity reports are submitted quarterly. GVT 2012
The Bank’s requirements
regarding audit and
submission of
implementation reports
are complied with
5) Aid
Coordination and
Communication
Weak aid coordination at
Government level
Establish an appropriate aid coordination
mechanism
Coordination mechanism established and
operational with monthly meetings. GVT Permanent
More efficient resource
allocation. Duplication
of operations prevented
Weak coordination between
donors/Bank/Govt./PMU
Strengthen consultation among donors.
Strengthen coordination and monitoring between the
Bank, Government and executing agencies
(emergency aid)
Entrust leadership of coordination to one
donor and have regular consultations
Ensure there is a monthly review of the
situation between the Government and the
Bank
ADB/Donors
ADB/GVT
Quarterly
- Improve intervention
targeting.
- Reduction in number of
files pending
Communication between the
projects, Bank and Govt.
Improve the flow and exchange of information
between projects
Improve communication between the Bank and
Government/PMU
Organization of periodic meetings between
projects
Quarterly reviews of pending files by the
Bank and the Government.
ADB/PMU Permanent
Improved project
execution and
implementation
35
Annex 5
Justification for the use of FSF Resources in Support of Reforms
1. To support the measures envisaged and implemented concerning the strengthening of national
systems, particularly within the context of close coordination with the other donors, this CSP may provide
support to the reforms in the Comoros in the form of budget support. The latter will help to effectively
bolster the voluntary measures adopted by the Government and confirmed in the IMF programme finance
under the Extended Credit Facility (ECF), the aim of which is to restore a sound economic and budgetary
situation favourable to growth and poverty reduction.
2. Reform support will help to stabilize the economic and budgetary situation, contribute to the
financing of budget execution, mitigate the impact of the global financial crisis, and pursue
implementation of reforms aimed at improving public finance management especially with regard to
domestic resource mobilization, and improve the investment environment. The reforms will be specified
during preparation of the operation and will take into account the priority reforms that the authorities must
implement as well as those reforms backed by other technical and financial partners.
3. This support will bolster and complement the activities carried out under the PRCI as well as
those financed under FSF Pillar 3. The Comoros meets the conditions required to benefit from budgetary
support as set forth in the Bank’s policy on implementation of budget support and its Fragile States
policy. These conditions are summarized in the Table below. This budget support will be implemented in
close collaboration with the development partner community, including the World Bank with which a
joint budget support is envisaged in 2012. Safeguard measures will be taken to guarantee the success of
the reform support. They will concern, in particular, the pursuit of dialogue and close monitoring of the
reform support process in collaboration with our partners. The Bank’s budget support will be in two equal
tranches of UA 1 million, i.e. a total of UA 2 million covering the 2012-2013 period. Disbursement of the
two tranches will be subject to the satisfactory progress of the IMF Programme and implementation of the
priority structural reforms.
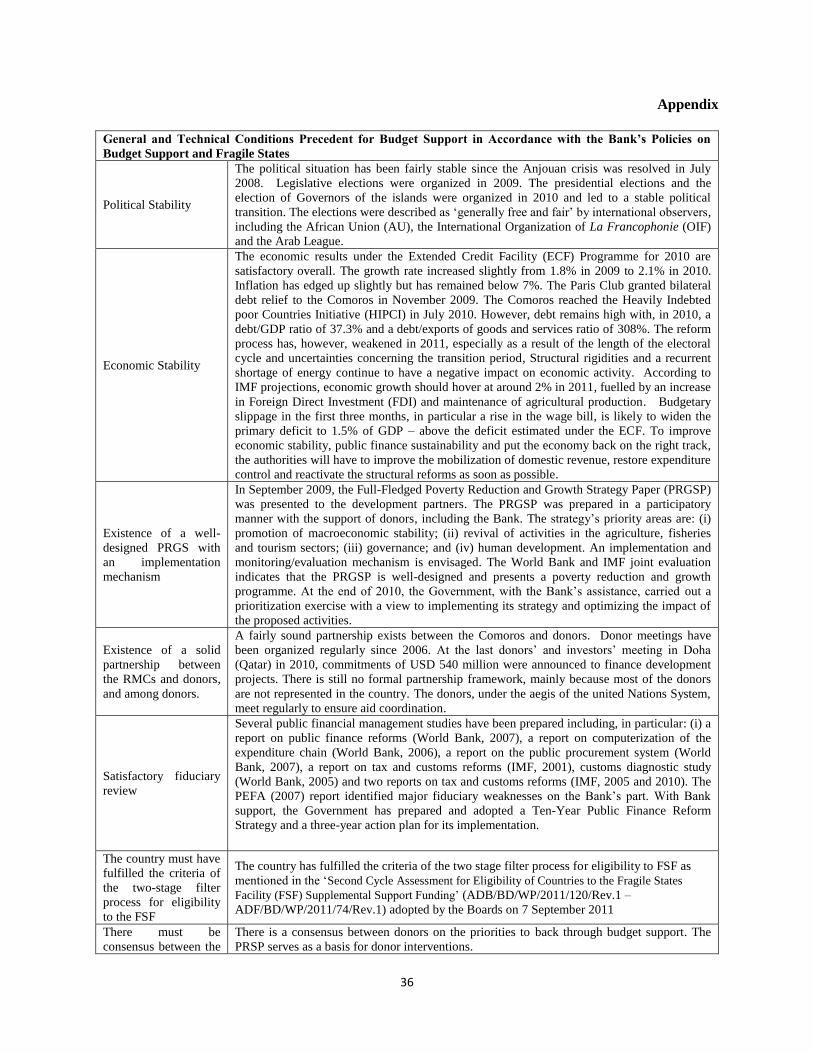
36
Appendix
General and Technical Conditions Precedent for Budget Support in Accordance with the Bank’s Policies on
Budget Support and Fragile States
Political Stability
The political situation has been fairly stable since the Anjouan crisis was resolved in July
2008. Legislative elections were organized in 2009. The presidential elections and the
election of Governors of the islands were organized in 2010 and led to a stable political
transition. The elections were described as ‘generally free and fair’ by international observers,
including the African Union (AU), the International Organization of La Francophonie (OIF)
and the Arab League.
Economic Stability
The economic results under the Extended Credit Facility (ECF) Programme for 2010 are
satisfactory overall. The growth rate increased slightly from 1.8% in 2009 to 2.1% in 2010.
Inflation has edged up slightly but has remained below 7%. The Paris Club granted bilateral
debt relief to the Comoros in November 2009. The Comoros reached the Heavily Indebted
poor Countries Initiative (HIPCI) in July 2010. However, debt remains high with, in 2010, a
debt/GDP ratio of 37.3% and a debt/exports of goods and services ratio of 308%. The reform
process has, however, weakened in 2011, especially as a result of the length of the electoral
cycle and uncertainties concerning the transition period, Structural rigidities and a recurrent
shortage of energy continue to have a negative impact on economic activity. According to
IMF projections, economic growth should hover at around 2% in 2011, fuelled by an increase
in Foreign Direct Investment (FDI) and maintenance of agricultural production. Budgetary
slippage in the first three months, in particular a rise in the wage bill, is likely to widen the
primary deficit to 1.5% of GDP – above the deficit estimated under the ECF. To improve
economic stability, public finance sustainability and put the economy back on the right track,
the authorities will have to improve the mobilization of domestic revenue, restore expenditure
control and reactivate the structural reforms as soon as possible.
Existence of a well-
designed PRGS with
an implementation
mechanism
In September 2009, the Full-Fledged Poverty Reduction and Growth Strategy Paper (PRGSP)
was presented to the development partners. The PRGSP was prepared in a participatory
manner with the support of donors, including the Bank. The strategy’s priority areas are: (i)
promotion of macroeconomic stability; (ii) revival of activities in the agriculture, fisheries
and tourism sectors; (iii) governance; and (iv) human development. An implementation and
monitoring/evaluation mechanism is envisaged. The World Bank and IMF joint evaluation
indicates that the PRGSP is well-designed and presents a poverty reduction and growth
programme. At the end of 2010, the Government, with the Bank’s assistance, carried out a
prioritization exercise with a view to implementing its strategy and optimizing the impact of
the proposed activities.
Existence of a solid
partnership between
the RMCs and donors,
and among donors.
A fairly sound partnership exists between the Comoros and donors. Donor meetings have
been organized regularly since 2006. At the last donors’ and investors’ meeting in Doha
(Qatar) in 2010, commitments of USD 540 million were announced to finance development
projects. There is still no formal partnership framework, mainly because most of the donors
are not represented in the country. The donors, under the aegis of the united Nations System,
meet regularly to ensure aid coordination.
Satisfactory fiduciary
review
Several public financial management studies have been prepared including, in particular: (i) a
report on public finance reforms (World Bank, 2007), a report on computerization of the
expenditure chain (World Bank, 2006), a report on the public procurement system (World
Bank, 2007), a report on tax and customs reforms (IMF, 2001), customs diagnostic study
(World Bank, 2005) and two reports on tax and customs reforms (IMF, 2005 and 2010). The
PEFA (2007) report identified major fiduciary weaknesses on the Bank’s part. With Bank
support, the Government has prepared and adopted a Ten-Year Public Finance Reform
Strategy and a three-year action plan for its implementation.
The country must have
fulfilled the criteria of
the two-stage filter
process for eligibility
to the FSF
The country has fulfilled the criteria of the two stage filter process for eligibility to FSF as
mentioned in the ‘Second Cycle Assessment for Eligibility of Countries to the Fragile States
Facility (FSF) Supplemental Support Funding’ (ADB/BD/WP/2011/120/Rev.1 –
ADF/BD/WP/2011/74/Rev.1) adopted by the Boards on 7 September 2011
There must be
consensus between the
There is a consensus between donors on the priorities to back through budget support. The
PRSP serves as a basis for donor interventions.
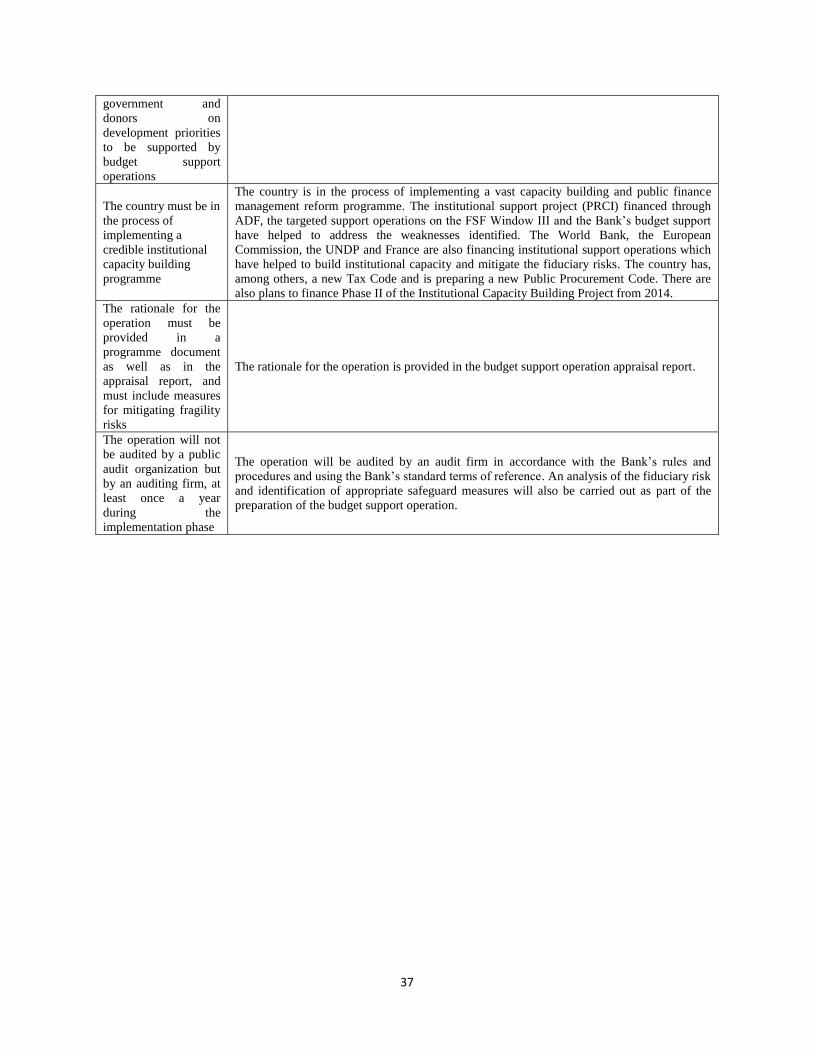
37
government and
donors on
development priorities
to be supported by
budget support
operations
The country must be in
the process of
implementing a
credible institutional
capacity building
programme
The country is in the process of implementing a vast capacity building and public finance
management reform programme. The institutional support project (PRCI) financed through
ADF, the targeted support operations on the FSF Window III and the Bank’s budget support
have helped to address the weaknesses identified. The World Bank, the European
Commission, the UNDP and France are also financing institutional support operations which
have helped to build institutional capacity and mitigate the fiduciary risks. The country has,
among others, a new Tax Code and is preparing a new Public Procurement Code. There are
also plans to finance Phase II of the Institutional Capacity Building Project from 2014. The rationale for the
operation must be
provided in a
programme document
as well as in the
appraisal report, and
must include measures
for mitigating fragility
risks
The rationale for the operation is provided in the budget support operation appraisal report.
The operation will not
be audited by a public
audit organization but
by an auditing firm, at
least once a year
during the
implementation phase
The operation will be audited by an audit firm in accordance with the Bank’s rules and
procedures and using the Bank’s standard terms of reference. An analysis of the fiduciary risk
and identification of appropriate safeguard measures will also be carried out as part of the
preparation of the budget support operation.
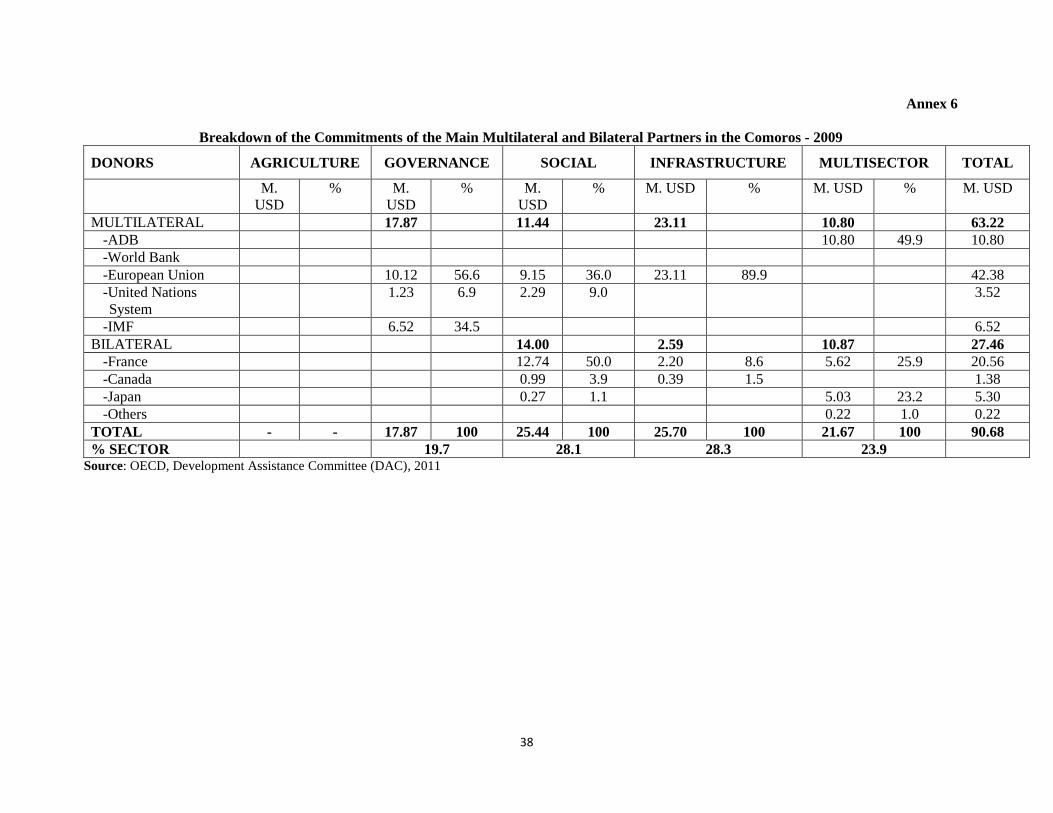
38
Annex 6
Breakdown of the Commitments of the Main Multilateral and Bilateral Partners in the Comoros - 2009
DONORS AGRICULTURE GOVERNANCE SOCIAL INFRASTRUCTURE MULTISECTOR TOTAL
M.
USD
% M.
USD
% M.
USD
% M. USD % M. USD % M. USD
MULTILATERAL 17.87 11.44 23.11 10.80 63.22
-ADB 10.80 49.9 10.80
-World Bank
-European Union 10.12 56.6 9.15 36.0 23.11 89.9 42.38
-United Nations
System
1.23 6.9 2.29 9.0 3.52
-IMF 6.52 34.5 6.52
BILATERAL 14.00 2.59 10.87 27.46
-France 12.74 50.0 2.20 8.6 5.62 25.9 20.56
-Canada 0.99 3.9 0.39 1.5 1.38
-Japan 0.27 1.1 5.03 23.2 5.30
-Others 0.22 1.0 0.22
TOTAL - - 17.87 100 25.44 100 25.70 100 21.67 100 90.68
% SECTOR 19.7 28.1 28.3 23.9 Source: OECD, Development Assistance Committee (DAC), 2011

39
ANNEX 7
COMPARATIVE SOCIO-ECONOMIC INDICATORS
Year Comoros Africa Developing
Countries
Developed
Countries
Basic Indicators Area ('000 Km²) 2 30 323 80 976 54 658
Total Population (millions) 2010 0.7 1 031 5 659 1 117
Urban Population (% of Total) 2010 28.2 39.9 45.1 77.3
Population Density (per Km²) 2010 309.3 34.0 69.9 20.4
Gross National Income (GNI) per capita (USD) 2009 870 1 525 2 968 37 990
Labour Force Participation - Total (%) 2010 49.4 40.1 61.8 60.7
Labour Force Participation - Female (%) 2010 46.6 41.0 49.1 52.2
Gender-Related Development Index Value 2007 0.571 0.433 0.694 0.911
Human Development Index (rank among 169 countries) 2010 140 n.a n.a n.a
Population Living Below $ 1 a Day (%) 2005-08 … 42.3 25.2 …
Demographic Indicators
Population Growth Rate - Total (%) 2010 2.2 2.3 1.3 0.6
Urban Population Growth Rate (%) 2010 2.6 3.4 2.4 1.0
Population < 15 Years (%) 2010 38.1 40.3 29.0 17.5
Population >= 65 years (%) 2010 3.5 3.8 6.0 15.4
Dependency Ratio (%) 2010 69.9 77.6 55.4 49.2
Sex Ratio (per 100 female) 2010 100.7 99.5 93.5 94.8
Female Population 15-49 years (% of total population) 2010 25.6 24.4 49.4 50.6
Life Expectancy at Birth - Total (years) 2010 66.2 56.0 67.1 79.8
Life Expectancy at Birth - Female (years) 2010 68.5 57.1 69.1 82.7
Crude Birth Rate (per 1000) 2010 31.3 34.2 21.4 11.8
Crude Death Rate (per 1000) 2010 6.4 12.6 8.2 8.4
Infant Mortality Rate (per 1000) 2010 44.1 78.6 46.9 5.8
Under-5 Mortality Rate (per 1000) 2010 56.0 127.2 66.5 6.9
Total Fertility Rate (per woman) 2010 3.8 4.4 2.7 1.7
Maternal Mortality Rate (per 100,000) 2008 340.0 530.2 290.0 15.2
Health and Nutrition Indicators
Physicians (per 100,000 people) 2004-09 15.0 58.3 109.5 286.0
Nurses (per 100,000 people) 2004-09 79.8 113.3 204.0 786.5
Births Attended by Trained Health Personnel (%) 2005-07 … 50.2 64.1 …
Access to Safe Water (% of population) 2008 95.0 64.5 84.3 99.6
Access to Health Services (% of population) 2005-08 … 65.4 80.0 100.0
Access to Sanitation (% of population) 2008 36.0 41.0 53.6 99.5
Percent of Adults (aged 15-49) Living with HIV/AIDS 2007 0.1 4.9 0.9 0.3
Incidence of Tuberculosis (per 100,000) 2009 39.0 294.9 161.0 14.0
Child Immunization against Tuberculosis (%) 2009 80.0 79.9 81.0 95.1
Child Immunization against Measles (%) 2009 79.0 71.1 80.7 93.0
Daily Calorie Supply per Capita 2007 1 884 2 465 2 675 3 285
Public Expenditure on Health (as % of GDP) 2008 3.3 5.7 2.9 7.4
Education indicators
Gross Enrolment Ratio (%)
Primary School - Total 2008 119.4 102.7 107.2 101.3
Primary School - Girls 2008 114.1 99.0 109.2 101.1
Secondary School - Total 2005-08 45.8 37.8 62.9 100.1
Secondary School - Girls 2005-08 39.3 33.8 61.3 99.6
Primary School Female Teaching Staff (% of Total) 2008 36.9 47.0 60.5 81.4
Adult Literacy Rate - Total (%) 2008 73.6 64.8 80.3 98.4
Adult Literacy Rate - Male (%) 2008 79.3 74.0 86.0 98.7
Adult Literacy Rate - Women (%) 2008 67.8 55.9 74.8 98.1
% of GDP Spent on Education 2008 7.6 4.6 3.8 5.0
Environmental indicators
Arable Land as % of Total Land Area 2008 43.0 7.8 10.6 10.9
Annual Rate of Deforestation (%) 2005-09 … 0.7 0.4 -0.2
Annual Rate of Reforestation (%) 2005-09 … 10.9 … …
Per Capita CO2 Emissions (metric tons) 2009 0.2 1.1 2.9 12.5
Source: ADB, Statistics Department, 2011
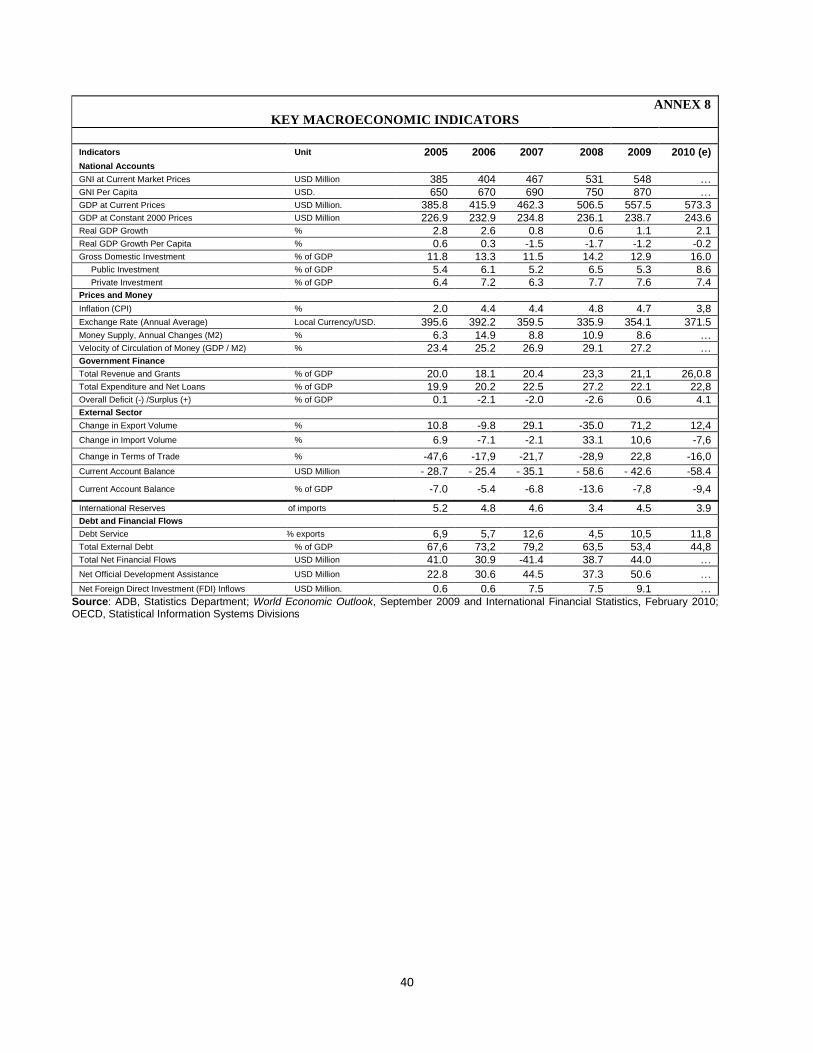
40
ANNEX 8
KEY MACROECONOMIC INDICATORS
Indicators Unit 2005 2006 2007 2008 2009 2010 (e)
National Accounts GNI at Current Market Prices USD Million 385 404 467 531 548 … GNI Per Capita USD. 650 670 690 750 870 … GDP at Current Prices USD Million. 385.8 415.9 462.3 506.5 557.5 573.3 GDP at Constant 2000 Prices USD Million 226.9 232.9 234.8 236.1 238.7 243.6 Real GDP Growth % 2.8 2.6 0.8 0.6 1.1 2.1 Real GDP Growth Per Capita % 0.6 0.3 -1.5 -1.7 -1.2 -0.2 Gross Domestic Investment % of GDP 11.8 13.3 11.5 14.2 12.9 16.0 Public Investment % of GDP 5.4 6.1 5.2 6.5 5.3 8.6 Private Investment % of GDP 6.4 7.2 6.3 7.7 7.6 7.4 Prices and Money
Inflation (CPI) % 2.0 4.4 4.4 4.8 4.7 3,8
Exchange Rate (Annual Average) Local Currency/USD. 395.6 392.2 359.5 335.9 354.1 371.5 Money Supply, Annual Changes (M2) % 6.3 14.9 8.8 10.9 8.6 … Velocity of Circulation of Money (GDP / M2) % 23.4 25.2 26.9 29.1 27.2 … Government Finance Total Revenue and Grants % of GDP 20.0 18.1 20.4 23,3 21,1 26,0.8 Total Expenditure and Net Loans % of GDP 19.9 20.2 22.5 27.2 22.1 22,8 Overall Deficit (-) /Surplus (+) % of GDP 0.1 -2.1 -2.0 -2.6 0.6 4.1 External Sector Change in Export Volume % 10.8 -9.8 29.1 -35.0 71,2 12,4
Change in Import Volume % 6.9 -7.1 -2.1 33.1 10,6 -7,6
Change in Terms of Trade % -47,6 -17,9 -21,7 -28,9 22,8 -16,0
Current Account Balance USD Million - 28.7 - 25.4 - 35.1 - 58.6 - 42.6 -58.4
Current Account Balance % of GDP -7.0 -5.4 -6.8 -13.6 -7,8 -9,4
International Reserves Months of imports 5.2 4.8 4.6 3.4 4.5 3.9 Debt and Financial Flows Debt Service % des % exports 6,9 5,7 12,6 4,5 10,5 11,8 Total External Debt % of GDP 67,6 73,2 79,2 63,5 53,4 44,8 Total Net Financial Flows USD Million 41.0 30.9 -41.4 38.7 44.0 …
Net Official Development Assistance USD Million 22.8 30.6 44.5 37.3 50.6 …
Net Foreign Direct Investment (FDI) Inflows USD Million. 0.6 0.6 7.5 7.5 9.1 …
Source: ADB, Statistics Department; World Economic Outlook, September 2009 and International Financial Statistics, February 2010; OECD, Statistical Information Systems Divisions

41
Annex 9
MAP OF THE COMOROS