Embed Size (px)
Citation preview

Africa Statistics FlashSelected Socio-Economic Indicators on Africa
December 2016
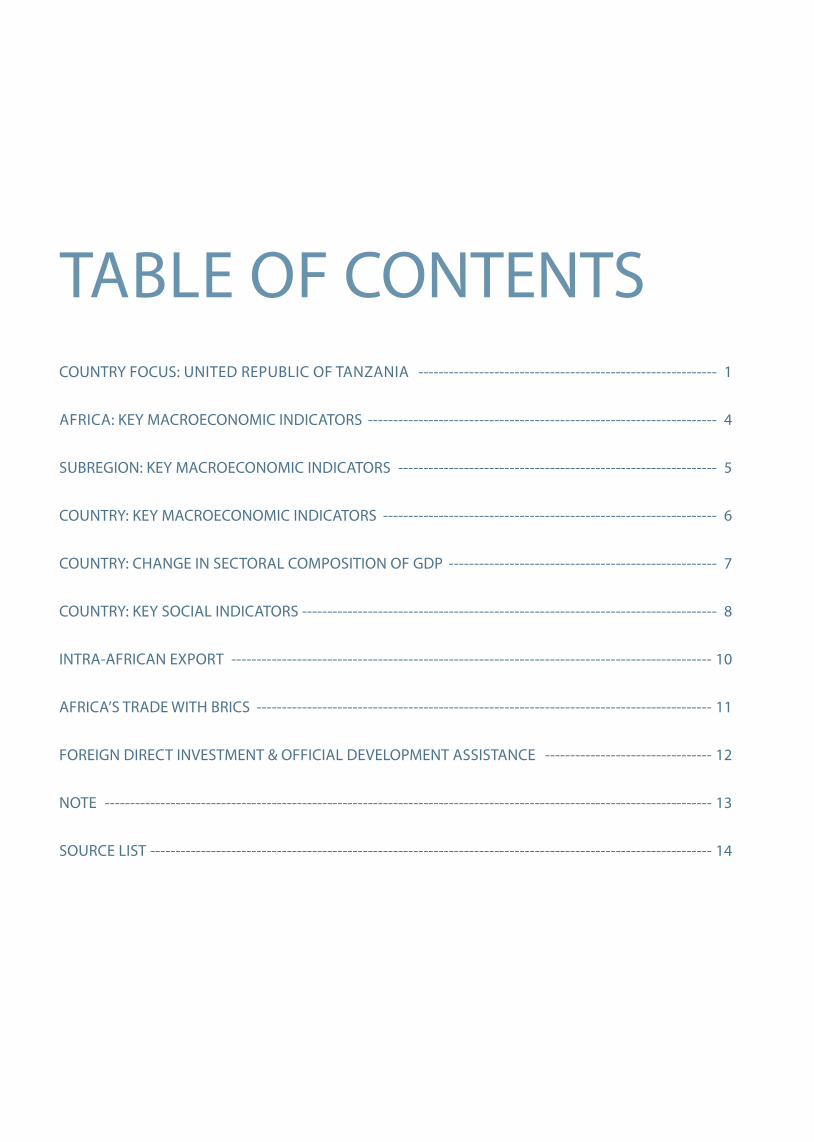
Table of CoNTeNTSCoUNTRY foCUS: UNiTed RepUbliC of TaNzaNia ----------------------------------------------------------- 1
afRiCa: KeY MaCRoeCoNoMiC iNdiCaToRS --------------------------------------------------------------------- 4
SUbReGioN: KeY MaCRoeCoNoMiC iNdiCaToRS --------------------------------------------------------------- 5
CoUNTRY: KeY MaCRoeCoNoMiC iNdiCaToRS ------------------------------------------------------------------ 6
CoUNTRY: CHaNGe iN SeCToRal CoMpoSiTioN of Gdp ----------------------------------------------------- 7
CoUNTRY: KeY SoCial iNdiCaToRS ---------------------------------------------------------------------------------- 8
iNTRa-afRiCaN eXpoRT ----------------------------------------------------------------------------------------------- 10
afRiCa’S TRade WiTH bRiCS ------------------------------------------------------------------------------------------ 11
foReiGN diReCT iNVeSTMeNT & offiCial deVelopMeNT aSSiSTaNCe --------------------------------- 12
NoTe ------------------------------------------------------------------------------------------------------------------------ 13
SoURCe liST --------------------------------------------------------------------------------------------------------------- 14
United Republic of Tanzania key macroeconomic indicatorsIndicators 2010 2011 2012 2013 2014 2015Gdp per capita (current, thousand TzS) 1,046 1,222 1,408 1,583 1,724 1,919 Real Gdp growth (%) 6.4 7.9 5.1 7.3 7.0 7.0 inflation (annual, %) 5.5 12.7 16.0 7.9 6.1 5.6 Gross domestic investment (% of Gdp) 27.3 33.2 28.5 30.3 30.9 30.8 Gross saving (% of Gdp) 21.2 21.6 19.3 14.9 21.9 22.0 Trade balance (% of Gdp) 15.1 16.1 13.8 9.6 15.9 17.3 Current account balance incl. official transfer (% of Gdp) 6.9 13.0 9.6 11.2 10.4 7.2 external debt (% of Gdp) 26.9 26.6 26.9 28.8 29.9 33.7 Share of industry (% of Gdp) 21.5 24.0 23.0 23.9 25.0 26.1 (of which manufacturing) 7.3 8.1 7.9 6.8 6.0 5.6 debt service ratio (% of export) 3.5 3.2 3.2 5.5 5.0 4.0
2009 2010 2011 2012 2013 2014 20150
5,000
10,000
15,000
(USD million)
5.4 %
6.4 %
7.9 %
5.1 %
7.3 %7.0 % 7.0 %
0
1
2
3
4
5
6
7
8
9(percentage)
Export/Import and GDP growth rate
Export Import
32.1 31.7 30.9 32.8 32.9 31.0 31.1
19.8 21.5 24.0 23.0 23.9 25.0 26.1
48.2 46.8 45.0 44.2 43.1 44.0 42.9
2009 2010 2011 2012 2013 2014 20150
20
40
60
80
100(% of GDP)
Services
Industry
Agriculture
Contribution to GDP by selected sectors
-
120.0
a f R i C a S T a T i S T i C S f l a S H | d e c e m b e r 2 0 1 6 |
1
COUNTRY FOCUS: UNITed RepUblIC OF TaNzaNIa

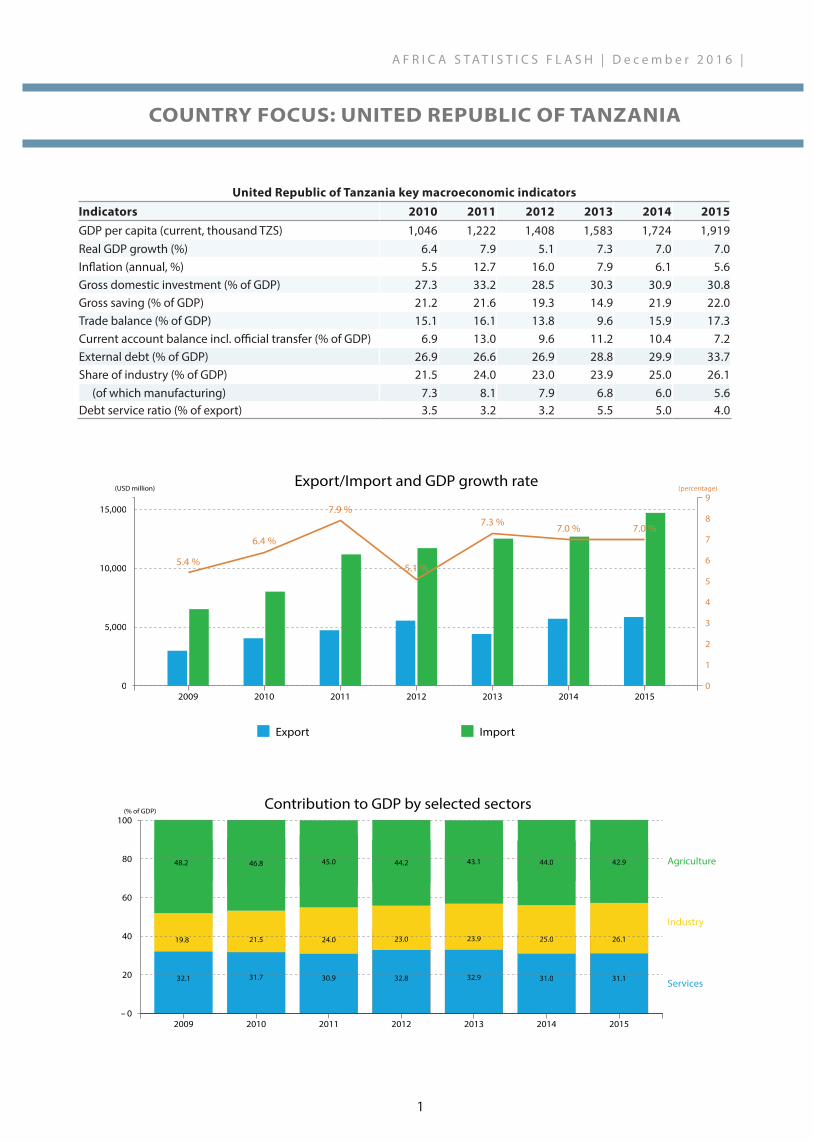
2011 2012 2013 2014 20150
2
4
6
8
(percentage)
Africa
Eastern Africa
Tanzania
GDP growth rate
2009 2010 2011 2012 2013 2014 20150
500
1,000
1,500
2,000
2,500
(USD million)FDI inward �ow
| d e c e m b e r 2 0 1 6 | a f R i C a S T a T i S T i C S f l a S H
2
COUNTRY FOCUS: UNITed RepUblIC OF TaNzaNIa COUNTRY FOCUS: UNITed RepUblIC OF TaNzaNIa

Top 5 export products (USd millions)product 2010 2011 2012 2013 2014 2015Gold 574 901 929 910 780 1,431 precious metal ores 461 541 421 302 566 469 Television receivers - - - - - 351 brans, sharps and other 4 8 13 13 14 263 Cashew nuts 99 106 142 165 376 243 Total 1,138 1,555 1,505 1,390 1,737 2,758
Top 5 import products (USd millions)product 2010 2011 2012 2013 2014 2015petroleum oils 1,699 2,678 2,716 3,532 2,523 6,791 light petroleum oils 454 840 921 1,133 885 537 other medicaments 89 138 118 150 309 300 Wheat 292 404 240 305 319 222 Road tractors 56 118 195 170 169 130 Total 2,590 4,178 4,189 5,290 4,205 7,980
Top 5 export destinations (USd millions)Country 2010 2011 2012 2013 2014 2015india 226 210 481 752 1,255 1,149 Kenya 325 221 350 228 446 794 South africa 434 858 983 765 689 675 China 657 677 525 309 684 562 oman 1 2 4 3 5 250 Total 1,643 1,968 2,342 2,057 3,079 3,431
Top 5 import origins (USd millions)Country 2010 2011 2012 2013 2014 2015
Saudi arabia 199 149 231 223 205 5,976
China 877 1,056 1,163 1,596 2,047 1,854 india 895 1,565 881 2,309 2,454 1,259 United arab emirates 672 1,243 1,026 1,193 1,175 839 South africa 772 988 935 730 603 511 Total 3,414 5,002 4,235 6,051 6,484 10,439
a f R i C a S T a T i S T i C S f l a S H | d e c e m b e r 2 0 1 6 |
3
COUNTRY FOCUS: UNITed RepUblIC OF TaNzaNIa COUNTRY FOCUS: UNITed RepUblIC OF TaNzaNIa

SomaliaSierra LeoneEquatorial GuineaSouth SudanBurundiBotswanaLiberia
EritreaGuineaTunisia
ComorosLibya
South AfricaZimbabwe
Cabo VerdeSwaziland
NigeriaMalawi
MadagascarSao Tome and Principe
MauritiusCentral African Republic
NigerZambiaAngolaAlgeriaGhanaGabon
ChadEgypt
MoroccoNamibia
SeychellesGuinea-Bissau
GambiaMali
MauritaniaBenin
SudanLesotho
Burkina FasoKenya
TogoCameroon
CongoUganda
MozambiqueSenegalDjiboutiRwanda
TanzaniaDR Congo
Côte d'IvoireEthiopia
no data
-20 -10 0 10
-20 -10 0 10
GDP growth rate (2015, %)
LesothoEritrea
Sao Tome and PrincipeGambiaSomalia
MauritaniaDjibouti
ComorosSeychelles
Guinea BissauCentral African Republic
LiberiaCabo Verde
BurundiTogo
Sierra LeoneSwaziland
Equatorial GuineaGuinea
NigerMalawi
RwandaSouth Sudan
BeninMauritius
NamibiaZimbabwe
CongoChad
Burkina FasoGabon
MozambiqueMadagascar
BotswanaSenegal
MaliDR Congo
ZambiaUganda
CameroonCôte d'ivoire
LibyaGhanaTunisia
TanzaniaKenya
EthiopiaAngolaSudan
MoroccoAlgeria
South AfricaEgypt
Nigeria
0 200 400 600 800 1,000 1,200
0 200 400 600 800 1,000 1,200
GNI, PPP (2015, current int'l dollar)
no datano datano datano datano datano datano datano data2.42.72.93.33.38.29.710.110.313.914.118.819.720.020.122.924.425.526.529.129.629.632.532.734.035.336.241.555.759.369.371.873.5
95.1111.7122.8136.1141.0
160.9161.5164.3
268.4566.6
705.3978.3
1056.3
-21.5-10.3
-5.3-3.9
-0.30.0
0.30.71.01.11.21.31.51.51.7
2.82.93.0
3.53.53.63.63.73.83.94.14.24.24.24.44.44.64.74.75.05.05.25.35.35.35.45.55.75.7
6.36.36.56.77.0
7.67.7
9.59.6
Indicators 2011 2012 2013 2014 2015Gdp, ppp (current international $ billion)1 4,720 5,034 5,304 5,577 5,819 Gdp per capita (current, USd) 1 2,087 2,171 2,199 2,209 1,966 Real Gdp growth (%) 1.6 5.2 3.8 3.8 3.4inflation (annual, growth rate%) 1 9.0 2 8.6 6.4 7.1 7.0General govt. net lending/borrowing (% of Gdp) -3.2 -3.2 -5.0 -6.3 -7.4Total investment (% of Gdp) 3 22.2 22.6 22.6 23.2 23.0Gross national saving (% of Gdp) 4 21.6 20.3 19.6 19.0 16.4Real export growth (%) 0.3 19.5 -0.7 0.0 2.1Trade balance (% of Gdp) 2.0 1.0 -0.8 -3.3 -6.8Share of africa’s export (%) 3.1 3.2 3.0 2.7 2.4Terms of trade index (2000=100) 185.6 191.7 188.0 180.4 153.7Current account balance (% of Gdp) 23 -0.3 -0.7 -2.3 -4.5 -7.0fdi (inward flow; USd million) 47,705 2 56,435 53,969 53,912 ...fdi (outward flow; USd million) 5 6,500 12,386 15,951 13,073 ...international reserve (USd billion) 6 532.3 575.0 571.3 508.5 351.8Total external debt (% of GNi) 7 20.4 21.8 22.4 21.8 ...Share of industry (% of Gdp) 33.3 33.4 32.3 31.9 ... (of which manufacturing) 10.4 10.2 10.4 10.8 ...
a f R i C a S T a T i S T i C S f l a S H | d e c e m b e r 2 0 1 6 |
4
aFRICa: KeY MaCROeCONOMIC INdICaTORS

Central africa eastern africa
Indicators 2011 2012 2013 2014 2015 2011 2012 2013 2014 2015
Real Gdp growth (%) 4.2 6.5 0.4 5.6 2.1 6.2 2.5 7.0 6.7 6.4Gdp per capita (current, USd)9 2,107 2,030 2,028 2,032 1,543 5582 617 668 710 673
inflation (annual, %)9 2.8 4.3 2.2 2.4 3.0 18.8 15.2 5.9 5.7 8.6
Gen. govt. net lend/borrow (% of Gdp) 2.3 -0.9 -2.9 -4.0 -5.5 -2.4 -3.2 -3.4 -3.9 -3.7
Total investment (% of Gdp)9 29.8 29.1 30.3 32.1 31.3 24.7 25.9 25.3 25.7 27.4
Gross national saving (% of Gdp)9 27.2 26.5 24.7 25.6 20.3 19.5 17.8 16.7 17.2 18.0Current account balance (% of Gdp)9 1.8 -0.3 -1.9 -4.5 -7.8 -7.7 -8.5 -8.2 -8.7 -10.2
fdi inward flow (USd million) 5,854 5,960 6,672 9,693 ... 6,1552 8,452 8,153 8,039 ...
fdi outward flow (USd million)10 328.4 -229.2 -294.9 -65.2 ... 96 491 381 352 ...
international reserve (USd billion)11 15.2 17.0 17.7 14.9 9.5 15.2 18.8 20.4 20.8 19.1Total external debt (% of Gdp)12 17.4 18.9 23.7 23.2 ... 26.0 24.3 25.7 26.5 ...
Share of industry (% of Gdp)8 57.8 57.4 54.7 52.8 ... 23.7 21.9 22.4 23.0 ... (of which manufacturing) 7.6 7.6 8.1 8.6 ... 9.3 9.1 8.8 8.3 ...
North africa Southern africa
Indicators 2011 2012 2013 2014 2015 2011 2012 2013 2014 2015
Real Gdp growth (%) -3.5 6.0 1.5 2.2 3.9 3.7 3.7 3.4 2.8 2.1Gdp per capita (current, USd) 3,440 3,705 3,670 3,645 3,493 3,748 3,650 3,491 3,365 2,893 inflation (annual, %) 9.8 11.2 10.4 13.3 10.8 6.5 6.4 6.4 6.2 5.7Gen. govt. net lend/borrow (% of Gdp) -5.9 -4.9 -7.5 -10.3 -12.3 -1.8 -2.3 -3.2 -4.2 -4.2
Total investment (% of Gdp) 24.9 24.9 25.4 26.2 27.0 19.8 21.0 21.2 21.4 19.2
Gross national saving (% of Gdp) 25.4 23.1 22.7 22.8 19.8 18.6 17.8 16.8 16.2 13.1Current account balance (% of Gdp) 1.014 1.6 -2.1 -5.2 -9.3 -0.6 -2.4 -3.5 -5.1 -6.222
fdi inward flow (USd million) 8,136 18,540 14,784 12,734 ... 9,192 8,550 11,277 11,176 ...
fdi outward flow (USd million)14 1,495 3,336 955 1,676 ... 2,058 5,291 12,748 8,859 ...
international reserve (USd billion)15 349.4 368.2 364.5 323.1 189.6 97.5 105.1 104.0 99.7 90.517
Total external debt (% of Gdp)16,18 18.5 19.7 20.5 16.9 ... 28.7 34.8 36.1 38.9 ...Share of industry (% of Gdp) 39.1 40.4 39.2 38.8 ... 34.7 34.5 33.6 33.8 ... (of which manufacturing) 12.6 12.0 12.1 12.7 ... 11.9 11.6 11.6 11.6 ...
West africa Africa
Indicators 2011 2012 2013 2014 2015 2011 2012 2013 2014 2015
Real Gdp growth (%) 5.8 5.8 6.2 5.3 2.8 1.6 5.2 3.8 3.8 3.4Gdp per capita (current, USd) 1,801 1,927 2,093 2,184 1,841 2,087 2,171 2,199 2,209 1,966 inflation (annual, %) 6.0 4.6 2.6 1.6 2.3 9.0 8.6 6.4 7.1 7.0Gen. govt. net lend/borrow (% of Gdp) -0.9 -1.3 -3.3 -3.1 -4.2 -3.2 -3.2 -5.0 -6.3 -7.4
Total investment (% of Gdp)19 17.7 17.5 17.1 17.6 16.6 22.2 22.6 22.6 23.2 23.0
Gross national saving (% of Gdp)19 18.3 18.1 17.6 15.6 12.8 21.6 20.3 19.6 19.0 16.4Current account balance (% of Gdp) 0.6 1.1 0.7 -1.6 -3.6 -0.3 -0.7 -2.3 -4.5 -7.0fdi inward flow (USd million) 18,368 14,933 13,083 12,271 ... 47,705 56,435 53,969 53,912 ...
fdi outward flow (USd million)20 2,522 3,496 2,162 2,250 ... 6,500 12,386 15,951 13,073 ...
international reserve (USd billion)21 55.0 65.8 64.7 50.0 43.1 532.3 575.0 571.3 508.5 351.8Total external debt (% of Gdp) 12.0 10.7 11.1 11.2 ... 20.4 21.8 22.4 21.8 ...Share of industry (% of Gdp) 25.5 24.9 24.0 23.3 ... 33.3 33.4 32.3 31.9 ... (of which manufacturing) 7.4 7.7 8.5 9.0 ... 10.4 10.2 10.4 10.8 ...
| d e c e m b e r 2 0 1 6 | a f R i C a S T a T i S T i C S f l a S H
5
SUbReGION: KeY MaCROeCONOMIC INdICaTORS SUbReGION: KeY MaCROeCONOMIC INdICaTORS
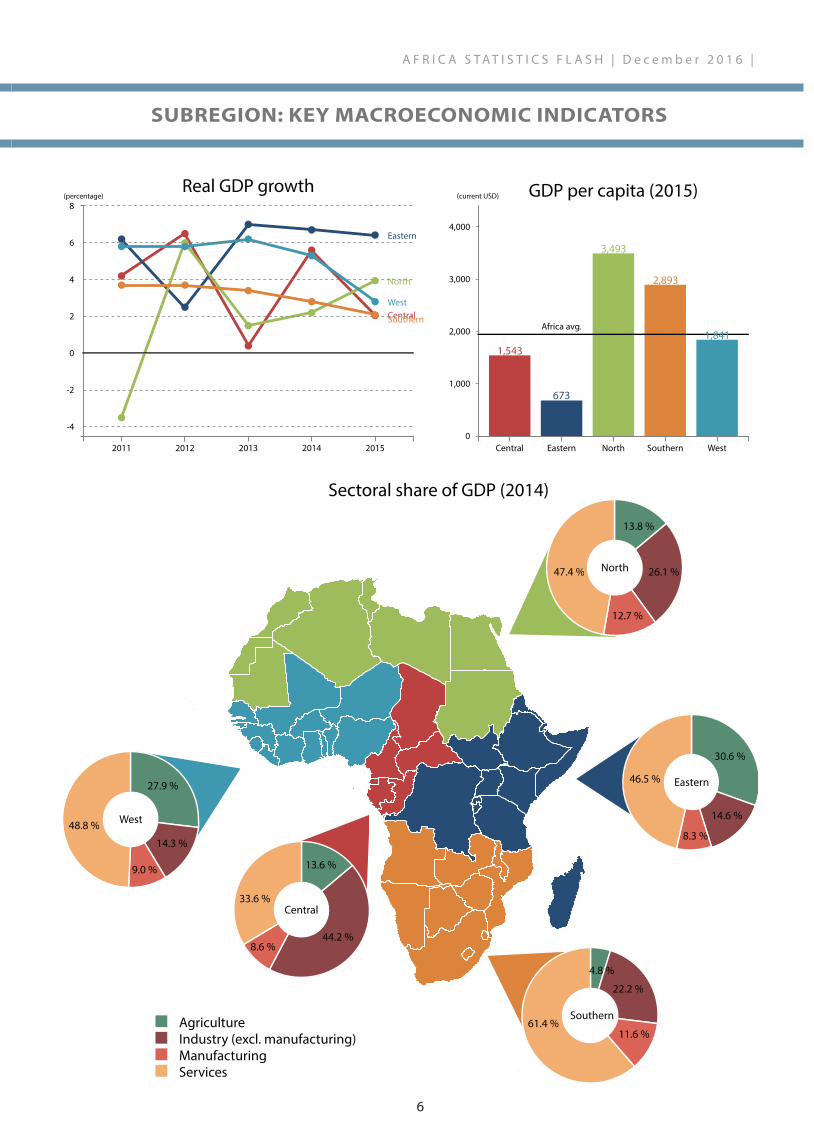
Sectoral share of GDP (2014)
West
Central
Southern
Eastern
North
AgricultureIndustry (excl. manufacturing)ManufacturingServices
27.9 %
14.3 %
9.0 %
48.8 %
13.6 %
44.2 %8.6 %
33.6 %
4.8 %
22.2 %
11.6 %61.4 %
30.6 %
14.6 %
8.3 %
46.5 %
13.8 %
26.1 %
12.7 %
47.4 %
Central
Eastern
North
Southern
West
2011 2012 2013 2014 2015
-4
-2
0
2
4
6
8(percentage)
Real GDP growth
0
1,000
2,000
3,000
4,000
(current USD)
Central Eastern North Southern West
1,543
673
3,493
2,893
Africa avg.
GDP per capita (2015)
1,841
a f R i C a S T a T i S T i C S f l a S H | d e c e m b e r 2 0 1 6 |
6
SUbReGION: KeY MaCROeCONOMIC INdICaTORS SUbReGION: KeY MaCROeCONOMIC INdICaTORS

| d e c e m b e r 2 0 1 6 | a f R i C a S T a T i S T i C S f l a S H
Country Gdp at current (2015, bil. int’l $)
Inflation(2015, %)
Total investment (2015, % of Gdp)
Trade balance (2015, % of Gdp)
debt service ratio (% of exports)
algeria 578.7 4.8 50.3 -7.4 0.4 (2014)angola 184.4 10.3 9.3 8.4 10.7 (2014)benin 22.9 0.3 27.8 -12.2 5.1 (2013)botswana 34.8 3.0 27.8 -5.7 2.3 (2013)burkina faso 30.9 0.9 14.2 -9.9 2.8 (2013)burundi 7.7 5.6 10.6 -20.9 13.7 (2013)Cabo Verde 3.4 0.1 40.7 -35.0 4.8 (2014)Cameroon 72.6 2.7 21.8 -9.5 2.7 (2013)Central african Republic 3.0 5.4 14.5 3.6 …Chad 30.5 3.6 27.1 3.0 …Comoros 1.2 2.0 18.4 -37.5 0.7 (2014)Congo 29.4 3.2 33.4 -17.8 ...Côte d'ivoire 78.6 1.2 18.2 3.9 11.6 (2014)dR Congo 62.9 1.0 15.6 1.8 3.1 (2014)djibouti 3.1 2.1 60.4 -35.7 6.1 (2014)egypt 1,047.9 11.0 14.0 -13.7 12.7 (2014)equatorial Guinea 25.4 0.1 54.4 3.5 …eritrea 8.7 9.0 7.6 -11.0 …ethiopia 161.6 10.1 39.8 -36.7 7.2 (2012)Gabon 34.6 2.0 37.8 22.9 ...Gambia, The 3.3 17.2 19.8 -32.3 7.1 (2012)Ghana 114.7 8.2 23.9 -8.8 5.1 (2014)Guinea 15.0 1.5 10.2 3.2 4.2 (2013)Guinea-bissau 2.7 7.7 11.2 0.3 0.3 (2013)Kenya 141.9 6.6 22.5 -16.5 11.0 (2014)lesotho 5.8 4.8 29.8 -61.3 2.8 (2013)liberia 3.7 1.4 … -89.2 0.7 (2013)libya 92.6 8.0 31.6 -20.0 …Madagascar 35.4 7.4 17.1 -6.8 2.5 (2013)Malawi 20.4 21.9 12.0 -20.2 4.2 (2014)Mali 35.8 1.0 24.0 -5.5 3.0 (2013)Mauritania 16.3 0.5 35.6 -11.2 5.6 (2013)Mauritius 24.6 1.3 25.5 -20.2 26.8 (2014)Morocco 273.5 1.6 33.3 -15.6 15.1 (2014)Mozambique 33.2 2.4 28.2 -35.1 2.6 (2013)Namibia 25.3 3.4 29.4 -28.5 …Niger 19.1 9.0 42.1 -20.1 2.5 (2013)Nigeria 1,091.7 0.1 14.5 0.6 0.8 (2014)Rwanda 20.4 2.5 25.0 -19.1 3.4 (2013)Sao Tome and principe 0.7 5.3 26.2 -41.1 15.1 (2014)Senegal 36.7 9.0 25.3 -21.4 8.9 (2013)Seychelles 2.4 4.0 31.8 -36.1 …Sierra leone 10.0 6.8 16.3 -26.4 1.2 (2013)Somalia … … … … …South africa 723.5 4.6 19.5 -2.8 8.6 (2014)South Sudan 23.7 52.8 9.9 … …Sudan 167.0 16.9 17.3 -6.0 4.4 (2014)Swaziland 10.8 5.0 10.9 4.2 1.3 (2014)Tanzania 138.5 5.6 31.3 -10.7 1.9 (2013)Togo 10.8 1.8 24.2 -21.9 2.2 (2013)Tunisia 127.0 4.9 21.8 -14.2 8.7 (2014)Uganda 79.9 5.8 26.5 -14.4 2.1 (2014)zambia 62.7 10.1 34.6 -6.8 3.7 (2014)zimbabwe 28.1 -2.4 13.0 … …
7
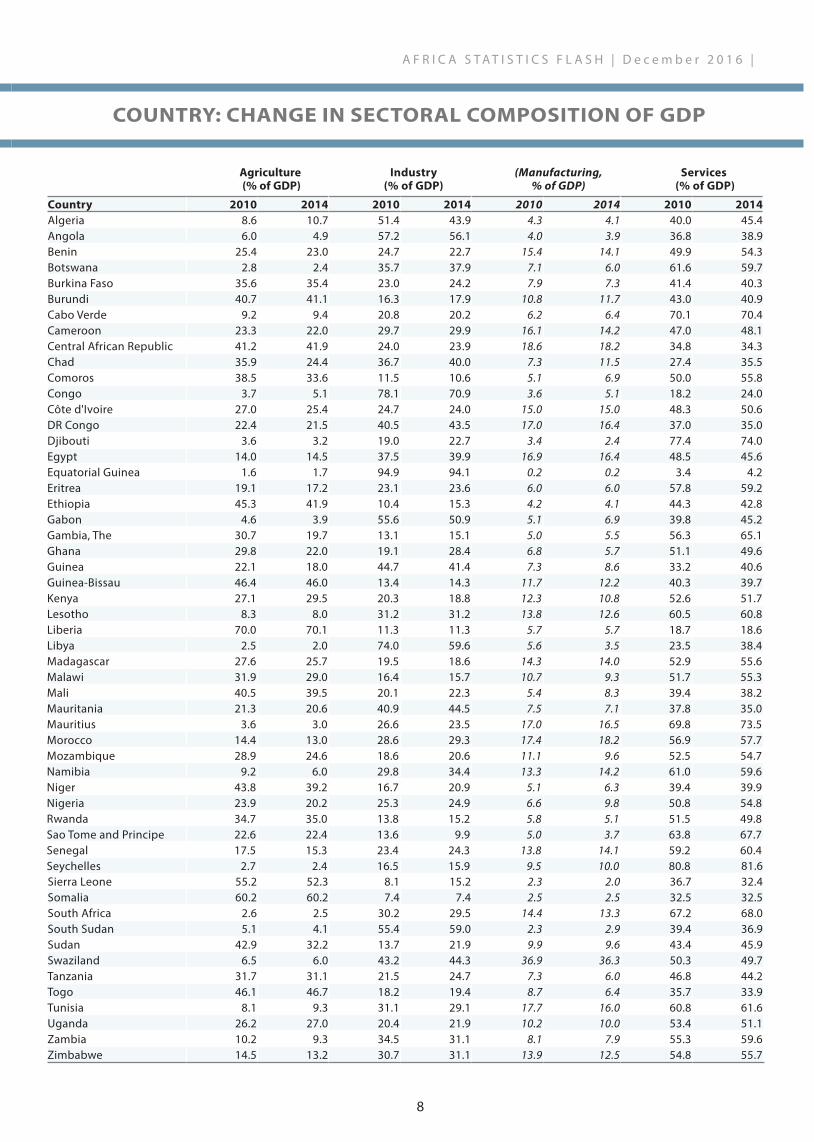
COUNTRY: CHaNGe IN SeCTORal COMpOSITION OF GdpCOUNTRY: KeY MaCROeCONOMIC INdICaTORS
a f R i C a S T a T i S T i C S f l a S H | d e c e m b e r 2 0 1 6 |
agriculture (% of Gdp)
Industry (% of Gdp)
(Manufacturing, % of GDP)
Services (% of Gdp)
Country 2010 2014 2010 2014 2010 2014 2010 2014algeria 8.6 10.7 51.4 43.9 4.3 4.1 40.0 45.4angola 6.0 4.9 57.2 56.1 4.0 3.9 36.8 38.9benin 25.4 23.0 24.7 22.7 15.4 14.1 49.9 54.3botswana 2.8 2.4 35.7 37.9 7.1 6.0 61.6 59.7burkina faso 35.6 35.4 23.0 24.2 7.9 7.3 41.4 40.3burundi 40.7 41.1 16.3 17.9 10.8 11.7 43.0 40.9Cabo Verde 9.2 9.4 20.8 20.2 6.2 6.4 70.1 70.4Cameroon 23.3 22.0 29.7 29.9 16.1 14.2 47.0 48.1Central african Republic 41.2 41.9 24.0 23.9 18.6 18.2 34.8 34.3Chad 35.9 24.4 36.7 40.0 7.3 11.5 27.4 35.5Comoros 38.5 33.6 11.5 10.6 5.1 6.9 50.0 55.8Congo 3.7 5.1 78.1 70.9 3.6 5.1 18.2 24.0Côte d'ivoire 27.0 25.4 24.7 24.0 15.0 15.0 48.3 50.6dR Congo 22.4 21.5 40.5 43.5 17.0 16.4 37.0 35.0djibouti 3.6 3.2 19.0 22.7 3.4 2.4 77.4 74.0egypt 14.0 14.5 37.5 39.9 16.9 16.4 48.5 45.6equatorial Guinea 1.6 1.7 94.9 94.1 0.2 0.2 3.4 4.2eritrea 19.1 17.2 23.1 23.6 6.0 6.0 57.8 59.2ethiopia 45.3 41.9 10.4 15.3 4.2 4.1 44.3 42.8Gabon 4.6 3.9 55.6 50.9 5.1 6.9 39.8 45.2Gambia, The 30.7 19.7 13.1 15.1 5.0 5.5 56.3 65.1Ghana 29.8 22.0 19.1 28.4 6.8 5.7 51.1 49.6Guinea 22.1 18.0 44.7 41.4 7.3 8.6 33.2 40.6Guinea-bissau 46.4 46.0 13.4 14.3 11.7 12.2 40.3 39.7Kenya 27.1 29.5 20.3 18.8 12.3 10.8 52.6 51.7lesotho 8.3 8.0 31.2 31.2 13.8 12.6 60.5 60.8liberia 70.0 70.1 11.3 11.3 5.7 5.7 18.7 18.6libya 2.5 2.0 74.0 59.6 5.6 3.5 23.5 38.4Madagascar 27.6 25.7 19.5 18.6 14.3 14.0 52.9 55.6Malawi 31.9 29.0 16.4 15.7 10.7 9.3 51.7 55.3Mali 40.5 39.5 20.1 22.3 5.4 8.3 39.4 38.2Mauritania 21.3 20.6 40.9 44.5 7.5 7.1 37.8 35.0Mauritius 3.6 3.0 26.6 23.5 17.0 16.5 69.8 73.5Morocco 14.4 13.0 28.6 29.3 17.4 18.2 56.9 57.7Mozambique 28.9 24.6 18.6 20.6 11.1 9.6 52.5 54.7Namibia 9.2 6.0 29.8 34.4 13.3 14.2 61.0 59.6Niger 43.8 39.2 16.7 20.9 5.1 6.3 39.4 39.9Nigeria 23.9 20.2 25.3 24.9 6.6 9.8 50.8 54.8Rwanda 34.7 35.0 13.8 15.2 5.8 5.1 51.5 49.8Sao Tome and principe 22.6 22.4 13.6 9.9 5.0 3.7 63.8 67.7Senegal 17.5 15.3 23.4 24.3 13.8 14.1 59.2 60.4Seychelles 2.7 2.4 16.5 15.9 9.5 10.0 80.8 81.6Sierra leone 55.2 52.3 8.1 15.2 2.3 2.0 36.7 32.4Somalia 60.2 60.2 7.4 7.4 2.5 2.5 32.5 32.5South africa 2.6 2.5 30.2 29.5 14.4 13.3 67.2 68.0South Sudan 5.1 4.1 55.4 59.0 2.3 2.9 39.4 36.9Sudan 42.9 32.2 13.7 21.9 9.9 9.6 43.4 45.9Swaziland 6.5 6.0 43.2 44.3 36.9 36.3 50.3 49.7Tanzania 31.7 31.1 21.5 24.7 7.3 6.0 46.8 44.2Togo 46.1 46.7 18.2 19.4 8.7 6.4 35.7 33.9Tunisia 8.1 9.3 31.1 29.1 17.7 16.0 60.8 61.6Uganda 26.2 27.0 20.4 21.9 10.2 10.0 53.4 51.1zambia 10.2 9.3 34.5 31.1 8.1 7.9 55.3 59.6zimbabwe 14.5 13.2 30.7 31.1 13.9 12.5 54.8 55.7
8
COUNTRY: CHaNGe IN SeCTORal COMpOSITION OF GdpCOUNTRY: KeY MaCROeCONOMIC INdICaTORS
| d e c e m b e r 2 0 1 6 | a f R i C a S T a T i S T i C S f l a S H
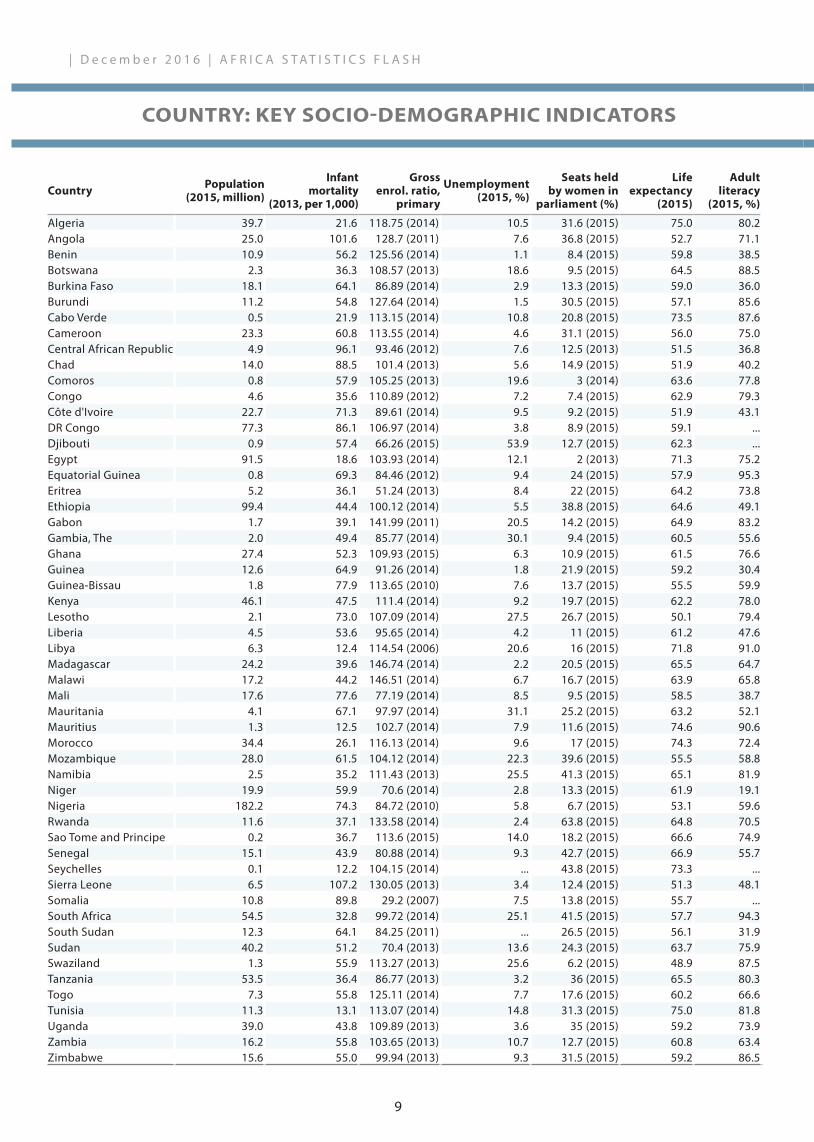
Country population (2015, million)
Infant mortality
(2013, per 1,000)
Gross enrol. ratio,
primary
Unemployment (2015, %)
Seats held by women in
parliament (%)
life expectancy
(2015)
adult literacy
(2015, %)
algeria 39.7 21.6 118.75 (2014) 10.5 31.6 (2015) 75.0 80.2angola 25.0 101.6 128.7 (2011) 7.6 36.8 (2015) 52.7 71.1benin 10.9 56.2 125.56 (2014) 1.1 8.4 (2015) 59.8 38.5botswana 2.3 36.3 108.57 (2013) 18.6 9.5 (2015) 64.5 88.5burkina faso 18.1 64.1 86.89 (2014) 2.9 13.3 (2015) 59.0 36.0burundi 11.2 54.8 127.64 (2014) 1.5 30.5 (2015) 57.1 85.6Cabo Verde 0.5 21.9 113.15 (2014) 10.8 20.8 (2015) 73.5 87.6Cameroon 23.3 60.8 113.55 (2014) 4.6 31.1 (2015) 56.0 75.0Central african Republic 4.9 96.1 93.46 (2012) 7.6 12.5 (2013) 51.5 36.8Chad 14.0 88.5 101.4 (2013) 5.6 14.9 (2015) 51.9 40.2Comoros 0.8 57.9 105.25 (2013) 19.6 3 (2014) 63.6 77.8Congo 4.6 35.6 110.89 (2012) 7.2 7.4 (2015) 62.9 79.3Côte d'ivoire 22.7 71.3 89.61 (2014) 9.5 9.2 (2015) 51.9 43.1dR Congo 77.3 86.1 106.97 (2014) 3.8 8.9 (2015) 59.1 ...djibouti 0.9 57.4 66.26 (2015) 53.9 12.7 (2015) 62.3 ...egypt 91.5 18.6 103.93 (2014) 12.1 2 (2013) 71.3 75.2equatorial Guinea 0.8 69.3 84.46 (2012) 9.4 24 (2015) 57.9 95.3eritrea 5.2 36.1 51.24 (2013) 8.4 22 (2015) 64.2 73.8ethiopia 99.4 44.4 100.12 (2014) 5.5 38.8 (2015) 64.6 49.1Gabon 1.7 39.1 141.99 (2011) 20.5 14.2 (2015) 64.9 83.2Gambia, The 2.0 49.4 85.77 (2014) 30.1 9.4 (2015) 60.5 55.6Ghana 27.4 52.3 109.93 (2015) 6.3 10.9 (2015) 61.5 76.6Guinea 12.6 64.9 91.26 (2014) 1.8 21.9 (2015) 59.2 30.4Guinea-bissau 1.8 77.9 113.65 (2010) 7.6 13.7 (2015) 55.5 59.9Kenya 46.1 47.5 111.4 (2014) 9.2 19.7 (2015) 62.2 78.0lesotho 2.1 73.0 107.09 (2014) 27.5 26.7 (2015) 50.1 79.4liberia 4.5 53.6 95.65 (2014) 4.2 11 (2015) 61.2 47.6libya 6.3 12.4 114.54 (2006) 20.6 16 (2015) 71.8 91.0Madagascar 24.2 39.6 146.74 (2014) 2.2 20.5 (2015) 65.5 64.7Malawi 17.2 44.2 146.51 (2014) 6.7 16.7 (2015) 63.9 65.8Mali 17.6 77.6 77.19 (2014) 8.5 9.5 (2015) 58.5 38.7Mauritania 4.1 67.1 97.97 (2014) 31.1 25.2 (2015) 63.2 52.1Mauritius 1.3 12.5 102.7 (2014) 7.9 11.6 (2015) 74.6 90.6Morocco 34.4 26.1 116.13 (2014) 9.6 17 (2015) 74.3 72.4Mozambique 28.0 61.5 104.12 (2014) 22.3 39.6 (2015) 55.5 58.8Namibia 2.5 35.2 111.43 (2013) 25.5 41.3 (2015) 65.1 81.9Niger 19.9 59.9 70.6 (2014) 2.8 13.3 (2015) 61.9 19.1Nigeria 182.2 74.3 84.72 (2010) 5.8 6.7 (2015) 53.1 59.6Rwanda 11.6 37.1 133.58 (2014) 2.4 63.8 (2015) 64.8 70.5Sao Tome and principe 0.2 36.7 113.6 (2015) 14.0 18.2 (2015) 66.6 74.9Senegal 15.1 43.9 80.88 (2014) 9.3 42.7 (2015) 66.9 55.7Seychelles 0.1 12.2 104.15 (2014) ... 43.8 (2015) 73.3 ...Sierra leone 6.5 107.2 130.05 (2013) 3.4 12.4 (2015) 51.3 48.1Somalia 10.8 89.8 29.2 (2007) 7.5 13.8 (2015) 55.7 ...South africa 54.5 32.8 99.72 (2014) 25.1 41.5 (2015) 57.7 94.3South Sudan 12.3 64.1 84.25 (2011) ... 26.5 (2015) 56.1 31.9Sudan 40.2 51.2 70.4 (2013) 13.6 24.3 (2015) 63.7 75.9Swaziland 1.3 55.9 113.27 (2013) 25.6 6.2 (2015) 48.9 87.5Tanzania 53.5 36.4 86.77 (2013) 3.2 36 (2015) 65.5 80.3Togo 7.3 55.8 125.11 (2014) 7.7 17.6 (2015) 60.2 66.6Tunisia 11.3 13.1 113.07 (2014) 14.8 31.3 (2015) 75.0 81.8Uganda 39.0 43.8 109.89 (2013) 3.6 35 (2015) 59.2 73.9zambia 16.2 55.8 103.65 (2013) 10.7 12.7 (2015) 60.8 63.4zimbabwe 15.6 55.0 99.94 (2013) 9.3 31.5 (2015) 59.2 86.5
9
COUNTRY: KeY SOCIO-deMOGRapHIC INdICaTORS INTRa-aFRICaN eXpORT

a f R i C a S T a T i S T i C S f l a S H | d e c e m b e r 2 0 1 6 |
10
COUNTRY: KeY SOCIO-deMOGRapHIC INdICaTORS INTRa-aFRICaN eXpORT
Intra african export (2015, USd million)
aMU CeN-Sad COMeSa eaC eCCaS eCOWaS IGad SadC World
From
aMU 5,617 7,307 2,293 9 448 1,398 359 238 85,803
CeN-Sad 4,208 17,263 5,509 1,707 2,948 12,200 2,407 6,535 167,872
COMeSa 1,856 4,653 8,590 2,671 2,116 363 3,674 7,973 69,322
eaC 33 1,179 3,477 2,477 1,061 87 1,887 2,042 13,468
eCCaS 48 803 1,597 43 920 468 18 2,817 63,438
eCOWaS 304 11,052 402 38 2,015 10,560 44 5,085 88,089
IGad 52 1,810 2,871 1,935 600 71 2,431 1,210 15,697
SadC 542 3,464 13,105 2,005 3,880 1,620 1,459 30,996 147,223
AMU/UMA
CENSAD
COMESA
EACCEEAC-ECCAS
CEDEAO-ECOWAS
IGAD
SADC
0 10 2030 0
10
20
30
40
5060
7080
9010
00
10
20
30
40
50
60
01020010
200
10
20
30
40
50
010
20
1020
3040
50
60
70
8090
100 110
0
Intra-African exports between RECs (USD million, UNCTAD 2015) Color of link represents the exporting REC
aMU (arab Maghreb Union), CeN-Sad (Community of Sahel-Saharan States), CoMeSa (Common Market for eastern and Southern
africa), eaC (east african Community), eCCaS (economic Community of Central african States), eCoWaS (economic Community of West
african States), iGad (intergovernmental authority on development), SadC (Southern african development Community)

Import from bRICS (USd million) export to bRICS (USd million)
Country 2011 2012 2013 2014 2015 2011 2012 2013 2014 2015
brazil 12,221 12,210 11,084 9,698 8,199 15,436 14,266 17,446 17,061 8,764
Russian federation 8,228 9,658 7,184 8,447 7,354 2,203 1,900 1,948 2,029 1,941
india 23,346 27,315 34,076 34,630 25,640 37,823 40,786 37,690 41,065 33,223
China12 72,921 85,137 92,576 105,839 108,514 93,234 113,244 117,454 115,659 70,468
South africa 26,652 27,645 27,371 27,628 21,741 9,905 12,410 12,247 13,268 10,414
Total 143,369 161,964 172,290 186,243 171,448 158,599 182,607 186,785 189,081 124,811
0
20
40
60
80
100(percentage)
2011 2012 2013 2014 2015 2011 2012 2013 2014 2015
8.5 7.5 6.4 5.2 4.8
5.7 6.04.2 4.5 4.3
16.3 16.9 19.8 18.615.0
50.9 52.6 53.7 56.8 63.3
18.6 17.1 15.9 14.8 12.7
9.7 7.8 9.3 9.0 7.0
1.41.0 1.0 1.1 1.6
23.822.3 20.2 21.7 26.6
58.862.0 62.9 61.2 56.5
6.2 6.8 6.6 7.0 8.3
South Africa China India Russian Federation Brazil
Imports Exports
| d e c e m b e r 2 0 1 6 | a f R i C a S T a T i S T i C S f l a S H
11
aFRICa’S TRade WITH bRICS FOReGIN dIReCT INveSTMeNT & OFFICIal develOpMeNT aSSITaNCe

Top 10 FdI inward flow (USd million)
Country 2014
South africa 5,712.3
Congo 5,502.3
Mozambique 4,901.8
egypt 4,783.2
Nigeria 4,693.8
Morocco 3,582.3
Ghana 3,357.0
zambia 2,483.8
Tanzania 2,141.6
dR Congo 2,063.2
africa total 53,912.1
Top 10 Oda recepients (as % of GNI)
Country 2014
liberia 44.3
Central african Republic 35.9
Somalia 21.1
Sierra leone 18.9
South Sudan 16.6
burundi 16.2
Malawi 15.8
Rwanda 13.3
Cabo Verde 12.9
Mozambique 12.6
FDI inward
South AfricaCongoMozambiqueEgyptNigeria
MoroccoGhana
ZambiaTanzaniaDR Congo
2008 2009 2010 2011 2012 2013 2014
0
2,000
4,000
6,000
8,000
10,000(USD million)
Net ODA
LiberiaCAR
SomaliaSierra LeoneSouth Sudan
BurundiMalawiRwandaCabo VerdeMozambique
2008 2009 2010 2011 2012 2013 20140
50
100
150
(% of GNI)
a f R i C a S T a T i S T i C S f l a S H | d e c e m b e r 2 0 1 6 |
12
aFRICa’S TRade WITH bRICS FOReGIN dIReCT INveSTMeNT & OFFICIal develOpMeNT aSSITaNCe

| d e c e m b e r 2 0 1 6 | a f R i C a S T a T i S T i C S f l a S H
13
NOTeSuperscript # Note
1 excluding Somalia
2 excluding South Sudan
3 excluding Somalia and liberia
4 excluding Somalia, libya and liberia
5 excluding djibouti, eritrea, ethiopia, Somalia, South Sudan, Gambia and Sudan
6 excluding eritrea (from 2012), ethipia, Somalia, South Sudan (2011), Mauritania (from 2013), libya (2015), Tunisia (2015), Malawi (2015), Ghana (from 2014), Gambia (2015) and liberia (2015)
7 excluding equatorial Guinea, djibouti, Somalia, South Sudan, Seychelles, libya, Tunisia (2014) and Namibia
8 excluding equatorial Guinea for Central africa
9 excluding Somalia for eastern africa
10 excluding djibouti, eritrea, ethiopia, Somalia and South Sudan for eastern africa
11 excluding eritrea (from 2012), ethipia, Somalia and South Sudan (2011) for eastern africa
12 excluding djibouti, Somalia, South Sudan and Seychelles for eastern africa
13 excluding libya for North africa
14 excluding Sudan for North africa
15 excluding Mauritania (from 2013), libya (2015) and Tunisia (2015) for North africa
16 excluding libya and Tunisia (2014) for North africa
17 excluding Malawi for Southern africa
18 excluding Namibia for Souther africa
19 excluding liberia for West africa
20 excluding Gambia for West africa
21 excluding Ghana (from 2014), Gambia (2015) and liberia (2015) for West africa
22 excluding zimbabwe
23 excluding Somalia, South Sudan (2011), Sudan (2011) and zimbabwe (2015)
a f R i C a S T a T i S T i C S f l a S H | d e c e m b e r 2 0 1 6 |
14
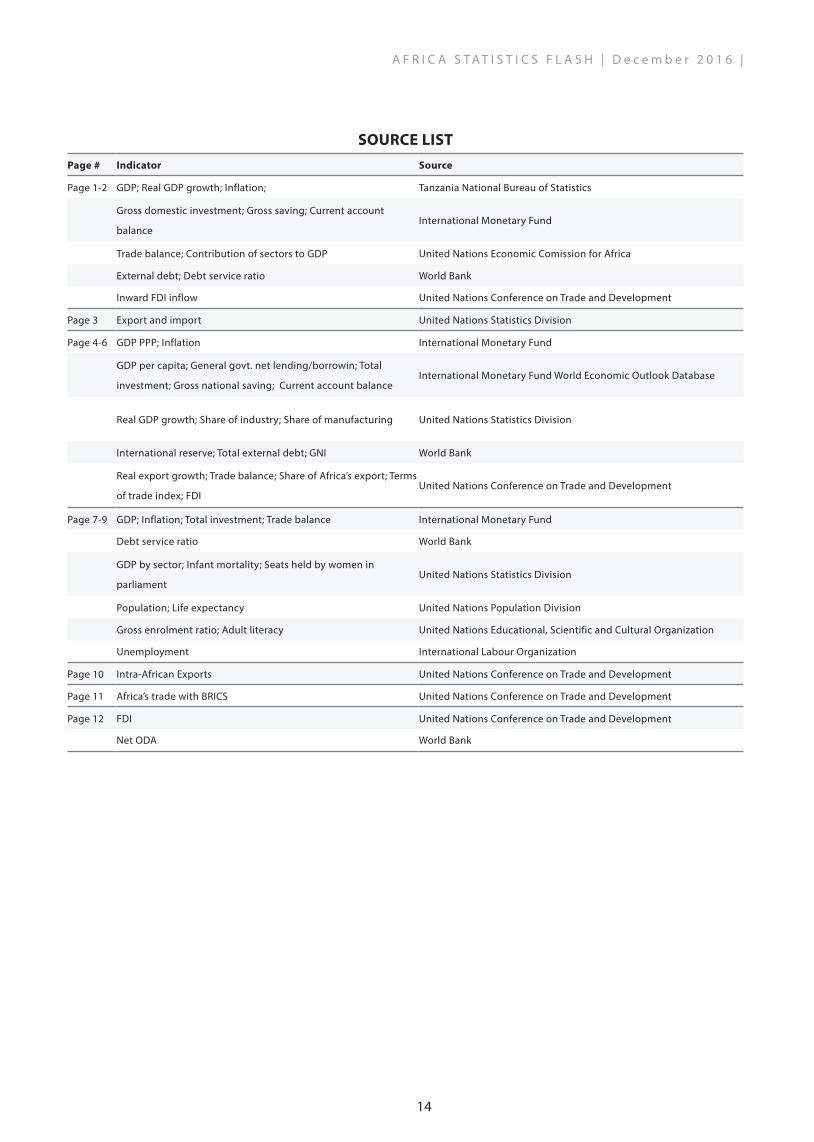
SOURCe lISTpage # Indicator Source
page 1-2 Gdp; Real Gdp growth; inflation; Tanzania National bureau of Statistics
Gross domestic investment; Gross saving; Current account
balanceinternational Monetary fund
Trade balance; Contribution of sectors to Gdp United Nations economic Comission for africa
external debt; debt service ratio World bank
inward fdi inflow United Nations Conference on Trade and development
page 3 export and import United Nations Statistics division
page 4-6 Gdp ppp; inflation international Monetary fund
Gdp per capita; General govt. net lending/borrowin; Total
investment; Gross national saving; Current account balanceinternational Monetary fund World economic outlook database
Real Gdp growth; Share of industry; Share of manufacturing United Nations Statistics division
international reserve; Total external debt; GNi World bank
Real export growth; Trade balance; Share of africa’s export; Terms
of trade index; fdiUnited Nations Conference on Trade and development
page 7-9 Gdp; inflation; Total investment; Trade balance international Monetary fund
debt service ratio World bank
Gdp by sector; infant mortality; Seats held by women in
parliamentUnited Nations Statistics division
population; life expectancy United Nations population division
Gross enrolment ratio; adult literacy United Nations educational, Scientific and Cultural organization
Unemployment international labour organization
page 10 intra-african exports United Nations Conference on Trade and development
page 11 africa’s trade with bRiCS United Nations Conference on Trade and development
page 12 fdi United Nations Conference on Trade and development
Net oda World bank

This report is prepared by the african Centre for Statistics of the economic Commission for africa.
The designations employed and the presentation of material in this publication do not imply the expression of any opinion whatsoever on the part of the United Nations concerning the legal status of any country, territory, city or area or of its authorities, or concerning the delimitation of its frontiers or boundaries. Where the designation “country or area” appears in the headings of tables, it covers countries, territories, cities or areas.
for more information Contact:african Centre for Statisticseconomic Commission for africap.o.box 3001addis ababaethiopiaTel.: +251-11-544 3050email: [email protected]: www.uneca.org