Embed Size (px)
Citation preview
AfreximbankPan-African bank at the epicentre of the continent’s trade growth
September 2019
1
Disclaimer
DISCLAIMER
IMPORTANT: Please read the following before continuing. The following applies to this document and the information contained therein, the oral presentation by the African Export-Import Bank (the “Bank”) or any person on
behalf of the Bank, and any question-and-answer session that follows the oral presentation (collectively, the “Information”). The Information has been prepared by the Bank for background purposes only and does not purport to
be full or complete. No reliance may be placed for any purpose on the Information or its accuracy, fairness or completeness. The Information and opinions contained herein are provided as at the date of this presentation and are
subject to change without notice. This presentation is the sole responsibility of the Bank and has not been reviewed or approved by any regulatory or supervisory authority.
The Information is not intended for potential investors and does not constitute or form part of, and should not be construed as an offer or the solicitation of an offer to subscribe for or purchase securities of the Bank, and nothing
contained therein shall form the basis of or be relied on in connection with any contract or commitment whatsoever. You acknowledge that all or part of the Information may constitute material non-public information and you
agree that you will not use such information or take any action in any way that might give rise to any infringement of law, regulations or restrictions in this regard. To the extent available, the industry, market and competitive
position data contained in the Information come from official or third party sources. Third party industry publications, studies and surveys generally state that the data contained therein has been obtained from sources believed to
be reliable, but that there is no guarantee of the accuracy or completeness of such data. While the Bank reasonably believes that each of these publications, studies and surveys has been prepared by a reputable party, neither
the Bank nor any of the Bank’s directors, officers, employees, agents, affiliates, advisors or agents, have independently verified the data contained therein. In addition, certain industry, market and competitive position data
contained in the Information come from the Bank’s internal research and estimates based on the knowledge and experience of the Bank’s management in the markets in which the Bank operates. While the Bank reasonably
believes that such research and estimates are reasonable, they, and their underlying methodology and assumptions, have not been verified by any independent source for accuracy or completeness and are subject to change.
Accordingly, reliance should not be placed on any of the industry, market or competitive position data contained in the Information.
This presentation includes certain operational and financial measures not presented in accordance with IFRS and, therefore, are not measures of financial performance in accordance with IFRS and may exclude items that are
significant in understanding and assessing the Bank’s financial results or future prospects. Therefore, these measures should not be considered in isolation or as an alternative performance measures under IFRS. You should be
aware that the Bank’s presentation of these measures may not be comparable to similarly-titled measures used by other companies.
The Information does not purport to be comprehensive. To the fullest extent permitted by law, neither the Bank nor any of the Bank’s directors, officers, employees, agents, affiliates, advisors or agents, accepts any responsibility
or liability whatsoever for (whether in contract, tort or otherwise) or makes any representation, warranty or undertaking, express or implied, as to the truth, fullness, fairness, accuracy or completeness of the Information (or
whether any information has been omitted from it) or any other information or opinion relating to the Bank, its subsidiaries, affiliates or associated companies, whether written, oral or in a visual or electronic form, and howsoever
transmitted or made available or for any loss howsoever arising from any use of the Information or otherwise arising in connection therewith. In giving this presentation, neither the Bank nor any of the Bank’s directors, officers,
employees, agents, affiliates, advisors or agents, undertake any obligation to provide the recipient(s) with access to any additional information or to update the Information, or to correct any inaccuracies in the Information,
including any data or forward-looking statements.
The Information may include forward-looking statements, which are based on current expectations and projections about future events. These statements may include, without limitation, any statements preceded by, followed by
or including words such as “target”, “believe”, “expect”, “aim”, “intend”, “may”, “anticipate”, “estimate”, “plan”, “project”, “will”, “can have”, “likely”, “should”, “would”, “could” and any other words and terms of similar meaning or the
negative thereof. These forward-looking statements are subject to risks, uncertainties and assumptions about the Bank and its subsidiaries and its investments, including, among other things, the development of its business,
strategy, trends in its operating environment, and future capital expenditures and acquisitions. In light of these risks, uncertainties and assumptions, the events in the forward-looking statements may not occur. No representation
or warranty is made that any forward-looking statement will come to pass. No one undertakes to update, supplement, amend or revise any such forward-looking statement. Except where otherwise indicated, the Information and
the opinions contained therein are provided as at the date of the presentation and are subject to change without notice.
1
Executive summary
3
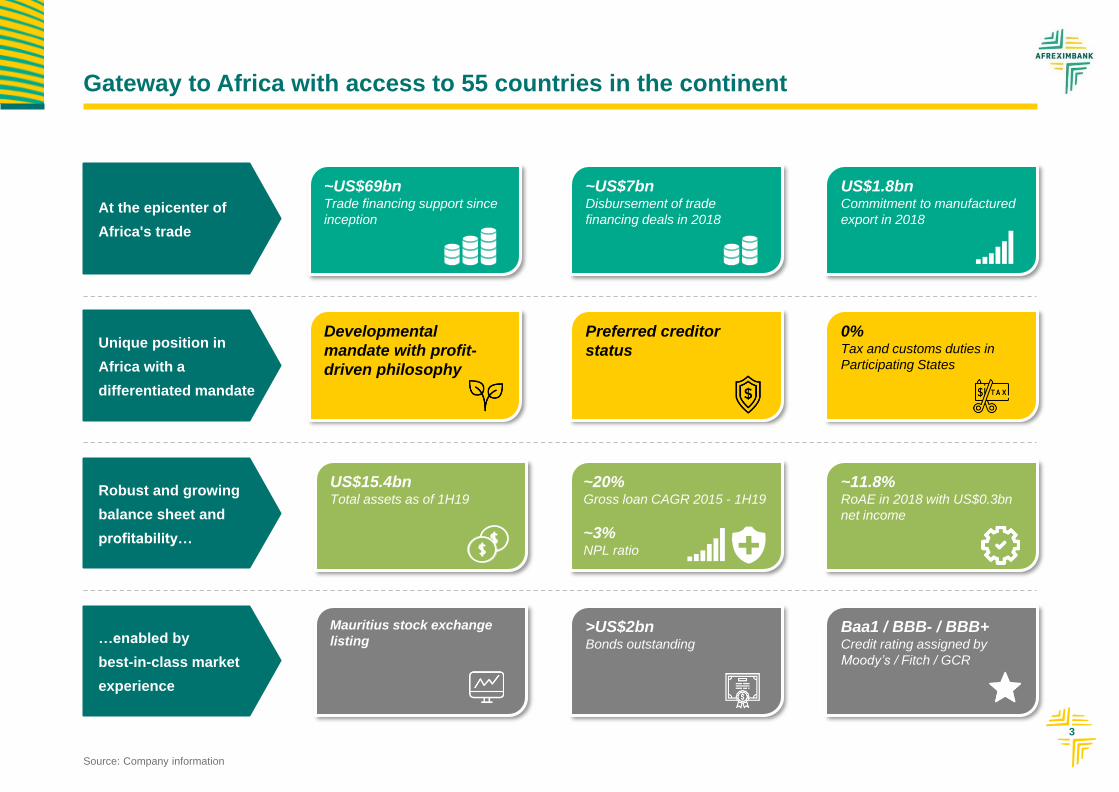
Gateway to Africa with access to 55 countries in the continent
Robust and growing
balance sheet and
profitability…
Source: Company information
…enabled by
best-in-class market
experience
Unique position in
Africa with a
differentiated mandate
At the epicenter of
Africa's trade
~20% Gross loan CAGR 2015 - 1H19
~3%NPL ratio
>US$2bnBonds outstanding
~11.8% RoAE in 2018 with US$0.3bn
net income
Baa1 / BBB- / BBB+Credit rating assigned by
Moody’s / Fitch / GCR
US$15.4bn Total assets as of 1H19
Mauritius stock exchange
listing
Preferred creditor
status
0%Tax and customs duties in
Participating States
Developmental
mandate with profit-
driven philosophy
~US$7bn Disbursement of trade
financing deals in 2018
US$1.8bnCommitment to manufactured
export in 2018
~US$69bn Trade financing support since
inception
4
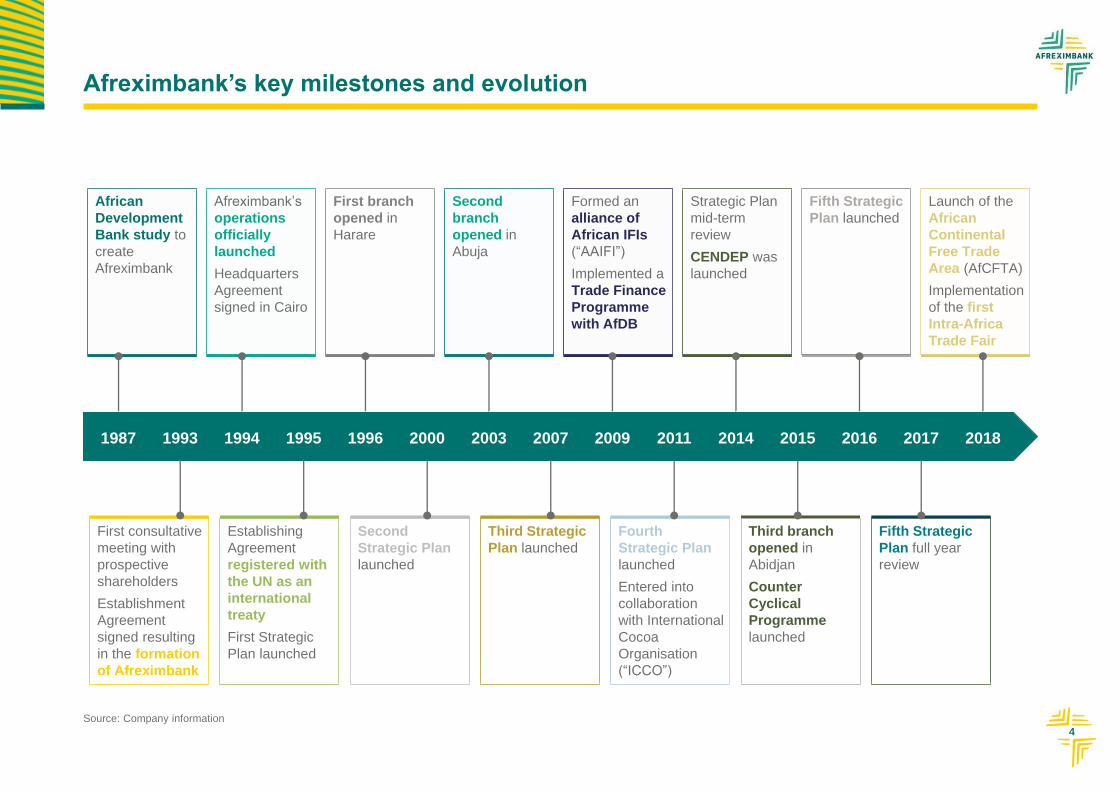
Afreximbank’s key milestones and evolution
1987 1993 1994 1995 1996 2000 2003 2007 2009 2011 2014 2015 2016 2017 2018
First consultative
meeting with
prospective
shareholders
Establishment
Agreement
signed resulting
in the formation
of Afreximbank
Establishing
Agreement
registered with
the UN as an
international
treaty
First Strategic
Plan launched
Second
Strategic Plan
launched
Third Strategic
Plan launched
Fourth
Strategic Plan
launched
Entered into
collaboration
with International
Cocoa
Organisation
(“ICCO”)
Third branch
opened in
Abidjan
Counter
Cyclical
Programme
launched
Fifth Strategic
Plan full year
review
African
Development
Bank study to
create
Afreximbank
Afreximbank’s
operations
officially
launched
Headquarters
Agreement
signed in Cairo
First branch
opened in
Harare
Second
branch
opened in
Abuja
Formed an
alliance of
African IFIs
(“AAIFI”)
Implemented a
Trade Finance
Programme
with AfDB
Strategic Plan
mid-term
review
CENDEP was
launched
Fifth Strategic
Plan launched
Launch of the
African
Continental
Free Trade
Area (AfCFTA)
Implementation
of the first
Intra-Africa
Trade Fair
Source: Company information
5
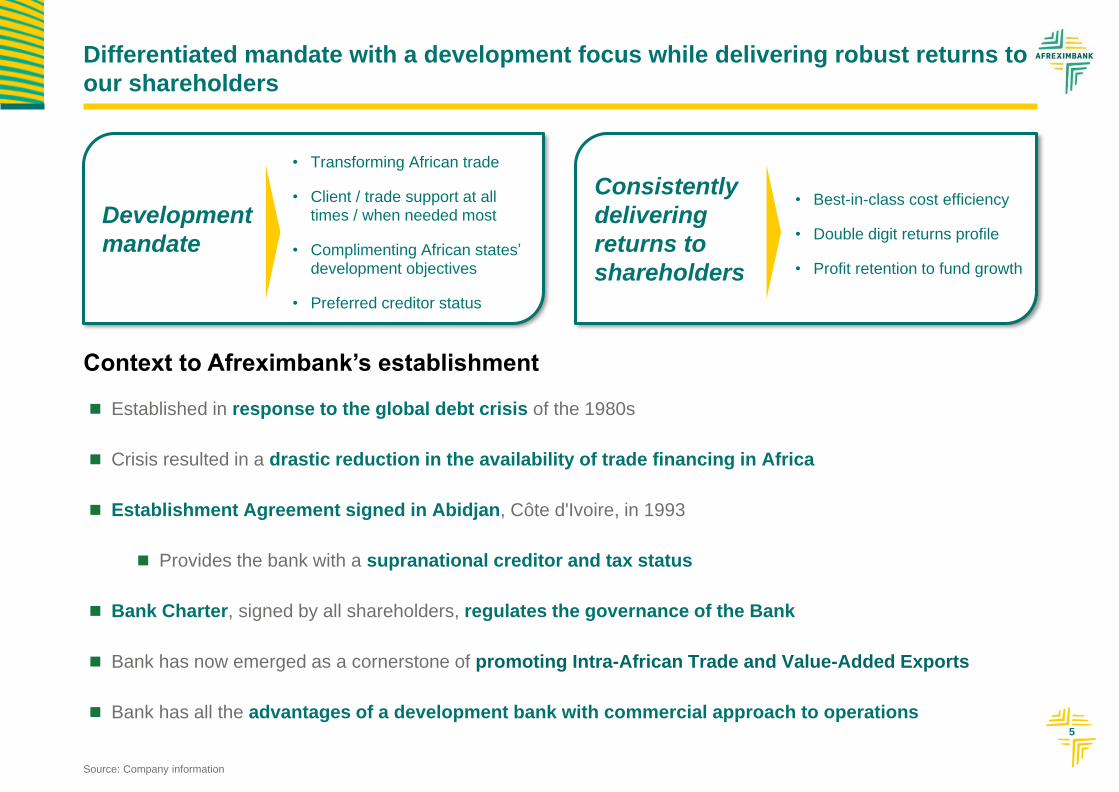
Differentiated mandate with a development focus while delivering robust returns to
our shareholders
Context to Afreximbank’s establishment
Established in response to the global debt crisis of the 1980s
Crisis resulted in a drastic reduction in the availability of trade financing in Africa
Establishment Agreement signed in Abidjan, Côte d'Ivoire, in 1993
Provides the bank with a supranational creditor and tax status
Bank Charter, signed by all shareholders, regulates the governance of the Bank
Bank has now emerged as a cornerstone of promoting Intra-African Trade and Value-Added Exports
Bank has all the advantages of a development bank with commercial approach to operations
Development
mandate
Consistently
delivering
returns to
shareholders
• Transforming African trade
• Client / trade support at all times / when needed most
• Complimenting African states’ development objectives
• Preferred creditor status
Source: Company information
• Best-in-class cost efficiency
• Double digit returns profile
• Profit retention to fund growth
6
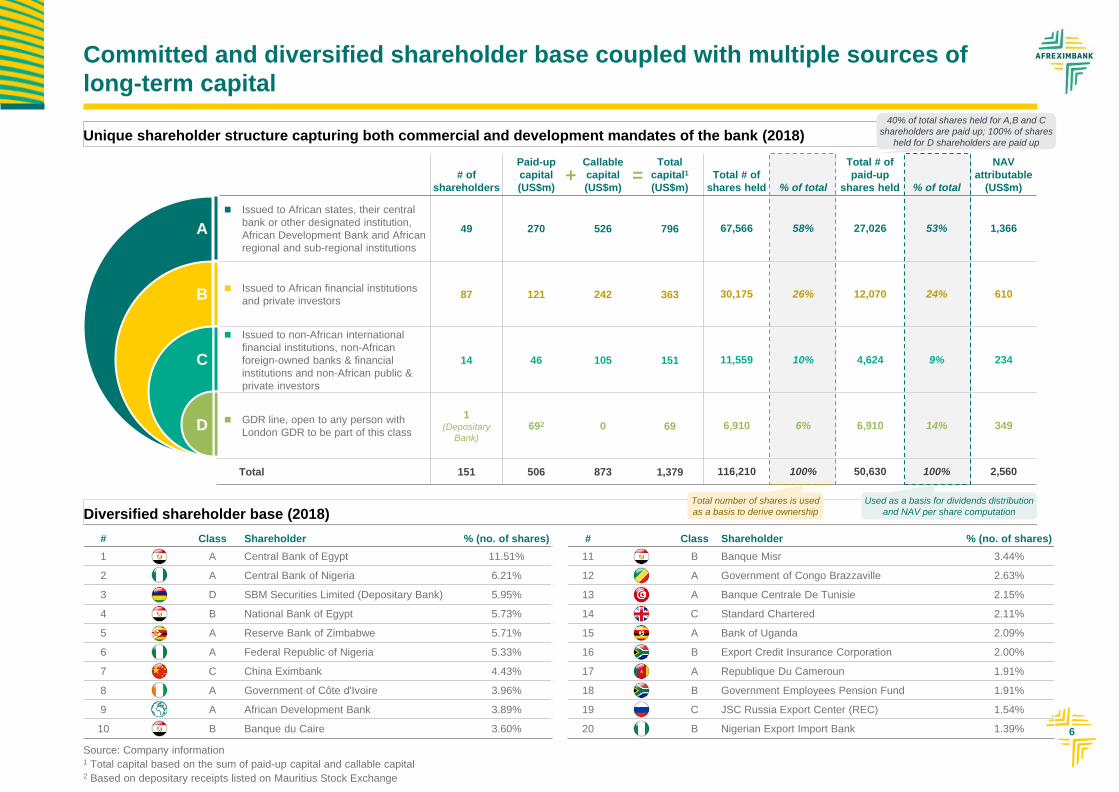
Unique shareholder structure capturing both commercial and development mandates of the bank (2018)
Committed and diversified shareholder base coupled with multiple sources of
long-term capital
# Class Shareholder % (no. of shares)
1 A Central Bank of Egypt 11.51%
2 A Central Bank of Nigeria 6.21%
3 D SBM Securities Limited (Depositary Bank) 5.95%
4 B National Bank of Egypt 5.73%
5 A Reserve Bank of Zimbabwe 5.71%
6 A Federal Republic of Nigeria 5.33%
7 C China Eximbank 4.43%
8 A Government of Côte d'Ivoire 3.96%
9 A African Development Bank 3.89%
10 B Banque du Caire 3.60%
# of
shareholders
Paid-up
capital
(US$m)
Callable
capital
(US$m)
Total
capital1
(US$m)
Total # of
shares held % of total
Total # of
paid-up
shares held % of total
NAV
attributable
(US$m)
Issued to African states, their central
bank or other designated institution,
African Development Bank and African
regional and sub-regional institutions
49 270 526 796 67,566 58% 27,026 53% 1,366
Issued to African financial institutions
and private investors87 121 242 363 30,175 26% 12,070 24% 610
Issued to non-African international
financial institutions, non-African
foreign-owned banks & financial
institutions and non-African public &
private investors
14 46 105 151 11,559 10% 4,624 9% 234
GDR line, open to any person with
London GDR to be part of this class
1(Depositary
Bank)
692 0 69 6,910 6% 6,910 14% 349
Total 151 506 873 1,379 116,210 100% 50,630 100% 2,560
A
B
C
D
Diversified shareholder base (2018)
# Class Shareholder % (no. of shares)
11 B Banque Misr 3.44%
12 A Government of Congo Brazzaville 2.63%
13 A Banque Centrale De Tunisie 2.15%
14 C Standard Chartered 2.11%
15 A Bank of Uganda 2.09%
16 B Export Credit Insurance Corporation 2.00%
17 A Republique Du Cameroun 1.91%
18 B Government Employees Pension Fund 1.91%
19 C JSC Russia Export Center (REC) 1.54%
20 B Nigerian Export Import Bank 1.39%
Source: Company information1 Total capital based on the sum of paid-up capital and callable capital2 Based on depositary receipts listed on Mauritius Stock Exchange
Used as a basis for dividends distribution
and NAV per share computation
Total number of shares is used
as a basis to derive ownership
+ =
40% of total shares held for A,B and C
shareholders are paid up; 100% of shares
held for D shareholders are paid up
7
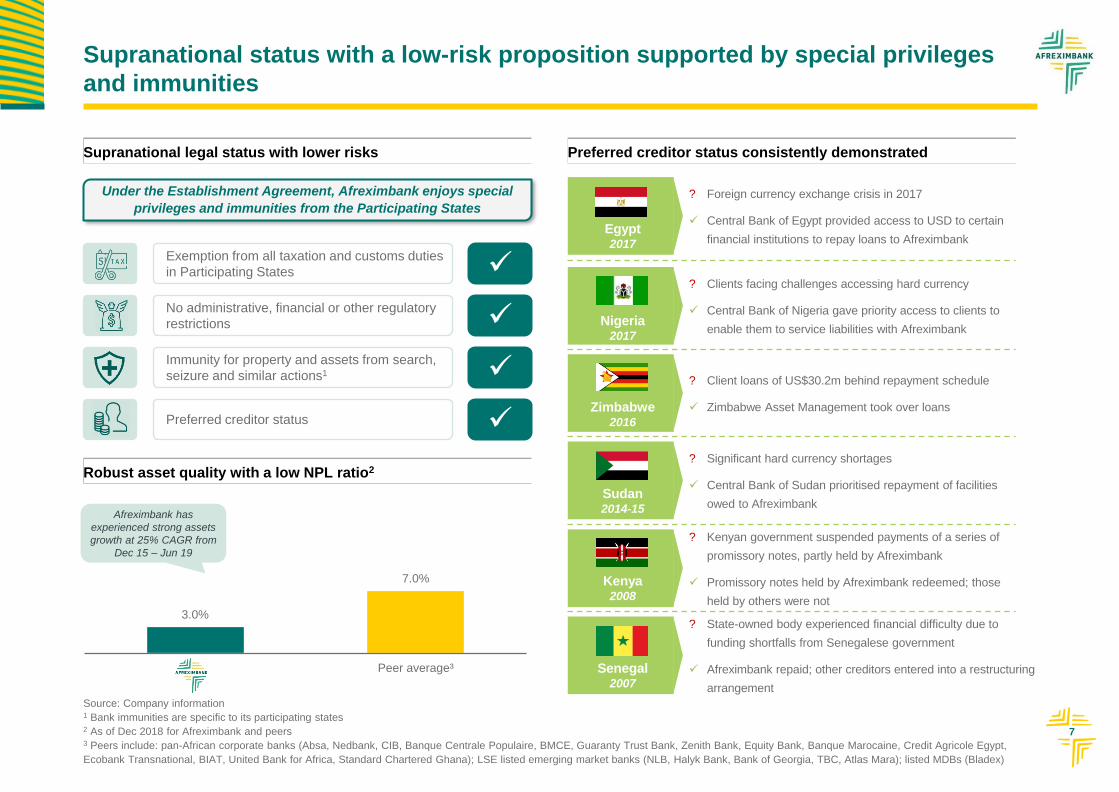
3.0%
7.0%
Peer average³
Exemption from all taxation and customs duties
in Participating States
No administrative, financial or other regulatory
restrictions
Immunity for property and assets from search,
seizure and similar actions1
Preferred creditor status
Supranational status with a low-risk proposition supported by special privileges
and immunities
Supranational legal status with lower risks Preferred creditor status consistently demonstrated
? Kenyan government suspended payments of a series of
promissory notes, partly held by Afreximbank
Promissory notes held by Afreximbank redeemed; those
held by others were not
Kenya2008
? Client loans of US$30.2m behind repayment schedule
Zimbabwe Asset Management took over loans Zimbabwe2016
? Significant hard currency shortages
Central Bank of Sudan prioritised repayment of facilities
owed to AfreximbankSudan2014-15
? Clients facing challenges accessing hard currency
Central Bank of Nigeria gave priority access to clients to
enable them to service liabilities with Afreximbank Nigeria
2017
? State-owned body experienced financial difficulty due to
funding shortfalls from Senegalese government
Afreximbank repaid; other creditors entered into a restructuring
arrangement
Senegal2007
? Foreign currency exchange crisis in 2017
Central Bank of Egypt provided access to USD to certain
financial institutions to repay loans to AfreximbankEgypt2017
Source: Company information1 Bank immunities are specific to its participating states2 As of Dec 2018 for Afreximbank and peers3 Peers include: pan-African corporate banks (Absa, Nedbank, CIB, Banque Centrale Populaire, BMCE, Guaranty Trust Bank, Zenith Bank, Equity Bank, Banque Marocaine, Credit Agricole Egypt,
Ecobank Transnational, BIAT, United Bank for Africa, Standard Chartered Ghana); LSE listed emerging market banks (NLB, Halyk Bank, Bank of Georgia, TBC, Atlas Mara); listed MDBs (Bladex)
Under the Establishment Agreement, Afreximbank enjoys special
privileges and immunities from the Participating States
Robust asset quality with a low NPL ratio2
Afreximbank has
experienced strong assets
growth at 25% CAGR from
Dec 15 – Jun 19
8
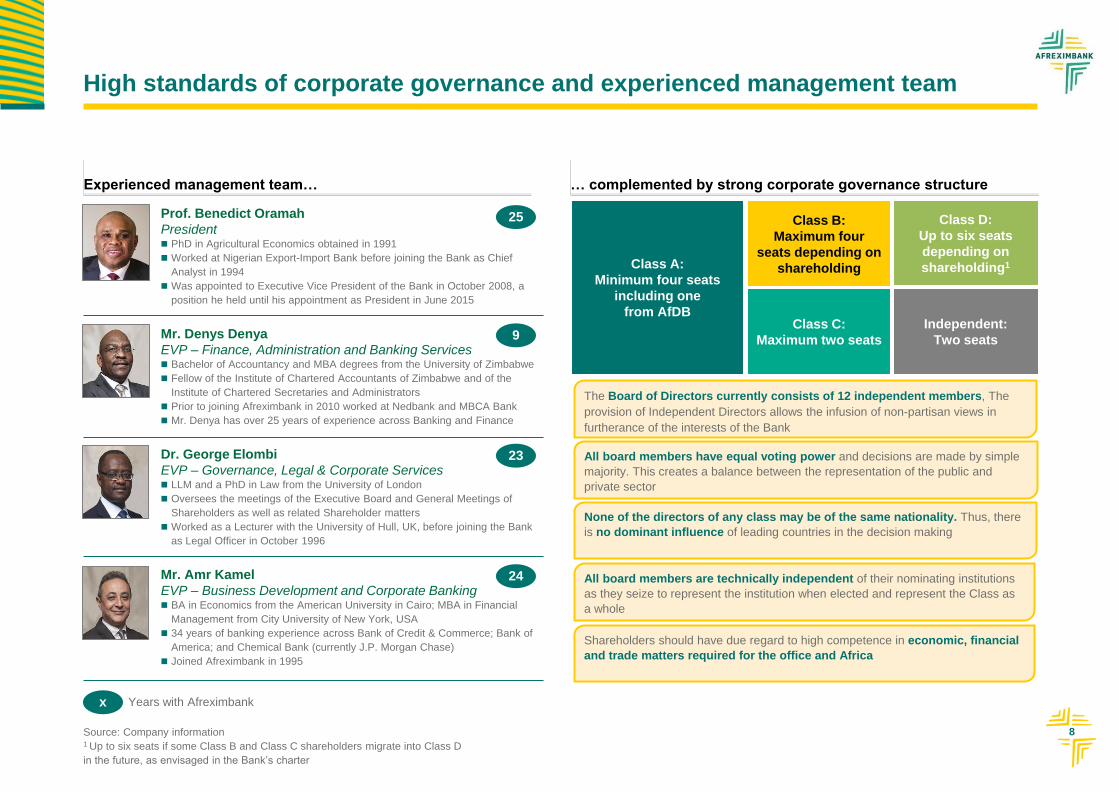
High standards of corporate governance and experienced management team
Prof. Benedict Oramah
President PhD in Agricultural Economics obtained in 1991
Worked at Nigerian Export-Import Bank before joining the Bank as Chief
Analyst in 1994
Was appointed to Executive Vice President of the Bank in October 2008, a
position he held until his appointment as President in June 2015
Mr. Denys Denya
EVP – Finance, Administration and Banking Services Bachelor of Accountancy and MBA degrees from the University of Zimbabwe
Fellow of the Institute of Chartered Accountants of Zimbabwe and of the
Institute of Chartered Secretaries and Administrators
Prior to joining Afreximbank in 2010 worked at Nedbank and MBCA Bank
Mr. Denya has over 25 years of experience across Banking and Finance
Dr. George Elombi
EVP – Governance, Legal & Corporate Services LLM and a PhD in Law from the University of London
Oversees the meetings of the Executive Board and General Meetings of
Shareholders as well as related Shareholder matters
Worked as a Lecturer with the University of Hull, UK, before joining the Bank
as Legal Officer in October 1996
Mr. Amr Kamel
EVP – Business Development and Corporate Banking BA in Economics from the American University in Cairo; MBA in Financial
Management from City University of New York, USA
34 years of banking experience across Bank of Credit & Commerce; Bank of
America; and Chemical Bank (currently J.P. Morgan Chase)
Joined Afreximbank in 1995
x Years with Afreximbank
25
9
23
24
Source: Company information1 Up to six seats if some Class B and Class C shareholders migrate into Class D
in the future, as envisaged in the Bank’s charter
Class A:
Minimum four seats
including one
from AfDBIndependent:
Two seats
Class B:
Maximum four
seats depending on
shareholding
Class C:
Maximum two seats
Class D:
Up to six seats
depending on
shareholding1
The Board of Directors currently consists of 12 independent members, The
provision of Independent Directors allows the infusion of non-partisan views in
furtherance of the interests of the Bank
All board members have equal voting power and decisions are made by simple
majority. This creates a balance between the representation of the public and
private sector
None of the directors of any class may be of the same nationality. Thus, there
is no dominant influence of leading countries in the decision making
All board members are technically independent of their nominating institutions
as they seize to represent the institution when elected and represent the Class as
a whole
Shareholders should have due regard to high competence in economic, financial
and trade matters required for the office and Africa
Experienced management team… … complemented by strong corporate governance structure

9
Leading banking franchise at the epicentre of intermediating Africa’s trade growth
Strong secular growth drivers compounded by the impressive African trade dynamics1
Supranational status with a low-risk proposition supported by special privileges and immunities2
Clearly defined strategy to further strengthen existing leadership in the African trade finance market with
key value upsides for Afreximbank8
Strong and liquid balance sheet profile with a solid capital position 6
Well-established public-private partnership model with strong international strategic alliances 3
Achieves long-lasting positive developmental impact via its specific operating model and mandate4
Consistent track record of robust earnings and dividends7
5Highly efficient operations driven by the wholesale banking model and the use of trade finance
intermediaries
2Strategic positioning and market
opportunity
11
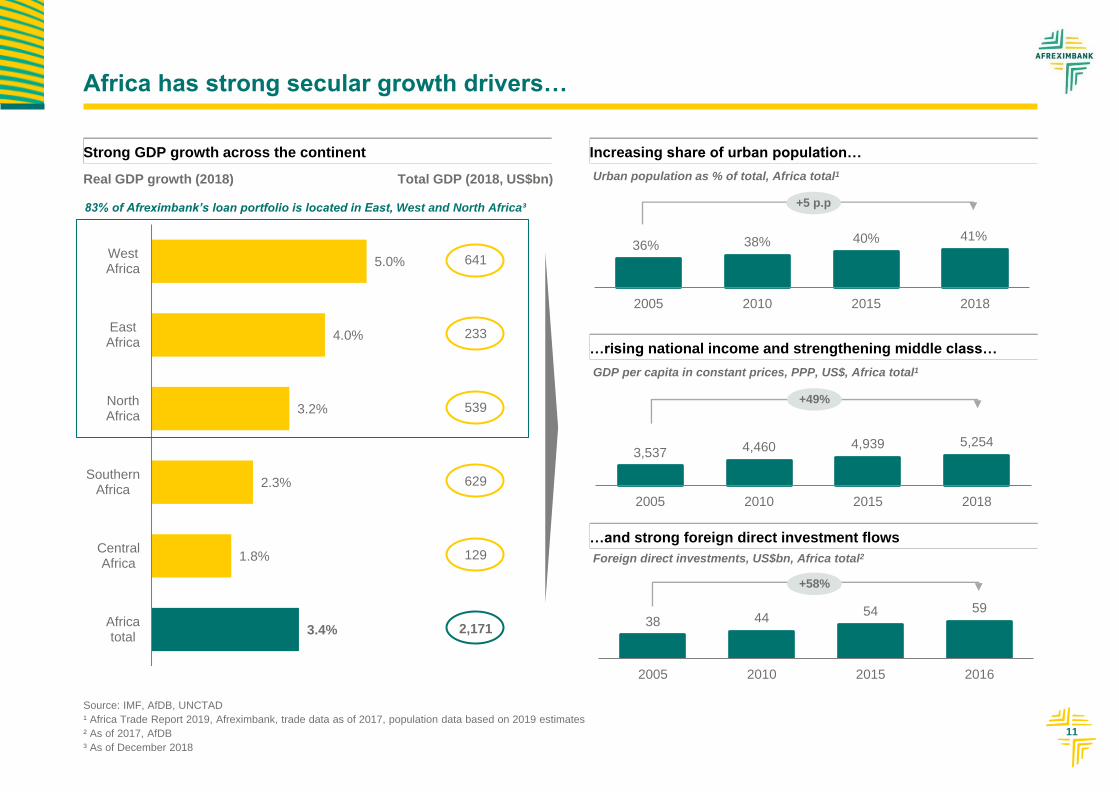
Africa has strong secular growth drivers…
Strong GDP growth across the continent
Real GDP growth (2018)
Source: IMF, AfDB, UNCTAD
¹ Africa Trade Report 2019, Afreximbank, trade data as of 2017, population data based on 2019 estimates
² As of 2017, AfDB
³ As of December 2018
5.0%
4.0%
3.2%
2.3%
1.8%
3.4%
WestAfrica
EastAfrica
NorthAfrica
SouthernAfrica
CentralAfrica
Africatotal
Total GDP (2018, US$bn)
641
233
539
629
129
2,171
83% of Afreximbank’s loan portfolio is located in East, West and North Africa³
36% 38% 40% 41%
2005 2010 2015 2018
+5 p.p
Increasing share of urban population…
Urban population as % of total, Africa total1
3,537 4,460 4,939 5,254
2005 2010 2015 2018
…rising national income and strengthening middle class…
GDP per capita in constant prices, PPP, US$, Africa total1
+49%
…and strong foreign direct investment flows
38 44 54 59
2005 2010 2015 2016
Foreign direct investments, US$bn, Africa total2
+58%
12
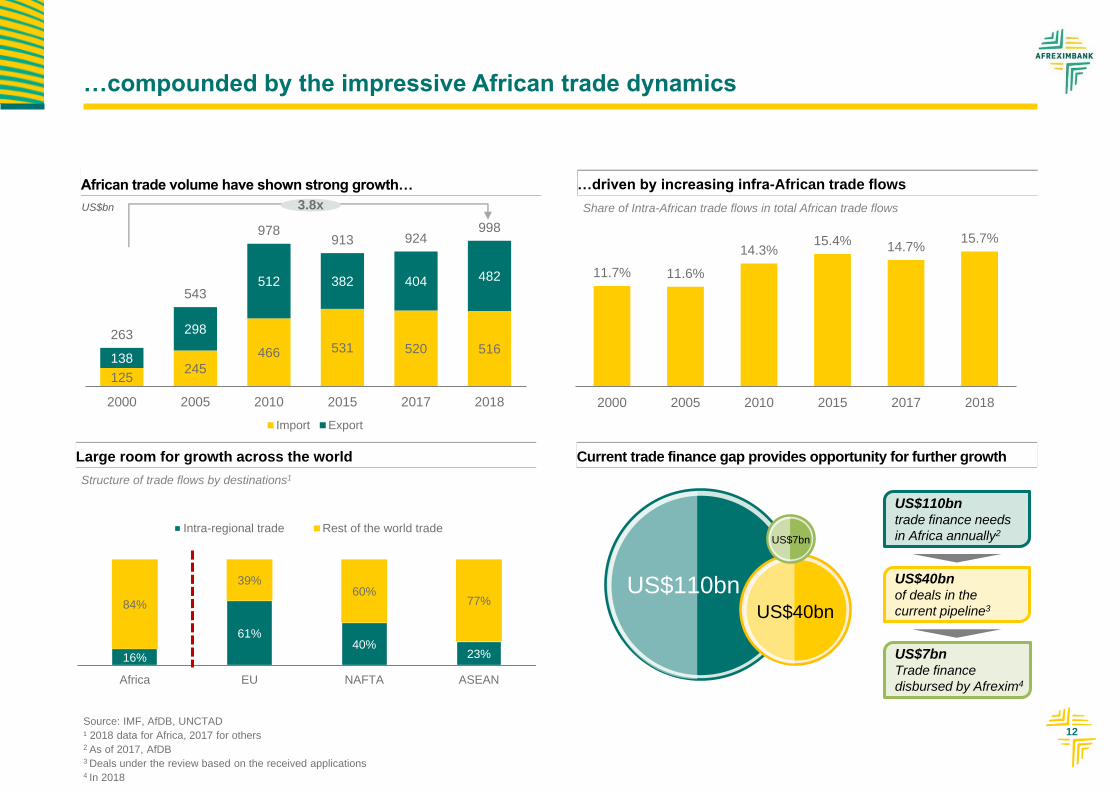
…compounded by the impressive African trade dynamics
11.7% 11.6%
14.3% 15.4% 14.7%
15.7%
2000 2005 2010 2015 2017 2018
…driven by increasing infra-African trade flows
Current trade finance gap provides opportunity for further growth
125 245
466 531 520 516 138
298
512 382 404 482
263
543
978913 924
998
2000 2005 2010 2015 2017 2018
Import Export
African trade volume have shown strong growth…
Large room for growth across the world
16%
61%40%
23%
84%
39%60%
77%
Africa EU NAFTA ASEAN
Intra-regional trade Rest of the world trade
Source: IMF, AfDB, UNCTAD
¹ 2018 data for Africa, 2017 for others2 As of 2017, AfDB3 Deals under the review based on the received applications4 In 2018
3.8x Share of Intra-African trade flows in total African trade flows
Structure of trade flows by destinations1
US$110bnUS$40bn
US$40bnof deals in the
current pipeline3
US$7bnTrade finance
disbursed by Afrexim4
US$110bntrade finance needs
in Africa annually2US$7bn
US$bn
13
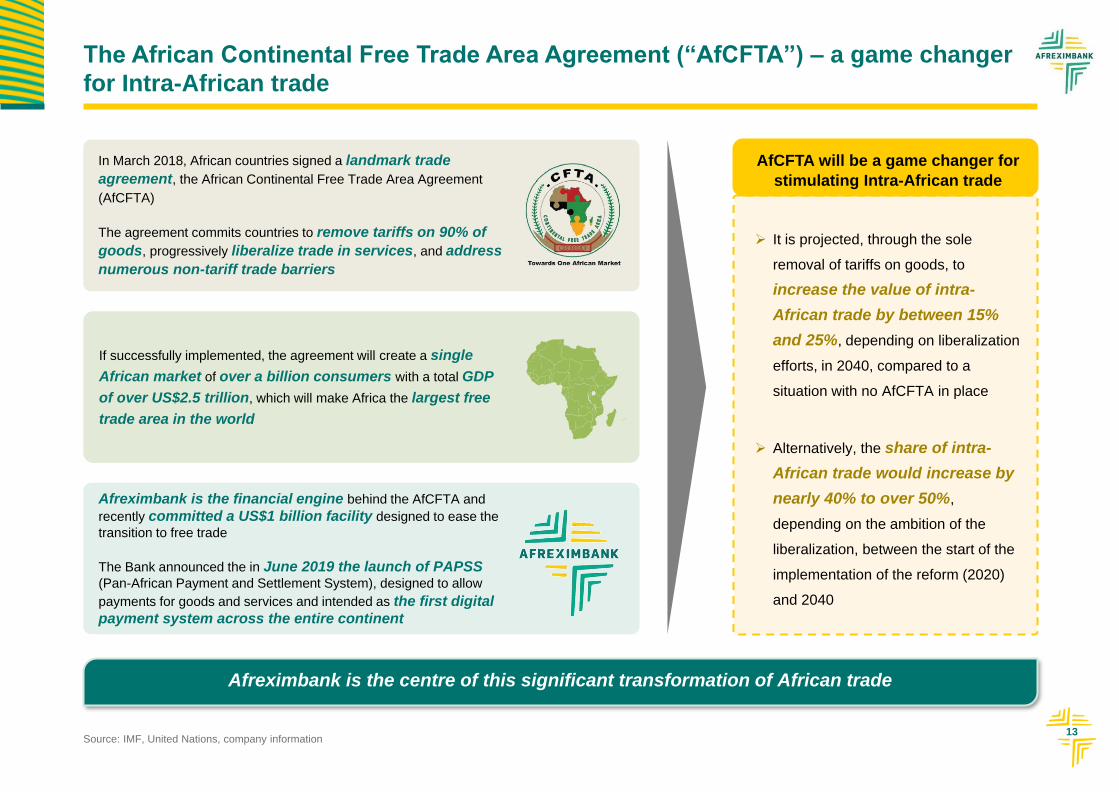
The African Continental Free Trade Area Agreement (“AfCFTA”) – a game changer
for Intra-African trade
Afreximbank is the centre of this significant transformation of African trade
Afreximbank is the financial engine behind the AfCFTA and
recently committed a US$1 billion facility designed to ease the
transition to free trade
The Bank announced the in June 2019 the launch of PAPSS(Pan-African Payment and Settlement System), designed to allow
payments for goods and services and intended as the first digital
payment system across the entire continent
If successfully implemented, the agreement will create a single
African market of over a billion consumers with a total GDP
of over US$2.5 trillion, which will make Africa the largest free
trade area in the world
In March 2018, African countries signed a landmark trade
agreement, the African Continental Free Trade Area Agreement
(AfCFTA)
The agreement commits countries to remove tariffs on 90% of
goods, progressively liberalize trade in services, and address
numerous non-tariff trade barriers
It is projected, through the sole
removal of tariffs on goods, to
increase the value of intra-
African trade by between 15%
and 25%, depending on liberalization
efforts, in 2040, compared to a
situation with no AfCFTA in place
Alternatively, the share of intra-
African trade would increase by
nearly 40% to over 50%,
depending on the ambition of the
liberalization, between the start of the
implementation of the reform (2020)
and 2040
AfCFTA will be a game changer for
stimulating Intra-African trade
Source: IMF, United Nations, company information
14
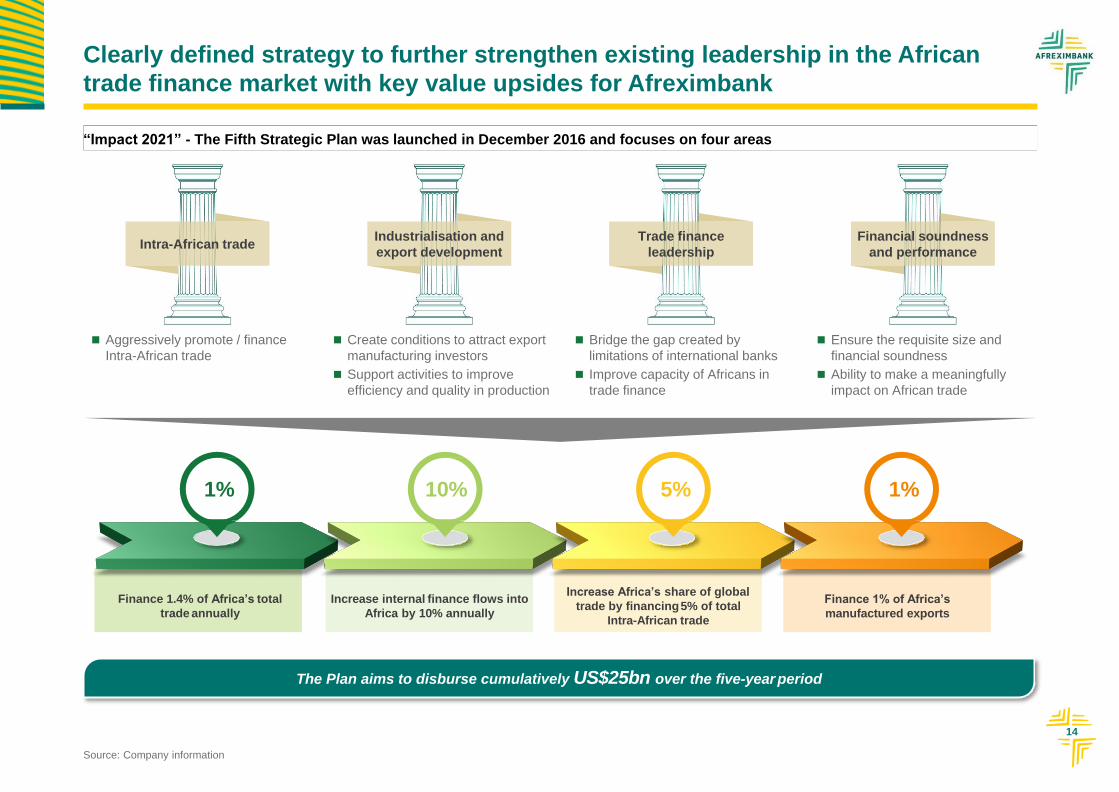
Clearly defined strategy to further strengthen existing leadership in the African
trade finance market with key value upsides for Afreximbank
Intra-African tradeIndustrialisation and
export development
Trade finance
leadership
Financial soundness
and performance
“Impact 2021” - The Fifth Strategic Plan was launched in December 2016 and focuses on four areas
Aggressively promote / finance
Intra-African trade
Create conditions to attract export
manufacturing investors
Support activities to improve
efficiency and quality in production
Bridge the gap created by
limitations of international banks
Improve capacity of Africans in
trade finance
Ensure the requisite size and
financial soundness
Ability to make a meaningfully
impact on African trade
Source: Company information
Finance 1.4% of Africa’s total
trade annually
Increase internal finance flows into
Africa by 10% annually
Increase Africa’s share of global
trade by financing5% of total
Intra-African trade
Finance 1% of Africa’s
manufactured exports
1% 10% 5% 1%
The Plan aims to disburse cumulatively US$25bn over the five-year period
15
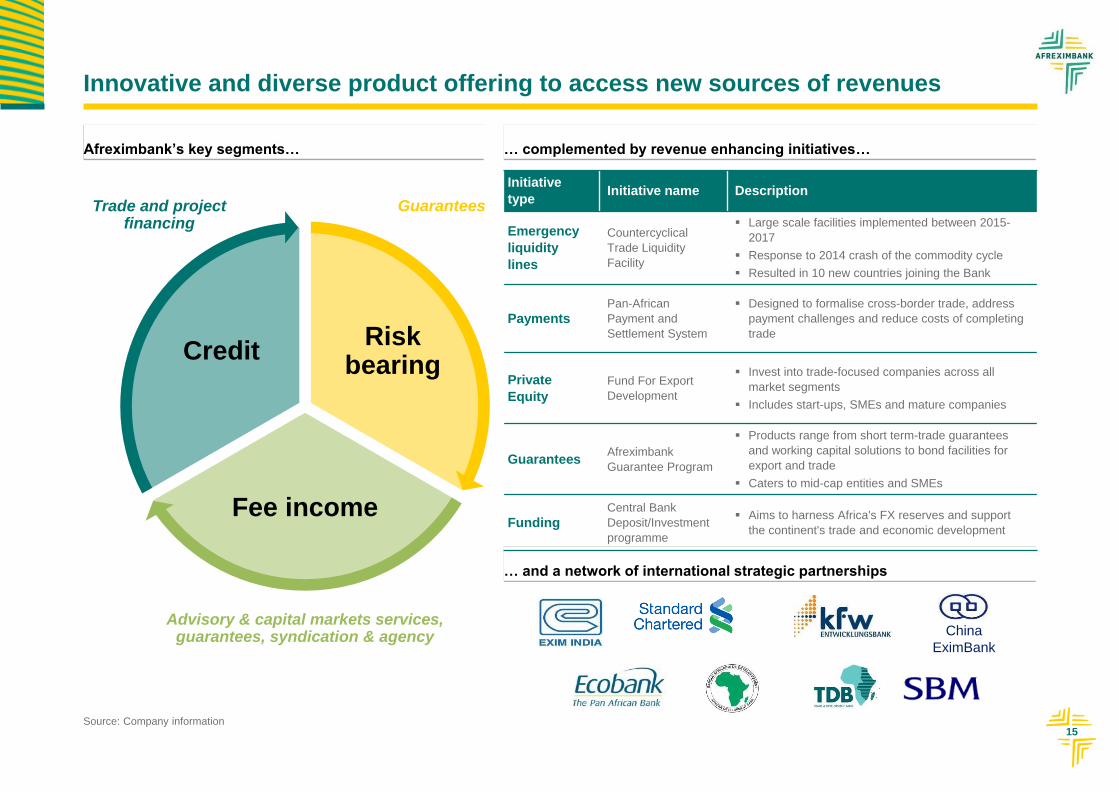
Innovative and diverse product offering to access new sources of revenues
Initiative
type Initiative name Description
Emergency
liquidity
lines
Countercyclical
Trade Liquidity
Facility
Large scale facilities implemented between 2015-
2017
Response to 2014 crash of the commodity cycle
Resulted in 10 new countries joining the Bank
PaymentsPan-African
Payment and
Settlement System
Designed to formalise cross-border trade, address
payment challenges and reduce costs of completing
trade
Private
Equity
Fund For Export
Development
Invest into trade-focused companies across all
market segments
Includes start-ups, SMEs and mature companies
GuaranteesAfreximbank
Guarantee Program
Products range from short term-trade guarantees
and working capital solutions to bond facilities for
export and trade
Caters to mid-cap entities and SMEs
FundingCentral Bank
Deposit/Investment
programme
Aims to harness Africa's FX reserves and support
the continent's trade and economic development
Afreximbank’s key segments… … complemented by revenue enhancing initiatives…
… and a network of international strategic partnerships
China
EximBank
Source: Company information
GuaranteesTrade and projectfinancing
Advisory & capital markets services, guarantees, syndication & agency
CreditRisk
bearing
Fee income
16
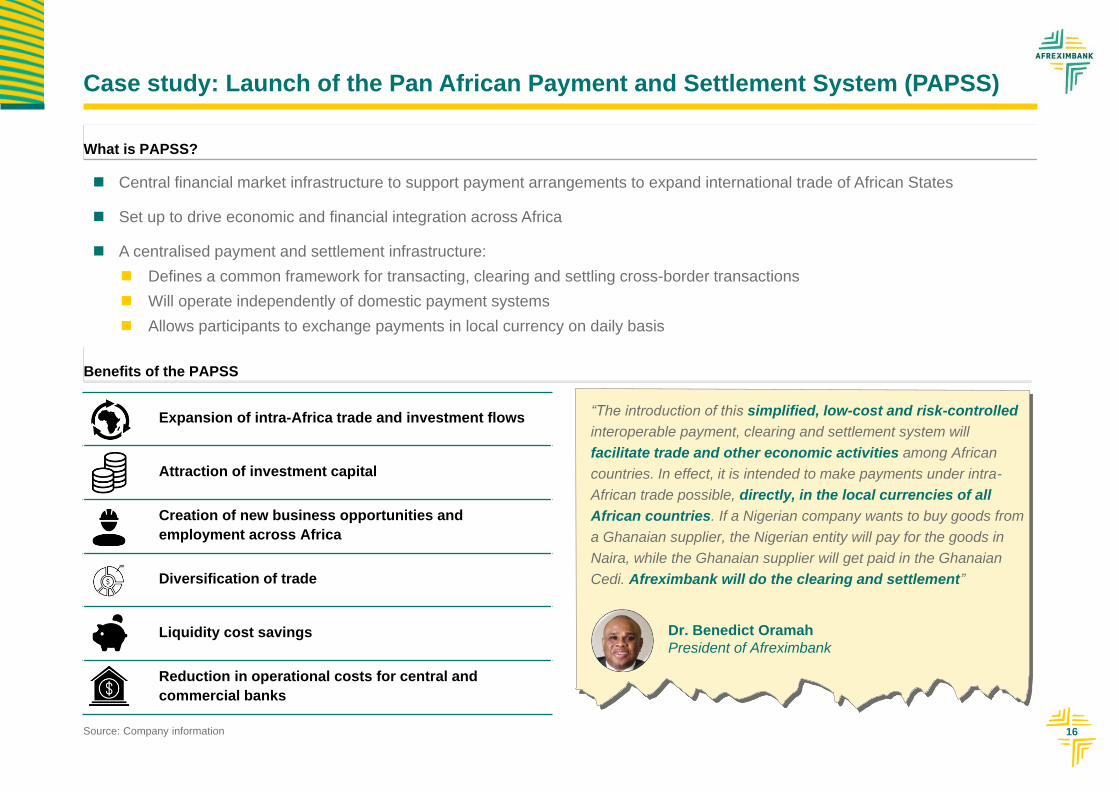
Case study: Launch of the Pan African Payment and Settlement System (PAPSS)
What is PAPSS?
Central financial market infrastructure to support payment arrangements to expand international trade of African States
Set up to drive economic and financial integration across Africa
A centralised payment and settlement infrastructure:
Defines a common framework for transacting, clearing and settling cross-border transactions
Will operate independently of domestic payment systems
Allows participants to exchange payments in local currency on daily basis
Benefits of the PAPSS
Expansion of intra-Africa trade and investment flows
Attraction of investment capital
Creation of new business opportunities and
employment across Africa
Diversification of trade
Liquidity cost savings
Reduction in operational costs for central and
commercial banks
“The introduction of this simplified, low-cost and risk-controlled
interoperable payment, clearing and settlement system will
facilitate trade and other economic activities among African
countries. In effect, it is intended to make payments under intra-
African trade possible, directly, in the local currencies of all
African countries. If a Nigerian company wants to buy goods from
a Ghanaian supplier, the Nigerian entity will pay for the goods in
Naira, while the Ghanaian supplier will get paid in the Ghanaian
Cedi. Afreximbank will do the clearing and settlement”
Dr. Benedict Oramah
President of Afreximbank
Source: Company information
17
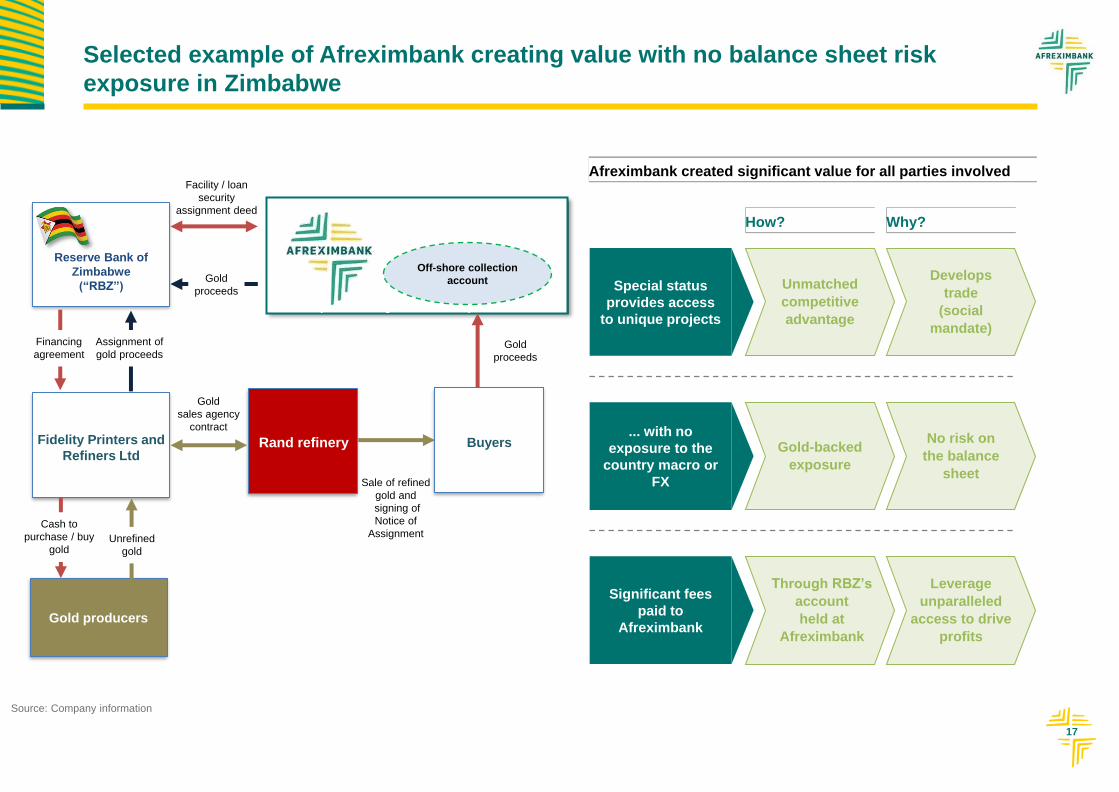
Selected example of Afreximbank creating value with no balance sheet risk
exposure in Zimbabwe
How? Why?
Special status
provides access
to unique projects
Unmatched
competitive
advantage
Develops
trade
(social
mandate)
... with no
exposure to the
country macro or
FX
Significant fees
paid to
Afreximbank
Gold-backed
exposure
No risk on
the balance
sheet
Through RBZ’s
account
held at
Afreximbank
Leverage
unparalleled
access to drive
profits
Afreximbank created significant value for all parties involved
Source: Company information
African Export – Import Bank
(“Security Trustee ”)
Reserve Bank of
Zimbabwe
(“RBZ”)
Fidelity Printers and
Refiners Ltd
Gold producers
Assignment of
gold proceeds
Financing
agreement
Facility / loan
security
assignment deed
Rand refinery
Gold
sales agency
contract
Cash to
purchase / buy
goldUnrefined
gold
Buyers
Off-shore collection
account
Sale of refined
gold and
signing of
Notice of
Assignment
Gold
proceeds
Gold
proceeds
18
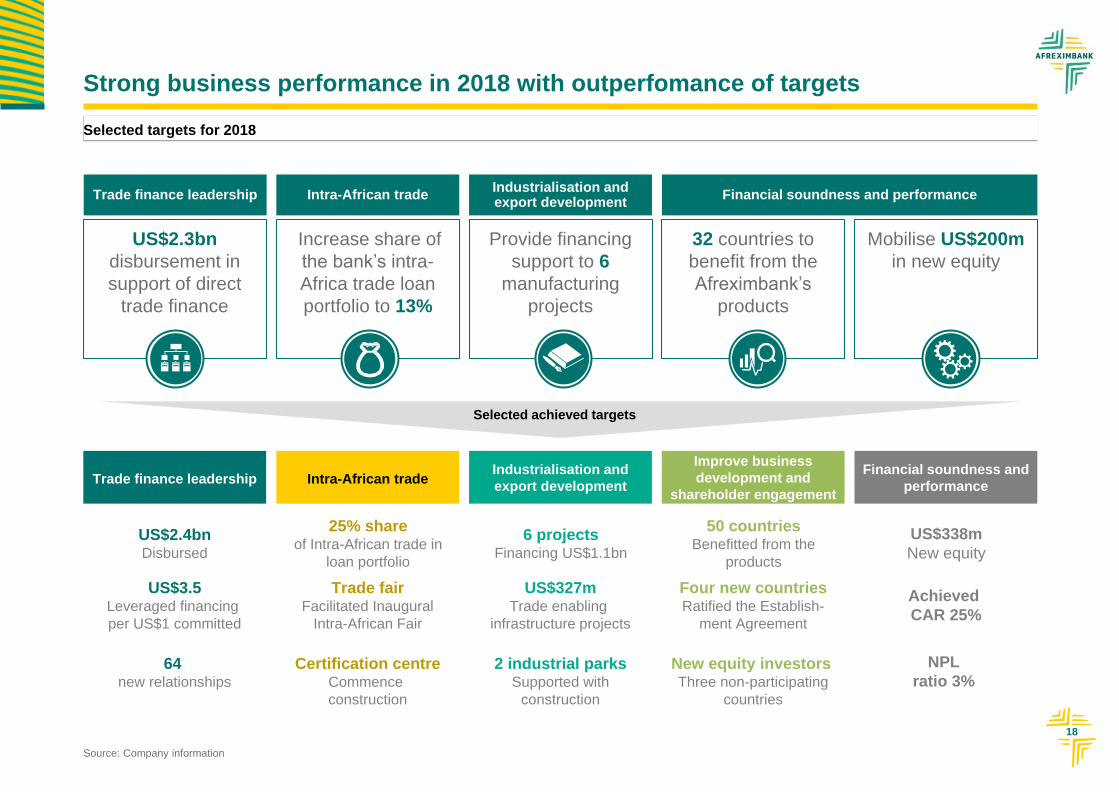
Strong business performance in 2018 with outperfomance of targets
US$2.3bn
disbursement in
support of direct
trade finance
Increase share of
the bank’s intra-
Africa trade loan
portfolio to 13%
32 countries to
benefit from the
Afreximbank’s
products
Provide financing
support to 6
manufacturing
projects
Mobilise US$200m
in new equity
Trade finance leadership Financial soundness and performanceIndustrialisation andexport development
Intra-African trade
Source: Company information
Trade finance leadership Intra-African tradeIndustrialisation and
export development
Improve business
development and
shareholder engagement
Financial soundness and
performance
Selected achieved targets
US$2.4bnDisbursed
25% shareof Intra-African trade in
loan portfolio
6 projectsFinancing US$1.1bn
50 countriesBenefitted from the
products
US$338m
New equity
US$3.5Leveraged financing
per US$1 committed
Trade fairFacilitated Inaugural
Intra-African Fair
US$327mTrade enabling
infrastructure projects
Four new countriesRatified the Establish-
ment Agreement
Achieved
CAR 25%
64 new relationships
Certification centreCommence
construction
2 industrial parksSupported with
construction
New equity investors Three non-participating
countries
NPL
ratio 3%
Selected targets for 2018
3Financial performance and medium term
expectation
20
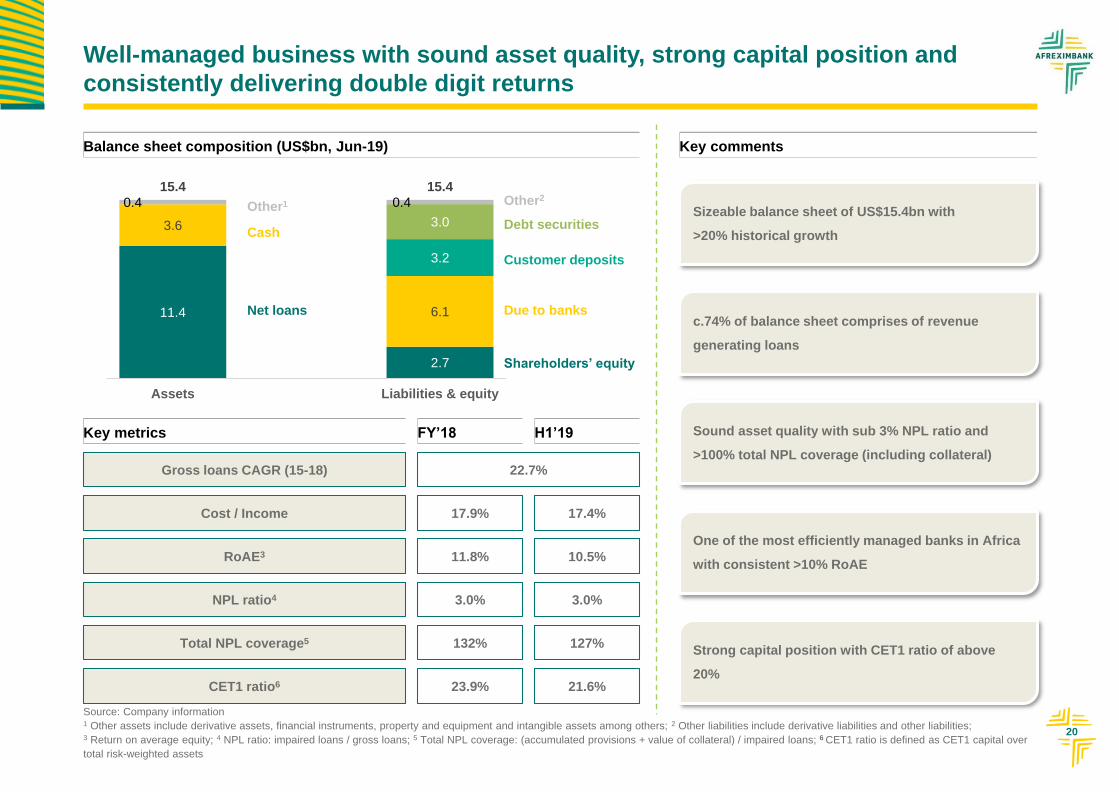
11.4
2.7
3.6
6.1
3.2
3.0
0.4 0.4
15.4 15.4
Assets Liabilities & equity
Well-managed business with sound asset quality, strong capital position and
consistently delivering double digit returns
Balance sheet composition (US$bn, Jun-19) Key comments
Sizeable balance sheet of US$15.4bn with
>20% historical growth
c.74% of balance sheet comprises of revenue
generating loans
Sound asset quality with sub 3% NPL ratio and
>100% total NPL coverage (including collateral)
One of the most efficiently managed banks in Africa
with consistent >10% RoAE
Strong capital position with CET1 ratio of above
20%
Net loans
Cash
Other1
Shareholders’ equity
Due to banks
Customer deposits
Debt securities
Key metrics
Gross loans CAGR (15-18)
NPL ratio4
Total NPL coverage5
CET1 ratio6
22.7%
3.0%
132%
23.9%
FY’18
Cost / Income
RoAE3
17.9%
11.8%
17.4%
10.5%
3.0%
127%
21.6%
H1’19
Other2
Source: Company information1 Other assets include derivative assets, financial instruments, property and equipment and intangible assets among others; 2 Other liabilities include derivative liabilities and other liabilities; 3 Return on average equity; 4 NPL ratio: impaired loans / gross loans; 5 Total NPL coverage: (accumulated provisions + value of collateral) / impaired loans; 6 CET1 ratio is defined as CET1 capital over
total risk-weighted assets
21
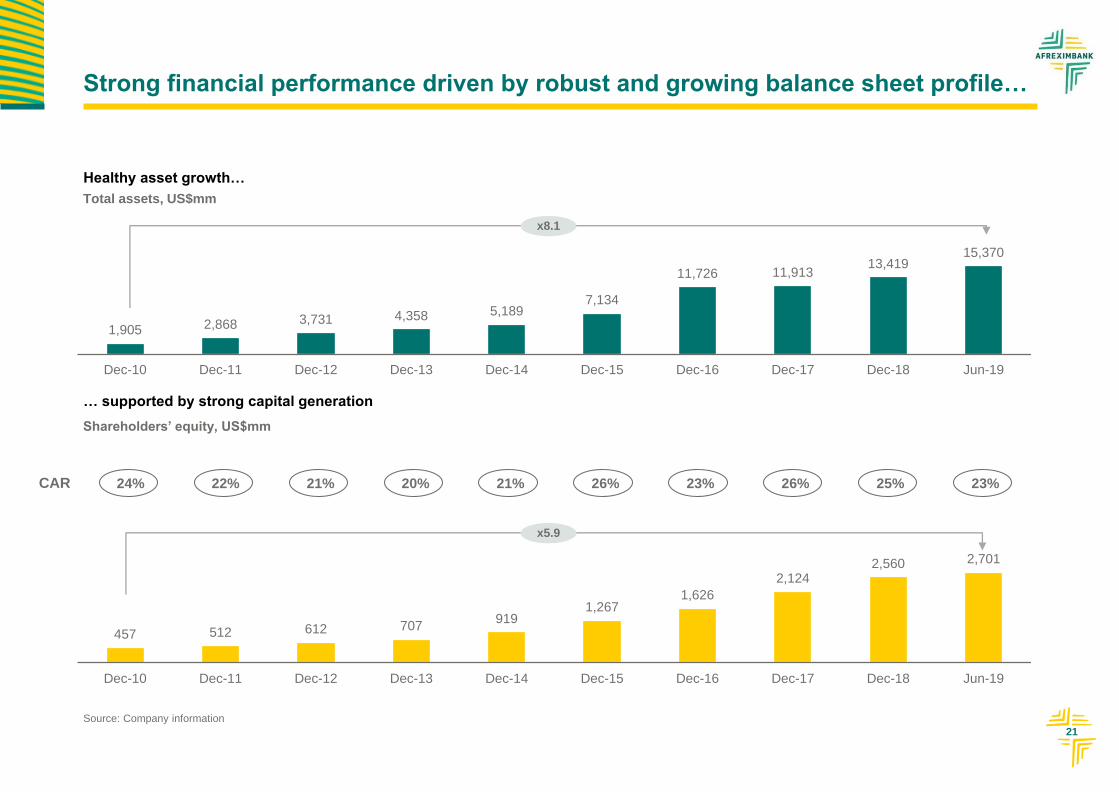
Strong financial performance driven by robust and growing balance sheet profile…
Healthy asset growth…
… supported by strong capital generation
1,905 2,868 3,731 4,358 5,1897,134
11,726 11,91313,419
15,370
Dec-10 Dec-11 Dec-12 Dec-13 Dec-14 Dec-15 Dec-16 Dec-17 Dec-18 Jun-19
x8.1
Total assets, US$mm
Shareholders’ equity, US$mm
457 512 612 707919
1,2671,626
2,1242,560 2,701
Dec-10 Dec-11 Dec-12 Dec-13 Dec-14 Dec-15 Dec-16 Dec-17 Dec-18 Jun-19
x5.9
CAR 24% 22% 21% 20% 21% 26% 23% 26% 25% 23%
Source: Company information
22
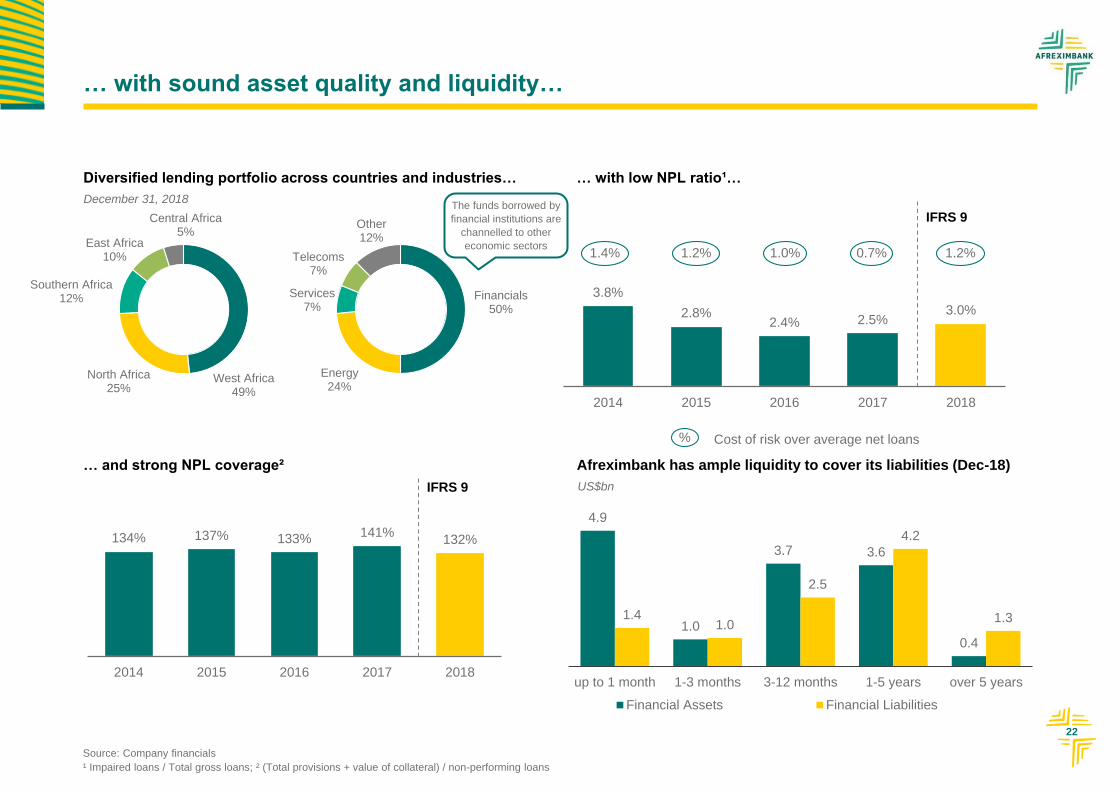
3.8%
2.8% 2.4% 2.5%
3.0%
2014 2015 2016 2017 2018
Financials50%
Energy24%
Services7%
Telecoms7%
Other12%
West Africa49%
North Africa25%
Southern Africa12%
East Africa10%
Central Africa5%
… with sound asset quality and liquidity…
… with low NPL ratio¹…Diversified lending portfolio across countries and industries…
… and strong NPL coverage² Afreximbank has ample liquidity to cover its liabilities (Dec-18)
4.9
1.0
3.7 3.6
0.4
1.41.0
2.5
4.2
1.3
up to 1 month 1-3 months 3-12 months 1-5 years over 5 years
Financial Assets (US$m) Financial Liabilities (US$m)
134% 137% 133% 141%
132%
2014 2015 2016 2017 2018
Source: Company financials
¹ Impaired loans / Total gross loans; ² (Total provisions + value of collateral) / non-performing loans
IFRS 9
IFRS 9 US$bn
The funds borrowed by
financial institutions are
channelled to other
economic sectors1.4% 1.2% 1.0% 0.7%
% Cost of risk over average net loans
1.2%
December 31, 2018
23
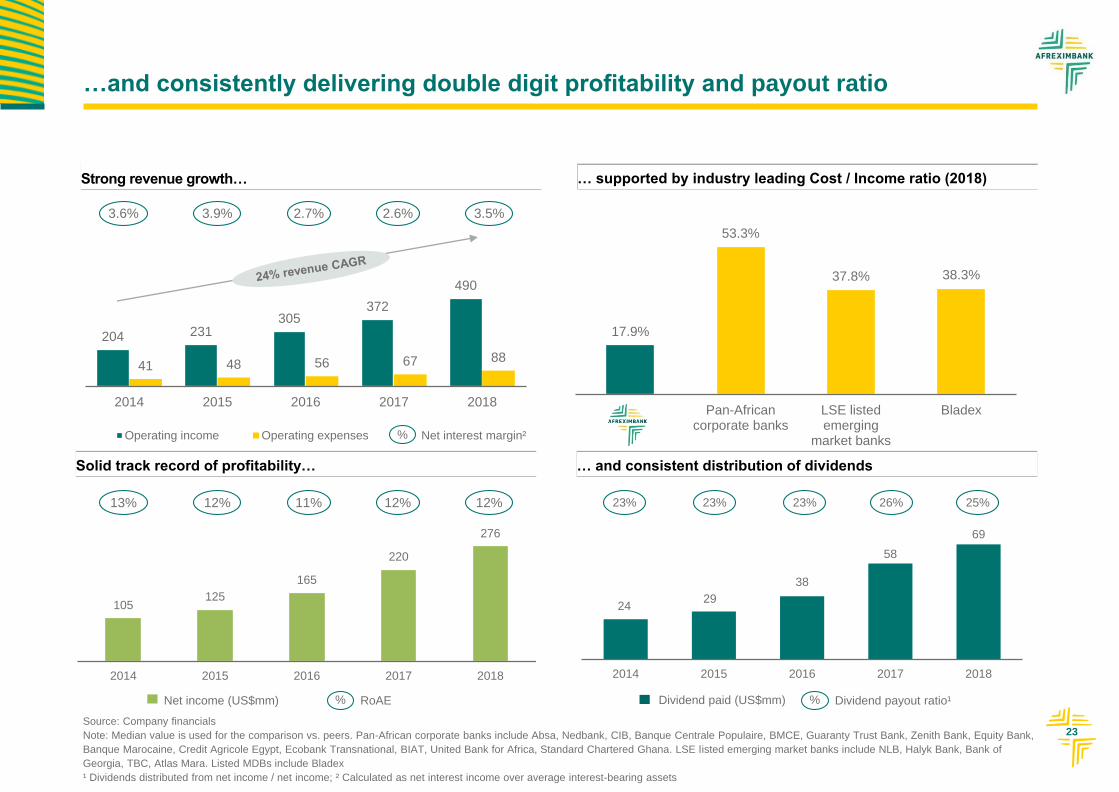
…and consistently delivering double digit profitability and payout ratio
17.9%
53.3%
37.8% 38.3%
Pan-Africancorporate banks
LSE listedemerging
market banks
Bladex
… supported by industry leading Cost / Income ratio (2018)
… and consistent distribution of dividends
24 29
38
58
69
2014 2015 2016 2017 2018
23% 25%23% 23% 26%
% Dividend payout ratio¹Dividend paid (US$mm)
Source: Company financials
Note: Median value is used for the comparison vs. peers. Pan-African corporate banks include Absa, Nedbank, CIB, Banque Centrale Populaire, BMCE, Guaranty Trust Bank, Zenith Bank, Equity Bank,
Banque Marocaine, Credit Agricole Egypt, Ecobank Transnational, BIAT, United Bank for Africa, Standard Chartered Ghana. LSE listed emerging market banks include NLB, Halyk Bank, Bank of
Georgia, TBC, Atlas Mara. Listed MDBs include Bladex
¹ Dividends distributed from net income / net income; ² Calculated as net interest income over average interest-bearing assets
204 231 305
372
490
41 48 56 67 88
2014 2015 2016 2017 2018
Operating income Operating expenses
Strong revenue growth…
Solid track record of profitability…
105125
165
220
276
2014 2015 2016 2017 2018
13% 12%12% 11% 12%
% RoAENet income (US$mm)
3.6% 3.5%3.9% 2.7% 2.6%
% Net interest margin²
24
105 125 165 220 276
2014 2015 2016 2017 2018
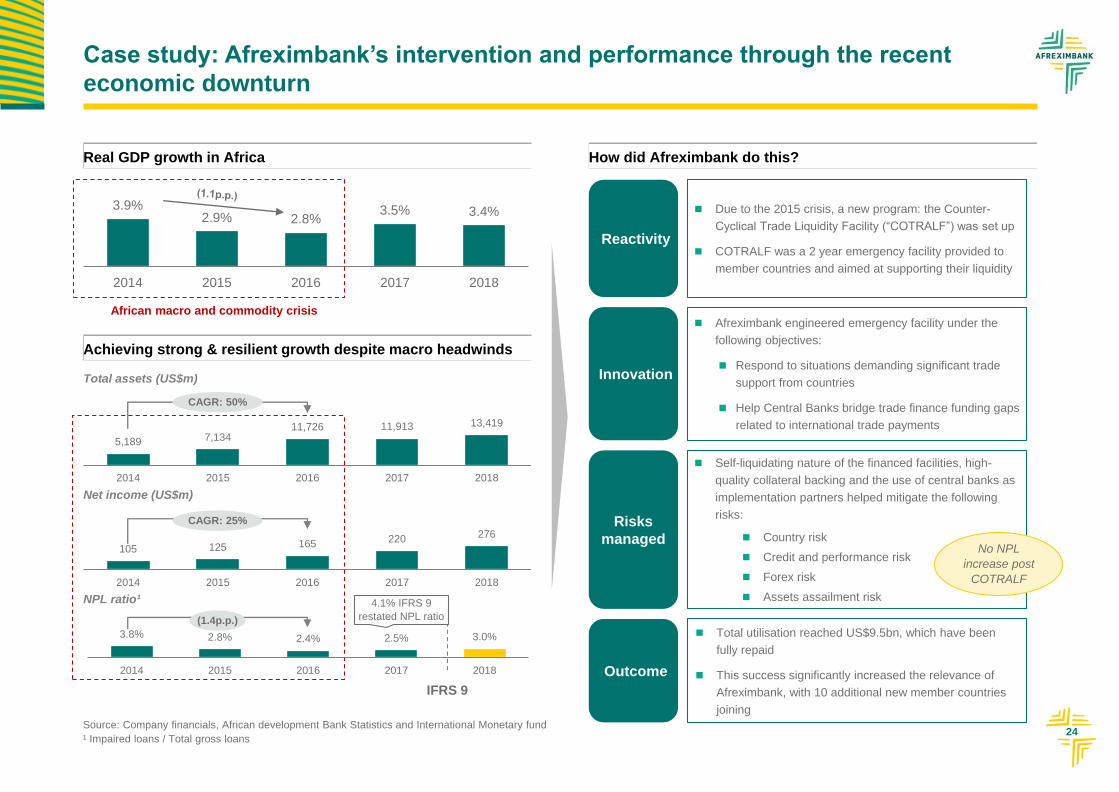
Case study: Afreximbank’s intervention and performance through the recent
economic downturn
5,189 7,13411,726 11,913 13,419
2014 2015 2016 2017 2018
Total assets (US$m)
IFRS 9
Source: Company financials, African development Bank Statistics and International Monetary fund
¹ Impaired loans / Total gross loans
Reactivity
How did Afreximbank do this?
Total utilisation reached US$9.5bn, which have been
fully repaid
This success significantly increased the relevance of
Afreximbank, with 10 additional new member countries
joining
African macro and commodity crisis
CAGR: 50%
Real GDP growth in Africa
Achieving strong & resilient growth despite macro headwinds
Net income (US$m)
NPL ratio¹
Innovation
Risks
managed
3.9%2.9% 2.8%
3.5% 3.4%
2014 2015 2016 2017 2018
CAGR: 25%
(1.4p.p.)
3.8% 2.8% 2.4% 2.5% 3.0%
2014 2015 2016 2017 2018
Due to the 2015 crisis, a new program: the Counter-
Cyclical Trade Liquidity Facility (“COTRALF”) was set up
COTRALF was a 2 year emergency facility provided to
member countries and aimed at supporting their liquidity
Afreximbank engineered emergency facility under the
following objectives:
Respond to situations demanding significant trade
support from countries
Help Central Banks bridge trade finance funding gaps
related to international trade payments
Outcome
Self-liquidating nature of the financed facilities, high-
quality collateral backing and the use of central banks as
implementation partners helped mitigate the following
risks:
Country risk
Credit and performance risk
Forex risk
Assets assailment risk
No NPL
increase post
COTRALF
4.1% IFRS 9
restated NPL ratio
25
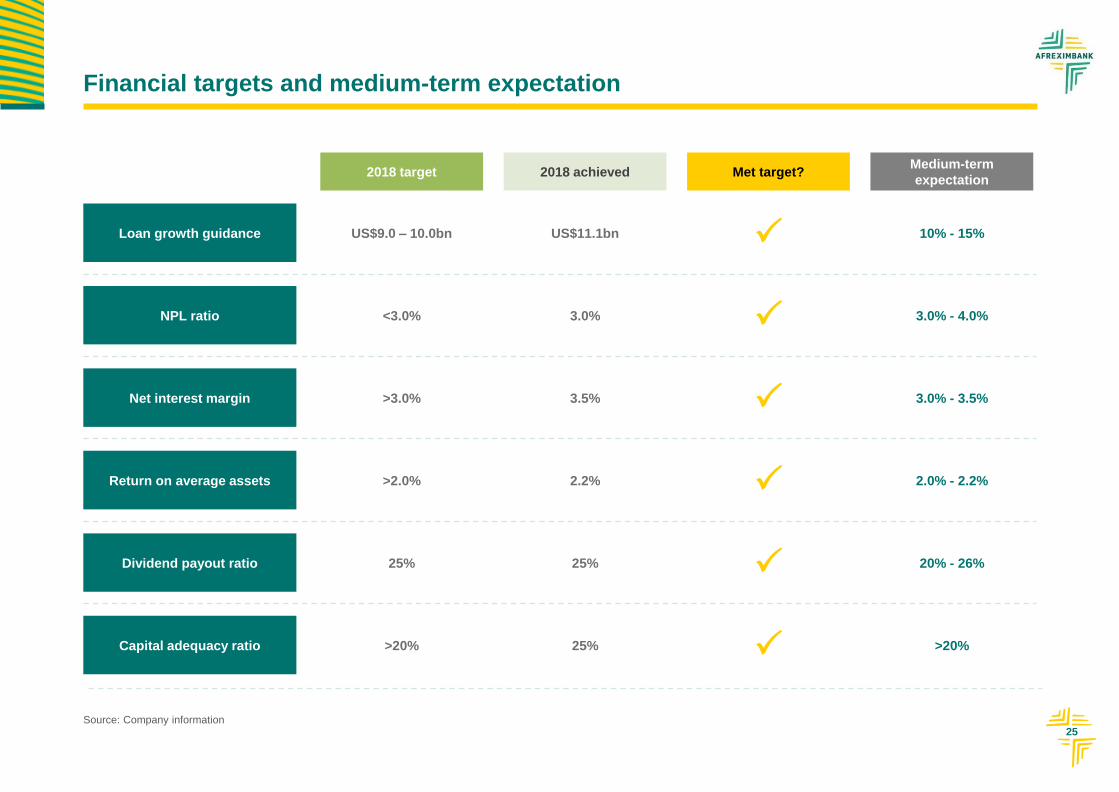
Financial targets and medium-term expectation
Source: Company information
2018 target 2018 achieved Met target?Medium-term
expectation
Net interest margin >3.0% 3.5% 3.0% - 3.5%
Return on average assets >2.0% 2.2% 2.0% - 2.2%
NPL ratio <3.0% 3.0% 3.0% - 4.0%
Loan growth guidance US$9.0 – 10.0bn US$11.1bn 10% - 15%
Capital adequacy ratio >20% 25% >20%
Dividend payout ratio 25% 25% 20% - 26%

4
Key takeaways
27
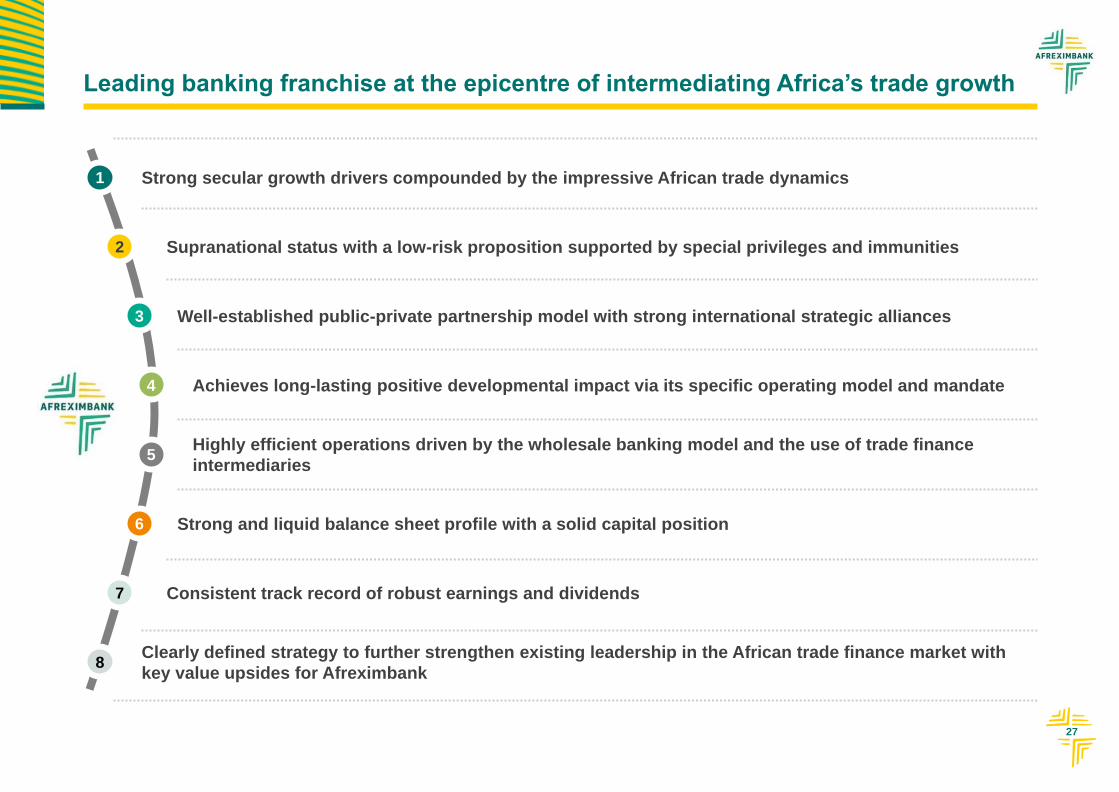
Leading banking franchise at the epicentre of intermediating Africa’s trade growth
Strong secular growth drivers compounded by the impressive African trade dynamics1
Supranational status with a low-risk proposition supported by special privileges and immunities2
Clearly defined strategy to further strengthen existing leadership in the African trade finance market with
key value upsides for Afreximbank8
Strong and liquid balance sheet profile with a solid capital position 6
Well-established public-private partnership model with strong international strategic alliances 3
Achieves long-lasting positive developmental impact via its specific operating model and mandate4
Consistent track record of robust earnings and dividends7
5Highly efficient operations driven by the wholesale banking model and the use of trade finance
intermediaries
5
Appendix
29
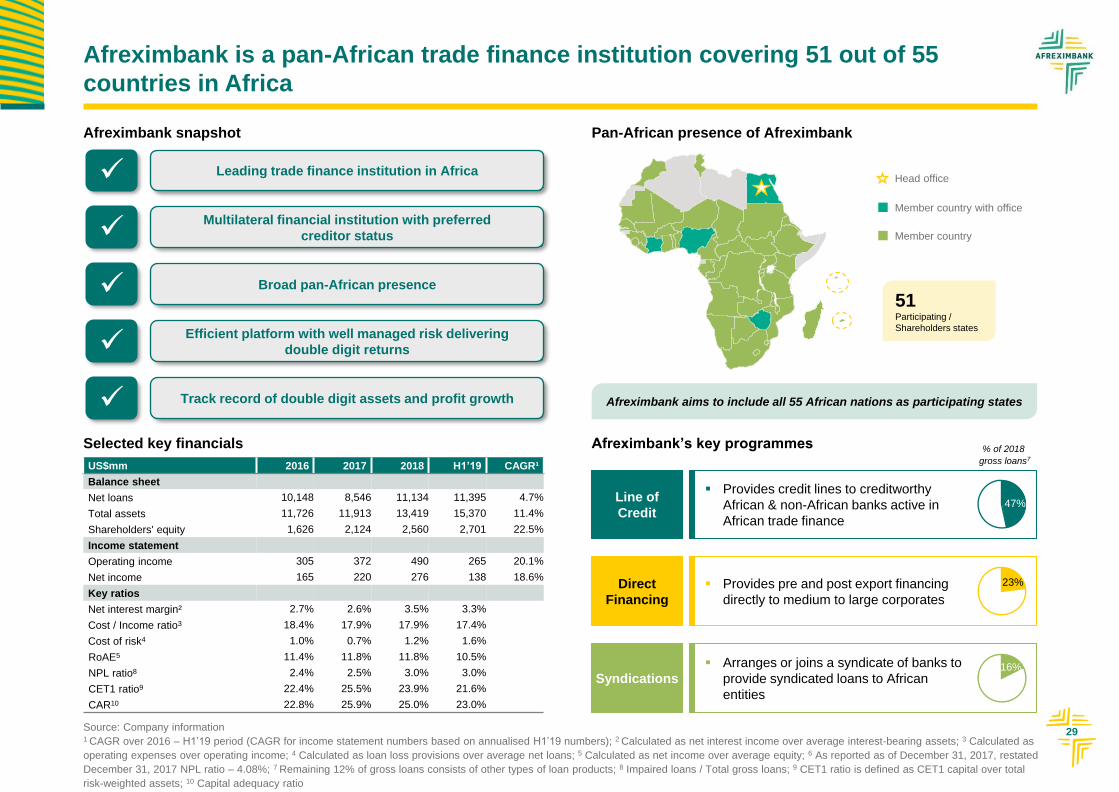
Afreximbank is a pan-African trade finance institution covering 51 out of 55
countries in Africa
Pan-African presence of Afreximbank
Afreximbank aims to include all 55 African nations as participating states
Member country with office
Member country
Head office
Selected key financials
Afreximbank snapshot
Leading trade finance institution in Africa
Broad pan-African presence
Multilateral financial institution with preferred
creditor status
Efficient platform with well managed risk delivering
double digit returns
Track record of double digit assets and profit growth
Afreximbank’s key programmes
51 Participating /
Shareholders states
Provides credit lines to creditworthy
African & non-African banks active in
African trade finance
Line of
Credit
Provides pre and post export financing
directly to medium to large corporates
Direct
Financing
Arranges or joins a syndicate of banks to
provide syndicated loans to African
entities
Syndications
% of 2018
gross loans7
47%
23%
16%
US$mm 2016 2017 2018 H1’19 CAGR¹
Balance sheet
Net loans 10,148 8,546 11,134 11,395 4.7%
Total assets 11,726 11,913 13,419 15,370 11.4%
Shareholders' equity 1,626 2,124 2,560 2,701 22.5%
Income statement
Operating income 305 372 490 265 20.1%
Net income 165 220 276 138 18.6%
Key ratios
Net interest margin² 2.7% 2.6% 3.5% 3.3%
Cost / Income ratio3 18.4% 17.9% 17.9% 17.4%
Cost of risk4 1.0% 0.7% 1.2% 1.6%
RoAE5 11.4% 11.8% 11.8% 10.5%
NPL ratio8 2.4% 2.5% 3.0% 3.0%
CET1 ratio9 22.4% 25.5% 23.9% 21.6%
CAR10 22.8% 25.9% 25.0% 23.0%
Source: Company information1 CAGR over 2016 – H1’19 period (CAGR for income statement numbers based on annualised H1’19 numbers); 2 Calculated as net interest income over average interest-bearing assets; 3 Calculated as
operating expenses over operating income; 4 Calculated as loan loss provisions over average net loans; 5 Calculated as net income over average equity; 6 As reported as of December 31, 2017, restated
December 31, 2017 NPL ratio – 4.08%; 7 Remaining 12% of gross loans consists of other types of loan products; 8 Impaired loans / Total gross loans; 9 CET1 ratio is defined as CET1 capital over total
risk-weighted assets; 10 Capital adequacy ratio
30
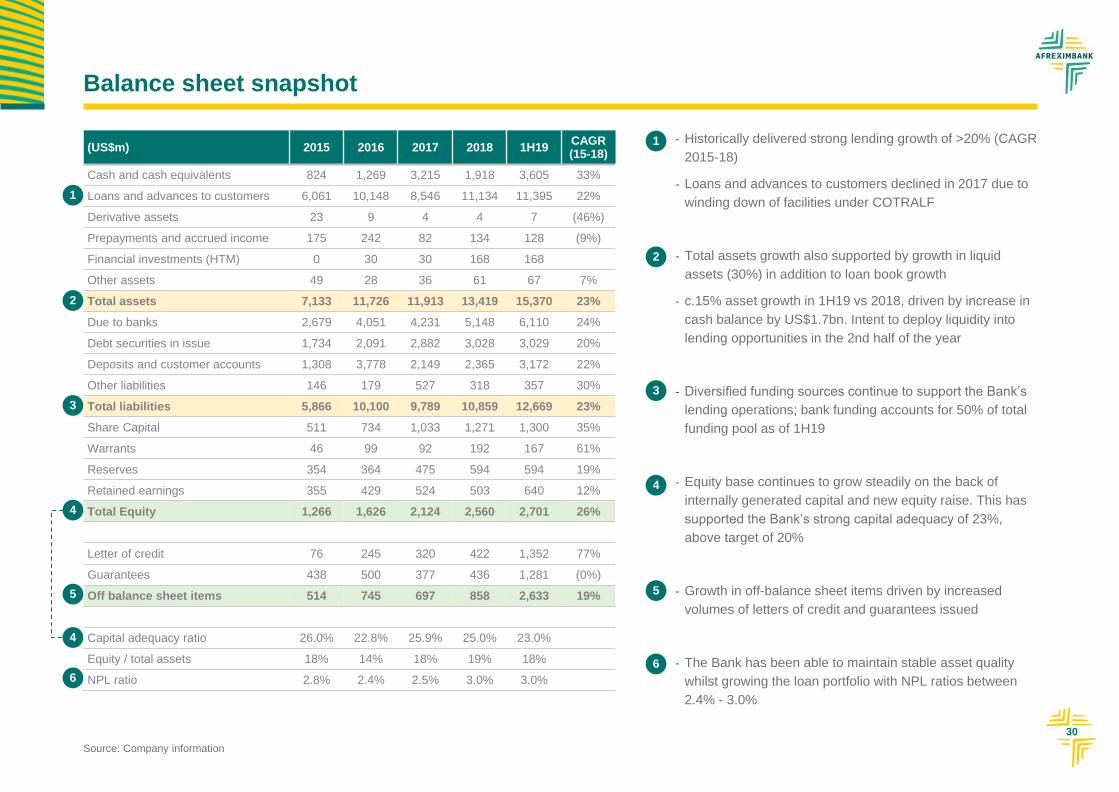
Balance sheet snapshot
(US$m) 2015 2016 2017 2018 1H19CAGR (15-18)
Cash and cash equivalents 824 1,269 3,215 1,918 3,605 33%
Loans and advances to customers 6,061 10,148 8,546 11,134 11,395 22%
Derivative assets 23 9 4 4 7 (46%)
Prepayments and accrued income 175 242 82 134 128 (9%)
Financial investments (HTM) 0 30 30 168 168
Other assets 49 28 36 61 67 7%
Total assets 7,133 11,726 11,913 13,419 15,370 23%
Due to banks 2,679 4,051 4,231 5,148 6,110 24%
Debt securities in issue 1,734 2,091 2,882 3,028 3,029 20%
Deposits and customer accounts 1,308 3,778 2,149 2,365 3,172 22%
Other liabilities 146 179 527 318 357 30%
Total liabilities 5,866 10,100 9,789 10,859 12,669 23%
Share Capital 511 734 1,033 1,271 1,300 35%
Warrants 46 99 92 192 167 61%
Reserves 354 364 475 594 594 19%
Retained earnings 355 429 524 503 640 12%
Total Equity 1,266 1,626 2,124 2,560 2,701 26%
Letter of credit 76 245 320 422 1,352 77%
Guarantees 438 500 377 436 1,281 (0%)
Off balance sheet items 514 745 697 858 2,633 19%
Capital adequacy ratio 26.0% 22.8% 25.9% 25.0% 23.0%
Equity / total assets 18% 14% 18% 19% 18%
NPL ratio 2.8% 2.4% 2.5% 3.0% 3.0%
1
3
4
2
- Historically delivered strong lending growth of >20% (CAGR
2015-18)
- Loans and advances to customers declined in 2017 due to
winding down of facilities under COTRALF
- Total assets growth also supported by growth in liquid
assets (30%) in addition to loan book growth
- c.15% asset growth in 1H19 vs 2018, driven by increase in
cash balance by US$1.7bn. Intent to deploy liquidity into
lending opportunities in the 2nd half of the year
- Diversified funding sources continue to support the Bank’s
lending operations; bank funding accounts for 50% of total
funding pool as of 1H19
- Equity base continues to grow steadily on the back of
internally generated capital and new equity raise. This has
supported the Bank’s strong capital adequacy of 23%,
above target of 20%
- Growth in off-balance sheet items driven by increased
volumes of letters of credit and guarantees issued
- The Bank has been able to maintain stable asset quality
whilst growing the loan portfolio with NPL ratios between
2.4% - 3.0%
Source: Company information
1
2
3
4
66
4
5 5
31
Off-balance sheet items
Source: Company information
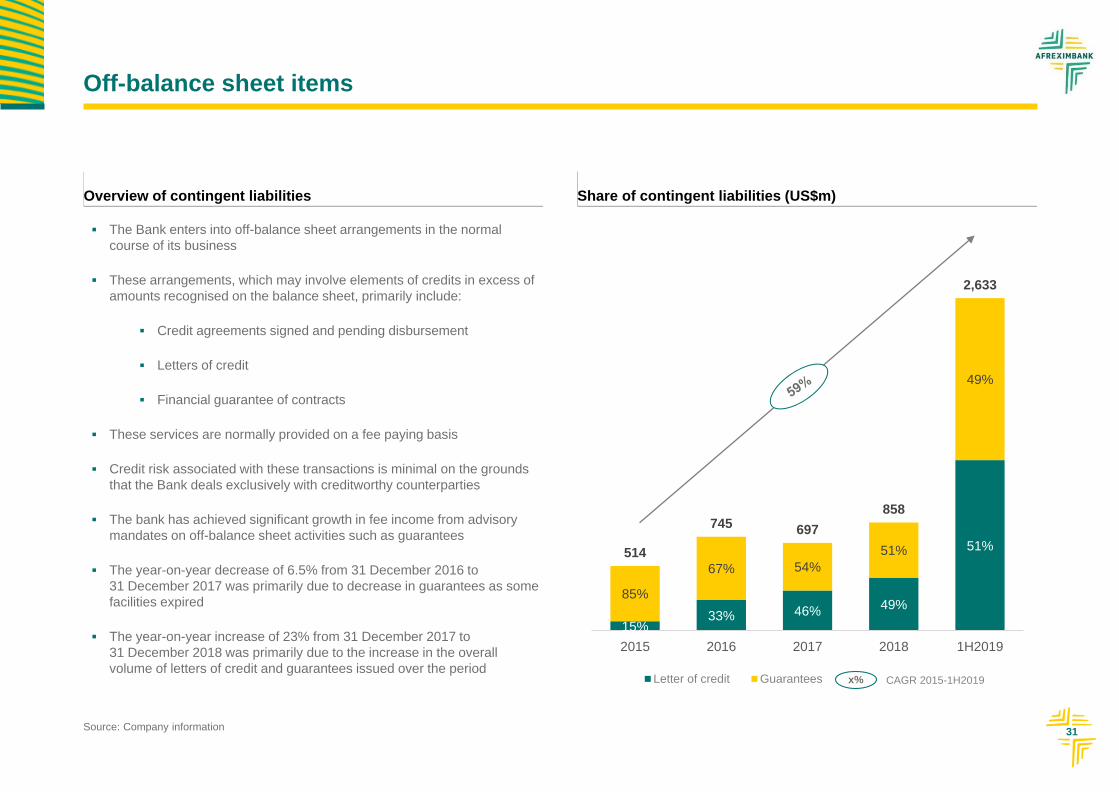
Overview of contingent liabilities
The Bank enters into off-balance sheet arrangements in the normal
course of its business
These arrangements, which may involve elements of credits in excess of
amounts recognised on the balance sheet, primarily include:
Credit agreements signed and pending disbursement
Letters of credit
Financial guarantee of contracts
These services are normally provided on a fee paying basis
Credit risk associated with these transactions is minimal on the grounds
that the Bank deals exclusively with creditworthy counterparties
The bank has achieved significant growth in fee income from advisory
mandates on off-balance sheet activities such as guarantees
The year-on-year decrease of 6.5% from 31 December 2016 to
31 December 2017 was primarily due to decrease in guarantees as some
facilities expired
The year-on-year increase of 23% from 31 December 2017 to
31 December 2018 was primarily due to the increase in the overall
volume of letters of credit and guarantees issued over the period
15%33% 46%
49%
51%
85%
67% 54%
51%
49%
514
745 697
858
2,633
2015 2016 2017 2018 1H2019
Letter of credit Guarantees
Share of contingent liabilities (US$m)
x% CAGR 2015-1H2019
32
Income statement snapshot
1
3
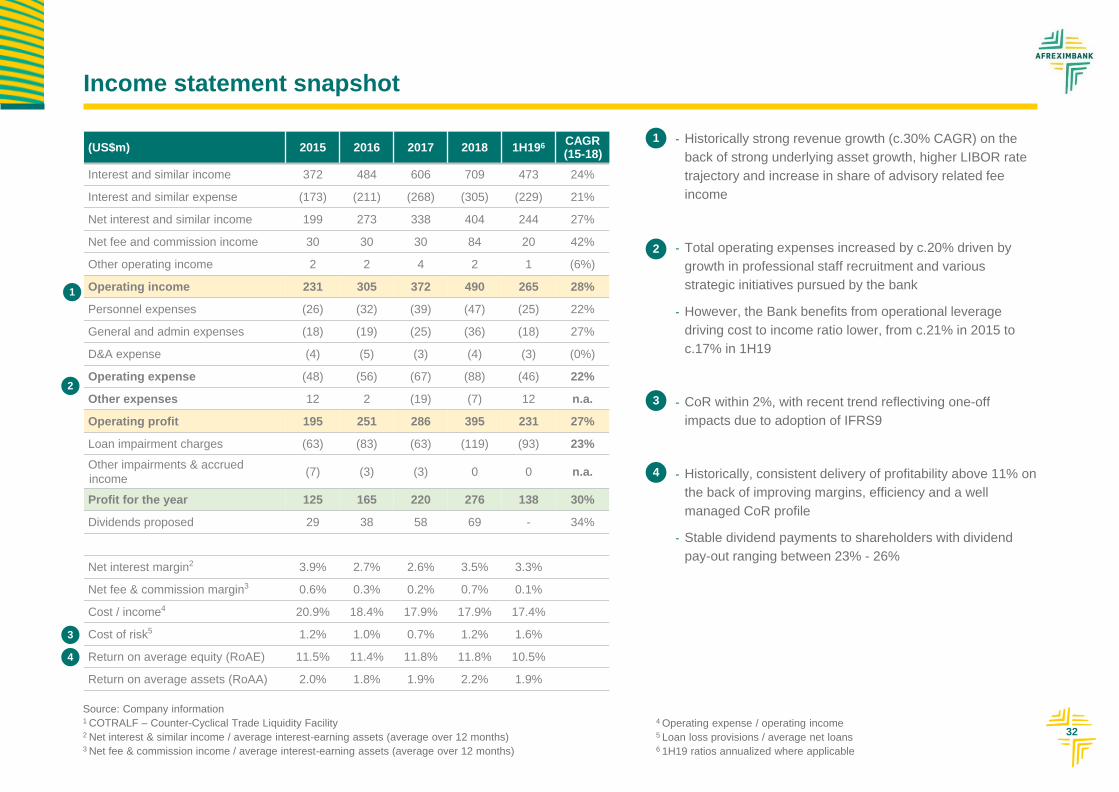
(US$m) 2015 2016 2017 2018 1H196 CAGR (15-18)
Interest and similar income 372 484 606 709 473 24%
Interest and similar expense (173) (211) (268) (305) (229) 21%
Net interest and similar income 199 273 338 404 244 27%
Net fee and commission income 30 30 30 84 20 42%
Other operating income 2 2 4 2 1 (6%)
Operating income 231 305 372 490 265 28%
Personnel expenses (26) (32) (39) (47) (25) 22%
General and admin expenses (18) (19) (25) (36) (18) 27%
D&A expense (4) (5) (3) (4) (3) (0%)
Operating expense (48) (56) (67) (88) (46) 22%
Other expenses 12 2 (19) (7) 12 n.a.
Operating profit 195 251 286 395 231 27%
Loan impairment charges (63) (83) (63) (119) (93) 23%
Other impairments & accrued
income(7) (3) (3) 0 0 n.a.
Profit for the year 125 165 220 276 138 30%
Dividends proposed 29 38 58 69 - 34%
Net interest margin2 3.9% 2.7% 2.6% 3.5% 3.3%
Net fee & commission margin3 0.6% 0.3% 0.2% 0.7% 0.1%
Cost / income4 20.9% 18.4% 17.9% 17.9% 17.4%
Cost of risk5 1.2% 1.0% 0.7% 1.2% 1.6%
Return on average equity (RoAE) 11.5% 11.4% 11.8% 11.8% 10.5%
Return on average assets (RoAA) 2.0% 1.8% 1.9% 2.2% 1.9%
2
Source: Company information1 COTRALF – Counter-Cyclical Trade Liquidity Facility2 Net interest & similar income / average interest-earning assets (average over 12 months)3 Net fee & commission income / average interest-earning assets (average over 12 months)
- Historically strong revenue growth (c.30% CAGR) on the
back of strong underlying asset growth, higher LIBOR rate
trajectory and increase in share of advisory related fee
income
- Total operating expenses increased by c.20% driven by
growth in professional staff recruitment and various
strategic initiatives pursued by the bank
- However, the Bank benefits from operational leverage
driving cost to income ratio lower, from c.21% in 2015 to
c.17% in 1H19
- CoR within 2%, with recent trend reflectiving one-off
impacts due to adoption of IFRS9
- Historically, consistent delivery of profitability above 11% on
the back of improving margins, efficiency and a well
managed CoR profile
- Stable dividend payments to shareholders with dividend
pay-out ranging between 23% - 26%
1
2
3
4
4
4 Operating expense / operating income5 Loan loss provisions / average net loans6 1H19 ratios annualized where applicable