Embed Size (px)
Citation preview
AFM Surface Force Measurements between Hydrophobized Gold Surfaces
Jialin Wang
Dissertation submitted to the faculty of Virginia Polytechnic Institute and State University in partial fulfillment of the requirements for the degree of
Doctor of Philosophy
in Materials Science and Engineering
Submitted to:
Dr. Roe-Hoan Yoon, Committee Chair Dr. David E Clark Dr. John Y Walz
Dr. Michael F Hochella Dr. Richard D Gandour
September 8, 2008 Blacksburg, Virginia Tech
Keywords: AFM, DLVO, surface force, hydrophobic force, gold, long-range attraction, thin film, temperature effect, water structure
Copyright 2008©, Jialin Wang
AFM Surface Force Measurements between Hydrophobized Gold Surfaces
Jialin Wang
Abstract
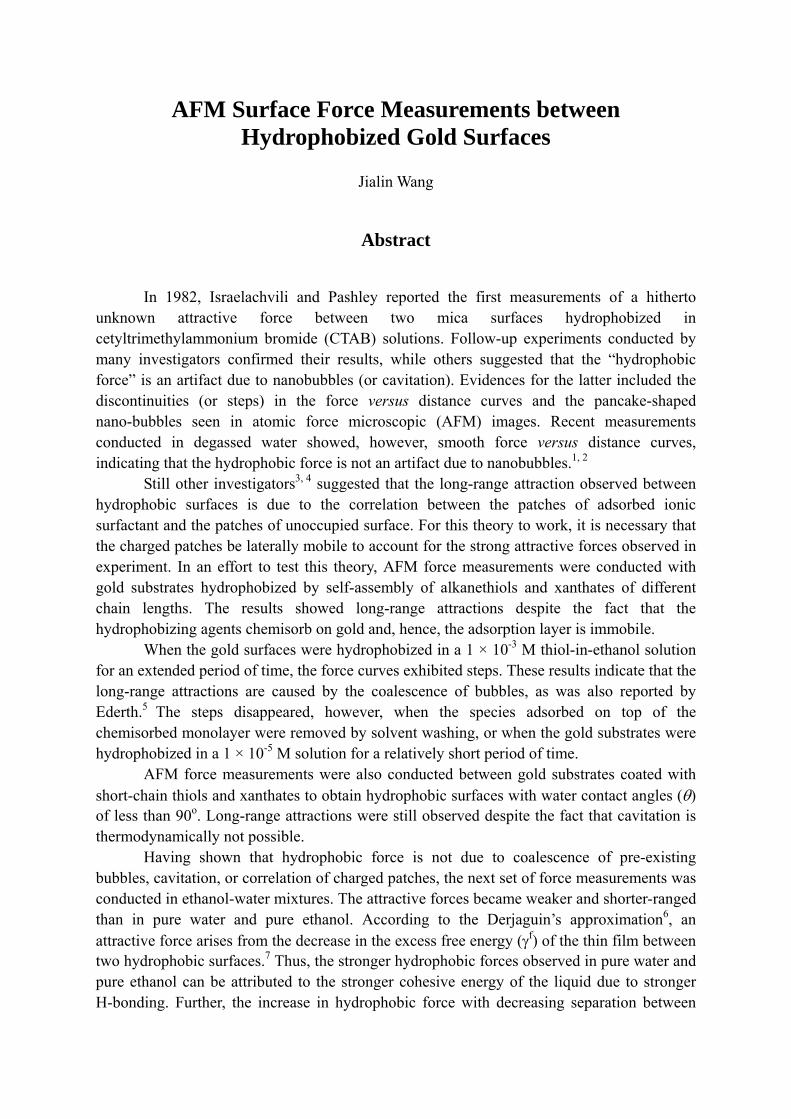
In 1982, Israelachvili and Pashley reported the first measurements of a hitherto unknown attractive force between two mica surfaces hydrophobized in cetyltrimethylammonium bromide (CTAB) solutions. Follow-up experiments conducted by many investigators confirmed their results, while others suggested that the “hydrophobic force” is an artifact due to nanobubbles (or cavitation). Evidences for the latter included the discontinuities (or steps) in the force versus distance curves and the pancake-shaped nano-bubbles seen in atomic force microscopic (AFM) images. Recent measurements conducted in degassed water showed, however, smooth force versus distance curves, indicating that the hydrophobic force is not an artifact due to nanobubbles.1, 2
Still other investigators3, 4 suggested that the long-range attraction observed between hydrophobic surfaces is due to the correlation between the patches of adsorbed ionic surfactant and the patches of unoccupied surface. For this theory to work, it is necessary that the charged patches be laterally mobile to account for the strong attractive forces observed in experiment. In an effort to test this theory, AFM force measurements were conducted with gold substrates hydrophobized by self-assembly of alkanethiols and xanthates of different chain lengths. The results showed long-range attractions despite the fact that the hydrophobizing agents chemisorb on gold and, hence, the adsorption layer is immobile.
When the gold surfaces were hydrophobized in a 1 × 10⁻³ M thiol-in-ethanol solution for an extended period of time, the force curves exhibited steps. These results indicate that the long-range attractions are caused by the coalescence of bubbles, as was also reported by Ederth.5 The steps disappeared, however, when the species adsorbed on top of the chemisorbed monolayer were removed by solvent washing, or when the gold substrates were hydrophobized in a 1 × 10⁻⁵ M solution for a relatively short period of time.
AFM force measurements were also conducted between gold substrates coated with short-chain thiols and xanthates to obtain hydrophobic surfaces with water contact angles (θ) of less than 90o. Long-range attractions were still observed despite the fact that cavitation is thermodynamically not possible.
Having shown that hydrophobic force is not due to coalescence of pre-existing bubbles, cavitation, or correlation of charged patches, the next set of force measurements was conducted in ethanol-water mixtures. The attractive forces became weaker and shorter-ranged than in pure water and pure ethanol. According to the Derjaguin’s approximation6, an attractive force arises from the decrease in the excess free energy (γf) of the thin film between two hydrophobic surfaces.7 Thus, the stronger hydrophobic forces observed in pure water and pure ethanol can be attributed to the stronger cohesive energy of the liquid due to stronger H-bonding. Further, the increase in hydrophobic force with decreasing separation between
two hydrophobic surfaces indicates that the H-bonded structure becomes stronger in the vicinity of hydrophobic surfaces.
The force measurements conducted at different temperatures in the range of 10-40ºC showed that the hydrophobic attraction between macroscopic surfaces causes a decrease in film entropy (Sf), which confirms that the hydrophobic force is due to the structuring of water in the thin film between two hydrophobic surfaces. The results showed also that the hydrophobic interaction entails a reduction in the excess film enthalpy (Hf), which may be associated with the formation of partial (or full) clathrates formed in the vicinity of hydrophobic surfaces. The presence of the clathrates is supported by the recent finding that the density of water in the vicinity of hydrophobic surfaces is lower than in the bulk.8
References 1. Meyer, E. E.; Lin, Q.; Israelachvili, J. N., Langmuir 2005, 21, 256-259. 2. Zhang, J.; Yoon, R.-H.; Mao, M.; Ducker, W. A., Langmuir 2005, 21, 5831-5841. 3. Miklavic, S. J.; Chan, D. Y. C.; White, L. R.; Healy, T. W., J. Phys. Chem. 1994, 98, 9022-9032. 4. Meyer, E. E.; Lin, Q.; Hassenkam, T.; Oroudjev, E.; Israelachvili, J. N., Proc. Nat. Acad. Sci. U.S.A 2005, 102, 6839-6842. 5. Ederth, T.; Claesson, P.; Liedberg, B., Langmuir 1998, 14, 4782-4789. 6. Derjaguin, B. V., Kolloid Zeits 1934, 69, 155-164. 7. Eriksson, J. C.; Ljunggren, S.; Claesson, P. M., J. Chem. Soc., Faraday Trans. 2 1989, 85, (3), 163-176. 8. Doshi, D. A.; Watkins, E. B.; Israelachvili, J. N.; Majewski, J., Proc. Nat. Acad. Sci. U.S.A 2005, 102, 9458-9462.
iii
Acknowledgements
After all those years, I have got quite a list of people. Without their help, it would not
have been possible for me to complete my Ph. D program at Virginia Tech. I would like to
take this opportunity to express my sincere gratitude to all of them.
Firstly, I owe my most sincere gratitude to my advisor Dr. Roe-Hoan Yoon, Director
of the Center for Advanced Separation Technologies (CAST), Virginia Tech, for his support,
guidance, and encouragement during my study program. He set up a good example for me. I
will always be thankful for his enthusiasm, wisdom and knowledge as well as the motivation
and challenge he gave me. My thanks also go to Dr. David Clark, Dr. John Walz, Dr. Michael
Hochella and Dr. Richard Gandour for serving on my committee. They are greatly
appreciated for their criticisms and suggestions for my work. Dr. Richard Gandour was
especially acknowledged for kindly training me in the chemical synthesis in his lab.
My research work at Virginia Tech has been strengthened through collaboration with
Dr. Jan Christer. Eriksson of the Department of Chemistry, Royal Institute of Technology,
Sweden. Special thank goes to him for his advices, inspirations and illuminating discussions
on hydrophobic force during his visits at Virginia Tech.
I would also like to thank Dr. Jinhong Zhang for teaching me to conduct surface force
measurement with Atomic Force Microscope (AFM). I thank Stephen McCartney for
assistance and helpful discussion in AFM force measurement. Sincere gratitude is expressed
to Dr. Jinming Zhang, Dr. Liguang Wang for their assistance, discussion and suggestion on
my work during the past few years. I would like to thank my fellow graduate students and the
iv
staffs at CAST center, particularly, Ruijia Wang, Monica Ma, Hyunsun Do, Chris Hull and
Kathy Flint for their support and friendship. Many thanks go to my officemate Charles
Schlosser for reading the manuscript and discussion. I would like to extend my gratitude to
several friends, especially, Li Yan, Zaijing Sun, Kai Zhang and Xiaojing Zhu, who made my
life in Blacksburg memorable.
I am very grateful to my caring parents, my old sister and my old brother for their
unconditional love and encouragement. Finally, I would like to express my deepest
appreciation to my dear wife Ru Li for her understanding, patient, selfless support and love. I
would be lost without her because she love and support me greatly in everything I do.
v
Table of Contents
Abstract.....................................................................................................................................ii
Acknowledgements .................................................................................................................iv
Table of Contents ....................................................................................................................vi
List of Figures..........................................................................................................................xi
List of Tables....................................................................................................................... xviii
Chapter 1 Introduction............................................................................................................1
1.1 General .............................................................................................................................1
1.2 Literature Review.............................................................................................................4
1.2.1 Direct Measurement of Hydrophobic Force .......................................................4
1.2.2 Factors Affecting Hydrophobic Force ................................................................6
1.3 Scientific Discussion ......................................................................................................12
1.4 Research Objectives .......................................................................................................15
1.5 References ......................................................................................................................16
Chapter 2 AFM Forces Measured between Gold Surfaces Coated with Self-Assembled
Monolayers of 1-Hexadecanethiol ........................................................................................21
2.1 Abstract...........................................................................................................................21
2.2 Introduction ....................................................................................................................22
2.3 Materials and Methods ...................................................................................................25
2.3.1 Materials ...........................................................................................................25
2.3.2 Cleaning Gold Substrates .................................................................................26
vi
2.3.3 Hydrophobizing Gold Substrates ......................................................................27
2.3.4 Contact Angle Measurement .............................................................................28
2.3.5 Surface Force Measurement and AFM Imaging...............................................28
2.3.6 ζ-Potential Measurement ..................................................................................29
2.4 Results and Discussion...................................................................................................31
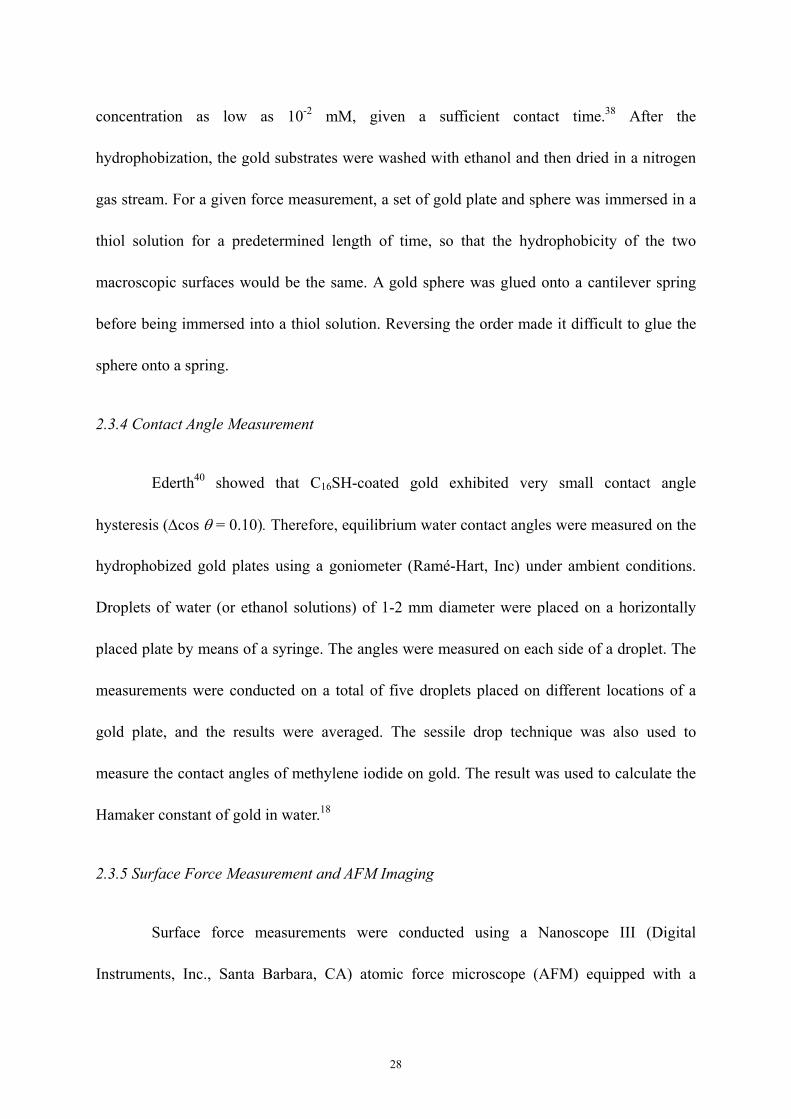
2.4.1 Surface Morphology..........................................................................................31
2.4.2 van der Waals Attraction...................................................................................32
2.4.3 Hydrophobic Force ...........................................................................................37
2.4.4 Bubble Coalescence ..........................................................................................38
2.5 Conclusions ....................................................................................................................47
2.6 Acknowledgement ..........................................................................................................48
2.7 References ......................................................................................................................48
Chapter 3 Surface Force Measurements between Gold Surfaces Hydrophobized with
Alkanethiols of Different Chain lengths ..............................................................................54
3.1 Abstract...........................................................................................................................54
3.2 Introduction ....................................................................................................................55
3.3 Materials and Methods ...................................................................................................59
3.3.1 Materials ...........................................................................................................59
3.3.2 Hydrophobizing Gold Surfaces .........................................................................60
3.3.3 Contact Angle Measurement .............................................................................61
3.3.4 AFM Surface Force Measurement ....................................................................62
3.4 Results ............................................................................................................................63
vii
3.4.1 Contact Angle Measurement .............................................................................63
3.4.2 Force Measurements in Water ..........................................................................64
3.4.3 Force Measurements in NaCl Aqueous Solutions.............................................70
3.4.4 Force Measurements in the Presence of C TACl Surfactant12 ...........................73
3.5 Discussion ......................................................................................................................74
3.5.1 The Existence of the Long-Range Hydrophobic Force .....................................74
3.5.2 Effect of Surface Adsorption on the Hydrophobic Force ..................................78
3.5.3 Electrostatic Origin?.........................................................................................83
3.6 Conclusions ....................................................................................................................86
3.7 Acknowledgement ..........................................................................................................87
3.8 References ......................................................................................................................87
Chapter 4 Surface Force between Gold Surfaces in Xanthate Solutions and Its
Implication in Flotation .........................................................................................................93
4.1 Abstract...........................................................................................................................93
4.2 Introduction ....................................................................................................................94
4.3 Materials and Methods ...................................................................................................97
4.3.1 Materials ...........................................................................................................97
4.3.2 Electrochemical Measurement ..........................................................................98
4.3.3 Contact Angle Measurement .............................................................................99
4.3.4 Surface Force Measurement ...........................................................................100
4.4 Results and Discussion.................................................................................................101
4.4.1 Electrochemical Characterization ..................................................................101
viii
4.4.2 Contact Angle Study ........................................................................................105
4.4.3 Surface Force Measurement ...........................................................................108
4.5 Conclusions ..................................................................................................................120
4.6 Acknowledgment..........................................................................................................121
4.7 References ....................................................................................................................121
Chapter 5 Surface Forces between Hydrophobized Gold Surfaces Submerged in
Alcohols and in Water-Ethanol Mixtures ..........................................................................125
5.1 Abstract.........................................................................................................................125
5.2 Background ..................................................................................................................126
5.3 Methods and Materials .................................................................................................129
5.3.1 Surface Force Measurements by Means of AFM ............................................129
5.3.2 Reagents ..........................................................................................................129
5.3.3 Gold Plates......................................................................................................130
5.3.4 Gold Probes ....................................................................................................130
5.3.5 Preparation of Hydrophobic Surfaces ............................................................130
5.4 Results and Discussion.................................................................................................133
5.5 Model Considerations...................................................................................................141
5.6 Conclusions ..................................................................................................................142
5.7 Acknowledgment..........................................................................................................143
5.8 References ....................................................................................................................143
Chapter 6 Hydrophobic Attraction Originates from Changes in Water Structure:
Thermodynamic Evidence...................................................................................................146
ix
6.1 Abstract.........................................................................................................................146
6.2 Introduction ..................................................................................................................147
6.3 Materials and Methods .................................................................................................149
6.3.1 Chemicals........................................................................................................149
6.3.2 Gold Surfaces Preparation .............................................................................149
6.3.3 Colloidal Probe Preparation ..........................................................................150
6.3.4 Hydrophobization of Gold ..............................................................................150
6.3.5 AFM Force Measurement ...............................................................................152
6.4 Results and Discussion.................................................................................................156
6.4.1 Effect of Temperature ......................................................................................156
6.4.2 Effect of Solutes...............................................................................................165
6.5 Summary and Conclusions...........................................................................................167
6.6 Acknowledgement ........................................................................................................168
6.7 References ....................................................................................................................168
Chapter 7 Conclusions and Recommendations.................................................................172
7.1 Conclusions ..................................................................................................................172
7.2 Recommendations for Future Work .............................................................................176
x
List of Figures
Figure 1.1 Surface interaction (F) versus distance (H) diagram for particle-particle
interaction………………………………………...…………………….……....2
Figure 1.2 Surface interaction (F) versus distance (H) diagram for bubble-particle
interaction…………………………………………...……………….….……...3
Figure 2.1 An AFM image (and its cross section) of the evaporated gold film on Cr-coated
glass after treatment with piranha solution………….….……………….……30
Figure 2.2 Surface forces measured between a microscopic gold sphere and a gold-coated
glass plate in water, 1mM and 100 mM NaCl solutions…………………..….31
Figure 2.3 Changes in equilibrium water contact angle (θ) on gold plate as a function of
immersion time in 0.01 and 1 mM 1-hexadecanethiol-in-ethanol solutions….35
Figure 2.4 (a) A normalized AFM force curve obtained in water between gold surfaces
hydrophobized in a 1 × 10⁻² mM C16SH-in-ethanol solution for 10 minutes. (b)
The same data plotted on a log-log scale to show the goodness of the fit…....36
Figure 2.5 (a) Normalized forces measured in pure water and ethanol/water mixtures
between gold surfaces contacted with a 1 mM C16SH-in-ethanol solution for at
least 15 hours; (b) The contact angles of gold in the ethanol-water mixtures
were 44 and 39º in 65 and 76% ethanol, respectively………………...………39
Figure 2.6 Effects of the contact time between gold substrates and a 0.01 mM
C16SH-in-ethanol solution on the AFM forces measured in pure water…...…41
Figure 2.7 A model for the adsorption of C16SH on gold. The surface coverage and
xi
orientation are shown to change with the contact time in a 10-2 mM
thiol-in-ethanol solution……………………………………….......………….43
Figure 2.8 An AFM force curve obtained between gold surfaces immersed in a 1 mM
C16SH-in-ethanol solution for 12 hours and then washed with organic solvents
before the measurements…………….…………………………………...…...46
Figure 3.1 Schematic illustration of the method for making gold microspheres…………60
Figure 3.2 Changes in the equilibrium water contact angles (θ) on gold plates as functions
of immersion time in 1 × 10⁻² mM C4SH-, C12SH-, and C16SH-in-ethanol
solutions............................................................................................................63
Figure 3.3 Effects of the immersion times of gold substrates in a 1 × 10⁻² mM
C12SH-in-ethanol solution on the AFM forces measured in pure water…...…65
Figure 3.4 Surface forces (F/R) versus separation distances (H) between hydrophobized
gold surfaces prepared using alkanethiols with different chain lengths.……..66
Figure 3.5 Normalized forces (F/R) between gold surfaces which were hydrophobized in a
1 × 10⁻² mM C4SH-in-ethanol solution for 6 hours. The step-like force curves
were obtained under the condition that C4SH-coated gold plate was exposed in
air for elongated time prior to the commencement of force measurement…...69
Figure 3.6 Effect of NaCl on the forces measured between gold surfaces hydrophobized in
a 1 × 10⁻² mM C16SH-in-ethanol solution for 10 minutes……………………70
Figure 3.7 Effect of NaCl on the forces measured between gold surfaces hydrophobized in
a 1 × 10⁻² mM C12SH-in-ethanol solution for 2 hours………………………..71
Figure 3.8 The AFM force curves obtained on C12SH-coated gold surfaces immersed in
xii
NaCl, C12TACl solution, and in NaCl/C12TACl mixtures…………….………73
Figure 3.9 Decay length (D) and value C versus contact angle plots for the data obtained
on C2SH-, C4SH-, C12SH- and C16SH-coated gold……………………...……78
Figure 3.10 Schematic illustration for the effect of adding C12TACl in bulk solution…….79
Figure 3.11 Decay length (D) versus the Debye length (κ-1) plots for the data obtained on
C12SH- and C16SH-coated gold in NaCl aqueous solutions with different
concentrations…………………………………………………………………83
Figure 4.1 Molecular structure of (a) potassium amyl xantahte (PAX) (b) and potassium
ethyl xanthate (KEX)………………...……………………………………….96
Figure 4.2 A schematic picture of the liquid cell for captive air bubble contact angle
measurement………………………………………………………….……….99
Figure 4.3 Cyclic voltammograms of gold recorded in 1 × 10⁻¹ M NaClO4 aqueous
solutions with and without 1 × 10⁻⁴ M potassium amyl xanthate (PAX) using a
scan rate of 250 mV/s……………………………..…………………………101
Figure 4.4 Schematic illustration for the arrangement and coordination of amyl xanthate
ion on gold…………………………………………...………………………103
Figure 4.5 Cyclic voltammograms of a gold electrode recorded in 1 × 10⁻² M
K3Fe(CN)6/K4Fe(CN)6, 1 × 10⁻¹ M NaClO4 and 1 × 10⁻⁵ M KAX aqueous
solutions at different adsorption times, with scan rate of 200 mV/s versus an
SHE reference electrode……………………………………………………..104
Figure 4.6 Contact angles of amyl xanthate layers on gold surface formed in different
xanthate aqueous solutions with varying immersion time…..………………106
xiii
Figure 4.7 Surface forces measured between bare gold in 1 × 10⁻⁶ M PAX aqueous
solution at different immersion times………………………………………..109
Figure 4.8 Surface forces measured between bare gold in a 5 × 10⁻⁶ M PAX aqueous
solution at different immersion times………………………………………..111
Figure 4.9 Surface forces measured between bare gold in a 1 × 10⁻⁵ M PAX aqueous
solution at different immersion times………………………………………..112
Figure 4.10 The surface forces measured between bare gold surfaces in PAX solutions as a
function of concentration of PAX……………………………………………115
Figure 4.11 Surface forces measured between KEX adsorbed gold surfaces in 1 × 10⁻⁵ M
KEX aqueous solution and in water…………………………………………117
Figure 4.12 Surface force measured between PAX hydrophobic layers in different
concentrations of NaCl aqueous solution………………………………...….119
Figure 5.1 The Gibbs surface excess of ethanol, Γ2(1), in the water (1)-ethanol (2)
mixture/air interface plotted versus the mole fraction of ethanol, x2. Note the
pronounced maximum for x2 ≈ 0.17. For comparison, the superficial density of
ethanol, Γ2, as obtained on the basis of Equations 5.1 and 5.2 are also shown.
Temperature is 25ºC……………………………………………...………….127
Figure 5.2 Surface force curves obtained for pure water, methanol, ethanol and 1-butanol
at room temperature (22±1ºC) using C4SH-coated gold surfaces, which were
prepared by immersing gold surfaces in a 1 × 10⁻² mM C4SH-in-ethanol
(absolute) solution for 5 hours………………………………………………132
Figure 5.3 Surface force curves obtained at room temperature (22±1ºC) for water-ethanol
xiv
mixtures using C4SH-coated gold surfaces……………………………….…133
Figure 5.4 Surface force curves obtained at room temperature (22±1ºC) for water-ethanol
mixtures using C12SH-coated gold surfaces…………………………………135
Figure 5.5 Surface force curves obtained at room temperature (22±1ºC) for water-ethanol
mixtures using C16SH-coated gold surfaces…………………………………135
Figure 5.6 The parameters C and D in Equation 5.3 plotted versus the mole fraction of
ethanol (x2) for the case of C4SH-coated gold surfaces……………………..137
Figure 5.7 The parameters C and D in Equation 5.3 plotted versus the mole fraction of
ethanol (x2) for the case of C12SH-coated gold surfaces…………………….137
Figure 5.8 The parameters C and D in Equation 5.3 plotted versus the mole fraction of
ethanol (x2) for the case of C16SH-coated gold surfaces………………...…..138
Figure 5.9 The Δγf versus x2 functions derived for the film thickness H = 10, 20, 30 and
40 nm by using the surface force data obtained for C4SH-coated gold surfaces
(Figure 5.3)…………………………………………………………………..138
Figure 5.10 The film excess of ethanol, ΔΓ2f,ex, derived from the Δγf-functions in Figure 5.9
by applying Equation 5.4…………………………………………………....140
Figure 5.11 The film excess of ethanol, ΔΓ2f,ex for H = 20 nm obtained for C4SH-, C12SH-
and C16SH-coated gold surfaces……………………………………………..140
Figure 6.1 The long-range attractive forces between C2SH-hydrophobized gold sphere and
gold-coated glass plates as measured in air-equilibrated water at different
temperatures…………………………………………………………...…….154
Figure 6.2 The long-range attractive forces between C4SH-hydrophobized gold sphere and
xv
gold-coated glass plates as measured in air-equilibrated water at different
temperatures………..………………………………………………………..154
Figure 6.3 The long-range attractive forces between C12SH-hydrophobized gold sphere
and gold-coated glass plates as measured in air-equilibrated water at different
temperatures……………………………………………..….……………….155
Figure 6.4 The long-range attractive forces between C16SH-hydrophobized gold sphere
and gold-coated glass plates as measured in air-equilibrated water at different
temperatures………………………………………..………………………..155
Figure 6.5 Same data as shown in Figure 6.4 for C16SH-coated gold was plotted on a
log-linear scale………………………………………………………………157
Figure 6.6 lnC and lnD obtained for C16SH-coated gold as functions of absolute
temperature. The temperature derivatives of lnC and lnD are -0.0129, and
-0.0101, respectively………………..……………………………………….157
Figure 6.7
The changes in excess film entropy (∆Sf) per m2 in the thin films of water
between two C16SH-coated gold surfaces as the film thickness (H) decreases,
or as the temperature increases………………………..…………….……….159
Figure 6.8 Changes in excess film entropy (∆Sf) per m2 in the thin films of water between
two gold surfaces hydrophobized by alkanethiols with different chain lengths
at 20ºC……………………………….………………………………………159
Figure 6.9 A plot of ∆H versus T at surface separation distance of 10, 20, 30 and 40 nm
for C16SH-coated gold surfaces………………………...……………………161
Figure 6.10 Changes in the excess thermodynamic functions for the hydrophobic
xvi
interaction between C16SH-coated gold macroscopic surfaces in
air-equilibrated water at 20ºC………………………………………………..163
Figure 6.11 The excess quantities of ethanol (∆Γsf) per m2 in the thin films of water-ethanol
mixtures between two C16SH-hydrophobized surfaces plotted versus ethanol
mole fraction………………………………………………………………...166
xvii
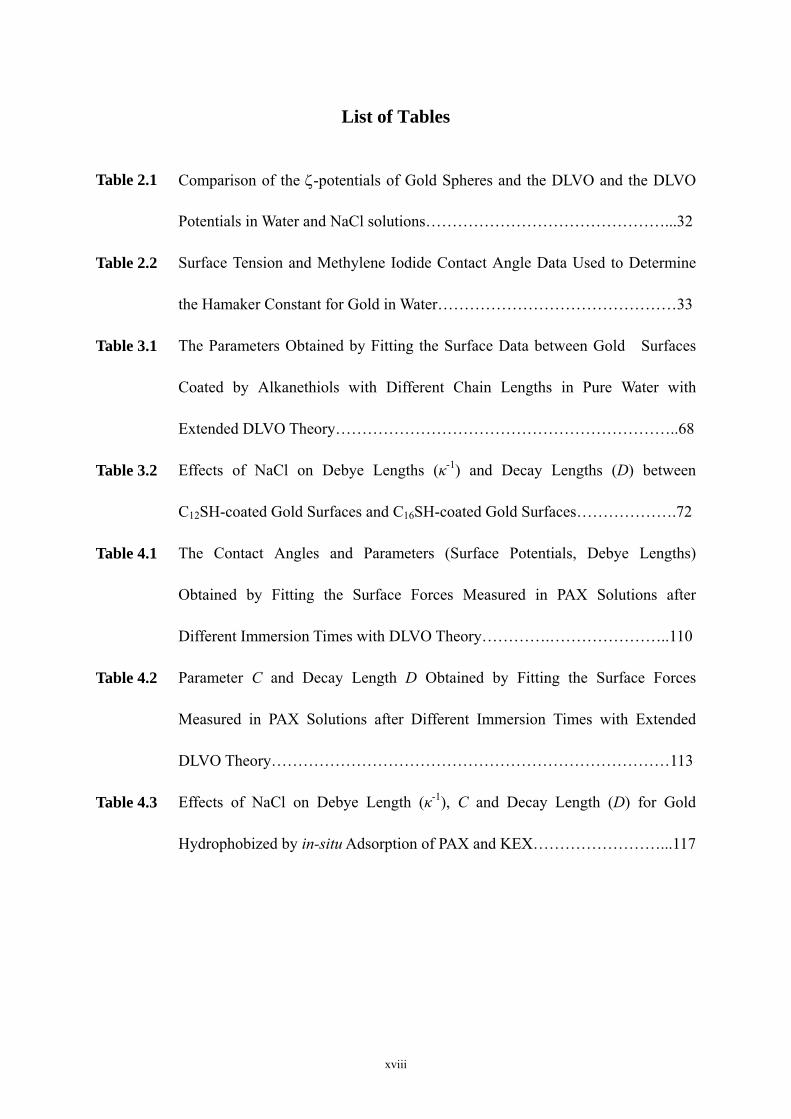
List of Tables
Table 2.1 Comparison of the ζ-potentials of Gold Spheres and the DLVO and the DLVO
Potentials in Water and NaCl solutions………………………………………...32
Table 2.2 Surface Tension and Methylene Iodide Contact Angle Data Used to Determine
the Hamaker Constant for Gold in Water………………………………………33
Table 3.1 The Parameters Obtained by Fitting the Surface Data between Gold Surfaces
Coated by Alkanethiols with Different Chain Lengths in Pure Water with
Extended DLVO Theory………………………………………………………..68
Table 3.2 Effects of NaCl on Debye Lengths (κ-1) and Decay Lengths (D) between
C12SH-coated Gold Surfaces and C16SH-coated Gold Surfaces……………….72
Table 4.1 The Contact Angles and Parameters (Surface Potentials, Debye Lengths)
Obtained by Fitting the Surface Forces Measured in PAX Solutions after
Different Immersion Times with DLVO Theory………….…………………..110
Table 4.2 Parameter C and Decay Length D Obtained by Fitting the Surface Forces
Measured in PAX Solutions after Different Immersion Times with Extended
DLVO Theory…………………………………………………………………113
Table 4.3 Effects of NaCl on Debye Length (κ-1), C and Decay Length (D) for Gold
Hydrophobized by in-situ Adsorption of PAX and KEX……………………...117
xviii
Chapter 1
Introduction
1.1 General
Froth flotation is the most widely used solid-solid separation process employed in the
mining industry. The process is designed to separate hydrophobic particles from hydrophilic
ones. Therefore, control of particle hydrophobicity is most important in flotation. For this
reason, the early days of flotation research was focused on developing various reagents
(collectors) that can be used to hydrophobize different minerals. During these early days of
research, contact angle was used as the measure of hydrophobicity. However, it is a
thermodynamic property and, hence, doses not give kinetic information. On the other hand,
flotation is a kinetic process, and the industry strives to improve flotation rate and, thereby, to
maximize recovery and throughput.
In colloid chemistry, the kinetics of coagulation can be predicted by the classical
DLVO theory1, 2, which considers two surface forces, namely, repulsive electrical
double-layer force (Fe) and attractive van der Waals dispersion force (Fd). These two surface
forces are considered additive. Thus, the total interaction force (Ft) between two particles can
be given as follows:
det FFF += (1.1)
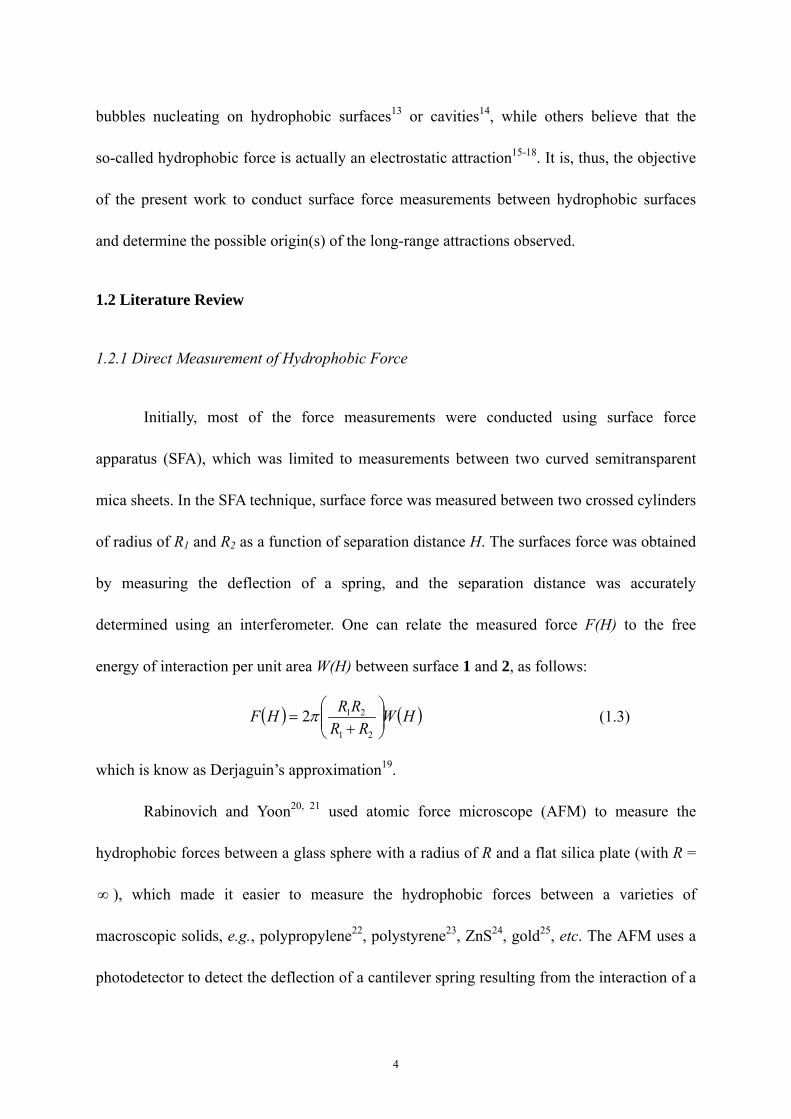
Typically, a plot (Figure 1.1) of Equation 1.1 shows a maximum repulsive force (Fmax)
at a critical separation distance (Hcr) between two colloidal particles. If Fmax is large,
coagulation of the particles are slow; and if Fmax is small, the coagulation is fast. As such, the
1
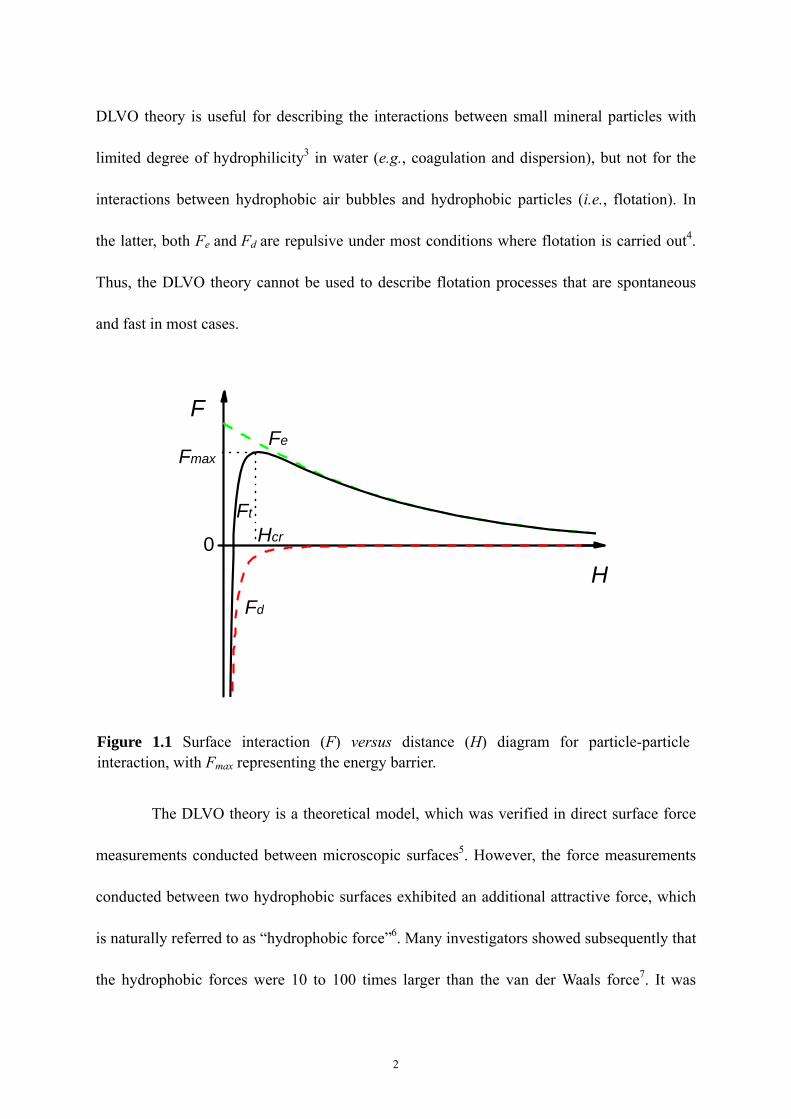
DLVO theory is useful for describing the interactions between small mineral particles with
limited degree of hydrophilicity3 in water (e.g., coagulation and dispersion), but not for the
interactions between hydrophobic air bubbles and hydrophobic particles (i.e., flotation). In
the latter, both Fe and Fd are repulsive under most conditions where flotation is carried out4.
Thus, the DLVO theory cannot be used to describe flotation processes that are spontaneous
and fast in most cases.
The DLVO theory is a theoretical model, which was verified in direct surface force
measurements conducted between microscopic surfaces5. However, the force measurements
conducted between two hydrophobic surfaces exhibited an additional attractive force, which
is naturally referred to as “hydrophobic force”6. Many investigators showed subsequently that
the hydrophobic forces were 10 to 100 times larger than the van der Waals force7. It was
2
0
Fmax
Ft
Fd
F
H
Hcr
Fe
Figure 1.1 Surface interaction (F) versus distance (H) diagram for particle-particle interaction, with Fmax representing the energy barrier.
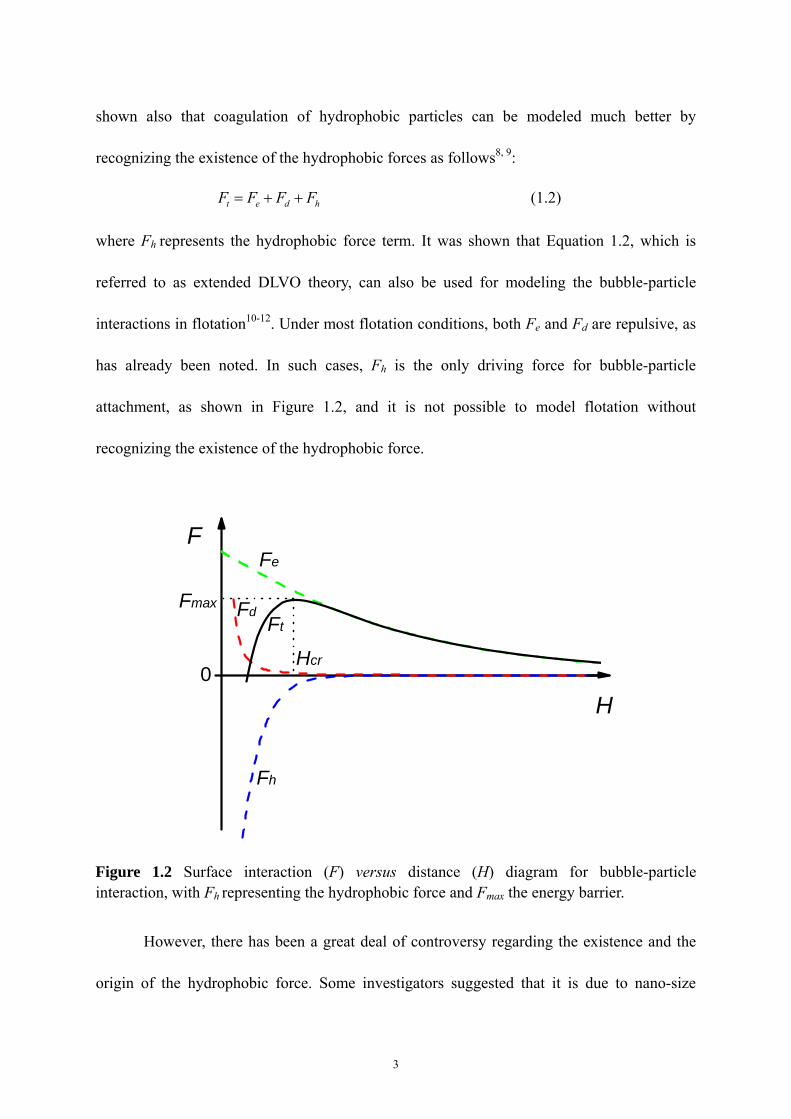
shown also that coagulation of hydrophobic particles can be modeled much better by
recognizing the existence of the hydrophobic forces as follows8, 9:
hdet FFFF ++= (1.2)
where Fh represents the hydrophobic force term. It was shown that Equation 1.2, which is
referred to as extended DLVO theory, can also be used for modeling the bubble-particle
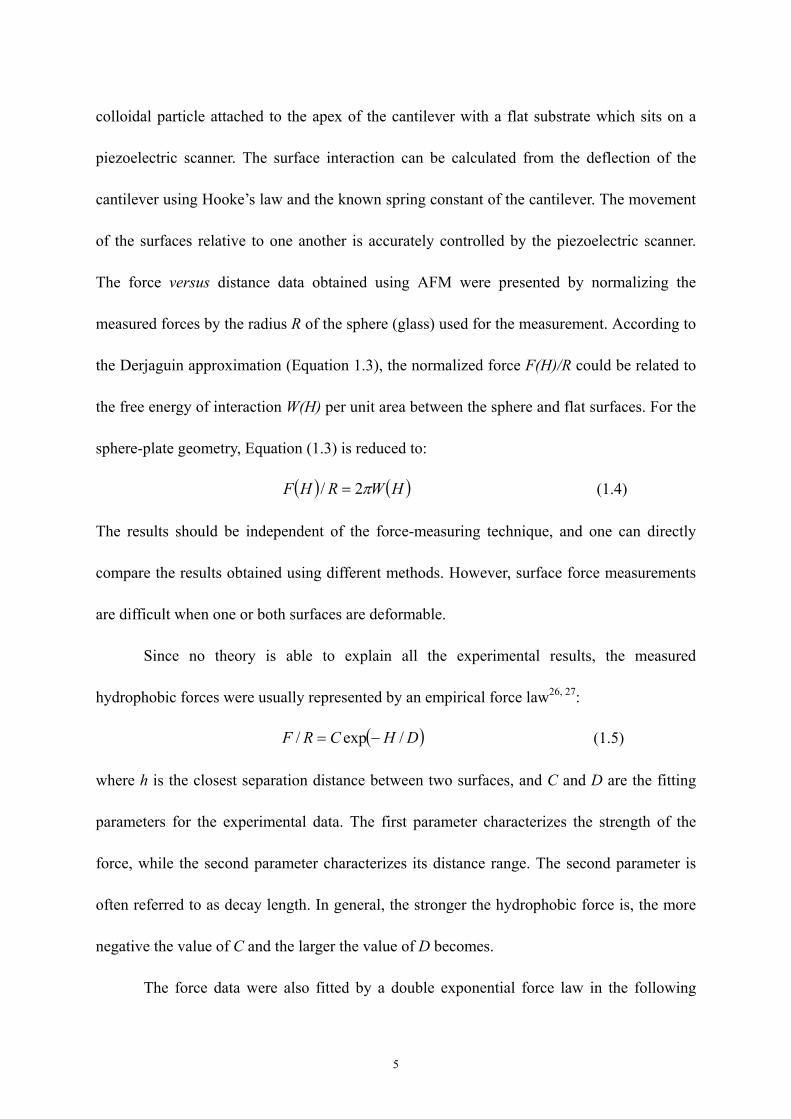
interactions in flotation10-12. Under most flotation conditions, both Fe and Fd are repulsive, as
has already been noted. In such cases, Fh is the only driving force for bubble-particle
attachment, as shown in Figure 1.2, and it is not possible to model flotation without
recognizing the existence of the hydrophobic force.
0
Fh
Fmax
FtFd
F
H
Hcr
Fe
Figure 1.2 Surface interaction (F) versus distance (H) diagram for bubble-particle interaction, with Fh representing the hydrophobic force and Fmax the energy barrier.
However, there has been a great deal of controversy regarding the existence and the
origin of the hydrophobic force. Some investigators suggested that it is due to nano-size
3
bubbles nucleating on hydrophobic surfaces13 or cavities14, while others believe that the
so-called hydrophobic force is actually an electrostatic attraction15-18. It is, thus, the objective
of the present work to conduct surface force measurements between hydrophobic surfaces
and determine the possible origin(s) of the long-range attractions observed.
1.2 Literature Review
1.2.1 Direct Measurement of Hydrophobic Force
Initially, most of the force measurements were conducted using surface force
apparatus (SFA), which was limited to measurements between two curved semitransparent
mica sheets. In the SFA technique, surface force was measured between two crossed cylinders
of radius of R1 and R2 as a function of separation distance H. The surfaces force was obtained
by measuring the deflection of a spring, and the separation distance was accurately
determined using an interferometer. One can relate the measured force F(H) to the free
energy of interaction per unit area W(H) between surface 1 and 2, as follows:
( ) ( )HWRR
RRHF ⎟⎟⎠
⎞⎜⎜⎝
⎛+
=21
212π (1.3)
which is know as Derjaguin’s approximation19.
Rabinovich and Yoon20, 21 used atomic force microscope (AFM) to measure the
hydrophobic forces between a glass sphere with a radius of R and a flat silica plate (with R =
), which made it easier to measure the hydrophobic forces between a varieties of
macroscopic solids, e.g., polypropylene
∞
22, polystyrene23, ZnS24, gold25, etc. The AFM uses a
photodetector to detect the deflection of a cantilever spring resulting from the interaction of a
4
colloidal particle attached to the apex of the cantilever with a flat substrate which sits on a
piezoelectric scanner. The surface interaction can be calculated from the deflection of the
cantilever using Hooke’s law and the known spring constant of the cantilever. The movement
of the surfaces relative to one another is accurately controlled by the piezoelectric scanner.
The force versus distance data obtained using AFM were presented by normalizing the
measured forces by the radius R of the sphere (glass) used for the measurement. According to
the Derjaguin approximation (Equation 1.3), the normalized force F(H)/R could be related to
the free energy of interaction W(H) per unit area between the sphere and flat surfaces. For the
sphere-plate geometry, Equation (1.3) is reduced to:
( ) ( )HWRHF π2/ = (1.4)
The results should be independent of the force-measuring technique, and one can directly
compare the results obtained using different methods. However, surface force measurements
are difficult when one or both surfaces are deformable.
Since no theory is able to explain all the experimental results, the measured
hydrophobic forces were usually represented by an empirical force law26, 27:
( )DHCRF /exp/ −= (1.5)
where h is the closest separation distance between two surfaces, and C and D are the fitting
parameters for the experimental data. The first parameter characterizes the strength of the
force, while the second parameter characterizes its distance range. The second parameter is
often referred to as decay length. In general, the stronger the hydrophobic force is, the more
negative the value of C and the larger the value of D becomes.
The force data were also fitted by a double exponential force law in the following
5
form20, 28, 29:
( ) )/exp(/exp/ 2211 DHCDHCRF −+−= (1.6)
in which C1 and C2 represent the magnitudes of the short- and long-range hydrophobic forces,
respectively, and D1 and D2 are the respective decay lengths.
Another way of representing the hydrophobic forces measured in experiment is to use
a power law20:
2131 6// HKRF −= (1.7)
where K131 is the hydrophobic force constant between two solids 1 in water 3. Equation (1.7)
has only one fitting parameter as compared to two in Equation 1.5 and four in Equation 1.6.
Equation 1.7 is of the same form as the van der Waals dispersion force; therefore, the value of
K131 is directly comparable with the Hamaker constant (A131).
1.2.2 Factors Affecting Hydrophobic Force
In 1982, Israelachivili and Pashley6 published a seminal paper in Nature, which
showed the presence of a third surface force. They measured an additional attractive force
between two mica surfaces hydrophobized by cetyltrimethylammonium bromide (CTAB).
Naturally, the non-DLVO attractive force was named hydrophobic force, which was not only
stronger than the van der Waals force but was also longer-ranged, that is, the force was
discernable at longer separation distances. The work of Israelachvili and Pashley created
interests among many colloid chemists, with numerous follow-up measurements on different
types of hydrophobic surfaces using a range of different methods of hydrophobization, as has
been reviewed recently7, 13, 30-33.
6
A wide range of factors affecting the hydrophobic force have been investigated, which
are summarized as follows:
1. Type of hydrophobic surface. Christenson and Claesson7 presented a state of the art
review of the hydrophobic force from an experimental perspective. Recognizing the large
variation of the measured interaction is dependent on the type of hydrophobic surface,
they classified the non-DLVO attractive forces observed in water between hydrophobic
surfaces into three different categories. (I) Stable hydrophobic surfaces, e.g., polymerized
Langmuir-Blodgett (LB) films deposited on mica34, 35, bulk polymer surfaces22, show a
fairly short-range but strongly attractive force, much stronger than the van der Waals
force. (II) Very hydrophobic surfaces, e.g., silica or glass surfaces made hydrophobic by
silylation36-38, gold surfaces made hydrophobic by self-assembly of thiol25, 39, 40, give an
attraction of variable strength and range caused by the presence of small bubbles
sporadically adhering to hydrophobic surfaces. (III) Results obtained with a variety of
hydrophobic surfaces, e.g., LB films of surfactants or lipids on mica or silica28, 41-43,
in-situ adsorbed surfactant on silica38, 44-47, appear to give rise to a very-long range
attractive force with exponential decay.
2. Surface hydrophobicity. Rabinovich and Yoon20 measured the hydrophobic force
between a silica bead and a silica plate surfaces, which were hydrophobized with varying
amounts of octadecylchlorosilane (OTS) or trimethylchlorosilane (TMS) as a means of
controlling contact angle. The range of the measured hydrophobic force depended on the
contact angle, varying from approximately 30 nm for the surface contact angle θa = 88º
to over 100 nm for θa = 115º. Yoon and Ravishankar48 measured hydrophobic forces
7
between mica surfaces in dodecylammonium chloride (DAHCl) solutions in the presence
of dodecanol or octanol. The results showed that when θa < 90º, only short range
hydrophobic forces were measured with decay lengths of around 1.3 nm. Long-ranged
hydrophobic forces, resulting from the formation of domains of close-packed
hydrocarbon chains, were observed at θa ≥ 90º. Ederth and Liedberg49 investigated the
influence of wetting properties on the long-range hydrophobic interaction between gold
surfaces hydrophobized by self-assembly of methyl- and hydroxyl-functionalized
alkanethiols. The results showed that whenever the advancing water contact angle on the
hydrophobized gold surfaces exceeded 90º, long-range attraction appeared and the
attractive force curves had steps or discontinuities. When the contact angle was lower
than 90°, the interaction was a van der Waals force.
3. Salt effect. Claesson et al.28 first investigated the electrolyte effect, and they found that
the interaction between water-stable hydrophobic LB monolayers on mica was weakly
dependent on KBr concentration up to a concentration of 0.01 M. Christenson et al.50
studied the effect of divalent electrolyte (0.01 M magnesium sulfate sand 0.1 M
magnesium sulfate solutions) on the hydrophobic attraction between two mica surfaces
coated with LB film of dimethyldioctadecylammonium bromide (DDOABr). They found
that the magnitude of the hydrophobic attraction was reduced with increasing electrolyte
concentration but remained much larger than the van der Waals force. Parker et al.36
conducted surface force measurements using chemically fluorinated glass surfaces in the
presence of KBr and NaCl. They found that no reduction in force upon addition of
electrolyte, except at very high salt concentrations (5 M NaCl) where the strength of the
8
attractive forces increased slightly. Meagher and Craig22 measured the hydrophobic
interaction between two polypropylene surfaces in NaCl solutions. The results showed
that increasing NaCl concentration up to 1 M had little or no effect on the range of the
interaction. Craig et al.51 demonstrated that the hydrophobic attraction was undiminished
between silica surfaces in soluble cetylpyridinium chloride in the presence of 0.1 M
NaCl. Kekicheff and Spalla17 measured surface force between electrically neutral glass
surfaces in aqueous solution of cetyltrimethylammonium bromide (CTAB) at pH about
5.7. It was found that the long-range attractive force decayed with the addition of KBr
(10-5−10-2 M). Zhang et al.46 conducted AFM force measurements between silica sphere
and fused-silica plate in aqueous octadecyltrimethylammonium chloride (C18TACl)
solutions. The results showed the attractive force was screened by an added electrolyte
(NaCl).
4. Dissolved gas. Meagher and Craig22 used a modified AFM to measure the hydrophobic
interaction between polypropylene surfaces in NaCl solutions. They showed that the
measured attraction in dilute NaCl solutions was reduced upon removal of the gas.
Rabinovich and Yoon21 demonstrated that attractive interaction between OTS-coated
silica surfaces in water became considerably stronger when the water was saturated with
argon. Craig et al.52 measured the hydrophobic forces between silica surfaces
hydrophobized by adsorption of cetylpyridinium chloride (CPC). The effect of dissolved
gas on the measured interaction was studied. It was shown that the removal of dissolved
gas decreased the range and magnitude of the attraction at long range. Mahnke et al.53
investigated the influence of dissolved gas on the interactions between silica surfaces
9
hydrophobized by either dehydroxylation or methylation. They found degassing caused a
significant reduction in large jump distance (> 25 nm), but not in the smaller jump
distance. For dehydroxylated silica surfaces interacting in CO2 saturated solution, they
found the jump distance were considerably larger than in the presence of air or argon.
Considine et al.54 measured the surface forces between two polystyrene latex spheres in
aqueous solution containing different amount of gas. They found that the range of the
attraction decreased significantly when the level of dissolved gas in the water was
reduced. Sakamoto et al.55 conducted force measurements between silica surfaces in
aqueous C18TACl solutions in the presence and absence of dissolved gas. They
concluded that long-range attractive force was not observed in carefully degassed
solutions. Zhang et al.46 repeated the experiment of Sakamoto et al., however, they found
instead that the long-range hydrophobic force still existed in degassed solution. Stevens
et al.56 studied the effects of degassing on the long-range attractive force between
hydrophobic amorphous fluoropolymer surfaces. They found the range of the attraction
was significantly decreased in degassed water, but the range and magnitude of the
attraction remained greater than the van der Waals attraction. The effect of dissolved gas
on the hydrophobic attraction between dimethyldioctadecylammonium bromide-
(DODAB) coated mica was studied by Meyer et al.57 using a surface forces apparatus
(SFA). Removal of dissolved gas was seen to reduce the range of the attraction while the
short-range attraction (< 25 nm) remained unchanged.
5. Temperature effect. Tsao et al.29 measured the attractive forces between two
hydrophobized mica surfaces immersed in water at three different temperatures in the
10
range 25−50ºC. The results showed that a very long range attractive force changed
dramatically with temperature, the attraction decreasing with increasing temperature.
They attributed the decrease in attractive force to the change of the state of the
hydrocarbon chains on the surface when the temperature was increased. Parker et al.36
investigated the effect of temperature using stable surfaces prepared by covalent
modification of silica with fluorocarbon silane. It was shown that there was a significant
increase in the strength of the interaction measured between silane-coated mica surfaces
when the temperature was increased from room temperature to 41ºC.
6. Ethanol effect. Parker et al.36 showed that the addition of ethanol reduced the strength of
the long range forces between silane-coated silica surfaces. Kokkoli et al.58 also showed
that addition of ethanol to water resulted in a decrease in the strength of the hydrophobic
attraction between self-assembled monolayers of hexadecanethiol on gold. As the ethanol
concentration was increased further (75% mole fraction), the hydrophobic attraction
became comparable to the van der Waals force. Ederth40 showed that the attractive force
measured between two hexadecanethiol-coated gold surfaces in water containing 12.5 %
ethanol (by weight) was slightly shorter-ranged than that in pure water. As the ethanol
concentration was increased to 20%, the attractive force measured was the van der Waals
force. Nguyen et al.37 measured attraction between silanated glass surfaces in
water-ethanol mixtures. The results showed that the strong attractive force decreased
with an increase in the ethanol content and disappeared in pure ethanol.
7. Chain order. Rabinovich et al.59 investigated the dependence of hydrophobic force on
the chain order for mica surfaces coated by double-chain surfactant
11
(dimethyldioctadecylammonium, DDOA) monolayers. It was found the hydrophobic
force increased with the ordering the hydrocarbon chains. It was thus suggested that the
hydrophobic force was related to the hydrocarbon chains ordering, which in turn may
affect the structure of vicinal water.
1.3 Scientific Discussion
Many research groups around the world conducted surface force measurements with
different types of hydrophobic surfaces, and showed the existence of long-range attractions.
However, the results are far from being consistent. Therefore, many investigators cast doubts
about the long-range force being the real hydrophobic force. Nevertheless, various theoretical
models and ideas have been rendered to explain the experimental results. Eriksson et al.60
carried out a theoretical analysis to suggest that the long range hydrophobic attraction is due
to the enhanced hydrogen bonding of the water molecules in the vicinity of a hydrophobic
solid. Some other investigators considered that they are due to surface-induced perturbation
in the adjacent fluid61, ion-ion correlations62, mobile charged patches15, correlated in plane
dipoles48, 63, lack of stability of hydrophobic surface groups64, and rearrangement of the
charged patchy bilayers33. However, these models cannot be reconciled with all of the
experimental data, particularly with regards to salt effect. In particular, Miklavic et al.15
predicted that the attraction due to charge correlation should decay exponentially with a
decay length equal to one-half of the Debye length (κ-1). Although there are some experiment
results consistent with this theory61, 62, more and more experimental data show that the force
is independent of ionic strength22, 36, 51.
12
More recently, many investigators showed evidence that the non-DLVO attractions
observed during the force measurements are artifacts introduced during the measurement.
Tyrrell and Attard65, 66 and Ishida et al.67 showed that the “so-called” hydrophobic force is
caused by the small bubbles (nanobubbles) preexisting on hydrophobic surfaces. Christenson
and Claesson14 and Yaminsky and Ninham68 suggested that the very long range forces
measured are a consequence of cavitations between microscopic hydrophobic surfaces. The
most frequently quoted evidences for the air-bubbles were the discontinuities (or steps)
observed in force versus distance curves36, each step representing coalescence of nanobubbles.
When two bubbles coalesce, gas bridges (or cavities) are formed between two surfaces,
which give rise to capillary forces. Tyrell and Attard 66 and Yang et al.69 actually showed
AFM images of the nanobubbles formed on hydrophobic surfaces. It is interesting that the
nanobubbles were flat, which, according to the authors, was necessary to minimize the gas
pressure inside the nanobubbles.
Seemingly definitive evidence for the microscopic bubbles theory was given by
Sakamoto et al.55, who conducted AFM force measurements between a glass sphere and silica
plate immersed in octadecyltrimethylammonium chloride (C18TACl) solutions. They found
that the long-range attractions were observed only when the measurements were conducted in
air-saturated solutions and not in carefully degassed solutions. This observation leads the
authors to the conclusion that “long-range attraction never appears in completely air-free
C18TACl solutions”.
This theory seems appealing, because the existence of the bubbles solves the range
problem. The apparent ranges of the forces depend on the heights of bubbles with varying
13
dimensions. However, a primary setback for this theory is that very small air bubbles in the
bulk water phase are short-lived70. Stevens et al.56 showed the range and strength of the
attraction between hydrophobic amorphous fluoropolymer surfaces in deaerated water remain
significantly greater than the van der Waals force. Meyer et al.57 conducted SFA force
measurements between mica surfaces coated by a Langmuir-Blodgett (LB)-deposited
hydrophobic monolayer of double-chain cationic surfactant (DODAB) both in the presence
and absence of dissolved gases. In the presence of dissolved gases, they observed long-range
attractive forces, while in degassed solutions only short-range attraction forces were observed.
The authors concluded, therefore, that “true” hydrophobic force exists even in degassed
solutions. They stated further that the longer range attractive force may be unrelated to
hydrophobicity. On the other hand, Zhang et al.46 observed long-range attractive forces with a
decay length as large as 36 nm even after degassing a C18TACl solution.
Thus, the questions concerning the existence of the hydrophobic force and its origins
remain controversial. It has been shown that the classical DLVO theory cannot explain the
coagulation of strongly hydrophobic particles and the coalescence of air bubbles at low
surfactant concentrations8, 9, 71, 72. Both of these phenomena are important in flotation as they
affect particle and bubble size distributions. Also, modeling bubble-particle interactions is not
possible without recognizing the existence of hydrophobic force10-12. Furthermore, most of
the surface force measurements conducted in the past was made between mica and silica
surfaces using surfactants that are not commonly used for flotation.
14
1.4 Research Objectives
The main objective of these studies is to examine the existence of the long range
hydrophobic forces between thiol- and xanthate-coated gold surfaces in air-equilibrated water.
The factors that may affect the hydrophobic force will be investigated. The results will be
used to study the nature of hydrophobicity and the origin of hydrophobic force.
The specific objectives for this research are:
1. Conduct AFM force measurements between two gold macroscopic surfaces in
aqueous solution to determine the Hamaker constant of gold (Chapter 2).
2. Conduct force measurements with gold surfaces pretreated by ex-situ adsorption of
alkanethiols as functions of surfactant concentration and immersion time (Chapter 2 and
Chapter 3).
3. Conduct force measurements with gold surfaces pretreated by ex-situ adsorption of
alkanethiols as function of chain length (Chapter 3).
4. Conduct force measurements with gold surfaces pretreated by in-situ adsorption of
water-soluble xanthate surfactants as functions of surfactant concentration and immersion
time (Chapter 4).
5. Conduct force measurements in the presence of various solutes such as inorganic
electrolytes, surfactants and alcohols that can affect the properties (e.g., structure) of the thin
water films between two hydrophobic surfaces (Chapter 3, Chapter 4 and Chapter 5).
6. Measure the surface forces at different temperatures to determine the changes in
film entropies (∆Sf,ex) and enthalpies (∆Hf,ex) across the film thickness (Chapter 6).
15
1.5 References
1. Derjaguin, B. V.; Laudau, L., Acta Physicochim. U. R. S. S. 1941, 14, 622-633.
2. Verwey, E. J. W.; Overbeek, J. T. G., Theory of the Stability of Lyophobic Colloids.
Elsevier: Amsterdam, 1948.
3. Derjaguin, B. V.; Churaev, N. V., Colloids Surf. 1989, 41, 223-237.
4. Laskowski, J.; Kitchener, J. A., J. Colloid Interface Sci. 1969, 29, 670-679.
5. Israelachvili, J. N., Surf. Sci. Rep. 1992, 14, 109-159.
6. Israelachvili, J. N.; Pashley, R. M., Nature 1982, 300, 341-342.
7. Christenson, H. K.; Claesson, P. M., Adv. Colloid Interface Sci. 2001, 91, 391-436.
8. Xu, Z.; Yoon, R.-H., J. Colloid Interface Sci. 1989, 132, (2), 532-541.
9. Xu, Z.; Yoon, R.-H., J. Colloid Interface Sci. 1990, 134, (2), 427-434.
10. Yoon, R.-H.; Mao, L., J. Colloid Interface Sci. 1996, 181, 613-626.
11. Yoon, R.-H. In Hydrodynamic and Surface Forces in Bubble-Particle Interactions, XVII
International Mineral Processing Congress, Dresden, Germany, 1991; Aufbereitungs-Technik:
Dresden, Germany, 1991; pp 474-485.
12. Mao, L.; Yoon, R.-H., Int. J. Miner. Process 1997, 51, 171-181.
13. Attard, P., Adv. Colloid Interface Sci. 2003, 104, 75-91.
14. Christenson, H. K.; Claesson, P. M., Science 1988, 239, (4838), 390-392.
15. Miklavic, S. J.; Chan, D. Y. C.; White, L. R.; Healy, T. W., J. Phys. Chem. 1994, 98,
9022-9032.
16. Podgornik, R., J. Chem. Phys 1989, 91, (9), 5840-5849.
17. Kekicheff, P.; Spalla, O., Phys. Rev. Lett. 1995, 75, (9), 1851-1855.
16
18. Meyer, E. E.; Lin, Q.; Hassenkam, T.; Oroudjev, E.; Israelachvili, J. N., Proc. Nat. Acad.
Sci. U.S.A 2005, 102, 6839-6842.
19. Derjaguin, B. V., Kolloid Zeits 1934, 69, 115-164.
20. Rabinovich, Y. I.; Yoon, R.-H., Langmuir 1994, 10, 1903-1909.
21. Rabinovich, Y. I.; Yoon, R.-H., Colloids and Surfaces 1994, 93, 263-273.
22. Meagher, L.; Craig, V. S. J., Langmuir 1994, 10, 2736-2742.
23. Vinogradova, O. I.; Yakubov, G. E., J. Chem. Phys. 2001, 114, (18), 8124-8131.
24. Muster, T. H.; Toikka, G.; Hayes, R. A.; Prestidge, C. A.; Ralston, J., Colloids and Surf.,
A 1996, 106, 203-211.
25. Wang, J.; Yoon, R.-H., Langmuir 2008, 24, 7889-7896.
26. Israelachvili, J.; Pashley, R., Nature 1982, 300, 341-342.
27. Christenson, H. K.; Claesson, P. M.; Berg, J.; Herder, P. C., J. Phys. Chem. 1989, 93,
1472-1478.
28. Claesson, P. M.; Blom, C. E.; Herder, P. C.; Ninham, B. W., J. Colloid Interface Sci.
1986, 114, (1), 234-242.
29. Tsao, Y.-H.; Yang, S. X.; Evans, D. F.; Wennerstrom, H., Langmuir 1991, 7, 3154-3159.
30. Spalla, O., Curr. Opin. Colloid Interface Sci. 2000, 5, 5-12.
31. Eriksson, J. C.; Yoon, R.-H., The Nature of Hydrophobic Attraction Forces. In Froth
Flotation A Century of Innovation, Fuerstenau, M. C.; Jameson, G.; Yoon, R.-H., Eds. Society
for Mining, Metallurgy, and Exploration, Inc.: 2006; pp 133-178.
32. Eriksson, J. C.; Yoon, R.-H., Hydrophobic Attraction in the Light of Thin-Film
Thermodynamics. In Colloid Stability: The Role of Surface Forces, Tadros, T. F., Ed.
17
WILEY-VCH Verlag GmbH & Co. KGaA: Weinheim, Germany, 2007; Vol. 1, pp 99-132.
33. Meyer, E. E.; Rosenberg, K. J.; Israelachvili, J., Proc. Nat. Acad. Sci. U.S.A 2006, 103,
15739-15746.
34. Wood, J.; Sharma, R., Langmuir 1994, 10, 2307-2310.
35. Wood, J.; Sharma, R., Langmuir 1995, 11, (12), 4797-4802.
36. Parker, J. L.; Claesson, P. M.; Attard, P., J. Phys. Chem. 1994, 98, 8468-8480.
37. Nguyen, A. V.; Nalaskowski, J.; Miller, J. D.; Butt, H.-J., Int. J. Miner. Process. 2003, 72,
215-225.
38. Ishida, N.; Kinoshita, N.; Miyahara, M.; Higashitani, K., J. Colloid Interface Sci. 1999,
216, 387-393.
39. Ederth, T.; Claesson, P.; Liedberg, B., Langmuir 1998, 14, 4782-4789.
40. Ederth, T., J. Phys. Chem. B 2000, 104, 9704-9712.
41. Hato, M., J. Phys. Chem. 1996, 100, 18530-18538.
42. Kurihara, K.; Kunitake, T., J. Am. Chem. Soc. 1992, 114, 10927-10933.
43. Lin, Q.; Meyer, E. E.; Tadmor, M.; Israelachvili, J. N.; Kuhl, T. L., Langmuir 2005, 21,
251-255.
44. Parker, J. L.; Yaminsky, V. V.; Claesson, P. M., J. Phys. Chem. 1993, 97, 7706-7710.
45. Rutland, M. W.; Parker, J. L., Langmuir 1994, 10, 1110-1121.
46. Zhang, J.; Yoon, R.-H.; Mao, M.; Ducker, W. A., Langmuir 2005, 21, 5831-5841.
47. Zhang, J.; Yoon, R.-H.; Eriksson, J. C., Colloids Surf., A 2007, 300, 335-345.
48. Yoon, R.-H.; Ravishankar, S. A. R., J. Colloid Interface Sci. 1996, 179, 391-402.
49. Ederth, T.; Liedberg, B., Langmuir 2000, 16, 2177-2184.
18
50. Christenson, H. K.; Fang, J.; Ninham, B. W.; Parker, J. L., J. Phys. Chem. 1990, 94,
8004-8006.
51. Craig, V. S. J.; Ninham, B. W.; Pashley, R. M., Langmuir 1998, 14, (12), 3326-3332.
52. Craig, V. S. J.; Ninham, B. W.; Pashley, R. M., Langmuir 1999, 15, 1562-1569.
53. Mahnke, J.; Stearnes, J.; Hayes, R. A.; Fornasiero, D.; Ralston, J., Phys. Chem. Chem.
Phys. 1999, 1, 2793-2798.
54. Considine, R. F.; Hayes, R. A.; Horn, R. G., Langmuir 1999, 15, 1657-1659.
55. Sakamoto, M.; Kanda, Y.; Miyahara, M.; Higashitani, K., Langmuir 2002, 18,
5713-5719.
56. Stevens, H.; Considine, R. F.; Drummond, C. J.; Hayes, R. A.; Attard, P., Langmuir 2005,
21, 6399-6405.
57. Meyer, E. E.; Lin, Q.; Israelachvili, J. N., Langmuir 2005, 21, 256-259.
58. Kokkoli, E.; Zukoski, C. F., J. Colloid Interface Sci. 1999, 209, 60-65.
59. Rabinovich, Y. I.; Guzonas, D. A.; Yoon, R.-H., Langmuir 1993, 9, 1168-1170.
60. Eriksson, J. C.; Ljunggren, S.; Claesson, P. M., J. Chem. Soc., Faraday Trans. 2 1989, 85,
(3), 163-176.
61. Attard, P., J. Phys. Chem 1989, 93, 6441-6444.
62. Spalla, O.; Belloni, L., Phys. Rev. Lett. 1995, 74, (13), 2515-2518.
63. Tsao, Y.-H.; Evans, D. F.; Wennerstrom, H., Science 1993, 262, (5133), 547-550.
64. Christenson, H. K.; Yaminsky, V. V., Colloids Surf., A 1997, 129-130, 67-74.
65. Tyrrell, J. W. G.; Attard, P., Phys. Rev. Lett. 2001, 87, (17), 176104-1.
66. Tyrrell, J. W. G.; Attard, P., Langmuir 2002, 18, 160-167.
19
67. Ishida, N.; Sakamoto, M.; Miyahara, M.; Higashitani, K., J. Colloid Interface Sci. 2002,
253, 112-116.
68. Yaminsky, V. V.; Ninham, B. W., Langmuir 1993, 9, 3618-3624.
69. Yang, J.; Duan, J.; Fornasiero, D.; Ralston, J., J. Phys. Chem. B 2003, 107, 6139-4147.
70. Ljunggren, S.; Eriksson, J. C., Colloids and Surf., A 1997, 129-130, 151-155.
71. Wang, L.; Yoon, R.-H., Langmuir 2004, 20, 11457-11464.
72. Yoon, R.-H.; Aksoy, B. S., J. Colloid Interface Sci. 1999, 211, 1-10.
20
Chapter 2
AFM Forces Measured between Gold Surfaces Coated with Self-Assembled Monolayers of 1-Hexadecanethiol∗
2.1 Abstract
An atomic force microscope (AFM) was used to measure the forces between gold
surfaces with and without hydrophobizing them by the self-assembly of 1-hexadecanethiol.
The forces measured between bare gold surfaces were fitted to the
Derjaguin-Landau-Verwey-Overbeek (DLVO) theory with a Hamaker constant of 1.2 × 10⁻²⁰
J, which was close to the value determined using the methylene iodide contact angle method
but was lower than that calculated using the Lifshitz theory. When the surfaces were
hydrophobized in a 1 × 10⁻² mM thiol-in-ethanol solution for 10 minutes, the measured forces
exhibited a long-range force with a decay length of 35 nm. Despite its high water contact
angle (105º), the force curve was smooth and exhibited no steps. When the surfaces were
hydrophobized in a 1 mM thiol solution for longer than 6 hours, however, the force curves
exhibited steps, indicating that the long-range attractions were caused by bridging bubbles.
When the measurements were conducted after washing the substrates with organic solvents,
the steps disappeared and long-range attractive force appeared. In the presence of ethanol, the
water contact angle decreased below 90º, the attraction became weaker, and the force curves
became smooth. On the basis of the results obtained in the present work, possible
mechanisms for the long-range attractions are discussed.
∗ Reproduced with permission from [10.1021/la800276r]. Copyright [2008] American Chemical Society.
21
2.2 Introduction
In colloid chemistry, the Derjaguin-Landau-Verwey-Overbeek (DLVO) theory has
been used extensively to predict the kinetics of coagulation. It was derived to predict the
stability of lyophobic colloids, that is, particles with low or no affinity with the dispersion
medium, on the basis of a balance between the van der Waals (attractive) force and the
electrical double layer (repulsive) force. Thus, the theory should work well with hydrophobic
colloids when the medium is water. However, many hydrophobic particles1, 2 and surfaces3-8
exhibit attractions that are much stronger than the van der Waals attractions. In this regard,
Derjaguin and Churaev9 suggested that the DLVO theory should be applicable for “particles
or surfaces having some limited degree of hydrophilicity”. They recognized that hydrophobic
attractions are detected experimentally when advancing contact angles (θa) are greater than
64o,3 while hydrophilic repulsions are detectable at θa < 15o.10 It appears, therefore, that the
DLVO theory has a limited applicability for colloids with a relatively narrow range of contact
angles.
The DLVO theory faces even more difficult challenges when one wishes to predict the
stability of the wetting films formed on hydrophobic surfaces. Thermodynamically, wetting
films are unstable at θ > 0o, and rupture instantaneously once the film thickness is reduced
to a critical value (Hcr). Blake and Kitchener11 measured the values of Hcr to be in the range
of 6-220 nm, while, according to the DLVO theory, no rupture should occur as both the
double-layer and van der Waals forces are repulsive in wetting films.12 Thus, one way of
explaining the rupture of wetting films would be to consider the possibility of a non-DLVO
force destabilizing the wetting film. Laskowski and Kitchener13 speculated the presence of a
22
long-range “hydrophobic influence” operating in the flotation of methylated silica, while
Blake and Kitchener11 suggested the presence of “hydrophobic force” in wetting films.
Israelachvili and Pashley14 were the first to actually measure the hydrophobic forces
in the thin water films between two mica surfaces coated with cetyltrimethylammonium
bromide (CTAB) using the surface force apparatus (SFA). They not only were stronger than
the van der Waals force but also were longer-ranged. The work of Israelachvili and Pashley
created interests among many colloid chemists and physicists, with numerous follow-up
publications.8, 15-19 Recognition of the hydrophobic force also made it possible to model the
coagulation of hydrophobic particles1, 2 and the bubble-particle adhesion occurring during
flotation.20-22
There has been a great deal of controversy, however, regarding the existence and the
nature of the hydrophobic force. Some investigators consider that it is due to the changes in
water structure in the vicinity of hydrophobic solids,16, 23-25 while others believe that it is an
electrical effect due to the correlation between charged patches26, 27 or between large dipoles28,
29 formed on solid surfaces,27, 28 metastability of the water films between hydrophobic
surfaces,5, 30 and bridging of preexisting nanobubbles.31-33 Recently, the nanobubble theory
gained momentum as many investigators showed the discontinuities (or steps) in their force
versus distance curves,33, 34 Tyrell and Attard31 and Yang et al.35 actually showed the AFM
images of the nanobubbles formed on hydrophobic surfaces. Interestingly, the nanobubbles
were flat, which was necessary to minimize the gas pressure inside the bubbles.
Seemingly definitive evidence for the nanobubble theory was presented by Sakamoto
et al.,36 who conducted AFM force measurements between a glass sphere and a silica plate
23
immersed in octadecyltrimethylammonium chloride (C18TACl) solutions. They observed
long-range attractions when the measurements were conducted in air-saturated solutions but
not in carefully degassed solutions. These observations led to a statement that “long-range
attraction never appears in completely air-free C18TACl solutions”. However, the repeat
experiments conducted by Zhang et al.17 on the same system showed that long-range
attractions with decay lengths of 36 nm were observed in degassed solutions. Meyers et al.19,
37 also conducted force measurements between mica surfaces coated with a double-chain
(C-18) cationic surfactant both in the presence and absence of dissolved gases. In the former,
they observed a long-range attractive force, while in the latter only a short-range attraction
was observed. It was concluded, therefore, that only the short-range force observed at
separations below 10 nm was the “true” hydrophobic force, while the long-range force
observed above 20 nm was unrelated to hydrophobicity. Meyers et al.27 suggested that the
long-range attraction was due to the electrostatic attraction between the positively charged
patches of cationic surfactants and the negatively charged bare mica surface. This explanation
was similar to the charged-patch model of Miklavic et al.,26 according to which the patches
must be mobile to account for the long-range attractions observed in surface force
measurements.
In the present work, AFM force measurements were conducted between gold
substrates hydrophobized by the self-assembly of 1-hexadecanethiol (C16SH). It is well
known that n-alkanethiols form stable monolayers with the terminal -CH3 groups in contact
with the aqueous phase, providing hydrophobic surfaces whose surface free energy (19
mJ/m2) is lower than any hydrocarbon surfaces studied to date.38 Further, the strong covalent
24
Au-S bonding provides robust and immobile hydrophobic monolayer, which will preclude the
possibility of mobile hydrophobic groups39, 40 or mobile charged patches19, 26, 27 creating the
long-range forces.
Ederth40 and Ederth et al.,41 used a bimorph surface force apparatus (MASIF) to
measure the forces between C16SH-coated gold surfaces in water. The force curves obtained
by these investigators showed steps, which led to their conclusion that the “excess” force was
due to bubble coalescence. They concluded that the excess force was observed only when
advancing contact angle (θa) exceeded 90o and that no attraction beyond the van der Waals
attraction was observed when θa < 90o. It has been found in the present work that strong and
long-range hydrophobic forces can still be observed without the steps when gold substrates
are contacted with C16SH-in-ethanol solutions of lower concentrations and for shorter contact
times than employed by Ederth and his co-workers. Further, the steps disappear when gold
substrates hydrophobized at higher concentrations for a long period of time are washed with
appropriate solvents.
2.3 Materials and Methods
2.3.1 Materials
a) Regents
A Nanopure II (Barnstead IA) water purification system was used to obtain
double-distilled and deionized water with a resistivity of 18.2 MΩ/cm. To remove particulates,
a submicron Postfilter (0.2 µm pore size) from Fisher Scientific was used in conjunction with
the Nanopure water system. 1-hexadecanethiol (C16SH, 97%) from TCI dissolved in 200
25
proof ethanol (AAPER Alcohol) was used to hydrophobize the gold surfaces. Sulfuric acid
(98%) from VMR International and hydrogen peroxide (H2O2, 29.0-32.0%) from Alfa Aesar
were used to clean gold plates.
b) Gold Plates
Gold microspheres and gold-coated glass slides were used for AFM surface force
measurements. The gold-coated glass slides were obtained by depositing pure gold on glass
using a vacuum evaporator. A 50 Å chromium layer was deposited first on the glass prior to
coating it with a thin-layer (500 Å) of gold. The chromium coating was necessary to achieve
strong bonding between gold and substrate. The coatings produced without the chromium
adhesive layer were easily removed in acid solutions.
c) Gold Spheres
Gold spheres were produced by melting a gold micro-powder (1.5-3.0 µm, >99.96%,
Alfa Aesar) in a furnace. The powder was placed in an alumina crucible, and heated until the
temperature was raised above its melting point (1,064.18oC). It was kept at 1,100ºC for 15
minutes and then cooled down slowly. The furnace was flushed with nitrogen to provide an
oxygen-free atmosphere. The gold spheres obtained in this manner had a wide range of sizes.
Only those with diameters of 15-20 μm were selected for AFM force measurements.
2.3.2 Cleaning Gold Substrates
To obtain high-quality thiol monolayers on gold, a substrate must be cleaned
thoroughly prior to immersing it in a thiol solution.42, 43 There are several cleaning procedures
reported in the literature, including the methods of using piranha solution,38, 44, 45 chromic
26
acid,46, 47 UV/ozone treatment,43, 48 etc. In the present work, the gold plates were cleaned first
by immersing them in a boiling piranha solution (1:2 H2O2/H2SO4) for 20 minutes, and then
washing it with nanopure water for 1 minute, followed by ethanol wash for 2 minutes. After
the cleaning, the gold plate was immediately contacted with a thiol solution for
hydrophobization. The piranha solution reacts violently with organic matter, especially when
it is hot, and is extremely corrosive. Therefore, it is known to oxidize gold surfaces.42 In the
present work, the gold surfaces cleaned in the manner described above exhibited zero water
contact angles, possibly due to the formation of gold oxide (Au2O3). After rinsing it with
ethanol for 2 minutes, the contact angle was increased to 65°. It has been reported that the
gold oxide is unstable at ambient and can be readily reduced by ethanol.42, 43
For the case of gold spheres, cleaning was done after they had been glued onto
cantilever springs. To prevent the glues from being destroyed by the piranha solution, each
gold sphere was flushed with ethanol, irradiated by UV irradiation (λ = 254 nm) for 2 hours,
and then rinsed with ethanol again.
2.3.3 Hydrophobizing Gold Substrates
The gold plates and spheres cleaned in the manner described above were
hydrophobized by contacting them in C16SH-in-ethanol solutions. The specific interaction
between sulfur and gold allowed the surfactant molecules to form robust self-assembled
monolayers.38 The kinetics of adsorption varied with the surfactant concentration.49 In the
present work, the hydrophobization was carried out in 10-2 or 1 mM C16SH-in-ethanol
solutions at room temperature. It was shown that good monolayers can be formed at a
27
concentration as low as 10-2 mM, given a sufficient contact time.38 After the
hydrophobization, the gold substrates were washed with ethanol and then dried in a nitrogen
gas stream. For a given force measurement, a set of gold plate and sphere was immersed in a
thiol solution for a predetermined length of time, so that the hydrophobicity of the two
macroscopic surfaces would be the same. A gold sphere was glued onto a cantilever spring
before being immersed into a thiol solution. Reversing the order made it difficult to glue the
sphere onto a spring.
2.3.4 Contact Angle Measurement
Ederth40 showed that C16SH-coated gold exhibited very small contact angle
hysteresis (Δcos θ = 0.10). Therefore, equilibrium water contact angles were measured on the
hydrophobized gold plates using a goniometer (Ramé-Hart, Inc) under ambient conditions.
Droplets of water (or ethanol solutions) of 1-2 mm diameter were placed on a horizontally
placed plate by means of a syringe. The angles were measured on each side of a droplet. The
measurements were conducted on a total of five droplets placed on different locations of a
gold plate, and the results were averaged. The sessile drop technique was also used to
measure the contact angles of methylene iodide on gold. The result was used to calculate the
Hamaker constant of gold in water.18
2.3.5 Surface Force Measurement and AFM Imaging
Surface force measurements were conducted using a Nanoscope III (Digital
Instruments, Inc., Santa Barbara, CA) atomic force microscope (AFM) equipped with a
28
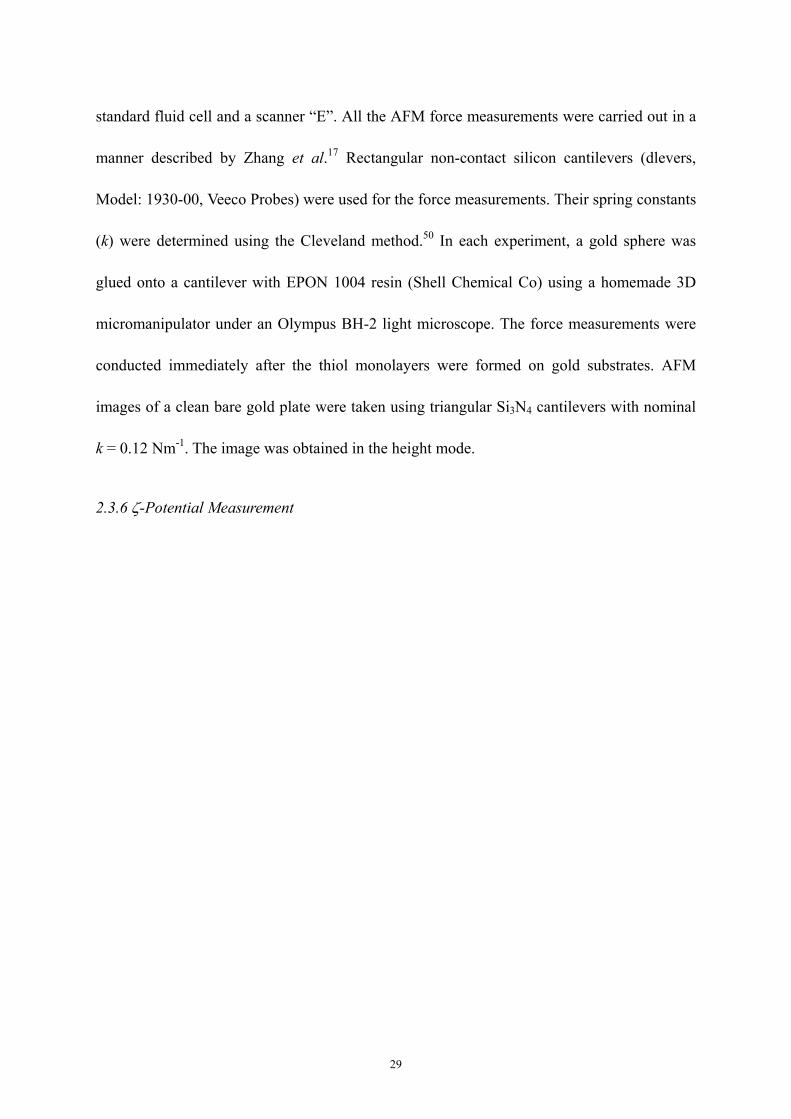
standard fluid cell and a scanner “E”. All the AFM force measurements were carried out in a
manner described by Zhang et al.17 Rectangular non-contact silicon cantilevers (dlevers,
Model: 1930-00, Veeco Probes) were used for the force measurements. Their spring constants
(k) were determined using the Cleveland method.50 In each experiment, a gold sphere was
glued onto a cantilever with EPON 1004 resin (Shell Chemical Co) using a homemade 3D
micromanipulator under an Olympus BH-2 light microscope. The force measurements were
conducted immediately after the thiol monolayers were formed on gold substrates. AFM
images of a clean bare gold plate were taken using triangular Si3N4 cantilevers with nominal
k = 0.12 Nm-1. The image was obtained in the height mode.
2.3.6 ζ-Potential Measurement
29
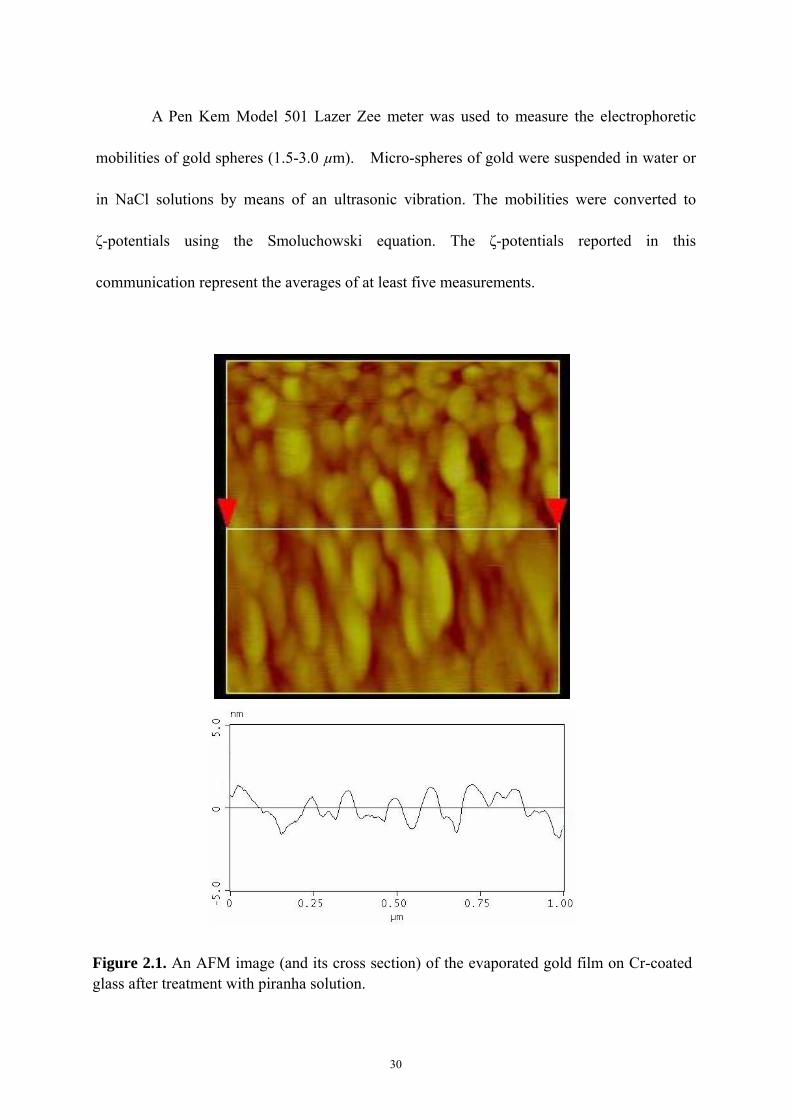
A Pen Kem Model 501 Lazer Zee meter was used to measure the electrophoretic
mobilities of gold spheres (1.5-3.0 µm). Micro-spheres of gold were suspended in water or
in NaCl solutions by means of an ultrasonic vibration. The mobilities were converted to
ζ-potentials using the Smoluchowski equation. The ζ-potentials reported in this
communication represent the averages of at least five measurements.
Figure 2.1. An AFM image (and its cross section) of the evaporated gold film on Cr-coated glass after treatment with piranha solution.
30
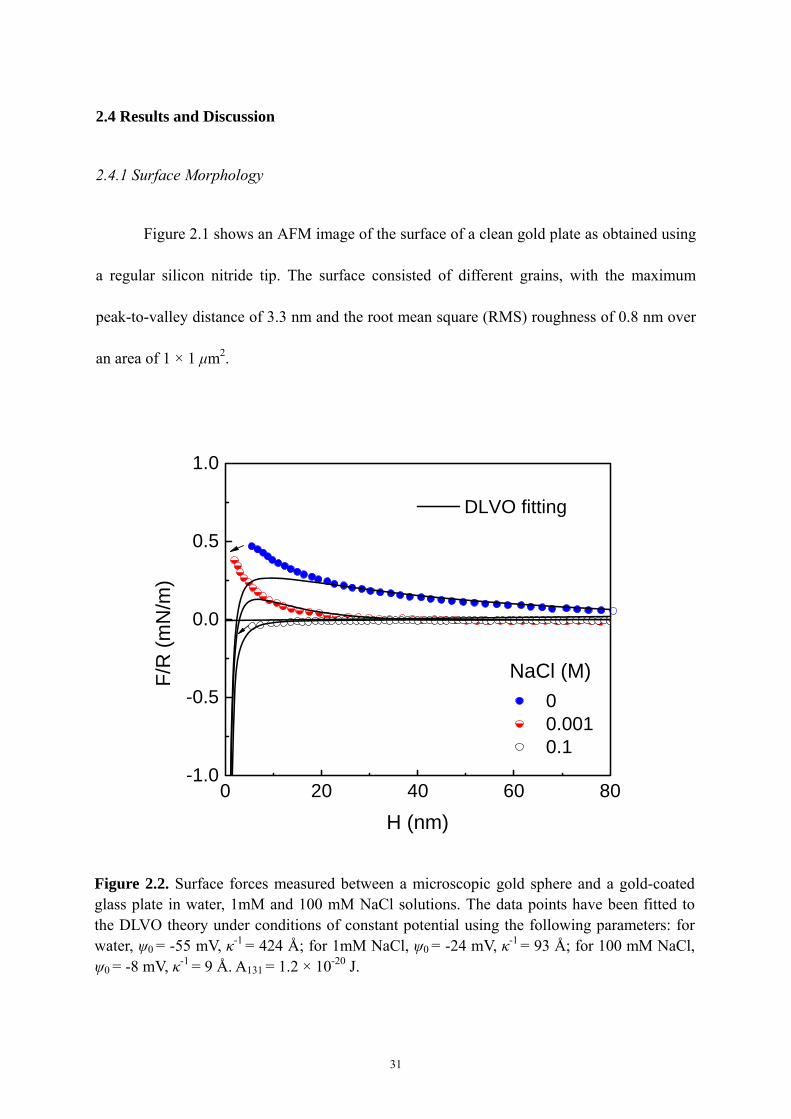
2.4 Results and Discussion
2.4.1 Surface Morphology
Figure 2.1 shows an AFM image of the surface of a clean gold plate as obtained using
a regular silicon nitride tip. The surface consisted of different grains, with the maximum
peak-to-valley distance of 3.3 nm and the root mean square (RMS) roughness of 0.8 nm over
an area of 1 × 1 μm2.
31
0 20 40 60 80-1.0
-0.5
0.0
0.5
1.0
DLVO fitting
0 0.001 0.1
F/R
(mN
/m)
H (nm)
NaCl (M)
Figure 2.2. Surface forces measured between a microscopic gold sphere and a gold-coated glass plate in water, 1mM and 100 mM NaCl solutions. The data points have been fitted to the DLVO theory under conditions of constant potential using the following parameters: for water, ψ0 = -55 mV, κ-1 = 424 Å; for 1mM NaCl, ψ0 = -24 mV, κ-1 = 93 Å; for 100 mM NaCl, ψ0 = -8 mV, κ-1 = 9 Å. A131 = 1.2 × 10⁻²⁰ J.
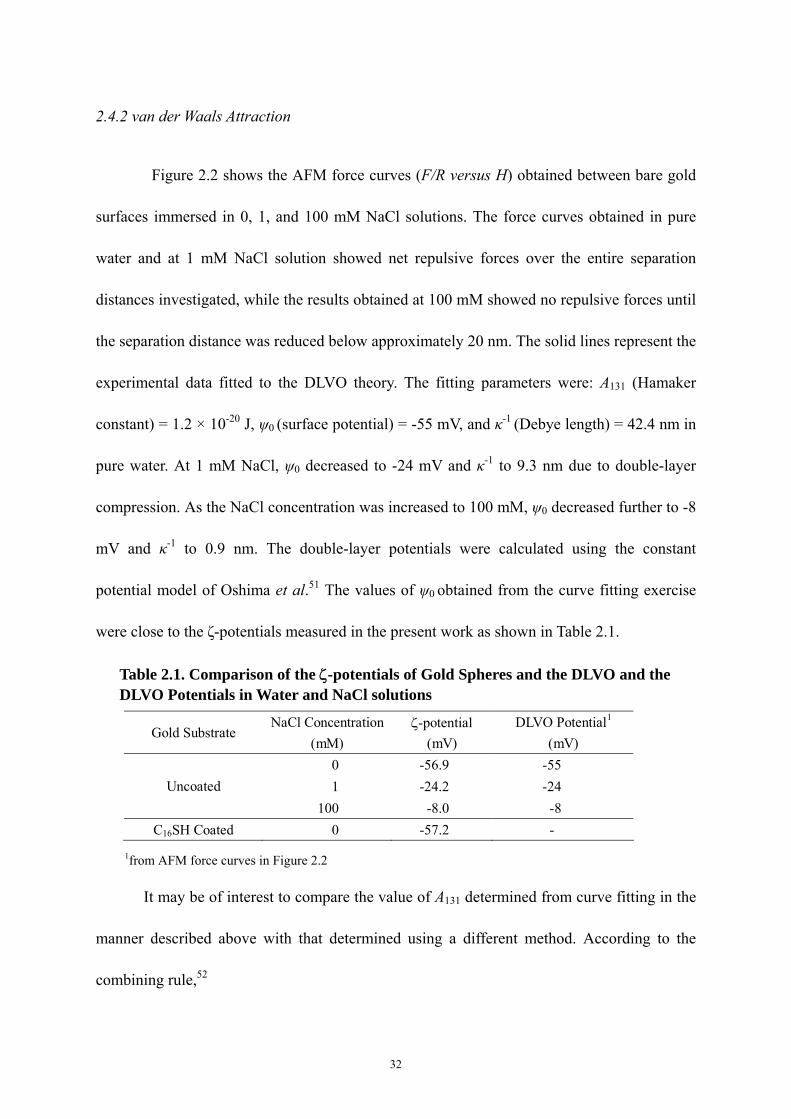
2.4.2 van der Waals Attraction
Figure 2.2 shows the AFM force curves (F/R versus H) obtained between bare gold
surfaces immersed in 0, 1, and 100 mM NaCl solutions. The force curves obtained in pure
water and at 1 mM NaCl solution showed net repulsive forces over the entire separation
distances investigated, while the results obtained at 100 mM showed no repulsive forces until
the separation distance was reduced below approximately 20 nm. The solid lines represent the
experimental data fitted to the DLVO theory. The fitting parameters were: A131 (Hamaker
constant) = 1.2 × 10⁻²⁰ J, ψ0 (surface potential) = -55 mV, and κ-1 (Debye length) = 42.4 nm in
pure water. At 1 mM NaCl, ψ0 decreased to -24 mV and κ-1 to 9.3 nm due to double-layer
compression. As the NaCl concentration was increased to 100 mM, ψ0 decreased further to -8
mV and κ-1 to 0.9 nm. The double-layer potentials were calculated using the constant
potential model of Oshima et al.51 The values of ψ0 obtained from the curve fitting exercise
were close to the ζ-potentials measured in the present work as shown in Table 2.1.
Table 2.1. Comparison of the ζ-potentials of Gold Spheres and the DLVO and the DLVO Potentials in Water and NaCl solutions
Gold Substrate NaCl Concentration
(mM) ζ-potential
(mV) DLVO Potential1
(mV) 0 -56.9 -55 1 -24.2 -24 Uncoated
100 -8.0 -8 C16SH Coated 0 -57.2 -
1from AFM force curves in Figure 2.2
It may be of interest to compare the value of A131 determined from curve fitting in the
manner described above with that determined using a different method. According to the
combining rule,52
32
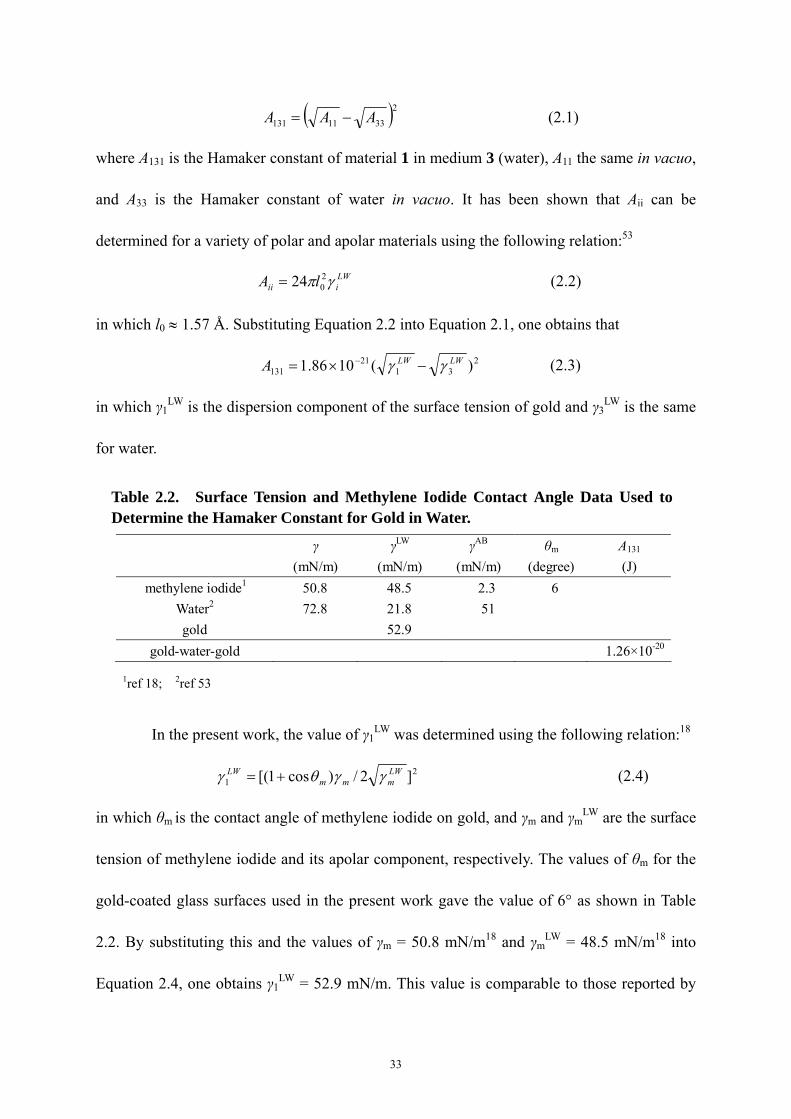
( )2
3311131 AAA −= (2.1)
where A131 is the Hamaker constant of material 1 in medium 3 (water), A11 the same in vacuo,
and A33 is the Hamaker constant of water in vacuo. It has been shown that Aii can be
determined for a variety of polar and apolar materials using the following relation:53
(2.2) LWiii lA γπ 2
024=
in which l0 ≈ 1.57 Å. Substituting Equation 2.2 into Equation 2.1, one obtains that
231
21131 )(1086.1 LWLWA γγ −×= −
(2.3)
in which γ1LW is the dispersion component of the surface tension of gold and γ3
LW is the same
for water.
Table 2.2. Surface Tension and Methylene Iodide Contact Angle Data Used to Determine the Hamaker Constant for Gold in Water.
γ (mN/m)
γLW (mN/m)
γAB (mN/m)
θm
(degree) A131 (J)
methylene iodide1 50.8 48.5 2.3 6 Water2 72.8 21.8 51 gold 52.9
gold-water-gold 1.26×10⁻²⁰
1ref 18; 2ref 53
In the present work, the value of γ1LW
was determined using the following relation:18
2
1 ]2/)cos1[( LWmmm
LW γγθγ += (2.4)
in which θm is the contact angle of methylene iodide on gold, and γm and γmLW are the surface
tension of methylene iodide and its apolar component, respectively. The values of θm for the
gold-coated glass surfaces used in the present work gave the value of 6° as shown in Table
2.2. By substituting this and the values of γm = 50.8 mN/m18 and γmLW = 48.5 mN/m18 into
Equation 2.4, one obtains γ1LW = 52.9 mN/m. This value is comparable to those reported by
33
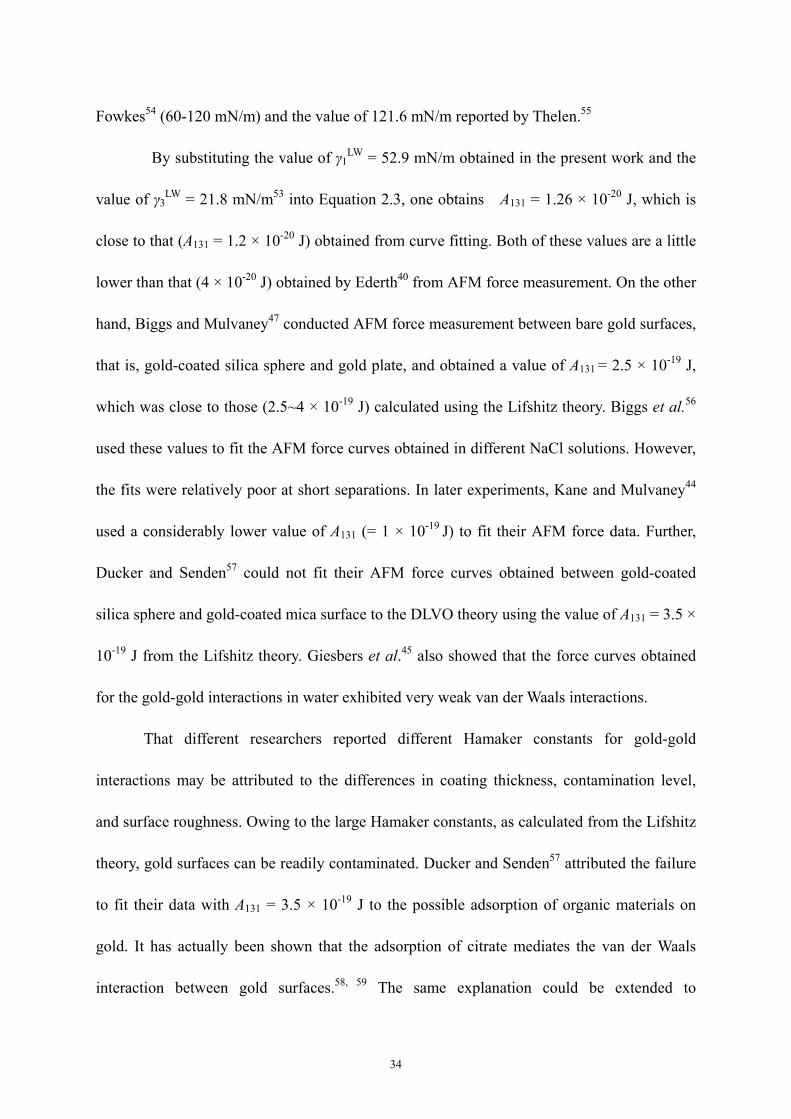
Fowkes54 (60-120 mN/m) and the value of 121.6 mN/m reported by Thelen.55
By substituting the value of γ1LW = 52.9 mN/m obtained in the present work and the
value of γ3LW = 21.8 mN/m53 into Equation 2.3, one obtains A131 = 1.26 × 10⁻²⁰ J, which is
close to that (A131 = 1.2 × 10⁻²⁰ J) obtained from curve fitting. Both of these values are a little
lower than that (4 × 10-20 J) obtained by Ederth40 from AFM force measurement. On the other
hand, Biggs and Mulvaney47 conducted AFM force measurement between bare gold surfaces,
that is, gold-coated silica sphere and gold plate, and obtained a value of A131 = 2.5 × 10⁻¹⁹ J,
which was close to those (2.5~4 × 10-19 J) calculated using the Lifshitz theory. Biggs et al.56
used these values to fit the AFM force curves obtained in different NaCl solutions. However,
the fits were relatively poor at short separations. In later experiments, Kane and Mulvaney44
used a considerably lower value of A131 (= 1 × 10-19 J) to fit their AFM force data. Further,
Ducker and Senden57 could not fit their AFM force curves obtained between gold-coated
silica sphere and gold-coated mica surface to the DLVO theory using the value of A131 = 3.5 ×
10-19 J from the Lifshitz theory. Giesbers et al.45 also showed that the force curves obtained
for the gold-gold interactions in water exhibited very weak van der Waals interactions.
That different researchers reported different Hamaker constants for gold-gold
interactions may be attributed to the differences in coating thickness, contamination level,
and surface roughness. Owing to the large Hamaker constants, as calculated from the Lifshitz
theory, gold surfaces can be readily contaminated. Ducker and Senden57 attributed the failure
to fit their data with A131 = 3.5 × 10⁻¹⁹ J to the possible adsorption of organic materials on
gold. It has actually been shown that the adsorption of citrate mediates the van der Waals
interaction between gold surfaces.58, 59 The same explanation could be extended to
34
silver-silver interactions. The AFM force measurements conducted between silver-coated
glass plate and silica sphere gave a Hamaker constant of 2 × 10-20 J, which was much smaller
than the value of 3 × 10-19 J calculated from the Lifshitz theory.60
According to Considine and Drummond,61 surface roughness attenuates short-range
forces such as van der Waals, steric, and hydration forces. Bhattacharjee et al.62 showed also
that random distribution of asperities can also reduce the interaction energies substantially.
0.1 1 10 100 10000
20
40
60
80
100
120
10-2 mM 1 mMC
onta
ct a
ngle
(deg
ree)
Immersion time (min)
C16SH
Figure 2.3. Changes in equilibrium water contact angle (θ) on gold plate as a function of immersion time in 0.01 and 1 mM 1-hexadecanethiol-in-ethanol solutions.
35
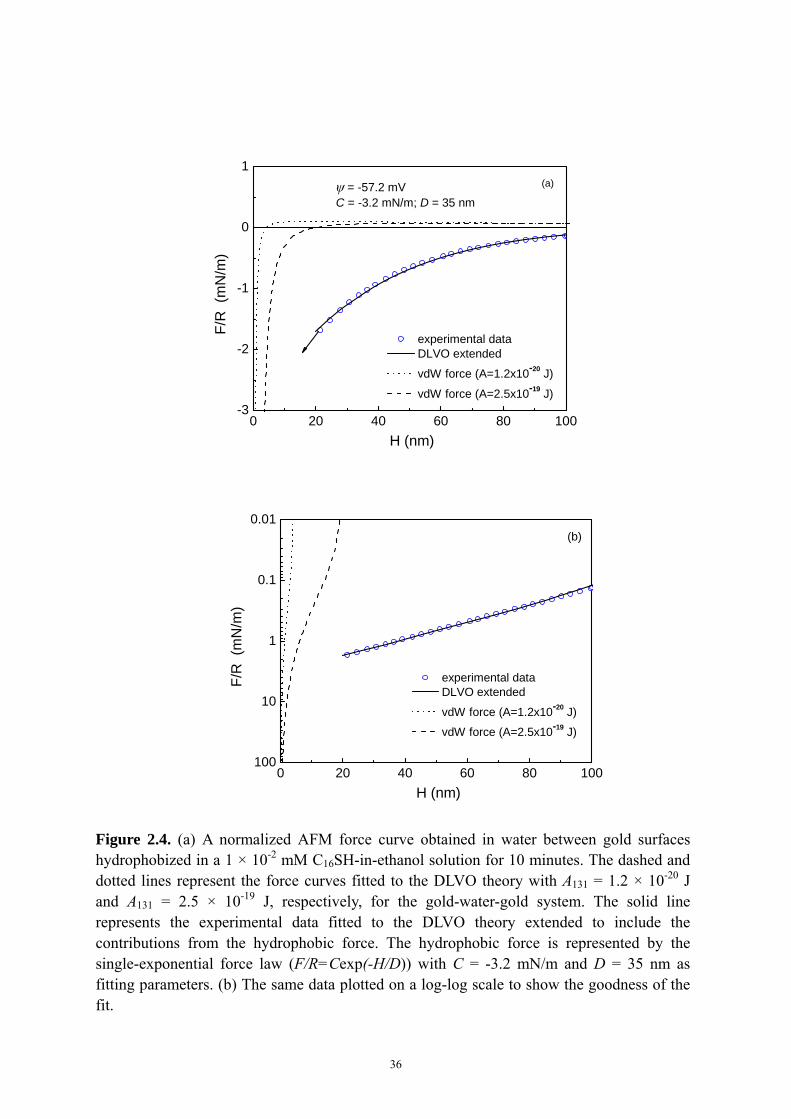
0 20 40 60 80 100-3
-2
-1
0
1ψ = -57.2 mVC = -3.2 mN/m; D = 35 nm
F/R
(m
N/m
)
H (nm)
experimental data DLVO extended
vdW force (A=1.2x10⁻²⁰ J)
vdW force (A=2.5x10⁻¹⁹ J)
(a)
0 20 40 60 80 100100
10
1
0.1
0.01(b)
F/R
(m
N/m
)
H (nm)
experimental data DLVO extended
vdW force (A=1.2x10⁻²⁰ J)
vdW force (A=2.5x10⁻¹⁹ J)
Figure 2.4. (a) A normalized AFM force curve obtained in water between gold surfaces hydrophobized in a 1 × 10⁻² mM C16SH-in-ethanol solution for 10 minutes. The dashed and dotted lines represent the force curves fitted to the DLVO theory with A131 = 1.2 × 10⁻²⁰ J and A131 = 2.5 × 10⁻¹⁹ J, respectively, for the gold-water-gold system. The solid line represents the experimental data fitted to the DLVO theory extended to include the contributions from the hydrophobic force. The hydrophobic force is represented by the single-exponential force law (F/R=Cexp(-H/D)) with C = -3.2 mN/m and D = 35 nm as fitting parameters. (b) The same data plotted on a log-log scale to show the goodness of the fit.
36
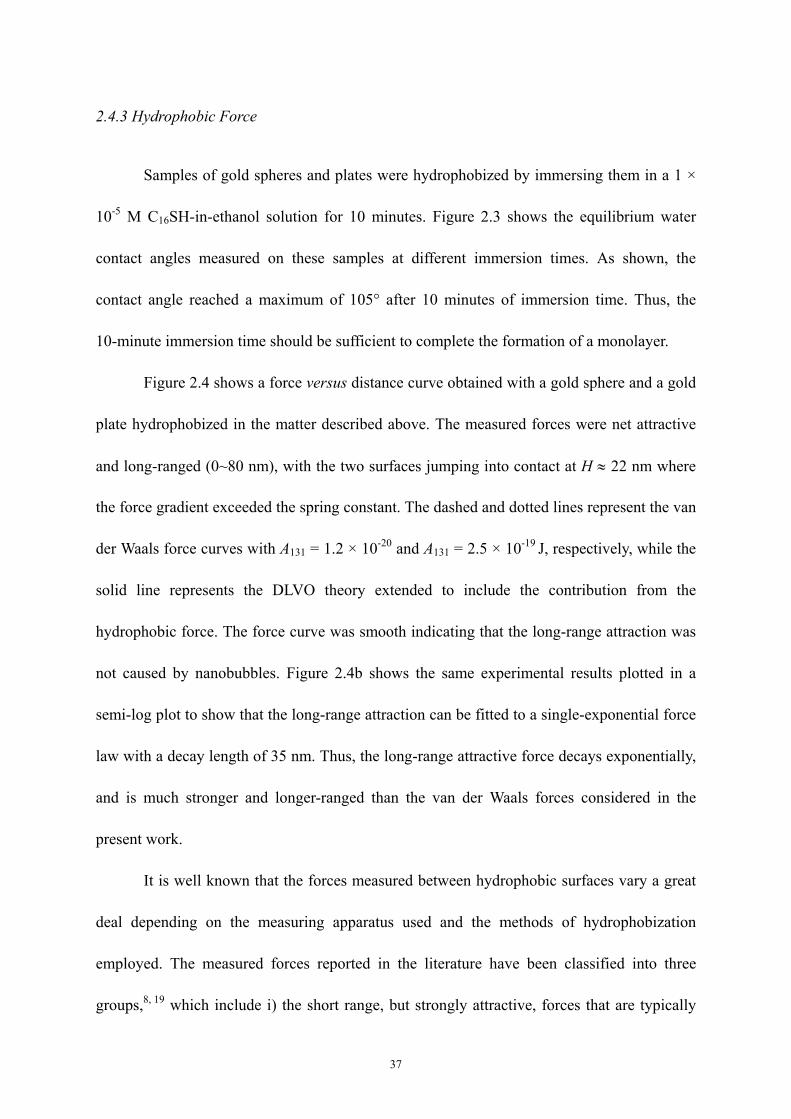
2.4.3 Hydrophobic Force
Samples of gold spheres and plates were hydrophobized by immersing them in a 1 ×
10-5 M C16SH-in-ethanol solution for 10 minutes. Figure 2.3 shows the equilibrium water
contact angles measured on these samples at different immersion times. As shown, the
contact angle reached a maximum of 105° after 10 minutes of immersion time. Thus, the
10-minute immersion time should be sufficient to complete the formation of a monolayer.
Figure 2.4 shows a force versus distance curve obtained with a gold sphere and a gold
plate hydrophobized in the matter described above. The measured forces were net attractive
and long-ranged (0~80 nm), with the two surfaces jumping into contact at H ≈ 22 nm where
the force gradient exceeded the spring constant. The dashed and dotted lines represent the van
der Waals force curves with A131 = 1.2 × 10⁻²⁰ and A131 = 2.5 × 10⁻¹⁹ J, respectively, while the
solid line represents the DLVO theory extended to include the contribution from the
hydrophobic force. The force curve was smooth indicating that the long-range attraction was
not caused by nanobubbles. Figure 2.4b shows the same experimental results plotted in a
semi-log plot to show that the long-range attraction can be fitted to a single-exponential force
law with a decay length of 35 nm. Thus, the long-range attractive force decays exponentially,
and is much stronger and longer-ranged than the van der Waals forces considered in the
present work.
It is well known that the forces measured between hydrophobic surfaces vary a great
deal depending on the measuring apparatus used and the methods of hydrophobization
employed. The measured forces reported in the literature have been classified into three
groups,8, 19 which include i) the short range, but strongly attractive, forces that are typically
37
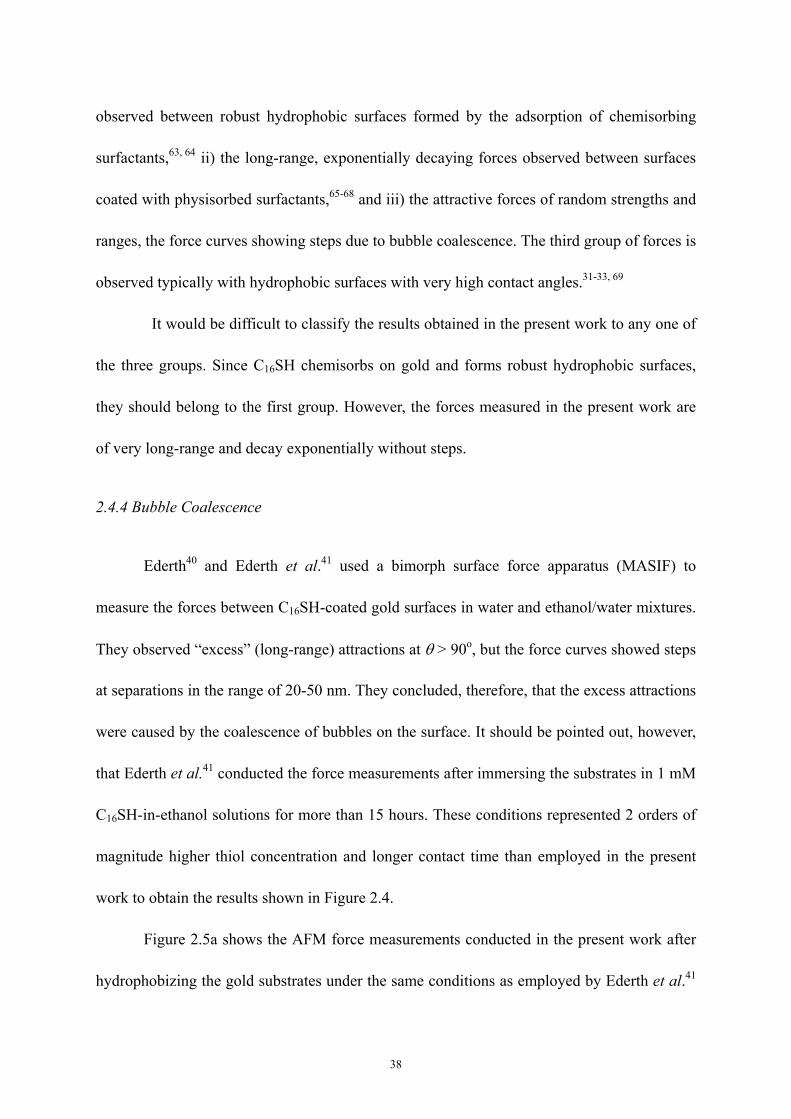
observed between robust hydrophobic surfaces formed by the adsorption of chemisorbing
surfactants,63, 64 ii) the long-range, exponentially decaying forces observed between surfaces
coated with physisorbed surfactants,65-68 and iii) the attractive forces of random strengths and
ranges, the force curves showing steps due to bubble coalescence. The third group of forces is
observed typically with hydrophobic surfaces with very high contact angles.31-33, 69
It would be difficult to classify the results obtained in the present work to any one of
the three groups. Since C16SH chemisorbs on gold and forms robust hydrophobic surfaces,
they should belong to the first group. However, the forces measured in the present work are
of very long-range and decay exponentially without steps.
2.4.4 Bubble Coalescence
Ederth40 and Ederth et al.41 used a bimorph surface force apparatus (MASIF) to
measure the forces between C16SH-coated gold surfaces in water and ethanol/water mixtures.
They observed “excess” (long-range) attractions at θ > 90o, but the force curves showed steps
at separations in the range of 20-50 nm. They concluded, therefore, that the excess attractions
were caused by the coalescence of bubbles on the surface. It should be pointed out, however,
that Ederth et al.41 conducted the force measurements after immersing the substrates in 1 mM
C16SH-in-ethanol solutions for more than 15 hours. These conditions represented 2 orders of
magnitude higher thiol concentration and longer contact time than employed in the present
work to obtain the results shown in Figure 2.4.
Figure 2.5a shows the AFM force measurements conducted in the present work after
hydrophobizing the gold substrates under the same conditions as employed by Ederth et al.41
38
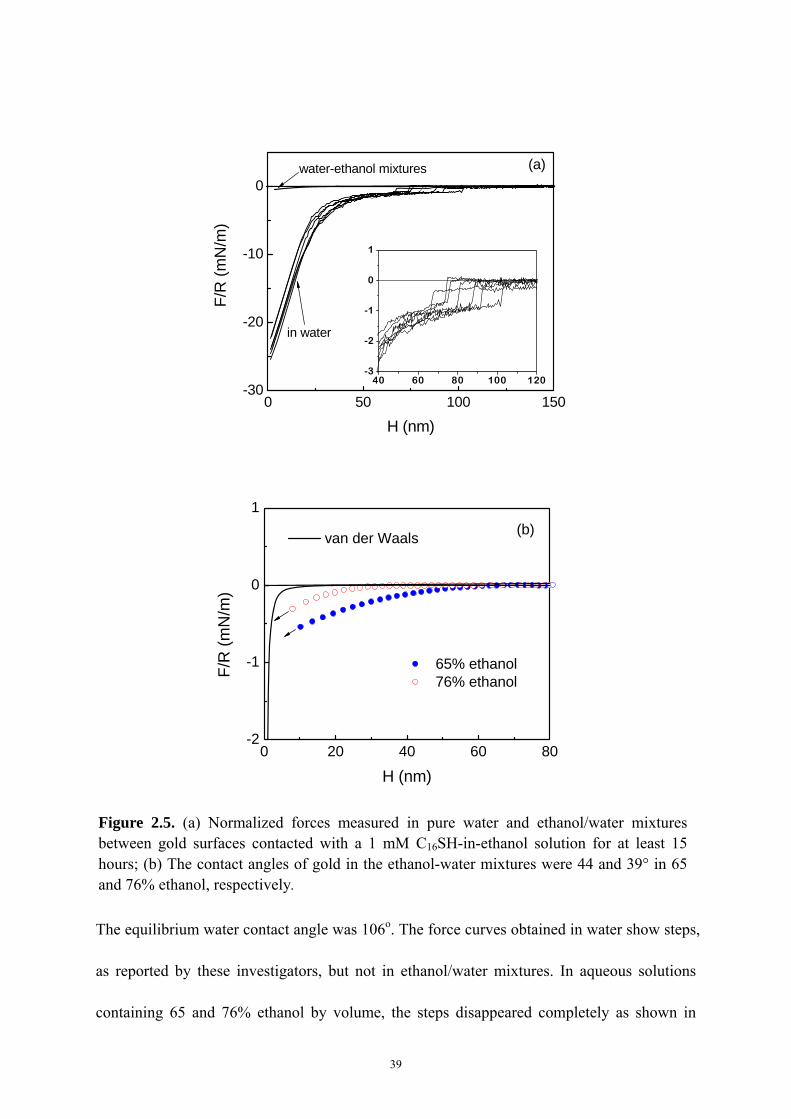
The equilibrium water contact angle was 106o. The force curves obtained in water show steps,
as reported by these investigators, but not in ethanol/water mixtures. In aqueous solutions
containing 65 and 76% ethanol by volume, the steps disappeared completely as shown in
39
0 50 100 150-30
-20
-10
0
40 60 80 100 120-3
-2
-1
0
1
F/R
(mN
/m)
H (nm)
water-ethanol mixtures
in water
(a)
0 20 40 60 80-2
-1
0
1
van der Waals
65% ethanol 76% ethanolF/
R (m
N/m
)
H (nm)
(b)
Figure 2.5. (a) Normalized forces measured in pure water and ethanol/water mixtures between gold surfaces contacted with a 1 mM C16SH-in-ethanol solution for at least 15 hours; (b) The contact angles of gold in the ethanol-water mixtures were 44 and 39° in 65 and 76% ethanol, respectively.
Figure 2.5b. This was not surprising because the contact angles were less than 90o, that is, 44
and 39o in 65 and 76% ethanol-in-water solutions, respectively. Under these conditions,
bubble nucleation is thermodynamically not possible. Therefore, the net-attractive forces
observed in the ethanol/water mixtures should be considered real hydrophobic forces. Note
here that the magnitudes of the attractive forces measured in the ethanol/water mixtures were
substantially less than in pure water, which may be attributed to the likelihood that the
network of hydrogen bonds in solution became weaker in the presence of ethanol. Effects of
ethanol on the AFM force measurements will be discussed further in detail in another
communication.
The results presented in Figure 2.5a show that nanobubbles can indeed be formed
when gold substrates are hydrophobized at a high thiol concentration for a long period of
time. It is possible that the thiol monolayer can have defects (or pits) in which air bubbles can
nucleate. It is possible that at lower concentrations (e.g., 1 × 10⁻² mM C16SH) and shorter
contact times smoother coatings are formed, which are less likely to trap nanobubbles and
hence give rise to force curves with no steps, as shown in Figure 2.4. Sakamoto et al.36 also
showed steps in their AFM force curves obtained with silica surfaces coated with C18TACl
solutions, and concluded that the long-range attractions were due to bridging bubbles. In
support of this claim, they showed that the long-range attractions disappeared when the
solution was degassed. On the other hand, Zhang et al.17 showed that long-range attractions
were still observed in degassed solutions. However, the long-range attractions observed in
degassed solutions were an order of magnitude weaker than those measured by Sakamoto et
al.36 Thus, the long-range attractions observed by Zhang et al.17 were considered true
40
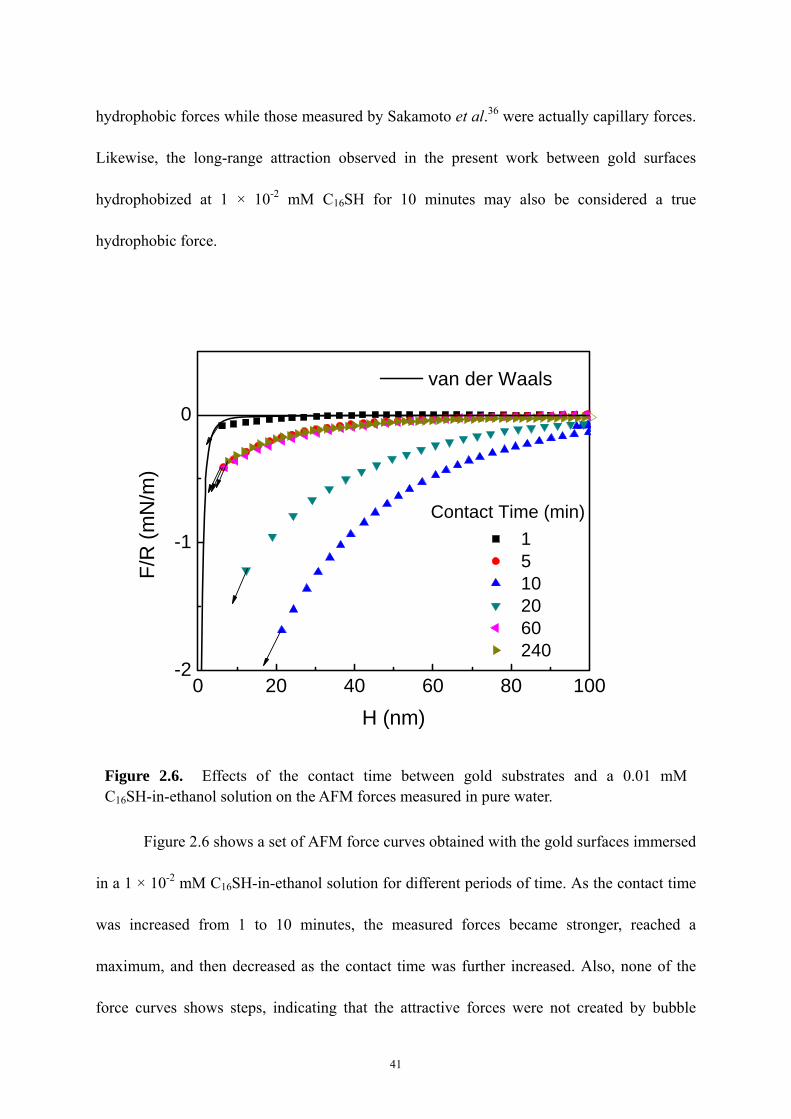
hydrophobic forces while those measured by Sakamoto et al.36 were actually capillary forces.
Likewise, the long-range attraction observed in the present work between gold surfaces
hydrophobized at 1 × 10⁻² mM C16SH for 10 minutes may also be considered a true
hydrophobic force.
0 20 40 60 80 100-2
-1
0
van der Waals
1 5 10 20 60 240
F/R
(mN
/m)
H (nm)
Contact Time (min)
Figure 2.6. Effects of the contact time between gold substrates and a 0.01 mM C16SH-in-ethanol solution on the AFM forces measured in pure water.
Figure 2.6 shows a set of AFM force curves obtained with the gold surfaces immersed
in a 1 × 10⁻² mM C16SH-in-ethanol solution for different periods of time. As the contact time
was increased from 1 to 10 minutes, the measured forces became stronger, reached a
maximum, and then decreased as the contact time was further increased. Also, none of the
force curves shows steps, indicating that the attractive forces were not created by bubble
41
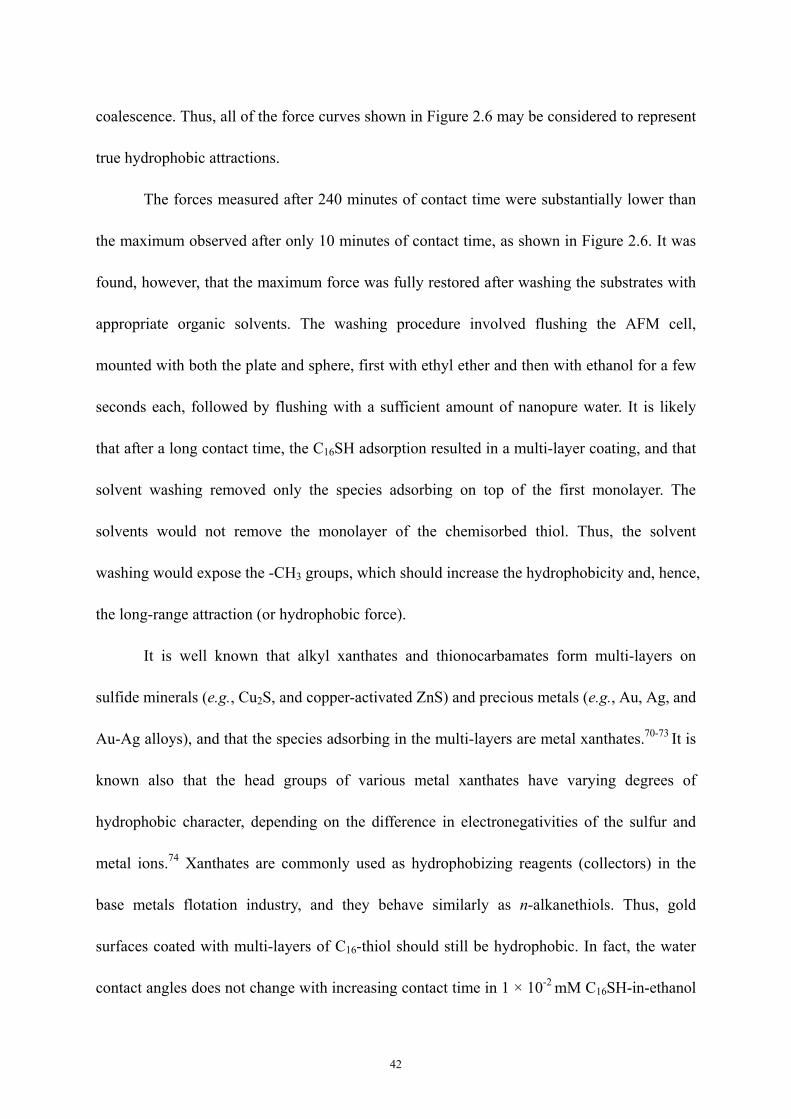
coalescence. Thus, all of the force curves shown in Figure 2.6 may be considered to represent
true hydrophobic attractions.
The forces measured after 240 minutes of contact time were substantially lower than
the maximum observed after only 10 minutes of contact time, as shown in Figure 2.6. It was
found, however, that the maximum force was fully restored after washing the substrates with
appropriate organic solvents. The washing procedure involved flushing the AFM cell,
mounted with both the plate and sphere, first with ethyl ether and then with ethanol for a few
seconds each, followed by flushing with a sufficient amount of nanopure water. It is likely
that after a long contact time, the C16SH adsorption resulted in a multi-layer coating, and that
solvent washing removed only the species adsorbing on top of the first monolayer. The
solvents would not remove the monolayer of the chemisorbed thiol. Thus, the solvent
washing would expose the -CH3 groups, which should increase the hydrophobicity and, hence,
the long-range attraction (or hydrophobic force).
It is well known that alkyl xanthates and thionocarbamates form multi-layers on
sulfide minerals (e.g., Cu2S, and copper-activated ZnS) and precious metals (e.g., Au, Ag, and
Au-Ag alloys), and that the species adsorbing in the multi-layers are metal xanthates.70-73 It is
known also that the head groups of various metal xanthates have varying degrees of
hydrophobic character, depending on the difference in electronegativities of the sulfur and
metal ions.74 Xanthates are commonly used as hydrophobizing reagents (collectors) in the
base metals flotation industry, and they behave similarly as n-alkanethiols. Thus, gold
surfaces coated with multi-layers of C16-thiol should still be hydrophobic. In fact, the water
contact angles does not change with increasing contact time in 1 × 10⁻² mM C16SH-in-ethanol
42
solutions, as shown in Figure 2.3, which makes it difficult to explain the restoration of the
full hydrophobic force by the solvent washing. One possible explanation would be that
thiol-coated gold surfaces become smoother after the solvent washing. It has been shown that
smoother surfaces gives stronger attractive forces.75
Figure 2.7. A model for the adsorption of C16SH on gold. The surface coverage and orientation are shown to change with the contact time in a 10-2 mM thiol-in-ethanol solution.
Figure 2.7 may depict a mechanism for the adsorption of C16SH on gold at a relatively
low concentration (e.g., 1 × 10⁻² mM). At a short contact time, the surface coverage will be
low, which may be responsible for a weak hydrophobic force. After an optimum contact time
of 10 minutes, a close-packed monolayer is formed, which gives rise to a maximum
43
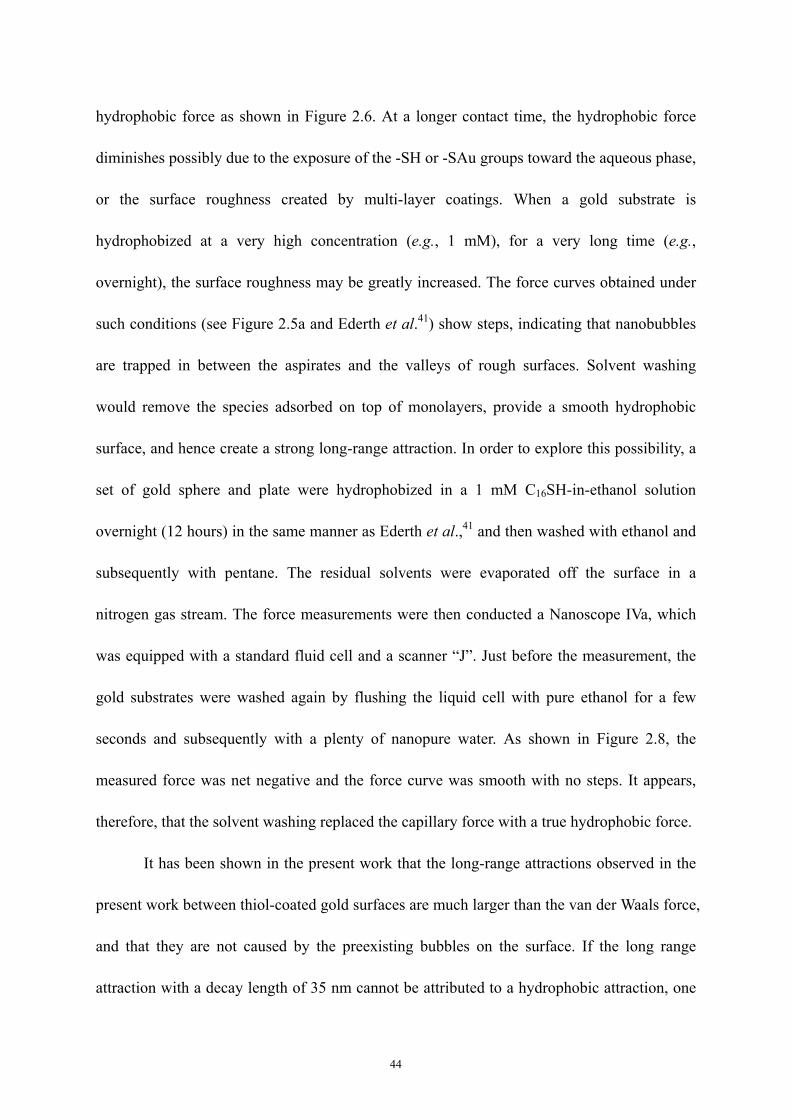
hydrophobic force as shown in Figure 2.6. At a longer contact time, the hydrophobic force
diminishes possibly due to the exposure of the -SH or -SAu groups toward the aqueous phase,
or the surface roughness created by multi-layer coatings. When a gold substrate is
hydrophobized at a very high concentration (e.g., 1 mM), for a very long time (e.g.,
overnight), the surface roughness may be greatly increased. The force curves obtained under
such conditions (see Figure 2.5a and Ederth et al.41) show steps, indicating that nanobubbles
are trapped in between the aspirates and the valleys of rough surfaces. Solvent washing
would remove the species adsorbed on top of monolayers, provide a smooth hydrophobic
surface, and hence create a strong long-range attraction. In order to explore this possibility, a
set of gold sphere and plate were hydrophobized in a 1 mM C16SH-in-ethanol solution
overnight (12 hours) in the same manner as Ederth et al.,41 and then washed with ethanol and
subsequently with pentane. The residual solvents were evaporated off the surface in a
nitrogen gas stream. The force measurements were then conducted a Nanoscope IVa, which
was equipped with a standard fluid cell and a scanner “J”. Just before the measurement, the
gold substrates were washed again by flushing the liquid cell with pure ethanol for a few
seconds and subsequently with a plenty of nanopure water. As shown in Figure 2.8, the
measured force was net negative and the force curve was smooth with no steps. It appears,
therefore, that the solvent washing replaced the capillary force with a true hydrophobic force.
It has been shown in the present work that the long-range attractions observed in the
present work between thiol-coated gold surfaces are much larger than the van der Waals force,
and that they are not caused by the preexisting bubbles on the surface. If the long range
attraction with a decay length of 35 nm cannot be attributed to a hydrophobic attraction, one
44
might consider the possibility that it originates from an electrostatic attraction between
charged patches.26 For this theory to work, however, it is necessary that the patch sizes be
large (larger than the size of hemimicelles) and mobile.76 The latter is unlikely in view of the
fact that thiols chemisorb on gold.77 Further, the thiolated gold has almost the same
ζ-potential as bare gold as shown in Table 2.1. What is left then would be the possibility that
the long-range attraction is related to the changes in water structure around hydrophobic
surfaces. A problem with this approach is that the computer simulations show that the
surface-induced water structure can be extended up to several layers of water molecules
only.78-80 As suggested by Ninham,81 the hydrophobic force may be related to the gas
molecules (oxygen and nitrogen) dissolved in water. At 1 atm, the concentration of the
dissolved gas molecules is 5 × 10⁻² M, above which the DLVO theory breaks down and the
Hofmeister effects begin to show up. It is possible that the dissolved gas molecules, which
are hydrophobic and are likely to concentrate near hydrophobic surfaces, may promote the
structuring of water at larger distances away from hydrophobic surfaces. In degassed
solutions, the surface-induced structuring may not be extended too far into the solution,
thereby making the hydrophobic force disappear,82 or only the short-range hydrophobic force
remain.37
Although the force measurements conducted by Zhang et al.17 in degassed solutions
showed long-range forces, it would be difficult to claim that the AFM cell was completely
sealed off from the ambient during the measurement. Thus, the long-range force observed by
Zhang et al. could have been affected by a small amount of dissolved gases still present in the
system. Pashley et al.82-85 showed recently that hydrocarbon oils can be readily emulsified in
45
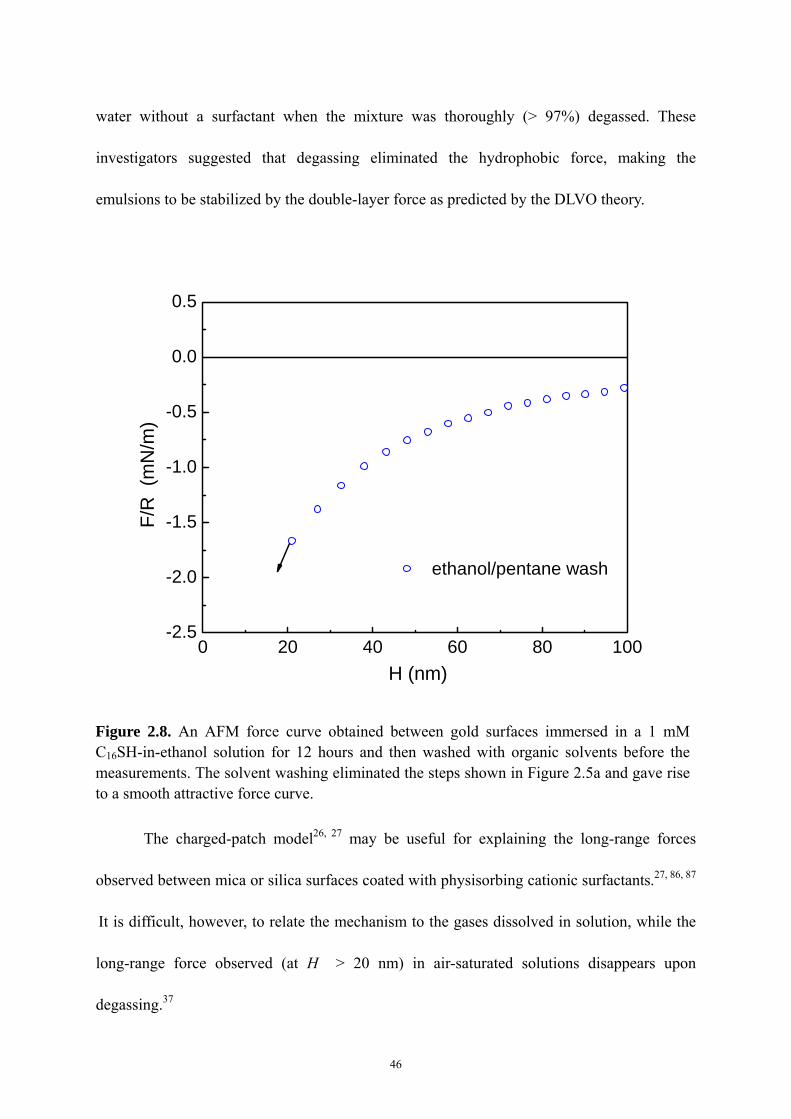
water without a surfactant when the mixture was thoroughly (> 97%) degassed. These
investigators suggested that degassing eliminated the hydrophobic force, making the
emulsions to be stabilized by the double-layer force as predicted by the DLVO theory.
0 20 40 60 80 100-2.5
-2.0
-1.5
-1.0
-0.5
0.0
0.5
F/R
(m
N/m
)
H (nm)
ethanol/pentane wash
Figure 2.8. An AFM force curve obtained between gold surfaces immersed in a 1 mM C16SH-in-ethanol solution for 12 hours and then washed with organic solvents before the measurements. The solvent washing eliminated the steps shown in Figure 2.5a and gave rise to a smooth attractive force curve.
The charged-patch model26, 27 may be useful for explaining the long-range forces
observed between mica or silica surfaces coated with physisorbing cationic surfactants.27, 86, 87
It is difficult, however, to relate the mechanism to the gases dissolved in solution, while the
long-range force observed (at H > 20 nm) in air-saturated solutions disappears upon
degassing.37
46
2.5 Conclusions
The Hamaker constant for the gold-gold interactions in water was determined to be
1.2 × 10⁻²⁰ J by fitting the AFM force curves obtained between bare gold surfaces to the
DLVO theory. This value is close to that (1.26 × 10⁻²⁰ J) determined using the methylene
iodide contact angle method. However, these values are substantially lower than those (2.5~4
× 10-19 J) obtained from the Lifshitz theory. The lower Hamaker constants measured in the
present work may be due to possible contamination of the gold surface, which may be
difficult to avoid in view of the large Hamaker constant of the heavy metal.
AFM force measurements were also conducted using gold surfaces hydrophobized by
the self-assembly of 1-hexadecanethiol. When the surfaces were hydrophobized in a 1 mM
thiol-in- ethanol solution longer than 6 hours, the measured forces were net-attractive and
long-ranged. However, the force curves exhibited steps, indicating that the measured forces
were due to bridging bubbles. Bubble nucleation was warranted as the water contact angles of
the thiolated gold surfaces were over 90o. These results were in agreement with those of
Ederth et al.40 When the AFM force measurements were conducted in ethanol/water mixtures,
the contact angles became less than 90o, and hence prevented bubble nucleation and gave rise
to smooth force curves without steps. The measured forces were weaker than in pure water,
but were still net attractive, long-ranged, and stronger than the van der Waals force.
When the gold substrates were hydrophobized in a dilute (1 × 10⁻² mM) thiol solution
at a relatively short contact time (10 minutes), a long-range attractive force which decayed
exponentially with a decay length of 35 nm was obtained. The force curve exhibited no steps
indicating that the long-range attraction was not due to bridging bubbles. Steps appeared
47
when the gold substrates were hydrophobized in a strong (1 mM) thiol solution at a long
contact time (overnight). When the force measurements were conducted after washing the
substrates with appropriate solvents, the steps in force curves disappeared and long-range
hydrophobic forces appeared.
The results obtained in the present work show that the long-range attraction observed
between thiolated gold surfaces in water and ethanol solutions are not due to bridging
nanobubbles or electrostatic attraction between charged patches. This leaves the possibility
that the long-range attraction is caused by the changes in water structure near hydrophobic
surfaces. Further work is needed to obtain stronger evidence that the long-range hydrophobic
forces are indeed of structural origin.
2.6 Acknowledgement
The authors would like to express their sincere appreciation to Professor Jan Christer
Eriksson for his encouragement and helpful discussions. They would also like to
acknowledge the financial support from the National Energy Technology Laboratory, U.S.
Department of Energy (DE-FC26-02NT41607).
2.7 References
1. Xu, Z.; Yoon, R.-H., J. Colloid Interface Sci. 1989, 132, (2), 532-541.
2. Xu, Z.; Yoon, R.-H., J. Colloid Interface Sci. 1990, 134, (2), 427-434.
3. Israelachvili, J. N.; Pashley, R. M., J. Colloid Interface Sci. 1984, 98, (2), 500-514.
4. Pashley, R. M.; Mcguiggan, P. M.; Ninham, B. W., Science 1985, 229, 1088-1089.
48
5. Claesson, P. M.; Christenson, H. K., J. Phys. Chem 1988, 92, 1650-1655.
6. Rabinovich, Y. I.; Derjaguin, B. V., Colloids Surf. 1988, 30, 243-251.
7. Parker, J. L.; Cho, D. L.; Claesson, P. M., J. Phys. Chem. 1989, 93, 6121-6125.
8. Christenson, H. K.; Claesson, P. M., Adv. Colloid Interface Sci. 2001, 91, 391-436.
9. Derjaguin, B. V.; Churaev, N. V., Colloids Surf. 1989, 41, 223-237.
10. Churaev, N. V., Usp. Kolloidn, Khim., FAN, Tashkent 1987, 70-78.
11. Blake, T. D.; Kitchener, J. A., J. Chem. Soc., Faraday Trans. 1 1972, 68, 1435-1442.
12. Hough, D. B.; White, L. R., Adv. Colloid Interface Sci. 1980, 14, 3-41.
13. Laskowski, J.; Kitchener, J. A., J. Colloid Interface Sci. 1969, 29, 670-679.
14. Israelachvili, J. N.; Pashley, R. M., Nature 1982, 300, 341-342.
15. Rabinovich, Y. I.; Yoon, R.-H., Langmuir 1994, 10, 1903-1909.
16. Eriksson, J. C.; Ljunggren, S.; Claesson, P. M., J. Chem. Soc., Faraday Trans. 2 1989, 85,
(3), 163-176.
17. Zhang, J.; Yoon, R.-H.; Mao, M.; Ducker, W. A., Langmuir 2005, 21, 5831-5841.
18. Yoon, R.-H.; Pazhianur, R., Colloids and Surf., A 1998, 144, 59-69.
19. Meyer, E. E.; Rosenberg, K. J.; Israelachvili, J., Proc. Nat. Acad. Sci. U.S.A 2006, 103,
15739-15746.
20. Yoon, R.-H., Aufbereit. Tech 1991, 32, 474-485.
21. Yoon, R.-H.; Mao, L., J. Colloid Interface Sci. 1996, 181, 613-626.
22. Mao, L.; Yoon, R.-H., Int. J. Miner. Process 1997, 51, 171-181.
23. Eriksson, J. C.; Yoon, R.-H., Hydrophobic Attraction in the Light of Thin-Film
Thermodynamics. In Colloid Stability: The Role of Surface Forces, Tadros, T. F., Ed.
49
WILEY-VCH Verlag GmbH & Co. KGaA: Weinheim, Germany, 2007; Vol. 1, pp 99-132.
24. Yoon, R.-H.; Wang, L., Hydrophobic Forces in Foam Films. In Colloid Stability. The
Role of Surface Forces-Part I, Tadros, T. F., Ed. Wiley-VCH: 2007; Vol. 1, pp 161-186.
25. Eriksson, J. C.; Henriksson, U., Langmuir 2007, 23, 10026-10033.
26. Miklavic, S. J.; Chan, D. Y. C.; White, L. R.; Healy, T. W., J. Phys. Chem. 1994, 98,
9022-9032.
27. Meyer, E. E.; Lin, Q.; Hassenkam, T.; Oroudjev, E.; Israelachvili, J. N., Proc. Nat. Acad.
Sci. U.S.A 2005, 102, 6839-6842.
28. Tsao, Y.-H.; Evans, D. F.; Wennerstrom, H., Science 1993, 262, (5133), 547-550.
29. Yoon, R.-H.; Ravishankar, S. A. R., J. Colloid Interface Sci. 1996, 179, 391-402.
30. Christenson, H. K.; Claesson, P. M., Science 1988, 239, 390-392.
31. Tyrrell, J. W. G.; Attard, P., Langmuir 2002, 18, 160-167.
32. Attard, P.; Moody, M. P.; Tyrrell, J. W. G., Physica A 2002, 314, 696-705.
33. Parker, J. L.; Claesson, P. M.; Attard, P., J. Phys. Chem. 1994, 98, 8468-8480.
34. Nguyen, A. V.; Nalaskowski, J.; Miller, J. D.; Butt, H.-J., Int. J. Miner. Process. 2003, 72,
215-225.
35. Yang, J.; Duan, J.; Fornasiero, D.; Ralston, J., J. Phys. Chem. B 2003, 107, 6139-6147.
36. Sakamoto, M.; Kanda, Y.; Miyahara, M.; Higashitani, K., Langmuir 2002, 18,
5713-5719.
37. Meyer, E. E.; Lin, Q.; Israelachvili, J. N., Langmuir 2005, 21, 256-259.
38. Bain, C. D.; Troughton, E. B.; Tao, Y.-T.; Evall, J.; Whitesides, G. M.; Nuzzo, R. G., J.
Am. Chem. Soc. 1989, 111, 321-335.
50
39. Christenson, H. K.; Yaminsky, V. V., Colloids Surf., A 1997, 129-130, 67-74.
40. Ederth, T., J. Phys. Chem. B 2000, 104, 9704-9712.
41. Ederth, T.; Claesson, P.; Liedberg, B., Langmuir 1998, 14, 4782-4789.
42. Ron, H.; Rubinstein, I., Langmuir 1994, 10, 4566-4573.
43. Ron, H.; Rubinstein, I., J. Am. Chem. Soc. 1998, 120, 13444-13452.
44. Kane, V.; Mulvaney, P., Langmuir 1998, 14, 3303-3311.
45. Giesbers, M.; Kleijin, J. M.; Stuart, M. A. C., J. Colloid Interface Sci. 2002, 252,
138-148.
46. Hillier, A. C.; Kim, S.; Bard, A. J., J. Phys. Chem. 1996, 100, 18808-18817.
47. Biggs, S.; Mulvaney, P., J. Chem. Phys. 1994, 100, (11), 8501-8505.
48. Sondag-Huethorst, J. A. M.; Fokkink, L. G. J., Langmuir 1992, 8, 2560-2566.
49. Karpovich, D. S.; Blanchard, G. J., Langmuir 1994, 10, 3315-3322.
50. Cleveland, J. P.; Manne, S.; Bocek, D.; Hansma, P. K., Rev. Sci. Instrum. 1993, 64, (2),
403-405.
51. Ohshima, H.; Healy, T. W.; White, L. R., J. Colloid Interface Sci. 1982, 89, 484-493.
52. Israelachvili, J. N., Proc. R. Soc. London, Ser. A 1972, 331, 39-55.
53. Oss, C. J. v., Interfacial Forces in Aqueous Media. 2 ed.; CRC Press: 2006.
54. Fowkes, F. M., Ind. Eng. Chem. 1964, 56, (12), 40-52.
55. Thelen, E., J. Phys. Chem. 1967, 71, (6), 1946-1948.
56. Biggs, S.; Mulvaney, P.; Zukoski, C. F.; Grieser, F., J. Am. Chem. Soc. 1994, 116, (20),
9150-9157.
57. Ducker, W. A.; Senden, T. J., Langmuir 1992, 8, 1831-1836.
51
58. Larson, I.; Chan, D. Y. C.; Drummond, C. J.; Grieser, F., Langmuir 1997, 13, 2429-2431.
59. Wall, J. F.; Grieser, F.; Zukoski, C. F., J. Chem. Soc., Faraday Trans. 1997, 93, (22),
4017-4020.
60. Dagastine, R. R.; Grieser, F., Langmuir 2004, 20, 6742-6747.
61. Considine, R. F.; Drummond, C. J., langmuir 2001, 17, 7777-7783.
62. Bhattacharjee, S.; Ko, C.-H.; Elimelech, M., Langmuir 1998, 14, 3365-3375.
63. Parker, J. L.; Claesson, P. M., Langmuir 1994, 10, 635-639.
64. Parker, J. L.; Claesson, P. M.; Wang, J.-H.; Yasuda, H. K., Langmuir 1994, 10,
2766-2773.
65. Claesson, P. M.; Blom, C. E.; Herder, P. C.; Ninham, B. W., J. Colloid Interface Sci.
1986, 114, (1), 234-242.
66. Lin, Q.; Meyer, E. E.; Tadmor, M.; Israelachvili, J. N.; Kuhl, T. L., Langmuir 2005, 21,
251-255.
67. Christenson, H. K.; Fang, J.; Ninham, B. W.; Parker, J. L., J. Phys. Chem. 1990, 94,
8004-8006.
68. Hato, M., J. Phys. Chem. 1996, 100, 18530-18538.
69. Ishida, N.; Sakamoto, M.; Miyahara, M.; Higashitani, K., Langmuir 2000, 16, (13),
5681-5687.
70. Mielczarski, J. A.; Yoon, R.-H., J. Phys. Chem. 1989, 93, 2034-2038.
71. Mielczarski, J. A.; Yoon, R.-H. In Proceedings of the Engineering Foundation
Conference, Palm Coast, Florida, January 10-15, 1989; Moudgil, B. M.; Scheiner, B. J., Eds.
United Engineering Trustees, Inc., New York: Palm Coast, Florida, 1989; pp 619-630.
52
72. Mielczarski, J. A.; Yoon, R.-H., J. Colloid Interface Sci. 1989, 131, (2), 423-432.
73. Mielczarski, J. A.; Yoon, R.-H., Langmuir 1991, 7, 101-106.
74. Leja, J., Surface Chemistry of Froth Flotation. In Plenum Press: Vancouver, 1982; p 510.
75. Walz, J. Y.; Suresh, L.; Piech, M., J. Nanopart. Res. 1999, 1, 99-113.
76. Zhang, J.; Yoon, R.-H.; Eriksson, J. C., Colloids Surf., A 2007, 300, 335-345.
77. Ulman, A., Chem. Rev. 1996, 96, (4), 1533-1554.
78. Fa, K.; Nguyen, A. V.; Miller, J. D., J. Phys. Chem. 2005, 109, (27), 13112-13118.
79. Forsman, J.; Jonsson, B.; Woodward, C. E., J. Phys. Chem. 1996, 100, (36),
15005-15010.
80. Sakurai, M.; Tamagawa, H.; Ariga, K.; Kunitake, T.; Inoue, Y., Chem. Phys. Lett. 1998,
289, 567-571.
81. Ninham, B. W., Prog. Colloid Polym. Sci. 2006, 133, 65-73.
82. Maeda, N.; Rosenberg, K. J.; Israelachvili, J. N.; Pashley, R. M., Langmuir 2004, 20,
3129-3137.
83. Pashley, R. M., J. Phys. Chem. B 2003, 107, 1714-1720.
84. Francis, M. J.; Gulati, N.; Pashley, R. M., J. Colloid Interface Sci. 2006, 299, 673-677.
85. Francis, M. J.; Pashley, R. M., Colloids Surf., A 2006, 287, 36-43.
86. Tsao, Y.-H.; Evans, D. F.; Wennerstrom, H., Langmuir 1993, 9, 779-785.
87. Claesson, P. M.; Herder, P. C.; Blom, C. E.; Ninham, B. W., J. Colloid Interface Sci.
1987, 118, 68-79.
53
Chapter 3
Surface Force Measurements between Gold Surfaces Hydrophobized with Alkanethiols of Different Chain Lengths
3.1 Abstract
An atomic force microscope (AFM) was used to measure the surface forces between
two macroscopic gold surfaces. A microsphere of gold and a gold-coated glass plate were
immersed in thiol-in-ethanol (1 × 10⁻² mM or 1 mM) solutions to hydrophobize the surfaces.
The degree of hydrophobization was controlled by varying immersion time and using thiols
of different chain lengths. In the present work, alkanethiols, such as ethanethiol (C2SH),
1-butanethiol (C4SH), 1-dodecanethiol (C12SH) and 1-hexadecanethiol (C16SH) were used.
The equilibrium water contact angle obtained with C2SH was 67º. The contact angles were
greater than 90º on gold surfaces coated with the other thiols of longer chain lengths.
Regardless of whether the contact angle was larger than 90º or not, the force curves obtained
were smooth and showed no steps, and the measured forces were substantially larger and
longer-ranged than the van der Waals force. When the thiol-coated surfaces were exposed for
prolonged periods of times in the atmospheric air or contaminated, discontinuities or steps on
the force curves were observed. The maximum equilibrium water contact angles obtained
with C4SH, C12SH and C16SH were 94º, 105º and 105º, respectively, and the strongest
hydrophobic attractions were measured on surfaces exhibiting maximum contact angles. The
strongest hydrophobic force measured on C4SH-coated gold was weaker than those measured
on C12SH- and C16SH-coated gold surfaces. The latter two surfaces were indistinguishable
54
with respect to the measured strongest hydrophobic forces.
It was found that the strengths and ranges of the hydrophobic attractive forces
decreased in the presence of NaCl electrolyte and a cationic surfactant C12TACl. The decay
lengths of the hydrophobic forces were not equal to one half of the Debye lengths, contrary to
the predictions from the electrostatic models. The results obtained in the present work suggest
that the long-range attractions measured may represent true hydrophobic forces originating
from the structural change of water in the vicinity of hydrophobic surfaces. Solvable foreign
species added to the system, e.g., cationic surfactant C12TACl and NaCl, break the hydrogen
bond network, and reduce the hydrophobic forces.
3.2 Introduction
The classic Derjaguin-Landau-Verwey-Overbeek (DLVO) theory, which combines the
effects of the van der Waals attraction and electrostatic double layer repulsion, has been
successfully applied to many colloidal systems. However, some colloidal systems comprising
hydrophobic particles1, 2 or oil droplets3 exhibit additional attraction which is much stronger
than the van der Waals force considered in DLVO theory. Early experiments carried out in
1972 by Blake and Kitchener4 on the stability of wetting films sandwiched between an air
bubble and hydrophobic silica indicated the existence of a long-range hydrophobic attraction
force. In 1982, the hydrophobic force was first measured directly by Israelachvili and
Pashley5 on two mica surfaces hydrophobized by the in-situ adsorption of
hexadecyltrimethylammonium bromide (CTAB) in aqueous solutions using a surface force
apparatus (SFA). The pioneering works of Blake and Kitchener, and Israelachvili and Pashley
55
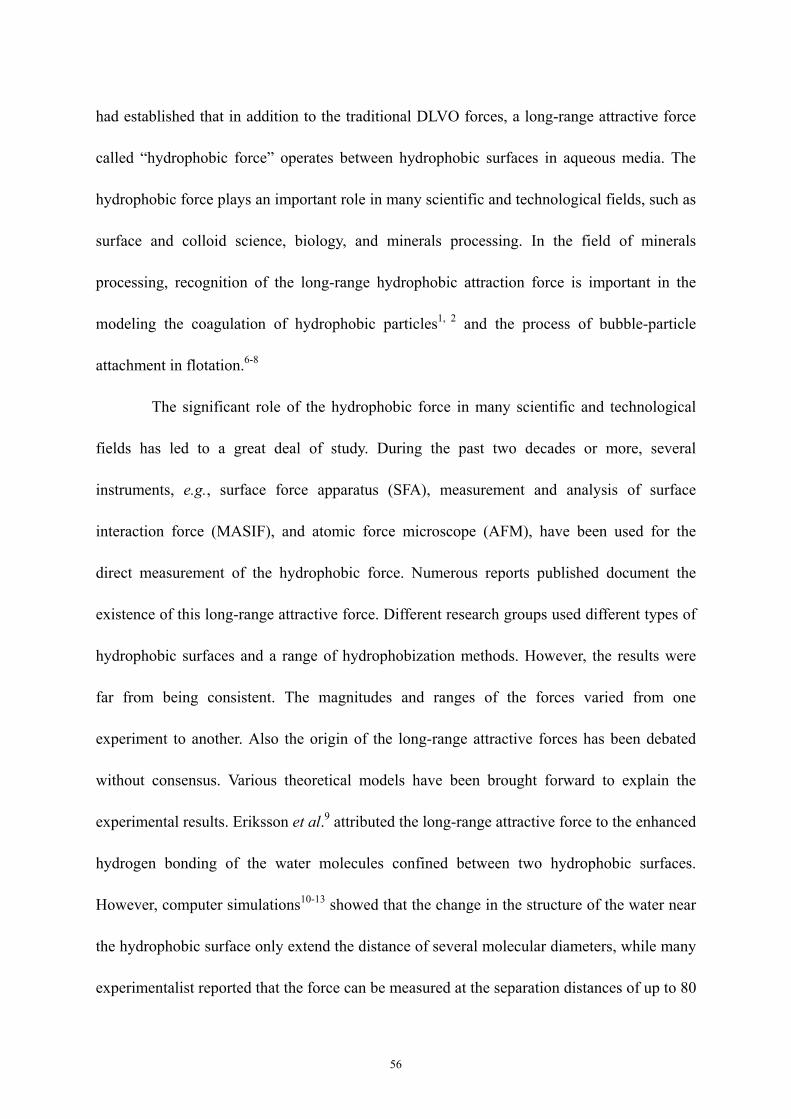
had established that in addition to the traditional DLVO forces, a long-range attractive force
called “hydrophobic force” operates between hydrophobic surfaces in aqueous media. The
hydrophobic force plays an important role in many scientific and technological fields, such as
surface and colloid science, biology, and minerals processing. In the field of minerals
processing, recognition of the long-range hydrophobic attraction force is important in the
modeling the coagulation of hydrophobic particles1, 2 and the process of bubble-particle
attachment in flotation.6-8
The significant role of the hydrophobic force in many scientific and technological
fields has led to a great deal of study. During the past two decades or more, several
instruments, e.g., surface force apparatus (SFA), measurement and analysis of surface
interaction force (MASIF), and atomic force microscope (AFM), have been used for the
direct measurement of the hydrophobic force. Numerous reports published document the
existence of this long-range attractive force. Different research groups used different types of
hydrophobic surfaces and a range of hydrophobization methods. However, the results were
far from being consistent. The magnitudes and ranges of the forces varied from one
experiment to another. Also the origin of the long-range attractive forces has been debated
without consensus. Various theoretical models have been brought forward to explain the
experimental results. Eriksson et al.9 attributed the long-range attractive force to the enhanced
hydrogen bonding of the water molecules confined between two hydrophobic surfaces.
However, computer simulations10-13 showed that the change in the structure of the water near
the hydrophobic surface only extend the distance of several molecular diameters, while many
experimentalist reported that the force can be measured at the separation distances of up to 80
56
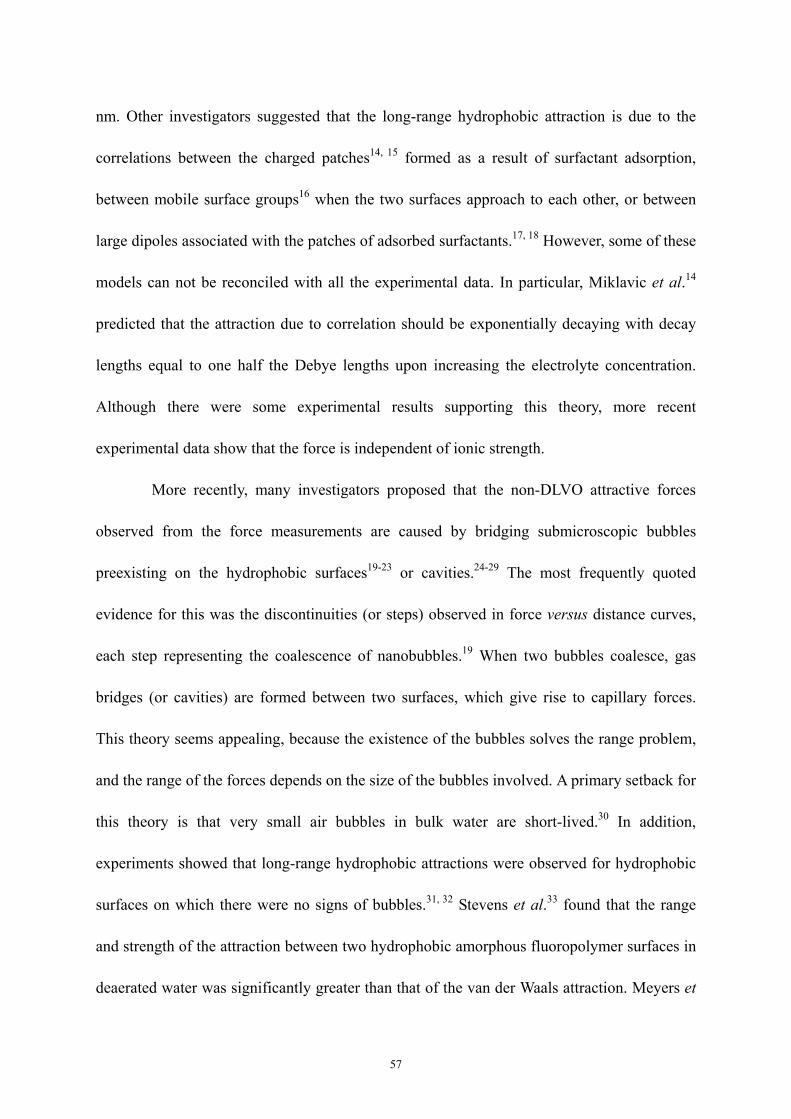
nm. Other investigators suggested that the long-range hydrophobic attraction is due to the
correlations between the charged patches14, 15 formed as a result of surfactant adsorption,
between mobile surface groups16 when the two surfaces approach to each other, or between
large dipoles associated with the patches of adsorbed surfactants.17, 18 However, some of these
models can not be reconciled with all the experimental data. In particular, Miklavic et al.14
predicted that the attraction due to correlation should be exponentially decaying with decay
lengths equal to one half the Debye lengths upon increasing the electrolyte concentration.
Although there were some experimental results supporting this theory, more recent
experimental data show that the force is independent of ionic strength.
More recently, many investigators proposed that the non-DLVO attractive forces
observed from the force measurements are caused by bridging submicroscopic bubbles
preexisting on the hydrophobic surfaces19-23 or cavities.24-29 The most frequently quoted
evidence for this was the discontinuities (or steps) observed in force versus distance curves,
each step representing the coalescence of nanobubbles.19 When two bubbles coalesce, gas
bridges (or cavities) are formed between two surfaces, which give rise to capillary forces.
This theory seems appealing, because the existence of the bubbles solves the range problem,
and the range of the forces depends on the size of the bubbles involved. A primary setback for
this theory is that very small air bubbles in bulk water are short-lived.30 In addition,
experiments showed that long-range hydrophobic attractions were observed for hydrophobic
surfaces on which there were no signs of bubbles.31, 32 Stevens et al.33 found that the range
and strength of the attraction between two hydrophobic amorphous fluoropolymer surfaces in
deaerated water was significantly greater than that of the van der Waals attraction. Meyers et
57
al.34 conducted SFA force measurements between mica surfaces coated by a
Langmuir-Blodgett (LB)-deposited hydrophobic monolayer of DODAB both in the presence
and absence of dissolved gases. In the presence of dissolved gases, they observed long-range
attractive forces, while in degassed solutions only short-range attraction forces (under ~ 250
Å) were observed. They concluded, therefore, that ‘true’ hydrophobic force exists even in
degassed solutions.
Ederth and Liedberg35 and Ederth23 have conducted direct force measurement
between thiolated-gold surfaces in water, water/ethanol mixtures by MASIF. The wettability
of the surfaces was controlled by changing the mole ratios of 1-hexadecanethiol (C16SH) and
16-hydroxyhexanedecanethiol (HOC16SH), and by changing the mixing ratios between water
and ethanol. They showed that when the contact angle of the thiolated-gold surface was larger
than 90º, long-range attractions with step-like profiles which were observed due to the
coalescences of microscopic air bubbles on the surfaces. When the contact angle was less
than 90º, the attraction was actually the same as the van der Waals attraction. In the present
work, an AFM force microscope was used to measure the surface forces between two
macroscopic gold surfaces in water, aqueous NaCl electrolytes and cationic surfactant
dodecyltrimethylammonium chloride (C12TACl) solutions. We also chose the self-assembled
monolayers of thiols on gold as interacting surfaces, because they are robust, well
characterized and easy to prepare. Spheres of gold and gold-coated glass plates were
immersed in quiescent thiol-in-ethanol solutions to hydrophobize the gold surfaces. The
degree of hydrophobization was controlled by varying immersion times or using thiols of
different chain lengths. The results are used to test existing theoretical models and discuss the
58
possible origins of the long-range hydrophobic force.
3.3 Materials and Methods
3.3.1 Materials
A Millipore direct-Q 3 ultrapure (Millipore, MA) water system was purchased and
used to obtain deionized water with a resistivity of 18.2 MΩ/cm at 25ºC. Alkanethiol such as
ethanethiol (C2SH, 98%, TCI America), 1-butanethiol (C4SH, 99%, Aldrich), 1-dodecanethiol
(C12SH, 98%, Aldrich) and 1-hexadecanethiol (C16SH, 97%, TCI America) dissolved in 200
proof ethanol (AAPER alcohol) were used to hydrophobize the gold surfaces. They were
used without further purification. Sulfuric acid (98%) from Fisher Scientific and hydrogen
peroxide (H2O2, 29−32% w/w) from Alfa Aesar were used as received to clean gold plates.
Sodium Chloride (99.999%, Sigma-Aldrich) was roasted in air at 560ºC to decompose
organic impurities and dissolved in pure water. Dodecyltrimethylammonium chloride
(C12TACl, 99%) was purchased from Acros Organics Co. Gold wire (0.0127 mm dia, 99.9%,
Alfa Aesar) was used to make gold microspheres.
Gold microspheres and gold-coated glass plate were used for AFM force
measurements. The gold-coated glass plates were produced by depositing pure gold on a
clean glass slide using a vacuum evaporator. A 50 Å chromium layer was deposited first on
the glass prior to coating it with a thin-layer (500 Å) of pure gold. The chromium coating was
necessary to achieve strong bonding between gold and substrate. The AFM image showed
that the flat gold surfaces were smooth, with maximum peak-to-valley distance of 3.3 nm.
Gold spheres with appropriate diameters were produced according to the procedure
59
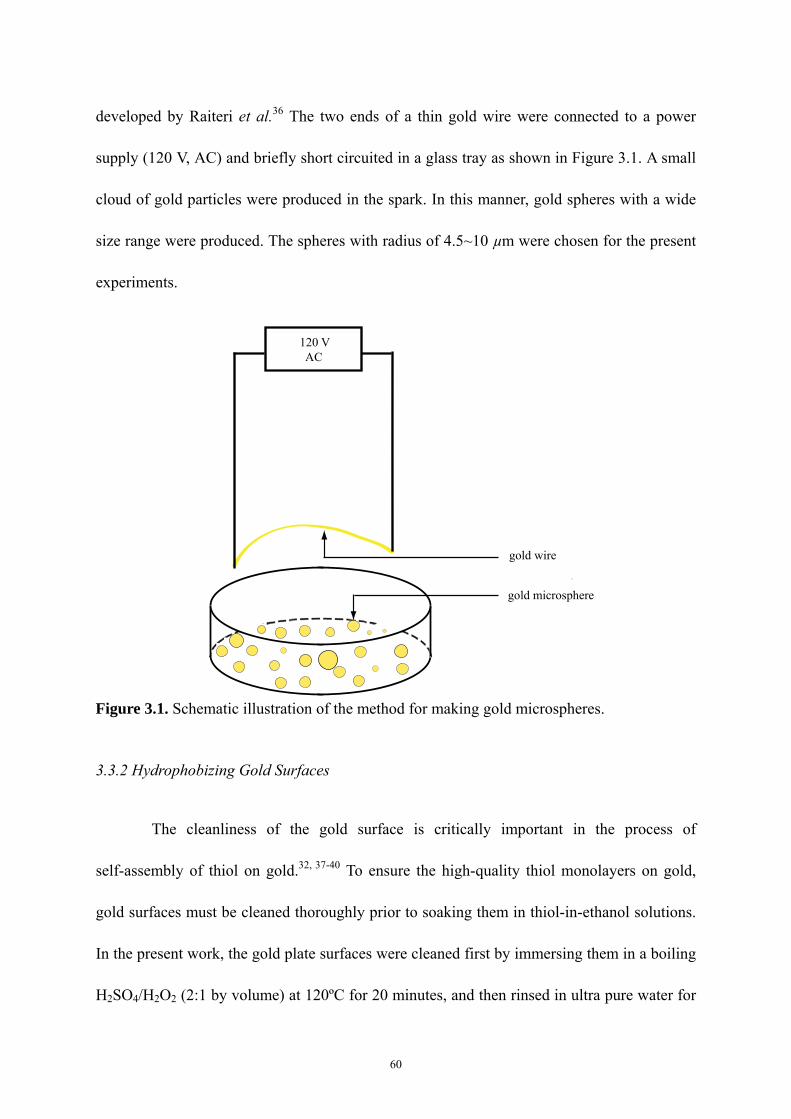
developed by Raiteri et al.36 The two ends of a thin gold wire were connected to a power
supply (120 V, AC) and briefly short circuited in a glass tray as shown in Figure 3.1. A small
cloud of gold particles were produced in the spark. In this manner, gold spheres with a wide
size range were produced. The spheres with radius of 4.5~10 µm were chosen for the present
experiments.
120 VAC
gold wire
gold microsphere
Figure 3.1. Schematic illustration of the method for making gold microspheres.
3.3.2 Hydrophobizing Gold Surfaces
The cleanliness of the gold surface is critically important in the process of
self-assembly of thiol on gold.32, 37-40 To ensure the high-quality thiol monolayers on gold,
gold surfaces must be cleaned thoroughly prior to soaking them in thiol-in-ethanol solutions.
In the present work, the gold plate surfaces were cleaned first by immersing them in a boiling
H2SO4/H2O2 (2:1 by volume) at 120ºC for 20 minutes, and then rinsed in ultra pure water for
60
1 minute, followed by ethanol wash for 2 minutes to remove the oxides produced in the
piranha solution. After cleaning, the gold plates were immediately exposed to quiescent thiol
solutions for hydrophobization in a fume hood. For the case of gold spheres, cleaning
procedure was performed after they had been glued onto the tips of AFM cantilever springs.
To prevent gold spheres from being washed away by strong acid solution, before
hydrophobization, each gold sphere was flushed with ethanol, irradiated by a UV lamp (λ =
254 nm) for 2 hours to remove possible organic contaminants, and then rinsed with ethanol
again.
The cleaned gold plates and spheres were hydrophobized by soaking them in
thiol-in-ethanol solutions at room temperature via chemical reaction. To ensure the accuracy
of the force measurement, for every set of experiment, only the fresh thiol surfactants were
used to prepare thiol-in-ethanol solutions, because the thiol surfactant in ethanol will degrade
with time. After hydrophobization, the gold substrates were washed with ethanol and then
dried in a nitrogen gas stream. For a given force measurement, a set of gold plate and sphere
on cantilever was immersed in a thiol solution for a desired period of time, so that the
hydorphobicity of the two microscopic surfaces would be the same.
3.3.3 Contact Angle Measurement
Equilibrium water contact angles on the hydrophobized gold plates were measured
with the sessile drop method using a goniometer (Ramé-Hart, Inc) under ambient conditions.
Droplets of pure water of 1−2 mm diameter were placed on the surface of a horizontally
placed thiolated-gold plate using a Norm-Ject syringe. The angles were measured on each
61
side of a water droplet. The measurements were conducted using a total of five droplets
placed on different locations of a gold surface, and the results were averaged. For the contact
angles of thiol-coated gold in NaCl solutions, aqueous NaCl solution with different
concentrations drops were employed instead of pure water as the contacting liquid.
3.3.4 AFM Surface Force Measurement
A Nanoscope Ⅲ (Digital Instruments, CA) multi-mode atomic force microscope
(AFM) equipped with a standard fluid liquid cell and a piezoelectric scanner “E”was used
for the force measurements. The surface interactions between a gold-coated glass and a gold
microsphere in water medium were measured at room temperature (~ 22ºC) using the
colloidal probe technique.41 The separation distance (H) between the spherical probe (gold
sphere) and the flat substrate (gold-coated glass) was determined by monitoring the deflection
of the cantilever on which the sphere was attached. Triangular silicon nitride (NP-20, Veeco
probes) cantilevers with a nominal spring constant (k) of 0.58 N/m were used in this study,
and their spring constants were determined using the Cleveland method.42 For each
experiment, a gold sphere was glued onto the end of a cantilever with EPON-1004 resin
(Shell Chemical Co.) using a homemade three-dimensional micromanipulator under an
optical microscope (Olympus BH-2). The fluid cell made of glass was cleaned in pure water
in an ultrasonic cleaner and blow-dried with nitrogen gas before each experiment. The force
measurements were conducted immediately after the thiol monolayers were formed on gold
substrates.
62
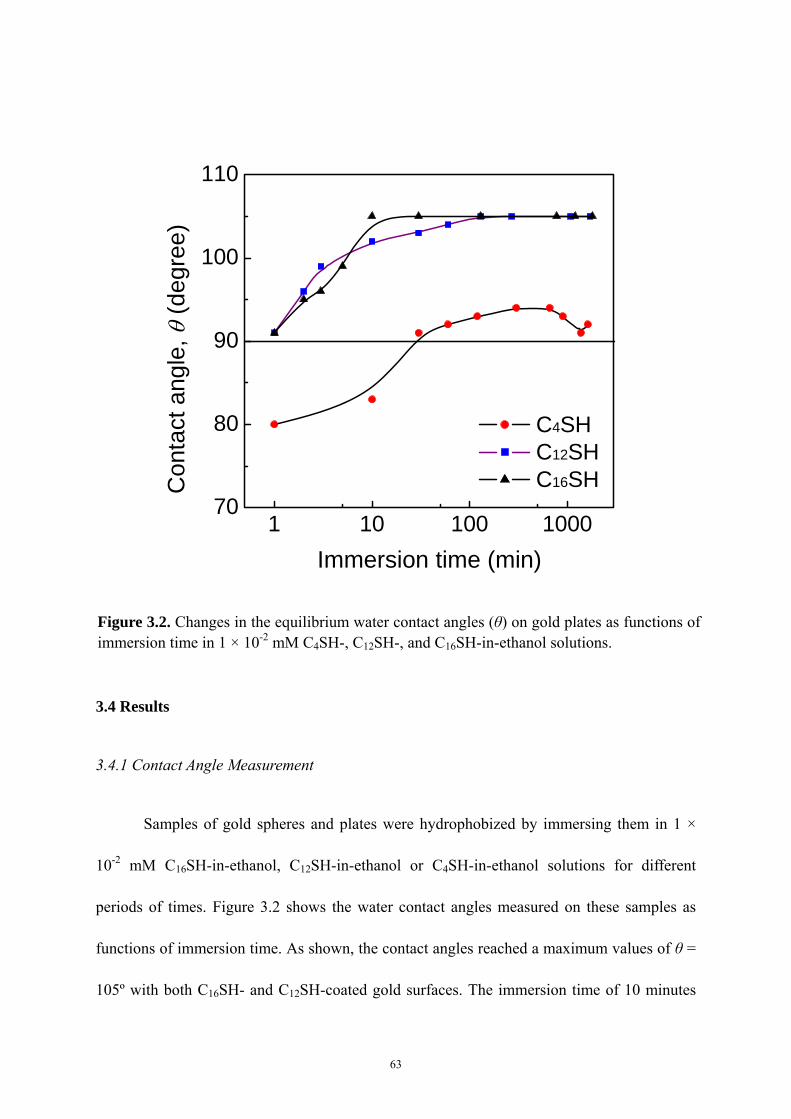
1 10 100 100070
80
90
100
110
Con
tact
ang
le, θ
(deg
ree)
Immersion time (min)
C4SH C12SH C16SH
Figure 3.2. Changes in the equilibrium water contact angles (θ) on gold plates as functions of immersion time in 1 × 10⁻² mM C4SH-, C12SH-, and C16SH-in-ethanol solutions.
3.4 Results
3.4.1 Contact Angle Measurement
Samples of gold spheres and plates were hydrophobized by immersing them in 1 ×
10-2 mM C16SH-in-ethanol, C12SH-in-ethanol or C4SH-in-ethanol solutions for different
periods of times. Figure 3.2 shows the water contact angles measured on these samples as
functions of immersion time. As shown, the contact angles reached a maximum values of θ =
105º with both C16SH- and C12SH-coated gold surfaces. The immersion time of 10 minutes
63
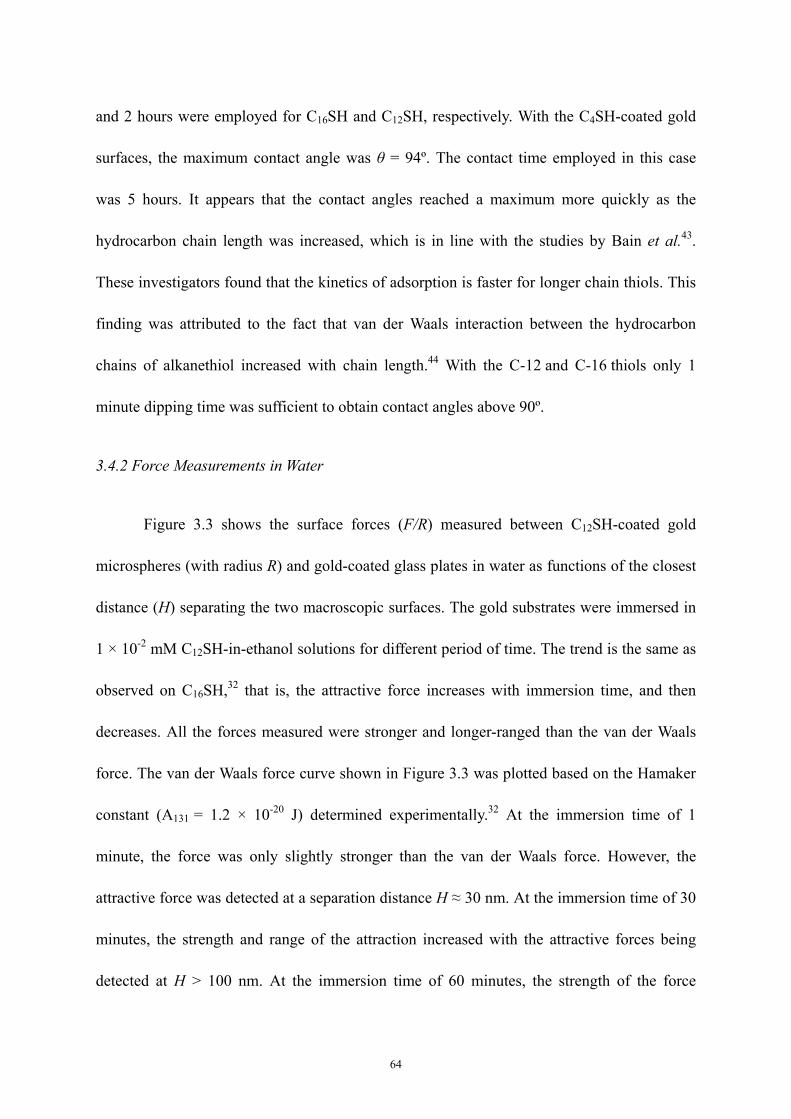
and 2 hours were employed for C16SH and C12SH, respectively. With the C4SH-coated gold
surfaces, the maximum contact angle was θ = 94º. The contact time employed in this case
was 5 hours. It appears that the contact angles reached a maximum more quickly as the
hydrocarbon chain length was increased, which is in line with the studies by Bain et al.43.
These investigators found that the kinetics of adsorption is faster for longer chain thiols. This
finding was attributed to the fact that van der Waals interaction between the hydrocarbon
chains of alkanethiol increased with chain length.44 With the C-12 and C-16 thiols only 1
minute dipping time was sufficient to obtain contact angles above 90º.
3.4.2 Force Measurements in Water
Figure 3.3 shows the surface forces (F/R) measured between C12SH-coated gold
microspheres (with radius R) and gold-coated glass plates in water as functions of the closest
distance (H) separating the two macroscopic surfaces. The gold substrates were immersed in
1 × 10⁻² mM C12SH-in-ethanol solutions for different period of time. The trend is the same as
observed on C16SH,32 that is, the attractive force increases with immersion time, and then
decreases. All the forces measured were stronger and longer-ranged than the van der Waals
force. The van der Waals force curve shown in Figure 3.3 was plotted based on the Hamaker
constant (A131 = 1.2 × 10⁻²⁰ J) determined experimentally.32 At the immersion time of 1
minute, the force was only slightly stronger than the van der Waals force. However, the
attractive force was detected at a separation distance H ≈ 30 nm. At the immersion time of 30
minutes, the strength and range of the attraction increased with the attractive forces being
detected at H > 100 nm. At the immersion time of 60 minutes, the strength of the force
64
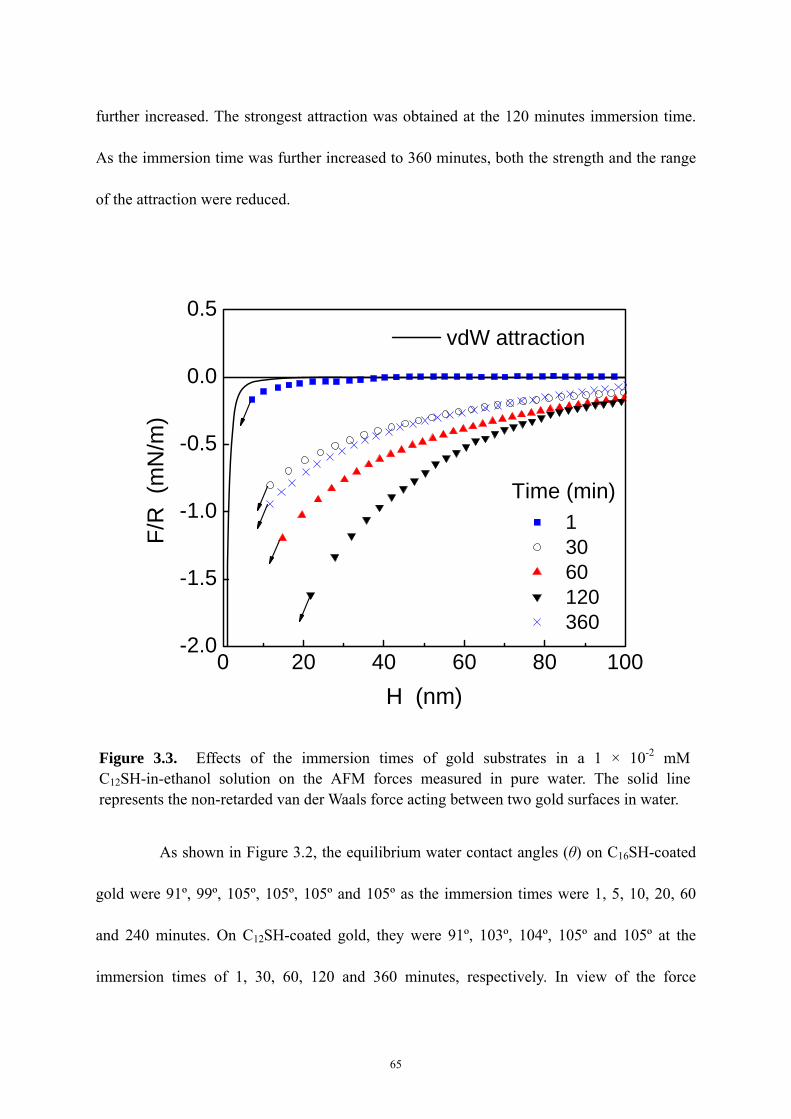
further increased. The strongest attraction was obtained at the 120 minutes immersion time.
As the immersion time was further increased to 360 minutes, both the strength and the range
of the attraction were reduced.
As shown in Figure 3.2, the equilibrium water contact angles (θ) on C16SH-coated
gold were 91º, 99º, 105º, 105º, 105º and 105º as the immersion times were 1, 5, 10, 20, 60
and 240 minutes. On C12SH-coated gold, they were 91º, 103º, 104º, 105º and 105º at the
immersion times of 1, 30, 60, 120 and 360 minutes, respectively. In view of the force
65
0 20 40 60 80 100-2.0
-1.5
-1.0
-0.5
0.0
0.5 vdW attraction
F/R
(m
N/m
)
H (nm)
1 30 60 120 360
Time (min)
Figure 3.3. Effects of the immersion times of gold substrates in a 1 × 10⁻² mM C12SH-in-ethanol solution on the AFM forces measured in pure water. The solid line represents the non-retarded van der Waals force acting between two gold surfaces in water.
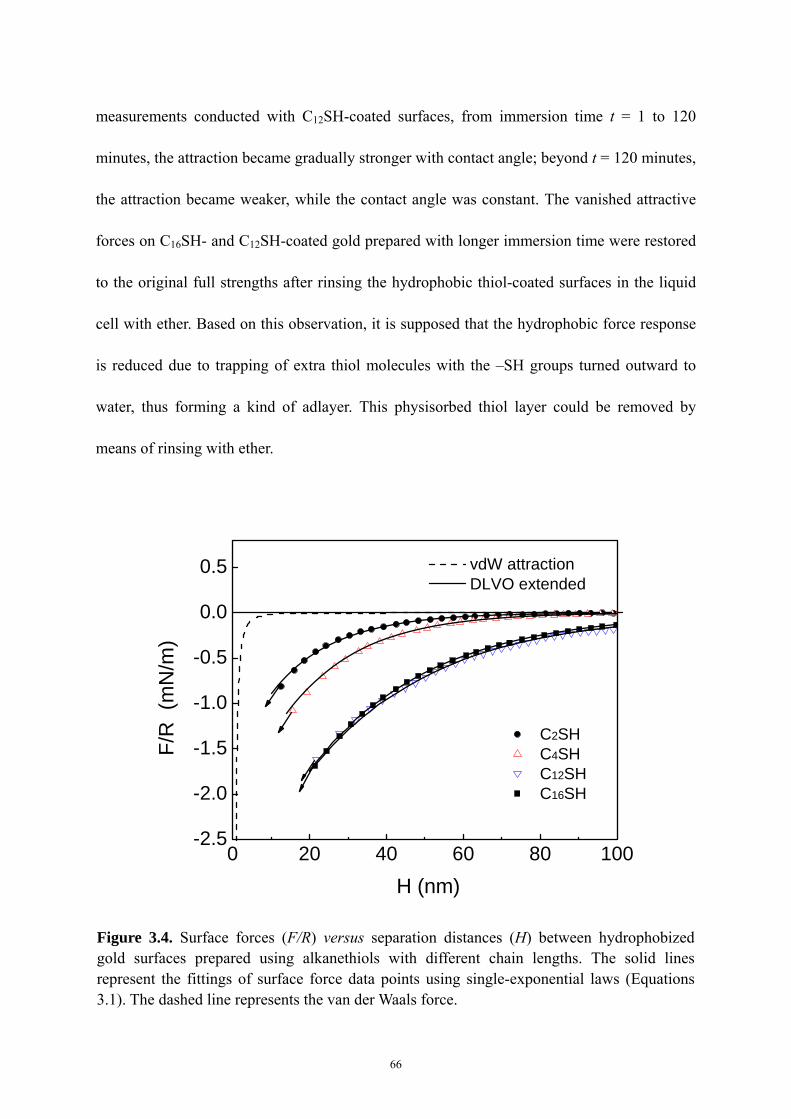
measurements conducted with C12SH-coated surfaces, from immersion time t = 1 to 120
minutes, the attraction became gradually stronger with contact angle; beyond t = 120 minutes,
the attraction became weaker, while the contact angle was constant. The vanished attractive
forces on C16SH- and C12SH-coated gold prepared with longer immersion time were restored
to the original full strengths after rinsing the hydrophobic thiol-coated surfaces in the liquid
cell with ether. Based on this observation, it is supposed that the hydrophobic force response
is reduced due to trapping of extra thiol molecules with the –SH groups turned outward to
water, thus forming a kind of adlayer. This physisorbed thiol layer could be removed by
means of rinsing with ether.
0 20 40 60 80 100-2.5
-2.0
-1.5
-1.0
-0.5
0.0
0.5 vdW attraction DLVO extended
F/R
(m
N/m
)
H (nm)
C2SH C4SH C12SH C16SH
Figure 3.4. Surface forces (F/R) versus separation distances (H) between hydrophobized gold surfaces prepared using alkanethiols with different chain lengths. The solid lines represent the fittings of surface force data points using single-exponential laws (Equations 3.1). The dashed line represents the van der Waals force.
66
Figure 3.4 shows the surface force measurements performed in water on gold surfaces
hydrophobized by self-assembly of alkanethiols with different chain lengths. The strongest
attractive force curves measured which were shown in Figure 3.3 on C12SH-coated gold
surfaces and on C16SH-coated gold32 are re-drawn in Figure 3.4. Also included in Figure 3.4
are surface forces data in water on C4SH- and C2SH-coated gold surfaces. According to the
contact angle measurements on C4SH-coated gold (Figure 3.2), the contact angle approaches
the maximum value (θ = 94º) after 5 hours of immersion time. In Figure 3.4, the surface force
between C4SH-coated gold surfaces in water was shown when the C4SH coatings were
prepared with an immersion time of 5 hours. The attractive force measured on surfaces
prepared under this condition should be the strongest according to the relation between
contact angle and hydrophobic force (Figure 3.3). The strongest hydrophobic force on
C4SH-coated gold is measurable at the separation distance H ≈ 70 nm. The surface force
between C2SH-coated gold surfaces in water was measured when the C2SH coatings were
prepared by immersing a gold microsphere and a gold coated-glass plate in 1 mM solution for
an immersion time of 6 hours. The water contact angle measured on C2SH-coated gold
surface prepared under this condition was θ = 67º, and the measured force between these
surfaces was purely attractive within a separation distance H ≈ 60 nm. All the force curves
shown in Figure 3.3 and 3.4 are smooth, without showing steps or discontinuities, indicating
that the hydrophobic surfaces were relatively free of contaminations or air bubbles. All the
attractions are much stronger and longer-ranged than the non-retarded van der Waals force.
All of the surface force curves in Figure 3.4 were fitted to a single-exponential force
law, that is:
67
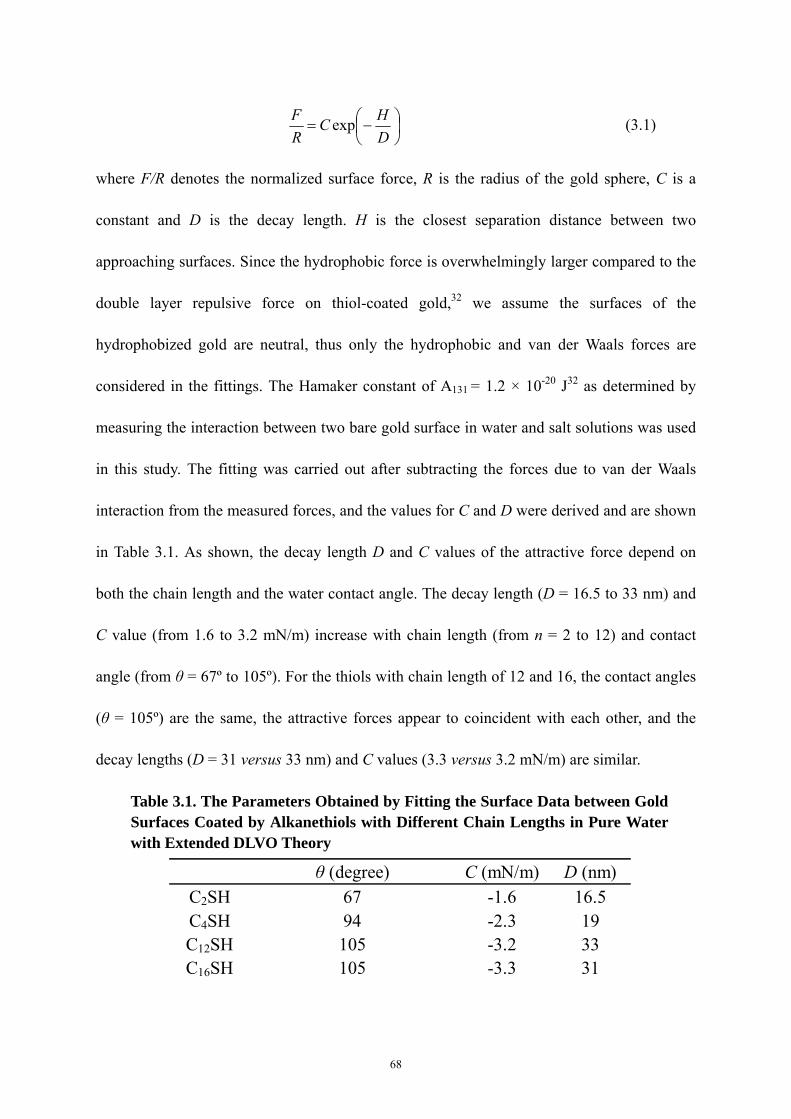
⎟⎠⎞
⎜⎝⎛−=
DHC
RF exp (3.1)
where F/R denotes the normalized surface force, R is the radius of the gold sphere, C is a
constant and D is the decay length. H is the closest separation distance between two
approaching surfaces. Since the hydrophobic force is overwhelmingly larger compared to the
double layer repulsive force on thiol-coated gold,32 we assume the surfaces of the
hydrophobized gold are neutral, thus only the hydrophobic and van der Waals forces are
considered in the fittings. The Hamaker constant of A131 = 1.2 × 10⁻²⁰ J32 as determined by
measuring the interaction between two bare gold surface in water and salt solutions was used
in this study. The fitting was carried out after subtracting the forces due to van der Waals
interaction from the measured forces, and the values for C and D were derived and are shown
in Table 3.1. As shown, the decay length D and C values of the attractive force depend on
both the chain length and the water contact angle. The decay length (D = 16.5 to 33 nm) and
C value (from 1.6 to 3.2 mN/m) increase with chain length (from n = 2 to 12) and contact
angle (from θ = 67º to 105º). For the thiols with chain length of 12 and 16, the contact angles
(θ = 105º) are the same, the attractive forces appear to coincident with each other, and the
decay lengths (D = 31 versus 33 nm) and C values (3.3 versus 3.2 mN/m) are similar.
Table 3.1. The Parameters Obtained by Fitting the Surface Data between Gold Surfaces Coated by Alkanethiols with Different Chain Lengths in Pure Water with Extended DLVO Theory
θ (degree) C (mN/m) D (nm) C2SH 67 -1.6 16.5 C4SH 94 -2.3 19C12SH 105 -3.2 33 C16SH 105 -3.3 31
68
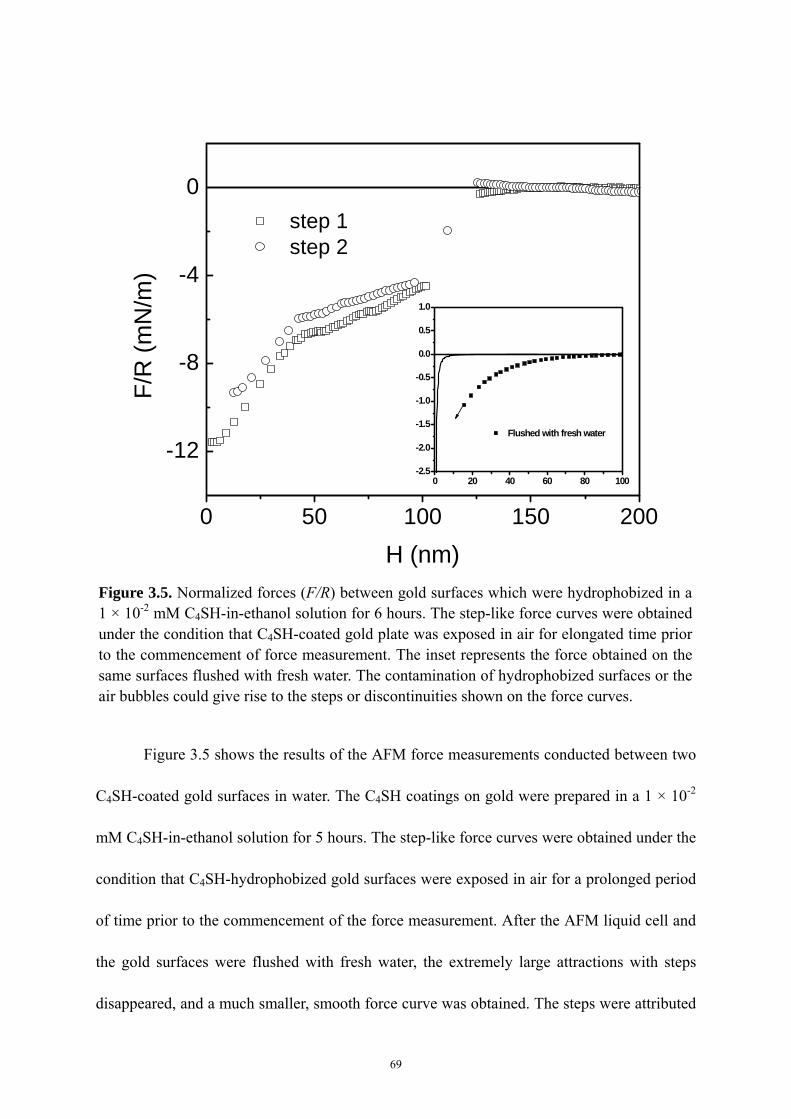
Figure 3.5 shows the results of the AFM force measurements conducted between two
C4SH-coated gold surfaces in water. The C4SH coatings on gold were prepared in a 1 × 10⁻²
mM C4SH-in-ethanol solution for 5 hours. The step-like force curves were obtained under the
condition that C4SH-hydrophobized gold surfaces were exposed in air for a prolonged period
of time prior to the commencement of the force measurement. After the AFM liquid cell and
the gold surfaces were flushed with fresh water, the extremely large attractions with steps
disappeared, and a much smaller, smooth force curve was obtained. The steps were attributed
69
0 50 100 150 200
-12
-8
-4
0
0 20 40 60 80 100-2.5
-2.0
-1.5
-1.0
-0.5
0.0
0.5
1.0
Flushed with fresh water
F/R
(mN
/m)
H (nm)
step 1 step 2
Figure 3.5. Normalized forces (F/R) between gold surfaces which were hydrophobized in a 1 × 10⁻² mM C4SH-in-ethanol solution for 6 hours. The step-like force curves were obtained under the condition that C4SH-coated gold plate was exposed in air for elongated time prior to the commencement of force measurement. The inset represents the force obtained on the same surfaces flushed with fresh water. The contamination of hydrophobized surfaces or the air bubbles could give rise to the steps or discontinuities shown on the force curves.
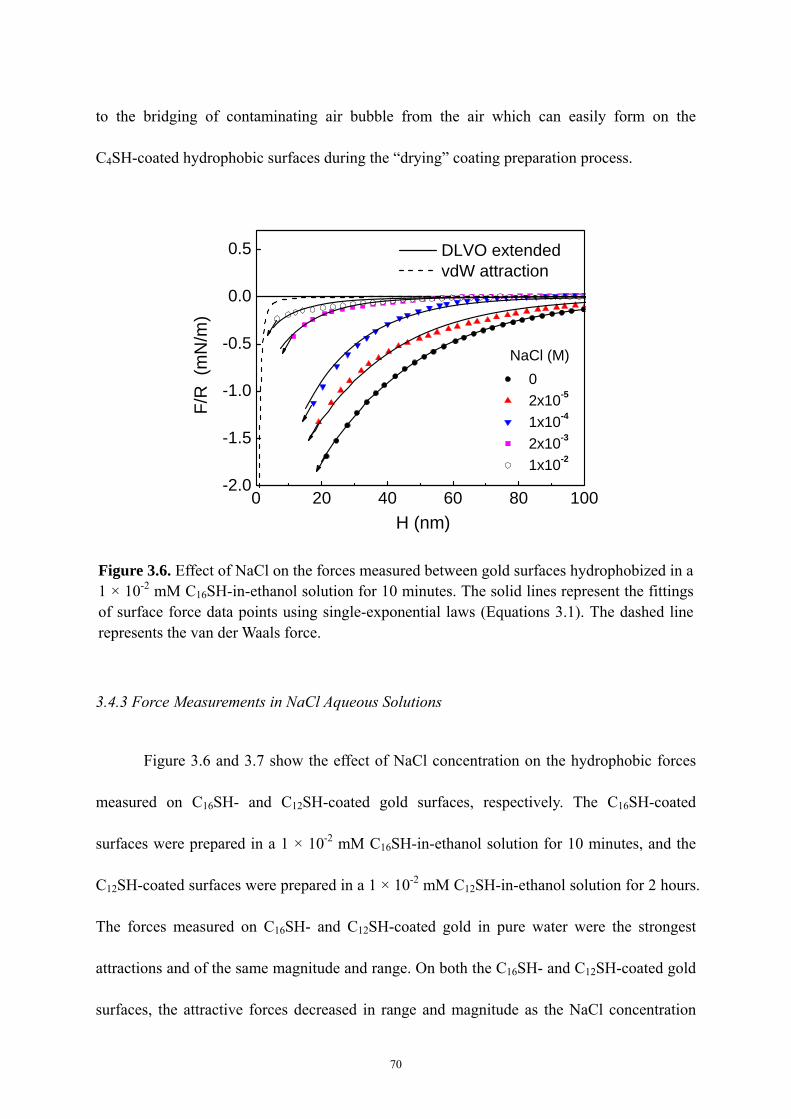
to the bridging of contaminating air bubble from the air which can easily form on the
C4SH-coated hydrophobic surfaces during the “drying” coating preparation process.
0 20 40 60 80 100-2.0
-1.5
-1.0
-0.5
0.0
0.5 DLVO extended vdW attraction
F/
R (
mN
/m)
H (nm)
0 2x10⁻⁵
1x10⁻⁴
2x10⁻³
1x10⁻²
NaCl (M)
Figure 3.6. Effect of NaCl on the forces measured between gold surfaces hydrophobized in a 1 × 10⁻² mM C16SH-in-ethanol solution for 10 minutes. The solid lines represent the fittings of surface force data points using single-exponential laws (Equations 3.1). The dashed line represents the van der Waals force.
3.4.3 Force Measurements in NaCl Aqueous Solutions
Figure 3.6 and 3.7 show the effect of NaCl concentration on the hydrophobic forces
measured on C16SH- and C12SH-coated gold surfaces, respectively. The C16SH-coated
surfaces were prepared in a 1 × 10⁻² mM C16SH-in-ethanol solution for 10 minutes, and the
C12SH-coated surfaces were prepared in a 1 × 10⁻² mM C12SH-in-ethanol solution for 2 hours.
The forces measured on C16SH- and C12SH-coated gold in pure water were the strongest
attractions and of the same magnitude and range. On both the C16SH- and C12SH-coated gold
surfaces, the attractive forces decreased in range and magnitude as the NaCl concentration
70

was increased from 0 to 1 × 10⁻² M. As shown in Figure 3.6 and 3.7, the attractive forces
measured in the most concentrated NaCl solution (1 × 10⁻² M) were still stronger and
longer-ranged than the van der Waals force. After finishing the experiments with NaCl, the
AFM liquid cell was flushed with fresh water in order to remove the NaCl electrolyte, and the
strong attractive forces in water reappeared. It is demonstrated that the C16SH and C12SH
monolayer coatings on gold were very stable, and the surface properties of these chemisorbed
surfactant layers were not changed upon increasing concentration of NaCl. Sessile drop
contact angle measurement using NaCl aqueous drops indicates that the contact angle on the
thiol surfaces did not change with the changed concentration of NaCl. It is suggested that the
surfaces did not become less hydrophobic in NaCl solutions.
In all cases, the attractive forces decreased exponentially as two surfaces approached
0 20 40 60 80 100-2.0
-1.5
-1.0
-0.5
0.0
0.5 DLVO extended van der Waals
F/R
(m
N/m
)
H (nm)
0 2x10⁻⁵
1x10⁻⁴
2x10⁻³
1x10⁻²
NaCl (M)
Figure 3.7. Effect of NaCl on the forces measured between gold surfaces hydrophobized in a 1 × 10⁻² mM C12SH-in-ethanol solution for 2 hours. The solid lines represent the fittings of surface force data points using single-exponential laws (Equations 3.1). The dashed line represents the van der Waals force.
71
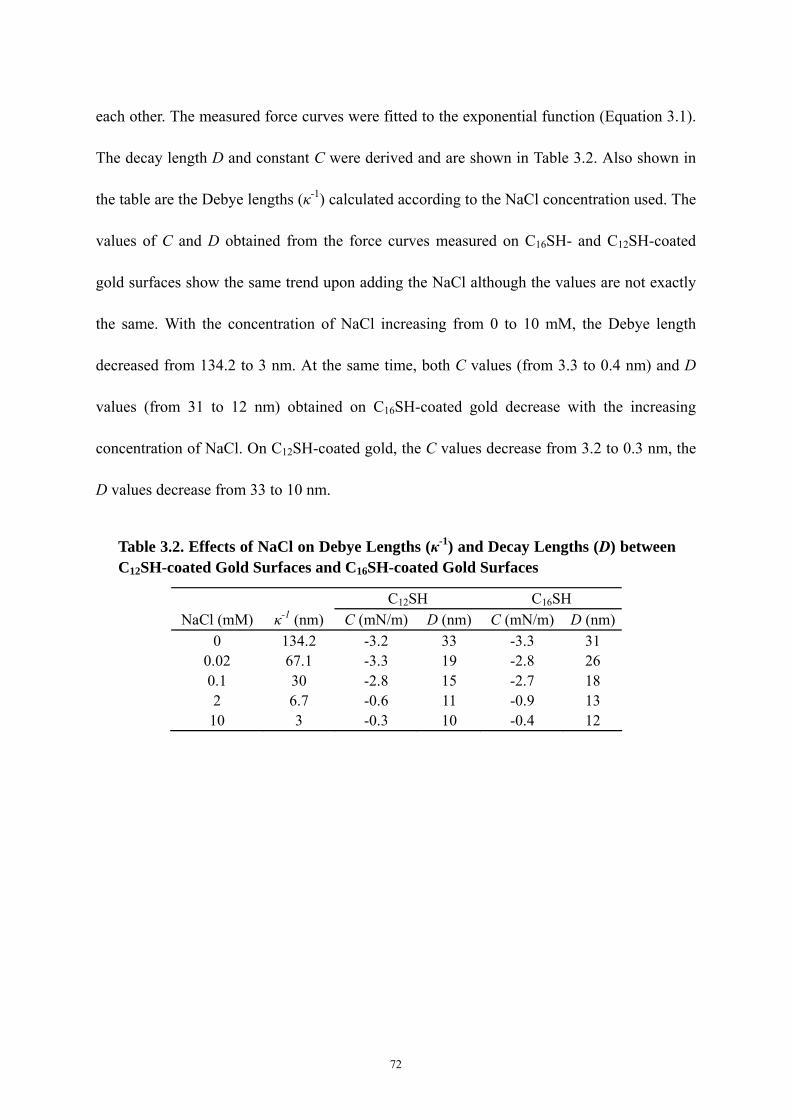
each other. The measured force curves were fitted to the exponential function (Equation 3.1).
The decay length D and constant C were derived and are shown in Table 3.2. Also shown in
the table are the Debye lengths (κ-1) calculated according to the NaCl concentration used. The
values of C and D obtained from the force curves measured on C16SH- and C12SH-coated
gold surfaces show the same trend upon adding the NaCl although the values are not exactly
the same. With the concentration of NaCl increasing from 0 to 10 mM, the Debye length
decreased from 134.2 to 3 nm. At the same time, both C values (from 3.3 to 0.4 nm) and D
values (from 31 to 12 nm) obtained on C16SH-coated gold decrease with the increasing
concentration of NaCl. On C12SH-coated gold, the C values decrease from 3.2 to 0.3 nm, the
D values decrease from 33 to 10 nm.
Table 3.2. Effects of NaCl on Debye Lengths (κ-1) and Decay Lengths (D) between C12SH-coated Gold Surfaces and C16SH-coated Gold Surfaces
C12SH C16SH NaCl (mM) κ-1 (nm) C (mN/m) D (nm) C (mN/m) D (nm)
0 134.2 -3.2 33 -3.3 31 0.02 67.1 -3.3 19 -2.8 26 0.1 30 -2.8 15 -2.7 18 2 6.7 -0.6 11 -0.9 13 10 3 -0.3 10 -0.4 12
72
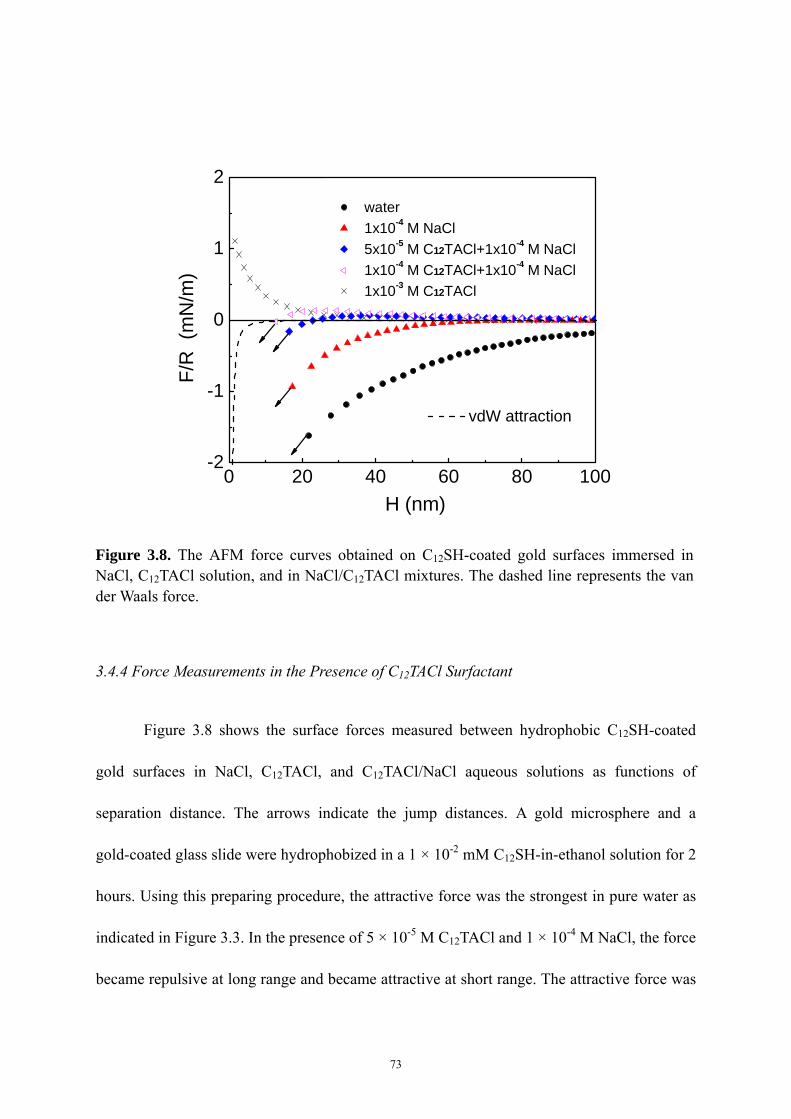
0 20 40 60 80 100-2
-1
0
1
2
vdW attraction
F/R
(m
N/m
)
H (nm)
water 1x10⁻⁴ M NaCl 5x10⁻⁵ M C12TACl+1x10⁻⁴ M NaCl 1x10⁻⁴ M C12TACl+1x10⁻⁴ M NaCl 1x10⁻³ M C12TACl
Figure 3.8. The AFM force curves obtained on C12SH-coated gold surfaces immersed in NaCl, C12TACl solution, and in NaCl/C12TACl mixtures. The dashed line represents the van der Waals force.
3.4.4 Force Measurements in the Presence of C12TACl Surfactant
Figure 3.8 shows the surface forces measured between hydrophobic C12SH-coated
gold surfaces in NaCl, C12TACl, and C12TACl/NaCl aqueous solutions as functions of
separation distance. The arrows indicate the jump distances. A gold microsphere and a
gold-coated glass slide were hydrophobized in a 1 × 10⁻² mM C12SH-in-ethanol solution for 2
hours. Using this preparing procedure, the attractive force was the strongest in pure water as
indicated in Figure 3.3. In the presence of 5 × 10⁻⁵ M C12TACl and 1 × 10⁻⁴ M NaCl, the force
became repulsive at long range and became attractive at short range. The attractive force was
73
dramatically reduced to a much shorter-ranged attraction with a jump distance H ≈ 18 nm,
and a long-ranged double layer repulsive force operating at separation distance H > 40 nm
appeared, most probably due to the inverse orientation of the C12TA+ ions.45 At 1 × 10⁻⁴ M
C12TACl and 1 × 10⁻⁴ M NaCl, the attractive force became progressively weaker and the
surfaces jumped into contact from a distance H ≈ 16 nm; and the double layer repulsive force
became even stronger. The attractive force disappeared and the electrostatic repulsion
dominated at all separation distances as the concentration of C12TACl increased to 1 × 10⁻³
M.
3.5 Discussion
3.5.1 The Existence of the Long-Range Hydrophobic Force
Although the long-range hydrophobic force has been observed experimentally on
different types of hydrophobic surfaces using different surface force measurement techniques,
the existence of this strong attractive force is still questioned by many people. In an attempt
to explain the long-range attractions of variable strengths and ranges reported so far with a
single theory, Hato et al.46 and Meyer et al.34 suggested that the various long-range attractive
forces measured consist of two components; one is the real hydrophobic force, of rather short
range (< 20 nm), and the other is the long-range attraction (> 20 nm) which is rather
dependent on surface preparation method than the hydrophobicity of the surfaces. Surface
force measurements19, 20, 23, 35, 47-50 and the surface images21, 22, 51 showed that the long-range
attractive force is caused by the bridging of nano or submicro air bubbles preexisting on the
two hydrophobic surfaces. Air bubbles adsorb and nucleate at the defective sites on the
74
hydrophobic surface, and steps on the force curve signify the coalescence of two air bubbles.
The range of the measured attractive force is determined by the size of the bubble.
Ederth et al.23, 35 had conducted surface force measurements on thiol-coated gold
surface with a MASIF instrument. The microscopic gold surfaces were hydrophobized in a 1
mM C16SH-in-ethanol solution overnight, and the contact angles measured on them were all
above 90º. They attributed the steps or discontinuities on the obtained force-separation curves
to the bridging of the two air bubbles preexisting on the hydrophobic thiol-coated gold
surfaces. When the contact angles on thiol-coated gold were below 90º, which were obtained
by using ethanol/water mixtures as solvents or by employing bi-functional thiol with –OH
group on the other end as the co-surfactant, they obtained only the van der Waals force. It was
suggested, therefore, that when the surface contact angle was above 90º, there was a
long-range attractive force not considered in classic DLVO theory acting between two
hydrophobic surfaces, which in turn was caused by the bridging of two air bubbles. At θ < 90º,
only the van der Waals force was measured.
In the present study, the gold substrates were hydrophobized in dilute solutions (1 ×
10-2 mM for C4SH, C12SH and C16SH) of thiol-in-ethanol for significantly shorter period of
time (1 minute to several hours). Figure 3.3 and 3.4 shows that all the force curves obtained
were smooth and the long-range surface forces measured were net attractive and stronger
than van der Waals, regardless of weather the contact angles were above 90º or not. Figure
3.5 shows the results of the force measurements in the presence and absence of air bubbles.
When the C4SH hydrophobized gold surfaces were exposed in atmospheric air for a longer
period time before the force measurement, preexisting bubbles were present on the surface,
75
which gave rise to capillary forces. The hydrophobic surfaces were dried completely when
exposed in air for a long period of time. As the surfaces were immersed in water, the surfaces
did not get wet completely, leaving air bubbles on the surfaces. In the absent of air bubbles,
or when the air bubbles were flushed away by fresh water, a smooth curve was obtained
instead of discontinued one, and the measured force was still much stronger than the van der
Waals force.
The contact angles on the C4SH-, C12SH- and C16SH-coated gold surfaces prepared in
this study were all above 90º, meaning that large-scale cavities may be formed due to the
metastability of the intervening fluid between the hydrophobic surfaces.24-29 The cavitation
can occur when the surface tension ( 12γ ) of thiol-coated surface is less than the solid-liquid
interfacial tension ( 13γ ).
θγγγ cos231312 =−=Δ cG (3.2)
Here, is the free energy of cavitation. The subscript 1 refers to solid, 2 refers to air, and
3 refers to liquid. The cavitations are expected to occur as the cavity state is the
thermodynamically favored state under situations where the receding contact angle
cGΔ
θ >
90º.52
Figure 3.4 shows surface force measured on C2SH-coated gold in water. The water
equilibrium contact angle on this surface was 67º, which was the mean value for the
advancing and receding contacts. According to Equation 3.2, the cavitation is not possible in
this case. However, the force measured on C2SH-coated gold was still much stronger than the
van der Waals force. Thus, it is concluded that long-range hydrophobic forces measured on
thiol-coated gold are not of bridging air bubbles or cavitations origin.
76
Comparing the contact angle measurements (Figure 3.2) with the surface force
measurements (Figure 3.3 and 3.4) on the same surfaces, it is found that the hydrophobic
force is dependent on the contact angle, which denotes the degree of surface hydrophobicity.
For C12SH- and C16SH-coated gold surfaces, the hydrophobic force increased with contact
angle, which was varied by changing the immersion time. When the contact angle was
controlled by using alkanethiols with different chain lengths, the measured forces showed the
same relation with water contact angle. The hydrophobic forces measured on C12SH- and
C16SH-coated gold surfaces are the same when they have the same contact angles. Indeed, the
hydrophobic force more or less depends on the surface preparation methods.53 With the
immersion time longer than 10 minutes for C16SH coating and 2 hours longer than C12SH
coating preparations, the contact angles were constant, but the hydrophobic forces diminished
with time. As indicated previously, the reduction of the hydrophobic force is due to the
physical adsorption of the multilayer of thiols, which can be removed by washing with
non-polar solvent ether. The relationship between the contact angle and chain length of
alkanethiol is in good agreement with the relation between the chain length and the structure
of the SAM monolayer of alkanethiol. The IR spectroscopic and ellipsometric data indicated
that self-assembled monolayers of short chain alkanethiols (n < 9) are disordered and
liquid-like, while the long-chain thiols form a densely packed, crystalline-like monolayers
which are free of pin holes.54 With increasing chain length, the structure becomes
increasingly ordered with higher packing density and coverage, which gives rise to the
stronger long-range hydrophobic attractive force.55, 56 Figure 3.9 shows the fitted decay
lengths D and values C for the measured hydrophobic forces plotted against the water contact
77
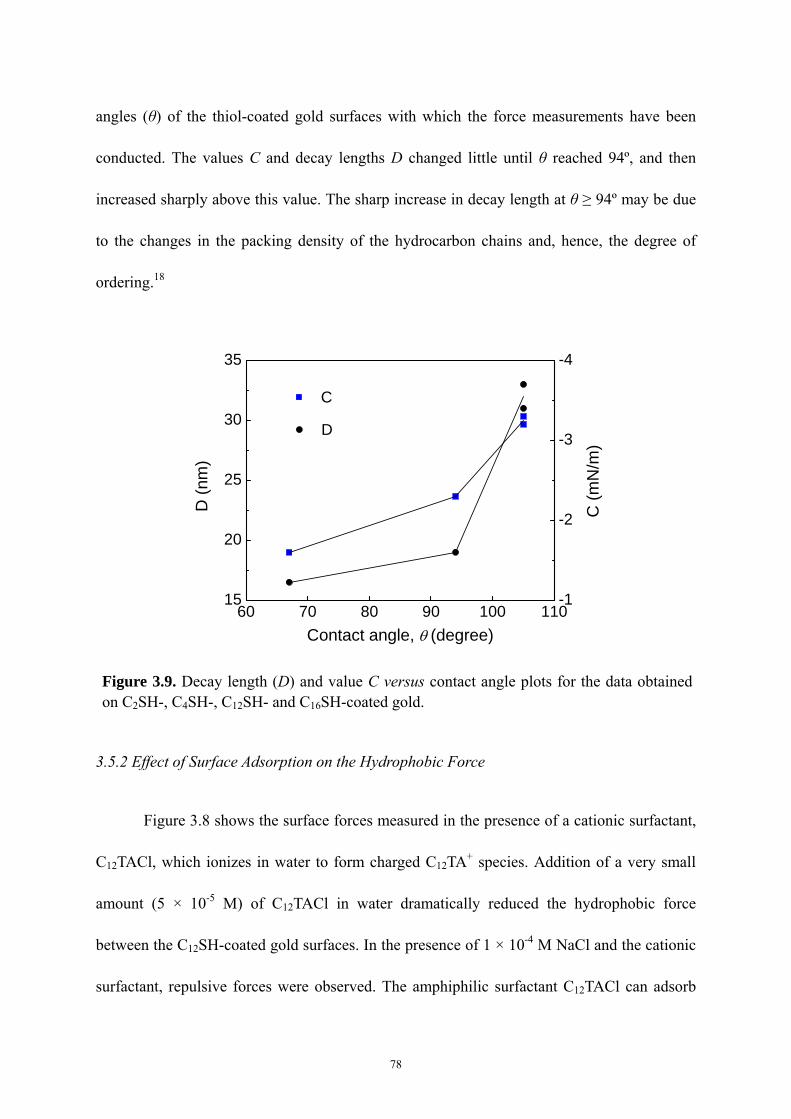
angles (θ) of the thiol-coated gold surfaces with which the force measurements have been
conducted. The values C and decay lengths D changed little until θ reached 94º, and then
increased sharply above this value. The sharp increase in decay length at θ ≥ 94º may be due
to the changes in the packing density of the hydrocarbon chains and, hence, the degree of
ordering.18
60 70 80 90 100 11015
20
25
30
35
-1
-2
-3
-4
C (m
N/m
)
D (n
m)
Contact angle, θ (degree)
D
C
Figure 3.9. Decay length (D) and value C versus contact angle plots for the data obtained on C2SH-, C4SH-, C12SH- and C16SH-coated gold.
3.5.2 Effect of Surface Adsorption on the Hydrophobic Force
Figure 3.8 shows the surface forces measured in the presence of a cationic surfactant,
C12TACl, which ionizes in water to form charged C12TA+ species. Addition of a very small
amount (5 × 10⁻⁵ M) of C12TACl in water dramatically reduced the hydrophobic force
between the C12SH-coated gold surfaces. In the presence of 1 × 10⁻⁴ M NaCl and the cationic
surfactant, repulsive forces were observed. The amphiphilic surfactant C12TACl can adsorb
78
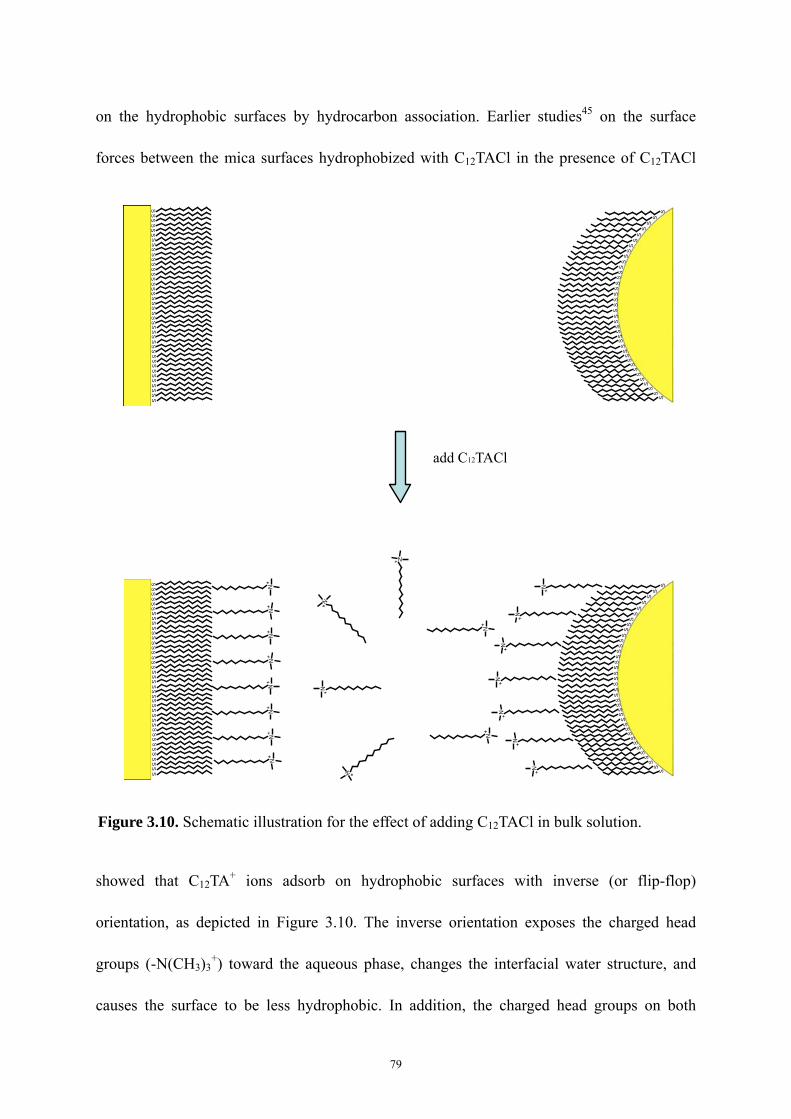
on the hydrophobic surfaces by hydrocarbon association. Earlier studies45 on the surface
forces between the mica surfaces hydrophobized with C12TACl in the presence of C12TACl
showed that C12TA+ ions adsorb on hydrophobic surfaces with inverse (or flip-flop)
orientation, as depicted in Figure 3.10. The inverse orientation exposes the charged head
groups (-N(CH3)3+) toward the aqueous phase, changes the interfacial water structure, and
causes the surface to be less hydrophobic. In addition, the charged head groups on both
SS
SS
SS
SS
SS
SS
SS
SS
SS
SS
SS
SS
SS
SS
SS
SS
SS
SS
SS
SS
SS
SS
SS
SS
SS
SS
SS
SS
S
S
S
SS
SS
SS
S
SS
SS
SS
SS
SS
SNN
NN
NN
NN
N
N
NN
N
N
N
N
N
N
N
N
N
SS
SS
SS
SS
SS
SS
SS
SS
SS
SS
SS
SS
SS
SS
SS
SS
SS
SS
SS
SS
SS
SS
SS
SS
SS
SS
SS
SS
S
S
S
SS
SS
SS
S
SS
SS
SS
SS
SS
S
add C12TACl
Figure 3.10. Schematic illustration for the effect of adding C12TACl in bulk solution.
79
surfaces can generate the electrostatic repulsion. On the C12SH-coated gold surfaces, the
attractive hydrophobic force decreased and the electrostatic repulsive force increased in the
presence of C12TACl. At 1 × 10⁻³ M, the attractive force was completely suppressed, and only
the repulsive force was operating at the short separation distance. In the concentration range
of 5 × 10⁻⁵ ~ 1 × 10⁻³ M, the physically adsorbed C12TACl molecules may not be saturated on
the hydrophobic surfaces, meaning some molecules were “lying down” while some were
“standing up”. As the concentration increased, more and more molecules were “standing up”
and the surface became much less hydrophobic, causing a decrease in the attractive force. At
the same time, the surface charge and hence the potential increased due to the adsorption of
the C12TA+ species, which gave rise to a stronger electrostatic repulsion.
Also shown in Figure 3.8 are the effects of NaCl. In the presence of 1 × 10⁻⁴ M NaCl,
the hydrophobic force was greatly reduced. This can be attributed to the possibility that the
hydrogen bond network diminished in the presence of NaCl. In the presence of NaCl, the
adsorption of the C12TA+ species may increase due to charge neutralization which in turn
increases surface activity of a charged surfactant. The residual C12TA+ species left in solution
may also contribute to diminishing the H-bonded water structure and decrease the
hydrophobic force, as suggested by Zhang et al.45
Figure 3.2 shows the kinetics of adsorption of alkanethiols (C4SH, C12SH and C16SH)
of different chain lengths on gold as monitored by the changes in contact angle with time.
The data indicates that, the water contact angles of the thiol-coated gold surfaces reached the
maximum after an exposure time of 5 hours, 2 hours and 10 minutes with C4SH, C12SH and
C16SH, respectively. Thus, it takes less time for an alkanethiol with a longer chain to
80
completely cover the gold surface and form a self-assembled monolayer. There is a large
body of information reported in the literature on the kinetics of alkanethiol adsorption on gold.
However, the experimental results obtained with various analytical methods regarding the
time required for the ordered monolayer formation are conflicting. Bain et al.,43 measured the
kinetics of formation of the self-assembled monolayer (SAM) of 1-octadecanethiol (C18SH)
on gold by measuring water contact angles. At thiol concentration below 1 mM, it took from
hours to days to form a perfectly-ordered monolayer. Pan et al.39 reported a contact time of
800 minutes for the monolayer formation in a 5 mM C12SH ethanol solution on gold as
monitored by a quartz crystal microbalance (QCM) in situ. On the other hand, the X-ray
photoelectron spectroscopy (XPS) analysis and scanning tunneling microscopy (STM)
imaging by Kawasaki et al.58 showed that almost complete monolayer coverage of
octanethiol (C8SH) SAM was obtained well within a few minutes, e.g., in a 1 × 10⁻² mM
alcoholic solution at room temperature. Campbell and Mutharasan59 observed a C16SH SAM
monolayer formation within 1 hour at various concentrations (1 nM to 10 mM) using a
piezo-excited millimeter-sized gold-coated cantilever sensor. The infrared spectroscopy
studies by Truong and Rowntree60 indicated a shorter time scale of 1-10 minutes for the
ordered C4SH SAM formation from a 5 mM solution. Pan et al39. attributed the discrepancies
among these reports to the contaminants on the gold surfaces. The pre-adsorbed contaminants
can retard the adsorption process, because it is necessary to displace the adsorbed
contaminants before thiol adsorption.
The surface force data obtained with C12SH (Figure 3.3) and C16SH-coated gold32
show that the hydrophobic forces were the strongest when the water contact angles
81
approached the maximum values after immersion time longer than 1 minute. As the
immersion time was extended, the contact angles remained the same. On the other hand, the
long-range attractions significantly decreased after longer immersion time. When the
thiol-coated surfaces were flushed with non-polar solvent such as ether and then the fresh
water was re-introduced in liquid cell, the strongest attractive forces were detected on C12SH-
and C16SH-coated gold substrates. It is suggested that the decrease of hydrophobic force was
caused by the physical adsorption of the bilayers of thiol.32 Apparently, the “ethanol wash”
step after hydrophobization step can not ensure that the physisorbed multilayer is completely
removed. The adsorption of a thiol on a gold surface may be represented as follows:
eAuAu +→ + (3.3)
++ +−→+ HSRAuRSHAu (3.4)
where the underscore refers to the gold species remaining on the surface. Thus, the
chemisorption yields the Au+ species on the surface, which uptakes the thiol in solution. After
a long immersion time, however, some gold species may enter the bulk ethanol solution and
form gold-thiol complex, which subsequently adsorb on the top of the chemisorbed thiol
monolayer. Although the bi-layer formation does not cause a decrease in water contact angle,
the presence of the gold-thiol complex in the adsorption layer can render the surface less
ordered, which may cause a decrease in hydrophobic force. When such species are removed
by appropriate solvent wash, a more ordered hydrophobic surface is exposed on the surface,
which may give rise to a strong hydrophobic force.
82
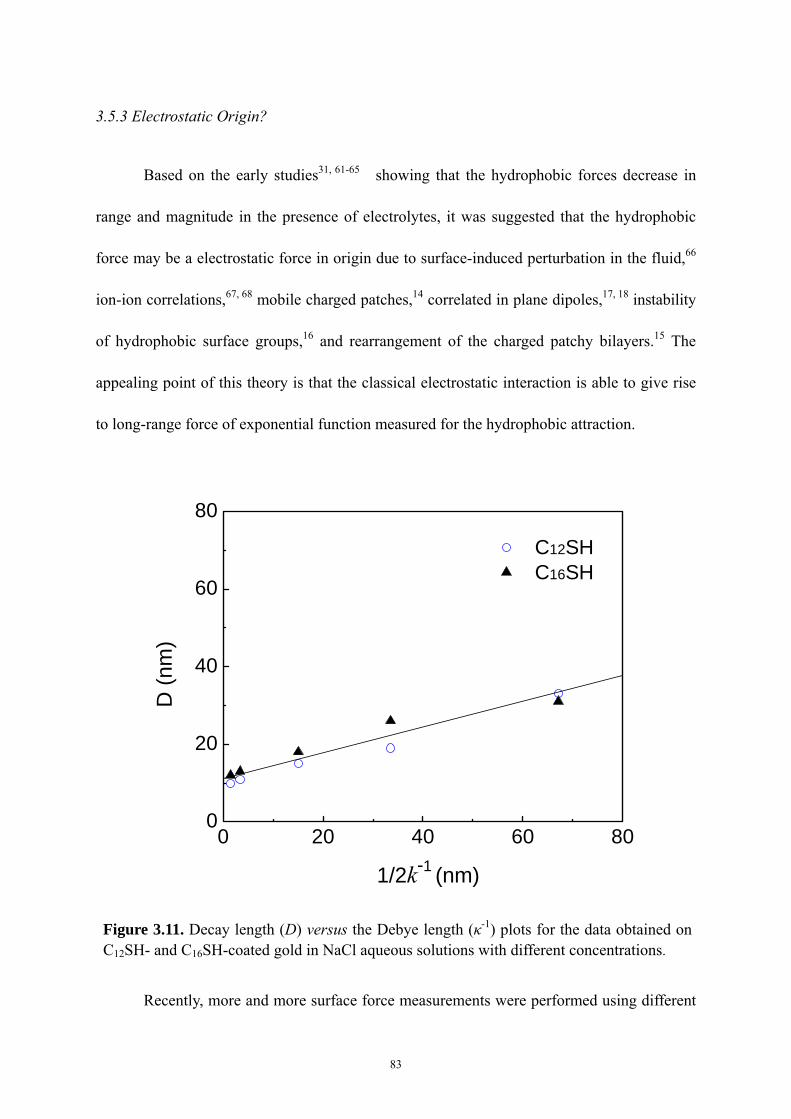
3.5.3 Electrostatic Origin?
Based on the early studies31, 61-65 showing that the hydrophobic forces decrease in
range and magnitude in the presence of electrolytes, it was suggested that the hydrophobic
force may be a electrostatic force in origin due to surface-induced perturbation in the fluid,66
ion-ion correlations,67, 68 mobile charged patches,14 correlated in plane dipoles,17, 18 instability
of hydrophobic surface groups,16 and rearrangement of the charged patchy bilayers.15 The
appealing point of this theory is that the classical electrostatic interaction is able to give rise
to long-range force of exponential function measured for the hydrophobic attraction.
0 20 40 60 800
20
40
60
80
D (n
m)
1/2k-1 (nm)
C12SH C16SH
Figure 3.11. Decay length (D) versus the Debye length (κ-1) plots for the data obtained on C12SH- and C16SH-coated gold in NaCl aqueous solutions with different concentrations.
Recently, more and more surface force measurements were performed using different
83
types of hydrophobic surfaces to determine the dependence of the range and strength of the
hydrophobic force on the concentrations of the electrolytes. However, detailed experiments
have shown that increased NaCl concentration up to 1 M has little or no effect on the range of
the interaction,69 the hydrophobic attraction is undiminished in the presence of concentrated
electrolyte (0.1 M NaCl),70 and electrolyte has negligible effect on the range and strength of
the measured force, the strength of the attractive forces increases slightly even at very high
salt concentrations.19 These results can not be reconciled with the above models that attribute
an electrostatic attraction to the hydrophobic force.
Figure 3.6 and 3.7 show the electrolyte (NaCl) effect on the hydrophobic forces
measured on C12SH- and C16SH-coated gold surfaces. As shown in Table 3.2, analysis by
fitting the force data points with extended DLVO theory which includes the contribution from
the hydrophobic force confirms that the value C and decay length D decrease as the
concentration of NaCl increases. The stability of C12SH- and C16SH-coated gold surfaces in
NaCl aqueous solutions was evaluated by surface force and contact angle measurements. The
experimental results show the decreased surface forces measured in NaCl solutions were
restored when the NaCl solutions were replaced by fresh water, and the hydrophobicity did
not change in the presence of NaCl electrolyte. According to the electrostatic models
developed by Attard,66 Miklavic et al.,14 Podgornik,67 and Spalla and Belloni,68 the attraction
decreases exponentially with a decay length D equal to the one half of the Debye length (κ-1).
In Figure 3.11, the values D obtained at different NaCl concentrations are plotted versus
1/2κ-1. However, it is shown that the D values are not equal to 1/2κ-1, except the D values
obtained in 0.1 mM NaCl solution, the D (15 nm for C12SH and 18 nm for C16SH surfaces)
84
values are approximately 1/2κ-1 (30 nm). At the concentration of NaCl less than 0.1 mM, the
obtained D values are smaller than the values of 1/2κ-1, while at NaCl concentration above
0.1 mM, the D values are much larger than 1/2κ-1. In addition, the thiol molecules formed
immobile and robust monolayers on gold via chemical reaction, which can not meet the
requirement of the theoretical models that assume that the surfaces are covered by movable
charges,14 mobile hydrophobic surface groups,16 or “rolling” bilayer.15 This conclusively rules
out any electrostatic mechanism on stable thiol-coated gold surfaces.
The very long-range hydrophobic forces observed on thiol-coated surfaces may be
explained by the changes in water structure across the thin film between the hydrophobic
surfaces. A problem with this approach is that the computer simulations show the
surface-induced structure can be extended up to only several layers of water molecules. It
was argued by Eriksson et al.71 that the classical simulations of Lee et al.10 based on a
simplistic water potential was not appropriate because it only explored density changes in
thin water film. In fact, structural rearrangement of water can occur without volume
changes.71 Based on the water structure theory, the effects of organic surfactant and inorganic
electrolyte ions across water thin film between thiol-coated hydrophobic surfaces on the
hydrophobic force can be explained. It is suggested that the cationic surfactant C12TACl and
NaCl broke the hydrogen bond network45 or the hydrations of Na+ and Cl- altered the water
structure57, 72 present in thin films between hydrophobic surface, and thus reducing the
hydrophobic force. Ninham73 suggested that the hydrophobic force may also be related to the
gas molecules dissolved in water, because degassing can stabilized the surfactant-free
emulsions74 and can reduce the range and magnitude of the hydrophobic attractive force.34 It
85
was shown that the solubility of oxygen in water decreases with increasing NaCl
concentration, so the bubble coalescence is inhibited by the presence of NaCl.
3.6 Conclusions
AFM force measurements were conducted using gold surfaces hydrophobized by the
self-assembly of alkanethiols with n = 2−16. We have observed net-attractive and long-range
(~100 nm) forces between thiol-coated surfaces regardless of whether the water contact angle
is greater than 90º or not, and the strengths and ranges of the attractions depends on the
surface hydrophobicity. The force curves do not show discontinuities or steps at all separation
distances except when the prepared thiol-coated hydrophobic surfaces were exposed in air for
a prolonged period of time before being immersed in water for force measurement. We have
tentatively exposed C4SH-coated gold surfaces in atmospheric air for prolonged time after
they were prepared ex-situ in thiol-in-ethanol solution. The force curves exhibited steps,
indicating that the measured forces were due to bridging bubbles, which were trapped on the
hydrophobic surfaces when C4SH-coated surfaces were brought into water. When the air
bubbles were washed away using water, the steps in force curves disappeared and long-range
hydrophobic forces appeared. When gold surfaces were hydrophobized with C2SH, the
contact angle was less than 90°. In this case, no cavitation is possible. Yet, the AFM force
measurement gave a long-range attraction, although it was weaker than those measured with
gold surfaces coated with longer chain thiols. That long-range attractions are still observed
under conditions cavitation is not thermodynamically possible suggest that hydrophobic force
is not due to bubbles formed on hydrophobic surfaces.
86
The attractive forces measured on C12SH- and C16SH-coated gold surfaces were
effectively reduced by electrolyte (NaCl), indicating that they may be of electrostatic origin.
For this mechanism to work, it is necessary to assume that the charged patches must be
mobile when two surfaces approach each other to maximize the correlation and give rise to a
long-range attraction. However, the strong covalent Au-S bonding provides robust and
immobile hydrophobic monolayers, which precludes the possibility of charged patches being
mobile. Further, there is no reason that thiol adsorption produces charged patches as the thiol
chemisorbs on gold.
Our work leaves the possibility that the long-range attraction is caused by the changes
in water structure near hydrophobic surfaces. It is possible that the electrolyte NaCl and
surfactant C12TACl in solution break the H-bonded water structure confined between two
hydrophobic surfaces, and thus, reduce the hydrophobic force.
3.7 Acknowledgement
The authors would like to express their sincere appreciation to Professor Jan Christer
Eriksson for his encouragement and helpful discussions. They would also like to
acknowledge the financial support from the National Energy Technology Laboratory, U.S.
Department of Energy (DE-FC26-02NT41607).
3.8 References
1. Xu, Z.; Yoon, R.-H., J. Colloid Interface Sci. 1989, 132, (2), 532-541.
2. Xu, Z.; Yoon, R.-H., J. Colloid Interface Sci. 1990, 134, (2), 427-434.
87
3. Demetriades, K.; Coupland, J. N.; McClements, D. J., J. Food Sci. 1997, 62, (3),
462-467.
4. Blake, T. D.; Kitchener, J. A., J. Chem. Soc., Faraday Trans. 1 1972, 68, 1435-1442.
5. Israelachvili, J.; Pashley, R., Nature 1982, 300, 341-342.
6. Yoon, R.-H. In Hydrodynamic and Surface Forces in Bubble-Particle Interactions, XVII
International Mineral Processing Congress, Dresden, Germany, 1991; Dresden, Germany,
1991; pp 17-31.
7. Yoon, R.-H.; Mao, L., J. Colloid Interface Sci. 1996, 181, 613-626.
8. Mao, L.; Yoon, R.-H., Int. J. Miner. Process 1997, 51, 171-181.
9. Eriksson, J. C.; Ljunggren, S.; Claesson, P. M., J. Chem. Soc., Faraday Trans. 2 1989, 85,
(3), 163-176.
10. Lee, C. Y.; McCammon, J. A.; Rossky, P. J., J. Chem. Phys. 1984, 80, (9), 4448-4455.
11. Forsman, J.; Jonsson, B.; Woodward, C. E., J. Phys. Chem. 1996, 100, (36),
15005-15010.
12. Sakurai, M.; Tamagawa, H.; Ariga, K.; Kunitake, T.; Inoue, Y., Chem. Phys. Lett. 1998,
289, 567-571.
13. Fa, K.; Nguyen, A. V.; Miller, J. D., J. Phys. Chem. 2005, 109, (27), 13112-13118.
14. Miklavic, S. J.; Chan, D. Y. C.; White, L. R.; Healy, T. W., J. Phys. Chem. 1994, 98,
9022-9032.
15. Meyer, E. E.; Lin, Q.; Hassenkam, T.; Oroudjev, E.; Israelachvili, J. N., Proc. Nat. Acad.
Sci. U.S.A 2005, 102, 6839-6842.
16. Christenson, H. K.; Yaminsky, V. V., Colloids Surf., A 1997, 129-130, 67-74.
88
17. Tsao, Y.-H.; Evans, D. F.; Wennerstrom, H., Science 1993, 262, (5133), 547-550.
18. Yoon, R.-H.; Ravishankar, S. A. R., J. Colloid Interface Sci. 1996, 179, 391-402.
19. Parker, J. L.; Claesson, P. M.; Attard, P., J. Phys. Chem. 1994, 98, 8468-8480.
20. Nguyen, A. V.; Nalaskowski, J.; Miller, J. D.; Butt, H.-J., Int. J. Miner. Process. 2003, 72,
215-225.
21. Ishida, N.; Sakamoto, M.; Miyahara, M.; Higashitani, K., J. Colloid Interface Sci. 2002,
253, 112-116.
22. Tyrrell, J. W. G.; Attard, P., Phys. Rev. Lett. 2001, 87, (17), 176104-1.
23. Ederth, T., J. Phys. Chem. B 2000, 104, 9704-9712.
24. Yushchenko, V. S.; Yaminsky, V. V.; Shchukin, E. D., J. Colloid Interface Sci. 1983, 96,
(2), 307-314.
25. Yaminsky, V. V.; Ninham, B. W., Langmuir 1993, 9, 3618-3624.
26. Yaminsky, V. V., Colloids and Surf., A 1999, 159, 181-195.
27. Craig, V. S. J.; Ninham, B. W.; Pashley, R. M., Langmuir 1999, 15, 1562-1569.
28. Christenson, H. K.; Claesson, P. M., Science 1988, 239, 390-392.
29. Wood, J.; Sharma, R., Langmuir 1995, 11, (12), 4797-4802.
30. Ljunggren, S.; Eriksson, J. C., Colloids and Surf., A 1997, 129-130, 151-155.
31. Zhang, J.; Yoon, R.-H.; Mao, M.; Ducker, W. A., Langmuir 2005, 21, 5831-5841.
32. Wang, J.; Yoon, R.-H., Langmuir 2008, 24, 7889-7896.
33. Stevens, H.; Considine, R. F.; Drummond, C. J.; Hayes, R. A.; Attard, P., Langmuir 2005,
21, 6399-6405.
34. Meyer, E. E.; Lin, Q.; Israelachvili, J. N., Langmuir 2005, 21, 256-259.
89
35. Ederth, T.; Liedberg, B., Langmuir 2000, 16, 2177-2184.
36. Raiteri, R.; Preuss, M.; Grattarola, M.; Butt, H.-J., Colloids Surf., A 1998, 136, 191-197.
37. Ron, H.; Rubinstein, I., Langmuir 1994, 10, (12), 4566-4573.
38. Ron, H.; Rubinstein, I., J. Am. Chem. Soc 1998, 120, (51), 13444-13452.
39. Pan, W.; Durning, C. J.; Turro, N. J., Langmuir 1996, 12, (18), 4469-4473.
40. Xu, S.; Cruchon-Dupeyrat, S. J. N.; Garno, J. C.; Liu, G.-Y.; Jennings, G. K.; Yong, T.-H.;
Laibinis, P. E., J. Chem. Phys. 1998, 108, (12), 5002-5012.
41. Ducker, W. A.; Senden, T. J., Langmuir 1992, 8, (7), 1831-1836.
42. Cleveland, J. P.; Manne, S.; Bocek, D.; Hansma, P. K., Rev. Sci. Instrum. 1993, 64, (2),
403-405.
43. Bain, C. D.; Troughton, E. B.; Tao, Y.-T.; Evall, J.; Whitesides, G. M.; Nuzzo, R. G., J.
Am. Chem. Soc. 1989, 111, 321-335.
44. Ulman, A., An Introduction to Ultrathin Organic Films From langmuir-Blodgett to
Self-Assembly. Academic Press: Rochester, New York, 1991.
45. Zhang, J.; Yoon, R.-H.; Eriksson, J. C., Colloids Surf., A 2007, 300, 335-345.
46. Hato, M., J. Phys. Chem. 1996, 100, 18530-18538.
47. Attard, P., Adv. Colloid Interface Sci. 2003, 104, 75-91.
48. Carambassis, A.; Jonker, L. C.; Attard, P.; Rutland, M. W., Phys. Rev. Lett. 1998, 80, (24),
5357-5360.
49. Ishida, N.; Sakamoto, M.; Miyahara, M.; Higashitani, K., Langmuir 2000, 16, (13),
5681-5687.
50. Sakamoto, M.; Kanda, Y.; Miyahara, M.; Higashitani, K., Langmuir 2002, 18,
90
5713-5719.
51. Yang, J.; Duan, J.; Fornasiero, D.; Ralston, J., J. Phys. Chem. B 2003, 107, 6139-6147.
52. Meyer, E. E.; Rosenberg, K. J.; Israelachvili, J., Proc. Nat. Acad. Sci. U.S.A 2006, 103,
15739-15746.
53. Christenson, H. K.; Claesson, P. M., Adv. Colloid Interface Sci. 2001, 91, 391-436.
54. Porter, M. D.; Bright, T. B.; Allara, D. L.; Chidsey, C. E. D., J. Am. Chem. Soc. 1987,
109, (12), 3559-3568.
55. Tsao, Y.-H.; Yang, S. X.; Evans, D. F.; Wennerstrom, H., Langmuir 1991, 7, 3154-3159.
56. Rabinovich, Y. I.; Guzonas, D. A.; Yoon, R.-H., Langmuir 1993, 9, 1168-1170.
57. Weissenborn, P. K.; Pugh, R. J., J. Colloid Interface Sci. 1996, 184, 550-563.
58. Kawasaki, M.; Sato, T.; Tanaka, T.; Takao, K., Langmuir 2000, 16, (4), 1719-1728.
59. Campbell, G. A.; Mutharasan, R., Langmuir 2005, 21, (25), 11568-11573.
60. Truong, K. D.; Rowntree, P. A., Prog. Surf. Sci. 1995, 50, (1-4), 207-216.
61. Rabinovich, Y. I.; Derjaguin, B. V., Colloids Surf. 1988, 30, 243-251.
62. Claesson, P. M.; Blom, C. E.; Herder, P. C.; Ninham, B. W., J. Colloid Interface Sci.
1986, 114, (1), 234-242.
63. Tsao, Y.-H.; Evans, D. F.; Wennerstrom, H., Langmuir 1993, 9, 779-785.
64. Kekicheff, P.; Spalla, O., Phys. Rev. Lett. 1995, 75, (9), 1851-1855.
65. Christenson, H. K.; Claesson, P. M.; Berg, J.; Herder, P. C., J. Phys. Chem. 1989, 93,
1472-1478.
66. Attard, P., J. Phys. Chem. 1989, 93, (17), 6441-6444.
67. Podgornik, R., J. Chem. Phys 1989, 91, (9), 5840-5849.
91
68. Spalla, O.; Belloni, L., Phys. Rev. Lett. 1995, 74, (13), 2515-2518.
69. Meagher, L.; Craig, V. S. J., Langmuir 1994, 10, 2736-2742.
70. Craig, V. S. J.; Ninham, B. W.; Pashley, R. M., Langmuir 1998, 14, (12), 3326-3332.
71. Eriksson, J. C.; Yoon, R.-H., Hydrophobic Attraction in the Light of Thin-Film
Thermodynamics. In Colloid Stability: The Role of Surface Forces, Tadros, T. F., Ed.
WILEY-VCH Verlag GmbH & Co. KGaA: Weinheim, Germany, 2007; Vol. 1, pp 99-132.
72. Craig, V. S. J.; Ninham, B. W.; Pashley, R. M., Nature 1993, 364, 317-319.
73. Ninham, B. W., Prog. Colloid Polym. Sci. 2006, 133, 65-73.
74. Pashley, R. M., J. Phys. Chem. B 2003, 107, 1714-1720.
92
Chapter 4
Surface Force between Gold Surfaces in Xanthate Solutions and Its Implication in Flotation
4.1 Abstract
Understanding the wetting behavior of sulfide and precious minerals in xanthate
solutions and the surface forces in flotation is essential for improving the process of flotation.
Contact angle and surface force measurements were conducted on the potassium amyl
xanthate (PAX)-gold system. Monolayer structures of PAX were formed by spontaneous
adsorption at different concentrations and contact (or adsorption) times. Captive bubble
contact angle measurements showed that chemisorption of PAX on gold was concentration
dependent. A monolayer was formed more readily on gold in a 1 × 10⁻⁵ M than in a 5 × 10⁻⁶
M PAX solution. The contact angle measurements conducted in 1 × 10⁻⁵ M and 5 × 10⁻⁶ M
PAX solutions showed a rapid increase in contact angle to a peak value of 94º, followed by a
slower period of decreasing contact angle.
Surface forces were measured using an atomic force microscope (AFM) with gold
substrates hydrophobized by PAX coatings. The results showed the existence of long-range
hydrophobic forces, which were closely related to the surface hydrophobicity. The strongest
hydrophobic force with a decay length of 23 nm was measured when the water contact angle
was the largest. The hydrophobic force decreased when the contact angle was decreased due
to the physisorption of additional xanthate ions on the underlying monolayer possibly with
reverse orientation. It was found that the residual xanthate species left in solution caused a
93
decrease in hydrophobic force, possibly because their presence in solution is detrimental to
maximizing the cohesive energy of water.
4.2 Introduction
Froth flotation is the most important solid-solid separation process in the mining
industry. Owing to its simplicity, the process is widely used for extracting many minerals
from their ores, cleaning coals, and recycling plastics, etc, by exploiting the differences in
hydrophobicity. In froth flotation, a stream of small air bubbles is introduced to the bottom of
a flotation cell, in which a mixture of finely grounded ore particles is suspended in water. The
air bubbles rise to the top of the tank under a buoyancy force. During the process, only the
hydrophobic particles adhere to the surface of air bubbles and are carried to the upper surface
of the pulp. Rendering a desired mineral particle more hydrophobic than the others
determines the selectivity, and is the key to the success of a flotation process. For this reason,
during the early stages of flotation research, most of the efforts were focused on
hydrophobizing minerals with surfactants (collectors) and monitoring the changes in surface
hydrophobicity by measuring contact angles. However, surface chemistry parameters such as
contact angle, are thermodynamic properties and do not provide kinetic information. On the
other hand, flotation is a kinetic process and the industry strives to improve flotation kinetics
and, thus, increase recovery and throughput.
Froth flotation can be described as a first order process with a rate constant
proportional to the probability of particle collection (P).1 The probability of particle
collection (P) is represented by:
94
)1( dac PPPP −= (4.1)
where Pc is the probability of air bubble and mineral particle collision, Pa is the probability of
bubble particle adhesion, and Pd is the probability of detachment. In mineral flotation, it is
believed that both the adhesion and detachment processes are determined by the surface force
between the air bubble and mineral particle. Derjaguin and Dukhin2, 3 were the first to
describe the bubble particle interaction in flotation by considering surface forces. However,
the authors only considered the traditional DLVO force, i.e., van der Waals and electrostatic
forces, which can not explain the strong attraction between air bubbles and hydrophobic
mineral particles in flotation. Laskowski and Kitchener4 were the first to recognize the
existence of the hydrophobic force by studying the interaction across a thin water film
between an air bubble and a silicate plate hydrophobized by trimethylchlorosilane (TMCS).
The air bubble readily adheres on the hydrophobic silica surface, even though both the van
der Waals and electrostatic force in the wetting film are repulsive. Therefore, they speculated
the existence of a third force, which is responsible for the bubble particle adhesion.
Furthermore, they said the long range hydrophobic influence may be responsible for the
flotation. In 1972, Blake and Kitchener5 were the first to use the term hydrophobic force in
wetting films. Recent studies of hydrophobic forces are focused on thin aqueous films
between solid hydrophobic surfaces. Most of the force measurements have been based on
employing the surface force apparatus (SFA) and atomic force microscope (AFM). In 1982,
an attractive force much larger than the van der Waals force between two curved mica
surfaces immersed in hexadecyltrimethylammonium bromide (CTAB) solution was first
measured by Israelachvili and Pashley6 using a SFA. They referred to the additional attractive
95
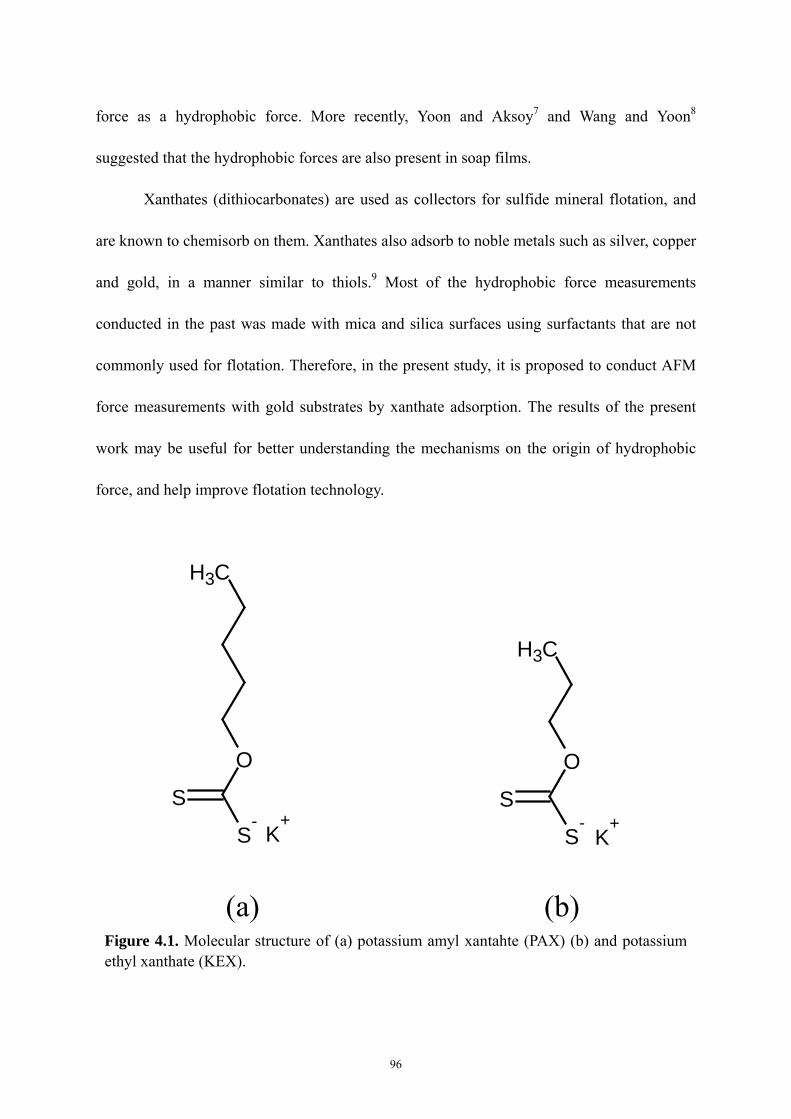
force as a hydrophobic force. More recently, Yoon and Aksoy7 and Wang and Yoon8
suggested that the hydrophobic forces are also present in soap films.
Xanthates (dithiocarbonates) are used as collectors for sulfide mineral flotation, and
are known to chemisorb on them. Xanthates also adsorb to noble metals such as silver, copper
and gold, in a manner similar to thiols.9 Most of the hydrophobic force measurements
conducted in the past was made with mica and silica surfaces using surfactants that are not
commonly used for flotation. Therefore, in the present study, it is proposed to conduct AFM
force measurements with gold substrates by xanthate adsorption. The results of the present
work may be useful for better understanding the mechanisms on the origin of hydrophobic
force, and help improve flotation technology.
CH3
O
S
S-
K+
CH3
O
S
S-
K+
(a) (b)
Figure 4.1. Molecular structure of (a) potassium amyl xantahte (PAX) (b) and potassium ethyl xanthate (KEX).
96
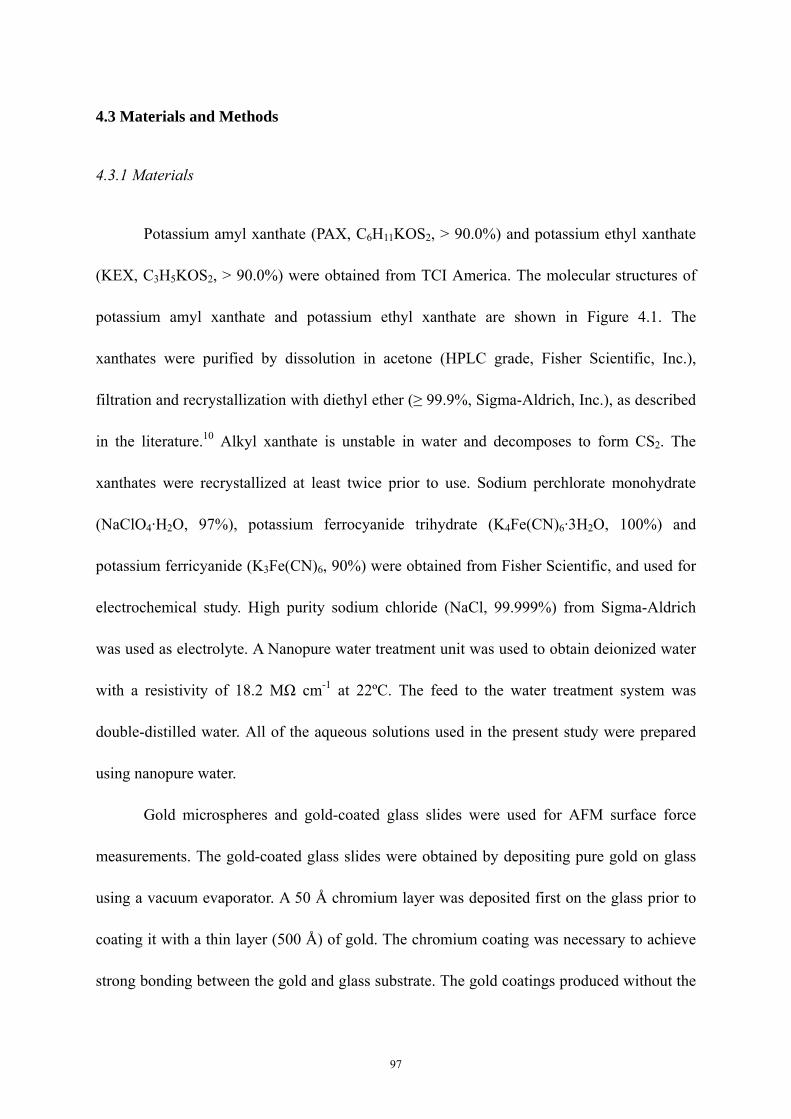
4.3 Materials and Methods
4.3.1 Materials
Potassium amyl xanthate (PAX, C6H11KOS2, > 90.0%) and potassium ethyl xanthate
(KEX, C3H5KOS2, > 90.0%) were obtained from TCI America. The molecular structures of
potassium amyl xanthate and potassium ethyl xanthate are shown in Figure 4.1. The
xanthates were purified by dissolution in acetone (HPLC grade, Fisher Scientific, Inc.),
filtration and recrystallization with diethyl ether (≥ 99.9%, Sigma-Aldrich, Inc.), as described
in the literature.10 Alkyl xanthate is unstable in water and decomposes to form CS2. The
xanthates were recrystallized at least twice prior to use. Sodium perchlorate monohydrate
(NaClO4·H2O, 97%), potassium ferrocyanide trihydrate (K4Fe(CN)6·3H2O, 100%) and
potassium ferricyanide (K3Fe(CN)6, 90%) were obtained from Fisher Scientific, and used for
electrochemical study. High purity sodium chloride (NaCl, 99.999%) from Sigma-Aldrich
was used as electrolyte. A Nanopure water treatment unit was used to obtain deionized water
with a resistivity of 18.2 MΩ cm-1 at 22ºC. The feed to the water treatment system was
double-distilled water. All of the aqueous solutions used in the present study were prepared
using nanopure water.
Gold microspheres and gold-coated glass slides were used for AFM surface force
measurements. The gold-coated glass slides were obtained by depositing pure gold on glass
using a vacuum evaporator. A 50 Å chromium layer was deposited first on the glass prior to
coating it with a thin layer (500 Å) of gold. The chromium coating was necessary to achieve
strong bonding between the gold and glass substrate. The gold coatings produced without the
97
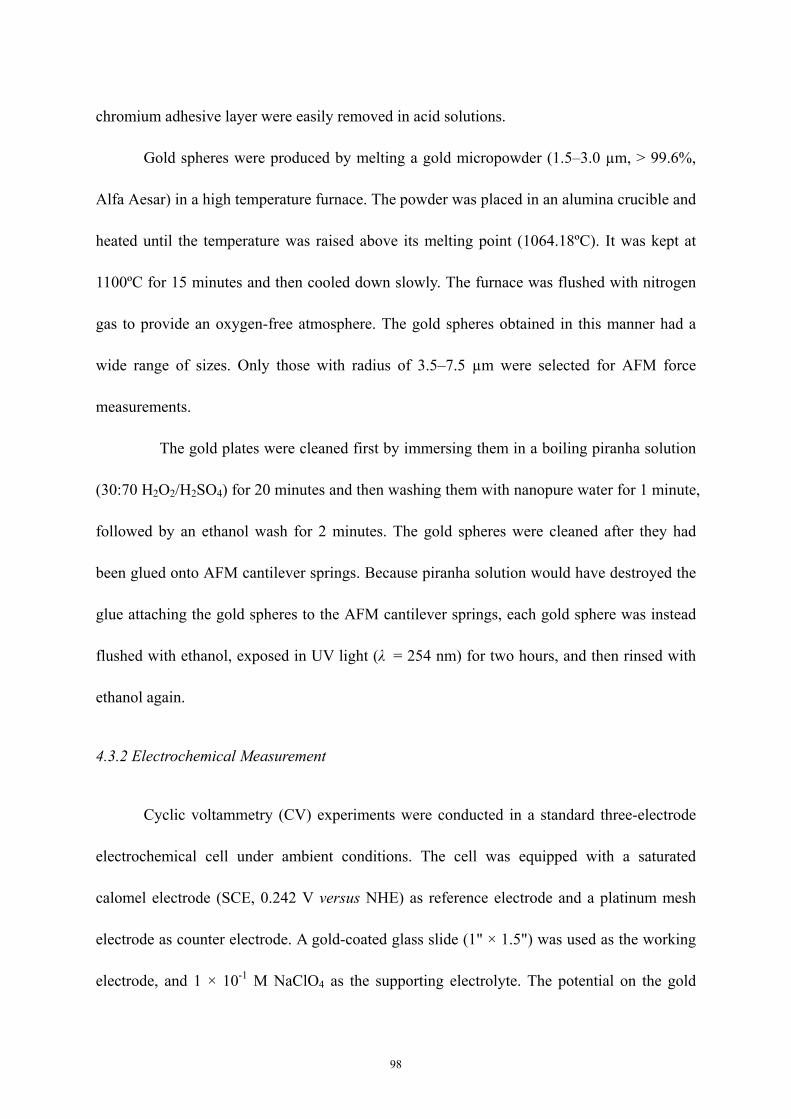
chromium adhesive layer were easily removed in acid solutions.
Gold spheres were produced by melting a gold micropowder (1.5–3.0 µm, > 99.6%,
Alfa Aesar) in a high temperature furnace. The powder was placed in an alumina crucible and
heated until the temperature was raised above its melting point (1064.18ºC). It was kept at
1100ºC for 15 minutes and then cooled down slowly. The furnace was flushed with nitrogen
gas to provide an oxygen-free atmosphere. The gold spheres obtained in this manner had a
wide range of sizes. Only those with radius of 3.5–7.5 µm were selected for AFM force
measurements.
The gold plates were cleaned first by immersing them in a boiling piranha solution
(30:70 H2O2/H2SO4) for 20 minutes and then washing them with nanopure water for 1 minute,
followed by an ethanol wash for 2 minutes. The gold spheres were cleaned after they had
been glued onto AFM cantilever springs. Because piranha solution would have destroyed the
glue attaching the gold spheres to the AFM cantilever springs, each gold sphere was instead
flushed with ethanol, exposed in UV light (λ = 254 nm) for two hours, and then rinsed with
ethanol again.
4.3.2 Electrochemical Measurement
Cyclic voltammetry (CV) experiments were conducted in a standard three-electrode
electrochemical cell under ambient conditions. The cell was equipped with a saturated
calomel electrode (SCE, 0.242 V versus NHE) as reference electrode and a platinum mesh
electrode as counter electrode. A gold-coated glass slide (1" × 1.5") was used as the working
electrode, and 1 × 10⁻¹ M NaClO4 as the supporting electrolyte. The potential on the gold
98
electrode was controlled by a potentiostat (model 273A, EG&G Princeton Applied Research).
The cyclic voltammetry experiments were carried out in 1 × 10⁻¹ M NaClO4 solutions
containing 1 × 10⁻⁴ M PAX at a scan rate of 250 mV/s to study the adsorption mechanism.
When testing the blocking capability of the xanthate layer on gold, an electrolyte solution
containing 1 × 10⁻¹ M NaClO4, 1 × 10⁻⁵ M PAX, and 1 × 10⁻² M K3Fe(CN)6/K4Fe(CN)6 at a
scan rate of 200 mV/s was used. The potentials are reported against the standard hydrogen
electrode (SHE), i.e., assuming that the potential is 242 mV more negative than the saturated
calomel electrode.
θair
Liquid
syringe
gold-coated glass
Figure 4.2. A schematic picture of the liquid cell for captive air bubble contact angle measurement.
4.3.3 Contact Angle Measurement
Contact angles of gold were measured using the captive air bubble technique in a
99
home-made plastic sample holder, which is shown in Figure 4.2. After the gold-coated glass
slides were kept in xanthate solutions for a desired period of time, air bubbles were brought
to contact using a syringe. Contact angles were measured by means of a contact angle
goniometer (model 100-00 115, Ramé-Hart, Inc., Mountain Lakes, NJ). An average of at least
five different individual measurements was used at a given experimental condition.
4.3.4 Surface Force Measurement
Surface force measurements were conducted using a nanoscope III (Digital
Instruments, Inc., Santa Barbara, CA) atomic force microscope (AFM) equipped with a
standard fluid cell and a piezoelectric scanner “E”. All the AFM force measurements were
carried out using the colloidal probe technique11, 12 at room temperature (22±1ºC). Triangular
silicon nitride cantilevers (NP-20, Veeco Probes, Inc.) were used for the force measurements.
The spring constant (k) was determined using the resonant frequency technique.13 In each
experiment, a gold sphere was glued onto a cantilever spring with EPON 1004 resin (Shell
Chemical Co.) using a homemade 3-D micromanipulator with a hot plate. The diameter of the
gold sphere was measured using an Olympus BH-2 light microscope. The liquid cell, used to
hold the sphere probe, was cleaned in an ultrasonic water bath. All of the measurements were
conducted in air-equilibrated solution. The separation distance (H) between the gold sphere
and the flat-gold coated glass plate was measured by monitoring the deflection of the
cantilever on which the gold sphere was attached. Measured forces (F) were normalized with
respect to the radii (R) of the gold spheres.
100
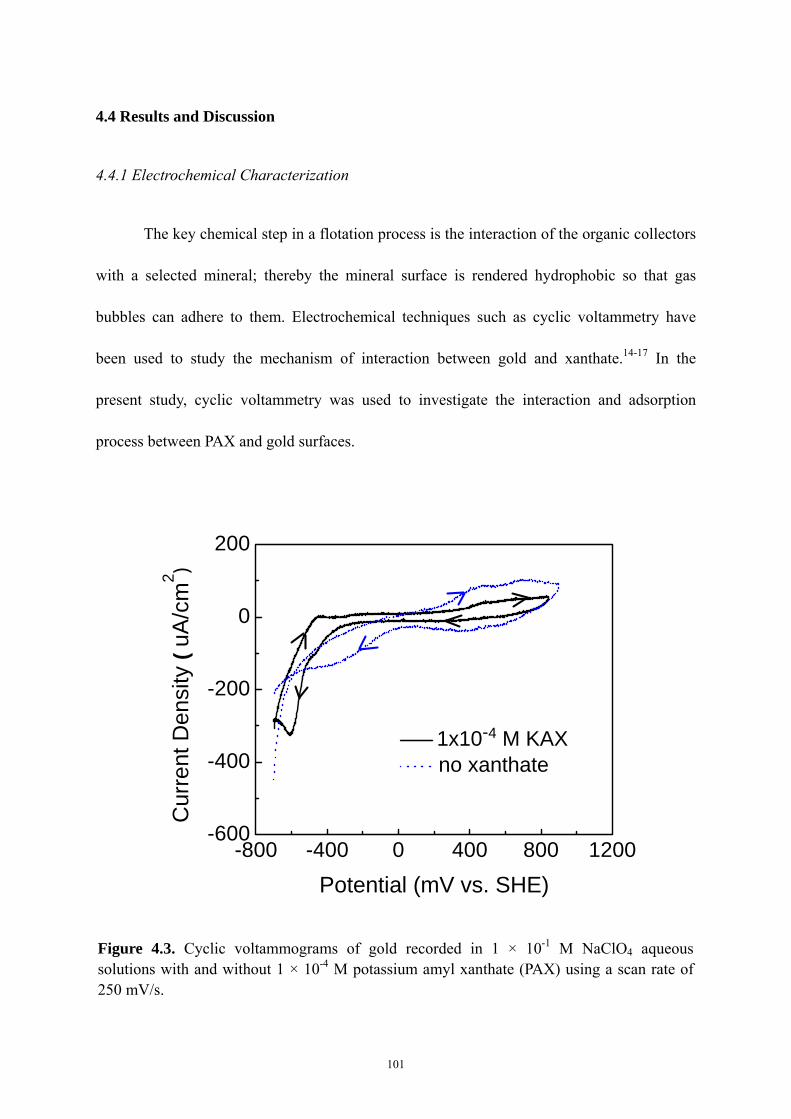
4.4 Results and Discussion
4.4.1 Electrochemical Characterization
The key chemical step in a flotation process is the interaction of the organic collectors
with a selected mineral; thereby the mineral surface is rendered hydrophobic so that gas
bubbles can adhere to them. Electrochemical techniques such as cyclic voltammetry have
been used to study the mechanism of interaction between gold and xanthate.14-17 In the
present study, cyclic voltammetry was used to investigate the interaction and adsorption
process between PAX and gold surfaces.
-800 -400 0 400 800 1200-600
-400
-200
0
200
Cur
rent
Den
sity
(uA
/cm
2 )
Potential (mV vs. SHE)
1x10⁻⁴ M KAX no xanthate
Figure 4.3. Cyclic voltammograms of gold recorded in 1 × 10⁻¹ M NaClO4 aqueous solutions with and without 1 × 10⁻⁴ M potassium amyl xanthate (PAX) using a scan rate of 250 mV/s.
101
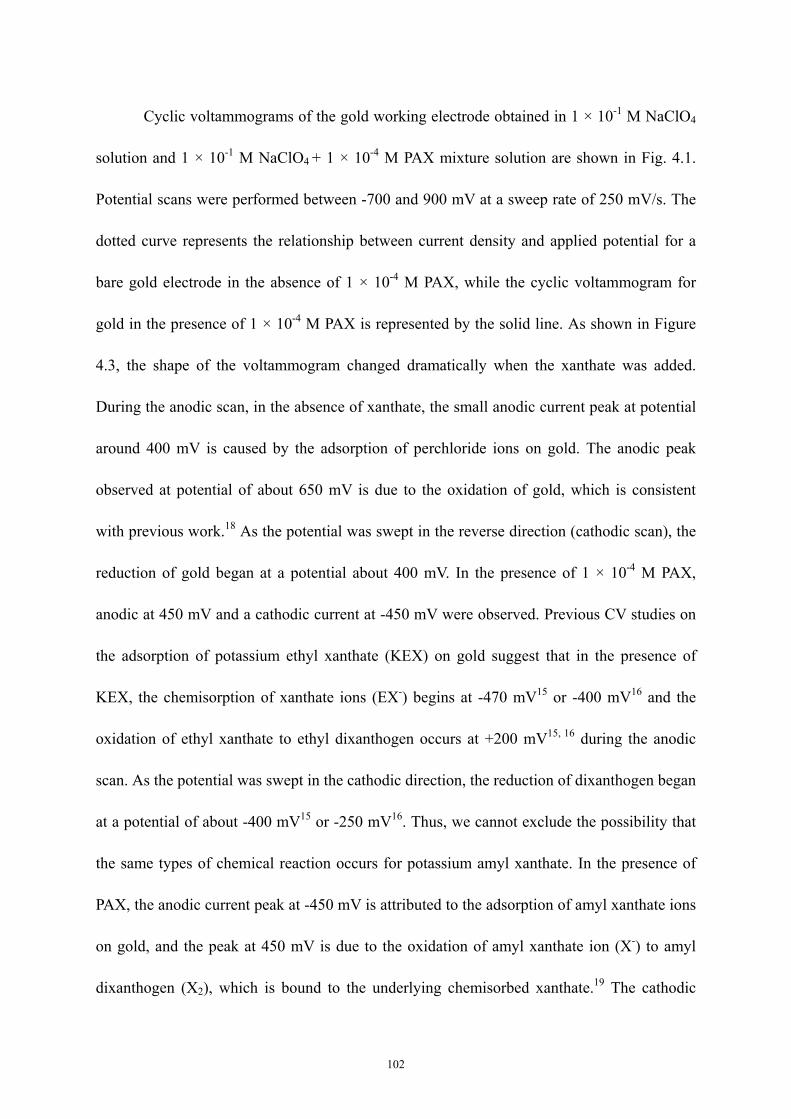
Cyclic voltammograms of the gold working electrode obtained in 1 × 10⁻¹ M NaClO4
solution and 1 × 10⁻¹ M NaClO4 + 1 × 10⁻⁴ M PAX mixture solution are shown in Fig. 4.1.
Potential scans were performed between -700 and 900 mV at a sweep rate of 250 mV/s. The
dotted curve represents the relationship between current density and applied potential for a
bare gold electrode in the absence of 1 × 10⁻⁴ M PAX, while the cyclic voltammogram for
gold in the presence of 1 × 10⁻⁴ M PAX is represented by the solid line. As shown in Figure
4.3, the shape of the voltammogram changed dramatically when the xanthate was added.
During the anodic scan, in the absence of xanthate, the small anodic current peak at potential
around 400 mV is caused by the adsorption of perchloride ions on gold. The anodic peak
observed at potential of about 650 mV is due to the oxidation of gold, which is consistent
with previous work.18 As the potential was swept in the reverse direction (cathodic scan), the
reduction of gold began at a potential about 400 mV. In the presence of 1 × 10⁻⁴ M PAX,
anodic at 450 mV and a cathodic current at -450 mV were observed. Previous CV studies on
the adsorption of potassium ethyl xanthate (KEX) on gold suggest that in the presence of
KEX, the chemisorption of xanthate ions (EX-) begins at -470 mV15 or -400 mV16 and the
oxidation of ethyl xanthate to ethyl dixanthogen occurs at +200 mV15, 16 during the anodic
scan. As the potential was swept in the cathodic direction, the reduction of dixanthogen began
at a potential of about -400 mV15 or -250 mV16. Thus, we cannot exclude the possibility that
the same types of chemical reaction occurs for potassium amyl xanthate. In the presence of
PAX, the anodic current peak at -450 mV is attributed to the adsorption of amyl xanthate ions
on gold, and the peak at 450 mV is due to the oxidation of amyl xanthate ion (X-) to amyl
dixanthogen (X2), which is bound to the underlying chemisorbed xanthate.19 The cathodic
102
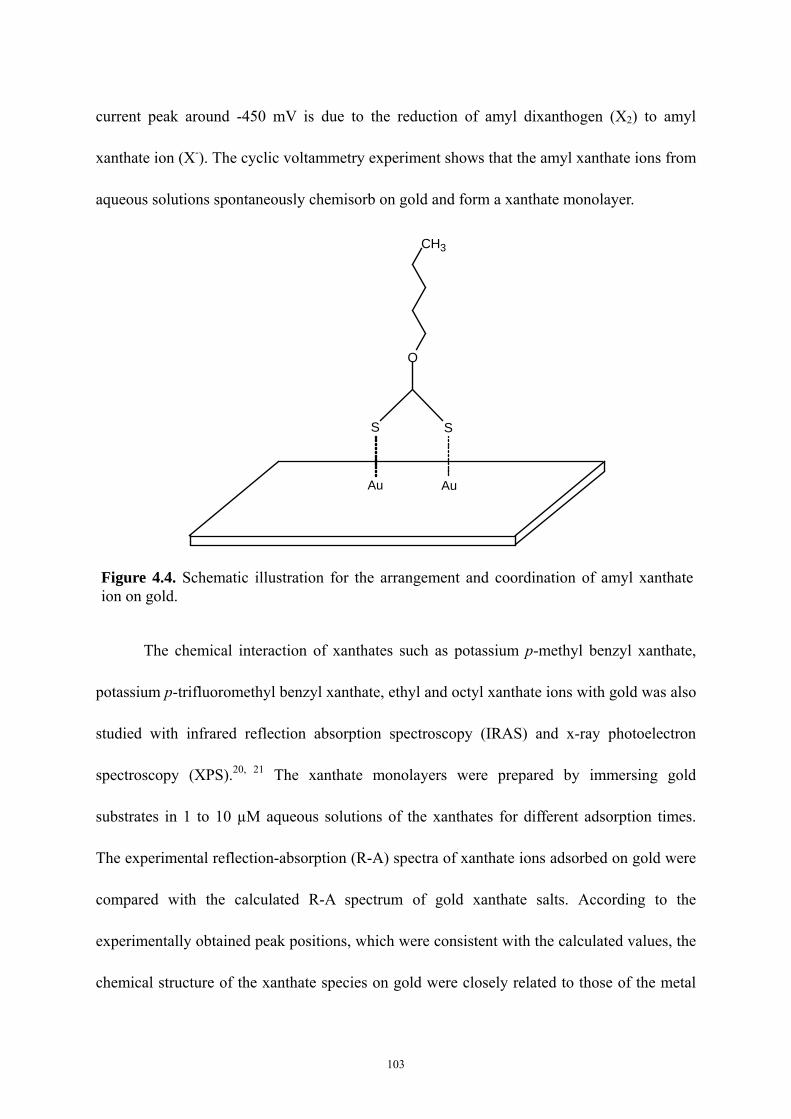
current peak around -450 mV is due to the reduction of amyl dixanthogen (X2) to amyl
xanthate ion (X-). The cyclic voltammetry experiment shows that the amyl xanthate ions from
aqueous solutions spontaneously chemisorb on gold and form a xanthate monolayer.
CH3
O
S S
Au Au
Figure 4.4. Schematic illustration for the arrangement and coordination of amyl xanthate ion on gold.
The chemical interaction of xanthates such as potassium p-methyl benzyl xanthate,
potassium p-trifluoromethyl benzyl xanthate, ethyl and octyl xanthate ions with gold was also
studied with infrared reflection absorption spectroscopy (IRAS) and x-ray photoelectron
spectroscopy (XPS).20, 21 The xanthate monolayers were prepared by immersing gold
substrates in 1 to 10 µM aqueous solutions of the xanthates for different adsorption times.
The experimental reflection-absorption (R-A) spectra of xanthate ions adsorbed on gold were
compared with the calculated R-A spectrum of gold xanthate salts. According to the
experimentally obtained peak positions, which were consistent with the calculated values, the
chemical structure of the xanthate species on gold were closely related to those of the metal
103
salts. Based on IRAS measurements, it was proposed that the xanthate ions are coordinated to
the gold surface through both sulfur atoms (Figure 4. 4). The XPS studies further confirmed a
bridge-like coordination for the chemisorbed xanthates.
-400 -200 0 200 400 600 800 1000-6
-4
-2
0
2
4
2 25 60 120 240 600 1260
Cur
rent
Den
sity
(mA
/cm
2 )
Potential (mV vs. SHE)
Time increase
time (min)
Figure 4.5. Cyclic voltammograms of a gold electrode recorded in 1 × 10⁻² M K3Fe(CN)6/K4Fe(CN)6, 1 × 10⁻¹ M NaClO4 and 1 × 10⁻⁵ M KAX aqueous solutions at different adsorption times, with scan rate of 200 mV/s versus an SHE reference electrode.
Figure 4.5 shows cyclic voltammograms of gold in the presence of 1 × 10⁻⁵ M PAX in
1 × 10⁻² M K3Fe(CN)6/K4Fe(CN)6 and 1 × 10⁻¹ M NaClO4. The scan rate was at 200 mV/s in
both directions. The blocking capability of the amyl xanthate layers on gold formed in 1 ×
10-5 M amyl xanthate aqueous solution at different immersion times towards the ferri/ferro
redox couples was investigated. A cleaned bare gold electrode gave the expected cyclic
104
voltammograms of K3Fe(CN)6/K4Fe(CN)6. The anodic current peak shows the oxidation of
Fe(CN)6-4 to Fe(CN)6
-3 on gold; and the cathodic sweep shows the reduction of Fe(CN)6-3 to
Fe(CN)6-4. There are no current peaks assigned to the oxidation or desorption of amyl
xanthate ions observed. It is known that the electron transfer reaction might be occurring at
pinhole sites.22 With the immersion time extending from 2 to 1,260 minutes, noticeable
decreases in the peak current were observed in the cyclic voltammograms. It appears that the
amyl xanthate layer’s ability to block the transfer of electrons to the gold electrode surfaces
increased with time. After 1,260 minutes of immersion time, the voltammogram was of a
sigmoidal line shape, which indicates that the layers had the least pinholes and defects. Thus,
the layer was, from an electrochemical point of view, well packed. It is suggested that the
organic hydrocarbon part of the xanthate molecule first lies down on the gold surfaces, and
erects itself, approaching a conformation normal to the surface with the packing density
increasing with reaction time.20 It also indirectly indicates that the formation of a
close-packed monolayer of amyl xanthate onto gold surface was a rather slow process, which
required at least 20 hours.
4.4.2 Contact Angle Study
Equilibrium contact angle measurement would be another way to examine the
adsorption process of amyl xanthate ions onto gold surfaces. The result of in-situ contact
angle measurements on gold in amyl xanthate solutions with the captive bubble technique is
shown in Fig. 4.6. The gold-coated glass plates were hydrophobized by in-situ adsorption
using a range of aqueous concentration (1 × 10⁻⁶, 5 × 10⁻⁶ and 1 × 10⁻⁵ M) of amyl xanthate
105
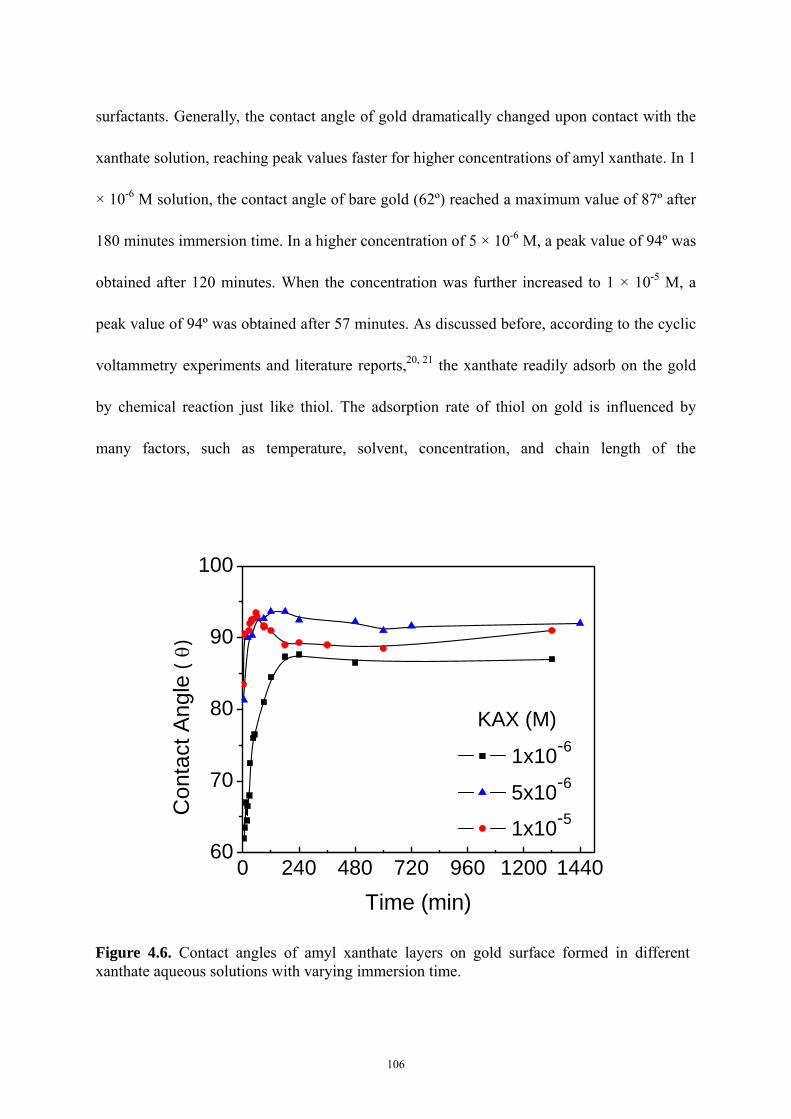
surfactants. Generally, the contact angle of gold dramatically changed upon contact with the
xanthate solution, reaching peak values faster for higher concentrations of amyl xanthate. In 1
× 10-6 M solution, the contact angle of bare gold (62º) reached a maximum value of 87º after
180 minutes immersion time. In a higher concentration of 5 × 10⁻⁶ M, a peak value of 94º was
obtained after 120 minutes. When the concentration was further increased to 1 × 10⁻⁵ M, a
peak value of 94º was obtained after 57 minutes. As discussed before, according to the cyclic
voltammetry experiments and literature reports,20, 21 the xanthate readily adsorb on the gold
by chemical reaction just like thiol. The adsorption rate of thiol on gold is influenced by
many factors, such as temperature, solvent, concentration, and chain length of the
0 240 480 720 960 1200 144060
70
80
90
100
1x10⁻⁶ 5x10⁻⁶
1x10⁻⁵Con
tact
Ang
le (
θ)
Time (min)
KAX (M)
Figure 4.6. Contact angles of amyl xanthate layers on gold surface formed in different xanthate aqueous solutions with varying immersion time.
106
adsorbate.23, 24 A xanthate monolayer forms with the polar head group in contact with gold,17
and the methyl group (-CH3) extends toward the aqueous phase, rendering the gold surface
hydrophobic.
At higher concentrations (5 × 10⁻⁶ M and 1 × 10⁻⁵ M), the adsorption process was
characterized by two distinct phases: a rapid adsorption followed by slower process. Within 5
minutes, the contact angles were close to the peak values. This initial, rapid adsorption was
followed by a slower period lasting 1 hour at 1 × 10⁻⁵ M PAX and 2 hours at 5 × 10⁻⁶ M PAX.
The maximum values (94º) were the same for 5 × 10⁻⁶ M and 1 × 10⁻⁵ M, indicating that the a
full monolayer of xanthate formed on gold when the contact angle reached the peak value.
The contact angles of gold decreased after reaching the maximum values. It is supposed that a
physisorbed adlayer of xanthate, which reversely oriented with polar group toward the
aqueous phase, was formed on top of a chemisorbed monolayer. According to the CV
experiment conducted in a solution containing 1 × 10⁻⁵ M PAX and ferrocyanide/ferricyanide
mixture solutions, the blocking capability reached the highest level after an immersion time
of 21 hours. While the contact angle measurements show that the hydrophobicity reached
maximum value after 1 hour in 1 × 10⁻⁵ M xanthate solution. It suggests that after the
xanthate completely covered the gold surface, the monolayer took a much longer time (21
hours) to reorganize itself and formed a close-packed monolayer. In a very dilute solution of
1 × 10⁻⁶ M, the contact angle reached maximum value of 87º and stayed constant as time
elapsed. The maximum contact angle on xanthate-coated gold was, however, less than the
contact angle of 94º for the full coverage of xanthate. This indicates that at low
concentrations, the entirety of xanthate molecules from the bulk solution migrated to the gold
107
surface without completely covering the gold surfaces. As suggested by Persson et al.,20 the
hydrocarbon chain lay down on the gold surface at low coverage densities, but erected itself
with a conformation normal to the surface when the coverage densities increased.
According to the Young’s equation, the changes of contact angle θ for gold surface
can be affected by changes in the surface tension γlv of a xanthate solution, the surface tension
γsv of gold, and the tension γsl of gold/liquid. The Young’s equation is shown below:
lv
slsv
γγγθ −
=cos (4.2)
When a gold plate was placed in an amyl xanthate solution (e.g., 5 × 10⁻⁶ M), the amyl
xanthate ions from the aqueous solution migrated and adsorbed on gold, making the gold
surface hydrophobic. Under such conditions, the surface tension γlv of a xanthate liquid did
not change with time. (Xanthate has no surface activity at the air/water interface due to short
hydrocarbon chain.) Compared to the surface tension γsv of xanthate-coated gold, the
interfacial tension γsl at the xanthate-coated gold/liquid interface changed much more with
immersion time. The interfacial tension γsl increased as more amyl xanthate ions adsorbed
onto the gold surface with the non-polar methyl group exposed to water, increasing contact
angles. After a monolayer was formed on gold, the additional xanthate molecules started to
adsorb on the monolayer with inverse orientation, causing a decrease for the interfacial
tension γsl , thereby decreasing the hydrophobicity.
4.4.3 Surface Force Measurement
Figure 4.7 shows the surface forces measured as a function of immersion time
between a flat gold-coated glass slide and a gold microsphere in a 1 × 10⁻⁶ M PAX solution.
108
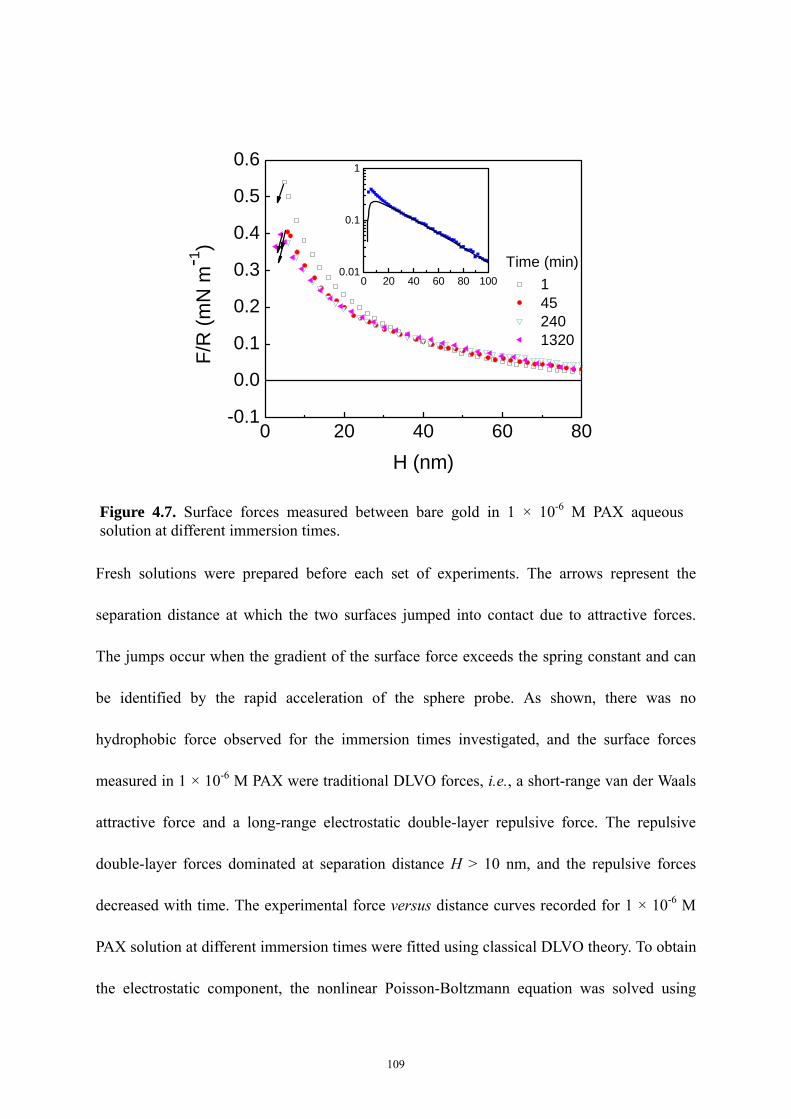
0 20 40 60 80-0.1
0.0
0.1
0.2
0.3
0.4
0.5
0.6
0 20 40 60 80 1000.01
0.1
1
1 45 240 1320
F/R
(mN
m-1
)
H (nm)
Time (min)
Figure 4.7. Surface forces measured between bare gold in 1 × 10⁻⁶ M PAX aqueous solution at different immersion times.
Fresh solutions were prepared before each set of experiments. The arrows represent the
separation distance at which the two surfaces jumped into contact due to attractive forces.
The jumps occur when the gradient of the surface force exceeds the spring constant and can
be identified by the rapid acceleration of the sphere probe. As shown, there was no
hydrophobic force observed for the immersion times investigated, and the surface forces
measured in 1 × 10⁻⁶ M PAX were traditional DLVO forces, i.e., a short-range van der Waals
attractive force and a long-range electrostatic double-layer repulsive force. The repulsive
double-layer forces dominated at separation distance H > 10 nm, and the repulsive forces
decreased with time. The experimental force versus distance curves recorded for 1 × 10⁻⁶ M
PAX solution at different immersion times were fitted using classical DLVO theory. To obtain
the electrostatic component, the nonlinear Poisson-Boltzmann equation was solved using
109
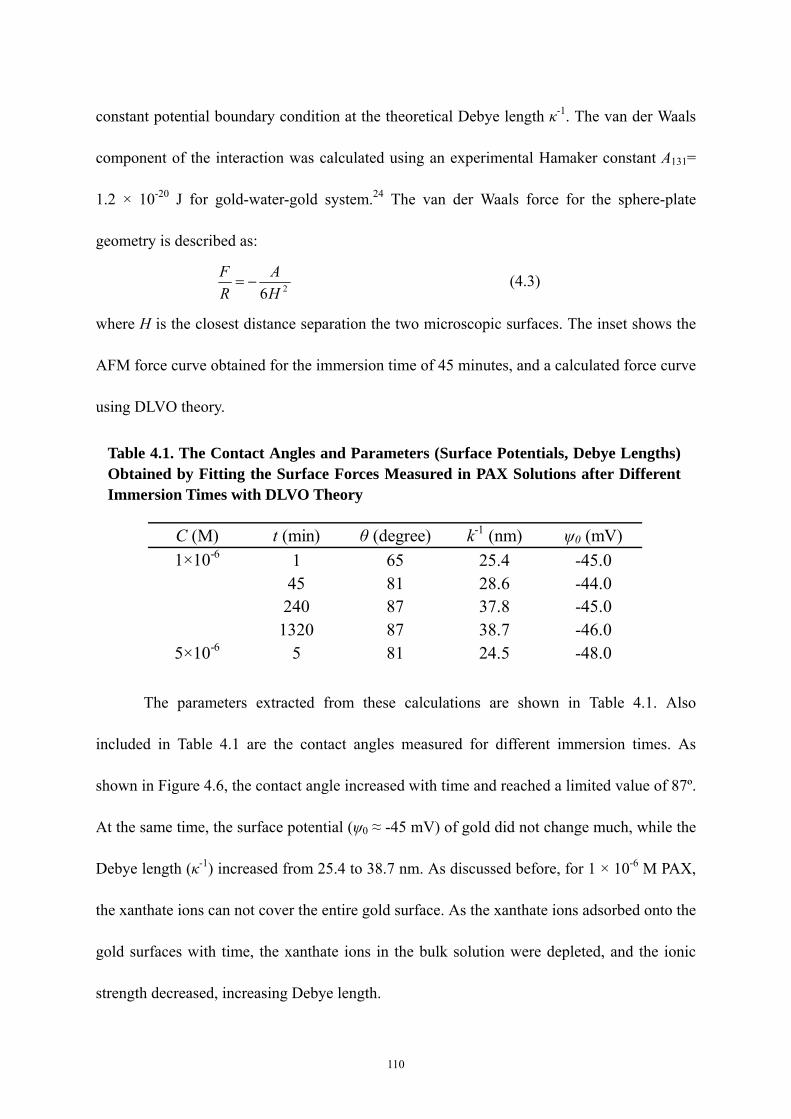
constant potential boundary condition at the theoretical Debye length κ-1. The van der Waals
component of the interaction was calculated using an experimental Hamaker constant A131=
1.2 × 10⁻²⁰ J for gold-water-gold system.24 The van der Waals force for the sphere-plate
geometry is described as:
26HA
RF
−= (4.3)
where H is the closest distance separation the two microscopic surfaces. The inset shows the
AFM force curve obtained for the immersion time of 45 minutes, and a calculated force curve
using DLVO theory.
Table 4.1. The Contact Angles and Parameters (Surface Potentials, Debye Lengths) Obtained by Fitting the Surface Forces Measured in PAX Solutions after Different Immersion Times with DLVO Theory
C (M) t (min) θ (degree) k-1 (nm) ψ0 (mV) 1 65 25.4 -45.0
45 81 28.6 -44.0 240 87 37.8 -45.0
1×10⁻⁶
1320 87 38.7 -46.0 5×10⁻⁶ 5 81 24.5 -48.0
The parameters extracted from these calculations are shown in Table 4.1. Also
included in Table 4.1 are the contact angles measured for different immersion times. As
shown in Figure 4.6, the contact angle increased with time and reached a limited value of 87º.
At the same time, the surface potential (ψ0 ≈ -45 mV) of gold did not change much, while the
Debye length (κ-1) increased from 25.4 to 38.7 nm. As discussed before, for 1 × 10⁻⁶ M PAX,
the xanthate ions can not cover the entire gold surface. As the xanthate ions adsorbed onto the
gold surfaces with time, the xanthate ions in the bulk solution were depleted, and the ionic
strength decreased, increasing Debye length.
110
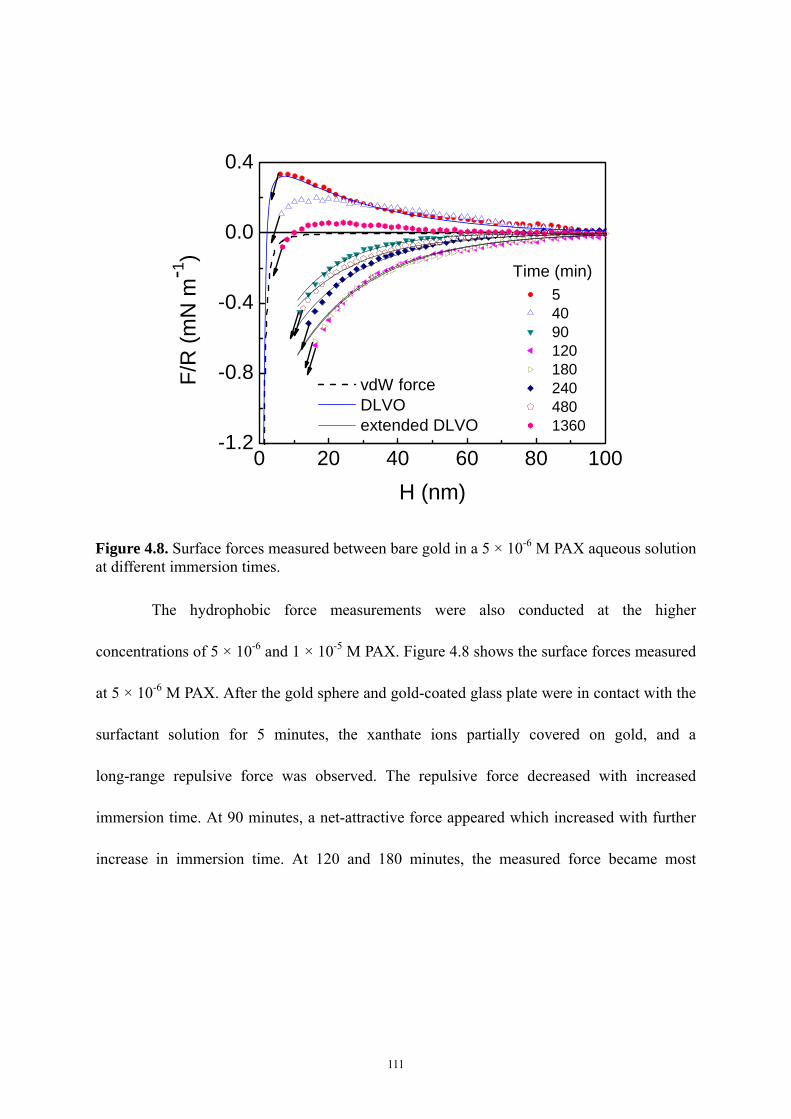
The hydrophobic force measurements were also conducted at the higher
concentrations of 5 × 10⁻⁶ and 1 × 10⁻⁵ M PAX. Figure 4.8 shows the surface forces measured
at 5 × 10⁻⁶ M PAX. After the gold sphere and gold-coated glass plate were in contact with the
surfactant solution for 5 minutes, the xanthate ions partially covered on gold, and a
long-range repulsive force was observed. The repulsive force decreased with increased
immersion time. At 90 minutes, a net-attractive force appeared which increased with further
increase in immersion time. At 120 and 180 minutes, the measured force became most
111
0 20 40 60 80 100-1.2
-0.8
-0.4
0.0
0.4
5 40 90 120 180 240 480 1360
vdW force DLVO extended DLVO
F/R
(mN
m-1
)
H (nm)
Time (min)
Figure 4.8. Surface forces measured between bare gold in a 5 × 10⁻⁶ M PAX aqueous solution at different immersion times.
0 20 40 60 80 100-0.8
-0.6
-0.4
-0.2
0.0
0.2
5 57 90 180
vdW force extended DLVO
F/R
(mN
m-1
)
H (nm)
Time (min)
Figure 4.9. Surface forces measured between bare gold in a 1 × 10⁻⁵ M PAX aqueous solution at different immersion times.
attractive. Presumably, the gold surfaces were completely covered by monolayers of xanthate.
After a 240 minutes immersion time, the attractive force decreased, probably due to the
inverse orientation of the physisorbed xanthate adlayer.
The results obtained in a 1 × 10⁻⁵ M PAX solution are presented in Figure 4.9. At this
high concentration, the gold surfaces were completely covered by xanthate after 5 and 57
minutes of immersion times, and gave rise to the strongest attraction. After the 90 minutes of
immersion time, the additional xanthate ions adsorbed on the underlying chemisorbed
monolayer with reverse orientation, which gave rise to a weaker attractive force. The
attractive force appeared sooner in 5 × 10⁻⁶ M than in 1 × 10⁻⁵ M PAX solution. According to
the contact angle measurements, the xanthate adsorption process is a concentration dependent
112
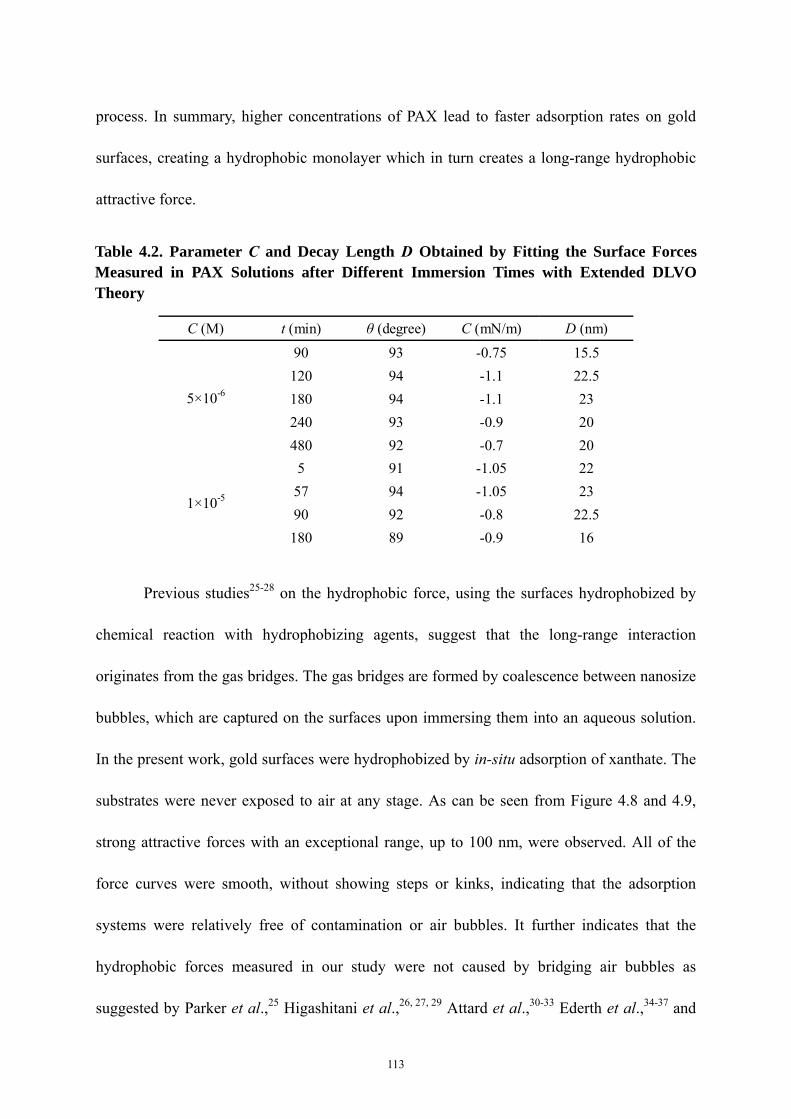
process. In summary, higher concentrations of PAX lead to faster adsorption rates on gold
surfaces, creating a hydrophobic monolayer which in turn creates a long-range hydrophobic
attractive force.
Table 4.2. Parameter C and Decay Length D Obtained by Fitting the Surface Forces Measured in PAX Solutions after Different Immersion Times with Extended DLVO Theory
C (M) t (min) θ (degree) C (mN/m) D (nm) 90 93 -0.75 15.5 120 94 -1.1 22.5 180 94 -1.1 23 240 93 -0.9 20
5×10⁻⁶
480 92 -0.7 20 5 91 -1.05 22
57 94 -1.05 23 90 92 -0.8 22.5
1×10⁻⁵
180 89 -0.9 16
Previous studies25-28 on the hydrophobic force, using the surfaces hydrophobized by
chemical reaction with hydrophobizing agents, suggest that the long-range interaction
originates from the gas bridges. The gas bridges are formed by coalescence between nanosize
bubbles, which are captured on the surfaces upon immersing them into an aqueous solution.
In the present work, gold surfaces were hydrophobized by in-situ adsorption of xanthate. The
substrates were never exposed to air at any stage. As can be seen from Figure 4.8 and 4.9,
strong attractive forces with an exceptional range, up to 100 nm, were observed. All of the
force curves were smooth, without showing steps or kinks, indicating that the adsorption
systems were relatively free of contamination or air bubbles. It further indicates that the
hydrophobic forces measured in our study were not caused by bridging air bubbles as
suggested by Parker et al.,25 Higashitani et al.,26, 27, 29 Attard et al.,30-33 Ederth et al.,34-37 and
113
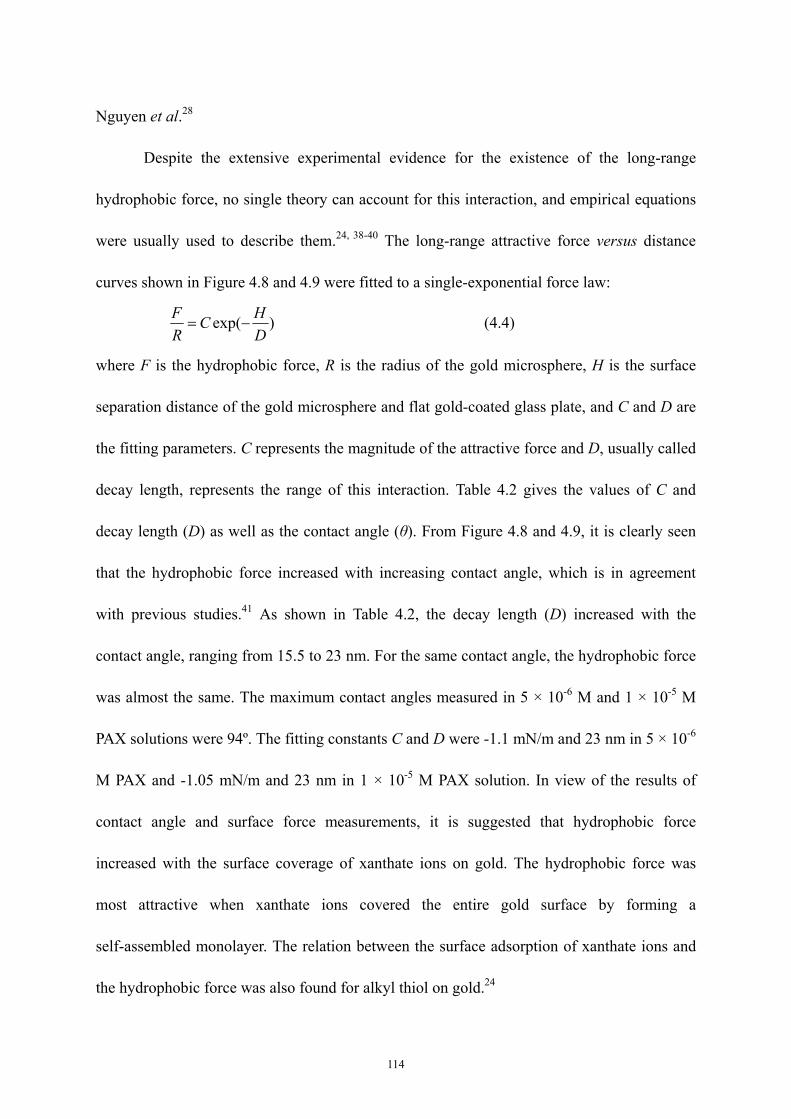
Nguyen et al.28
Despite the extensive experimental evidence for the existence of the long-range
hydrophobic force, no single theory can account for this interaction, and empirical equations
were usually used to describe them.24, 38-40 The long-range attractive force versus distance
curves shown in Figure 4.8 and 4.9 were fitted to a single-exponential force law:
)exp(DHC
RF
−= (4.4)
where F is the hydrophobic force, R is the radius of the gold microsphere, H is the surface
separation distance of the gold microsphere and flat gold-coated glass plate, and C and D are
the fitting parameters. C represents the magnitude of the attractive force and D, usually called
decay length, represents the range of this interaction. Table 4.2 gives the values of C and
decay length (D) as well as the contact angle (θ). From Figure 4.8 and 4.9, it is clearly seen
that the hydrophobic force increased with increasing contact angle, which is in agreement
with previous studies.41 As shown in Table 4.2, the decay length (D) increased with the
contact angle, ranging from 15.5 to 23 nm. For the same contact angle, the hydrophobic force
was almost the same. The maximum contact angles measured in 5 × 10⁻⁶ M and 1 × 10⁻⁵ M
PAX solutions were 94º. The fitting constants C and D were -1.1 mN/m and 23 nm in 5 × 10⁻⁶
M PAX and -1.05 mN/m and 23 nm in 1 × 10⁻⁵ M PAX solution. In view of the results of
contact angle and surface force measurements, it is suggested that hydrophobic force
increased with the surface coverage of xanthate ions on gold. The hydrophobic force was
most attractive when xanthate ions covered the entire gold surface by forming a
self-assembled monolayer. The relation between the surface adsorption of xanthate ions and
the hydrophobic force was also found for alkyl thiol on gold.24
114
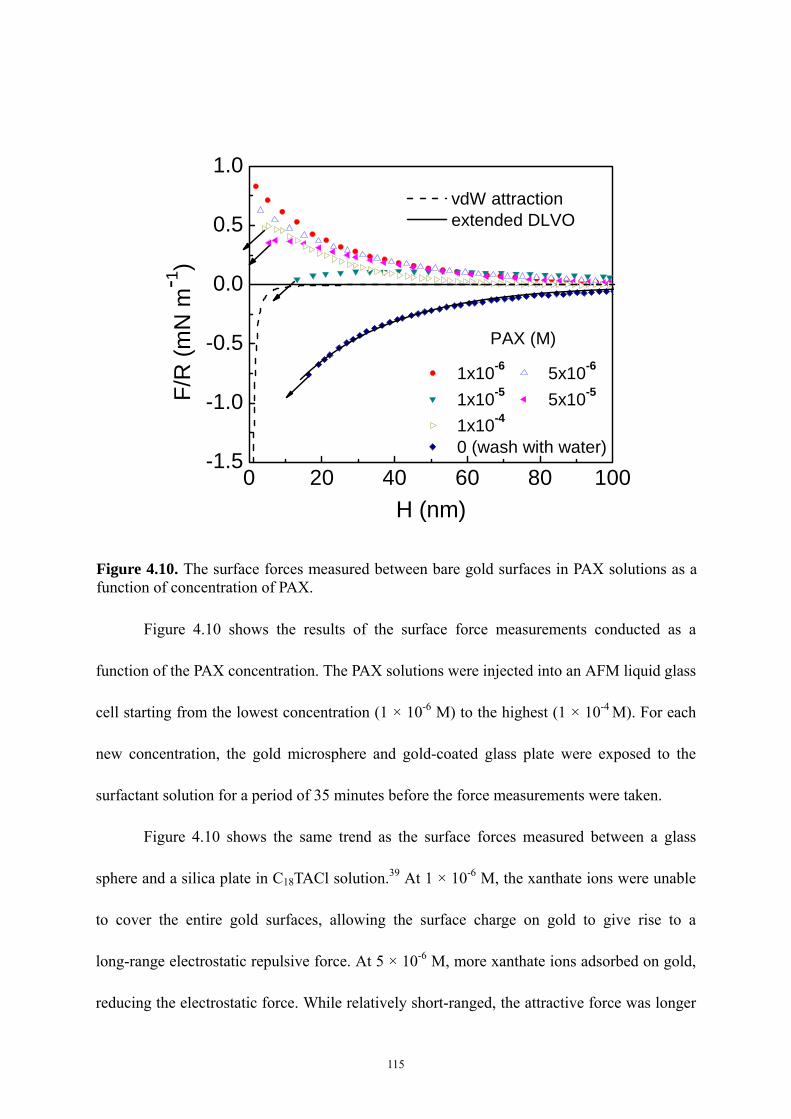
0 20 40 60 80 100-1.5
-1.0
-0.5
0.0
0.5
1.0 vdW attraction extended DLVO
1x10⁻⁶ 5x10⁻⁶
1x10⁻⁵ 5x10⁻⁵
1x10⁻⁴
0 (wash with water)
F/R
(mN
m-1
)
H (nm)
PAX (M)
Figure 4.10. The surface forces measured between bare gold surfaces in PAX solutions as a function of concentration of PAX.
Figure 4.10 shows the results of the surface force measurements conducted as a
function of the PAX concentration. The PAX solutions were injected into an AFM liquid glass
cell starting from the lowest concentration (1 × 10⁻⁶ M) to the highest (1 × 10⁻⁴ M). For each
new concentration, the gold microsphere and gold-coated glass plate were exposed to the
surfactant solution for a period of 35 minutes before the force measurements were taken.
Figure 4.10 shows the same trend as the surface forces measured between a glass
sphere and a silica plate in C18TACl solution.39 At 1 × 10⁻⁶ M, the xanthate ions were unable
to cover the entire gold surfaces, allowing the surface charge on gold to give rise to a
long-range electrostatic repulsive force. At 5 × 10⁻⁶ M, more xanthate ions adsorbed on gold,
reducing the electrostatic force. While relatively short-ranged, the attractive force was longer
115
than the van der Waals force (represented as the dashed line), causing the gold sphere to jump
to the gold-coated glass surface at a separation distance of 17 nm. This attraction was actually
the hydrophobic force, and the repulsive force was the electrostatic force caused by the
physisorbed xanthate layer with reverse orientation. At 5 × 10⁻⁵ M, the hydrophobic force
decreased, represented by the decreased jump distance (H = 9 nm). When the concentration
of PAX was increased to 1 × 10⁻⁴ M, an increase in surface charge and decrease in surface
hydrophobicity were observed, caused by an adsorption of amyl xanthate ions on the
chemisorbed monolayer. The repulsive electrostatic force increased and the hydrophobic
force decreased with a jump distance of 5 nm. After the force measurement in 1 × 10⁻⁴ M
PAX, the AFM liquid cell was flushed with nanopure water, replacing the xanthate solution.
The force measurement revealed the existence of a strongly attractive hydrophobic force with
a long range of up to 100 nm. This means that after water washing, the physisorbed adlayer
of xanthate was removed, leaving the chemisorbed monolayer intact and giving rise to the
long-range hydrophobic force.
The force measurement was also conducted after the gold sphere and gold-coated
glass plate were immersed in 1 × 10⁻⁵ M potassium ethyl xanthate (KEX) solution for 6 hours.
As shown in Figure 4.11, the red dotted line represents the force measured in KEX solution.
The force was attractive and jumped at short separation distance. The thin dashed black line
represents the van der Waals force calculated using an experimental Hamaker constant of 1.2
× 10-20 J. It is shown clearly that the measured attraction was smaller than the van der Waals
force. It is speculated that the measured force was a combination of attractive hydrophobic
force and a repulsive electrostatic force due to the physisorption of KEX. This physisorbed
116
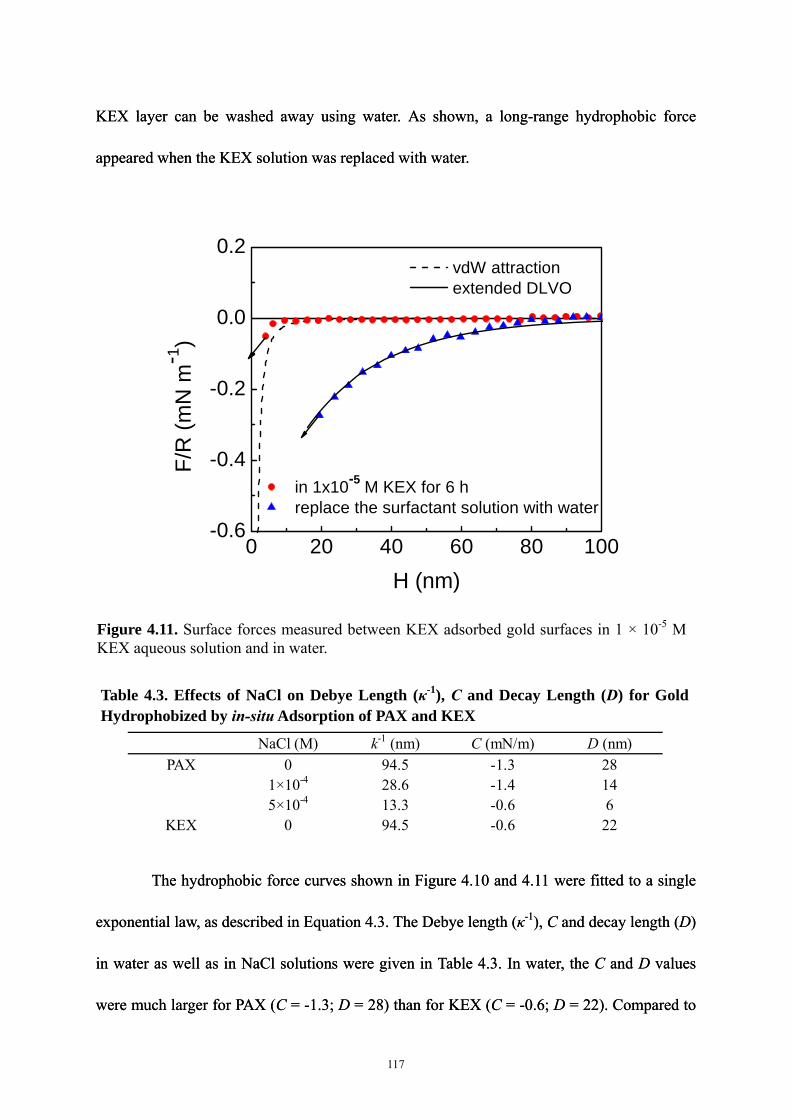
KEX layer can be washed away using water. As shown, a long-range hydrophobic force
appeared when the KEX solution was replaced with water.
KEX layer can be washed away using water. As shown, a long-range hydrophobic force
appeared when the KEX solution was replaced with water.
0 20 40 60 80 100-0.6
-0.4
-0.2
0.0
0.2
in 1x10⁻⁵ M KEX for 6 h replace the surfactant solution with water
vdW attraction extended DLVO
F/R
(mN
m-1
)
H (nm)
Figure 4.11. Surface forces measured between KEX adsorbed gold surfaces in 1 × 10⁻⁵ M KEX aqueous solution and in water.
Table 4.3. Effects of NaCl on Debye Length (κ-1), C and Decay Length (D) for Gold Hydrophobized by in-situ Adsorption of PAX and KEX
NaCl (M) k-1 (nm) C (mN/m) D (nm) PAX 0 94.5 -1.3 28
1×10⁻⁴ 28.6 -1.4 14 5×10⁻⁴ 13.3 -0.6 6
KEX 0 94.5 -0.6 22
The hydrophobic force curves shown in Figure 4.10 and 4.11 were fitted to a single
exponential law, as described in Equation 4.3. The Debye length (κ-1), C and decay length (D)
in water as well as in NaCl solutions were given in Table 4.3. In water, the C and D values
were much larger for PAX (C = -1.3; D = 28) than for KEX (C = -0.6; D = 22). Compared to
117
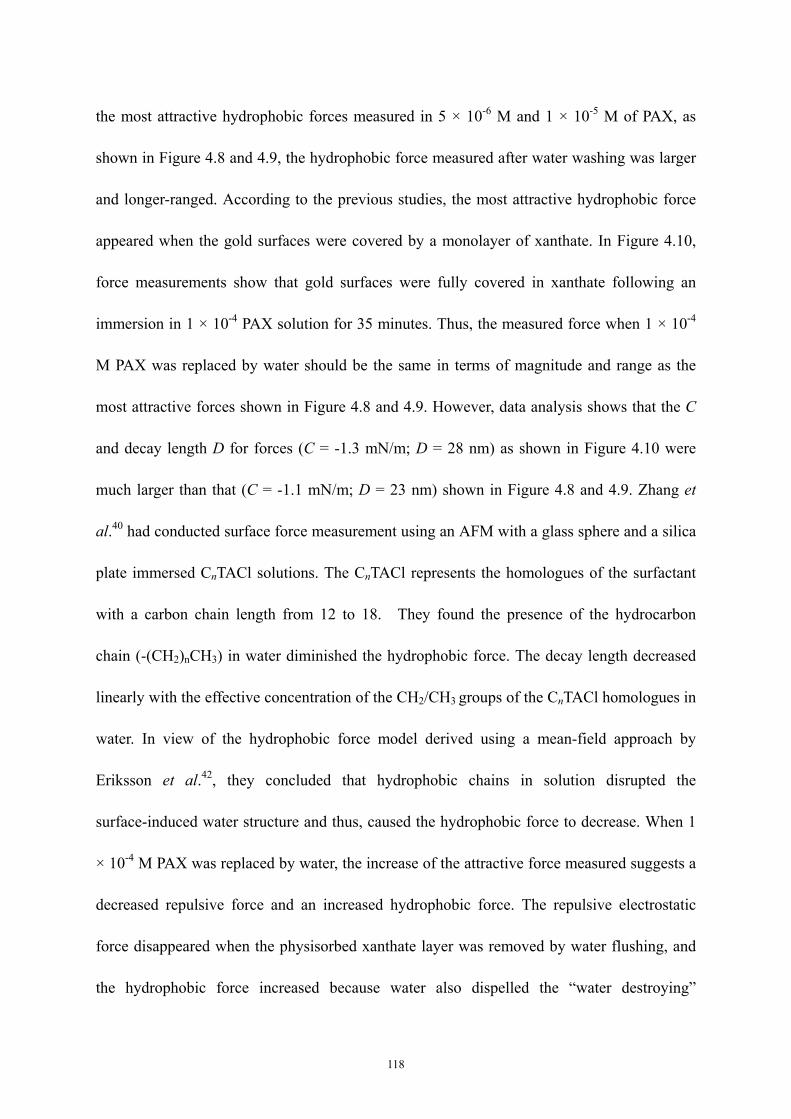
the most attractive hydrophobic forces measured in 5 × 10⁻⁶ M and 1 × 10⁻⁵ M of PAX, as
shown in Figure 4.8 and 4.9, the hydrophobic force measured after water washing was larger
and longer-ranged. According to the previous studies, the most attractive hydrophobic force
appeared when the gold surfaces were covered by a monolayer of xanthate. In Figure 4.10,
force measurements show that gold surfaces were fully covered in xanthate following an
immersion in 1 × 10⁻⁴ PAX solution for 35 minutes. Thus, the measured force when 1 × 10⁻⁴
M PAX was replaced by water should be the same in terms of magnitude and range as the
most attractive forces shown in Figure 4.8 and 4.9. However, data analysis shows that the C
and decay length D for forces (C = -1.3 mN/m; D = 28 nm) as shown in Figure 4.10 were
much larger than that (C = -1.1 mN/m; D = 23 nm) shown in Figure 4.8 and 4.9. Zhang et
al.40 had conducted surface force measurement using an AFM with a glass sphere and a silica
plate immersed CnTACl solutions. The CnTACl represents the homologues of the surfactant
with a carbon chain length from 12 to 18. They found the presence of the hydrocarbon
chain (-(CH2)nCH3) in water diminished the hydrophobic force. The decay length decreased
linearly with the effective concentration of the CH2/CH3 groups of the CnTACl homologues in
water. In view of the hydrophobic force model derived using a mean-field approach by
Eriksson et al.42, they concluded that hydrophobic chains in solution disrupted the
surface-induced water structure and thus, caused the hydrophobic force to decrease. When 1
× 10-4 M PAX was replaced by water, the increase of the attractive force measured suggests a
decreased repulsive force and an increased hydrophobic force. The repulsive electrostatic
force disappeared when the physisorbed xanthate layer was removed by water flushing, and
the hydrophobic force increased because water also dispelled the “water destroying”
118
hydrocarbon chain.
0 20 40 60 80 100-0.8
-0.6
-0.4
-0.2
0.0
0.2 vdW attraction extended DLVO
5x10⁻⁴
1x10⁻⁴
0
F/
R (m
N m
-1)
H (nm)
NaCl (M)
Figure 4.12. Surface force measured between PAX hydrophobic layers in different concentrations of NaCl aqueous solution.
After flushing with nanopure water, the liquid cell was filled by NaCl solutions with
two different concentrations (5 × 10⁻⁴ M and 1 × 10⁻⁴ M). The effect of added salt on the
hydrophobic force was investigated, and the experimental data are shown in Fig. 4.12 and the
fitted parameters are given in Table 4.3. It is shown that the addition of NaCl decreased the
magnitude and range of the attractive hydrophobic force, which is consistent with previous
investigations.39, 43-46 Because of its salt dependent character, the hydrophobic force was
regarded as the attraction due to electrostatic correlations in an early study.47 A charged-patch
model developed by Miklavic et al.48 predict that the attraction should be exponentially
decaying at a rate equal to one half the Debye length (κ-1), and data analysis shows that the
119
decay lengths in 1 × 10⁻⁴ M and 5 × 10⁻⁴ M are actually equal to one half of the corresponding
Debye length. However, Miklavic’s model presumes that the positive and negative surfactant
patches on the two surfaces are free to migrate to lower the interaction. Because xanthate ions
adsorbed on gold to form strong covalent bonding, it is not possible for them to migrate
freely on gold. The “patchy bilayer” model developed by Meyer et al.49 suggests that the
long-range hydrophobic force measured between two surfactant-coated surfaces is a
long-range electrostatic attraction, which results from the natural alignment of oppositely
charged surfactant domain as two such surfaces approach. Neither the “charged patch” nor
the “patchy bilayer” model can explain the long-range hydrophobic force in the present work.
It is believed that the addition of NaCl disturbs the water structure between the hydrophobic
surfaces.40
4.5 Conclusions
In the present work, cyclic voltammetry (CV), contact angle and surface force
measurements were conducted to study the adsorption of amyl xanthate on gold and to
measure the hydrophobic forces between xanthate-coated surfaces. The CV test verified the
chemical adsorption of amyl xanthate ions on gold. The contact angle and surface force
measurements revealed the reverse orientation of amyl xanthate on gold surfaces. According
to the surface force measurement, the attractive hydrophobic force which was much greater in
magnitude and range than expected for the van der Waals force has been detected at the high
water contact angles. It has been found also that xanthate adsorption resulted in multi-layer
formation. The molecules adsorbed in the second-layer adsorbed with inverse orientation,
120
which in turn caused a decrease in hydrophobic force. The molecules adsorbed in the second
and subsequent layers can be readily washed by water, which gives rise to a strong
hydrophobic force.
4.6 Acknowledgment
This work was funded by National Energy Technology Laboratory, U. S. Department
of Energy (DE-FC26-02NT41607).
4.7 References
1. Yoon, R.-H.; Mao, L., J. Colloid Interface Sci. 1996, 181, 613-626.
2. Derjaguin, B. V.; Dukhin, S. S., Trans. Inst. Min. Metall. 1961, 70, 221-246.
3. Derjaguin, B. V.; Dukhin, S. S., In Proceedings 13th Int. Miner. Process. Cong.,
Warszawa, 1979; Vol. 2, pp 1261-1287.
4. Laskowski, J.; Kitchener, J. A., J. Colloid Interface Sci. 1969, 29, 670-679.
5. Blake, T. D.; Kitchener, J. A., J. Chem. Soc., Faraday Trans. 1 1972, 68, 1435-1442.
6. Israelachvili, J.; Pashley, R., Nature 1982, 300, 341-342.
7. Yoon, R.-H.; Aksoy, B. S., J. Colloid Interface Sci. 1999, 211, 1-10.
8. Wang, L.; Yoon, R.-H., Langmuir 2004, 20, 11457-11464.
9. Tzhayik, O.; Sawant, P.; Efrima, S.; Kovalev, E.; Klug, J. T., Langmuir 2002, 18,
3364-3369.
10. Rao, S. R., Xanthates and Related Compounds. In Marcel Dekker, Inc.: New York, 1971;
pp 15-18.
121
11. Ducker, W. A.; Senden, T. J.; Pashley, R. M., Nature 1991, 353, 239-241.
12. Ducker, W. A.; Senden, T. J., Langmuir 1992, 8, 1831-1836.
13. Cleveland, J. P.; Manne, S.; Bocek, D.; Hansma, P. K., Rev. Sci. Instrum. 1993, 64, (2),
403-405.
14. Woods, R., J. Phys. Chem. 1971, 75, 354-362.
15. Leppinen, J. O.; Yoon, R.-H.; Mielczarski, J. A., Colloids Surf. 1991, 61, 189-203.
16. Talonen, P.; Sundholm, G.; Li, W.-H.; Floate, S.; Nichols, R. J., Phys. Chem. Chem. Phys.
1999, 1, 3661-3666.
17. Gothelf, K. V., J. Electroanal. Chem. 2000, 494, 147-150.
18. Sondag-Huethorst, J. A. M.; Fokkink, L. G. J., Langmuir 1992, 8, 2560-2566.
19. Woods, R.; Hope, G. A.; Brown, G. M., Colloids Surf., A 1998, 137, 339-344.
20. Persson, N. O.; Uvdal, K.; Liedberg, B.; Hellsten, M., Progr Colloid Polym Sci 1992, 88,
100-109.
21. Ihs, A.; Uvdal, K.; Liedberg, B., Langmuir 1993, 9, 733-739.
22. Finklea, H. O.; Snider, D. A.; Fedyk, J., Langmuir 1993, 9, 3660-3667.
23. Bain, C. D.; Troughton, E. B.; Tao, Y.-T.; Evall, J.; Whitesides, G. M.; Nuzzo, R. G., J.
Am. Chem. Soc. 1989, 111, 321-335.
24. Wang, J.; Yoon, R.-H., Langmuir 2008, 24, 7889-7896.
25. Parker, J. L.; Claesson, P. M.; Attard, P., J. Phys. Chem. 1994, 98, 8468-8480.
26. Ishida, N.; Sakamoto, M.; Miyahara, M.; Higashitani, K., Langmuir 2000, 16, (13),
5681-5687.
27. Ishida, N.; Sakamoto, M.; Miyahara, M.; Higashitani, K., J. Colloid Interface Sci. 2002,
122
253, 112-116.
28. Nguyen, A. V.; Nalaskowski, J.; Miller, J. D.; Butt, H.-J., Int. J. Miner. Process. 2003, 72,
215-225.
29. Sakamoto, M.; Kanda, Y.; Miyahara, M.; Higashitani, K., Langmuir 2002, 18,
5713-5719.
30. Carambassis, A.; Jonker, L. C.; Attard, P.; Rutland, M. W., Phys. Rev. Lett. 1998, 80, (24),
5357-5360.
31. Attard, P., Langmuir 2000, 16, 4455-4466.
32. Tyrrell, J. W. G.; Attard, P., Phys. Rev. Lett. 2001, 87, (17), 176104-1.
33. Attard, P.; Moody, M. P.; Tyrrell, J. W. G., Physica A 2002, 314, 696-705.
34. Ederth, T.; Claesson, P.; Liedberg, B., Langmuir 1998, 14, 4782-4789.
35. Ederth, T., J. Phys. Chem. B 2000, 104, 9704-9712.
36. Ederth, T.; Liedberg, B., Langmuir 2000, 16, 2177-2184.
37. Ederth, T.; Tamada, K.; Claesson, P. M.; Valiokas, R.; Colorado, R.; Graupe, M.;
Shmakova, O. E.; Lee, T. R., J. Colloid Interface Sci. 2001, 235, 391-397.
38. Rabinovich, Y. I.; Yoon, R.-H., Langmuir 1994, 10, 1903-1909.
39. Zhang, J.; Yoon, R.-H.; Mao, M.; Ducker, W. A., Langmuir 2005, 21, 5831-5841.
40. Zhang, J.; Yoon, R.-H.; Eriksson, J. C., Colloids Surf., A 2007, 300, 335-345.
41. Yoon, R.-H.; Ravishankar, S. A. R., J. Colloid Interface Sci. 1996, 179, 391-402.
42. Eriksson, J. C.; Ljunggren, S.; Claesson, P. M., J. Chem. Soc., Faraday Trans. 2 1989, 85,
(3), 163-176.
43. Claesson, P. M.; Christenson, H. K., J. Phys. Chem 1988, 92, 1650-1655.
123
44. Christenson, H. K.; Claesson, P. M.; Berg, J.; Herder, P. C., J. Phys. Chem. 1989, 93,
1472-1478.
45. Kekicheff, P.; Spalla, O., Phys. Rev. Lett. 1995, 75, (9), 1851-1855.
46. Claesson, P. M.; Blom, C. E.; Herder, P. C.; Ninham, B. W., J. Colloid Interface Sci.
1986, 114, (1), 234-242.
47. Attard, P., J. Phys. Chem. 1989, 93, (17), 6441-6444.
48. Miklavic, S. J.; Chan, D. Y. C.; White, L. R.; Healy, T. W., J. Phys. Chem. 1994, 98,
9022-9032.
49. Meyer, E. E.; Lin, Q.; Hassenkam, T.; Oroudjev, E.; Israelachvili, J. N., Proc. Nat. Acad.
Sci. U.S.A 2005, 102, 6839-6842.
124
Chapter 5
Surface Forces between Hydrophobized Gold Surfaces Submerged in
Alcohols and in Water-Ethanol Mixtures
5.1 Abstract
Hydrophobic surfaces prepared by the adsorption of alkanethiols of different chain
lengths onto a gold microsphere and a gold-coated flat glass plate were used to study the
long-range hydrophobic force. Direct surface force measurements were conducted in
air-equilibrated alcohols, water, and water/ethanol mixtures using an Atomic Force
Microscope (AFM) at room temperature. The force measurements in alcohols showed that
long range attractions existed in ethanol, 1-butanol and water between two C4SH-coated gold
surfaces. In methanol, the attractive force was slightly larger than the non-retarded van der
Waals force.
The surface forces measured on C4SH-, C12SH- and C16SH-coated gold surfaces in
water/ethanol mixtures were purely attractive, and the surface force curves were all smooth,
exhibiting no kinks or steps. With all of the three hydrophobic surfaces, the attraction was
strongest in pure water and pure ethanol. The attraction decreased in the ethanol-water
mixtures, its range and strength reaching a minimum at mole fractions in the range of 0.1 to
0.9, depending on the length of the hydrocarbon chain of the thiol used for hydrophobizing
the gold surfaces. For all three cases, the decay length (D) and pre-exponential constant (C)
passes through a minimum at the mole fraction of ethanol 0.2, indicating a transition from a
water structure to an ethanol structure. Considerations of thin film thermodynamics suggests
125
that at low ethanol concentration more of the ethanol is expelled from the film while more of
the water is expelled from the film at high ethanol concentration.
5.2 Background
For many years it has been recognized that both the water and ethanol surfaces
exposed to air at room temperature are characterized by anomalously low surface entropies.
Upon raising the temperature, however, the surface entropy increases. For a pure vapor-liquid
system, it passes through a pronounced maximum before vanishing at the critical
temperature.1 This type of behavior is anticipated also for water or ethanol in contact with a
(macroscopic) hydrophobic solid surface and can be explained, in a qualitative manner at
least, by invoking the notion of a surface-induced, H-bond-dependent, dynamic structure that
gradually becomes less extensive and less well-ordered at elevated temperatures.
Focusing on mixtures of water (1) and ethanol (2) in contact with air, we note that
upon raising the ethanol concentration, the surface tension at first drops quite rapidly for
alcohol mole fractions less than about 0.2 but only rather slowly, and almost linearly, in the
range above x2 ≈ 0.22, 3. From the surface tension curves and available vapor pressure data,4
Butler and Wightman5 showed that the Gibbs surface excess of ethanol, Γ2(1), passes through
a pronounced maximum at x2 = 0.17 (Figure 5.1). This maximum can be rationalized by
invoking that above x2 = 0.17, the interfacial structure and composition vary at a considerably
slower rate than the bulk composition, whereas the reverse holds true below this particular
mole fraction.
126
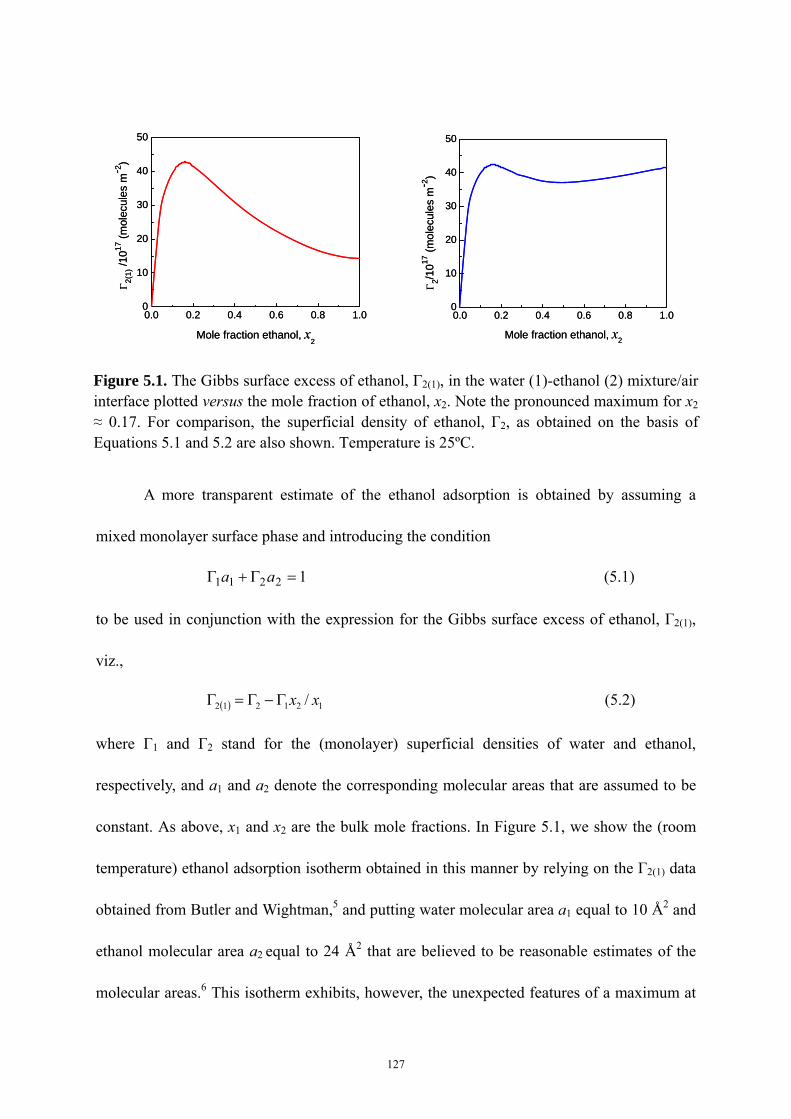
0.0 0.2 0.4 0.6 0.8 1.00
10
20
30
40
50
Γ 2(
1) /1
017 (m
olec
ules
m-2
)
Mole fraction ethanol, x2
0.0 0.2 0.4 0.6 0.8 1.00
10
20
30
40
50
Γ 2/10
17 (m
olec
ules
m-2
)
Mole fraction ethanol, x2
0.0 0.2 0.4 0.6 0.8 1.00
10
20
30
40
50
Γ 2(
1) /1
017 (m
olec
ules
m-2
)
Mole fraction ethanol, x2
0.0 0.2 0.4 0.6 0.8 1.00
10
20
30
40
50
Γ 2/10
17 (m
olec
ules
m-2
)
Mole fraction ethanol, x2
Figure 5.1. The Gibbs surface excess of ethanol, Γ2(1), in the water (1)-ethanol (2) mixture/air interface plotted versus the mole fraction of ethanol, x2. Note the pronounced maximum for x2
≈ 0.17. For comparison, the superficial density of ethanol, Γ2, as obtained on the basis of Equations 5.1 and 5.2 are also shown. Temperature is 25ºC.
A more transparent estimate of the ethanol adsorption is obtained by assuming a
mixed monolayer surface phase and introducing the condition
12211 =Γ+Γ aa (5.1)
to be used in conjunction with the expression for the Gibbs surface excess of ethanol, Γ2(1),
viz.,
( ) 121212 / xxΓ−Γ=Γ (5.2)
where Γ1 and Γ2 stand for the (monolayer) superficial densities of water and ethanol,
respectively, and a1 and a2 denote the corresponding molecular areas that are assumed to be
constant. As above, x1 and x2 are the bulk mole fractions. In Figure 5.1, we show the (room
temperature) ethanol adsorption isotherm obtained in this manner by relying on the Γ2(1) data
obtained from Butler and Wightman,5 and putting water molecular area a1 equal to 10 Å2 and
ethanol molecular area a2 equal to 24 Å2 that are believed to be reasonable estimates of the
molecular areas.6 This isotherm exhibits, however, the unexpected features of a maximum at
127
x2 = 0.13 and a faint minimum at x2 = 0.40, indicating a rather complex, non-ideal interfacial
behavior which the simplistic ansatz expressed by Equation 5.1 (in effect determining the
surface phase considered) is unable to cover in a proper manner. Nevertheless, there is no
question about the existence of a transition occurring between about x2 = 0.1 and x2 = 0.3,
from a laterally mixed to a layer-wise arranged, alcohol-rich interface.
By the same token, the solubility of e.g., oxygen in water-ethanol mixtures, studied
long ago by Shchukarev and Tolmacheva,7 was found to depend strongly on the structural
features of water for mole fractions less than x2 ≈ 0.2, whereas for higher mole fractions, the
formation of clusters of aggregated ethyl groups appear to be decisive for the oxygen
solubility. This is in line with more recent IR, x-ray and neutron diffraction results.8, 9
From sum-frequency vibration spectroscopy (SFVS), studies of water-alcohol
(methanol10 and ethanol11, 12) mixtures, it has been clarified that in the low concentration
range, the main event occurring is that dangling -OH groups (about one per 30 Å2) which
belong to the top layer of water molecules, successively become replaced by methyl
(water-methanol) or ethyl (water-ethanol) groups. At high alcohol mole fractions, a
hydrogen-bonded bilayer of alcohol molecules is present as the uppermost layer which
includes about twice as many alkyl groups as the number of dangling -OH groups originally
present in the case of a pure water surface. The purpose of our investigation, to be presented
below, was to investigate to what extent the structural changes occurring for alcohol-water
mixtures are reflected in the surface forces operating between hydrophobic solid surfaces
submerged in such mixtures. To this end, we have employed an AFM set-up and made use of
the colloidal probe technique.13, 14
128
5.3 Methods and Materials
5.3.1 Surface Force Measurements by Means of AFM
Surface force measurements were conducted at room temperature (22±1ºC) using a
Digital Instruments Nanoscope Ⅲ (Veeco Instruments, Inc., Santa Barbara, CA) atomic force
microscope (AFM). The AFM instrument was equipped with a contact mode fluid cell and a
scanner “E”. All AFM force measurements were carried out in a manner described earlier by
Zhang and Yoon.14 Triangular silicon nitride (Si3N4) cantilevers (Model: NP-20, Veeco probes)
were used for force measurement. The spring constant was calibrated according to the
Cleveland method.15 The force measurements were carried out without delay after thiol
monolayers had been generated on the gold substrates.
5.3.2 Reagents
A Nanopure Ⅲ (Barnstead, IA) water purification system was employed to obtain
double-distilled, deionized water with a resistivity of 18.2 MΩ/cm at 25ºC. To remove the
particulates in water, a submicron postfilter (0.2 μm in pore size, Fisher Scientific) was
integrated with the water purification unit. 1-butanethiol (C4SH, 97%, TCI America),
1-dodecanethiol (C12SH, 98%, Aldrich) and 1-hexadecanethiol (C16SH, ≧ 97%, TCI America)
were used to hydrophobize the gold substrates. Ethanol was obtained from AAPER alcohol,
KY; methanol (99.8%) from Fluka; and 1-butanol from Fisher Scientific. Other liquid
reagents, such as H2SO4 (98%, VMR International) and H2O2 (29.0-32.0%, Alfa Aesar), were
used to clean the gold plates. All reagents listed were used as received.
129
5.3.3 Gold Plates
The surface force measurements were carried out using gold micro-spheres and
gold-coated glass slides. Gold-coated glass slides were obtained by depositing gold onto glass
using a vacuum evaporator. A 50 Å chromium layer was first deposited, followed by coating
a 500 Å thick layer of gold. The chromium layer was necessary to ensure a strong adhesive
bonding between gold and glass.
5.3.4 Gold Probes
Gold spheres with suitable diameters were produced following the procedure devised
by Raiteri et al.16 A gold wire (0.0127 mm dia, 99.9%, Alfa Aesar) was connected to a power
supply (120V, AC), briefly creating a short circuit. This was done in a glass tray. A small
aerosol cloud of gold particles was produced in the spark. In this way, gold spheres with a
wide size distribution in the micrometer range were produced. Spheres with diameters 10~20
μm were chosen for the experiments. In each experiment, a gold sphere was glued onto a
cantilever with EPON 1004 resin (Shell Chemical Co) using a homemade three-dimensional
micromanipulator under an Olympus BH-2 light microscope.
5.3.5 Preparation of Hydrophobic Surfaces
To generate high-quality self-assembled thiol monolayer coatings, the gold substrates
were thoroughly cleaned prior to hydrophobizing them by thiol coating.17, 18 There are several
cleaning procedures available for gold that are based on “piranha” solution,19-21 chromic
acid22, 23 or UV/ozone treatment.18, 24 For the present investigation, a flat gold plate was first
130
cleaned by immersion into a boiling “piranha solution” (30:70 H2O2/H2SO4) for 20 minutes.
(WARNING: piranha solution reacts violently with organic matter, especially when hot, and
is extremely corrosive). The surface was then flushed with nano-pure water for 1 minute to
remove the residual acid, rinsed in pure ethanol for 2 minutes, and blow-dried with N2 gas.
The cleaned gold substrates were immediately contacted by a thiol solution.
A hot H2O2-H2SO4 mixture is an extremely strong oxidizing agent. It is not only
efficient in removing organic contaminants but also tends to oxidize the gold surface itself.17
The cleaning procedure results in a surface with zero water contact angle, which is due to
formation of gold oxide (Au2O3). The gold oxide is thermodynamically unstable in the
ambient and tends to decompose. It has been reported that ethanol reduces Au2O3 to gold.17, 18
In the present work, a gold plate rinsed in ethanol for 2 minutes gave a contact angle of 65o,
indicating that the solvent washing substantially removed the oxidation product.
As for cleaning the gold sphere, a given sphere was glued onto an AFM cantilever and
then cleaned by UV irradiation rather than being cleaned in the corrosive piranha solution.
This was adopted to avoid the possibility of destroying the glue holding the sphere onto the
cantilever. Typically, a gold sphere was flushed with ethanol, illuminated by a UV light (254
nm) for 2 hours, and then rinsed again with ethanol before being contacted in a thiol solution
for hydrophobization.
Hydrophobization of the gold surfaces was achieved by immersing the spheres and
plates in i) a 1 × 10⁻² mM C4SH-in-ethanol (absolute) solution for 5 hours, ii) a 1 × 10⁻² mM
C12SH-in-ethanol solution for 2 hours, and iii) a 1 × 10⁻² mM C16SH-in-ethanol solution for
10 minutes. The strong chemical bonding between the -SH group and the gold surface
131
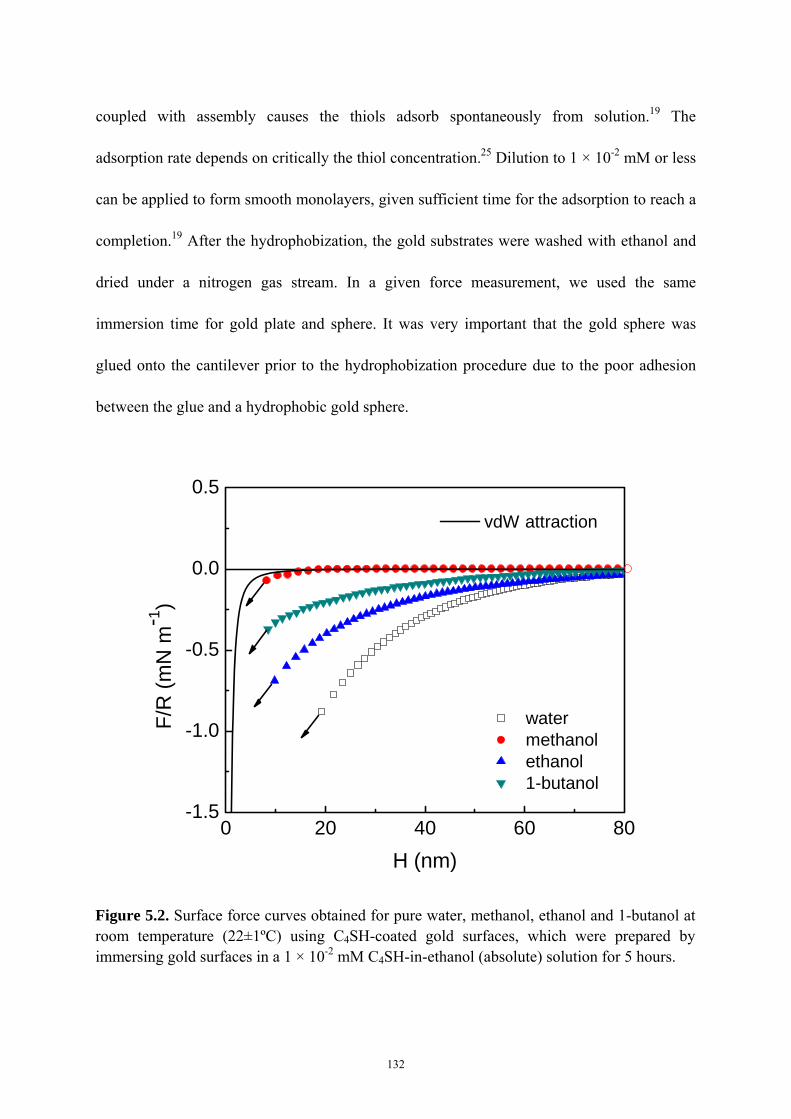
coupled with assembly causes the thiols adsorb spontaneously from solution.19 The
adsorption rate depends on critically the thiol concentration.25 Dilution to 1 × 10⁻² mM or less
can be applied to form smooth monolayers, given sufficient time for the adsorption to reach a
completion.19 After the hydrophobization, the gold substrates were washed with ethanol and
dried under a nitrogen gas stream. In a given force measurement, we used the same
immersion time for gold plate and sphere. It was very important that the gold sphere was
glued onto the cantilever prior to the hydrophobization procedure due to the poor adhesion
between the glue and a hydrophobic gold sphere.
132
0 20 40 60 80-1.5
-1.0
-0.5
0.0
0.5
vdW attraction
water methanol ethanol 1-butanol
F/R
(mN
m-1
)
H (nm)
Figure 5.2. Surface force curves obtained for pure water, methanol, ethanol and 1-butanol at room temperature (22±1ºC) using C4SH-coated gold surfaces, which were prepared by immersing gold surfaces in a 1 × 10⁻² mM C4SH-in-ethanol (absolute) solution for 5 hours.
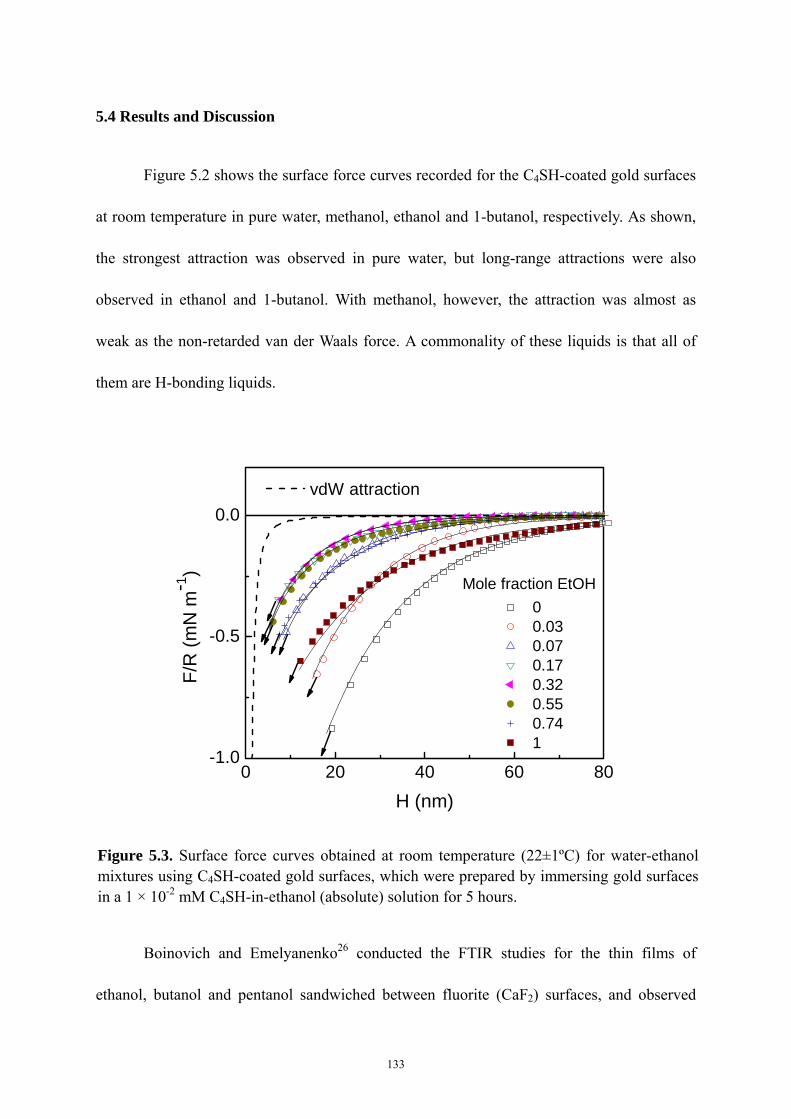
5.4 Results and Discussion
Figure 5.2 shows the surface force curves recorded for the C4SH-coated gold surfaces
at room temperature in pure water, methanol, ethanol and 1-butanol, respectively. As shown,
the strongest attraction was observed in pure water, but long-range attractions were also
observed in ethanol and 1-butanol. With methanol, however, the attraction was almost as
weak as the non-retarded van der Waals force. A commonality of these liquids is that all of
them are H-bonding liquids.
Figure 5.3. Surface force curves obtained at room temperature (22±1ºC) for water-ethanol mixtures using C4SH-coated gold surfaces, which were prepared by immersing gold surfaces in a 1 × 10⁻² mM C4SH-in-ethanol (absolute) solution for 5 hours.
0 20 40 60 80-1.0
-0.5
0.0 vdW attraction
0 0.03 0.07 0.17 0.32 0.55 0.74 1
F/R
(mN
m-1
)
H (nm)
Mole fraction EtOH
Boinovich and Emelyanenko26 conducted the FTIR studies for the thin films of
ethanol, butanol and pentanol sandwiched between fluorite (CaF2) surfaces, and observed
133
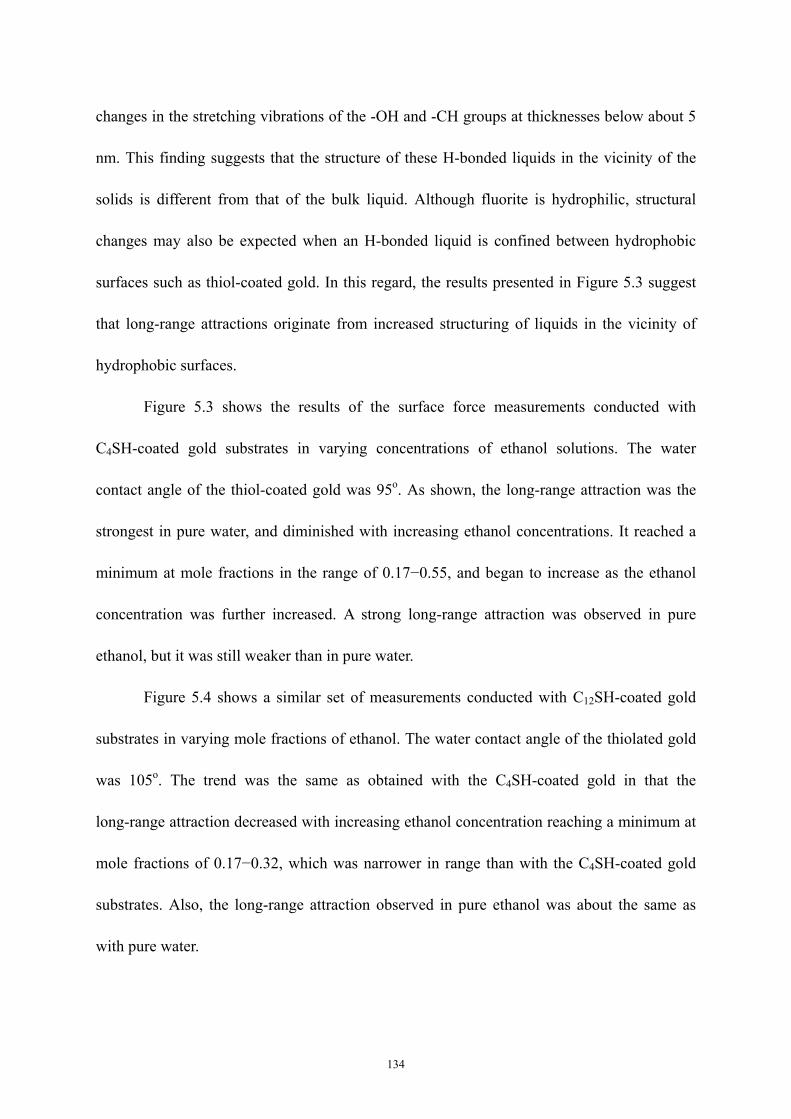
changes in the stretching vibrations of the -OH and -CH groups at thicknesses below about 5
nm. This finding suggests that the structure of these H-bonded liquids in the vicinity of the
solids is different from that of the bulk liquid. Although fluorite is hydrophilic, structural
changes may also be expected when an H-bonded liquid is confined between hydrophobic
surfaces such as thiol-coated gold. In this regard, the results presented in Figure 5.3 suggest
that long-range attractions originate from increased structuring of liquids in the vicinity of
hydrophobic surfaces.
Figure 5.3 shows the results of the surface force measurements conducted with
C4SH-coated gold substrates in varying concentrations of ethanol solutions. The water
contact angle of the thiol-coated gold was 95o. As shown, the long-range attraction was the
strongest in pure water, and diminished with increasing ethanol concentrations. It reached a
minimum at mole fractions in the range of 0.17−0.55, and began to increase as the ethanol
concentration was further increased. A strong long-range attraction was observed in pure
ethanol, but it was still weaker than in pure water.
Figure 5.4 shows a similar set of measurements conducted with C12SH-coated gold
substrates in varying mole fractions of ethanol. The water contact angle of the thiolated gold
was 105o. The trend was the same as obtained with the C4SH-coated gold in that the
long-range attraction decreased with increasing ethanol concentration reaching a minimum at
mole fractions of 0.17−0.32, which was narrower in range than with the C4SH-coated gold
substrates. Also, the long-range attraction observed in pure ethanol was about the same as
with pure water.
134
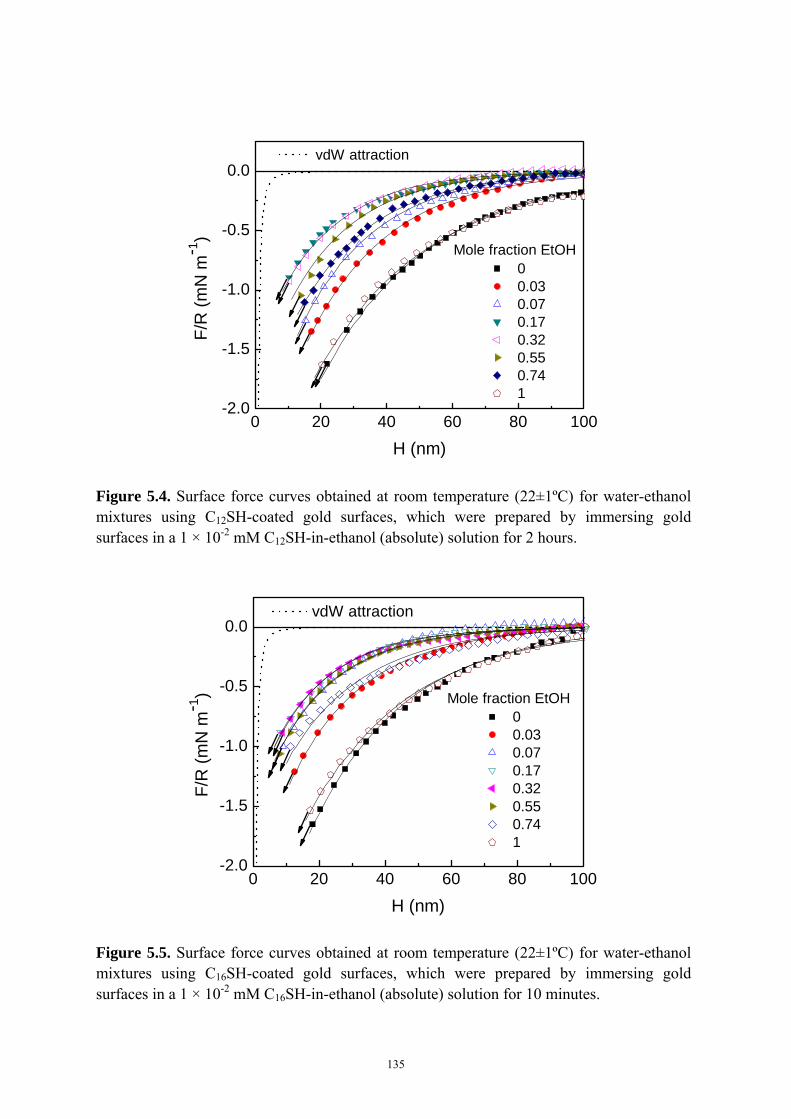
0 20 40 60 80 100-2.0
-1.5
-1.0
-0.5
0.0 vdW attraction
0 0.03 0.07 0.17 0.32 0.55 0.74 1
F/R
(mN
m-1
)
H (nm)
Mole fraction EtOH
Figure 5.4. Surface force curves obtained at room temperature (22±1ºC) for water-ethanol mixtures using C12SH-coated gold surfaces, which were prepared by immersing gold surfaces in a 1 × 10⁻² mM C12SH-in-ethanol (absolute) solution for 2 hours.
0 20 40 60 80 100-2.0
-1.5
-1.0
-0.5
0.0 vdW attraction
0 0.03 0.07 0.17 0.32 0.55 0.74 1
F/R
(mN
m-1
)
H (nm)
Mole fraction EtOH
Figure 5.5. Surface force curves obtained at room temperature (22±1ºC) for water-ethanol mixtures using C16SH-coated gold surfaces, which were prepared by immersing gold surfaces in a 1 × 10⁻² mM C16SH-in-ethanol (absolute) solution for 10 minutes.
135
A similar set of experiments was also conducted with C16SH-coated gold substrates,
and the results are presented in Figure 5.5. The weakest attractions were obtained in the mole
fractions of 0.17−0.55, and the result obtained in pure ethanol was about the same as in pure
water.
The attractive surface forces for ethanol-water mixtures were first seen by Ederth et
al.27 who, however, made just a couple of runs on solutions of ethanol in water (12.5 and 20%
by weight). The forces he recorded are about an order of magnitude weaker than those we
have obtained. However, the trend toward a rapidly diminishing surface force as a result of
ethanol addition was also evident in his measurements.
It is noteworthy that all the surface forces recorded were purely attractive, and the
force curves were all smooth without kinks or steps. Thus, these results do not support the
charged-patch28 or bridging nano-bubble29 mechanism.
The results presented in Figures 5.3-5.6 have been fitted to single-exponential force
law:
⎟⎠⎞
⎜⎝⎛−=
DHC
RF exp (5.3)
where F denotes the measured surface force, R the radius of the gold sphere, C a
pre-exponential constant, and D is the decay length. The C and D parameters obtained from
the curve-fitting exercise are plotted in Figures 5.6-5.8 versus the ethanol mole fraction (x2).
In all three cases, both C and D parameters pass through minima at x2 = 0.2. As discussed
above, earlier investigations showed that a transition from a water-structure related to an
ethanol-cluster related behavior takes place at this mole fraction2, 3, 7. At the same time, the
top layer of ethanol molecules become more or less fully developed by changing from a truly
136
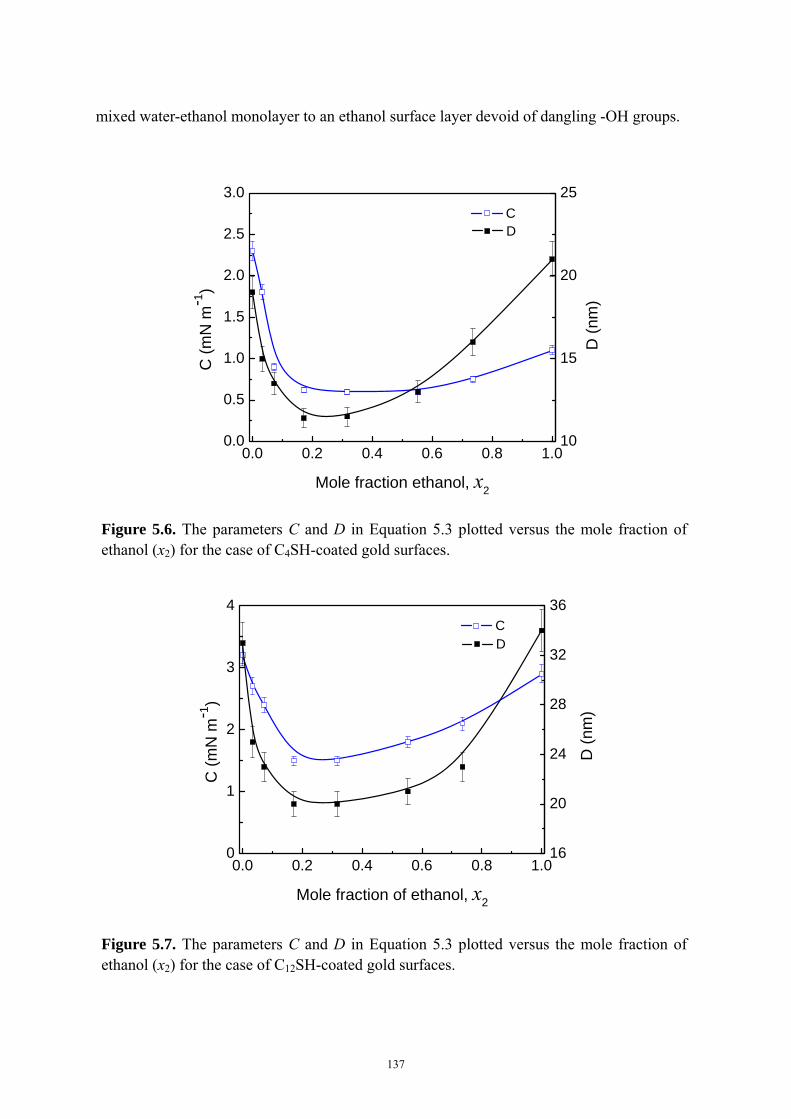
mixed water-ethanol monolayer to an ethanol surface layer devoid of dangling -OH groups.
0.0 0.2 0.4 0.6 0.8 1.00.0
0.5
1.0
1.5
2.0
2.5
3.0
10
15
20
25
D (n
m)
CC
(mN
m-1
)
Mole fraction ethanol, x2
D
Figure 5.6. The parameters C and D in Equation 5.3 plotted versus the mole fraction of ethanol (x2) for the case of C4SH-coated gold surfaces.
0.0 0.2 0.4 0.6 0.8 1.00
1
2
3
4
16
20
24
28
32
36D
(nm
)
C
C (m
N m
-1)
Mole fraction of ethanol, x2
D
Figure 5.7. The parameters C and D in Equation 5.3 plotted versus the mole fraction of ethanol (x2) for the case of C12SH-coated gold surfaces.
137
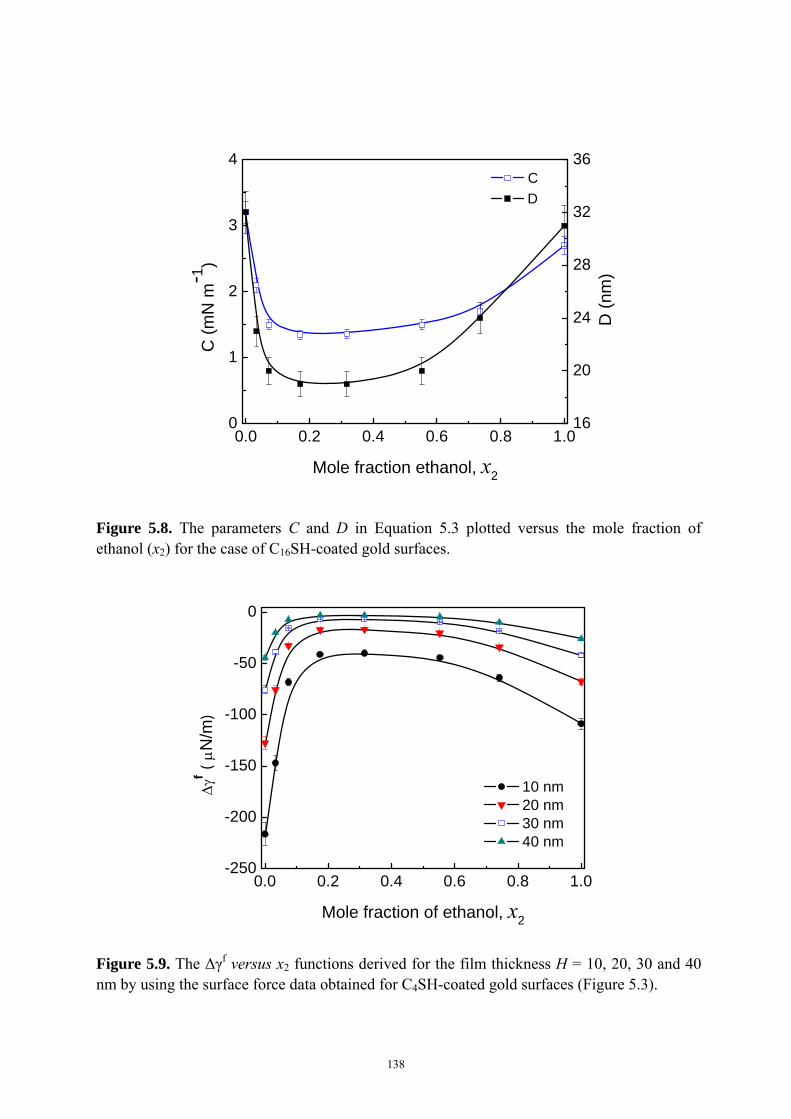
0.0 0.2 0.4 0.6 0.8 1.00
1
2
3
4
16
20
24
28
32
36
D (n
m)
C
C (m
N m
-1)
Mole fraction ethanol, x2
D
Figure 5.8. The parameters C and D in Equation 5.3 plotted versus the mole fraction of ethanol (x2) for the case of C16SH-coated gold surfaces.
0.0 0.2 0.4 0.6 0.8 1.0-250
-200
-150
-100
-50
0
10 nm 20 nm 30 nm 40 nm
Δγf (
μN/m
)
Mole fraction of ethanol, x2
Figure 5.9. The Δγf versus x2 functions derived for the film thickness H = 10, 20, 30 and 40 nm by using the surface force data obtained for C4SH-coated gold surfaces (Figure 5.3).
138
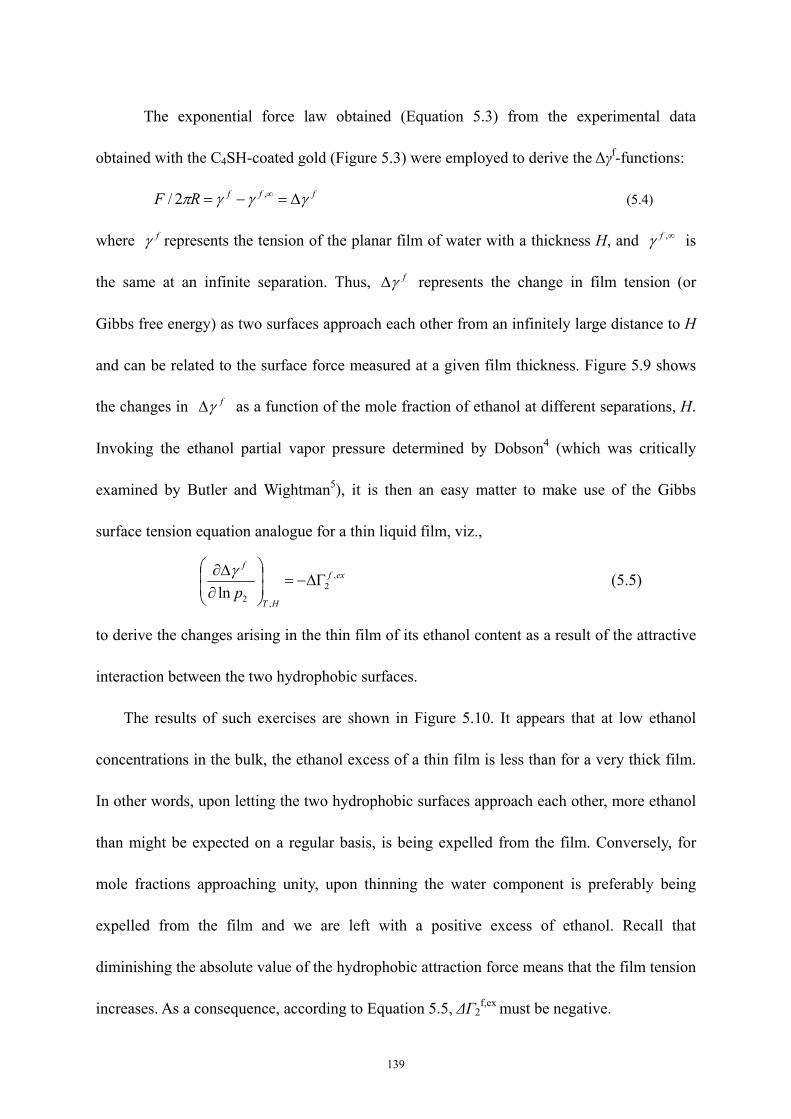
The exponential force law obtained (Equation 5.3) from the experimental data
obtained with the C4SH-coated gold (Figure 5.3) were employed to derive the Δγf-functions:
fffRF γγγπ Δ=−= ∞,2/ (5.4)
where represents the tension of the planar film of water with a thickness H, and is
the same at an infinite separation. Thus, represents the change in film tension (or
Gibbs free energy) as two surfaces approach each other from an infinitely large distance to H
and can be related to the surface force measured at a given film thickness. Figure 5.9 shows
the changes in as a function of the mole fraction of ethanol at different separations, H.
Invoking the ethanol partial vapor pressure determined by Dobson
fγ ∞,fγ
fγΔ
fγΔ
4 (which was critically
examined by Butler and Wightman5), it is then an easy matter to make use of the Gibbs
surface tension equation analogue for a thin liquid film, viz.,
exf
HT
f
p,
2
,2lnΔΓ−=⎟
⎟⎠
⎞⎜⎜⎝
⎛
∂Δ∂ γ (5.5)
to derive the changes arising in the thin film of its ethanol content as a result of the attractive
interaction between the two hydrophobic surfaces.
The results of such exercises are shown in Figure 5.10. It appears that at low ethanol
concentrations in the bulk, the ethanol excess of a thin film is less than for a very thick film.
In other words, upon letting the two hydrophobic surfaces approach each other, more ethanol
than might be expected on a regular basis, is being expelled from the film. Conversely, for
mole fractions approaching unity, upon thinning the water component is preferably being
expelled from the film and we are left with a positive excess of ethanol. Recall that
diminishing the absolute value of the hydrophobic attraction force means that the film tension
increases. As a consequence, according to Equation 5.5, ΔΓ2f,ex must be negative.
139
0.0 0.2 0.4 0.6 0.8 1.0-0.5
0.0
0.5
1.0
10 nm 20 nm 30 nm 40 nm
ΔΓf,
exE
than
olx1
07 (mol
m-2
)
Mole fraction of ethanol, x2
Figure 5.10. The film excess of ethanol, ΔΓ2
f,ex, derived from the Δγf-functions in Figure 5.9 by applying Equation 5.4.
0.0 0.2 0.4 0.6 0.8 1.0
0.0
1.2
2.4
ΔΓf,
exEt
hano
lx107 (m
ol m
-2)
Mole fraction of ethanol, x2
C4SH C12SH C16SH
Figure 5.11. The film excess of ethanol, ΔΓ2
f,ex for H = 20 nm obtained for C4SH-, C12SH- and C16SH-coated gold surfaces.
140
Figure 5.11 shows the ethanol film excess functions, ΔΓ2f,ex (x2) for H = 20 nm
generated by employing the surface force data recorded for C4SH-, C12SH- and C16SH-
coated gold surfaces. A semi-quantitative agreement is noted. For all three cases ΔΓ2f,ex is
negative for low and positive for high ethanol mole fractions.
5.5 Model Considerations
In terms of the recently presented bridging-cluster theory30 of hydrophobic attraction
that might apply for dilute solutions of alcohol in water, the pre-exponential constant C is
given by the expression:
⎟⎟⎠
⎞⎜⎜⎝
⎛ Δ−×⎟⎟
⎠
⎞⎜⎜⎝
⎛=
Tka
aTkC
B
effB γπ 2
2
2exp2 (5.6)
where a2 is the (mean) cross-sectional area of a cluster and Δγeff stands for the effective
change in interfacial free energy per unit area, arising due to attaching the cluster ends to the
hydrophobic surface. Assuming the latter to be a positive quantity, approximately
independent of the cluster cross section, one can anticipate C to diminish when the cross
section area a2 becomes larger. Moreover, the inverse of the decay length D is simply to be
regarded as the work per unit length to form the middle part of a long bridging cluster. It
should increase with a2, and upon raising the ethanol concentration. In this way, we can
tentatively account for the rapidly decreasing decay length D upon adding alcohol to water, at
least in a preliminary way.
As to the other end of the concentration scale, i.e., x2 is high, the ethyl groups and the
H-bonded -OH groups plus water molecules may form alternating layers that are parallel to
the hydrophobic surface. The structure may gradually become less and less well ordered with
141
distance away from the surface. In this concentration range, our original
order-parameter-based theory31 might apply, in which case the decay length would be given
by the simple expression:
( ) 2/123 2/ ccD = (5.7)
where the cooperative constant c3 represents a tendency to avoid gradients in the order
parameter, s, inside the thin film. A comparatively large value of c3 means that the layered
structure arrangement will prevail for some distance toward the core of the thin film, giving
rise to an attractive surface force. Adding more water should cause a reduced cooperatively
(i.e., a smaller c3) and increase the free energy of forming an ordered alcohol-water (i.e., a
larger c2), both contributing to decreasing the decay length D.
5.6 Conclusions
AFM surface force measurements were conducted between hydrophobized gold
surfaces in water, C-1 to C-4 alcohols, and ethanol-water mixtures. Long-range attractions
were observed in all of these H-bonding liquids, the range and strength of the attractions
decreasing in the order of water, ethanol, butanol, and methanol. In the ethanol-water
mixtures, the attractions were the maximum when the ethanol mole fraction was zero and
unity, and the strength and range of the attractions varied with composition. At the higher
mole fractions, the long-range attraction increased, most probably due to the increased
structuring of ethanol. Since each ethanol molecule forms two H-bonds, it is likely that
layered, laterally homogenous ethanol structures are formed at higher mole fractions. At
lower mole fractions, three-dimensional water structure may be formed in view of the fact
142
that each water molecule forms four H-bonds of equal strength.
The results obtained in the present work may thus indicate that the long-range
attraction (or hydrophobic force) originates from the liquid structure. The structure of water
or ethanol is disturbed in the presence of the other, causing a decrease in the hydrophobic
force. That the hydrophobic force increases with decreasing separation between hydrophobic
surfaces suggests that the structuring is induced by the hydrophobic surface.
5.7 Acknowledgment
This work was funded by National Energy Technology Laboratory, U. S. Department
of Energy (DE-FC26-02NT41607).
5.8 References
1. Eriksson, J. C., Arkiv Kemi 1966, 26, (2), 49-72.
2. Butler, J. A. V.; Wightman, A., J. Chem. Soc. (London) 1932, 2089-2097.
3. Teitelbaum, B. Y.; Gortalova, T. A.; Sidorova, E. E., Doklady Acad. Nauk S. S. S. R 1951,
(25), 911.
4. Dobson, H. J. E., J. Chem. Soc., Trans., 1925, 127, 2866-2873.
5. Butler, J. A. V.; Wightman, A., J. Chem. Soc. 1932, 2089-2097.
6. Li, Z. X.; Lu, J. R.; Styrkas, D. A.; Thomas, R. K.; Rennie, A. R.; Penfold, J., Mol. Phys.
1993, 80, (4), 925-939.
7. Shchukarev, S. A.; Tolmacheva, T. A., ZhurnalStrukt. Khim 1968, 9, 21-28.
8. Nishi, N.; Takahashi, S.; Matsumoto, M.; Tanaka, A.; Muraya, K.; Takamuku, T.;
143
Yamaguchi, T., J. Phys. Chem. 1995, 99, 462-468.
9. Dixit, S.; Crain, J.; Poon, W. C. K.; Finney, J. L.; Soper, A. K., Nature 2002, 416,
829-832.
10. Liu, W.-T.; Zhang, L.; Shen, Y. R., J. Chem. Phys. 2006, 125, 144711-1 -6.
11. Sung, J.; Park, K.; Kim, D., J. Korean. Phys. Soc. 1989, 44, 1394.
12. Sung, J.; Park, K.; Kim, D., J. Am. Chem. Soc 1989, 111, 321-335.
13. Ducker, W. A.; Senden, T. J.; Pashley, R. M., Nature 1991, (353), 239-241.
14. Zhang, J.; Yoon, R.-H.; Mao, M.; Ducker, W. A., Langmuir 2005, 21, 5831-5841.
15. Cleveland, J. P.; Manne, S.; Bocek, D.; Hansma, P. K., Rev. Sci. Instrum. 1993, 64, (2),
403-405.
16. Raiteri, R.; Preuss, M.; Grattarola, M.; Butt, H.-J., Colloids Surf., A 1998, 136, 191-197.
17. Ron, H.; Rubinstein, I., Langmuir 1994, 10, 4566-4573.
18. Ron, H.; Rubinstein, I., J. Am. Chem. Soc. 1998, 120, 13444-13452.
19. Bain, C. D.; Troughton, E. B.; Tao, Y.-T.; Evall, J.; Whitesides, G. M.; Nuzzo, R. G., J.
Am. Chem. Soc 1989, 111, 321-335.
20. Kane, V.; Mulvaney, P., Langmuir 1998, 14, 3303-3311.
21. Giesbers, M.; Kleijn, J. M.; Stuart, M. A. C., J. Colloid Interface Sci. 2002, 252,
138-148.
22. Hillier, A. C.; Kim, S.; Bard, A. J., J. Phys. Chem. 1996, 100, 18808-18817.
23. Biggs, S.; Mulvaney, P., J. Chem. Phys. 1994, 100, (11), 8501-8505.
24. Sondag-Huethorst, J. A. M.; Fokkink, L. G. J., Langmuir 1992, 8, 2560-2566.
25. Karpovich, D. S.; Blanchard, G. J., Langmuir 1994, 10, 3315-3322.
144
26. Boinovich, L. B.; Emelyanenko, A. M., Adv. Colloid Interface Sci. 2002, 96, 37-58.
27. Ederth, T., J. Phys. Chem. B 2000, 104, 9704-9712.
28. Miklavic, S. J.; Chan, D. Y. C.; White, L. R.; Healy, T. W., J. Phys. Chem. 1994, 98,
9022-9032.
29. Parker, J. L.; Claesson, P. M.; Attard, P., J. Phys. Chem. 1994, 98, 8468-8480.
30. Eriksson, J. C.; Henriksson, U., Langmuir 2007, 23, 10026-10033.
31. Eriksson, J. C.; Ljunggren, S.; Claesson, P. M., J. Chem. Soc. Faraday Trans. 2 1989, 85,
(3), 163-176.
145
Chapter 6
Hydrophobic attraction originates from changes in water structure: thermodynamic evidence
6.1 Abstract
In 1982, Israelachvili and Pashley1 reported the first measurements of a hitherto
unknown attractive force between two mica surfaces hydrophobized in
cetyltrimethylammonium bromide (CTAB) solutions. Follow-up experiments conducted by
many investigators confirmed their results, while others suggested that the “hydrophobic
force” is an artifact due to nanobubbles or cavities.2-4 Evidences for the latter included the
discontinuities (or steps) in the force versus distance curves5 and the pancake-shaped
nano-bubbles seen in atomic force microscopic (AFM) images.3 Recent measurements6-8
conducted in degassed water showed, however, smooth force versus distance curves,
indicating that the hydrophobic force is not an artifact due to nanobubbles. In the present
work, we have conducted AFM force measurements with gold substrates hydrophobized by
self-assembly of alkanethiols with different chain lengths. The measurements carried out at
10-40ºC show that the hydrophobic force decreases with temperature for all cases.
Thermodynamically, these results imply that as two hydrophobic surfaces approach each
other the excess film entropy per unit area (Sf) decreases, which suggests that the
hydrophobic force is due to the structuring of water in the thin film confined by two
hydrophobic surfaces rather than from an artifact. Our analysis also shows that the
hydrophobic interaction entails a reduction in the excess film enthalpy per unit area (Hf), with
the change in excess film enthalpy (∆Hf) being slightly more negative than the corresponding
entropy term (T∆Sf). The difference between these two quantities gives the change in film
tension (∆γf) or in Gibbs (free) energy per unit area. By multiplying this difference with 2π,
146
in accordance with the Derjaguin approximation,9 one obtains the surface force (F)
normalized by the radius (R) of the gold sphere used in the force measurement. The nearly
parallel enthalpy and entropy changes observed may be associated with the formation of
clathrate cages at the hydrophobic surface/water interfaces of the thin water film by virtue of
cooperative hydrogen bonding. The presence of the clathrate cages at the hydrocarbon-water
interface is supported by the decrease in water density observed by recent neutron reflectivity
measurements.10 Surface force measurements conducted in ethanol-water mixtures also show
that the long-range attractions are due to the structuring of the liquids in the thin liquid films
between hydrophobic surfaces.
6.2 Introduction
There have been intense debates in the scientific community as to the existence of a
long-range hydrophobic force between hydrophobic solid surfaces in water and its possible
origin. After the observations of such a non-DLVO force firstly made by Israelachvili and
Pashley1 for in situ hydrophobized mica using a surface force apparatus (SFA) in the early
1980s, the scientific community had been divided into different camps. One argues that the
long-range hydrophobic force is actually the capillary force in view of the “discontinuities”
(or steps) characteristic, attributed to nano-bubble bridging, for the force curves recorded2, 11,
12. Another one claims that the additional attractive force is related to the structuring of
confined water induced by the hydrophobic solid surface.13, 14 And the third one insists that,
however, the hydrophobic force is an electrostatic correlation force of charged patches on the
hydrophobic surfaces.15, 16 Addressing the controversy should help us better understand a
variety of important issues ranging from self-assembly, protein folding and stability,
molecular origin of life, enzyme-coenzyme interactions, recovery of energy minerals (oil,
coal, bitumen, kerogen, methane hydrates), etc.
147
A large part of the debate is due to the difficulty in preparing molecularly smooth and
stable hydrophobic surfaces for surface force measurements. For unstable hydrophobic
surfaces, indicated by contact angle hysteresis, the long-range attractions measured are
usually believed to be ascribed to significant molecular rearrangement,17 local charge
fluctuations18 when two hydrophobic surfaces come into contact in water, or patchy bilayer
formation when the surfaces were immersed in water.16 Preparation of ideal hydrophobic
surfaces is thus of importance to decide whether there is actually a true long-range
hydrophobic force arising from thin water film between hydrophobic solid surfaces. Some of
the supposedly most reliable surface force data were produced by Claesson and Christenson19
and, more recently, by Lin et al.20 using Langmuir-Blodgett deposited monolayers of a double
chain surfactant dioctadecyldimethylammonium bromide (DODAB) on mica. Unfortunately,
these surfaces lack full stability, especially when exposed to salt solutions. More recently,
self-assembly of long single-chain thiols on gold from alcohol solution has been used to
generate robust hydrophobic surfaces. Ederth et al.21 hydrophobized gold substrates in 1 mM
C16SH-in-ethanol solutions and used them for surface force measurements in pure water.
However, their force curves exhibited steps, indicating coalescence of pre-existing gas
bubbles on the two hydrophobic surfaces during the measurements. Under the conditions
employed by these investigators, we obtained essentially the same results.22 But it was found
that the steps disappeared when the thiol-coated gold surfaces were rinsed with appropriate
organic solvents after hydrophobizing them in 1 mM solutions for long periods of time (> 6
hours), or when they were hydrophobized in a dilute (1 × 10⁻² mM) solution for short periods
of time (< 10 minutes). Thus, one has to apply appropriate treatment times and concentrations
to ensure that the hydrophobic surfaces generated by chemisorbing an alkanethiol entail little
else but full monolayers of thiols firmly bonded by their -SH end groups to the gold substrate.
Otherwise, too small surface forces may be measured or nano bubbles will nucleate on
148
surfaces causing steps in the force curves.
In the present work, gold spheres and gold-coated glass plates were hydrophobized
using appropriate treating procedure. The gold surfaces, treated with alkanethiols with
different chain lengths (n = 2−16), were used to measure the surface forces using the AFM
colloidal probe technique.23, 24 A Veeco Multimode AFM equipped with a temperature
controller was used to record the forces in pure water at different temperatures.
6.3 Materials and Methods
6.3.1 Chemicals
The alkanethiols used to hydrophobize the gold surfaces in this work are
H-(CH2)n-SH, denoted briefly as CnSH, where n = 2, 4, 12, 16. They are all liquid at room
temperature. Ethanethiol (C2SH; 98%), 1-butanethiol (C4SH; 97%) and 1-hexadecanethiol
(C16SH; ≥ 97%) were purchased from TCI America (Portland, USA). 1-dodecanethiol (C12SH;
98%) was obtained from Aldrich. They were stored in the refrigerator and used without
further purification. The alkanethiol solutions were prepared in pure ethanol (Decon
Laboratories, Inc). H2SO4 (98%, VMR International) and H2O2 (29.0 – 32.0%, Alfa Aesar)
were used as received to clean the gold plates. Ultrapure water (18.2 MΩ • cm-1, 25ºC) was
obtained using a Millipore direct-Q3 ultrapure (Millipore, MA) water system.
6.3.2 Gold Surfaces Preparation
The flat gold surfaces (0.5 × 0.5 sq inch) were produced by coating smooth glass
substrates with a thermally evaporated 500 angstrom thick Au (99.9%) in a vacuum
evaporator. A 50 angstrom Cr interlayer was used to promote Au adhesion. The maximum
peak-to-valley distance was 3.3 nm and a typical root mean square (rms) roughness of the
gold-coated glass over a surface area of 1 × 1 µm2 was 0.8 nm, as measured by AFM.
149
Gold spheres with suitable size were produced following the procedure devised by
Raiteri et al.25 Gold wire (0.0127 mm dia, 99.9%), purchased from Alfa Aesar, was connected
to a power supply (120V, AC), briefly creating a short circuit. This was done in a glass tray. A
small aerosol cloud of gold micro particles was produced in the electric spark. In this way,
gold spheres with a wide size distribution in the micrometer range were produced. Spheres
with radius of 3~7 µm were chosen for the surface force measurements.
6.3.3 Colloidal Probe Preparation
In order to measure the force between surfaces of a gold microsphere and gold-coated
flat glass, a gold probe was made by gluing a gold sphere onto to the end of a AFM cantilever
with Epon 1004 (Shell Chemical Co) using a homemade 3-dimensional (X, Y, Z) translation
stage under a high-resolution optical microscope (BH2, Olympus). The polymer glue which
melts at about 105ºC, is insoluble in water. The translation stage is equipped with a hot plate,
which sits under the microscope and was used to melt the polymer glue. A clean glass plate
with gold microspheres and tiny particles of glue spreading on it was placed on the hot plate.
An AFM cantilever, gripped by a clump, was attached to the 3-dimensional translation stage.
The AFM cantilever was cleaned by soaking in pure ethanol and followed by irradiating
using a UV lamp (Model ENF-240 C, Spectronics Corporation; λ = 254 nm) for 10 minutes
before use. Firstly, the cantilever approached to a tiny glue drop and the cantilever tip dipped
into it. Then the glue-laden tip came close to a desired gold sphere. The radius of sphere R
was determined under the microscope. When the sphere was touched by the glue, it
spontaneously transfered to the cantilever tip due the capillary force.
6.3.4 Hydrophobization of Gold
To obtain high-quality thiol monolayers, the carbonaceous impurities on gold have to
150
be removed first. The gold plates were cleaned by soaking in a boiling piranha etch solution
(a mixture of 10 ml H2O2 and 20 ml H2SO4) for 20 minutes and then washed by rinsing with
nanopure water for 1 minute, followed by an ethanol wash for 2 minutes. This was done in a
fume hood. (Caution: piranha solution reacts violently with many organic materials and
should be used with extreme care). For the cases of gold spheres, they were cleaned after they
had been glued onto AFM cantilever springs. To prevent the glue from being destroyed by the
piranha solution, each gold sphere was flushed with ethanol, exposed in a short-wave UV
light (λ = 254 nm) for 2 hours, and then rinsed with ethanol again. The high energy UV
radiation can decompose and remove the organic compounds on gold.
All glassware such as volumetric flasks and pyrex dishes, used to prepare and contain
thiol solutions, were left overnight in sulfuric acid bath and cleaned by rinsing in ultrapure
water. Gold surfaces were hydrophobized with alkanethiols by soaking in ethanolic solution
of the alkanethiol for a desired period of time. After self-assembly, the surfaces were
thoroughly rinsed with pure ethanol and water and then dried in a nitrogen gas stream. For a
given force measurement, a gold sphere and a gold-coated glass were soaked in the same
solution at the same time, so that the hydrophobicity of the two microscopic surfaces would
be the same.
In the present study, gold surfaces were hydrophobized using short and long-chain
alkanethiols. The monolayers with different hydrocarbon chain lengths were obtained by
placing gold substrates in 1 mM solution of ethanethiol in ethanol for 6 hours, 1 × 10⁻² mM
ethanolic solution of butanethiol for 5 hours, 1 × 10⁻² mM dodecanethiol for 3 hours and in 1
× 10-2 mM hexadecanethiol for 10 minutes, respectively. Previous contact angle and force
measurement studies established that these procedures produce monolayers that can cover the
entire gold surface. To ensure the accuracy of the experiment, for every set of experiment,
fresh thiol surfactant solutions were used to prepare the hydrophobic coatings, because the
151
ethanolic thiol solutions degrade with time.
6.3.5 AFM Force Measurement
Surface force measurements with temperature control were carried out using a
Nanoscope IVa (Digital Instruments, Inc.) in Nanoscale Characterization and Fabrication
Laboratory (NCFL) at Virginia Tech. The MultiMode AFM was equipped with a
heater/cooler accessory, which enables force measurement at both reduced and elevated
temperatures. Primary components of the equipment include a heater/cooler Peltier element, a
specialized scanner “J”, a scanner cooling system which is comprised of a peristaltic pump
and an ice bucket, and a Digital Instruments Thermal Applications Controller (TAC) which
set and control the liquid temperature by regulating the Peltier element. The Peltier element
was plugged into the connector on top of the scanner. The coated flat gold sample was
mounted onto a sample puck and placed under the glass fluid cell sealed with a silicone
O-ring. The metallic sample puck was placed on top of the Peltier element. Triangular
silicon nitride cantilevers (NP-20, Veeco Probes, Inc.) bearing the gold microspheres were
used for the force measurements. The spring constant (k) were determined using the resonant
frequency technique.26 The unloaded and loaded resonant frequencies were obtained using
Tapping mode AFM. In each experiment, the liquid cell, used to hold the sphere probe, was
cleaned in an ultrasonic water bath. Ultrapure water was injected into liquid cell for force
measurement using a Norm-Ject syringe. All of the measurements were conducted in
air-equilibrated solution. The separation distance (H) between the gold sphere and the
flat-gold coated glass plate was measured by monitoring the deflection of the cantilever on
which the gold sphere was attached. Measured forces (F) were normalized with respect to the
radii (R) of the gold spheres.
The initial measurements were conducted in water at 10ºC and subsequently at 20, 30,
152
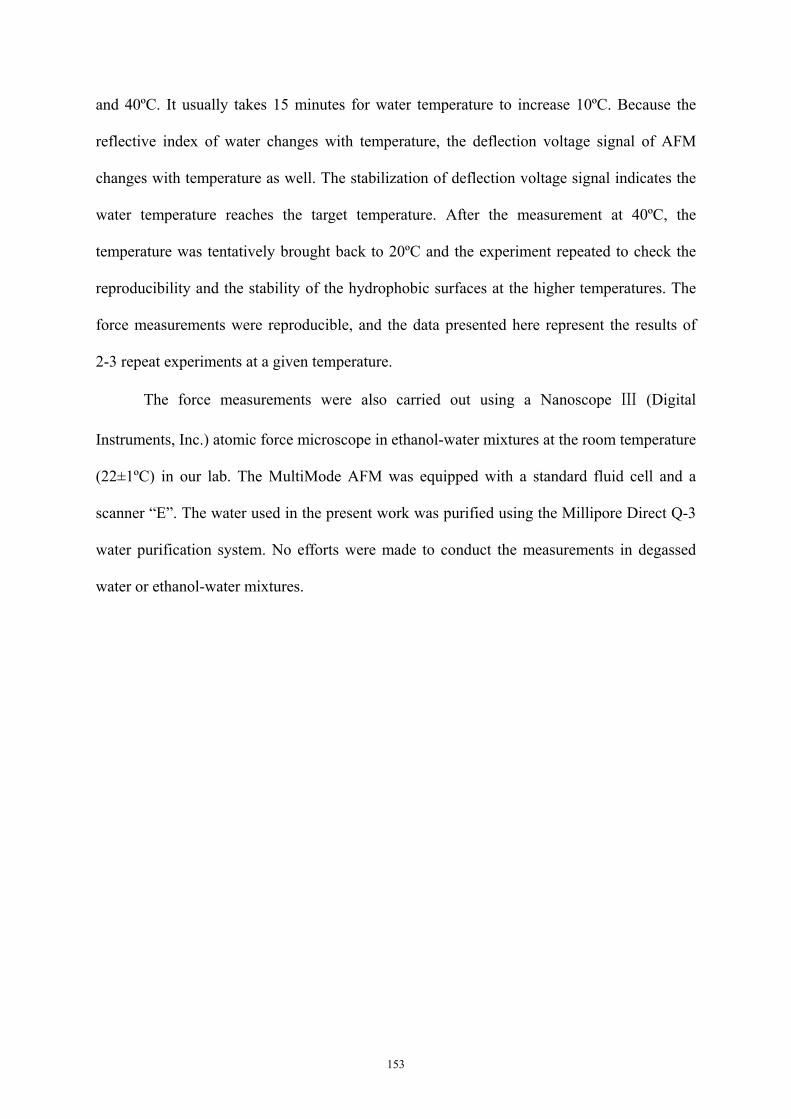
and 40ºC. It usually takes 15 minutes for water temperature to increase 10ºC. Because the
reflective index of water changes with temperature, the deflection voltage signal of AFM
changes with temperature as well. The stabilization of deflection voltage signal indicates the
water temperature reaches the target temperature. After the measurement at 40ºC, the
temperature was tentatively brought back to 20ºC and the experiment repeated to check the
reproducibility and the stability of the hydrophobic surfaces at the higher temperatures. The
force measurements were reproducible, and the data presented here represent the results of
2-3 repeat experiments at a given temperature.
The force measurements were also carried out using a Nanoscope Ⅲ (Digital
Instruments, Inc.) atomic force microscope in ethanol-water mixtures at the room temperature
(22±1ºC) in our lab. The MultiMode AFM was equipped with a standard fluid cell and a
scanner “E”. The water used in the present work was purified using the Millipore Direct Q-3
water purification system. No efforts were made to conduct the measurements in degassed
water or ethanol-water mixtures.
153
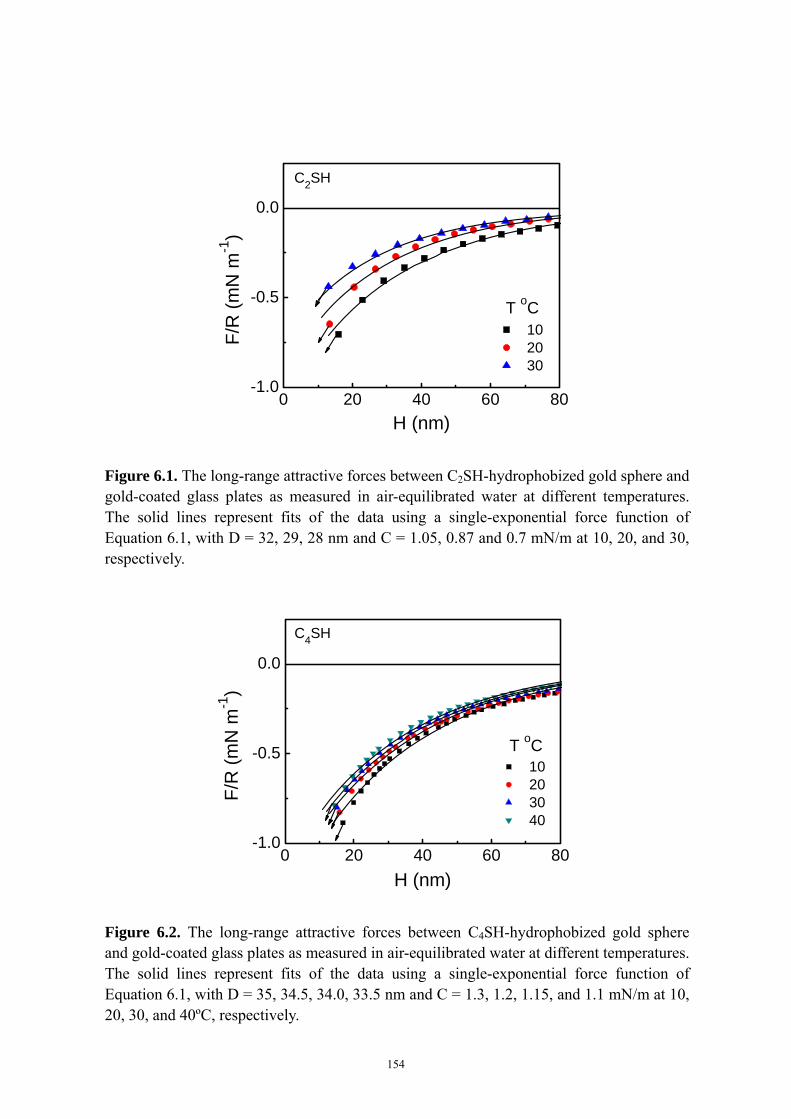
0 20 40 60 80-1.0
-0.5
0.0
T oC
10 20 30
F/R
(mN
m-1
)
H (nm)
C2SH
Figure 6.1. The long-range attractive forces between C2SH-hydrophobized gold sphere and gold-coated glass plates as measured in air-equilibrated water at different temperatures. The solid lines represent fits of the data using a single-exponential force function of Equation 6.1, with D = 32, 29, 28 nm and C = 1.05, 0.87 and 0.7 mN/m at 10, 20, and 30, respectively.
0 20 40 60 80-1.0
-0.5
0.0
T oC
10 20 30 40
F/R
(mN
m-1
)
H (nm)
C4SH
Figure 6.2. The long-range attractive forces between C4SH-hydrophobized gold sphere and gold-coated glass plates as measured in air-equilibrated water at different temperatures. The solid lines represent fits of the data using a single-exponential force function of Equation 6.1, with D = 35, 34.5, 34.0, 33.5 nm and C = 1.3, 1.2, 1.15, and 1.1 mN/m at 10, 20, 30, and 40ºC, respectively.
154
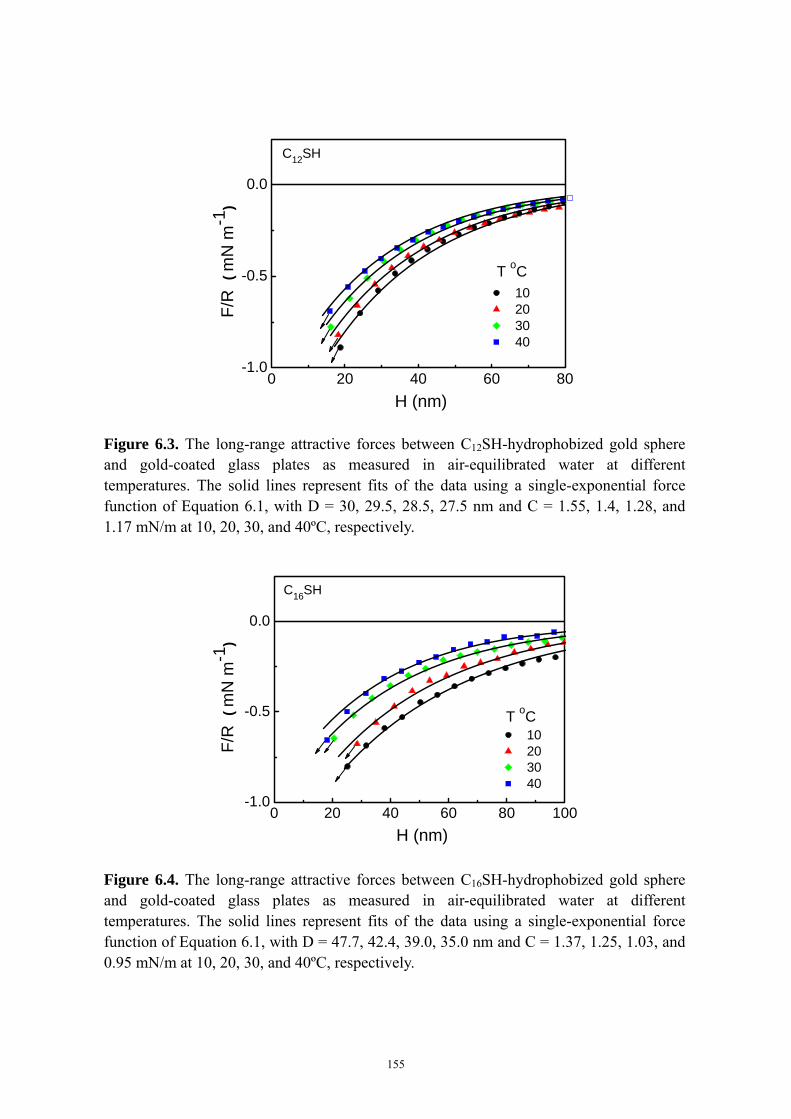
0 20 40 60 80-1.0
-0.5
0.0
F/R
(m
N m
-1)
H (nm)
10 20 30 40
T oC
C12SH
Figure 6.3. The long-range attractive forces between C12SH-hydrophobized gold sphere and gold-coated glass plates as measured in air-equilibrated water at different temperatures. The solid lines represent fits of the data using a single-exponential force function of Equation 6.1, with D = 30, 29.5, 28.5, 27.5 nm and C = 1.55, 1.4, 1.28, and 1.17 mN/m at 10, 20, 30, and 40ºC, respectively.
0 20 40 60 80 100-1.0
-0.5
0.0
F/R
(m
N m
-1)
H (nm)
10 20 30 40
T oC
C16SH
Figure 6.4. The long-range attractive forces between C16SH-hydrophobized gold sphere and gold-coated glass plates as measured in air-equilibrated water at different temperatures. The solid lines represent fits of the data using a single-exponential force function of Equation 6.1, with D = 47.7, 42.4, 39.0, 35.0 nm and C = 1.37, 1.25, 1.03, and 0.95 mN/m at 10, 20, 30, and 40ºC, respectively.
155
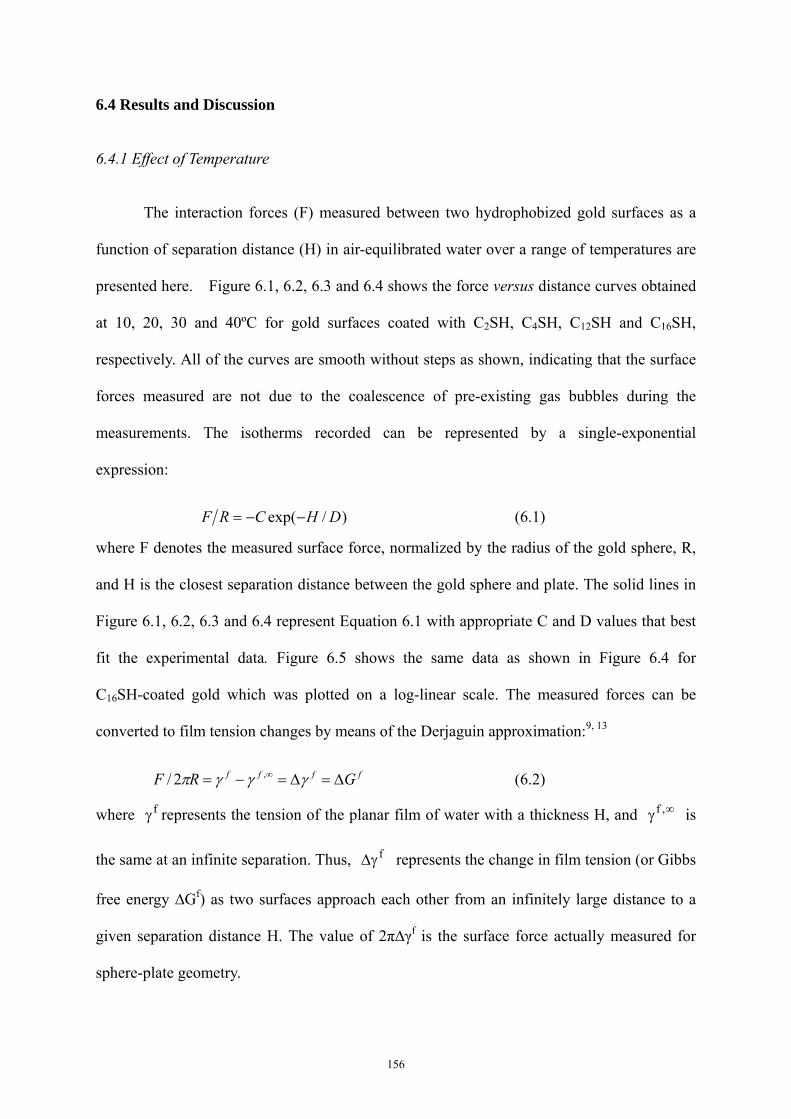
6.4 Results and Discussion
6.4.1 Effect of Temperature
The interaction forces (F) measured between two hydrophobized gold surfaces as a
function of separation distance (H) in air-equilibrated water over a range of temperatures are
presented here. Figure 6.1, 6.2, 6.3 and 6.4 shows the force versus distance curves obtained
at 10, 20, 30 and 40ºC for gold surfaces coated with C2SH, C4SH, C12SH and C16SH,
respectively. All of the curves are smooth without steps as shown, indicating that the surface
forces measured are not due to the coalescence of pre-existing gas bubbles during the
measurements. The isotherms recorded can be represented by a single-exponential
expression:
)/exp( DHCRF −−= (6.1)
where F denotes the measured surface force, normalized by the radius of the gold sphere, R,
and H is the closest separation distance between the gold sphere and plate. The solid lines in
Figure 6.1, 6.2, 6.3 and 6.4 represent Equation 6.1 with appropriate C and D values that best
fit the experimental data. Figure 6.5 shows the same data as shown in Figure 6.4 for
C16SH-coated gold which was plotted on a log-linear scale. The measured forces can be
converted to film tension changes by means of the Derjaguin approximation:9, 13
ffff GRF Δ=Δ=−= ∞ γγγπ ,2/ (6.2)
where represents the tension of the planar film of water with a thickness H, and is
the same at an infinite separation. Thus, represents the change in film tension (or Gibbs
free energy ∆G
fγ ∞γ ,f
fγΔ
f) as two surfaces approach each other from an infinitely large distance to a
given separation distance H. The value of 2π∆γf is the surface force actually measured for
sphere-plate geometry.
156
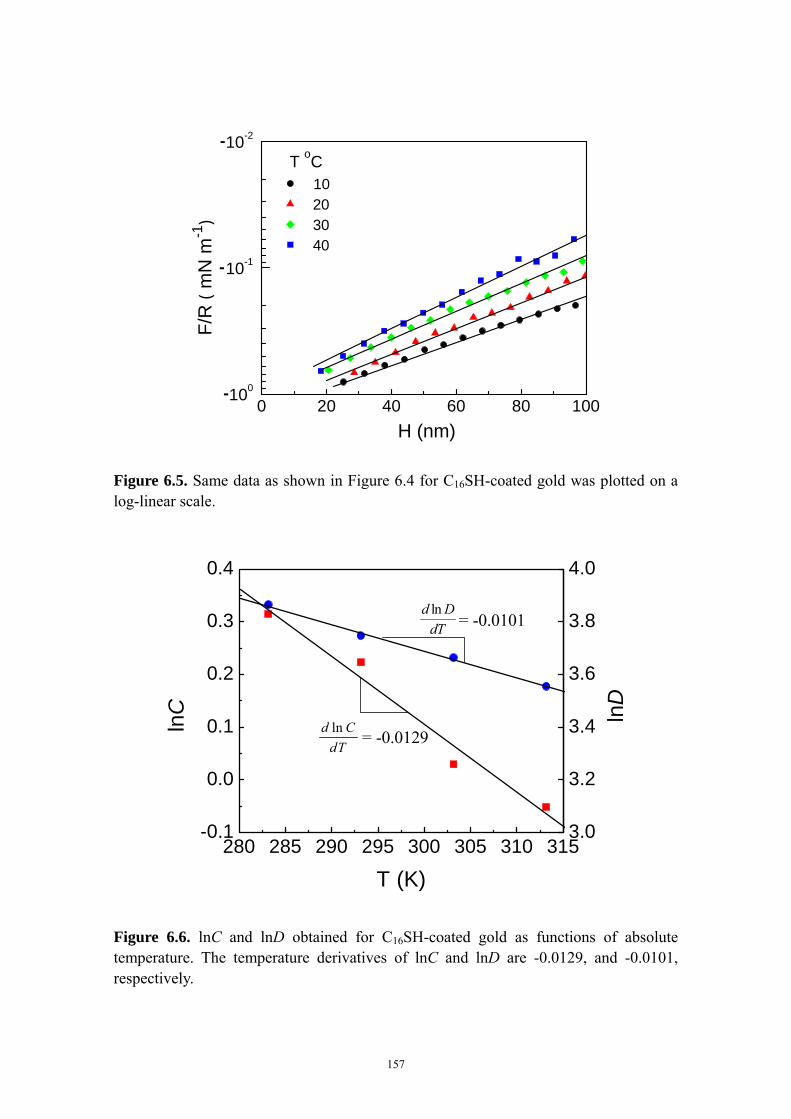
0 20 40 60 80 100100
10-1
10-2-
-
F/R
(m
N m
-1)
H (nm)
10 20 30 40
T oC
-
Figure 6.5. Same data as shown in Figure 6.4 for C16SH-coated gold was plotted on a log-linear scale.
280 285 290 295 300 305 310 315-0.1
0.0
0.1
0.2
0.3
0.4
3.0
3.2
3.4
3.6
3.8
4.0
lnD
lnC
T (K)
= -0.0101dT
Dd ln
dTCd ln = -0.0129
Figure 6.6. lnC and lnD obtained for C16SH-coated gold as functions of absolute temperature. The temperature derivatives of lnC and lnD are -0.0129, and -0.0101, respectively.
157
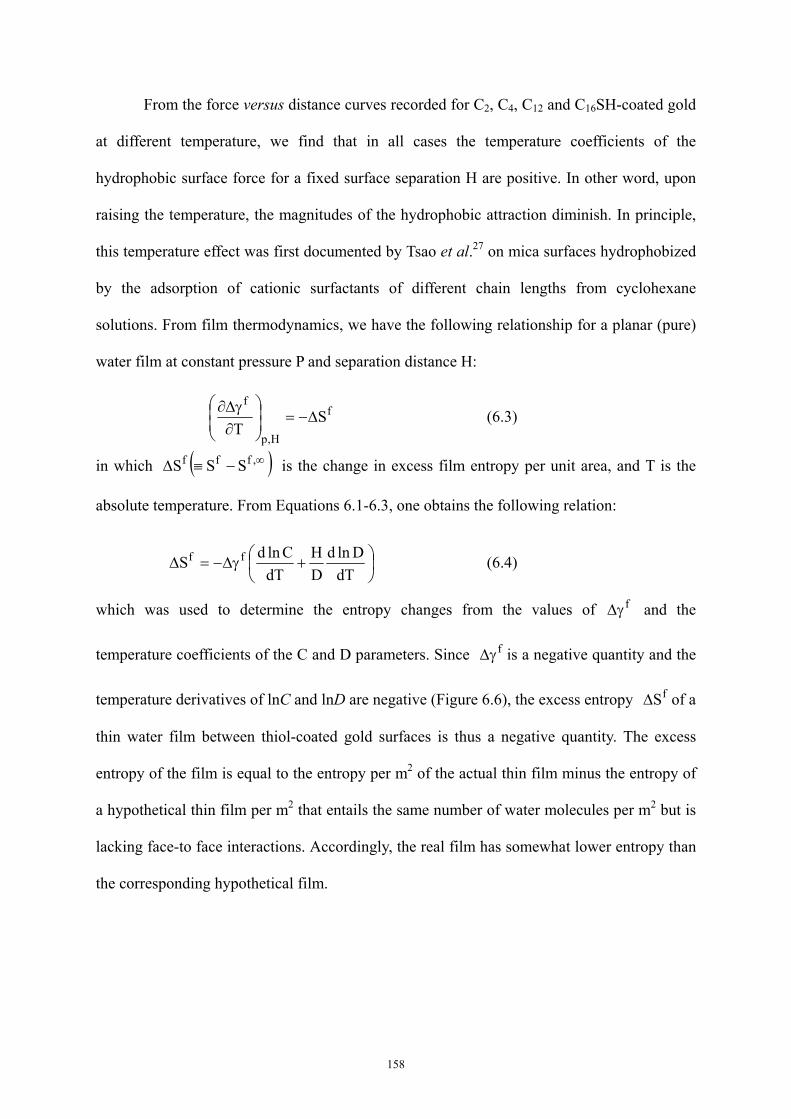
From the force versus distance curves recorded for C2, C4, C12 and C16SH-coated gold
at different temperature, we find that in all cases the temperature coefficients of the
hydrophobic surface force for a fixed surface separation H are positive. In other word, upon
raising the temperature, the magnitudes of the hydrophobic attraction diminish. In principle,
this temperature effect was first documented by Tsao et al.27 on mica surfaces hydrophobized
by the adsorption of cationic surfactants of different chain lengths from cyclohexane
solutions. From film thermodynamics, we have the following relationship for a planar (pure)
water film at constant pressure P and separation distance H:
ST
f
H,p
fΔ−=⎟
⎟⎠
⎞⎜⎜⎝
⎛
∂γΔ∂ (6.3)
in which ( )∞−≡Δ ,fff SSS is the change in excess film entropy per unit area, and T is the
absolute temperature. From Equations 6.1-6.3, one obtains the following relation:
⎟⎠⎞
⎜⎝⎛ +γΔ−=Δ
dTDlnd
DH
dTClndS ff (6.4)
which was used to determine the entropy changes from the values of and the
temperature coefficients of the C and D parameters. Since is a negative quantity and the
temperature derivatives of lnC and lnD are negative (Figure 6.6), the excess entropy of a
thin water film between thiol-coated gold surfaces is thus a negative quantity. The excess
entropy of the film is equal to the entropy per m
fγΔ
fγΔ
fSΔ
2 of the actual thin film minus the entropy of
a hypothetical thin film per m2 that entails the same number of water molecules per m2 but is
lacking face-to face interactions. Accordingly, the real film has somewhat lower entropy than
the corresponding hypothetical film.
158
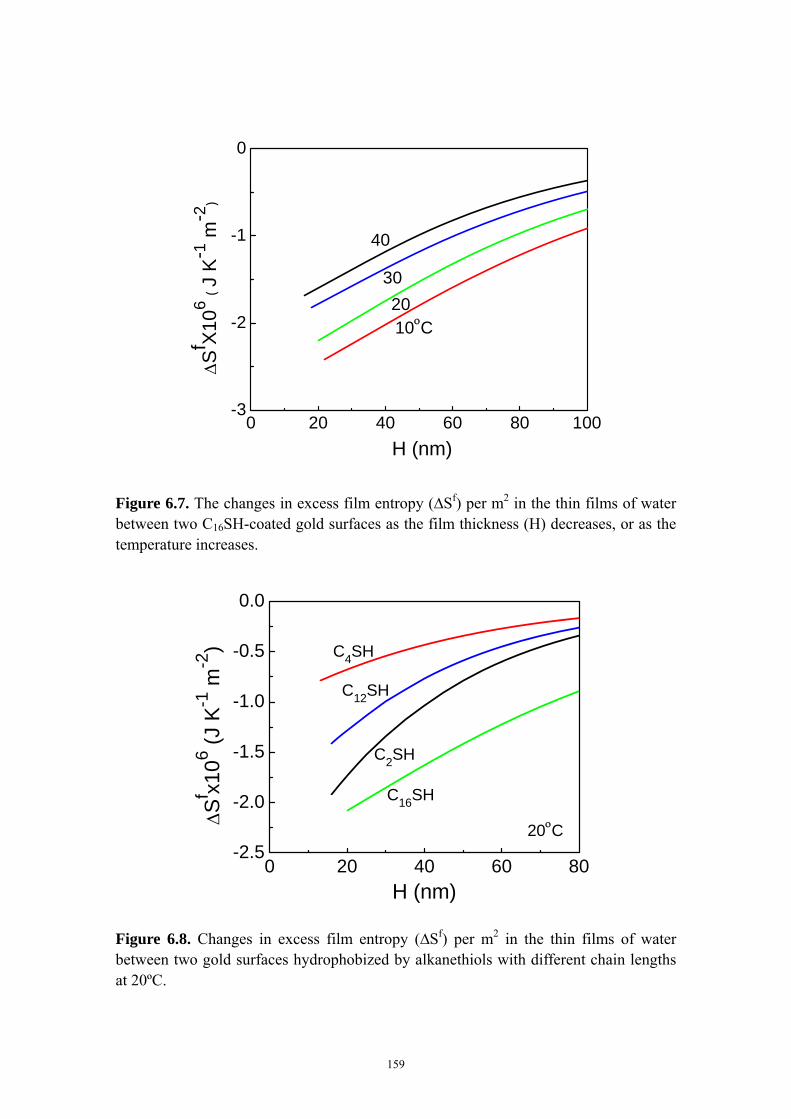
0 20 40 60 80 100-3
-2
-1
0
40
3020
ΔSf X
106 (
J K
-1 m
-2)
H (nm)
10οC
Figure 6.7. The changes in excess film entropy (∆Sf) per m2 in the thin films of water between two C16SH-coated gold surfaces as the film thickness (H) decreases, or as the temperature increases.
0 20 40 60 80-2.5
-2.0
-1.5
-1.0
-0.5
0.0
ΔSf x1
06 (J K
-1 m
-2)
H (nm)
C2SH
C4SH
C12SH
C16SH
20οC
Figure 6.8. Changes in excess film entropy (∆Sf) per m2 in the thin films of water between two gold surfaces hydrophobized by alkanethiols with different chain lengths at 20ºC.
159
As shown in Figure 6.7 and 6.8, the change in excess film entropy ( ) becomes
more negative when the thickness of the film (H) confined between two hydrophobic surfaces
is reduced. A typical value of for a plane-parallel film of thickness 20 nm between two
C
fSΔ
fSΔ
16SH-coated surfaces turns out to be -0.0022 mJm-2K-1, which is about 0.008% of the
entropy change associated with the liquid water-to-ice phase transition. Although the effect
dealt with here is an exceedingly minute one, the decrease in excess film entropy indicates
that the thin film of water becomes increasingly structured as two hydrophobic surfaces
approach each other. Note also that at a given film thickness H, becomes more negative
at lower temperatures, which is akin to the anomalous behavior of supercooled water. As is
well known, the density of water decreases below its maximum at 4ºC, which has invoked the
presence of various low-density species (e.g., “ice-like” species,
fSΔ
28 pentagonal dodecahedra,29
clathrate cages,30 etc.) in pure water. All of these species represent highly ordered structure of
water; therefore, their formation in colder water entails entropy decrease. Likewise, the
results presented in Figure 6.7 may indicate the formation of low-density species at the
hydrophobic surface/water interface. Figure 6.8 shows changes in excess film entropy (∆Sf)
per m2 in the thin films of water as functions of separation distance between two gold
surfaces hydrophobized by C2SH, C4SH, C12SH and C16SH at 20ºC. As the chain length
decreases from 16 to 4, the change in excess film entropy decreases. The difference between
changes in excess film entropy obtained from different surfaces may due to different states of
the hydrophobic carbon chains on the surface (e.g. crystalline order of hydrocarbon chain)27.
For C2SH, the obtained change in excess film entropy is comparable to that for C16SH, and
larger than that for C4SH and C12SH, probably due to the experimental uncertainty.
Thermodynamically, the change in film tension ( ) is composed of enthalpic (fγΔ fHΔ )
and entropic ( ) parts. Using Equation 6.5, one can obtain the excess enthalpy per unit fSTΔ
160
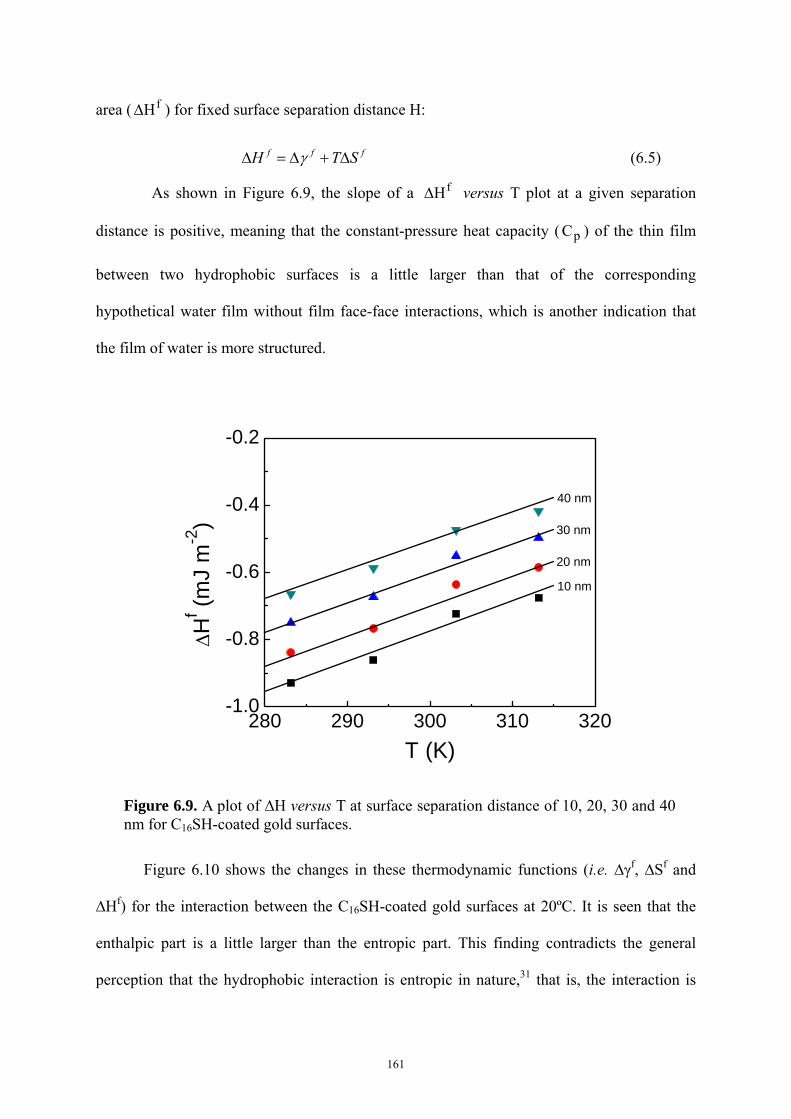
area ( ) for fixed surface separation distance H: fHΔ
fff STH Δ+Δ=Δ γ (6.5)
As shown in Figure 6.9, the slope of a fHΔ versus T plot at a given separation
distance is positive, meaning that the constant-pressure heat capacity ( ) of the thin film
between two hydrophobic surfaces is a little larger than that of the corresponding
hypothetical water film without film face-face interactions, which is another indication that
the film of water is more structured.
pC
Figure 6.10 shows the changes in these thermodynamic functions (i.e. ∆γf, ∆Sf and
∆Hf) for the interaction between the C16SH-coated gold surfaces at 20ºC. It is seen that the
enthalpic part is a little larger than the entropic part. This finding contradicts the general
perception that the hydrophobic interaction is entropic in nature,31 that is, the interaction is
280 290 300 310 320-1.0
-0.8
-0.6
-0.4
-0.2
ΔHf (m
J m
-2)
T (K)
10 nm
20 nm
30 nm
40 nm
Figure 6.9. A plot of ∆H versus T at surface separation distance of 10, 20, 30 and 40 nm for C16SH-coated gold surfaces.
161
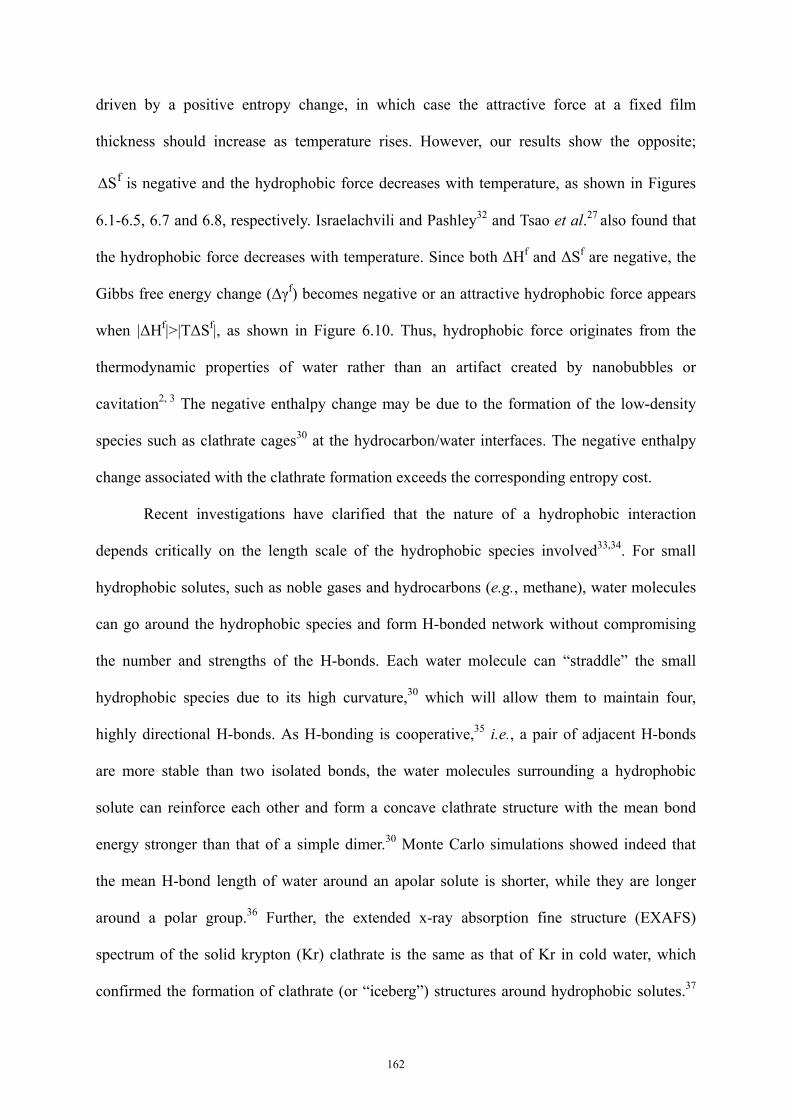
driven by a positive entropy change, in which case the attractive force at a fixed film
thickness should increase as temperature rises. However, our results show the opposite;
is negative and the hydrophobic force decreases with temperature, as shown in Figures
6.1-6.5, 6.7 and 6.8, respectively. Israelachvili and Pashley
fSΔ
32 and Tsao et al.27 also found that
the hydrophobic force decreases with temperature. Since both ΔHf and ΔSf are negative, the
Gibbs free energy change (∆γf) becomes negative or an attractive hydrophobic force appears
when |ΔHf|>|TΔSf|, as shown in Figure 6.10. Thus, hydrophobic force originates from the
thermodynamic properties of water rather than an artifact created by nanobubbles or
cavitation2, 3 The negative enthalpy change may be due to the formation of the low-density
species such as clathrate cages30 at the hydrocarbon/water interfaces. The negative enthalpy
change associated with the clathrate formation exceeds the corresponding entropy cost.
Recent investigations have clarified that the nature of a hydrophobic interaction
depends critically on the length scale of the hydrophobic species involved33,34. For small
hydrophobic solutes, such as noble gases and hydrocarbons (e.g., methane), water molecules
can go around the hydrophobic species and form H-bonded network without compromising
the number and strengths of the H-bonds. Each water molecule can “straddle” the small
hydrophobic species due to its high curvature,30 which will allow them to maintain four,
highly directional H-bonds. As H-bonding is cooperative,35 i.e., a pair of adjacent H-bonds
are more stable than two isolated bonds, the water molecules surrounding a hydrophobic
solute can reinforce each other and form a concave clathrate structure with the mean bond
energy stronger than that of a simple dimer.30 Monte Carlo simulations showed indeed that
the mean H-bond length of water around an apolar solute is shorter, while they are longer
around a polar group.36 Further, the extended x-ray absorption fine structure (EXAFS)
spectrum of the solid krypton (Kr) clathrate is the same as that of Kr in cold water, which
confirmed the formation of clathrate (or “iceberg”) structures around hydrophobic solutes.37
162
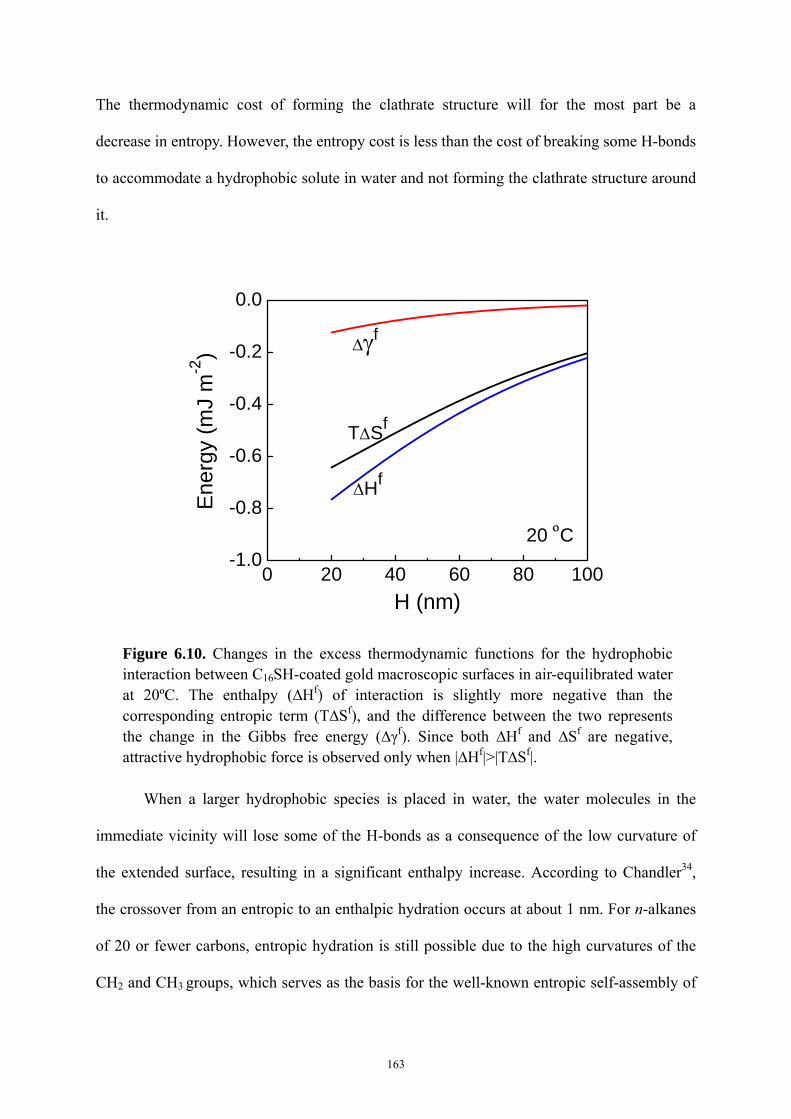
The thermodynamic cost of forming the clathrate structure will for the most part be a
decrease in entropy. However, the entropy cost is less than the cost of breaking some H-bonds
to accommodate a hydrophobic solute in water and not forming the clathrate structure around
it.
When a larger hydrophobic species is placed in water, the water molecules in the
immediate vicinity will lose some of the H-bonds as a consequence of the low curvature of
the extended surface, resulting in a significant enthalpy increase. According to Chandler34,
the crossover from an entropic to an enthalpic hydration occurs at about 1 nm. For n-alkanes
of 20 or fewer carbons, entropic hydration is still possible due to the high curvatures of the
CH2 and CH3 groups, which serves as the basis for the well-known entropic self-assembly of
0 20 40 60 80 100-1.0
-0.8
-0.6
-0.4
-0.2
0.0
Δγf
TΔSf
ΔHf
20 οC
Ene
rgy
(mJ
m-2
)
H (nm)
Figure 6.10. Changes in the excess thermodynamic functions for the hydrophobic interaction between C16SH-coated gold macroscopic surfaces in air-equilibrated water at 20ºC. The enthalpy (∆Hf) of interaction is slightly more negative than the corresponding entropic term (T∆Sf), and the difference between the two represents the change in the Gibbs free energy (∆γf). Since both ∆Hf and ∆Sf are negative, attractive hydrophobic force is observed only when |∆Hf|>|T∆Sf|.
163
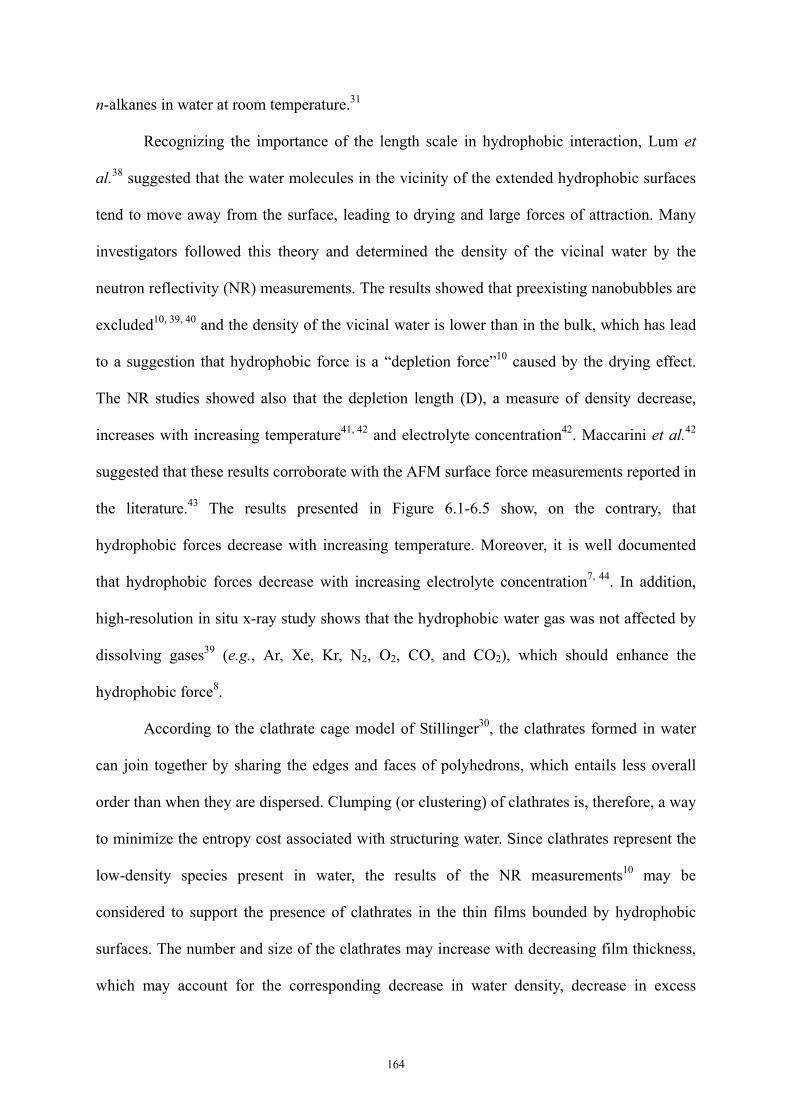
n-alkanes in water at room temperature.31
Recognizing the importance of the length scale in hydrophobic interaction, Lum et
al.38 suggested that the water molecules in the vicinity of the extended hydrophobic surfaces
tend to move away from the surface, leading to drying and large forces of attraction. Many
investigators followed this theory and determined the density of the vicinal water by the
neutron reflectivity (NR) measurements. The results showed that preexisting nanobubbles are
excluded10, 39, 40 and the density of the vicinal water is lower than in the bulk, which has lead
to a suggestion that hydrophobic force is a “depletion force”10 caused by the drying effect.
The NR studies showed also that the depletion length (D), a measure of density decrease,
increases with increasing temperature41, 42 and electrolyte concentration42. Maccarini et al.42
suggested that these results corroborate with the AFM surface force measurements reported in
the literature.43 The results presented in Figure 6.1-6.5 show, on the contrary, that
hydrophobic forces decrease with increasing temperature. Moreover, it is well documented
that hydrophobic forces decrease with increasing electrolyte concentration7, 44. In addition,
high-resolution in situ x-ray study shows that the hydrophobic water gas was not affected by
dissolving gases39 (e.g., Ar, Xe, Kr, N2, O2, CO, and CO2), which should enhance the
hydrophobic force8.
According to the clathrate cage model of Stillinger30, the clathrates formed in water
can join together by sharing the edges and faces of polyhedrons, which entails less overall
order than when they are dispersed. Clumping (or clustering) of clathrates is, therefore, a way
to minimize the entropy cost associated with structuring water. Since clathrates represent the
low-density species present in water, the results of the NR measurements10 may be
considered to support the presence of clathrates in the thin films bounded by hydrophobic
surfaces. The number and size of the clathrates may increase with decreasing film thickness,
which may account for the corresponding decrease in water density, decrease in excess
164
entropy ( ), and hence increase in hydrophobic force. Eriksson et al.fS 14 assumed that the
clusters are of quasi-cylindrical shape, and derived a surface-thermodynamic model for the
long-range attractive forces observed between charge-free hydrophobic surfaces.14 The
possibility of forming linear clusters is to some extent supported by the recent spectroscopic
evidence that a water molecule is bonded to its neighbors by two strong and two weak
H-bonds rather than four bonds of equal strength.45
6.4.2 Effect of Solutes
It has been shown that the long-range attractions between hydrophobic surfaces
decrease considerably in degassed solutions.6, 8 This important observation can be analyzed
by means of the Gibbs surface tension equation adapted for thin planar films at constant
temperature, pressure, and film thickness:
fS
H,p,TS
fΓΔ−=⎟
⎟⎠
⎞⎜⎜⎝
⎛
μ∂γΔ∂ (6.5)
in which is the chemical potential of a solute (dissolved air) and is its excess
quantity per m
Sμ fSΓΔ
2 in the thin film of thickness H. Since the attractive force increases (i.e.,
becomes more negative) in the presence of dissolved air, must be positive in the thin
film, that is, the amount of a dissolved gas in a thin film between two hydrophobic surfaces is
higher than in a thick film. The excess dissolved gas in a thin film should promote the
clathrate structure by the hydrophobic hydration mechanism described above and, hence,
should give rise to a stronger hydrophobic force. The van der Waals attraction between the
guest (gas) and host (water) molecules should also contribute to the stabilization of clathrate
structure. Meagher et al.
fγΔ
fSΓΔ
6 and Meyer et al.8 showed that hydrophobic force becomes shorter
ranged in degassed water, which may be attributed to the weakening of the clathrate structure
and, hence, smaller number and size of the clathrates.
165
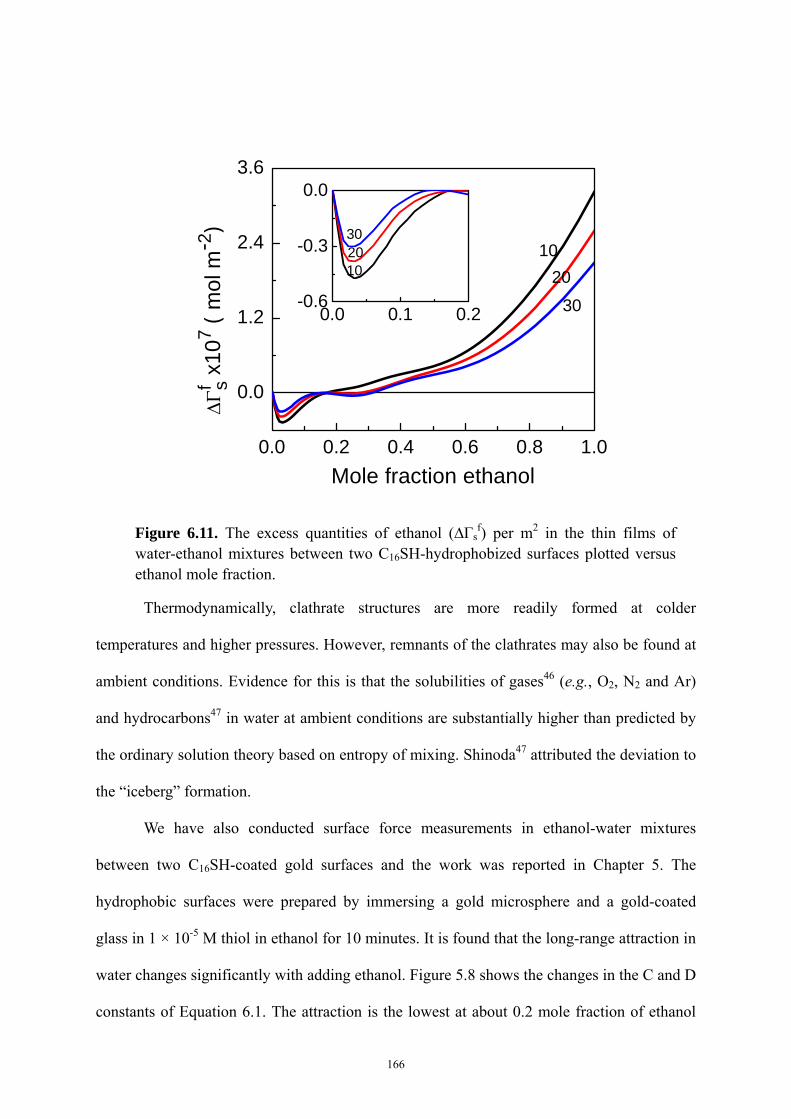
Thermodynamically, clathrate structures are more readily formed at colder
temperatures and higher pressures. However, remnants of the clathrates may also be found at
ambient conditions. Evidence for this is that the solubilities of gases46 (e.g., O2, N2 and Ar)
and hydrocarbons47 in water at ambient conditions are substantially higher than predicted by
the ordinary solution theory based on entropy of mixing. Shinoda47 attributed the deviation to
the “iceberg” formation.
0.0 0.2 0.4 0.6 0.8 1.0
0.0
1.2
2.4
3.6
0.0 0.1 0.2-0.6
-0.3
0.0
ΔΓf s
x107 (
mol
m-2
)
Mole fraction ethanol
1020
30
102030
Figure 6.11. The excess quantities of ethanol (∆Γsf) per m2 in the thin films of
water-ethanol mixtures between two C16SH-hydrophobized surfaces plotted versus ethanol mole fraction.
We have also conducted surface force measurements in ethanol-water mixtures
between two C16SH-coated gold surfaces and the work was reported in Chapter 5. The
hydrophobic surfaces were prepared by immersing a gold microsphere and a gold-coated
glass in 1 × 10⁻⁵ M thiol in ethanol for 10 minutes. It is found that the long-range attraction in
water changes significantly with adding ethanol. Figure 5.8 shows the changes in the C and D
constants of Equation 6.1. The attraction is the lowest at about 0.2 mole fraction of ethanol
166
and increases on either side, and both C and D have minimum values at about the ethanol
mole fraction 0.2. This finding mirrors other properties of ethanol-water mixtures regarding
oxygen solubility48 and the surface excess of ethanol at the air-solution interface.49
The data presented in Figure 5.8 have been used to calculate the film excess of
ethanol ( ) using Equation 6.5. By invoking vapor pressure data of Butler and
Wightman
fSΓΔ
49 that yield the changes in ethanol with the chemical potential changes of ethanol,
we can thus compute the excess of ethanol in the film as a function of composition for
different film thickness. The results presented in Figure 6.11 show that at low ethanol
concentrations is negative, indicating that some of the ethanol is excluded from the
thin film. This is most probably because ethanol disrupts the water structure in the vicinity of
hydrophobic surfaces. As the ethanol concentration is increased, the strong, long-range
attraction reappears, and becomes positive, which means that water molecules are to
some extent expelled from the thin films between the hydrophobic surfaces. Both water and
ethanol are H-bonding liquids. It appears, however, that the H-bonding of one becomes less
extensive in the presence of the other, and causes the long-range attraction to diminish.
fSΓΔ
fSΓΔ
Neto50 also observed strong long-range attractions between hydrophobic surfaces in
pure ethanol, and Boinovich and Emelyanenko51 detected structural changes in the thin
ethanol films (<5 nm) formed between fluorite surfaces using an infrared spectroscopic
technique. In all likelihood, a layer-wise molecular arrangement that extends toward the core
of the thin film is generated.
6.5 Summary and Conclusions
Our new thermodynamic data lend support for the hydrophobic force originating from
the structural differences between water in the thin and thick films bounded by hydrophobic
surfaces. This conclusion is the same as originally suggested by Rabinovich and Derjaguin52
167
and Eriksson et al13. The water molecules in the vicinity of hydrophobic surfaces reorganize
themselves to form clathrates and clusters thereof, and cause hydrophobic attractions to
appear. In the presence of dissolved gases, the clathrate structure becomes stronger, which
gives rise to long-range hydrophobic forces. In degassed solutions, the clathrate structure
becomes weaker, which in turn causes the hydrophobic force to become short-ranged8 and
oil-in-water emulsions to become stabilized without surfactant53. Unlike the dissolved inert
gases, ethanol disrupts the water structure and, hence, diminishes the long-range attractions.
Further studies in the thermodynamics of hydrophobic interactions should lead to a better
understanding of the origin of hydrophobic force, which plays an important role in a variety
of scientific and technological fields.
6.6 Acknowledgement
The authors are grateful for the financial assistance from the National Energy
Technology Laboratory, the U.S. Department of Energy (DE-FC26-02NT41607).
6.7 References
1. Israelachvili, J.; Pashley, R., Nature 1982, 300, 341-342.
2. Parker, J. L.; Claesson, P. M.; Attard, P., J. Phys. Chem. 1994, 98, 8468-8480.
3. Tyrrell, J. W. G.; Attard, P., Phys. Rev. Lett. 2001, 87, (17), 176104-1.
4. Seo, H.; Yoo, M.; Jeon, S., Langmuir 2007, 23, 1623-1625.
5. Sakamoto, M.; Kanda, Y.; Miyahara, M.; Higashitani, K., Langmuir 2002, 18,
5713-5719.
6. Meagher, L.; Craig, V. S. J., Langmuir 1994, 10, 2736-2742.
7. Zhang, J.; Yoon, R.-H.; Mao, M.; Ducker, W. A., Langmuir 2005, 21, 5831-5841.
168
8. Meyer, E. E.; Lin, Q.; Israelachvili, J. N., Langmuir 2005, 21, 256-259.
9. Derjaguin, B. V., Kolloid Zeits 1934, 69, 155-164.
10. Doshi, D. A.; Watkins, E. B.; Israelachvili, J. N.; Majewski, J., Proc. Nat. Acad. Sci.
U.S.A 2005, 102, 9458-9462.
11. Nguyen, A. V.; Nalaskowski, J.; Miller, J. D.; Butt, H.-J., Int. J. Miner. Process. 2003, 72,
215-225.
12. Ederth, T., J. Phys. Chem. B 2000, 104, 9704-9712.
13. Eriksson, J. C.; Ljunggren, S.; Claesson, P. M., J. Chem. Soc., Faraday Trans. 2 1989, 85,
(3), 163-176.
14. Eriksson, J. C.; Henriksson, U., Langmuir 2007, 23, 10026-10033.
15. Miklavic, S. J.; Chan, D. Y. C.; White, L. R.; Healy, T. W., J. Phys. Chem. 1994, 98,
9022-9032.
16. Meyer, E. E.; Lin, Q.; Hassenkam, T.; Oroudjev, E.; Israelachvili, J., Proc. Nat. Acad. Sci.
U.S.A 2005, 102, (19), 6839-6842.
17. Christenson, H. K.; Yaminsky, V. V., Colloids Surf., A 1997, 129-130, 67-74.
18. Podgornik, R., J. Chem. Phys 1989, 91, (9), 5840-5849.
19. Claesson, P. M.; Christenson, H. K., J. Phys. Chem 1988, 92, 1650-1655.
20. Lin, Q.; Meyer, E. E.; Tadmor, M.; Israelachvili, J. N.; Kuhl, T. L., Langmuir 2005, 21,
251-255.
21. Ederth, T.; Claesson, P.; Liedberg, B., Langmuir 1998, 14, 4782-4789.
22. Wang, J.; Yoon, R.-H., Langmuir 2008, 24, 7889-7896.
23. Ducker, W. A.; Senden, T. J.; Pashley, R. M., Nature 1991, 353, 239-241.
169
24. Rabinovich, Y. I.; Yoon, R.-H., Langmuir 1994, 10, 1903-1909.
25. Raiteri, R.; Preuss, M.; Grattarola, M.; Butt, H.-J., Colloids Surf., A 1998, 136, 191-197.
26. Cleveland, J. P.; Manne, S.; Bocek, D.; Hansma, P. K., Rev. Sci. Instrum. 1993, 64, (2),
403-405.
27. Tsao, Y.-H.; Yang, S. X.; Evans, D. F.; Wennerstrom, H., Langmuir 1991, 7, 3154-3159.
28. Roentgen, W. C., Ann. Phys. 1892, 281, 91-97.
29. Pauling, L., Science 1961, 134, 15-21.
30. Stillinger, F. H., Science 1980, 209, 451-457.
31. Tanford, C., The Hydrophobic Effect. 2 ed.; Wiley: New York, 1980.
32. Israelachvili, J. N.; Pashley, R. M., J. Colloid Interface Sci. 1984, 98, (2), 500-514.
33. Chandler, D., Nature 2002, 417, 491.
34. Chandler, D., Nature 2005, 437, 640-647.
35. Frank, H. S.; Wen, W.-Y., Discuss. Faraday Soc. 1957, 24, 133-140.
36. Sharp, K. A.; Madan, B., J. Phys. Chem. B 1997, 101, 4343-4348.
37. Kauzmann, W., Nature 1987, 325, 763-764.
38. Lum, K.; Chandler, D.; Weeks, J. D., J. Phys. Chem. B 1999, 103, 4570-4577.
39. Mezger, M.; Reichert, H.; Schoder, S.; Okasinski, J.; Schroder, H.; Dosch, H.; Palms, D.;
Ralston, J.; Honkimaki, V., Proc. Nat. Acad. Sci. U.S.A 2006, 103, (49), 18401-18404.
40. Poynor, A.; Hong, L.; Robinson, I. K.; Granick, S., Phys. Rev. Lett. 2006, 97, 266101.
41. Jensen, T. R.; Jensen, M. Q.; Reitzel, N.; Balashev, K.; Peters, G. H.; Kjaer, K.;
Bjqrnholm, T., Phys. Rev. Lett. 2003, 90, (8), 086101-1.
42. Maccarini, M.; Steitz, R.; Himmelhaus, M.; Fick, J.; Tatur, S.; Wolff, M.; Grunze, M.;
170
Janecek, J.; Netz, R. R., Langmuir 2007, 23, 598-608.
43. Kokkoli, E.; Zukoski, C. F., Langmuir 1998, 14, 1189-1195.
44. Christenson, H. K.; Claesson, P. M.; Berg, J.; Herder, P. C., J. Phys. Chem. 1989, 93,
1472-1478.
45. Wernet, P.; Nordlund, D.; Bergmann, U.; Cavalleri, M.; Odelius, M.; Ogasawara, H.;
Naslund, L. A.; Kirsch, T. K.; Ojamae, L.; Glatzel, P.; Pettersson, L. G. M.; Nilsson, A.,
Science 2004, 304, 995-999.
46. Battino, R.; Clever, H. L., Chem. Rev. 1966, 66, (4), 395-463.
47. Shinoda, K., J. Phys. Chem. 1977, 81, (13), 1300-1302.
48. Shchukarev, S. A.; Tolmacheva, T. A., ZhurnalStrukt. Khim 1968, 9, 21-28.
49. Butler, J. A. V.; Wightman, A., J. Chem. Soc. (London) 1932, 2089-2097.
50. Neto, C. Universita degli Studi di Firenze, Firenze, 2001.
51. Boinovich, L. B.; Emelyanenko, A. M., Adv. Colloid Interface Sci. 2002, 96, 37-58.
52. Rabinovich, Y. I.; Derjaguin, B. V., Colloids Surf. 1988, 30, 243-251.
53. Maeda, N.; Rosenberg, K. J.; Israelachvili, J. N.; Pashley, R. M., Langmuir 2004, 20,
3129-3137.
171
Chapter 7
Conclusions and Recommendations
7.1 Conclusions
In this work, the force measurements were conducted with gold surfaces pretreated by
ex-situ adsorption of alkanethiols and in-situ adsorption of water-soluble xanthates of
different chain lengths, concentrations, and immersion times. Further, the force measurements
were conducted in the presence of various solutes such as inorganic electrolytes, ionic
surfactants, and alcohols that can affect the properties (e.g., structure) of the thin water films
between two hydrophobic surfaces. To gain an understanding of the water structure, the
changes in the excess film entropies and enthalpies across the film thickness were determined
by measuring the surface forces at different temperatures.
Based on the findings of the present study, conclusions can be drawn as follows:
1. I observed long-range attractions between gold surfaces pretreated by ex-situ
adsorption of alkanethiols (n = 2-16) and in-situ adsorption of water-soluble
xanthate surfactants (i.e., PAX, KEX). The long-range attractive forces decayed
exponentially, and were detected at the separation distance of up to 120 nm. The
force curves exhibited no steps, indicating that the long-range attraction was not
due to bridging bubbles.
2. The surface forces measured between hydrophobized-gold surfaces depend on
surface treatment conditions such as surfactant concentration and immersion time.
When the surfaces were hydrophobized in 1 mM 1-hexadecanethiol of ethanol
172
solution longer than 6 hours, the measured forces were net-attractive and
long-ranged. However, the force curves exhibited steps, indicating that the
measured forces were due to bridging bubbles. It is possible that the thiol
monolayer can have defects (or pits) in which air bubbles can nucleate. When the
gold substrates were hydrophobized in a dilute (1 × 10⁻² mM) thiol solution at
relatively short contact time (10 minutes), a long-range attractive force which
decayed exponentially with a decay length of 35 nm was obtained, and the force
curve exhibited no steps. It is possible that at lower concentrations and shorter
contact times smoother coatings are formed, which are less likely to trap
nanobubbles and hence give rise to smooth force curves.
When the gold substrates were immersed in the 1 × 10⁻² mM C16SH- and
C12SH-in-ethanol solutions for different periods of time, the attractive forces
increased with immersion time, and then decreased. All the forces measured were
stronger and longer-ranged than the van der Waals force. The contact angles on
these surfaces were greater than 90º. When the force measurements were
conducted after washing the substrates with appropriate solvents, strong
long-range hydrophobic forces appeared. The same behavior was also found for
gold in PAX solutions after different immersion times. It is suggested that the
decrease of hydrophobic force is caused by the formation of the bilayers of thiol
or xanthate, which can be washed away by using appropriate solvents.
3. The long-range attractions were observed between thiol-coated gold surfaces
regardless of weather the contact angles were greater or smaller than 90º. When
173
gold surfaces were hydrophobized with C2SH, the contact angle was less than 90º.
In this case, no cavitation is possible. Yet, the AFM force measurement gave a
long-range attraction. It is suggested that hydrophobic force is not due to the
bubbles present on hydrophobic surfaces or to the cavitation (or drying).
4. The long-range hydrophobic attraction increases with increasing chain length of
alkanethiol, decreases in the presence of salt (e.g., NaCl) and surfactant (e.g.,
C12TACl, PAX), and changes with ethanol concentration. The strongest
hydrophobic attraction measured on the C4SH-coated gold was weaker than those
measured on C12SH- and C16SH-coated gold surfaces. The latter two surfaces had
the same water contact angles and were indistinguishable with respect to the
hydrophobic attractions measured. It was also found that the hydrophobic force
measured with PAX was much larger than that with KEX.
The attractive forces measured on C12SH-, C16SH- and PAX-coated gold surfaces
were effectively reduced by electrolyte (NaCl), indicating that they may be of
electrostatic origin. For this mechanism to work, it is necessary that the charged
patches be mobile when two surfaces approach each other to maximize the
correlation and give rise to a long-range attraction. However, the strong covalent
Au-S bonding provides robust and immobile hydrophobic monolayers, which
precludes the possibility of charged patches being mobile. Further, there is no
reason that thiol or xanthate adsorption produced charged patches as they
chemisorbs on gold. For the case of xanthate adsorption, both the adsorbate and
adsorbent are negatively charged. Our work leaves the possibility that the
174
long-range attraction is caused by the changes in water structure near
hydrophobic surfaces. It is possible that the electrolyte (NaCl), ionic surfactant
(C12TACl) and residual xanthate (PAX) in solution break the H-bonded water
structure and, hence, reduce the hydrophobic force.
The surface force data obtained in water-ethanol mixtures showed that the
attractions were strong and long-ranged in pure water and pure ethanol, whereas
they were weaker and of shorter range in water-ethanol mixtures with mole
fraction of ethanol from 0.1 to 0.9. The data have been analyzed by using thin
film thermodynamics. The results mirror the well-known, rather special bulk
properties of water-ethanol mixtures. At mole fractions below about 0.2, a
breakdown of the water structure due to introducing ethanol molecules was a
predominant feature, explaining the reduction of hydrophobic attraction in both
strength and range. For high ethanol mole fractions, we can assume that a layered,
laterally homogenous surface structure was formed that stretches some distance
away from the hydrophobic surfaces, likewise giving rise to a long-range
attraction that was readily disturbed, however, by adding more water.
5. Hydrophobic force may be a structural force. The measurements carried out at
10−40ºC show that the hydrophobic force decreased with increasing temperature.
Thermodynamically, these results imply that as two hydrophobic surfaces
approach each other the changes in excess film entropy (Sf) and enthalpy (Hf) per
unit area decrease, which suggests that the hydrophobic force is due to the
structuring of water in the thin film confined by two hydrophobic surfaces rather
175
than from an artifact.
7.2 Recommendations for Future Work
Based on the results obtained in this work, the following areas of research are
recommended:
1. It has been suggested that the hydrophobic force may be related to the structure of
water confined between hydrophobic surfaces. Direct evidence for the structure
change of water is needed. Therefore, systematic neutron reflectivity (NR)
measurement, in-situ x-ray or nuclear magnetic resonance (NMR) studies on
water between two hydrophobic surfaces which are close to each other are highly
recommended.
2. Based on the surface force measurements at different temperatures, it was
speculated that water molecules form partial or full clathrates in the vicinity of
hydrophobic surfaces and the presence of gases facilitates the clathrate hydrate
formation. In the future work, the AFM force measurements are recommended to
be conducted in the presence of different gases (e.g., CO2, CH4, H2, He, N2)
dissolved in water to investigate the gas effect. Molecular dynamic simulation of
water in the vicinity of hydrophobic surfaces is recommended to pursue the
molecular origin of the hydrophobic force.
176