Embed Size (px)
Citation preview
S1
Supplementary Figures
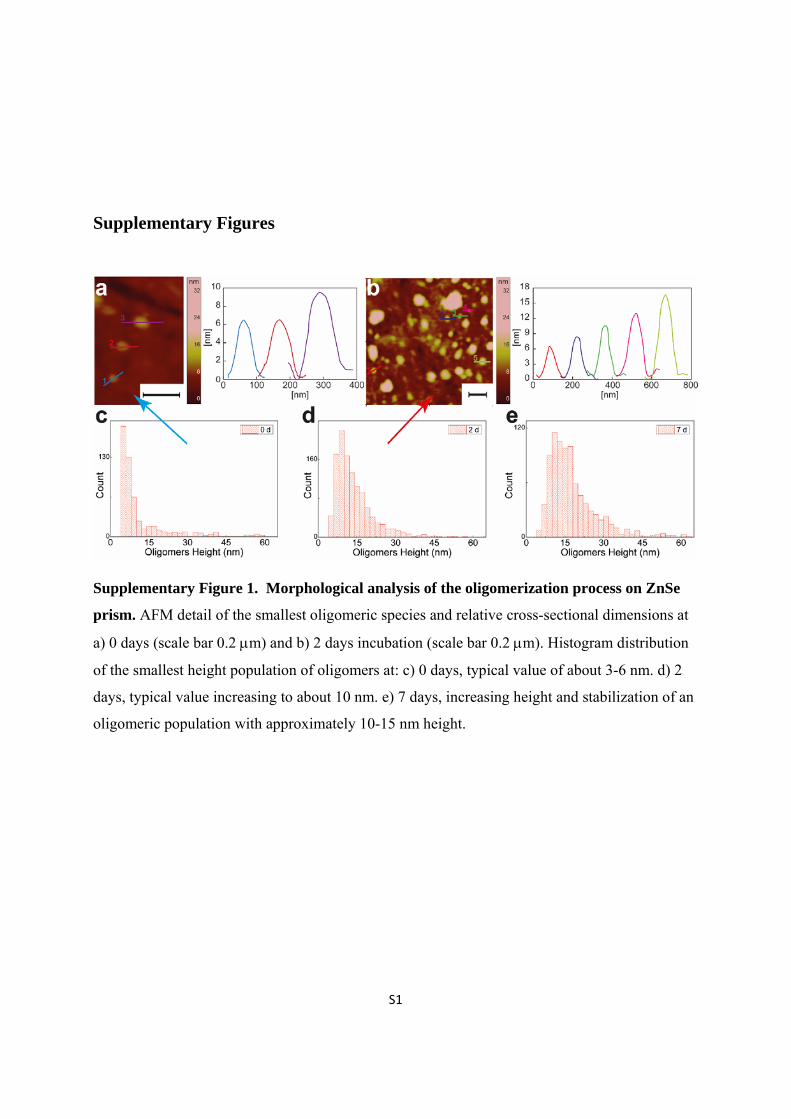
Supplementary Figure 1. Morphological analysis of the oligomerization process on ZnSe
prism. AFM detail of the smallest oligomeric species and relative cross-sectional dimensions at
a) 0 days (scale bar 0.2 m) and b) 2 days incubation (scale bar 0.2 m). Histogram distribution
of the smallest height population of oligomers at: c) 0 days, typical value of about 3-6 nm. d) 2
days, typical value increasing to about 10 nm. e) 7 days, increasing height and stabilization of an
oligomeric population with approximately 10-15 nm height.
S2
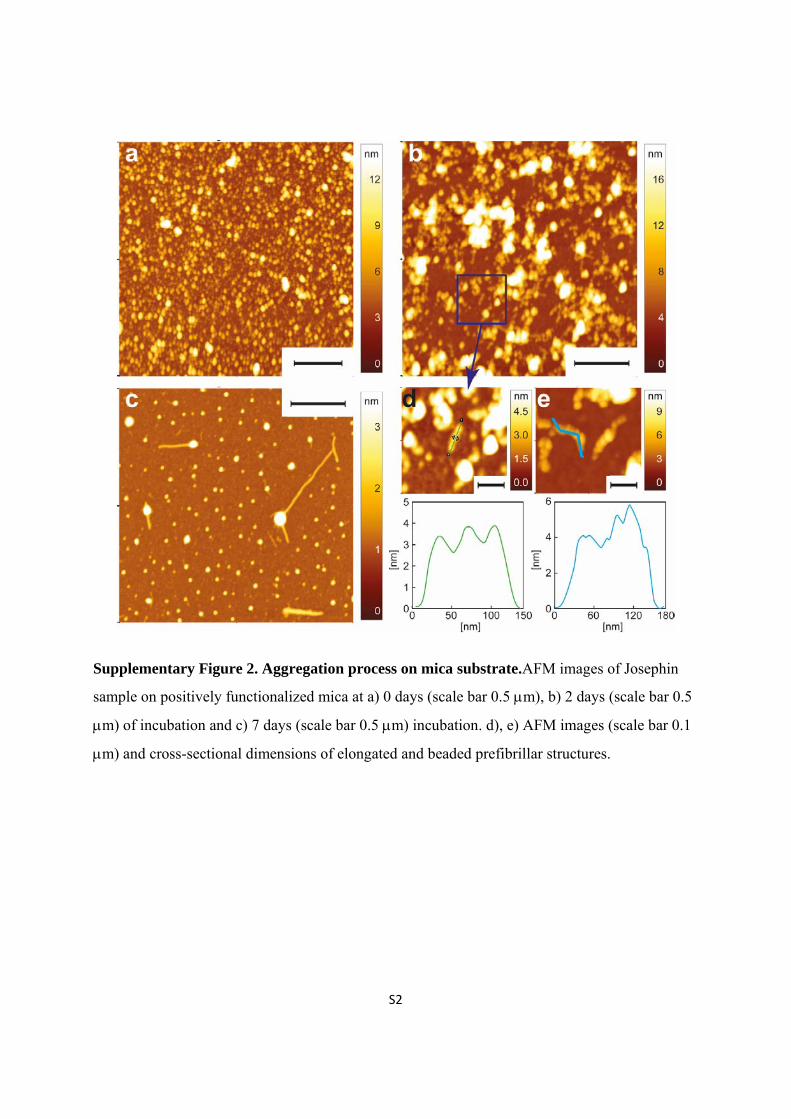
Supplementary Figure 2. Aggregation process on mica substrate.AFM images of Josephin
sample on positively functionalized mica at a) 0 days (scale bar 0.5 m), b) 2 days (scale bar 0.5
m) of incubation and c) 7 days (scale bar 0.5 m) incubation. d), e) AFM images (scale bar 0.1
m) and cross-sectional dimensions of elongated and beaded prefibrillar structures.

S3
Supplementary Figure 3. Morphological analysis of large oligomeric aggregates at 0 days.
a) AFM height image (scale bar 5 m). The dotted line approximately represents the area shown
in the main text. b) Horizontal cross sections of the structures.
S4
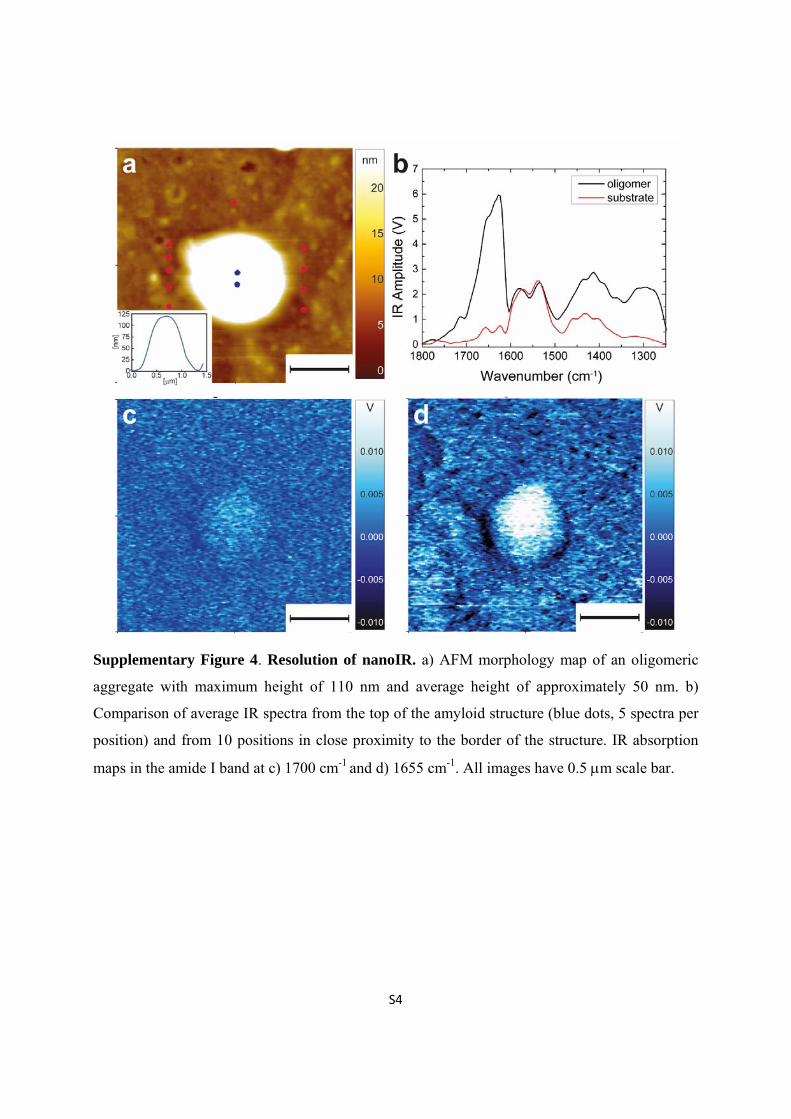
Supplementary Figure 4. Resolution of nanoIR. a) AFM morphology map of an oligomeric
aggregate with maximum height of 110 nm and average height of approximately 50 nm. b)
Comparison of average IR spectra from the top of the amyloid structure (blue dots, 5 spectra per
position) and from 10 positions in close proximity to the border of the structure. IR absorption
maps in the amide I band at c) 1700 cm-1 and d) 1655 cm-1. All images have 0.5 m scale bar.

Supplem
each wa
investig
Supplem
a) AFM
mentary Fi
avenumber.
gated spectra
mentary Fi
M height (sca
igure 5. Na
The spectra
al region.
igure 6. Mo
ale bar 2 m
anoIR’s las
a are normal
orphologica
m). b) Heigh
S5
ser power
lized in ord
al propertie
ht cross secti
spectrum.
der to have c
es of aggreg
ions.
Effective p
constant lase
gates after 7
power of th
er power alo
7 days incu
he laser at
ong all the
ubation.
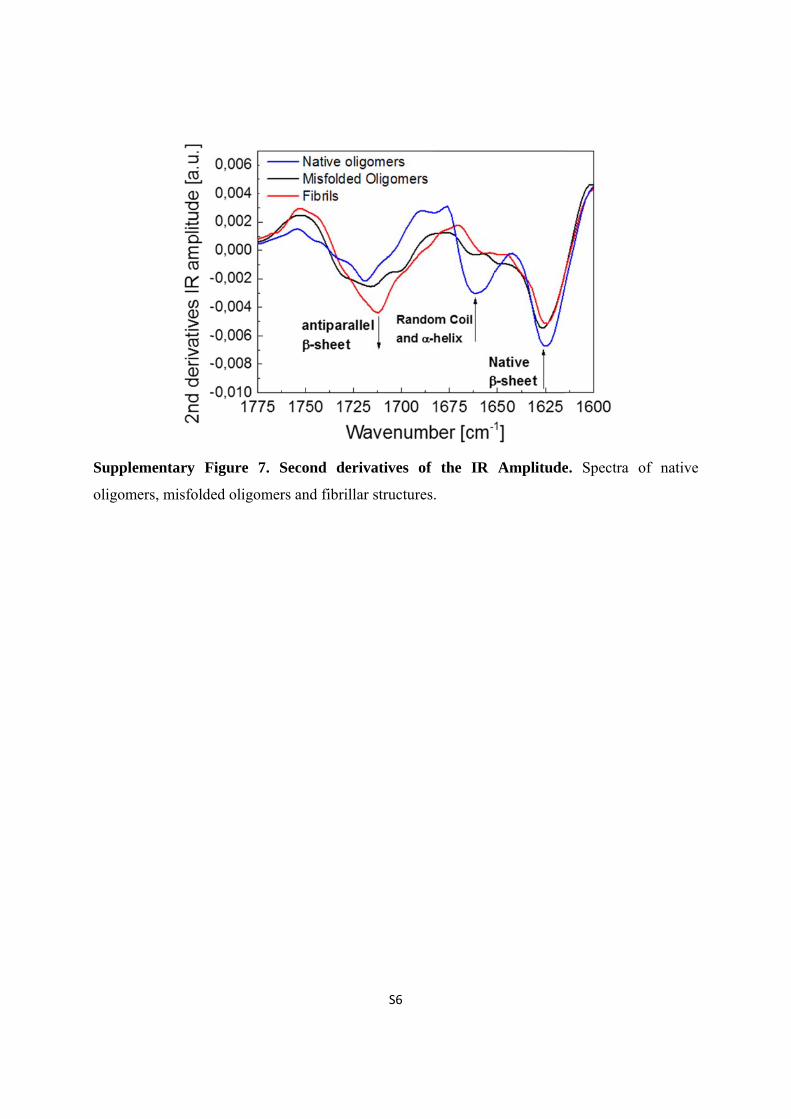
Supplem
oligome
mentary F
ers, misfolde
Figure 7. S
ed oligomer
Second der
rs and fibrill
S6
rivatives o
lar structure
of the IR
es.
Amplitude
e. Spectra of native

Supplem
derivati
showing
Plot.
mentary F
ives. Spectr
g: a) 3-D Sc
Figure 8. T
ral range w
cores Plot;
The results
within 1800
b) Loading
S7
s of PCA
cm-1– 1270
gs Plots; c)
analysis ap
0 cm-1 (exc
PC1-PC2 S
pplied to t
cluding 162
Scores Plot
the spectra
20 cm-1 – 1
; d) PC2-PC
al second
480 cm-1)
C3 Scores
S8
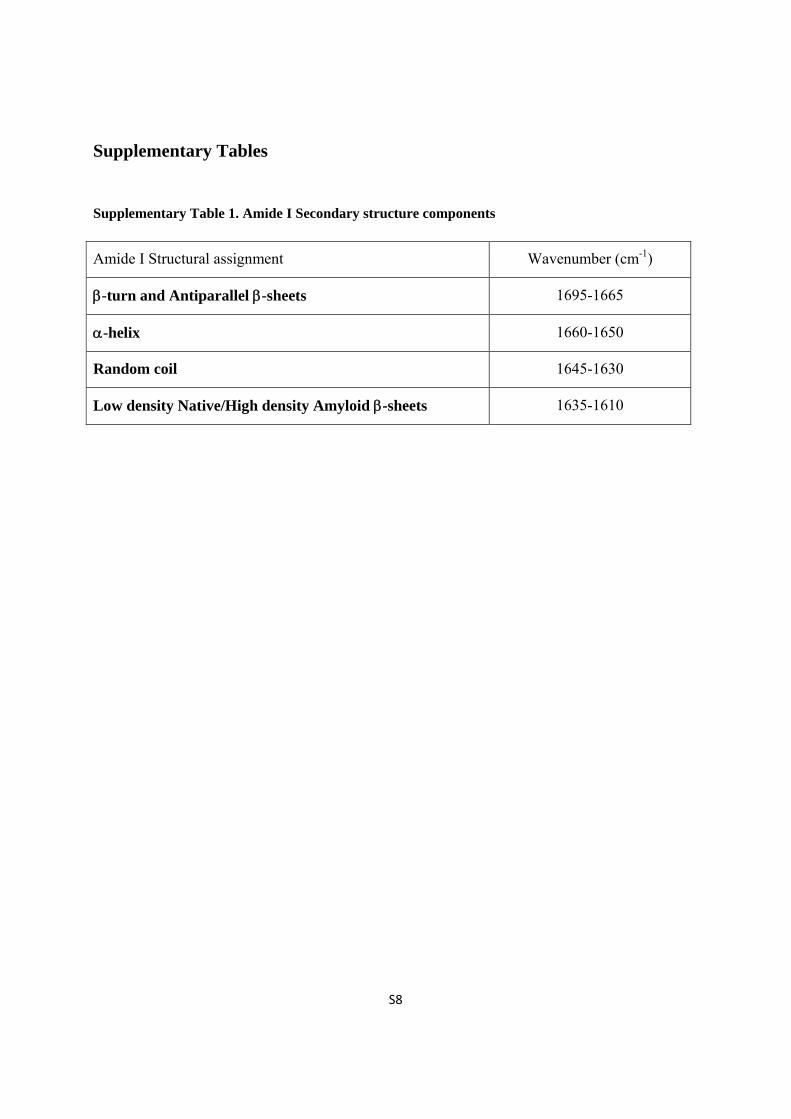
Supplementary Tables
Supplementary Table 1. Amide I Secondary structure components
Amide I Structural assignment Wavenumber (cm-1)
-turn and Antiparallel -sheets 1695-1665
-helix 1660-1650
Random coil 1645-1630
Low density Native/High density Amyloid -sheets 1635-1610
S9
Supplementary Discussion
Comparison of Josephin Aggregation on ZnSe and Mica Substrates
In order to compare the aggregation process on the ZnSe prism (Fig. 1 and Supplementary Fig.
1) with the previous experiments in literature on charged substrates,1 we performed conventional
AFM measurements in air of the sample deposited on positively functionalized mica
(Supplementary Fig. 2).
The AFM measurements on the mica substrate were conducted on the same solution and in
parallel with the infrared nanospectroscopy experiments on the ZnSe prism. We investigated the
process at the same time points: 0, 2 and 7 days. At 0 days, before incubation, we could observe
only monomers and spheroidal oligomers (height ≈30 nm). At 2 days, the images showed
interacting oligomers losing their spherical shape and high resolution measurements evidenced
flexible and beaded prefibrillar structures. These results were in agreement with what shown by
Masino et al.1 Furthermore, the presence of interacting oligomers losing their spheroidal shape is
well corresponding with the measurements on the ZnSe prism (Fig. 1-2). Finally, at 7 days, we
could not observe stiff fibrillar bundles and aggregates as in the case of the sample deposited on
the ZnSe; only low concentrated fibrillar species on mica were present. This is likely caused by
the hydrophilicity of the mica surface that did not allow the stable deposition of hydrophobic
fibrillar aggregates and bundles. Probably because of a weak sample-surface interaction, these
structures do not attach firmly to the mica substrate and that they were rinsed away in the last
step of sample’s preparation (rinsing by water and flushing by nitrogen).
The morphological differences between structures observed on positively functionalized mica
(Supplementary Fig. 2) and the structures on the ZnSe prism can be explained by a differential

S10
selective absorption of the amyloid structures in solution by these two surfaces, which possess a
different state of charge. Indeed, as shown by contact angle measurements,2 the ZnSe prism is a
hydrophobic surface. Conversely, MgCl2 or APTES treated mica are hydrophilic surfaces with
positive charge. This is a fundamental difference when depositing an amyloid aggregating
solution on a surface. Indeed, an aggregating amyloid solution is an extremely heterogeneous
ensemble of structures with different states of charge. For instance, monomeric proteins of
Josephin possess an excess of negative charge (-10), while amyloid fibrillar aggregates are
insoluble and highly hydrophobic. The hydrophilicity of the mica surface probably did not allow
the stable deposition of large insoluble fibrillar bundles, which were consequently absent on this
surface. Whereas, the hydrophobicity of the ZnSe substrate enabled the deposition and the study
of the stiffer and hydrophobic fibrillar bundles and aggregates presented in Fig. 1-2.
In conclusion, the use of different substrates allowed a wider view of the aggregation process in
solution. Indeed, the comparison of the AFM images of the proteins (from the same aliquot
solution) deposited on the ZnSe prism and on functionalized mica indicates that fibrillar
aggregates are always present in solution and that they are able to attach firmly only on the ZnSe
surface.
IR spectroscopy Provides Structural Analysis of the Amyloidogenic Aggregates
IR spectroscopy can be used to observe the conformational transition from monomers to cross -
sheet amyloid structures and investigate their structural properties at the nanoscale during
amyloid formation. IR spectroscopy is based on the molecular vibrations produced, under light
exposition, by stretching, deformational motions, bending and rotations of chemical bonds. The
amide I, amide II and amide III modes are the most commonly used to study the structural
properties of polypeptides. The amide I mode arises mainly from backbone C=O stretching
S11
vibrations with frequencies at 1700-1600 cm-1. The exact band position is determined by the
backbone conformation and thus by the secondary structure of the protein.3,4 The amide II band
reflects a combination of backbone N-H bending and C-N stretching and has frequencies within
1580-1510 cm-1. The amide III band at 1350-1200 cm-1 reflects a combination of different modes
such as C-N stretching, N-H bending, C-C stretching and C=O bending. We could associate the
position of these two bands to the secondary structure of the protein, but the analysis is far from
trivial because of the various contributions. The amide I band is thus the most frequently used to
infer the secondary structure of peptides. From several studies, a consensus has emerged for the
assignment of the secondary structure IR peaks in this spectral region. 5,6 The components that
we have considered concurring to the shape and position of this band are: antiparallel -sheet
and -turn within 1695-1665 cm-1; -helical between 1660-1650 cm-1; random coil between
1645-1630 cm-1; low density native -sheet or high density amyloid -sheets within 1635-1610
cm-1.
NanoIR principle and sensitivity
The combination of AFM and IR spectroscopy is based on a photothermal induced resonance
effect (PTIR). Briefly, if a pulse of IR light at a given wavelength is absorbed by a sample, the
local rise in temperature leads to local photo-thermal expansion. This expansion excites the
mechanical resonances of the AFM cantilever in contact with the sample. The AFM detection of
this temporary dilatation of the scanned region allows reconstructing, together with the
acquisition of conventional morphology imaging, the IR-absorption map of the sample and its
chemical spectra with a lateral resolution defined in principle by the dimensions of the AFM
tip.7,8 The critical thickness (AFM average height) of the sample needed to acquire IR spectra is
S12
in the order of 50-100 nm and is determined by the ultimate instrument sensitivity to the
measurement of the photo-thermal expansion.8 By acquiring IR maps at different wavenumbers
and spectra at specific locations, we could retrieve the spectroscopic properties of native
oligomers as small as 50 nm in average height (Supplementary Fig. 3-4). This is one of the
main advantages of nanoIR compared to conventional IR techniques, which have spatial
resolution limited by the smallest achievable IR spot size (~20 m).9 NanoIR also requires very
small quantities of biological specimens (less than picograms or sub-femtomoles are
sufficient).15 This is a major advantage when working with biological materials whose
production is expensive and time costly.
The resolution of the instrument is clearly showed in the Supplementary Fig. 4, where
we show an AFM image of an oligomeric aggregate (0 days) with average height of
approximately 50 nm and maximum height of 110 nm. The comparison of the spectra acquired
on the top of the structure and in its close proximity on the substrate clearly demonstrates that we
could distinguish the signal acquired from the structure from the residual signal on the substrate,
which can be due to the instrumental noise and to the signal deriving from pressure waves of
other close features. Furthermore, the spectroscopic behaviour in the amide I band is confirmed
by the acquisition of IR absorption maps at different wavenumbers.
Finally, it is worth to note that sensitivity of the instrument in the spectra region within
1610-1550 cm-1 is limited by the extremely low laser power in this region (Supplementary Fig.
5), which causes low signal-to-noise ratio. This is clear in the Supplementary Fig. 4, where the
signal on the aggregate is clearly distinguishable from the one on the substrate in the entire
spectral range, except in the amide II band. For this reason, in this region, the acquisition of
chemical properties of objects with thickness close to the sensitivity limit (average height of 50

S13
nm) is affected by high noise. Thus, spectra of oligomers with average height close to 50 nm and
amide II band between about 1590-1560 had extremely low signal to noise ratio. While, in the
case of fibrillar structures, the lengths of several micrometres, average heights as big as 200 nm
and a shift at lower wavenumbers, where laser power is more intense, allowed to increase the
signal to noise ratio in the amide II bands.
Secondary Structure Estimation of Josephin before incubation
We estimated the secondary structure content of Josephin before incubation at 37 ºC by de-
convolution of the amide I band of the spectrum of the uniform protein aggregates before
incubation (Fig. 3f). The analysis was performed by XPSPEAK and a -squared of at least 0.001
was reached for the statistical significance of the fit. Although the shape of the band is affected
by the high noise between 1610 cm-1 and 1550 cm-1, we could estimate a secondary structure
content of 33% -helix, 29% random coil, 23% -sheet and 15% -turn.
The shoulder of the spectrum around 1715-1725 cm-1 was fitted by considering the IR
absorption peaks of the side chain vibrations of aspartic and glutamic acids.10 The addition of
this band in the fit is easily explicable considering that these amino acids are relatively abundant
in the Josephin structure (~15% of total composition, ~30% more abundant than in the average
protein composition). Moreover, these residues have stronger absorbance coefficients than the
average side chains absorption and they are not superimposed to any other secondary structure
component of amide I band.
Principal Component Analysis
Unprocessed spectra show pronounced baseline effects. To avoid the possible influence
of these baselines on the results and also to present in details the spectral differences related to
S14
the conformational transition of amyloids, PCA was also performed on the second derivatives of
the collected data (Supplementary Fig. 7-8). In this case, we considered the opposite situation
in the interpretation of the correlation between spectra clustering and Loading Plots
(Supplementary Fig. 8a-b): the maximum (minimum) of loading is related to the position of a
particular vibrational motion, which is typical of the spectra clustered on the negative (positive)
values of corresponding Principal Component (PC) on the Scores Plot.
Three clusters of three groups of spectra collected from i) native oligomers, ii) misfolded
oligomers and iii) fibrils are well delineated on the three dimensional (PC-1 vs PC-2 vs PC-3)
Scores Plot (Supplementary Fig. 8a). Two additional Scores Plots (Supplementary Fig. 8c,d)
are shown to visualize the separation along each PC. However, the boundary between a cluster of
spectra collected from native oligomers and misfolded oligomers is not clearly evident. This
suggests that their conformation is more similar in comparison of the conformation of fibrils.
The Loadings Plot (Supplementary Fig. 8b) indicates that PC-1 (33 % of total variance) is
dominated by amide I, which is the most significant marker of amyloid conformational changes.
The PC-1 is negatively correlated with an antiparallel -sheet/-turn band at 1710 cm-1. This
indicates that fibrils (oppositely correlated with a positive PC-1), contain higher levels of
antiparallel -sheet/-turn conformation in comparison to native oligomers (negative PC-1). In
amide I, the PC-1 is positively correlated to the infrared motions corresponding to native -
sheets at 1628 cm-1, which confirms the presence of this conformation in native oligomers. The
PC-1 indicates also a shift of the COO- band from ~1435 cm-1 (fibrils) to 1410 cm-1 (native
oligomers). This band dominates the PC-2, showing also a strong positive correlation at 1435
cm-1 for fibrils and, partially, for misfolded oligomers (negative PC-2), while for native and
misfolded oligomers there is a negative correlation. This is another clear indication that the peak

S15
at 1440 cm-1 is typical of amyloid fibrils. The separation along PC-2 can also be explained by the
negative loading for PC-2 in the spectral region that corresponds to amide III at 1309 cm-1
(oligomers) and positive at 1290 cm-1 (fibrils). PC-3 (17 % of total variance) is dominated by the
spectral features attributed to -helix at 1658 cm-1, which is oppositely correlated to all spectra
of native oligomers, confirming their high content of this secondary structure, and about 50 % of
misfolded oligomers spectra.

S16
Supplementary References
1 Masino, L. et al. The Josephin Domain Determines the Morphological and Mechanical Properties of Ataxin-3 Fibrils. Biophysical Journal 100, 2033-2042, (2011).
2 Jeon, J. S., Raghavan, S. & Sperline, R. P. Quantitative analysis of albumin adsorption onto uncoated and poly(ether)urethane-coated ZnSe surfaces using the attenuated total reflection FTIR technique. Colloids and Surfaces A: Physicochemical and Engineering Aspects 92, 255-265, (1994).
3 Kumosinski, T. F. & Unruh, J. J. Quantitation of the global secondary structure of globular proteins by FTIR spectroscopy: Comparison with X-ray crystallographic structure. Talanta 43, 199-219, (1996).
4 Kong, J. & Yu, S. Fourier transform infrared spectroscopic analysis of protein secondary structures. Acta biochimica et biophysica Sinica 39, 549-559, (2007).
5 Haris, P. & Severcan, F. FTIR spectroscopic characterization of protein structure in aqueous and non-aqueous media. Journal of Molecular Catalysis B: Enzymatic, (1999).
6 Shivu, B. et al. Distinct β-Sheet Structure in Protein Aggregates Determined by ATR–FTIR Spectroscopy. Biochemistry 52, 5176-5183, (2013).
7 Dazzi, A. et al. AFM-IR: Combining Atomic Force Microscopy and Infrared Spectroscopy for Nanoscale Chemical Characterization. Appl. Spectrosc. 66, 1365-1384, (2012).
8 Lahiri, B., Holland, G. & Centrone, A. Chemical Imaging Beyond the Diffraction Limit: Experimental Validation of the PTIR Technique. Small 9, 439-445, (2013).
9 Carr, G. L. Resolution limits for infrared microspectroscopy explored with synchrotron radiation. Review of Scientific Instruments 72, 1613-1619, (2001).
10 Barth, A. The infrared absorption of amino acid side chains. Progress in Biophysics and Molecular Biology 74, 141-173, (2000).


![DNA origami attachment and AFM imaging on mica and SiO 2 /Si [100] in air Foundations of Nanoscience (FNANO2010) NSF workshop on DNA origami Kyoung Nan](https://img.pdfslide.us/doc/110x75/56649ce55503460f949b26df/dna-origami-attachment-and-afm-imaging-on-mica-and-sio-2-si-100-in-air-foundations.jpg)


![DNA origami attachment and AFM imaging on mica and SiO 2 /Si [100] in air](https://img.pdfslide.us/doc/110x75/5681665c550346895dd9dee8/dna-origami-attachment-and-afm-imaging-on-mica-and-sio-2-si-100-in-air.jpg)