Embed Size (px)
Citation preview
AfghanistanOpium Survey 2015
Cultivation and Production
Vienna International Centre, PO Box 500, 1400 Vienna, Austria Tel.: (+43-1) 26060-0, Fax: (+43-1) 26060-5866, www.unodc.org
AFG
HA
NIS
TAN
OP
IUM
SU
RV
EY
2015
DE
CE
MB
ER
201
5
Banayee Bus Station, Jalalabad Main Road9th District, Kabul, AfghanistanTel.: (+93) 799891851, www.mcn.gov.af
Islamic Republic of AfghanistanMinistry of Counter Narcotics
Islamic Republic of AfghanistanMinistry of Counter Narcotics
Afghanistan Opium Survey 2015
2
ABBREVIATIONS
AGE Anti-Government elements
ANP Afghan National Police
CNPA Counter Narcotics Police of Afghanistan
GLE Governor-led eradication
ICMP Illicit Crop Monitoring Programme (UNODC)
ISAF International Security Assistance Force
MCN Ministry of Counter-Narcotics
UNODC United Nations Office on Drugs and Crime
ACKNOWLEDGEMENTS
The following organizations and individuals contributed to the implementation of the Afghanistan
Opium Survey and to the preparation of this report:
Ministry of Counter-Narcotics
Prof. Salamat Azimi (Minister), Haroon Rashid Sherzad (Deputy Minister), Mohammad Ibrahim Azhar
(Deputy Minister), Mohammad Osman Frotan (Director General Policy and Planning), Sayed
Najibullah Ahmadi (Acting Director of Narcotics Survey Directorate), Humayon Faizzad (Provincial
Affairs Director), Saraj Ahmad (Deputy Director of Narcotics Survey Directorate), Nasir Ahmad
Karimi (Deputy Director of Narcotics Survey Directorate) Mohammad Ajmal Sultani (Statistical Data
Analyst), Mohammad Hakim Hayat (GIS & Remote sensing analyst ), Shabir Ahmad Taieb (GIS &
Remote Sensing Analyst), Sayed Shahenshah Sadat (Quality Control and Digit Specialist), Ahmad
Mustafa Safi (Database Analysis & Statistics Member), Najeem Alcozai (Database Analysis &
Statistics Member), Karimdad Qadari (Database Analysis & Statistics Member) and Hamida Hussaini
(Administrative Officer)
Survey Coordinators: Sayed Eshaq Masumi (Central Region), Abdul Latif Ehsan (Western Region),
Fida Mohammad (Northern Region), Mohammed Ishaq Anderabi (North-Eastern Region), Khalil
Ahmad Noori (Southern Region), Abdullah Jan Daudkhail (Eastern Region)
United Nations Office on Drugs and Crime (Kabul)
Andrey Avetisyan (Regional Representative), Mark Colhoun (Deputy Representative), Devashish Dhar
(International Project Coordinator), Abdul Manan Ahmadzai (Senior Survey Officer), Noor
Mohammad Sadiq (Database Developer)
Remote Sensing Analysts: Ahmad Jawid Ghiasee and Sayed Mehdi Sadat. Ziaulhaq Sidiqi (GIS
Associate), Asia Noory (Project Associate)
Survey Coordinators: Abdul Basir Basiret (Eastern Region), Sayd Ghawash Nayer (Western Region),
Rahimullah Omar (Central Region).
Provincial Coordinators: Mohammad Alam Ghalib (Eastern Region), Altaf Hussain Joya (North-
eastern Region), Lutfurhaman Lutfi (Northern Region).
United Nations Office on Drugs and Crime (Vienna)
Jean-Luc Lemahieu (Director, Division for Policy Analysis and Public Affairs), Angela Me (Chief,
Research and Trend Analysis Branch), Chloé Carpentier (Chief, Statistics and Surveys Section), Coen
Bussink (GIS & Remote Sensing Expert), Irmgard Zeiler (Statistician).
The implementation of the survey would not have been possible without the dedicated work of the field
surveyors, who often faced difficult security conditions.
The MCN/UNODC Illicit Crop Monitoring activities in Afghanistan were made possible by financial
contributions from the Governments of Germany, the United Kingdom of Great Britain and Northern
Ireland and the United States of America.
Afghanistan Opium Survey 2015
3
Contents
CONTENTS ..................................................................................................................................... 3
LIST OF TABLES .......................................................................................................................... 5
KEY FINDINGS ............................................................................................................................. 6
FACT SHEET AFGHANISTAN OPIUM SURVEY 2015 .......................................................... 8
1 INTRODUCTION .......................................................................................................... 9
2 OPIUM POPPY CULTIVATION .............................................................................. 12
2.1 NATIONAL AND REGIONAL OPIUM POPPY CULTIVATION TRENDS ................... 12
2.2 REGIONAL BREAKDOWN ............................................................................................... 16
3 ERADICATION ........................................................................................................... 25
3.1 POPPY ERADICATION INCREASED BY 40% IN 2015 ................................................. 25
3.2 QUALITY CONTROL OF REPORTED ERADICATION WITH SATELLITE IMAGES 29
4 POTENTIAL OPIUM YIELD AND PRODUCTION .............................................. 30
4.1 POTENTIAL OPIUM YIELD AND PRODUCTION DECREASED IN 2015 ................... 30
4.2 POTENTIAL HEROIN PRODUCTION IN AFGHANISTAN ........................................... 34
5 OPIUM PRICES AND FARM-GATE VALUE OF OPIUM ................................... 36
5.1 OPIUM PRICES ................................................................................................................... 36
5.2 FARM-GATE VALUE OF OPIUM PRODUCTION .......................................................... 40
6 METHODOLOGY....................................................................................................... 41
6.1 ESTIMATION OF AREA UNDER OPIUM POPPY CULTIVATION .............................. 41
6.2 POSSIBLE IMPACT OF THE CHANGE OF STUDY DESIGN ........................................ 46
6.2.1 KANDAHAR PROVINCE .................................................................................................. 47
6.2.1 FARAH AND NIMROZ PROVINCES ............................................................................... 48
6.2.2 BADGHIS, NANGARHAR AND ZABUL ......................................................................... 51
6.3 SATELLITE IMAGE INTERPRETATION ........................................................................ 52
6.4 VERIFICATION OF GOVERNOR-LED ERADICATION (GLE) ..................................... 56
6.5 OPIUM YIELD AND PRODUCTION ................................................................................ 57
6.6 HEROIN PRODUCTION .................................................................................................... 59
6.7 AVERAGE FARM-GATE PRICE AND FARM-GATE VALUE OF OPIUM
PRODUCTION .................................................................................................................... 62
ANNEX I: INDICATIVE DISTRICT LEVEL ESTIMATES OF OPIUM POPPY
CULTIVATION, 2001-2015 (HECTARES) ............................................................................... 63
ANNEX II: ERADICATION FIGURES, BY DISTRICT (2015) ............................................. 69
Afghanistan Opium Survey 2015
4
LIST OF FIGURES
Figure 1: Opium poppy cultivation in Afghanistan, 1994-2015 (Hectares) ..................................... 12
Figure 2: Number of provinces by opium poppy cultivation trends, 2006-2015 ............................. 14
Figure 3: Opium poppy cultivation in Nangarhar province, 1994-2015 (Hectares) ....................... 17
Figure 4: Opium poppy cultivation in Laghman, Kunar, Nuristan and Kapisa provinces, 1994-
2015 (Hectares) ............................................................................................................................. 18
Figure 5: Opium poppy cultivation in Badakhshan province, 1994-2015 (Hectares) ..................... 19
Figure 6: Opium poppy cultivation in the Northern region, 2004-2015 (Hectares) ........................ 20
Figure 7: Opium poppy cultivation in Day Kundi and Zabul provinces, 2002-2015 ...................... 21
Figure 8: Opium poppy cultivation in Hilmand, Kandahar and Uruzgan provinces, 2005-2015
(Hectares)...................................................................................................................................... 22
Figure 9: Opium poppy cultivation in Badghis province, 2004-2015 (Hectares) ............................ 23
Figure 10: Opium poppy cultivation in Farah and Nimroz provinces, 2004-2015 (Hectares) ....... 24
Figure 11: Percentage of total opium poppy eradication, by province, 2014-2015 ......................... 27
Figure 12: Area of opium poppy eradication, by different methods, 2014-2015 (Percentage of
total) .............................................................................................................................................. 28
Figure 13: Area of opium poppy eradication, per month, 2014-2015 (Percentage of total) ........... 28
Figure 14: Potential opium production in Afghanistan, 1997-2015 (Tons) ..................................... 33
Figure 15 Farm-gate prices of dry opium at harvest time weighted by production and annual
opium production, 1999-2015 (tons; US dollars per kilogram) ............................................... 37
Figure 16: Regional average price of dry opium reported by opium traders, January 2005 to
August 2015 (US dollars per kilogram)...................................................................................... 37
Figure 17: Monthly prices of dry opium in Kandahar and Nangarhar province, as collected from
March 1997 to August 2015 (US dollars per kilogram) ............................................................ 39
Figure 18: Farm-gate value of opium production in Afghanistan, 2008-2015 (Million US dollars)
....................................................................................................................................................... 40
Figure 19 Square root of predicted sampling variance for simple random sampling of 27 units of
10x10 km (horizontal line) together with sampling .................................................................. 42
Figure 20 Samples of 2014 (blue) and 2015 (red) together with potential agricultural land in
Kandahar province ...................................................................................................................... 47
Figure 21 Poppy probability (geotools) in Kandahar province, 2015 .............................................. 48
Figure 22 Poppy fields in 2014 (yellow; 1,332 hectares) and 2015 (blue; 755 hectares) of a single
image in Nimroz province ........................................................................................................... 49
Figure 23 Samples of 2014 (blue) and 2015 (red) together with potential agricultural land in
Nimroz province ........................................................................................................................... 50
Figure 24 Samples of 2014 (blue) and 2015 (red) together with potential agricultural land in
Farah province ............................................................................................................................. 51
Figure 25 Area estimates of selected sample provinces with 95% confidence interval, 2014 and
2015 (Hectares) ............................................................................................................................. 52
Figure 26: Spectral reflectance of opium poppy and other crops .................................................... 53
Figure 27: Image classification methodology for estimating opium poppy cultivation area.......... 53
Figure 28: Use of geo-referenced ground photos for image interpretation ..................................... 54
Figure 29: Use of aerial photos for image interpretation .................................................................. 55
Figure 30: Advantage of two-dated images, Kabul and Kandahar, 2009 ........................................ 56
Figure 31: Simplified flow chart of the main stages of processing pure heroin base from opium. 60
Afghanistan Opium Survey 2015
5
List of Tables Table 1: Regional distribution of opium poppy cultivation, 2014-2015 (Hectares) ........................ 13
Table 2: Main opium-poppy-cultivating provinces in Afghanistan, 2009-2015 (Hectares) ............ 14
Table 3: Opium poppy cultivation (2012-2015) and eradication (2014-2015) in Afghanistan
(Hectares)...................................................................................................................................... 14
Table 4: Opium poppy cultivation and eradication in the Central region, 2013-2015 (Hectares) . 16
Table 5: Opium poppy cultivation and eradication in the Eastern region, 2013-2015 (Hectares) 16
Table 6: Opium poppy cultivation and eradication in the North-eastern region, 2013-2015
(Hectares)...................................................................................................................................... 18
Table 7: Opium poppy cultivation and eradication in the Northern region, 2013-2015 (Hectares)
....................................................................................................................................................... 20
Table 8: Opium poppy cultivation and eradication in the Southern region, 2013-2015 (Hectares)
....................................................................................................................................................... 21
Table 9: Poppy cultivation inside and outside the former Hilmand “Food Zone” (after
eradication), 2012-2014 ............................................................................................................... 22
Table 10: Opium poppy cultivation and eradication in the Western region, 2013-2015 (Hectares)
....................................................................................................................................................... 23
Table 11: Governor-led eradication, by province, 2015 .................................................................... 26
Table 12: Governor-led eradication, 2014-2015 (Hectares and percentage change) ...................... 26
Table 13: Opium poppy eradication and cultivation in Afghanistan, 2010-2015 (Hectares) ......... 27
Table 14: Start and end dates of Governor-led eradication (GLE), 2015 ........................................ 28
Table 15: Opium yield, by region, 2014-2015 (Kilograms per hectare) ........................................... 30
Table 16: Opium production in Afghanistan 2009-2015, by province (Tons) ................................. 32
Table 17: Potential opium production, by region, 2014-2015 (Tons) ............................................... 33
Table 18: Potential opium production, by region, with ranges, 2015 (Tons)................................... 34
Table 19: Potential heroin production from Afghan opium, 2015 ................................................... 35
Table 20: Regional farm-gate prices of dry opium at harvest time, reported by farmers through
the price-monitoring system, 2014-2015 (US dollars per kilogram) ........................................ 36
Table 21: Dry opium prices reported by opium traders, by region, August 2014-August 2015 (US
dollars per kilogram) ................................................................................................................... 38
Table 22: Area estimation method, by province, 2015 ...................................................................... 41
Table 23 Sample size and agricultural land and sampling ratio, by province, 2015....................... 43
Table 24 Coefficient of variation, variance, standard deviation and correlation between
agricultural land and poppy in the 2014 samples ..................................................................... 44
Table 25: Area estimates of sample provinces with 95% confidence interval, 2015 (Hectares) .... 45
Table 26: Regional opium yield values with 95% confidence intervals, 2015 (Kilograms per
hectare) ......................................................................................................................................... 58
Table 27: Yield survey villages and fields surveyed (all data), 2009-2015 ....................................... 58
Table 28: Proportions of opiate seizures in Afghanistan and neighbouring countries (Percentage)
....................................................................................................................................................... 59
Afghanistan Opium Survey 2015
6
Key Findings
Area under opium poppy cultivation decreased by 19%
The total area under opium poppy cultivation in Afghanistan was estimated at 183,000
hectares in 2015, a 19% decrease from the previous year. Area under opium poppy cultivation
has decreased for the first time since 2009 but it is at its fourth highest level since the
beginning of estimations in 1994; higher levels have been estimated in 2007, 2013 and 2014.
The vast majority (97%) of opium poppy cultivation took place in the Southern, Eastern and
Western regions of the country. Hilmand remained Afghanistan’s major opium-poppy-
cultivating province, followed by Farah, Kandahar, Badghis, Uruzgan and Nangarhar.
All three main opium-poppy-cultivating regions experienced a decrease in poppy-cultivation
levels in 2015, with the largest relative decrease being in the Eastern region (-40%; mainly
driven by decreases in Nangarhar), followed by the Southern (-20%) and Western (-10%)
regions.
Opium poppy cultivation decreased in most of the main poppy-cultivating provinces,
including Nangarhar (-45%), Nimroz (-40%), Kandahar (-38%), Farah (-23%) and Hilmand (-
16%).
In the Central (+38%) and Northern (+154%) regions a strong increase was observed, albeit
starting from low levels, which coincides with a deterioration of the security situation.
Badghis, at the border to In the Northeastern region (-5%) area under poppy cultivation
remained relatively as stable.
The number of poppy-free provinces decreased in 2015. In the Northern region, Balkh lost its
poppy-free status, which it had regained in 2014.
Improvements of methodology
Caution is needed when interpreting these results: between 2014 and 2015, the availability of
improved technology led to a major improvement in the methodology used to estimate area
under poppy cultivation. The changes affected all 12 provinces in which a sampling approach
to select satellite imagery was employed, including all major opium poppy-growing
provinces.
The change in methodology may have had the effect of making the extent of changes appear
greater than it actually was, but additional research undertaken by MCN/UNODC confirms
the direction of the change (decrease/increase) at provincial, regional and national level. A
detailed description of the changes and their possible impact can be found in the Methodology
section.
Total eradication of opium poppy increased by 40%
Total eradication of opium poppy increased by 40% in 2015, to 3,760 hectares, while less
security incidences occurred than in 2014: in 2015, 5 lives were lost and 18 persons were
injured. In 2014, 13 lives were lost and 26 persons were injured.
Potential opium yield and production decreased in 2015
Potential opium production was estimated at 3,300 tons in 2015, a decrease of 48% from its
2014 level (6,400 tons). The low production is a result of a reduction in area under cultivation,
but more importantly of a reduction in opium yield per hectare.
Average opium yield amounted to 18.3 kilograms per hectare, which was 36% less than in
2014. Yields decreased in all main opium poppy cultivating regions. The strongest decrease
occurred in the Southern region, where the average yield decreased by 45% from 29.5
kilograms per hectare in 2014 to 16.1 kilograms per hectare in 2015, followed by the Western
region (-20%; from 20.4 in 2014 to 16.3 kilograms per hectare in 2015) and Eastern region (-
8%; from 39.6 in 2014 to 36.5 kilograms per hectare 2015).
Afghanistan Opium Survey 2015
7
Reports from the field (Nimroz province) pointed towards a lack of water, which may have
affected field quality and thus yields. Low yields and poor quality of fields (low plant density)
has been confirmed by satellite imagery and field photographs for all of the Western and
Southern regions.
Accounting for 58% of national production, the Southern region continued to produce the vast
majority of opium in Afghanistan. With 22% of national production, the Western region was
the country’s second most important opium-producing region in 2015.
In 2015, possibly caused by the decrease in supply, opium prices increased in all regions of
Afghanistan. However, at US$ 0.57 billion, or the equivalent of roughly 4% of Afghanistan’s
estimated GDP, the farm-gate value of opium production decreased by 33% in 2014 to its
lowest level since 2009 (not adjusted for inflation).
Discussion of possible reasons for the decrease
The reasons why Afghan farmers cultivate opium poppy are multiple. The ‘2014 Afghanistan
opium survey report – Socio-economic Analysis’, discussed these reasons, presenting the views of
the farmers and an in-depth analysis of different data which described the risk factors related to
illicit cultivation of opium.
The lucrative nature of the crop has been the principal reason that the largest share of farmers have
offered as an explanation for their decision to cultivate opium poppy but risk factors behind opium
poppy cultivation vary from region to region, with environmental suitability, socio-economic
vulnerability and security/rule of law issues (as insecurity continues to be highly correlated with
opium poppy cultivation), and opium prices being the principal factors.
Economic reasoning might offer an explanation for the decreases in the Southern and Western
regions. Opium poppy cultivation, as lucrative as it is, is costly. Harvest is labor intensive and
requires paid lancers. In desert areas, poppies have to be irrigated, often by using irrigation pumps
which need costly fuel to function. In times of high prices and good harvests, investments in
making land arable and maintaining fields under unfavorable conditions were profitable. In the
past years, however, yields have decreased in the Southern and Western regions, which, together
with moderate prices, may have led to a situation where making new land arable and keeping
high-maintenance fields have become not highly profitable anymore.
The climatic conditions, such as lack of water or soil degradation, that have affected yields in the
South and West might have directly reduced land available for opium poppy cultivation. In
Nimroz province, for example the land available for agriculture in general reduced by 19%
between 2014 and 2015, which directly affected the area under cultivation of opium poppy, too.
Opium poppy cultivation thus may have reached a ‘natural exploitation’ peak in the main poppy
cultivating provinces in 2014 or may have even exceeded it, providing a possible explanation for
the poppy cultivation decrease in the Southern and Western regions. With this assumption, there is
a risk of an inner Afghan shift of cultivation. If conditions in the main poppy cultivating provinces
continue to deteriorate, cultivation might shift to other provinces, where agriculture conditions are
more favourable. The increases in the Central and Northern regions, which coincided with a
deterioration of the security situation, might foreshadow such a development which needs close
monitoring and appropriate action to avoid cultivation from spreading.
There is also a question on whether the decrease observed in 2015 is a result of a market
adjustment since two strong years of production in 2013 and 2014 may have led to an oversupply
of opium. The 2015 price increase points to an unmet demand caused by the reduction of supply,
but the increase observed is not comparable to the price shocks in years when the reduction on
opium supply clearly triggered a large gap with demand. Weak data on global opiates use do not
allow a holistic interpretation of the Afghan trend in 2015 in the context of global demand and
supply of opium.
With the multitude of possible reasons for changes in area under cultivation and the complexity of
the factors driving opium poppy cultivation, the present reduction of cultivation cannot be related
to a single factor or policy measure. Further analyses of the underlying driving factors will be
provided in the upcoming “Afghanistan opium survey 2015 – Socio-economic analysis”.
Afghanistan Opium Survey 2015
8
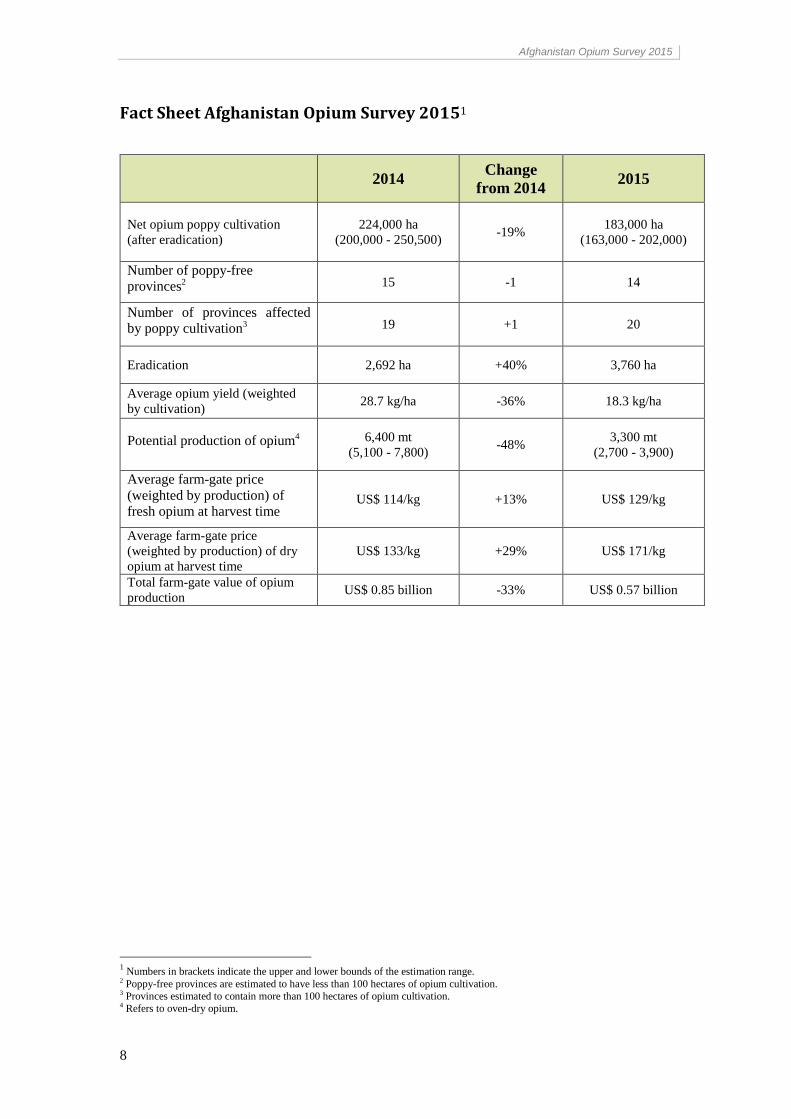
Fact Sheet Afghanistan Opium Survey 20151
2014 Change
from 2014 2015
Net opium poppy cultivation
(after eradication)
224,000 ha
(200,000 - 250,500) -19%
183,000 ha
(163,000 - 202,000)
Number of poppy-free
provinces2 15 -1 14
Number of provinces affected
by poppy cultivation3 19 +1 20
Eradication 2,692 ha +40% 3,760 ha
Average opium yield (weighted
by cultivation) 28.7 kg/ha -36% 18.3 kg/ha
Potential production of opium4 6,400 mt
(5,100 - 7,800) -48%
3,300 mt
(2,700 - 3,900)
Average farm-gate price
(weighted by production) of
fresh opium at harvest time US$ 114/kg +13% US$ 129/kg
Average farm-gate price
(weighted by production) of dry
opium at harvest time
US$ 133/kg +29% US$ 171/kg
Total farm-gate value of opium
production US$ 0.85 billion -33% US$ 0.57 billion
1 Numbers in brackets indicate the upper and lower bounds of the estimation range.
2 Poppy-free provinces are estimated to have less than 100 hectares of opium cultivation. 3 Provinces estimated to contain more than 100 hectares of opium cultivation. 4 Refers to oven-dry opium.
Afghanistan Opium Survey 2015
9
1 Introduction
The Afghanistan Opium Survey is implemented annually by the Ministry of Counter Narcotics
(MCN) of Afghanistan in collaboration with the United Nations Office on Drugs and Crime
(UNODC). The survey team collects and analyses information on the location and extent of opium
poppy cultivation, potential opium production and the socio-economic situation in rural areas.
Since 2005, MCN and UNODC have also been involved in the verification of opium eradication
conducted by provincial governors and poppy-eradication forces. The results provide a detailed
picture of the outcome of the current year’s opium season and, together with data from previous
years, enable the identification of medium- and long-term trends in the evolution of the illicit drug
problem. This information is essential for planning, implementing and monitoring the impact of
measures required for tackling a problem that has serious implications for Afghanistan and the
international community.
The opium survey is implemented within the technical framework of the UNODC Illicit Crop
Monitoring Programme (ICMP). The objective of ICMP is to assist the international community in
monitoring the extent and evolution of illicit crops in the context of the Plan of Action adopted by
the United Nations (the 53rd
session of the Commission on Narcotic Drugs in March 2009). Under
ICMP, monitoring activities currently supported by UNODC also exist in other countries affected
by illicit crop cultivation: in Asia, Myanmar and the Lao People’s Democratic Republic; in Latin
America, the Plurinational State of Bolivia, Colombia, Ecuador, Mexico and Peru; in Africa,
Nigeria.
The Afghanistan Opium Survey 2015 was implemented under project AFG/F98, “Monitoring of
Opium Production in Afghanistan”, with financial contributions from the Governments of
Germany, the United Kingdom of Great Britain and Northern Ireland, and the United States of
America.
Afghanistan Opium Survey 2015
10
Afghanistan Opium Survey 2015
11
Afghanistan Opium Survey 2015
12
2 Opium Poppy Cultivation
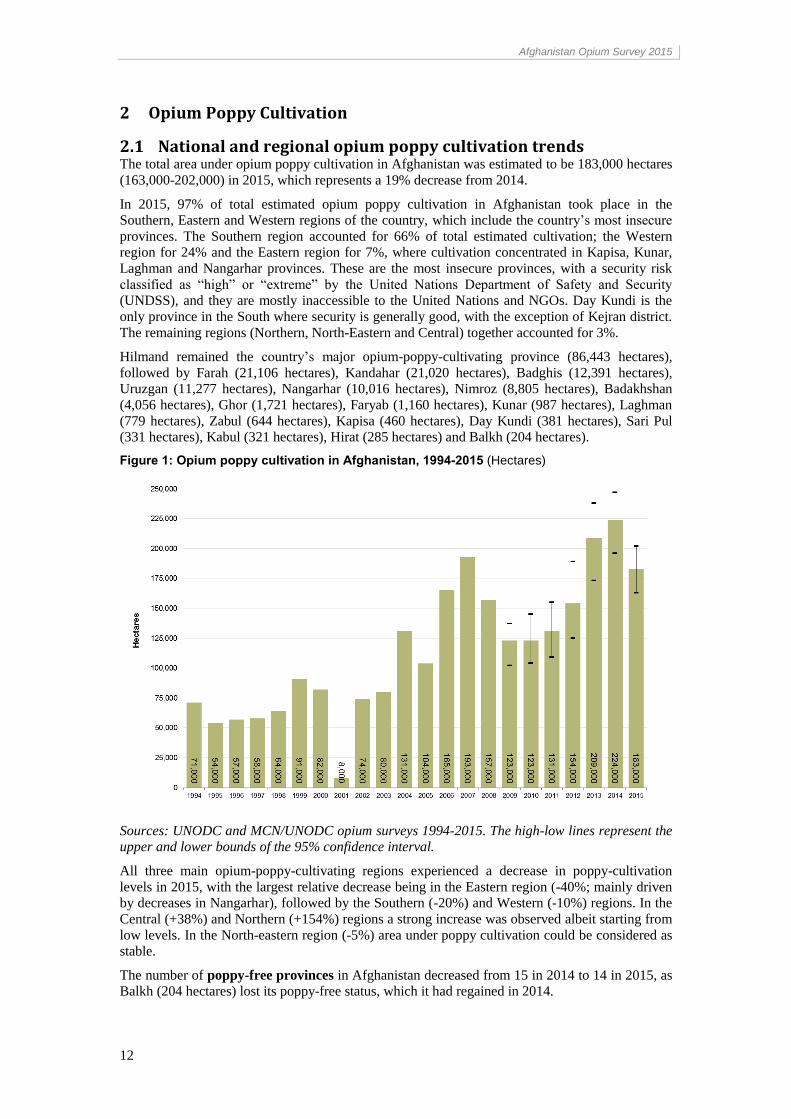
2.1 National and regional opium poppy cultivation trends The total area under opium poppy cultivation in Afghanistan was estimated to be 183,000 hectares
(163,000-202,000) in 2015, which represents a 19% decrease from 2014.
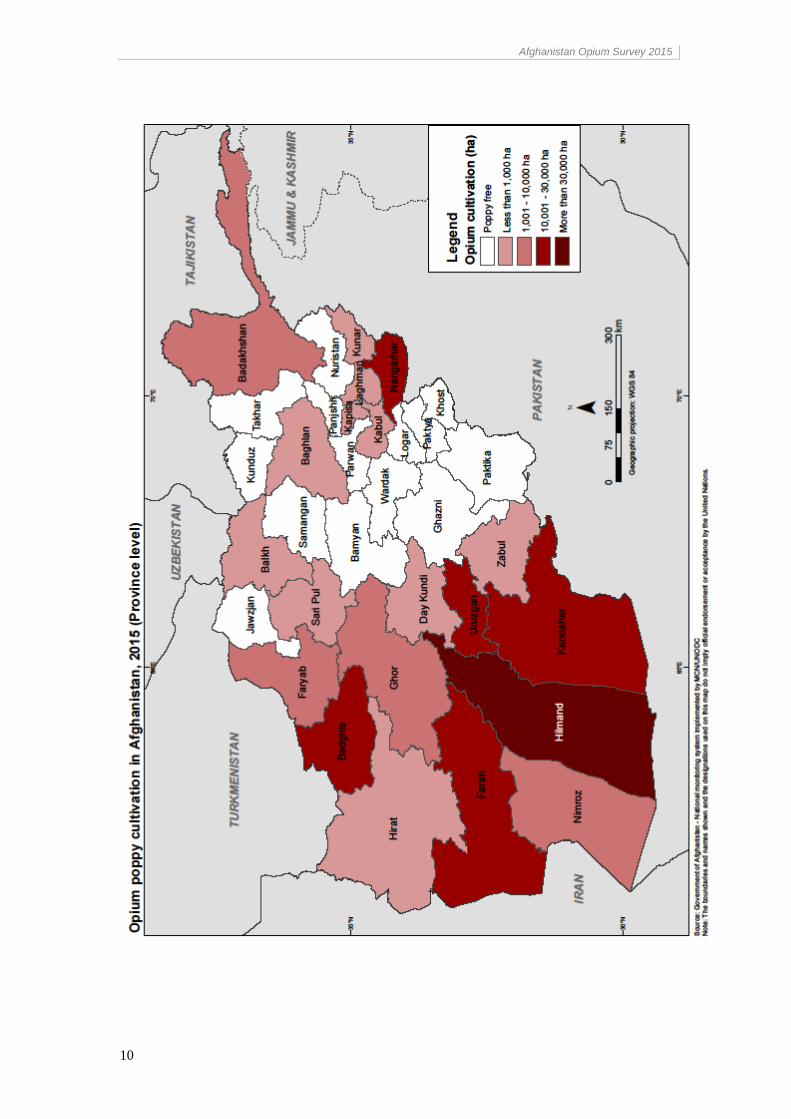
In 2015, 97% of total estimated opium poppy cultivation in Afghanistan took place in the
Southern, Eastern and Western regions of the country, which include the country’s most insecure
provinces. The Southern region accounted for 66% of total estimated cultivation; the Western
region for 24% and the Eastern region for 7%, where cultivation concentrated in Kapisa, Kunar,
Laghman and Nangarhar provinces. These are the most insecure provinces, with a security risk
classified as “high” or “extreme” by the United Nations Department of Safety and Security
(UNDSS), and they are mostly inaccessible to the United Nations and NGOs. Day Kundi is the
only province in the South where security is generally good, with the exception of Kejran district.
The remaining regions (Northern, North-Eastern and Central) together accounted for 3%.
Hilmand remained the country’s major opium-poppy-cultivating province (86,443 hectares),
followed by Farah (21,106 hectares), Kandahar (21,020 hectares), Badghis (12,391 hectares),
Uruzgan (11,277 hectares), Nangarhar (10,016 hectares), Nimroz (8,805 hectares), Badakhshan
(4,056 hectares), Ghor (1,721 hectares), Faryab (1,160 hectares), Kunar (987 hectares), Laghman
(779 hectares), Zabul (644 hectares), Kapisa (460 hectares), Day Kundi (381 hectares), Sari Pul
(331 hectares), Kabul (321 hectares), Hirat (285 hectares) and Balkh (204 hectares).
Figure 1: Opium poppy cultivation in Afghanistan, 1994-2015 (Hectares)
Sources: UNODC and MCN/UNODC opium surveys 1994-2015. The high-low lines represent the upper and lower bounds of the 95% confidence interval.
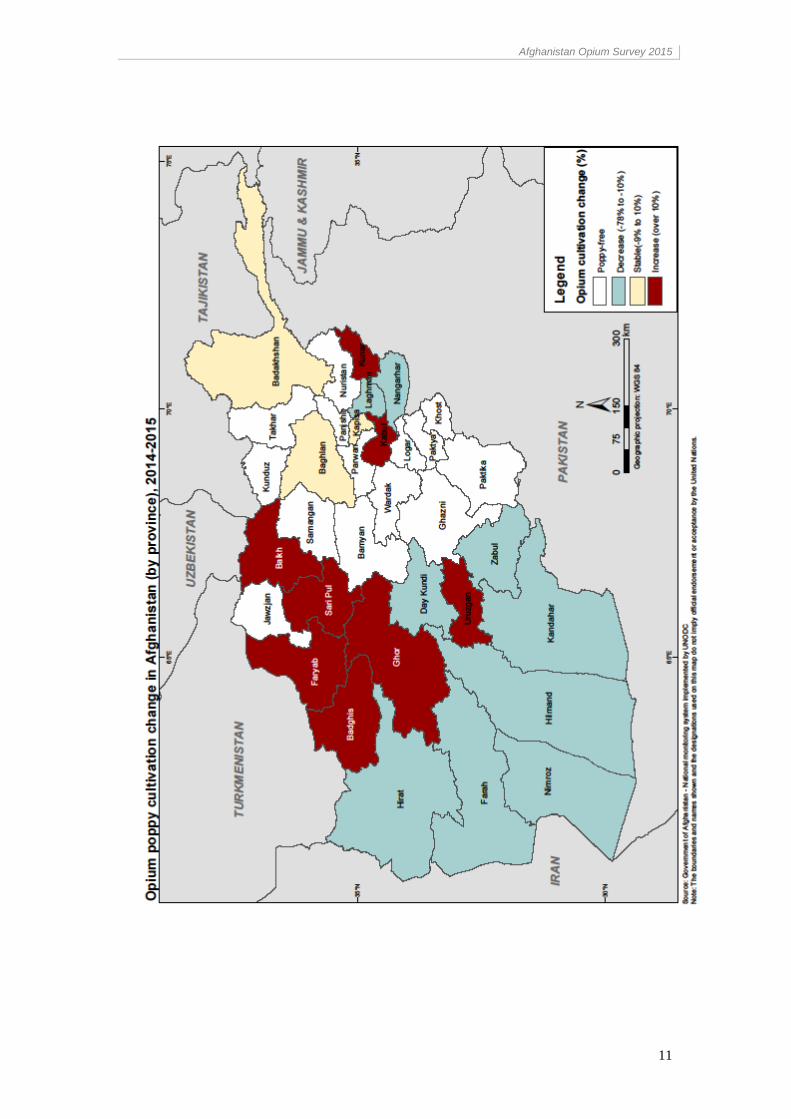
All three main opium-poppy-cultivating regions experienced a decrease in poppy-cultivation
levels in 2015, with the largest relative decrease being in the Eastern region (-40%; mainly driven
by decreases in Nangarhar), followed by the Southern (-20%) and Western (-10%) regions. In the
Central (+38%) and Northern (+154%) regions a strong increase was observed albeit starting from
low levels. In the North-eastern region (-5%) area under poppy cultivation could be considered as
stable.
The number of poppy-free provinces in Afghanistan decreased from 15 in 2014 to 14 in 2015, as Balkh (204 hectares) lost its poppy-free status, which it had regained in 2014.
Afghanistan Opium Survey 2015
13
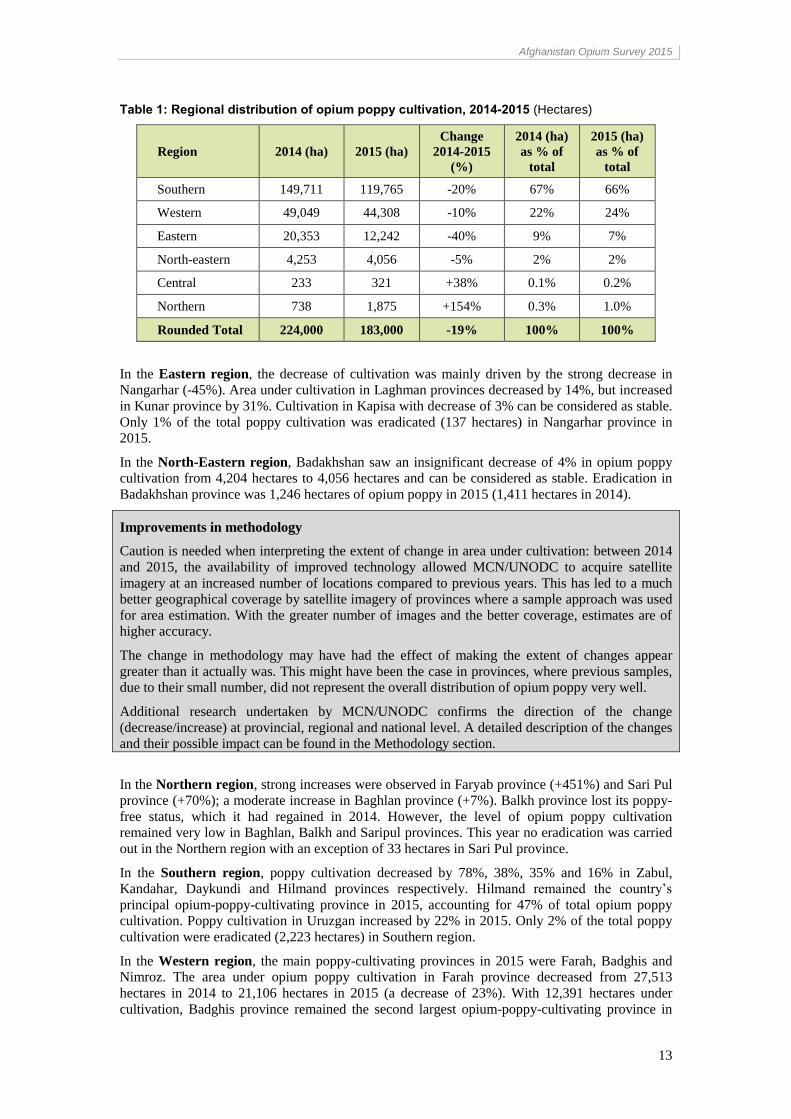
Table 1: Regional distribution of opium poppy cultivation, 2014-2015 (Hectares)
Region 2014 (ha) 2015 (ha)
Change
2014-2015
(%)
2014 (ha)
as % of
total
2015 (ha)
as % of
total
Southern 149,711 119,765 -20% 67% 66%
Western 49,049 44,308 -10% 22% 24%
Eastern 20,353 12,242 -40% 9% 7%
North-eastern 4,253 4,056 -5% 2% 2%
Central 233 321 +38% 0.1% 0.2%
Northern 738 1,875 +154% 0.3% 1.0%
Rounded Total 224,000 183,000 -19% 100% 100%
In the Eastern region, the decrease of cultivation was mainly driven by the strong decrease in
Nangarhar (-45%). Area under cultivation in Laghman provinces decreased by 14%, but increased
in Kunar province by 31%. Cultivation in Kapisa with decrease of 3% can be considered as stable.
Only 1% of the total poppy cultivation was eradicated (137 hectares) in Nangarhar province in
2015.
In the North-Eastern region, Badakhshan saw an insignificant decrease of 4% in opium poppy
cultivation from 4,204 hectares to 4,056 hectares and can be considered as stable. Eradication in
Badakhshan province was 1,246 hectares of opium poppy in 2015 (1,411 hectares in 2014).
Improvements in methodology
Caution is needed when interpreting the extent of change in area under cultivation: between 2014
and 2015, the availability of improved technology allowed MCN/UNODC to acquire satellite
imagery at an increased number of locations compared to previous years. This has led to a much
better geographical coverage by satellite imagery of provinces where a sample approach was used
for area estimation. With the greater number of images and the better coverage, estimates are of
higher accuracy.
The change in methodology may have had the effect of making the extent of changes appear
greater than it actually was. This might have been the case in provinces, where previous samples,
due to their small number, did not represent the overall distribution of opium poppy very well.
Additional research undertaken by MCN/UNODC confirms the direction of the change
(decrease/increase) at provincial, regional and national level. A detailed description of the changes
and their possible impact can be found in the Methodology section.
In the Northern region, strong increases were observed in Faryab province (+451%) and Sari Pul
province (+70%); a moderate increase in Baghlan province (+7%). Balkh province lost its poppy-
free status, which it had regained in 2014. However, the level of opium poppy cultivation
remained very low in Baghlan, Balkh and Saripul provinces. This year no eradication was carried
out in the Northern region with an exception of 33 hectares in Sari Pul province.
In the Southern region, poppy cultivation decreased by 78%, 38%, 35% and 16% in Zabul,
Kandahar, Daykundi and Hilmand provinces respectively. Hilmand remained the country’s
principal opium-poppy-cultivating province in 2015, accounting for 47% of total opium poppy
cultivation. Poppy cultivation in Uruzgan increased by 22% in 2015. Only 2% of the total poppy
cultivation were eradicated (2,223 hectares) in Southern region.
In the Western region, the main poppy-cultivating provinces in 2015 were Farah, Badghis and
Nimroz. The area under opium poppy cultivation in Farah province decreased from 27,513
hectares in 2014 to 21,106 hectares in 2015 (a decrease of 23%). With 12,391 hectares under
cultivation, Badghis province remained the second largest opium-poppy-cultivating province in
Afghanistan Opium Survey 2015
14
the Western region in 2015 (an increase of 117%). Opium poppy cultivation in Nimroz province
decreased by 40% from 14,584 hectares in 2014 to 8,805 hectares in 2015. This year a total of 92
hectares were eradicated in Western region.
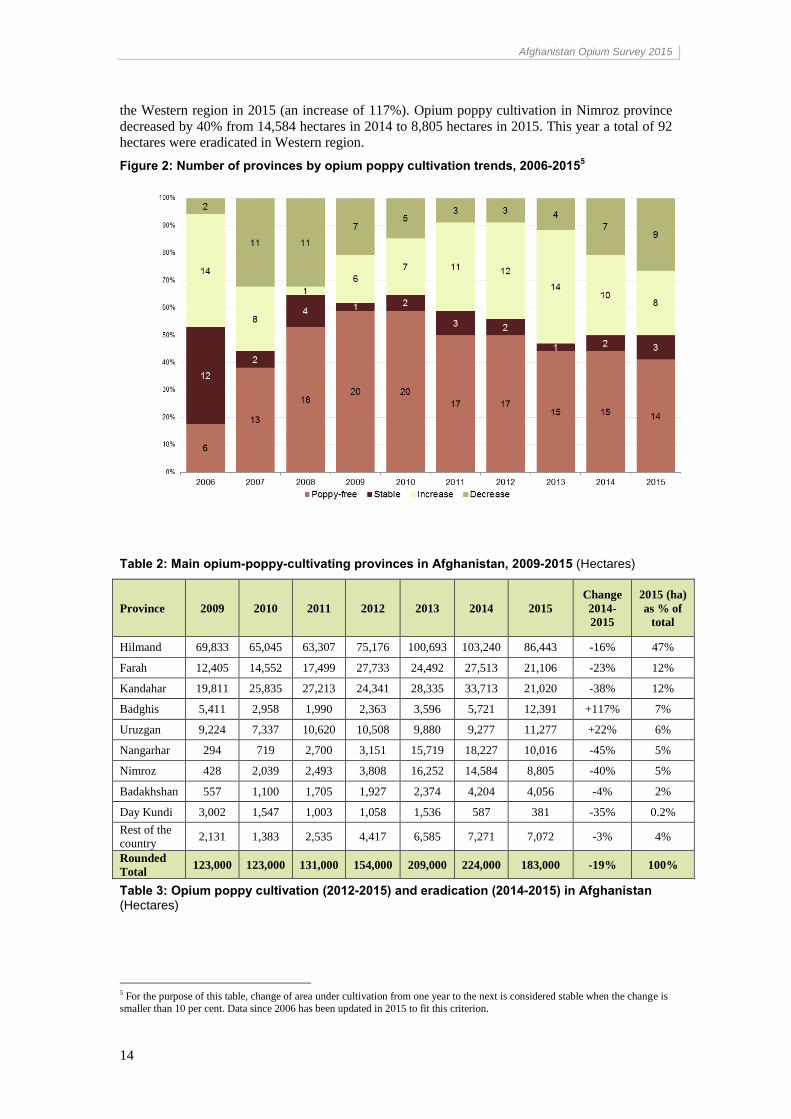
Figure 2: Number of provinces by opium poppy cultivation trends, 2006-20155
Table 2: Main opium-poppy-cultivating provinces in Afghanistan, 2009-2015 (Hectares)
Province 2009 2010 2011 2012 2013 2014 2015
Change
2014-
2015
2015 (ha)
as % of
total
Hilmand 69,833 65,045 63,307 75,176 100,693 103,240 86,443 -16% 47%
Farah 12,405 14,552 17,499 27,733 24,492 27,513 21,106 -23% 12%
Kandahar 19,811 25,835 27,213 24,341 28,335 33,713 21,020 -38% 12%
Badghis 5,411 2,958 1,990 2,363 3,596 5,721 12,391 +117% 7%
Uruzgan 9,224 7,337 10,620 10,508 9,880 9,277 11,277 +22% 6%
Nangarhar 294 719 2,700 3,151 15,719 18,227 10,016 -45% 5%
Nimroz 428 2,039 2,493 3,808 16,252 14,584 8,805 -40% 5%
Badakhshan 557 1,100 1,705 1,927 2,374 4,204 4,056 -4% 2%
Day Kundi 3,002 1,547 1,003 1,058 1,536 587 381 -35% 0.2%
Rest of the
country 2,131 1,383 2,535 4,417 6,585 7,271 7,072 -3% 4%
Rounded
Total 123,000 123,000 131,000 154,000 209,000 224,000 183,000 -19% 100%
Table 3: Opium poppy cultivation (2012-2015) and eradication (2014-2015) in Afghanistan (Hectares)
5 For the purpose of this table, change of area under cultivation from one year to the next is considered stable when the change is
smaller than 10 per cent. Data since 2006 has been updated in 2015 to fit this criterion.
Afghanistan Opium Survey 2015
15
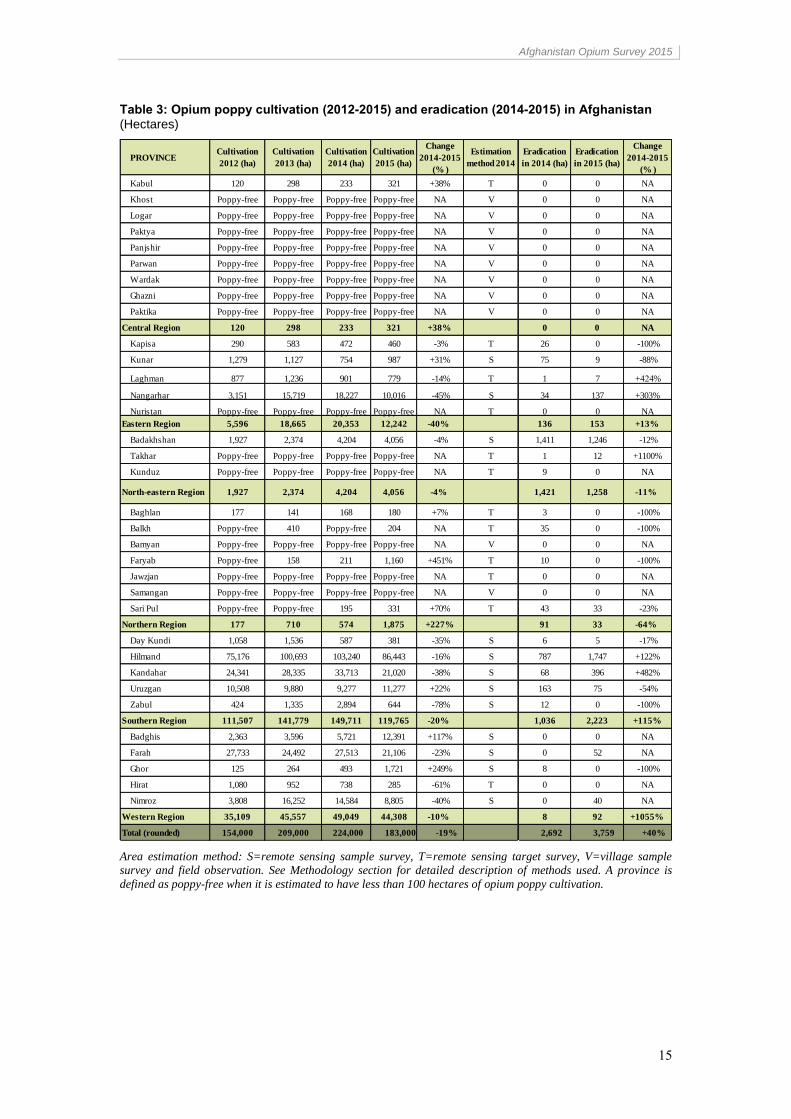
Table 3: Opium poppy cultivation (2012-2015) and eradication (2014-2015) in Afghanistan (Hectares)
Area estimation method: S=remote sensing sample survey, T=remote sensing target survey, V=village sample
survey and field observation. See Methodology section for detailed description of methods used. A province is
defined as poppy-free when it is estimated to have less than 100 hectares of opium poppy cultivation.
PROVINCECultivation
2012 (ha)
Cultivation
2013 (ha)
Cultivation
2014 (ha)
Cultivation
2015 (ha)
Change
2014-2015
(% )
Estimation
method 2014
Eradication
in 2014 (ha)
Eradication
in 2015 (ha)
Change
2014-2015
(% )
Kabul 120 298 233 321 +38% T 0 0 NA
Khost Poppy-free Poppy-free Poppy-free Poppy-free NA V 0 0 NA
Logar Poppy-free Poppy-free Poppy-free Poppy-free NA V 0 0 NA
Paktya Poppy-free Poppy-free Poppy-free Poppy-free NA V 0 0 NA
Panjshir Poppy-free Poppy-free Poppy-free Poppy-free NA V 0 0 NA
Parwan Poppy-free Poppy-free Poppy-free Poppy-free NA V 0 0 NA
Wardak Poppy-free Poppy-free Poppy-free Poppy-free NA V 0 0 NA
Ghazni Poppy-free Poppy-free Poppy-free Poppy-free NA V 0 0 NA
Paktika Poppy-free Poppy-free Poppy-free Poppy-free NA V 0 0 NA
Central Region 120 298 233 321 +38% 0 0 NA
Kapisa 290 583 472 460 -3% T 26 0 -100%
Kunar 1,279 1,127 754 987 +31% S 75 9 -88%
Laghman 877 1,236 901 779 -14% T 1 7 +424%
Nangarhar 3,151 15,719 18,227 10,016 -45% S 34 137 +303%
Nuristan Poppy-free Poppy-free Poppy-free Poppy-free NA T 0 0 NA
Eastern Region 5,596 18,665 20,353 12,242 -40% 136 153 +13%
Badakhshan 1,927 2,374 4,204 4,056 -4% S 1,411 1,246 -12%
Takhar Poppy-free Poppy-free Poppy-free Poppy-free NA T 1 12 +1100%
Kunduz Poppy-free Poppy-free Poppy-free Poppy-free NA T 9 0 NA
North-eastern Region 1,927 2,374 4,204 4,056 -4% 1,421 1,258 -11%
Baghlan 177 141 168 180 +7% T 3 0 -100%
Balkh Poppy-free 410 Poppy-free 204 NA T 35 0 -100%
Bamyan Poppy-free Poppy-free Poppy-free Poppy-free NA V 0 0 NA
Faryab Poppy-free 158 211 1,160 +451% T 10 0 -100%
Jawzjan Poppy-free Poppy-free Poppy-free Poppy-free NA T 0 0 NA
Samangan Poppy-free Poppy-free Poppy-free Poppy-free NA V 0 0 NA
Sari Pul Poppy-free Poppy-free 195 331 +70% T 43 33 -23%
Northern Region 177 710 574 1,875 +227% 91 33 -64%
Day Kundi 1,058 1,536 587 381 -35% S 6 5 -17%
Hilmand 75,176 100,693 103,240 86,443 -16% S 787 1,747 +122%
Kandahar 24,341 28,335 33,713 21,020 -38% S 68 396 +482%
Uruzgan 10,508 9,880 9,277 11,277 +22% S 163 75 -54%
Zabul 424 1,335 2,894 644 -78% S 12 0 -100%
Southern Region 111,507 141,779 149,711 119,765 -20% 1,036 2,223 +115%
Badghis 2,363 3,596 5,721 12,391 +117% S 0 0 NA
Farah 27,733 24,492 27,513 21,106 -23% S 0 52 NA
Ghor 125 264 493 1,721 +249% S 8 0 -100%
Hirat 1,080 952 738 285 -61% T 0 0 NA
Nimroz 3,808 16,252 14,584 8,805 -40% S 0 40 NA
Western Region 35,109 45,557 49,049 44,308 -10% 8 92 +1055%
Total (rounded) 154,000 209,000 224,000 183,000 -19% 2,692 3,759 +40%
Afghanistan Opium Survey 2015
16
2.2 Regional Breakdown
2.2.1 Central region
(Ghazni, Kabul, Khost, Logar, Paktika, Paktya, Panjshir, Parwan, Wardak)
Opium poppy cultivation in the Central region increased by 38% in 2015, with the total area
cultivated increasing to 321 hectares in 2015 from 233 hectares in 2014. Opium poppy cultivation
was limited to the Uzbeen valley of Surobi district in Kabul province, where security is extremely
poor. There was no eradication in Kabul province since 2013. With the exception of Kabul, all
provinces in the Central region have been poppy-free since 2008 and remained so in 2015.
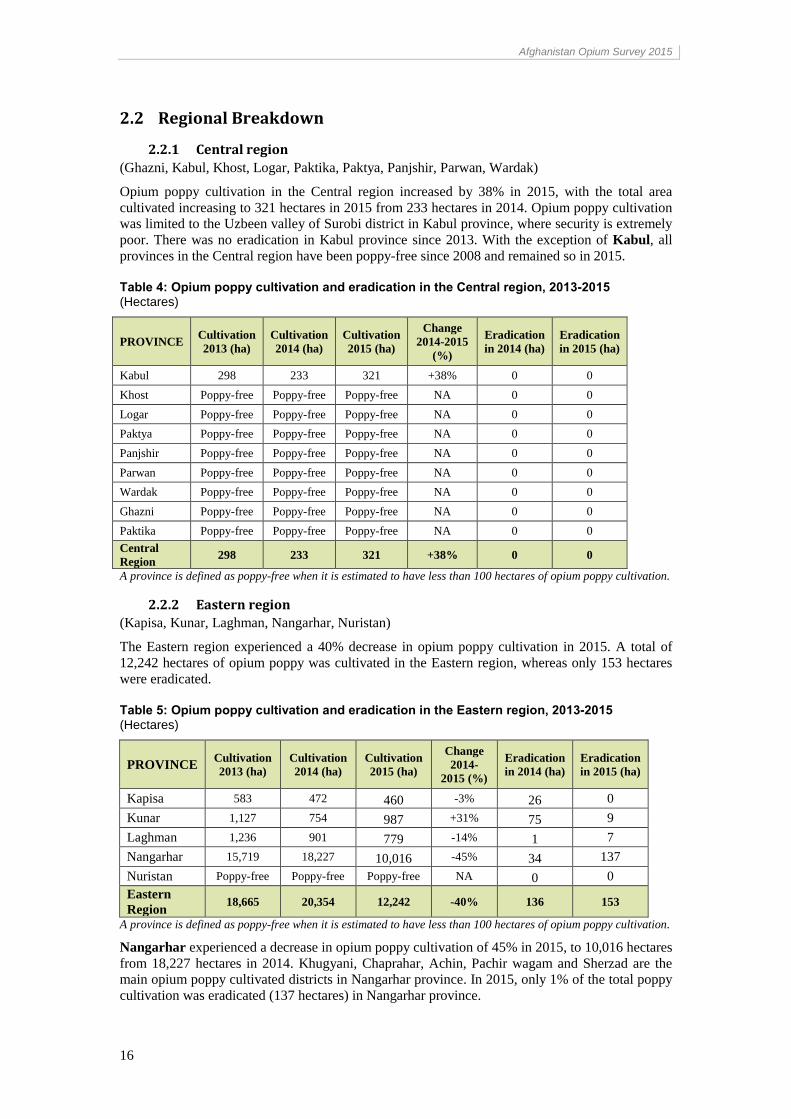
Table 4: Opium poppy cultivation and eradication in the Central region, 2013-2015 (Hectares)
PROVINCE Cultivation
2013 (ha)
Cultivation
2014 (ha)
Cultivation
2015 (ha)
Change
2014-2015
(%)
Eradication
in 2014 (ha)
Eradication
in 2015 (ha)
Kabul 298 233 321 +38% 0 0
Khost Poppy-free Poppy-free Poppy-free NA 0 0
Logar Poppy-free Poppy-free Poppy-free NA 0 0
Paktya Poppy-free Poppy-free Poppy-free NA 0 0
Panjshir Poppy-free Poppy-free Poppy-free NA 0 0
Parwan Poppy-free Poppy-free Poppy-free NA 0 0
Wardak Poppy-free Poppy-free Poppy-free NA 0 0
Ghazni Poppy-free Poppy-free Poppy-free NA 0 0
Paktika Poppy-free Poppy-free Poppy-free NA 0 0
Central
Region 298 233 321 +38% 0 0
A province is defined as poppy-free when it is estimated to have less than 100 hectares of opium poppy cultivation.
2.2.2 Eastern region
(Kapisa, Kunar, Laghman, Nangarhar, Nuristan)
The Eastern region experienced a 40% decrease in opium poppy cultivation in 2015. A total of
12,242 hectares of opium poppy was cultivated in the Eastern region, whereas only 153 hectares
were eradicated.
Table 5: Opium poppy cultivation and eradication in the Eastern region, 2013-2015 (Hectares)
PROVINCE Cultivation
2013 (ha)
Cultivation
2014 (ha)
Cultivation
2015 (ha)
Change
2014-
2015 (%)
Eradication
in 2014 (ha)
Eradication
in 2015 (ha)
Kapisa 583 472 460 -3% 26 0
Kunar 1,127 754 987 +31% 75 9
Laghman 1,236 901 779 -14% 1 7
Nangarhar 15,719 18,227 10,016 -45% 34 137
Nuristan Poppy-free Poppy-free Poppy-free NA 0 0
Eastern
Region 18,665 20,354 12,242 -40% 136 153
A province is defined as poppy-free when it is estimated to have less than 100 hectares of opium poppy cultivation.
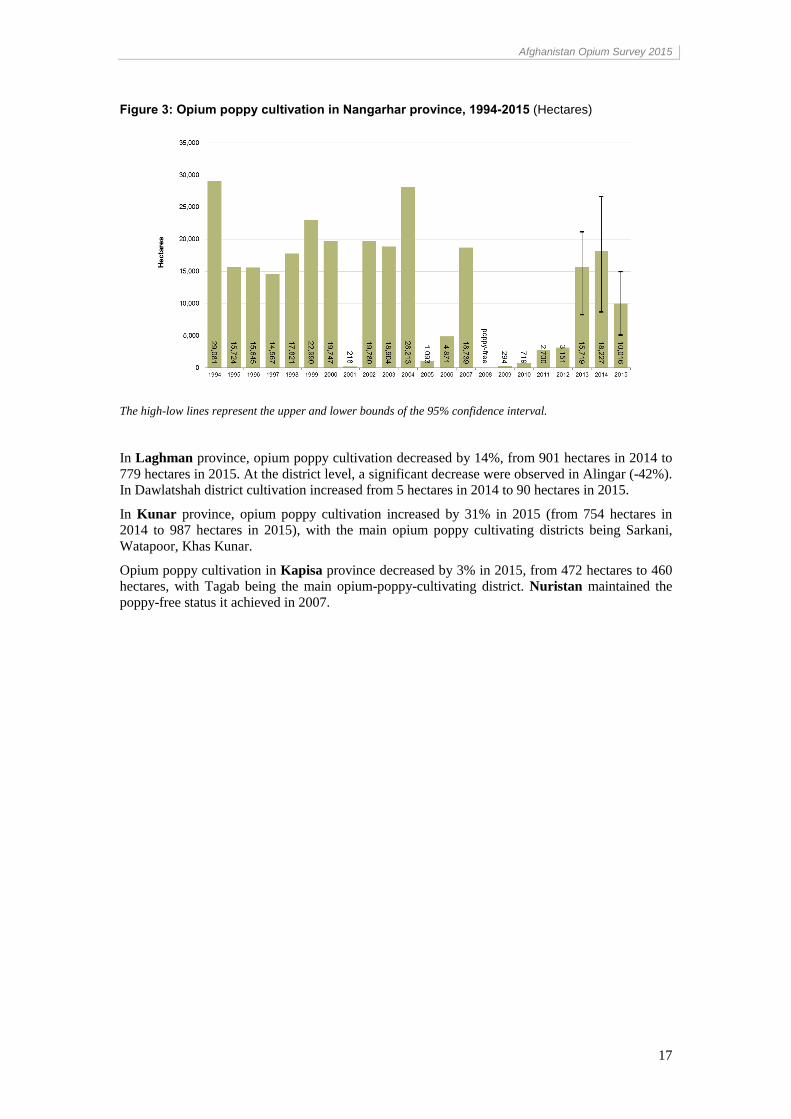
Nangarhar experienced a decrease in opium poppy cultivation of 45% in 2015, to 10,016 hectares
from 18,227 hectares in 2014. Khugyani, Chaprahar, Achin, Pachir wagam and Sherzad are the
main opium poppy cultivated districts in Nangarhar province. In 2015, only 1% of the total poppy
cultivation was eradicated (137 hectares) in Nangarhar province.
Afghanistan Opium Survey 2015
17
Figure 3: Opium poppy cultivation in Nangarhar province, 1994-2015 (Hectares)
The high-low lines represent the upper and lower bounds of the 95% confidence interval.
In Laghman province, opium poppy cultivation decreased by 14%, from 901 hectares in 2014 to
779 hectares in 2015. At the district level, a significant decrease were observed in Alingar (-42%).
In Dawlatshah district cultivation increased from 5 hectares in 2014 to 90 hectares in 2015.
In Kunar province, opium poppy cultivation increased by 31% in 2015 (from 754 hectares in
2014 to 987 hectares in 2015), with the main opium poppy cultivating districts being Sarkani,
Watapoor, Khas Kunar.
Opium poppy cultivation in Kapisa province decreased by 3% in 2015, from 472 hectares to 460
hectares, with Tagab being the main opium-poppy-cultivating district. Nuristan maintained the
poppy-free status it achieved in 2007.
Afghanistan Opium Survey 2015
18
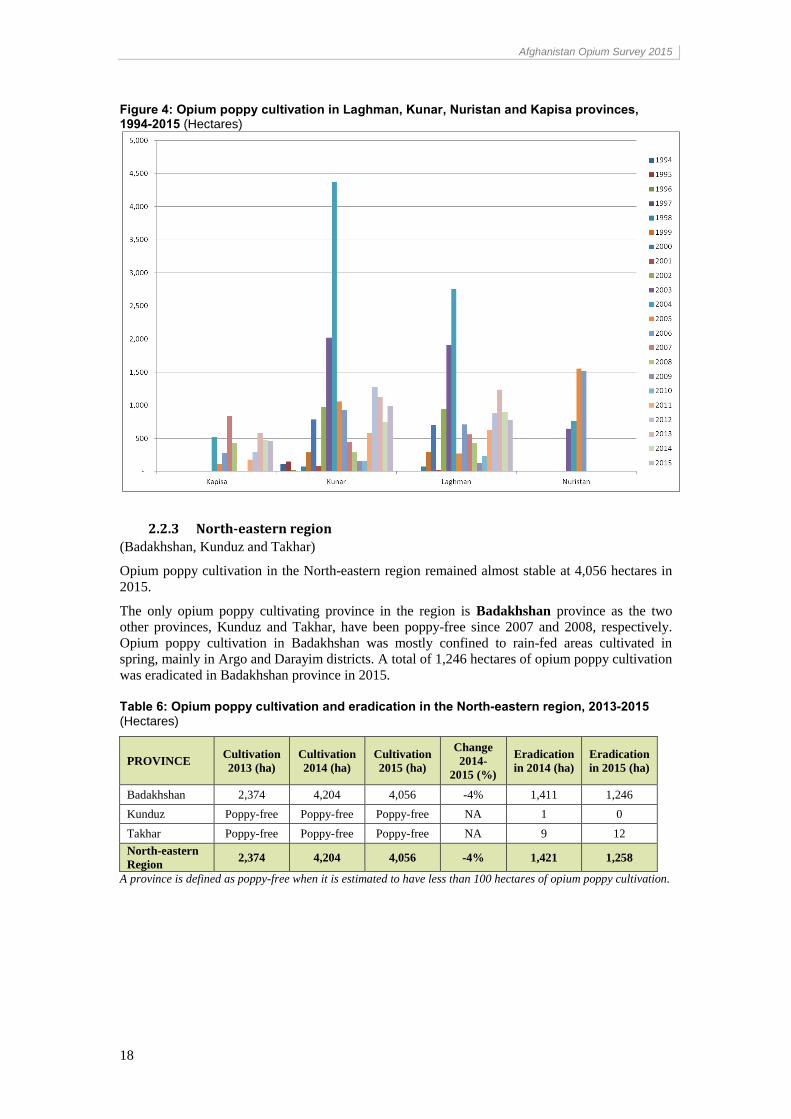
Figure 4: Opium poppy cultivation in Laghman, Kunar, Nuristan and Kapisa provinces, 1994-2015 (Hectares)
2.2.3 North-eastern region
(Badakhshan, Kunduz and Takhar)
Opium poppy cultivation in the North-eastern region remained almost stable at 4,056 hectares in
2015.
The only opium poppy cultivating province in the region is Badakhshan province as the two
other provinces, Kunduz and Takhar, have been poppy-free since 2007 and 2008, respectively.
Opium poppy cultivation in Badakhshan was mostly confined to rain-fed areas cultivated in
spring, mainly in Argo and Darayim districts. A total of 1,246 hectares of opium poppy cultivation
was eradicated in Badakhshan province in 2015.
Table 6: Opium poppy cultivation and eradication in the North-eastern region, 2013-2015 (Hectares)
PROVINCE Cultivation
2013 (ha)
Cultivation
2014 (ha)
Cultivation
2015 (ha)
Change
2014-
2015 (%)
Eradication
in 2014 (ha)
Eradication
in 2015 (ha)
Badakhshan 2,374 4,204 4,056 -4% 1,411 1,246
Kunduz Poppy-free Poppy-free Poppy-free NA 1 0
Takhar Poppy-free Poppy-free Poppy-free NA 9 12
North-eastern
Region 2,374 4,204 4,056 -4% 1,421 1,258
A province is defined as poppy-free when it is estimated to have less than 100 hectares of opium poppy cultivation.
Afghanistan Opium Survey 2015
19
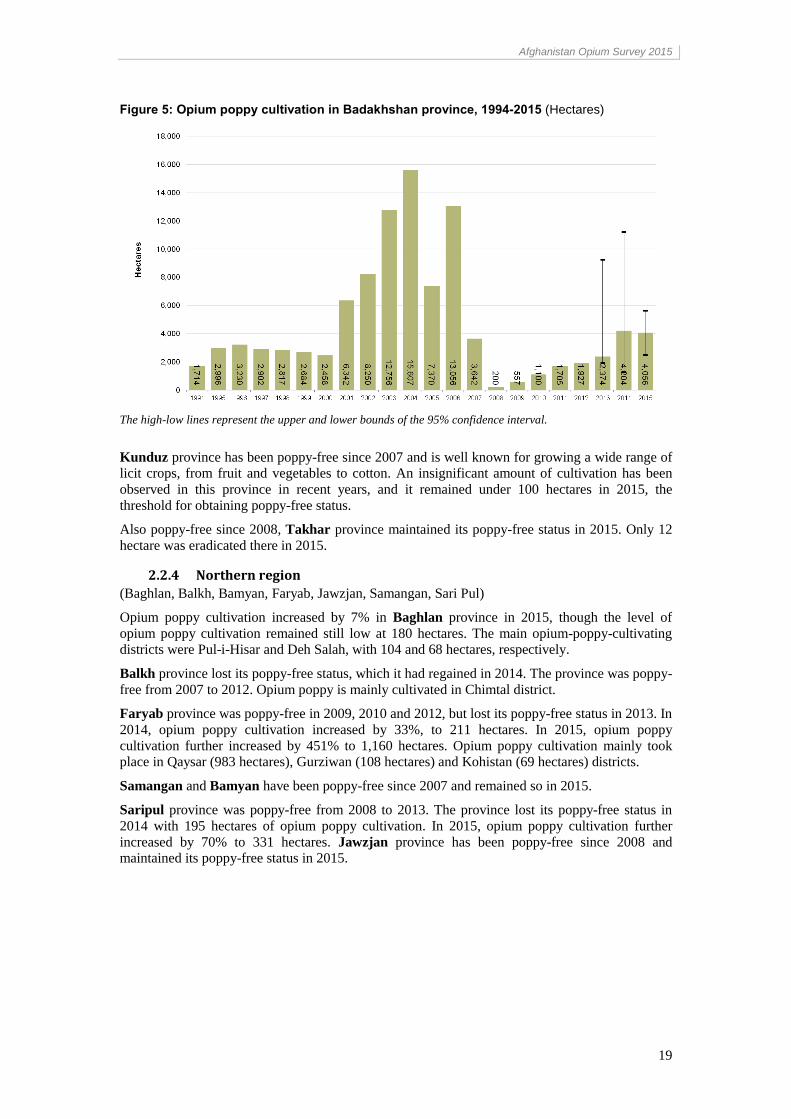
Figure 5: Opium poppy cultivation in Badakhshan province, 1994-2015 (Hectares)
The high-low lines represent the upper and lower bounds of the 95% confidence interval.
Kunduz province has been poppy-free since 2007 and is well known for growing a wide range of
licit crops, from fruit and vegetables to cotton. An insignificant amount of cultivation has been
observed in this province in recent years, and it remained under 100 hectares in 2015, the
threshold for obtaining poppy-free status.
Also poppy-free since 2008, Takhar province maintained its poppy-free status in 2015. Only 12
hectare was eradicated there in 2015.
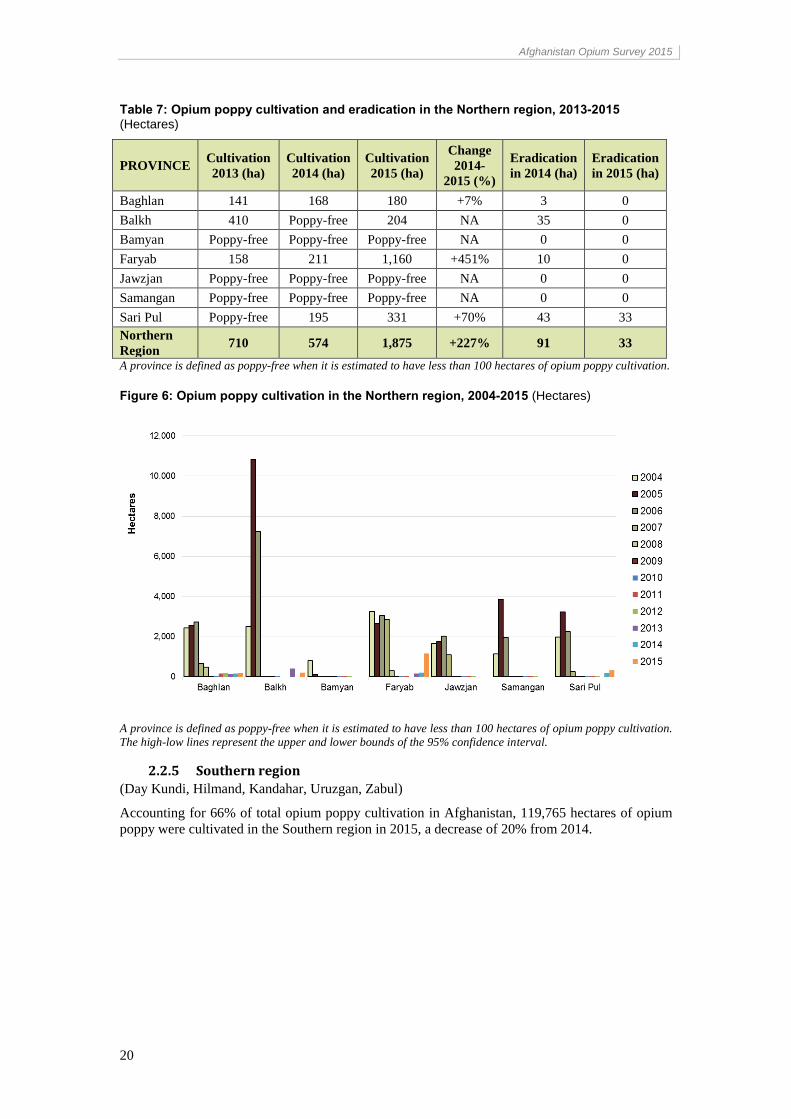
2.2.4 Northern region
(Baghlan, Balkh, Bamyan, Faryab, Jawzjan, Samangan, Sari Pul)
Opium poppy cultivation increased by 7% in Baghlan province in 2015, though the level of
opium poppy cultivation remained still low at 180 hectares. The main opium-poppy-cultivating
districts were Pul-i-Hisar and Deh Salah, with 104 and 68 hectares, respectively.
Balkh province lost its poppy-free status, which it had regained in 2014. The province was poppy-
free from 2007 to 2012. Opium poppy is mainly cultivated in Chimtal district.
Faryab province was poppy-free in 2009, 2010 and 2012, but lost its poppy-free status in 2013. In
2014, opium poppy cultivation increased by 33%, to 211 hectares. In 2015, opium poppy
cultivation further increased by 451% to 1,160 hectares. Opium poppy cultivation mainly took
place in Qaysar (983 hectares), Gurziwan (108 hectares) and Kohistan (69 hectares) districts.
Samangan and Bamyan have been poppy-free since 2007 and remained so in 2015.
Saripul province was poppy-free from 2008 to 2013. The province lost its poppy-free status in
2014 with 195 hectares of opium poppy cultivation. In 2015, opium poppy cultivation further
increased by 70% to 331 hectares. Jawzjan province has been poppy-free since 2008 and
maintained its poppy-free status in 2015.
Afghanistan Opium Survey 2015
20
Table 7: Opium poppy cultivation and eradication in the Northern region, 2013-2015 (Hectares)
PROVINCE Cultivation
2013 (ha)
Cultivation
2014 (ha)
Cultivation
2015 (ha)
Change
2014-
2015 (%)
Eradication
in 2014 (ha)
Eradication
in 2015 (ha)
Baghlan 141 168 180 +7% 3 0
Balkh 410 Poppy-free 204 NA 35 0
Bamyan Poppy-free Poppy-free Poppy-free NA 0 0
Faryab 158 211 1,160 +451% 10 0
Jawzjan Poppy-free Poppy-free Poppy-free NA 0 0
Samangan Poppy-free Poppy-free Poppy-free NA 0 0
Sari Pul Poppy-free 195 331 +70% 43 33
Northern
Region 710 574 1,875 +227% 91 33
A province is defined as poppy-free when it is estimated to have less than 100 hectares of opium poppy cultivation.
Figure 6: Opium poppy cultivation in the Northern region, 2004-2015 (Hectares)
A province is defined as poppy-free when it is estimated to have less than 100 hectares of opium poppy cultivation.
The high-low lines represent the upper and lower bounds of the 95% confidence interval.
2.2.5 Southern region
(Day Kundi, Hilmand, Kandahar, Uruzgan, Zabul)
Accounting for 66% of total opium poppy cultivation in Afghanistan, 119,765 hectares of opium
poppy were cultivated in the Southern region in 2015, a decrease of 20% from 2014.
Afghanistan Opium Survey 2015
21
Table 8: Opium poppy cultivation and eradication in the Southern region, 2013-2015 (Hectares)
PROVINCE Cultivation
2013 (ha)
Cultivation
2014 (ha)
Cultivation
2015 (ha)
Change
2014-2015
(%)
Eradication
in 2014 (ha)
Eradication
in 2015 (ha)
Day Kundi 809 587 381 -35% 6 5
Hilmand 100,693 103,240 86,443 -16% 787 1,747
Kandahar 28,335 33,713 21,020 -38% 68 396
Uruzgan 10,607 9,277 11,277 +22% 163 75
Zabul 1,335 2,894 644 -78% 12 0
Southern
Region 141,779 149,711 119,765 -20% 1,036 2,223
A province is defined as poppy-free when it is estimated to have less than 100 hectares of opium poppy cultivation.
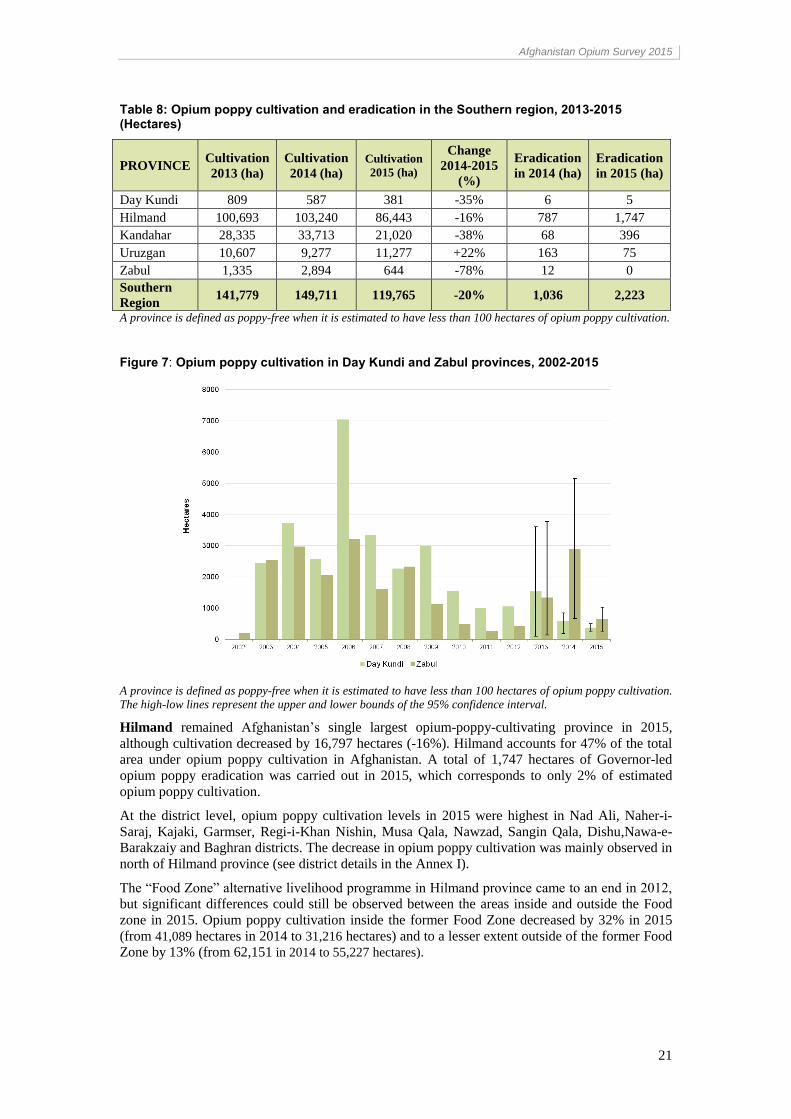
Figure 7: Opium poppy cultivation in Day Kundi and Zabul provinces, 2002-2015
A province is defined as poppy-free when it is estimated to have less than 100 hectares of opium poppy cultivation.
The high-low lines represent the upper and lower bounds of the 95% confidence interval.
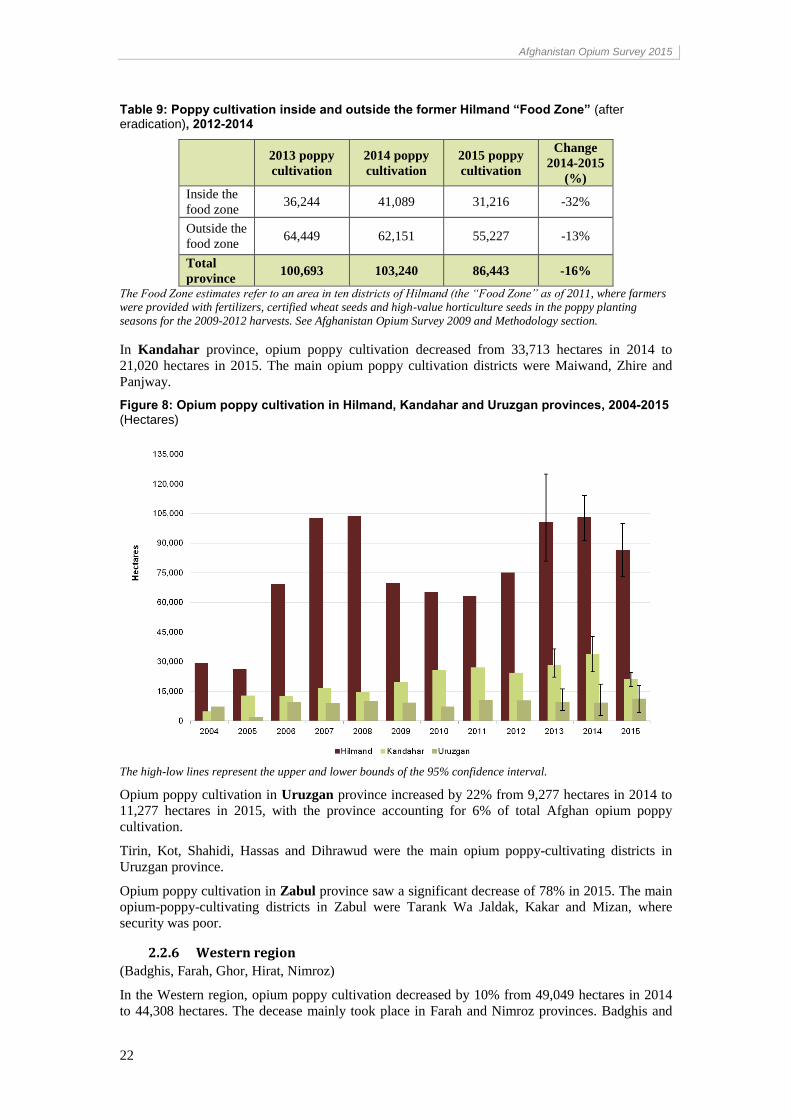
Hilmand remained Afghanistan’s single largest opium-poppy-cultivating province in 2015,
although cultivation decreased by 16,797 hectares (-16%). Hilmand accounts for 47% of the total
area under opium poppy cultivation in Afghanistan. A total of 1,747 hectares of Governor-led
opium poppy eradication was carried out in 2015, which corresponds to only 2% of estimated
opium poppy cultivation.
At the district level, opium poppy cultivation levels in 2015 were highest in Nad Ali, Naher-i-
Saraj, Kajaki, Garmser, Regi-i-Khan Nishin, Musa Qala, Nawzad, Sangin Qala, Dishu,Nawa-e-
Barakzaiy and Baghran districts. The decrease in opium poppy cultivation was mainly observed in
north of Hilmand province (see district details in the Annex I).
The “Food Zone” alternative livelihood programme in Hilmand province came to an end in 2012,
but significant differences could still be observed between the areas inside and outside the Food
zone in 2015. Opium poppy cultivation inside the former Food Zone decreased by 32% in 2015
(from 41,089 hectares in 2014 to 31,216 hectares) and to a lesser extent outside of the former Food
Zone by 13% (from 62,151 in 2014 to 55,227 hectares).
Afghanistan Opium Survey 2015
22
Table 9: Poppy cultivation inside and outside the former Hilmand “Food Zone” (after eradication), 2012-2014
2013 poppy
cultivation
2014 poppy
cultivation
2015 poppy
cultivation
Change
2014-2015
(%)
Inside the
food zone 36,244 41,089 31,216 -32%
Outside the
food zone 64,449 62,151 55,227 -13%
Total
province 100,693 103,240 86,443 -16%
The Food Zone estimates refer to an area in ten districts of Hilmand (the “Food Zone” as of 2011, where farmers
were provided with fertilizers, certified wheat seeds and high-value horticulture seeds in the poppy planting
seasons for the 2009-2012 harvests. See Afghanistan Opium Survey 2009 and Methodology section.
In Kandahar province, opium poppy cultivation decreased from 33,713 hectares in 2014 to
21,020 hectares in 2015. The main opium poppy cultivation districts were Maiwand, Zhire and
Panjway.
Figure 8: Opium poppy cultivation in Hilmand, Kandahar and Uruzgan provinces, 2004-2015 (Hectares)
The high-low lines represent the upper and lower bounds of the 95% confidence interval.
Opium poppy cultivation in Uruzgan province increased by 22% from 9,277 hectares in 2014 to
11,277 hectares in 2015, with the province accounting for 6% of total Afghan opium poppy
cultivation.
Tirin, Kot, Shahidi, Hassas and Dihrawud were the main opium poppy-cultivating districts in
Uruzgan province.
Opium poppy cultivation in Zabul province saw a significant decrease of 78% in 2015. The main
opium-poppy-cultivating districts in Zabul were Tarank Wa Jaldak, Kakar and Mizan, where
security was poor.
2.2.6 Western region
(Badghis, Farah, Ghor, Hirat, Nimroz)
In the Western region, opium poppy cultivation decreased by 10% from 49,049 hectares in 2014
to 44,308 hectares. The decease mainly took place in Farah and Nimroz provinces. Badghis and
Afghanistan Opium Survey 2015
23
Ghor provinces experienced strong increases (117% and 249%, respectively). Eradication was
barely carried out in the Western region, a total of 92 hectares of eradication was carried out in
Farah and Nimroz provinces.
The Western region consistently shows very high levels of opium poppy cultivation. Insecurity
continues to be a major problem as it compromises the rule of law and limits counter-narcotics
interventions.
Table 10: Opium poppy cultivation and eradication in the Western region, 2013-2015 (Hectares)
PROVINCE Cultivation
2013 (ha)
Cultivation
2014 (ha)
Cultivation
2015 (ha)
Change 2014-
2015 (%)
Eradication
in 2014
(ha)
Eradication
in 2015 (ha)
Badghis 3,596 5,721 12,391 +117% 0 0
Farah 24,492 27,513 21,106 -23% 0 52
Ghor 264 493 1,721 +249% 8 0
Hirat 952 738 285 -61% 0 0
Nimroz 16,252 14,584 8,805 -40% 0 40
Western
Region 45,557 49,049 44,308 -10% 8 92
Note: In 2013, the Dilaram area, previously a district of Farah province, was reintegrated into Nimroz province.
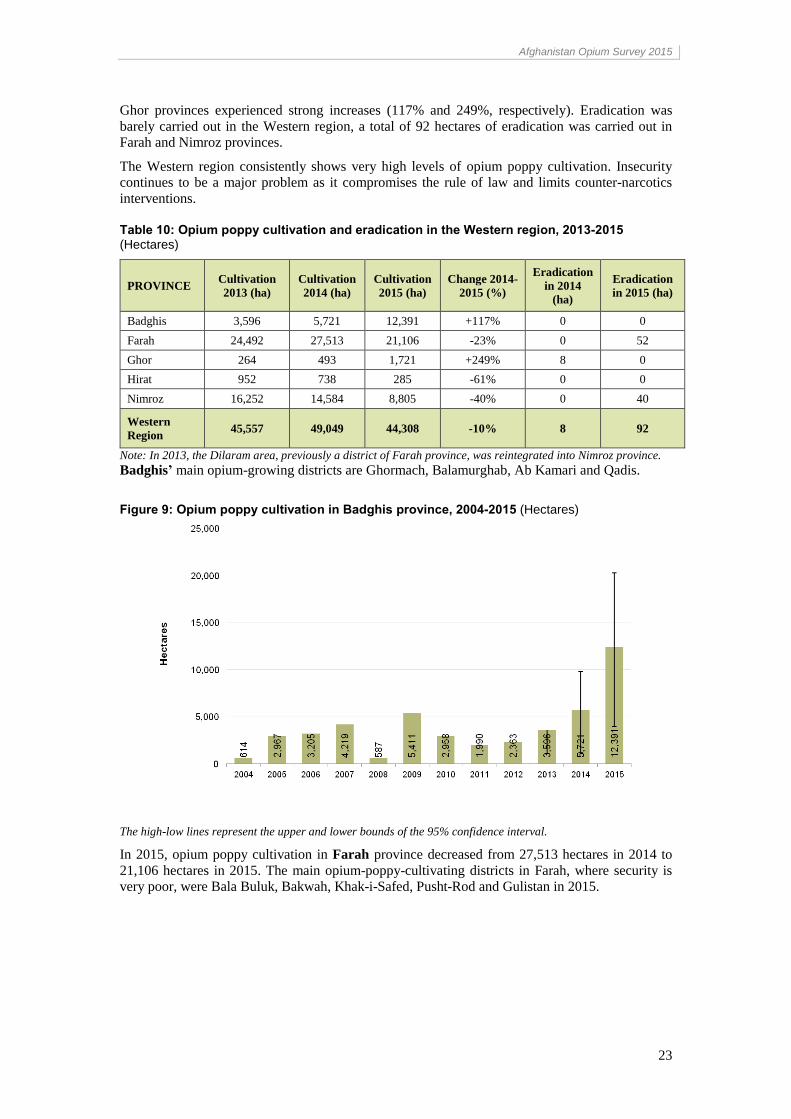
Badghis’ main opium-growing districts are Ghormach, Balamurghab, Ab Kamari and Qadis.
Figure 9: Opium poppy cultivation in Badghis province, 2004-2015 (Hectares)
The high-low lines represent the upper and lower bounds of the 95% confidence interval.
In 2015, opium poppy cultivation in Farah province decreased from 27,513 hectares in 2014 to
21,106 hectares in 2015. The main opium-poppy-cultivating districts in Farah, where security is
very poor, were Bala Buluk, Bakwah, Khak-i-Safed, Pusht-Rod and Gulistan in 2015.
Afghanistan Opium Survey 2015
24
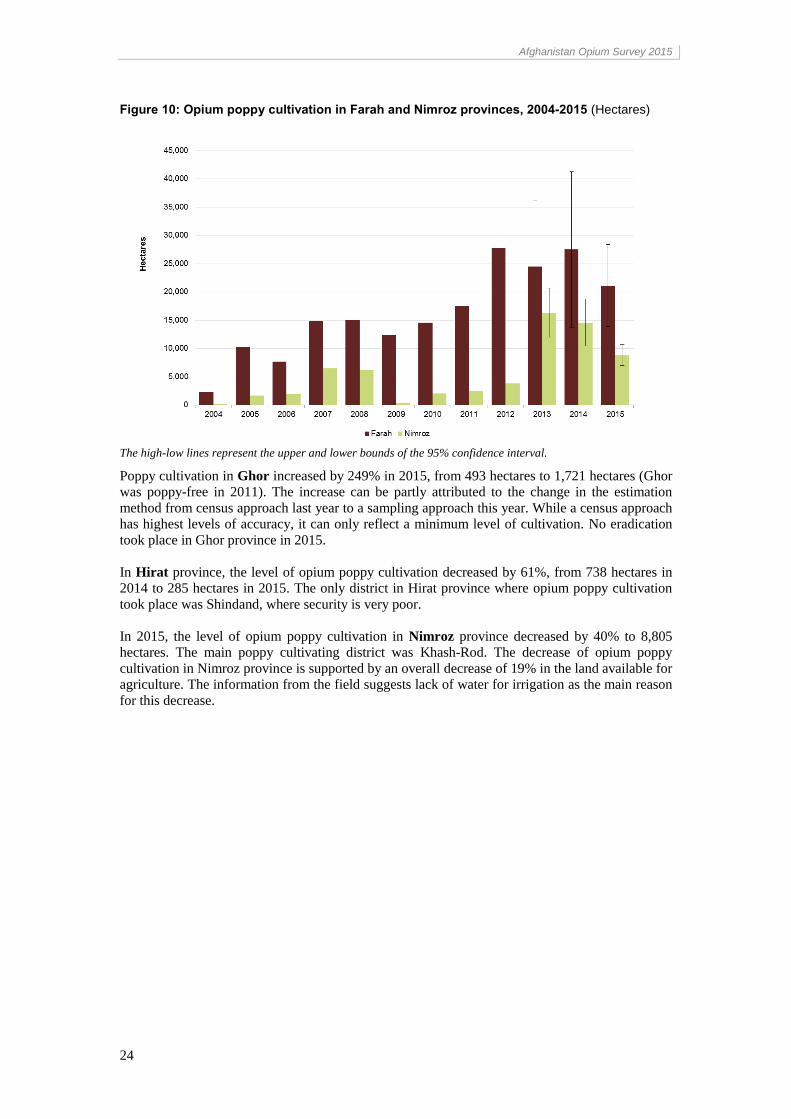
Figure 10: Opium poppy cultivation in Farah and Nimroz provinces, 2004-2015 (Hectares)
The high-low lines represent the upper and lower bounds of the 95% confidence interval.
Poppy cultivation in Ghor increased by 249% in 2015, from 493 hectares to 1,721 hectares (Ghor
was poppy-free in 2011). The increase can be partly attributed to the change in the estimation
method from census approach last year to a sampling approach this year. While a census approach
has highest levels of accuracy, it can only reflect a minimum level of cultivation. No eradication
took place in Ghor province in 2015.
In Hirat province, the level of opium poppy cultivation decreased by 61%, from 738 hectares in
2014 to 285 hectares in 2015. The only district in Hirat province where opium poppy cultivation
took place was Shindand, where security is very poor.
In 2015, the level of opium poppy cultivation in Nimroz province decreased by 40% to 8,805
hectares. The main poppy cultivating district was Khash-Rod. The decrease of opium poppy
cultivation in Nimroz province is supported by an overall decrease of 19% in the land available for
agriculture. The information from the field suggests lack of water for irrigation as the main reason
for this decrease.
Afghanistan Opium Survey 2015
25
3 Eradication
3.1 Poppy eradication increased by 40% in 2015
A total of 3,760 hectares of verified poppy eradication was carried out by the provincial
Governors in 2015, representing an increase of 40% from 2014 when 2,692 hectares of Governor-
led eradication (GLE) was verified by MCN/UNODC.
In 2015, MCN/UNODC field surveyors verified the eradication of 11,694 fields in 619 villages in
12 provinces, whereas in 2014 MCN/UNODC verifiers visited 480 villages (10,221 poppy fields)
in 17 provinces where eradication had been carried out by Governor-led eradication teams.
Quality control of eradication verification was carried out using satellite data in Badakhshan,
Hilmand, Kandahar, Nangarhar, Sari Pul, Nimroz and Uruzgan provinces. Final figures for
eradication in these provinces are confirmed after checking with high-resolution satellite imagery
supported by GPS tracking files, and photographs from the ground. For the provinces of Day
Kundi, Farah, Kunar, Faryab, Laghman and Takhar, the quality checks for eradication verification
were based on survey forms, checking area measurement calculations and on field photographs.
Major observations on eradication campaigns in 2014 and 2015 are given below (see tables also):
Governor-led poppy eradication campaigns eradicated more area in Hilmand province in
2015 than in 2014.
A total of 3,760 hectares of Governor-led poppy eradication was carried out in 2015, which
corresponds to an increase of 40% from 2014, when 2,692 hectares were eradicated.
Eradication took place in 12 provinces in 2015 (17 provinces in 2014): Badakhshan, Day
Kundi, Farah, Hilmand, Kandahar, Kunar, Laghman, Nangarhar, Nimroz, Sari Pul, Takhar
and Uruzgan. No eradication took place in Faryab, Ghor, Kunduz, Kapisa, Balkh, Baghlan
and Zabul provinces.
The Governor-led poppy eradication campaign commenced on 25 February 2015 in
Kandahar province and 27 February in Hilmand province, while the 2014 eradication
activities began on 3 March in Hilmand province and 16 April in Kandahar province.
The largest amount of poppy eradication took place in Hilmand province (1,747 hectares;
122% more than in 2014), followed by Badakhshan province (1,246 hectares; 12% less than
in 2014), and Kandahar, where 396 hectares were eradicated (482% more than in 2014).
In 2015, less security incidences occurred than in 2014. In 2015, 5 lives were lost (1 Police
officer, 3 Afghan Local Police officers, and 1 member of the Afghan National Army) and
18 persons were injured (2 Police officers, 3 Afghan Local Police officers, 7 members of
the Afghan National Army and 6 farmers). In 2014, 13 lives were lost and 26 persons were
injured. Farmers’ resistance against poppy eradication operations manifested itself in
different ways such as direct attacks on eradication teams, mine explosions or flooding of
fields.
The increased security during eradication has been attributed to a better coordination
between the Ministry of Counternarcotics, the Ministries of Defense and Interior and the
Independent Directorate of Local Governance. Eradication was carried out in the vicinity of
military operations in Hilmand and Kandahar provinces, which reportedly increased
security.
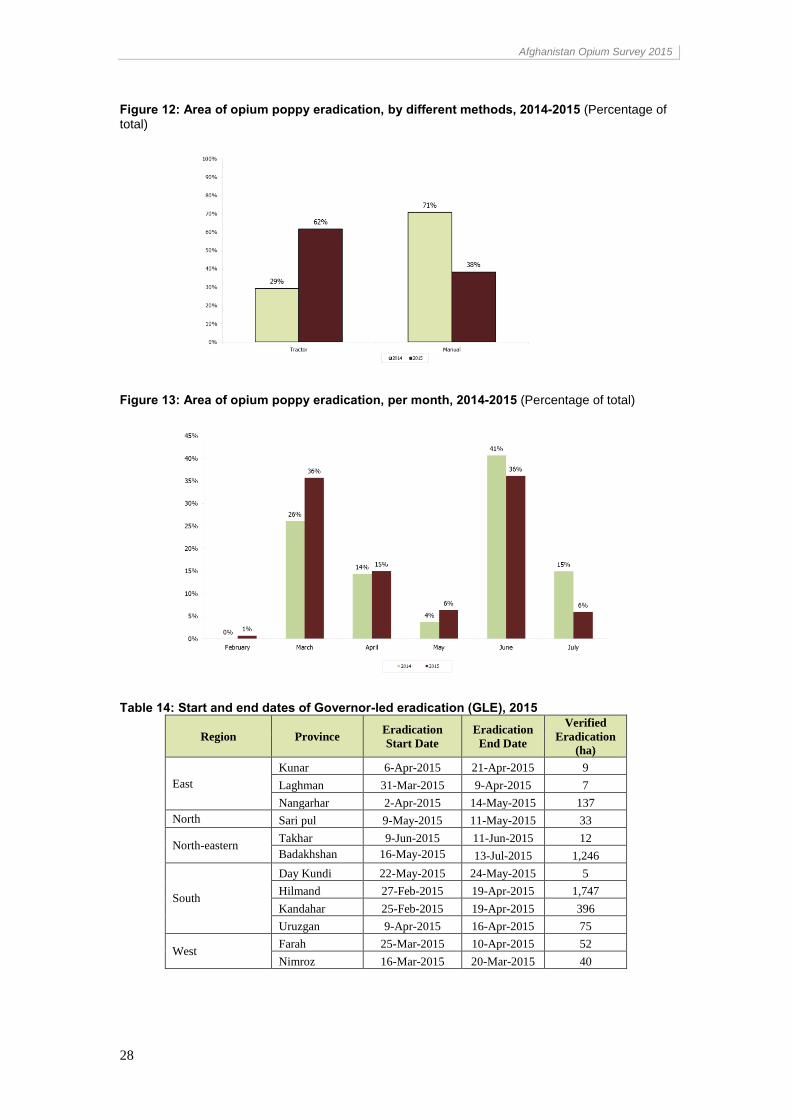
GLE teams mainly used tractors and ATVs (All Terrain Vehicles) and manual eradication
(sticks, blades, hands and uprooting) in 2015, with 62% of GLE being carried out by
tractor/ATV and 38% by manual methods.
Afghanistan Opium Survey 2015
26
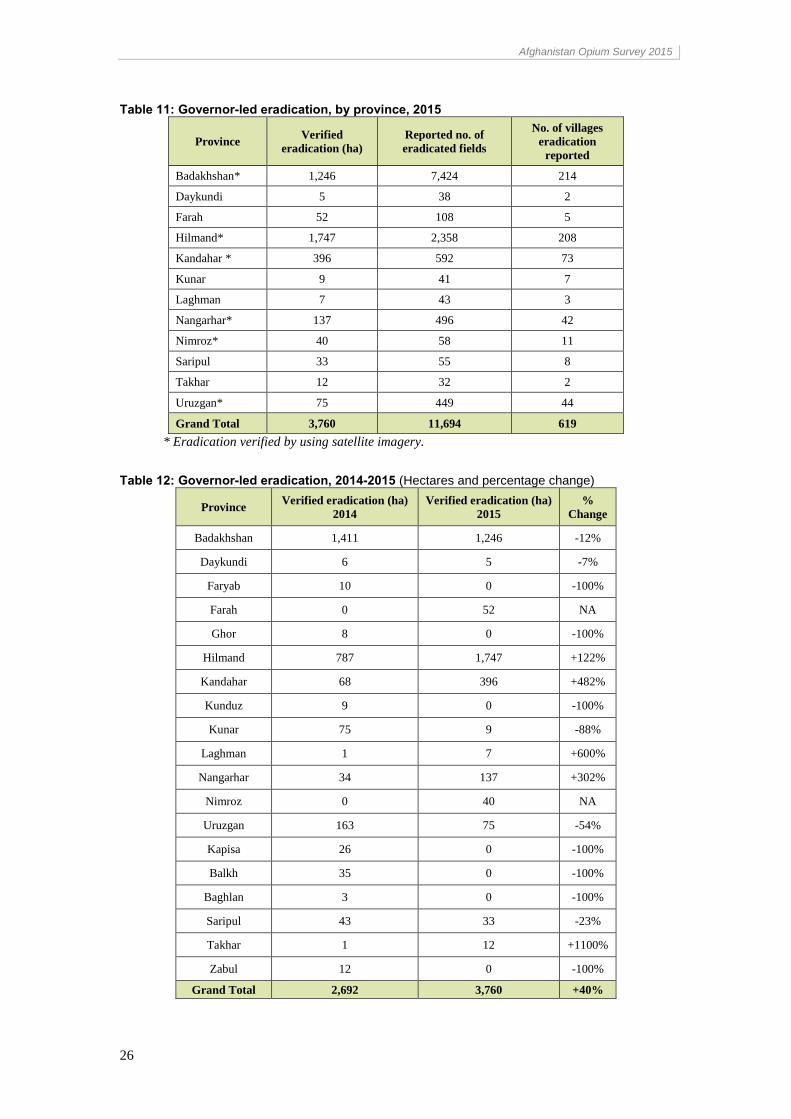
Table 11: Governor-led eradication, by province, 2015
Province Verified
eradication (ha)
Reported no. of
eradicated fields
No. of villages
eradication
reported
Badakhshan* 1,246 7,424 214
Daykundi 5 38 2
Farah 52 108 5
Hilmand* 1,747 2,358 208
Kandahar * 396 592 73
Kunar 9 41 7
Laghman 7 43 3
Nangarhar* 137 496 42
Nimroz* 40 58 11
Saripul 33 55 8
Takhar 12 32 2
Uruzgan* 75 449 44
Grand Total 3,760 11,694 619
* Eradication verified by using satellite imagery.
Table 12: Governor-led eradication, 2014-2015 (Hectares and percentage change)
Province Verified eradication (ha)
2014
Verified eradication (ha)
2015
%
Change
Badakhshan 1,411 1,246 -12%
Daykundi 6 5 -7%
Faryab 10 0 -100%
Farah 0 52 NA
Ghor 8 0 -100%
Hilmand 787 1,747 +122%
Kandahar 68 396 +482%
Kunduz 9 0 -100%
Kunar 75 9 -88%
Laghman 1 7 +600%
Nangarhar 34 137 +302%
Nimroz 0 40 NA
Uruzgan 163 75 -54%
Kapisa 26 0 -100%
Balkh 35 0 -100%
Baghlan 3 0 -100%
Saripul 43 33 -23%
Takhar 1 12 +1100%
Zabul 12 0 -100%
Grand Total 2,692 3,760 +40%
Afghanistan Opium Survey 2015
27
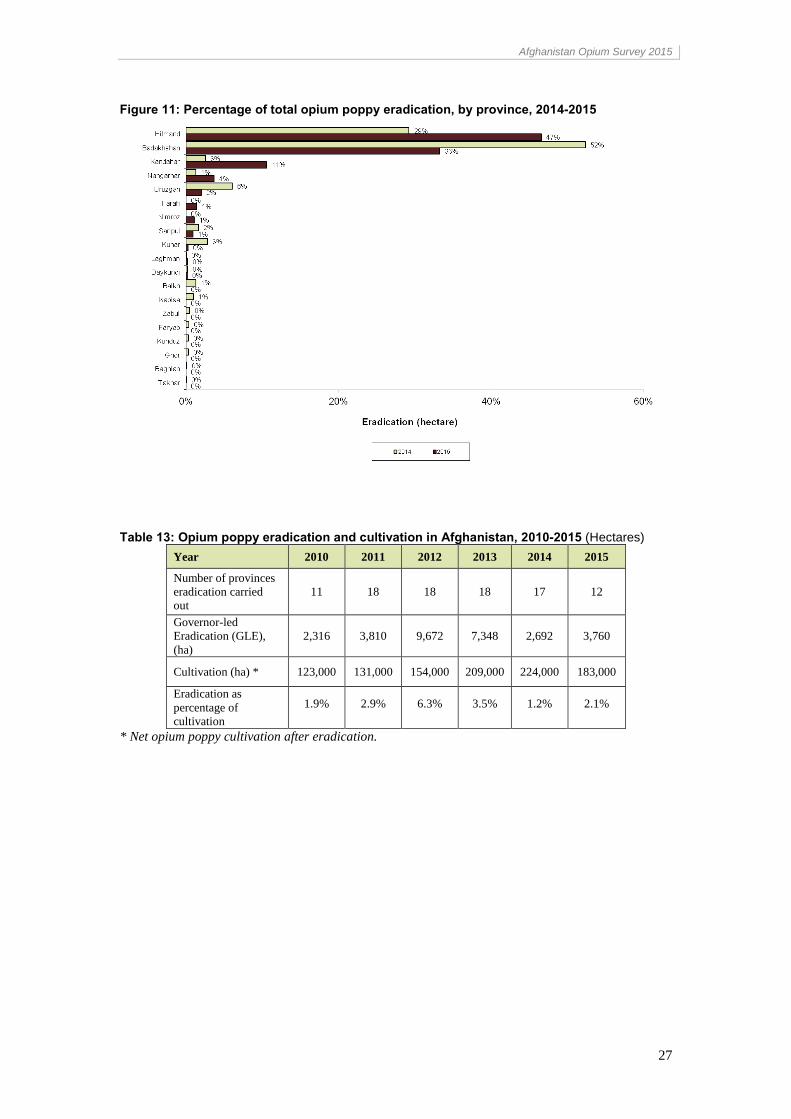
Figure 11: Percentage of total opium poppy eradication, by province, 2014-2015
Table 13: Opium poppy eradication and cultivation in Afghanistan, 2010-2015 (Hectares)
Year 2010 2011 2012 2013 2014 2015
Number of provinces
eradication carried
out
11 18 18 18 17 12
Governor-led
Eradication (GLE),
(ha)
2,316 3,810 9,672 7,348 2,692 3,760
Cultivation (ha) * 123,000 131,000 154,000 209,000 224,000 183,000
Eradication as
percentage of
cultivation
1.9% 2.9% 6.3% 3.5% 1.2% 2.1%
* Net opium poppy cultivation after eradication.
Afghanistan Opium Survey 2015
28
Figure 12: Area of opium poppy eradication, by different methods, 2014-2015 (Percentage of total)
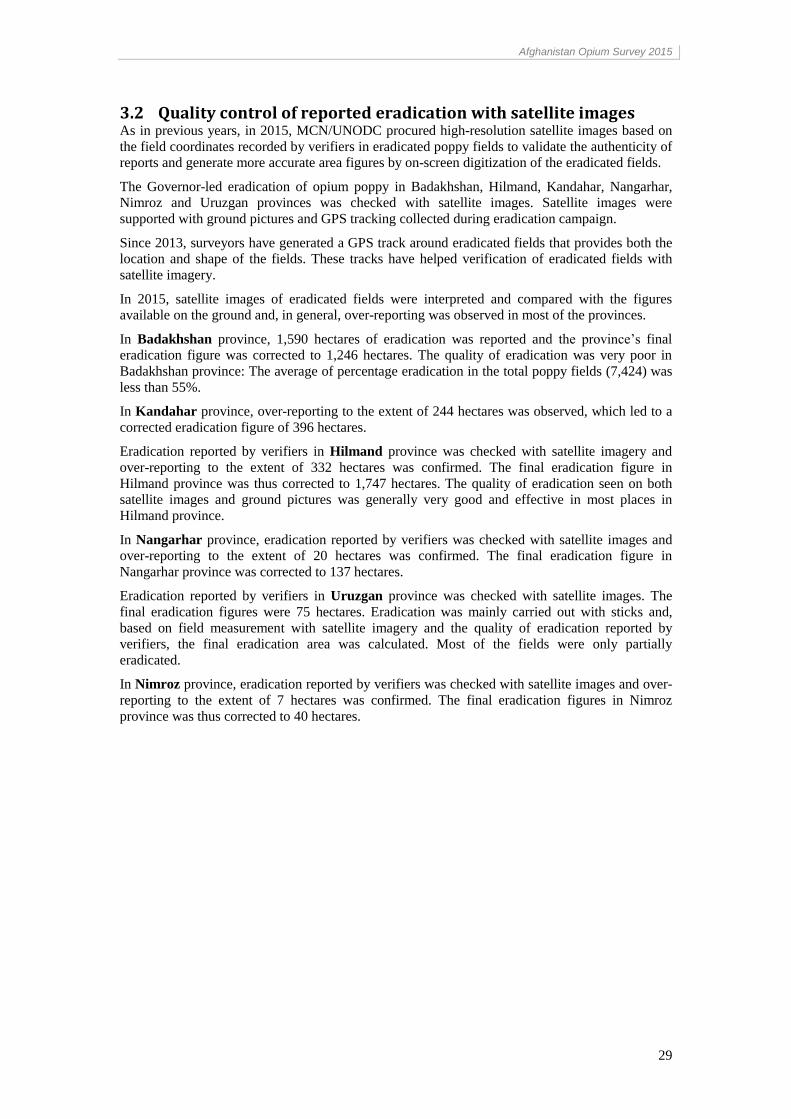
Figure 13: Area of opium poppy eradication, per month, 2014-2015 (Percentage of total)
Table 14: Start and end dates of Governor-led eradication (GLE), 2015
Region Province Eradication
Start Date
Eradication
End Date
Verified
Eradication
(ha)
East
Kunar 6-Apr-2015 21-Apr-2015 9
Laghman 31-Mar-2015 9-Apr-2015 7
Nangarhar 2-Apr-2015 14-May-2015 137
North Sari pul 9-May-2015 11-May-2015 33
North-eastern Takhar 9-Jun-2015 11-Jun-2015 12
Badakhshan 16-May-2015 13-Jul-2015 1,246
South
Day Kundi 22-May-2015 24-May-2015 5
Hilmand 27-Feb-2015 19-Apr-2015 1,747
Kandahar 25-Feb-2015 19-Apr-2015 396
Uruzgan 9-Apr-2015 16-Apr-2015 75
West Farah 25-Mar-2015 10-Apr-2015 52
Nimroz 16-Mar-2015 20-Mar-2015 40
Afghanistan Opium Survey 2015
29
3.2 Quality control of reported eradication with satellite images As in previous years, in 2015, MCN/UNODC procured high-resolution satellite images based on
the field coordinates recorded by verifiers in eradicated poppy fields to validate the authenticity of
reports and generate more accurate area figures by on-screen digitization of the eradicated fields.
The Governor-led eradication of opium poppy in Badakhshan, Hilmand, Kandahar, Nangarhar,
Nimroz and Uruzgan provinces was checked with satellite images. Satellite images were
supported with ground pictures and GPS tracking collected during eradication campaign.
Since 2013, surveyors have generated a GPS track around eradicated fields that provides both the
location and shape of the fields. These tracks have helped verification of eradicated fields with
satellite imagery.
In 2015, satellite images of eradicated fields were interpreted and compared with the figures
available on the ground and, in general, over-reporting was observed in most of the provinces.
In Badakhshan province, 1,590 hectares of eradication was reported and the province’s final
eradication figure was corrected to 1,246 hectares. The quality of eradication was very poor in
Badakhshan province: The average of percentage eradication in the total poppy fields (7,424) was
less than 55%.
In Kandahar province, over-reporting to the extent of 244 hectares was observed, which led to a
corrected eradication figure of 396 hectares.
Eradication reported by verifiers in Hilmand province was checked with satellite imagery and
over-reporting to the extent of 332 hectares was confirmed. The final eradication figure in
Hilmand province was thus corrected to 1,747 hectares. The quality of eradication seen on both
satellite images and ground pictures was generally very good and effective in most places in
Hilmand province.
In Nangarhar province, eradication reported by verifiers was checked with satellite images and
over-reporting to the extent of 20 hectares was confirmed. The final eradication figure in
Nangarhar province was corrected to 137 hectares.
Eradication reported by verifiers in Uruzgan province was checked with satellite images. The
final eradication figures were 75 hectares. Eradication was mainly carried out with sticks and,
based on field measurement with satellite imagery and the quality of eradication reported by
verifiers, the final eradication area was calculated. Most of the fields were only partially
eradicated.
In Nimroz province, eradication reported by verifiers was checked with satellite images and over-
reporting to the extent of 7 hectares was confirmed. The final eradication figures in Nimroz
province was thus corrected to 40 hectares.
Afghanistan Opium Survey 2015
30
4 Potential opium yield and production
4.1 Potential opium yield and production decreased in 20156 In 2015, estimated potential opium production in Afghanistan amounted to 3,300 tons (2,700-
3,900 tons), a decrease of 48% from its 2014 level (6,400 tons). Average opium yield amounted to
18.3 kilograms per hectare in 2015, which was 36% less than in 2014 (28.7 kilograms per
hectare).
The decrease in production was mainly the result of a decrease in opium poppy cultivation by 19%
and yield by 36%. The 45% decrease in the Southern and 20% decrease Western region, in
particular, caused a decrease in overall production. However, as in the previous year, adverse
weather conditions in parts of the Western and Southern regions affected poppy plants, thereby
reducing the yield in comparison to the relatively unaffected 2011 yield (44.5 kilograms per
hectare).
In 2015, a total of 188 poppy fields were surveyed for the purpose of estimating opium yield. As
in 2012, the yield survey was limited to low-risk areas where the security situation allowed access
and enough time to carry out all measurements. Together with close supervision of field work, this
ensured a very high degree of compliance with the yield survey protocol.7 All yield data obtained
in 2015, except for the data collected in Nimroz and Faryab provinces, met the strict quality
criteria introduced in 2011.
The Southern region continued to produce the vast majority of opium in Afghanistan in 2015,
representing 58% of national production. The Western region was the country’s second most
important opium-producing region (22%). The Eastern region was the country’s third most
important opium-producing region (14%). The rest of the country contributed 6% of total opium
production.
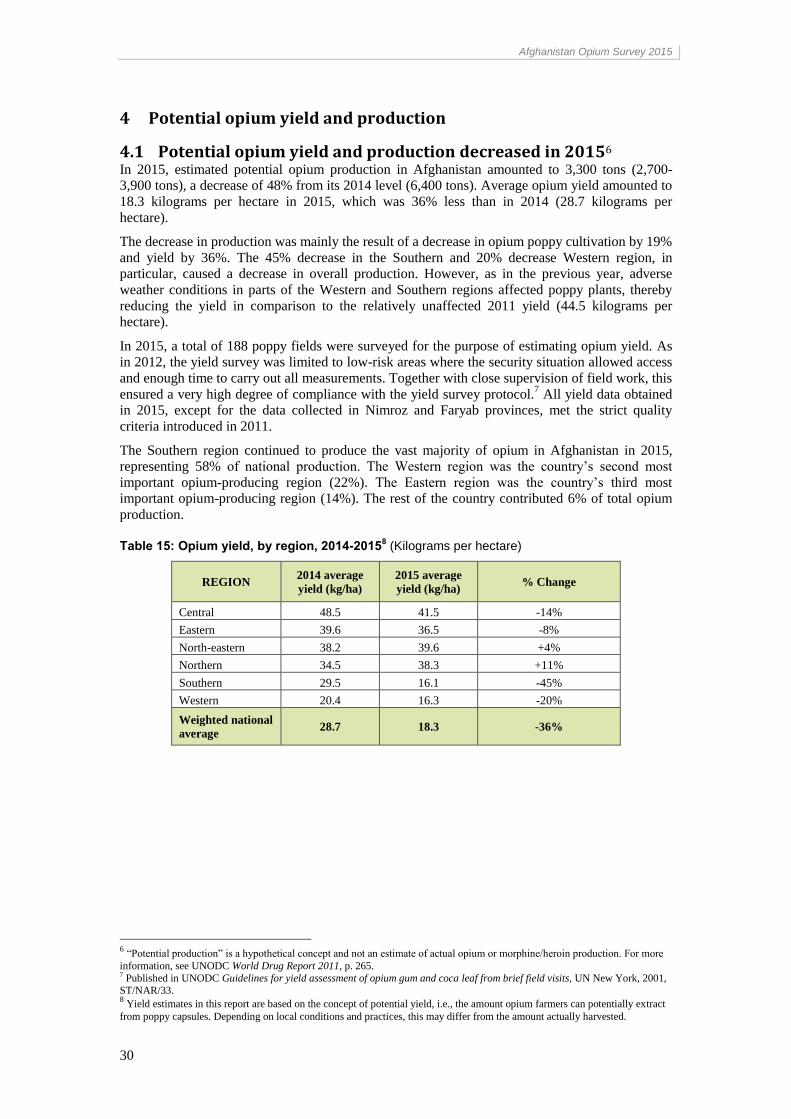
Table 15: Opium yield, by region, 2014-20158 (Kilograms per hectare)
REGION 2014 average
yield (kg/ha)
2015 average
yield (kg/ha) % Change
Central 48.5 41.5 -14%
Eastern 39.6 36.5 -8%
North-eastern 38.2 39.6 +4%
Northern 34.5 38.3 +11%
Southern 29.5 16.1 -45%
Western 20.4 16.3 -20%
Weighted national
average 28.7 18.3 -36%
6 “Potential production” is a hypothetical concept and not an estimate of actual opium or morphine/heroin production. For more
information, see UNODC World Drug Report 2011, p. 265. 7 Published in UNODC Guidelines for yield assessment of opium gum and coca leaf from brief field visits, UN New York, 2001,
ST/NAR/33. 8 Yield estimates in this report are based on the concept of potential yield, i.e., the amount opium farmers can potentially extract
from poppy capsules. Depending on local conditions and practices, this may differ from the amount actually harvested.
Afghanistan Opium Survey 2015
31
Afghanistan Opium Survey 2015
32
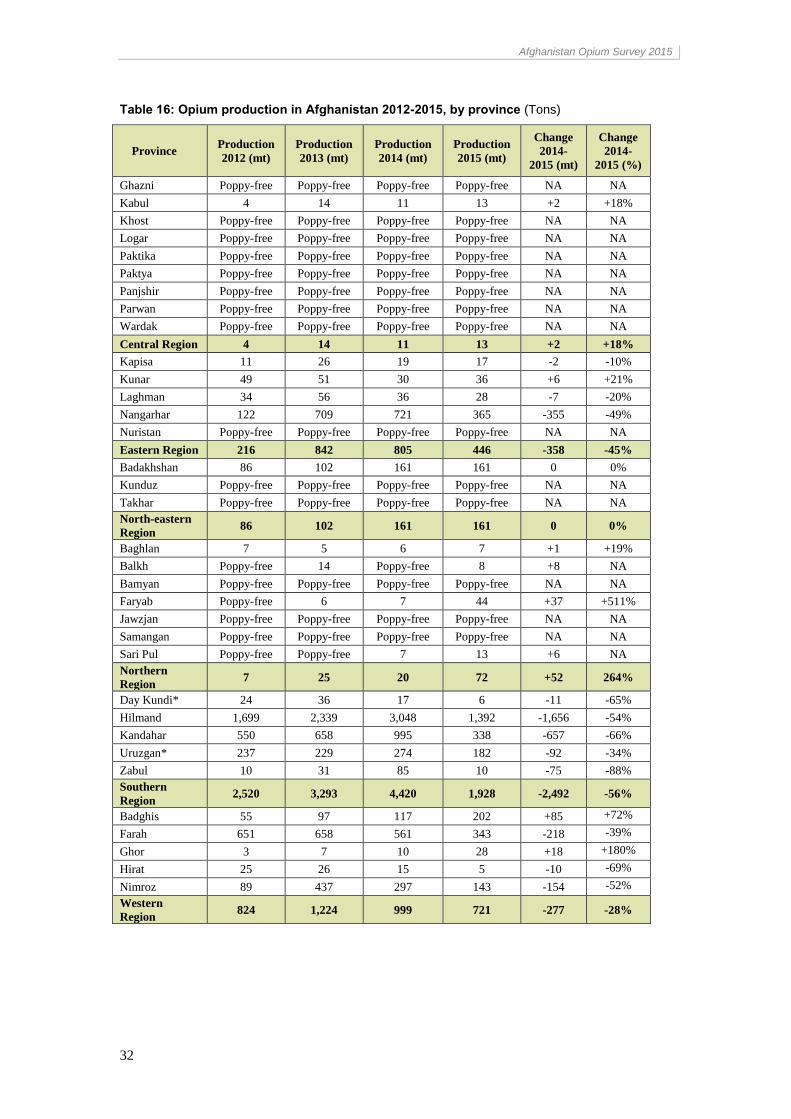
Table 16: Opium production in Afghanistan 2012-2015, by province (Tons)
Province Production
2012 (mt)
Production
2013 (mt)
Production
2014 (mt)
Production
2015 (mt)
Change
2014-
2015 (mt)
Change
2014-
2015 (%)
Ghazni Poppy-free Poppy-free Poppy-free Poppy-free NA NA
Kabul 4 14 11 13 +2 +18%
Khost Poppy-free Poppy-free Poppy-free Poppy-free NA NA
Logar Poppy-free Poppy-free Poppy-free Poppy-free NA NA
Paktika Poppy-free Poppy-free Poppy-free Poppy-free NA NA
Paktya Poppy-free Poppy-free Poppy-free Poppy-free NA NA
Panjshir Poppy-free Poppy-free Poppy-free Poppy-free NA NA
Parwan Poppy-free Poppy-free Poppy-free Poppy-free NA NA
Wardak Poppy-free Poppy-free Poppy-free Poppy-free NA NA
Central Region 4 14 11 13 +2 +18%
Kapisa 11 26 19 17 -2 -10%
Kunar 49 51 30 36 +6 +21%
Laghman 34 56 36 28 -7 -20%
Nangarhar 122 709 721 365 -355 -49%
Nuristan Poppy-free Poppy-free Poppy-free Poppy-free NA NA
Eastern Region 216 842 805 446 -358 -45%
Badakhshan 86 102 161 161 0 0%
Kunduz Poppy-free Poppy-free Poppy-free Poppy-free NA NA
Takhar Poppy-free Poppy-free Poppy-free Poppy-free NA NA
North-eastern
Region 86 102 161 161 0 0%
Baghlan 7 5 6 7 +1 +19%
Balkh Poppy-free 14 Poppy-free 8 +8 NA
Bamyan Poppy-free Poppy-free Poppy-free Poppy-free NA NA
Faryab Poppy-free 6 7 44 +37 +511%
Jawzjan Poppy-free Poppy-free Poppy-free Poppy-free NA NA
Samangan Poppy-free Poppy-free Poppy-free Poppy-free NA NA
Sari Pul Poppy-free Poppy-free 7 13 +6 NA
Northern
Region 7 25 20 72 +52 264%
Day Kundi* 24 36 17 6 -11 -65%
Hilmand 1,699 2,339 3,048 1,392 -1,656 -54%
Kandahar 550 658 995 338 -657 -66%
Uruzgan* 237 229 274 182 -92 -34%
Zabul 10 31 85 10 -75 -88%
Southern
Region 2,520 3,293 4,420 1,928 -2,492 -56%
Badghis 55 97 117 202 +85 +72%
Farah 651 658 561 343 -218 -39%
Ghor 3 7 10 28 +18 +180%
Hirat 25 26 15 5 -10 -69%
Nimroz 89 437 297 143 -154 -52%
Western
Region 824 1,224 999 721 -277 -28%
Afghanistan Opium Survey 2015
33
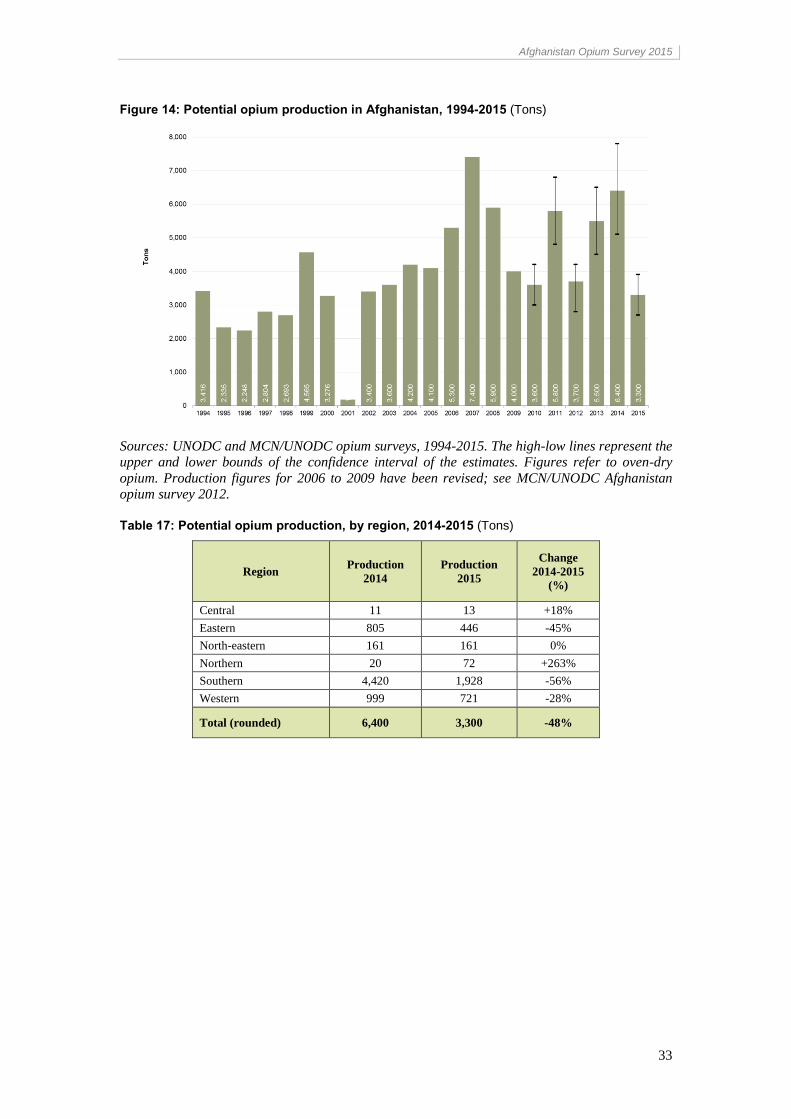
Figure 14: Potential opium production in Afghanistan, 1994-2015 (Tons)
Sources: UNODC and MCN/UNODC opium surveys, 1994-2015. The high-low lines represent the upper and lower bounds of the confidence interval of the estimates. Figures refer to oven-dry
opium. Production figures for 2006 to 2009 have been revised; see MCN/UNODC Afghanistan opium survey 2012.
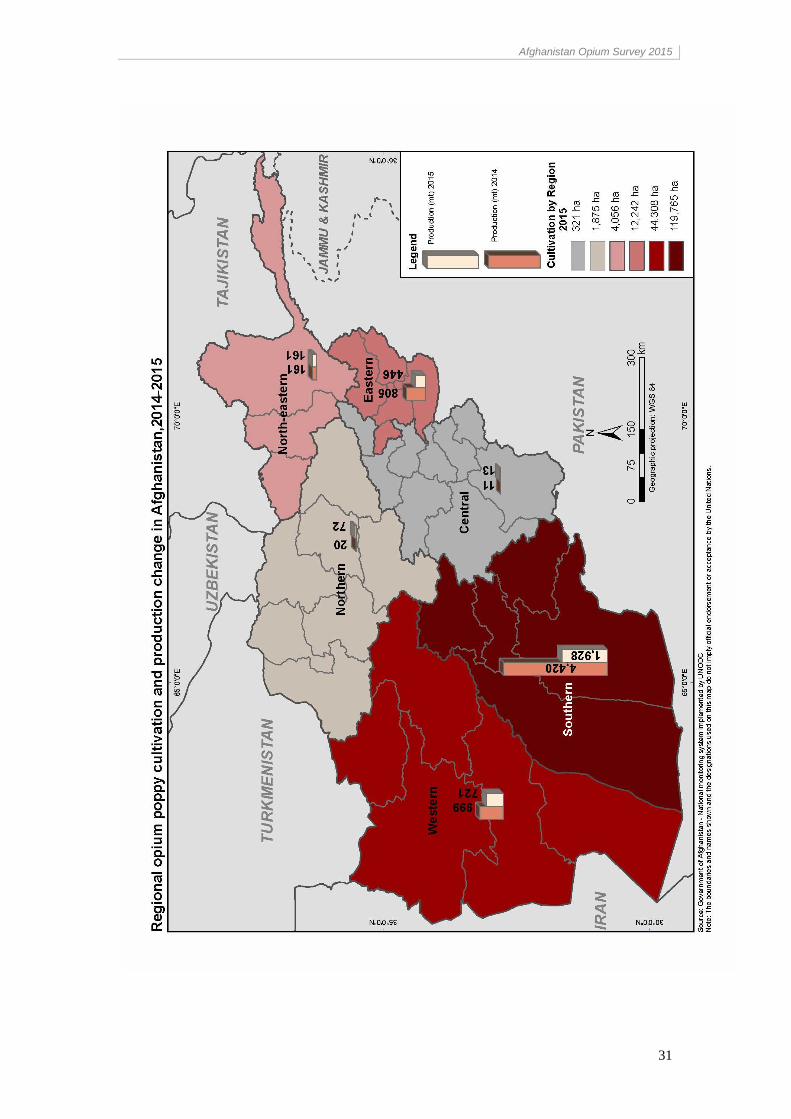
Table 17: Potential opium production, by region, 2014-2015 (Tons)
Region Production
2014
Production
2015
Change
2014-2015
(%)
Central 11 13 +18%
Eastern 805 446 -45%
North-eastern 161 161 0%
Northern 20 72 +263%
Southern 4,420 1,928 -56%
Western 999 721 -28%
Total (rounded) 6,400 3,300 -48%
Afghanistan Opium Survey 2015
34
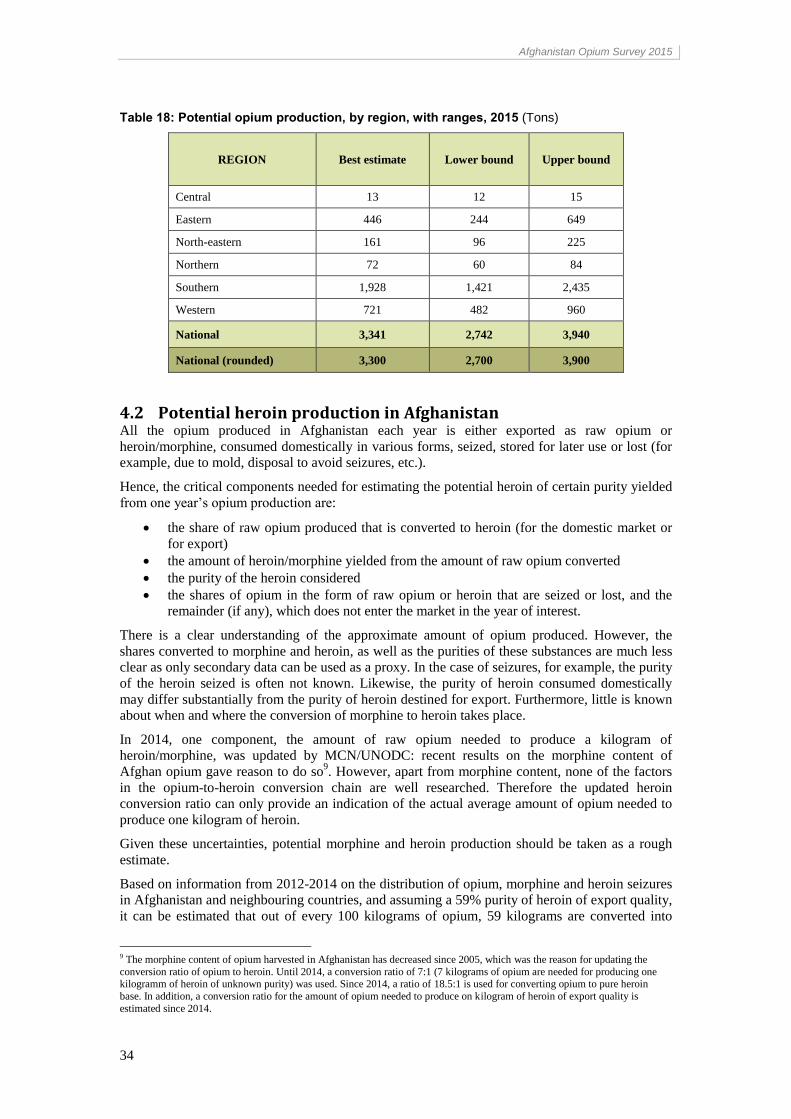
Table 18: Potential opium production, by region, with ranges, 2015 (Tons)
REGION Best estimate Lower bound Upper bound
Central 13 12 15
Eastern 446 244 649
North-eastern 161 96 225
Northern 72 60 84
Southern 1,928 1,421 2,435
Western 721 482 960
National 3,341 2,742 3,940
National (rounded) 3,300 2,700 3,900
4.2 Potential heroin production in Afghanistan All the opium produced in Afghanistan each year is either exported as raw opium or
heroin/morphine, consumed domestically in various forms, seized, stored for later use or lost (for
example, due to mold, disposal to avoid seizures, etc.).
Hence, the critical components needed for estimating the potential heroin of certain purity yielded
from one year’s opium production are:
the share of raw opium produced that is converted to heroin (for the domestic market or
for export)
the amount of heroin/morphine yielded from the amount of raw opium converted
the purity of the heroin considered
the shares of opium in the form of raw opium or heroin that are seized or lost, and the
remainder (if any), which does not enter the market in the year of interest.
There is a clear understanding of the approximate amount of opium produced. However, the
shares converted to morphine and heroin, as well as the purities of these substances are much less
clear as only secondary data can be used as a proxy. In the case of seizures, for example, the purity
of the heroin seized is often not known. Likewise, the purity of heroin consumed domestically
may differ substantially from the purity of heroin destined for export. Furthermore, little is known
about when and where the conversion of morphine to heroin takes place.
In 2014, one component, the amount of raw opium needed to produce a kilogram of
heroin/morphine, was updated by MCN/UNODC: recent results on the morphine content of
Afghan opium gave reason to do so9. However, apart from morphine content, none of the factors
in the opium-to-heroin conversion chain are well researched. Therefore the updated heroin
conversion ratio can only provide an indication of the actual average amount of opium needed to
produce one kilogram of heroin.
Given these uncertainties, potential morphine and heroin production should be taken as a rough
estimate.
Based on information from 2012-2014 on the distribution of opium, morphine and heroin seizures
in Afghanistan and neighbouring countries, and assuming a 59% purity of heroin of export quality,
it can be estimated that out of every 100 kilograms of opium, 59 kilograms are converted into
9 The morphine content of opium harvested in Afghanistan has decreased since 2005, which was the reason for updating the
conversion ratio of opium to heroin. Until 2014, a conversion ratio of 7:1 (7 kilograms of opium are needed for producing one kilogramm of heroin of unknown purity) was used. Since 2014, a ratio of 18.5:1 is used for converting opium to pure heroin
base. In addition, a conversion ratio for the amount of opium needed to produce on kilogram of heroin of export quality is
estimated since 2014.
Afghanistan Opium Survey 2015
35
heroin of export quality and 41 kilograms are left unprocessed.10
Potentially, all opium produced
in Afghanistan could be converted into morphine and heroin. In reality, however, a sizable
proportion of opium is trafficked and consumed in the region in its raw form.
As in 2014, estimated purity of heroin of export quality is based on the latest data available on
purity of wholesale heroin reported by Turkey11
, an important transit country for opiates trafficked
from Afghanistan to Europe. Reported purity of heroin varies substantially. Tajikistan reported
purities from 0.4% to 79% (201312
); the United Kingdom, a destination country for heroin which
receives considerable amounts of Afghan heroin directly from Pakistan, reported purities of brown
heroin of typically 45% (from 20% to 70%) in 2012 (latest available data). Similar levels of purity
as Turkey have been found by the Combined Maritime Forces13
. The Combined Maritime Forces
reported purities of seizures of a total of 3.9 tons of heroin over the time period 2012 to 2014,
which had an average purity (weighted) of 62% (minimum 34%, maximum 82.5%).
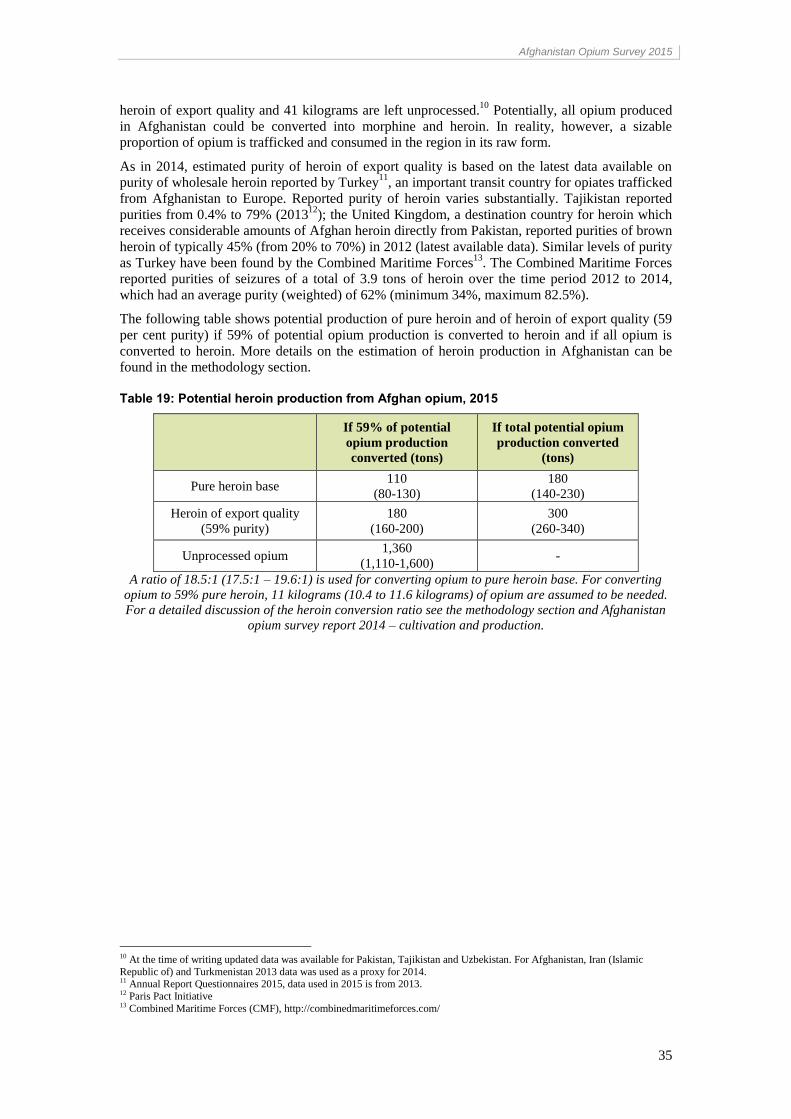
The following table shows potential production of pure heroin and of heroin of export quality (59
per cent purity) if 59% of potential opium production is converted to heroin and if all opium is
converted to heroin. More details on the estimation of heroin production in Afghanistan can be
found in the methodology section.
Table 19: Potential heroin production from Afghan opium, 2015
If 59% of potential
opium production
converted (tons)
If total potential opium
production converted
(tons)
Pure heroin base 110
(80-130)
180
(140-230)
Heroin of export quality
(59% purity)
180
(160-200)
300
(260-340)
Unprocessed opium 1,360
(1,110-1,600) -
A ratio of 18.5:1 (17.5:1 – 19.6:1) is used for converting opium to pure heroin base. For converting
opium to 59% pure heroin, 11 kilograms (10.4 to 11.6 kilograms) of opium are assumed to be needed.
For a detailed discussion of the heroin conversion ratio see the methodology section and Afghanistan
opium survey report 2014 – cultivation and production.
10 At the time of writing updated data was available for Pakistan, Tajikistan and Uzbekistan. For Afghanistan, Iran (Islamic
Republic of) and Turkmenistan 2013 data was used as a proxy for 2014. 11 Annual Report Questionnaires 2015, data used in 2015 is from 2013. 12 Paris Pact Initiative 13 Combined Maritime Forces (CMF), http://combinedmaritimeforces.com/
Afghanistan Opium Survey 2015
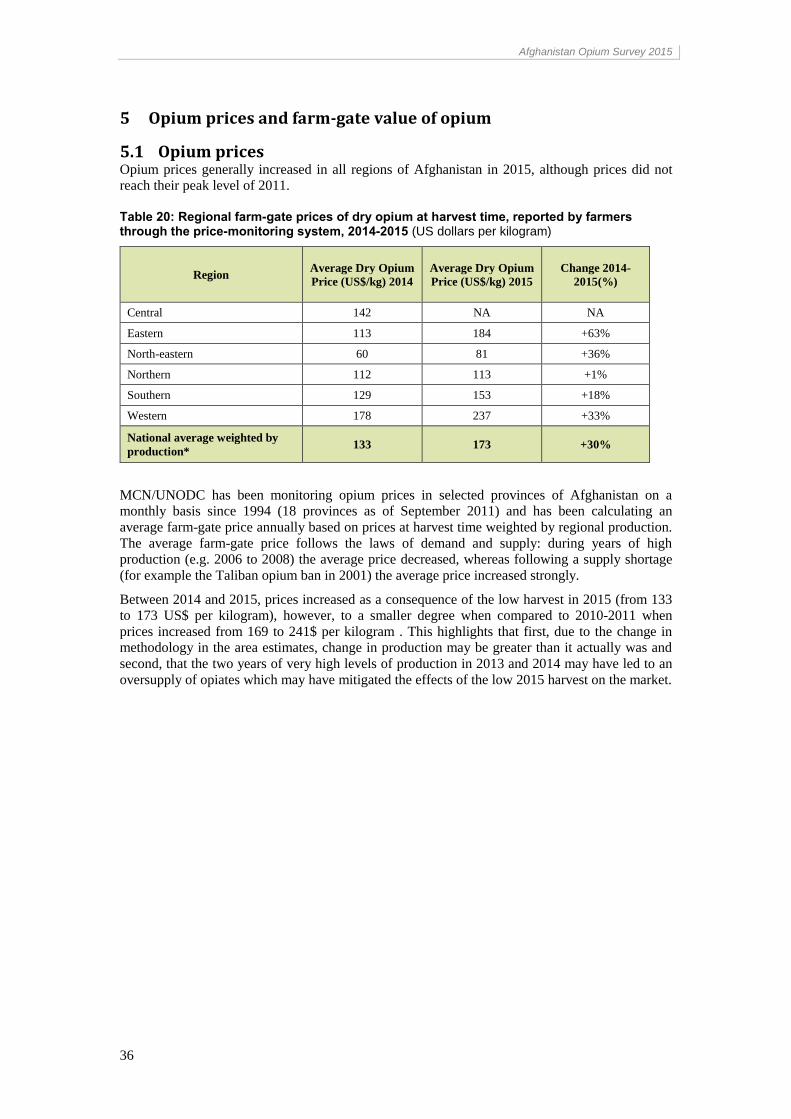
36
5 Opium prices and farm-gate value of opium
5.1 Opium prices Opium prices generally increased in all regions of Afghanistan in 2015, although prices did not
reach their peak level of 2011.
Table 20: Regional farm-gate prices of dry opium at harvest time, reported by farmers through the price-monitoring system, 2014-2015 (US dollars per kilogram)
Region Average Dry Opium
Price (US$/kg) 2014
Average Dry Opium
Price (US$/kg) 2015
Change 2014-
2015(%)
Central 142 NA NA
Eastern 113 184 +63%
North-eastern 60 81 +36%
Northern 112 113 +1%
Southern 129 153 +18%
Western 178 237 +33%
National average weighted by
production* 133 173 +30%
MCN/UNODC has been monitoring opium prices in selected provinces of Afghanistan on a
monthly basis since 1994 (18 provinces as of September 2011) and has been calculating an
average farm-gate price annually based on prices at harvest time weighted by regional production.
The average farm-gate price follows the laws of demand and supply: during years of high
production (e.g. 2006 to 2008) the average price decreased, whereas following a supply shortage
(for example the Taliban opium ban in 2001) the average price increased strongly.
Between 2014 and 2015, prices increased as a consequence of the low harvest in 2015 (from 133
to 173 US$ per kilogram), however, to a smaller degree when compared to 2010-2011 when
prices increased from 169 to 241$ per kilogram . This highlights that first, due to the change in
methodology in the area estimates, change in production may be greater than it actually was and
second, that the two years of very high levels of production in 2013 and 2014 may have led to an
oversupply of opiates which may have mitigated the effects of the low 2015 harvest on the market.
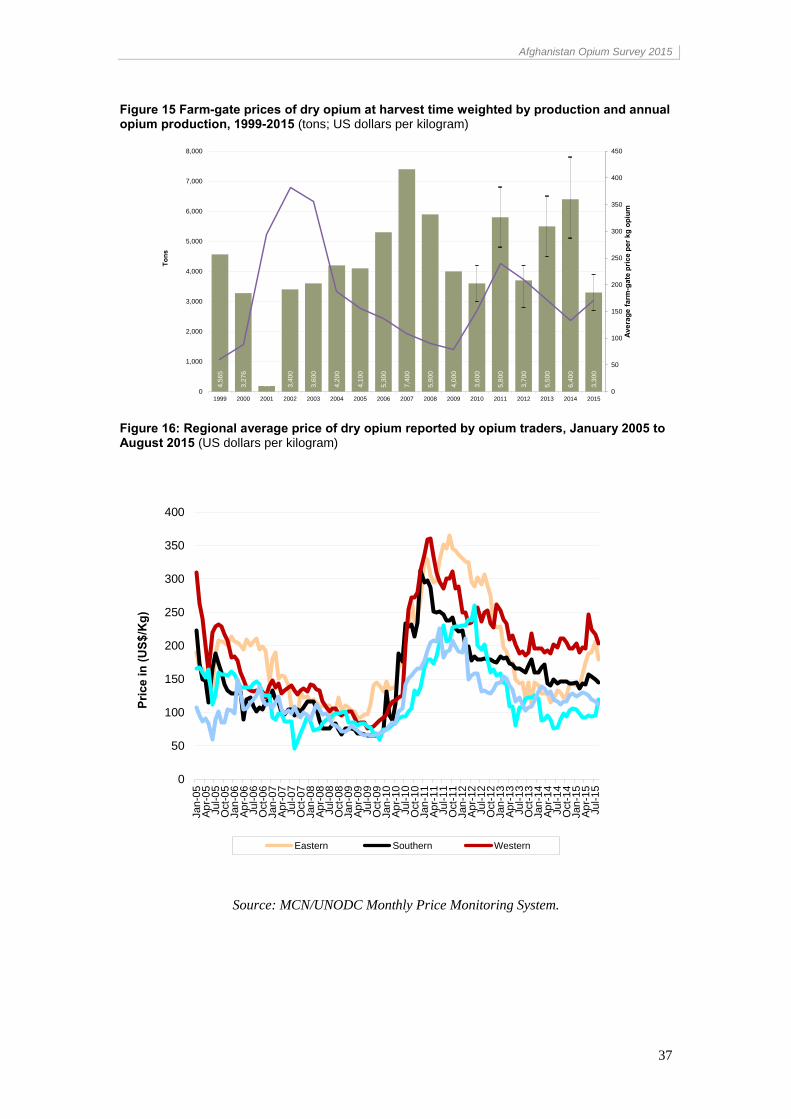
Afghanistan Opium Survey 2015
37
Figure 15 Farm-gate prices of dry opium at harvest time weighted by production and annual opium production, 1999-2015 (tons; US dollars per kilogram)
Figure 16: Regional average price of dry opium reported by opium traders, January 2005 to August 2015 (US dollars per kilogram)
Source: MCN/UNODC Monthly Price Monitoring System.
4,5
65
3,2
76
185
3,4
00
3,6
00
4,2
00
4,1
00
5,3
00
7,4
00
5,9
00
4,0
00
3,6
00
5,8
00
3,7
00
5,5
00
6,4
00
3,3
00
0
50
100
150
200
250
300
350
400
450
0
1,000
2,000
3,000
4,000
5,000
6,000
7,000
8,000
1999 2000 2001 2002 2003 2004 2005 2006 2007 2008 2009 2010 2011 2012 2013 2014 2015
Ave
rag
e f
arm
-gate
pri
ce p
er
kg
op
ium
To
ns
0
50
100
150
200
250
300
350
400
Jan
-05
Ap
r-05
Jul-0
5O
ct-
05
Jan
-06
Ap
r-06
Jul-0
6O
ct-
06
Jan
-07
Ap
r-07
Jul-0
7O
ct-
07
Jan
-08
Ap
r-08
Jul-0
8O
ct-
08
Jan
-09
Ap
r-09
Jul-0
9O
ct-
09
Jan
-10
Ap
r-10
Jul-1
0O
ct-
10
Jan
-11
Ap
r-11
Jul-1
1O
ct-
11
Jan
-12
Ap
r-12
Jul-1
2O
ct-
12
Jan
-13
Ap
r-13
Jul-1
3O
ct-
13
Jan
-14
Ap
r-14
Jul-1
4O
ct-
14
Jan
-15
Ap
r-15
Jul-1
5
Pri
ce
in
(U
S$
/Kg
)
Eastern Southern Western
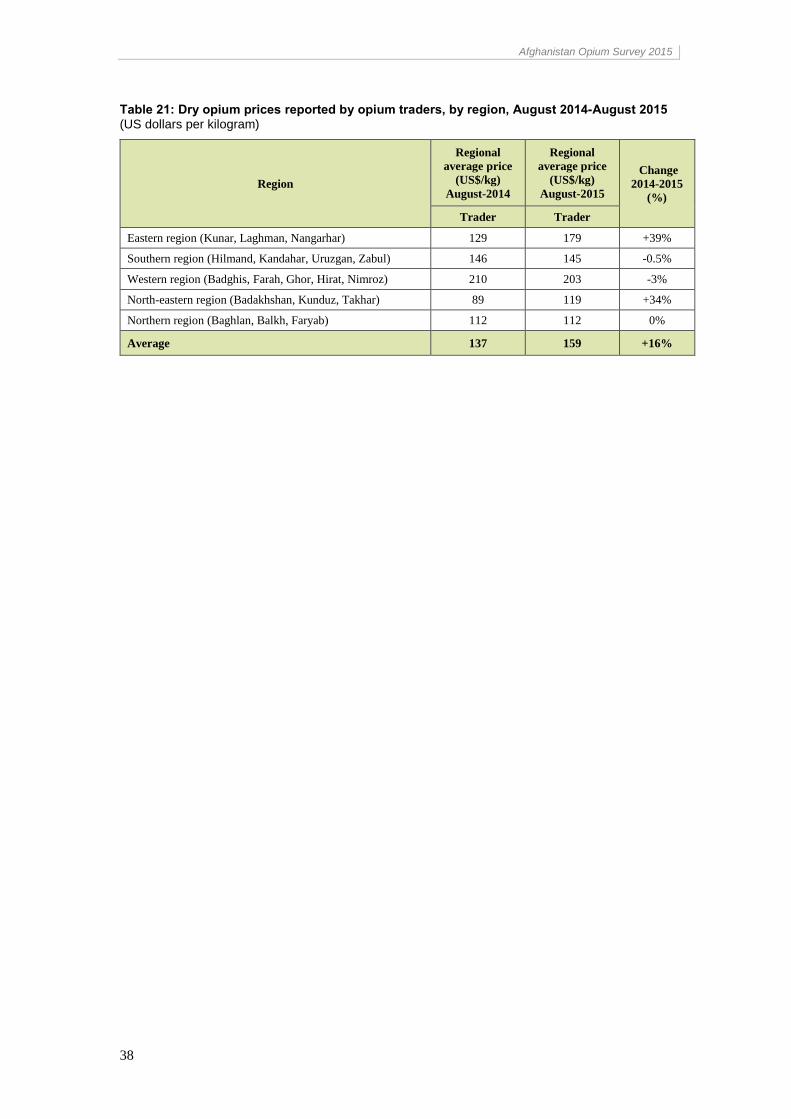
Afghanistan Opium Survey 2015
38
Table 21: Dry opium prices reported by opium traders, by region, August 2014-August 2015 (US dollars per kilogram)
Region
Regional
average price
(US$/kg)
August-2014
Regional
average price
(US$/kg)
August-2015
Change
2014-2015
(%)
Trader Trader
Eastern region (Kunar, Laghman, Nangarhar) 129 179 +39%
Southern region (Hilmand, Kandahar, Uruzgan, Zabul) 146 145 -0.5%
Western region (Badghis, Farah, Ghor, Hirat, Nimroz) 210 203 -3%
North-eastern region (Badakhshan, Kunduz, Takhar) 89 119 +34%
Northern region (Baghlan, Balkh, Faryab) 112 112 0%
Average 137 159 +16%
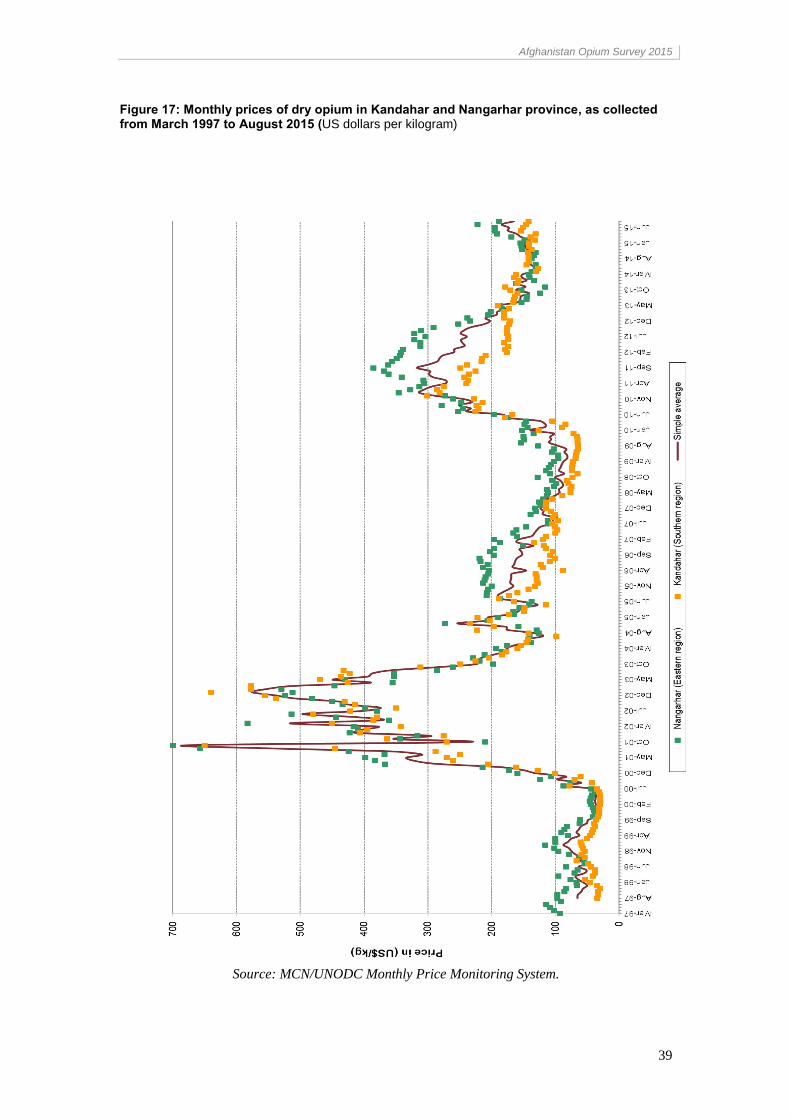
Afghanistan Opium Survey 2015
39
Figure 17: Monthly prices of dry opium in Kandahar and Nangarhar province, as collected from March 1997 to August 2015 (US dollars per kilogram)
Source: MCN/UNODC Monthly Price Monitoring System.
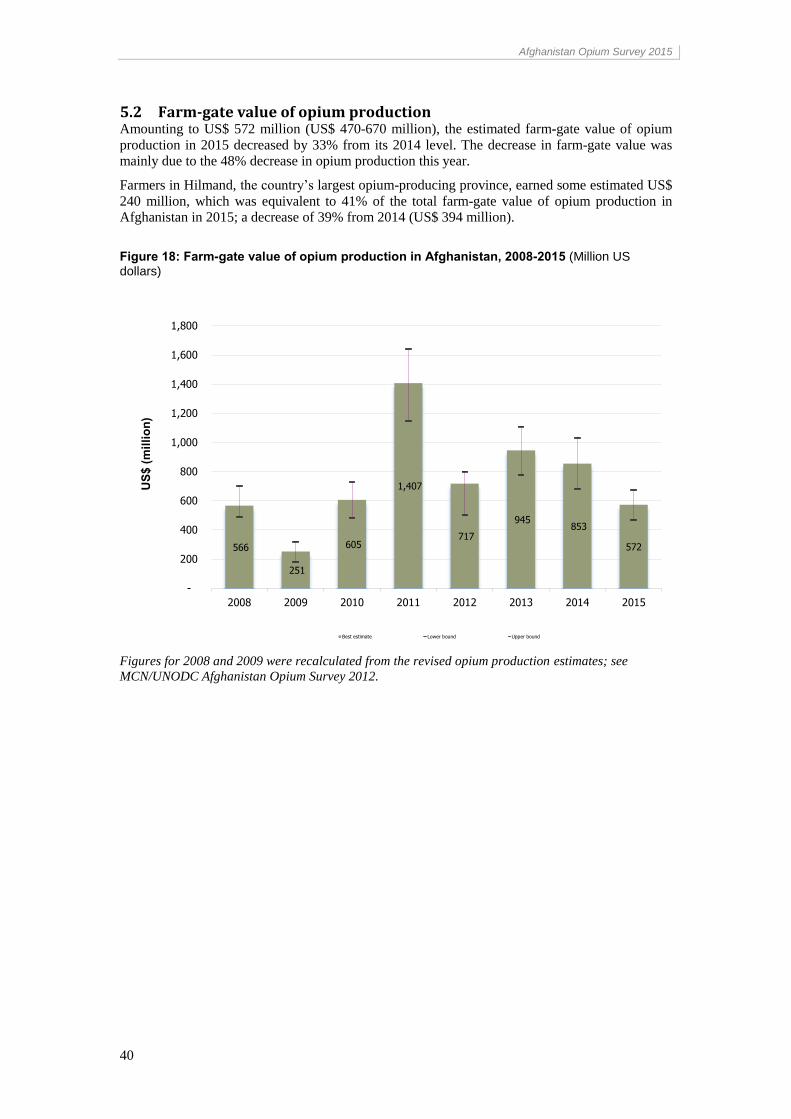
Afghanistan Opium Survey 2015
40
5.2 Farm-gate value of opium production Amounting to US$ 572 million (US$ 470-670 million), the estimated farm-gate value of opium
production in 2015 decreased by 33% from its 2014 level. The decrease in farm-gate value was
mainly due to the 48% decrease in opium production this year.
Farmers in Hilmand, the country’s largest opium-producing province, earned some estimated US$
240 million, which was equivalent to 41% of the total farm-gate value of opium production in
Afghanistan in 2015; a decrease of 39% from 2014 (US$ 394 million).
Figure 18: Farm-gate value of opium production in Afghanistan, 2008-2015 (Million US dollars)
Figures for 2008 and 2009 were recalculated from the revised opium production estimates; see
MCN/UNODC Afghanistan Opium Survey 2012.
566
251
605
1,407
717
945 853
572
-
200
400
600
800
1,000
1,200
1,400
1,600
1,800
2008 2009 2010 2011 2012 2013 2014 2015
US
$ (
mil
lio
n)
Best estimate Lower bound Upper bound
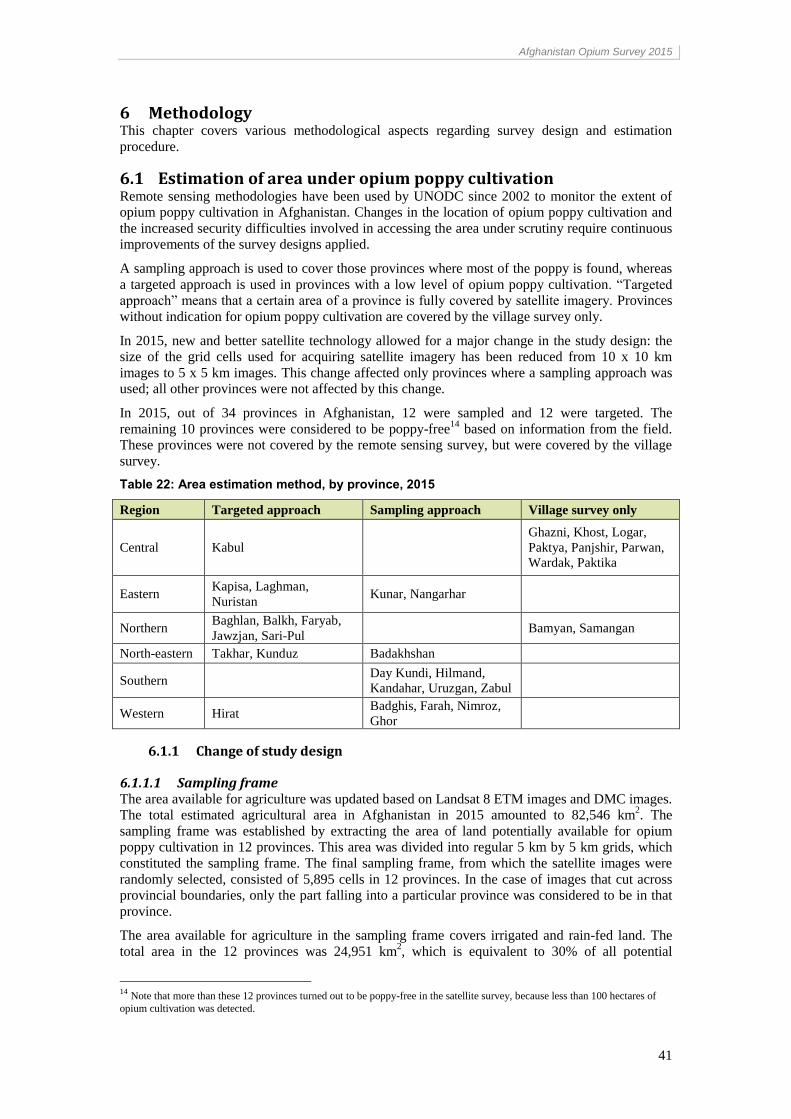
Afghanistan Opium Survey 2015
41
6 Methodology This chapter covers various methodological aspects regarding survey design and estimation
procedure.
6.1 Estimation of area under opium poppy cultivation Remote sensing methodologies have been used by UNODC since 2002 to monitor the extent of
opium poppy cultivation in Afghanistan. Changes in the location of opium poppy cultivation and
the increased security difficulties involved in accessing the area under scrutiny require continuous
improvements of the survey designs applied.
A sampling approach is used to cover those provinces where most of the poppy is found, whereas
a targeted approach is used in provinces with a low level of opium poppy cultivation. “Targeted
approach” means that a certain area of a province is fully covered by satellite imagery. Provinces
without indication for opium poppy cultivation are covered by the village survey only.
In 2015, new and better satellite technology allowed for a major change in the study design: the
size of the grid cells used for acquiring satellite imagery has been reduced from 10 x 10 km
images to 5 x 5 km images. This change affected only provinces where a sampling approach was
used; all other provinces were not affected by this change.
In 2015, out of 34 provinces in Afghanistan, 12 were sampled and 12 were targeted. The
remaining 10 provinces were considered to be poppy-free14
based on information from the field.
These provinces were not covered by the remote sensing survey, but were covered by the village
survey.
Table 22: Area estimation method, by province, 2015
Region Targeted approach Sampling approach Village survey only
Central Kabul
Ghazni, Khost, Logar,
Paktya, Panjshir, Parwan,
Wardak, Paktika
Eastern Kapisa, Laghman,
Nuristan Kunar, Nangarhar
Northern Baghlan, Balkh, Faryab,
Jawzjan, Sari-Pul Bamyan, Samangan
North-eastern Takhar, Kunduz Badakhshan
Southern Day Kundi, Hilmand,
Kandahar, Uruzgan, Zabul
Western Hirat Badghis, Farah, Nimroz,
Ghor
6.1.1 Change of study design
6.1.1.1 Sampling frame The area available for agriculture was updated based on Landsat 8 ETM images and DMC images.
The total estimated agricultural area in Afghanistan in 2015 amounted to 82,546 km2. The
sampling frame was established by extracting the area of land potentially available for opium
poppy cultivation in 12 provinces. This area was divided into regular 5 km by 5 km grids, which
constituted the sampling frame. The final sampling frame, from which the satellite images were
randomly selected, consisted of 5,895 cells in 12 provinces. In the case of images that cut across
provincial boundaries, only the part falling into a particular province was considered to be in that
province.
The area available for agriculture in the sampling frame covers irrigated and rain-fed land. The
total area in the 12 provinces was 24,951 km2, which is equivalent to 30% of all potential
14 Note that more than these 12 provinces turned out to be poppy-free in the satellite survey, because less than 100 hectares of
opium cultivation was detected.
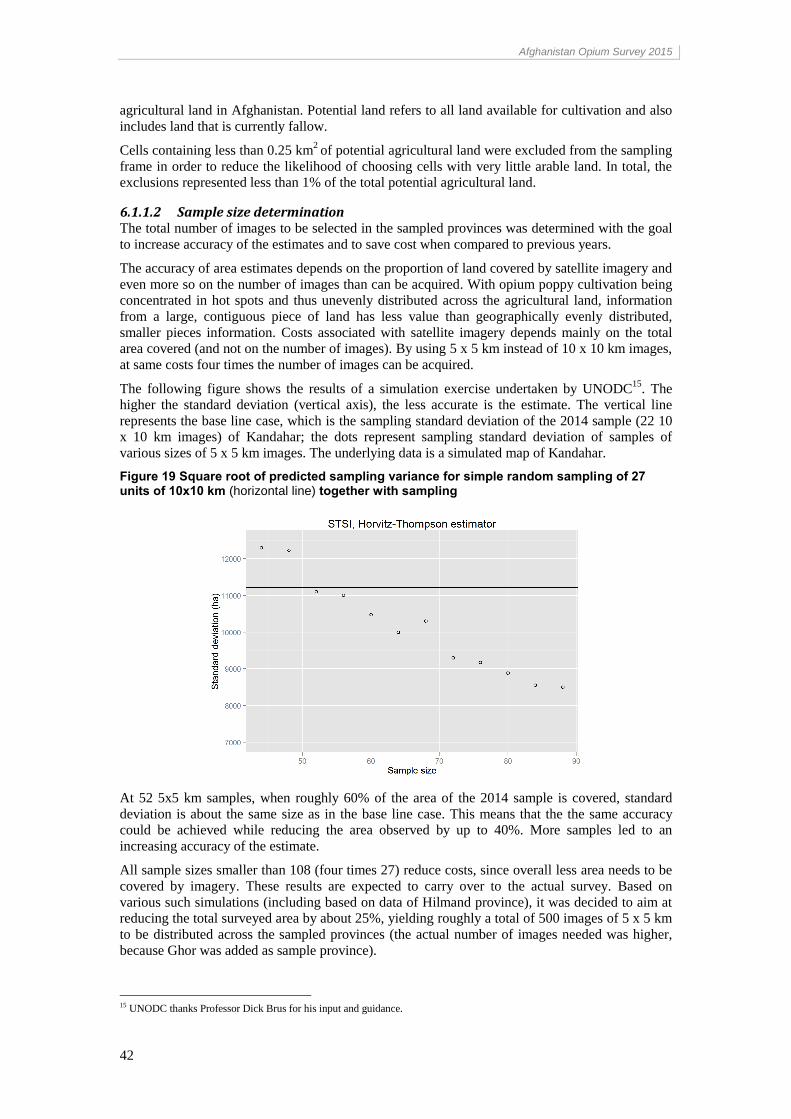
Afghanistan Opium Survey 2015
42
agricultural land in Afghanistan. Potential land refers to all land available for cultivation and also
includes land that is currently fallow.
Cells containing less than 0.25 km2
of potential agricultural land were excluded from the sampling
frame in order to reduce the likelihood of choosing cells with very little arable land. In total, the
exclusions represented less than 1% of the total potential agricultural land.
6.1.1.2 Sample size determination The total number of images to be selected in the sampled provinces was determined with the goal
to increase accuracy of the estimates and to save cost when compared to previous years.
The accuracy of area estimates depends on the proportion of land covered by satellite imagery and
even more so on the number of images than can be acquired. With opium poppy cultivation being
concentrated in hot spots and thus unevenly distributed across the agricultural land, information
from a large, contiguous piece of land has less value than geographically evenly distributed,
smaller pieces information. Costs associated with satellite imagery depends mainly on the total
area covered (and not on the number of images). By using 5 x 5 km instead of 10 x 10 km images,
at same costs four times the number of images can be acquired.
The following figure shows the results of a simulation exercise undertaken by UNODC15
. The
higher the standard deviation (vertical axis), the less accurate is the estimate. The vertical line
represents the base line case, which is the sampling standard deviation of the 2014 sample (22 10
x 10 km images) of Kandahar; the dots represent sampling standard deviation of samples of
various sizes of 5 x 5 km images. The underlying data is a simulated map of Kandahar.
Figure 19 Square root of predicted sampling variance for simple random sampling of 27 units of 10x10 km (horizontal line) together with sampling
At 52 5x5 km samples, when roughly 60% of the area of the 2014 sample is covered, standard
deviation is about the same size as in the base line case. This means that the the same accuracy
could be achieved while reducing the area observed by up to 40%. More samples led to an
increasing accuracy of the estimate.
All sample sizes smaller than 108 (four times 27) reduce costs, since overall less area needs to be
covered by imagery. These results are expected to carry over to the actual survey. Based on
various such simulations (including based on data of Hilmand province), it was decided to aim at
reducing the total surveyed area by about 25%, yielding roughly a total of 500 images of 5 x 5 km
to be distributed across the sampled provinces (the actual number of images needed was higher,
because Ghor was added as sample province).
15 UNODC thanks Professor Dick Brus for his input and guidance.
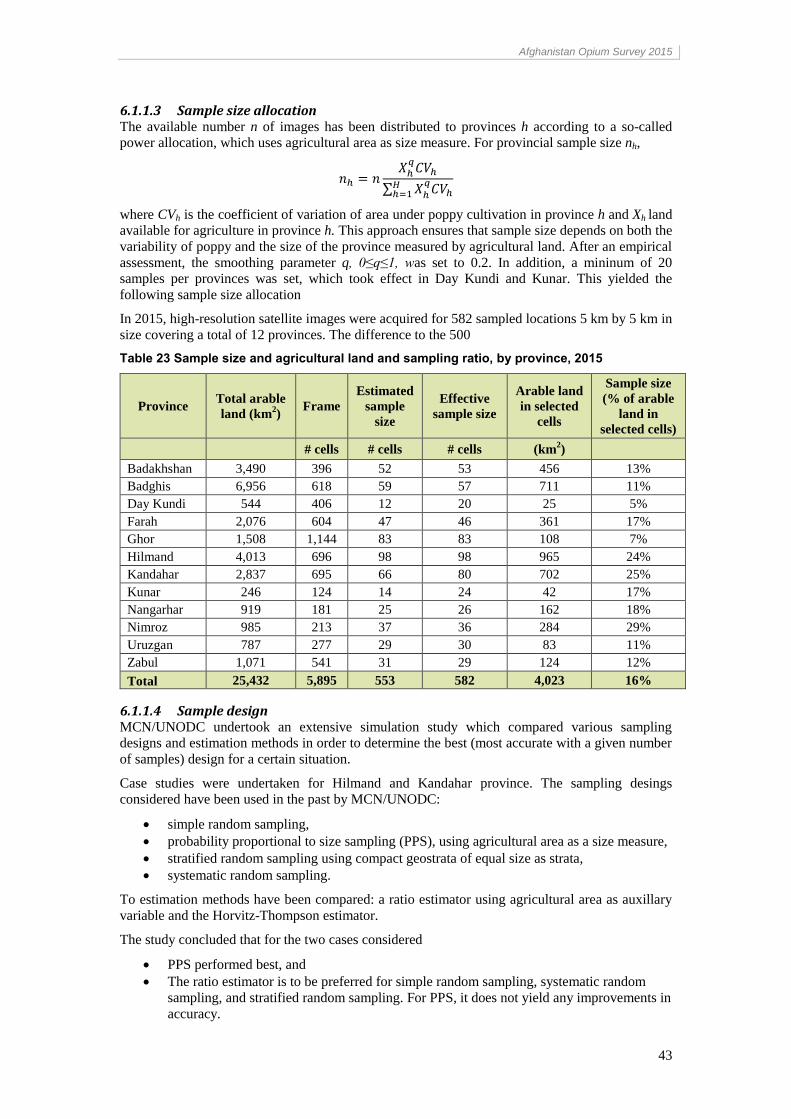
Afghanistan Opium Survey 2015
43
6.1.1.3 Sample size allocation The available number n of images has been distributed to provinces h according to a so-called
power allocation, which uses agricultural area as size measure. For provincial sample size nh,
𝑛ℎ = 𝑛𝑋ℎ
𝑞𝐶𝑉ℎ
∑ 𝑋ℎ𝑞
𝐶𝑉ℎ𝐻ℎ=1
where CVh is the coefficient of variation of area under poppy cultivation in province h and Xh land
available for agriculture in province h. This approach ensures that sample size depends on both the
variability of poppy and the size of the province measured by agricultural land. After an empirical
assessment, the smoothing parameter q, 0≤q≤1, was set to 0.2. In addition, a mininum of 20
samples per provinces was set, which took effect in Day Kundi and Kunar. This yielded the
following sample size allocation
In 2015, high-resolution satellite images were acquired for 582 sampled locations 5 km by 5 km in
size covering a total of 12 provinces. The difference to the 500
Table 23 Sample size and agricultural land and sampling ratio, by province, 2015
Province Total arable
land (km2)
Frame
Estimated
sample
size
Effective
sample size
Arable land
in selected
cells
Sample size
(% of arable
land in
selected cells)
# cells # cells # cells (km2)
Badakhshan 3,490 396 52 53 456 13%
Badghis 6,956 618 59 57 711 11%
Day Kundi 544 406 12 20 25 5%
Farah 2,076 604 47 46 361 17%
Ghor 1,508 1,144 83 83 108 7%
Hilmand 4,013 696 98 98 965 24%
Kandahar 2,837 695 66 80 702 25%
Kunar 246 124 14 24 42 17%
Nangarhar 919 181 25 26 162 18%
Nimroz 985 213 37 36 284 29%
Uruzgan 787 277 29 30 83 11%
Zabul 1,071 541 31 29 124 12%
Total 25,432 5,895 553 582 4,023 16%
6.1.1.4 Sample design MCN/UNODC undertook an extensive simulation study which compared various sampling
designs and estimation methods in order to determine the best (most accurate with a given number
of samples) design for a certain situation.
Case studies were undertaken for Hilmand and Kandahar province. The sampling desings
considered have been used in the past by MCN/UNODC:
simple random sampling,
probability proportional to size sampling (PPS), using agricultural area as a size measure,
stratified random sampling using compact geostrata of equal size as strata,
systematic random sampling.
To estimation methods have been compared: a ratio estimator using agricultural area as auxillary
variable and the Horvitz-Thompson estimator.
The study concluded that for the two cases considered
PPS performed best, and
The ratio estimator is to be preferred for simple random sampling, systematic random
sampling, and stratified random sampling. For PPS, it does not yield any improvements in
accuracy.
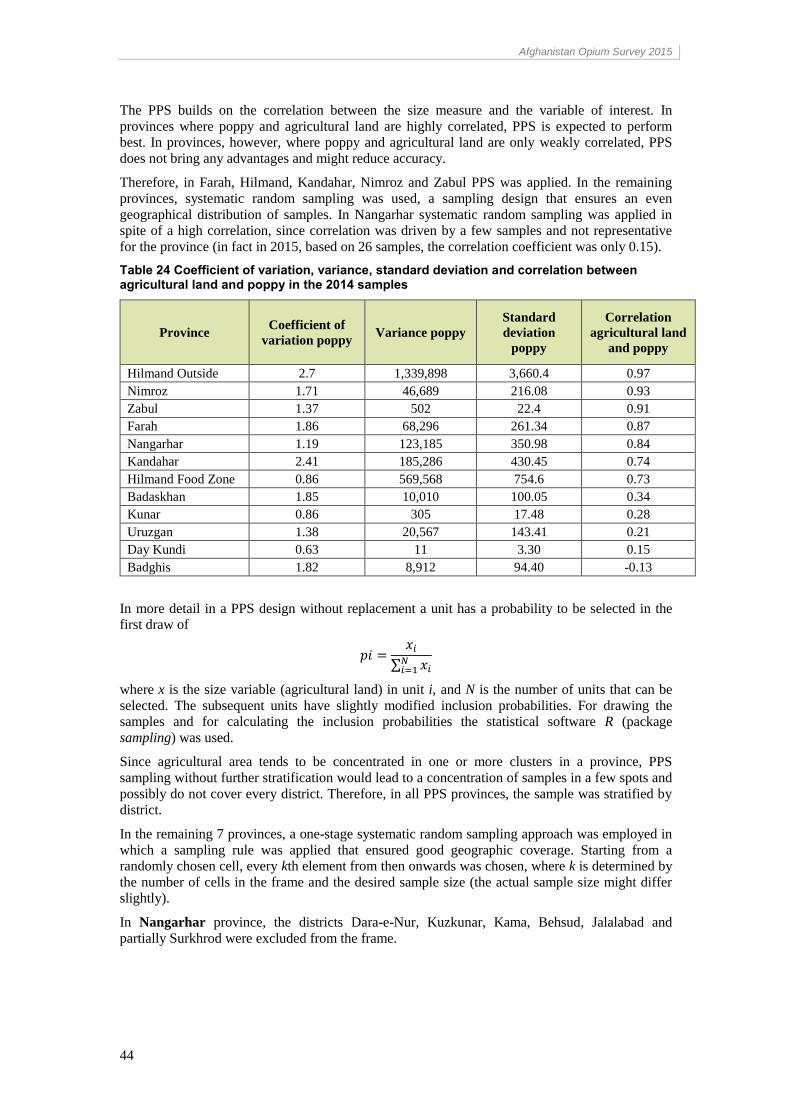
Afghanistan Opium Survey 2015
44
The PPS builds on the correlation between the size measure and the variable of interest. In
provinces where poppy and agricultural land are highly correlated, PPS is expected to perform
best. In provinces, however, where poppy and agricultural land are only weakly correlated, PPS
does not bring any advantages and might reduce accuracy.
Therefore, in Farah, Hilmand, Kandahar, Nimroz and Zabul PPS was applied. In the remaining
provinces, systematic random sampling was used, a sampling design that ensures an even
geographical distribution of samples. In Nangarhar systematic random sampling was applied in
spite of a high correlation, since correlation was driven by a few samples and not representative
for the province (in fact in 2015, based on 26 samples, the correlation coefficient was only 0.15).
Table 24 Coefficient of variation, variance, standard deviation and correlation between agricultural land and poppy in the 2014 samples
Province Coefficient of
variation poppy Variance poppy
Standard
deviation
poppy
Correlation
agricultural land
and poppy
Hilmand Outside 2.7 1,339,898 3,660.4 0.97
Nimroz 1.71 46,689 216.08 0.93
Zabul 1.37 502 22.4 0.91
Farah 1.86 68,296 261.34 0.87
Nangarhar 1.19 123,185 350.98 0.84
Kandahar 2.41 185,286 430.45 0.74
Hilmand Food Zone 0.86 569,568 754.6 0.73
Badaskhan 1.85 10,010 100.05 0.34
Kunar 0.86 305 17.48 0.28
Uruzgan 1.38 20,567 143.41 0.21
Day Kundi 0.63 11 3.30 0.15
Badghis 1.82 8,912 94.40 -0.13
In more detail in a PPS design without replacement a unit has a probability to be selected in the
first draw of
𝑝𝑖 =𝑥𝑖
∑ 𝑥𝑖𝑁𝑖=1
where x is the size variable (agricultural land) in unit i, and N is the number of units that can be
selected. The subsequent units have slightly modified inclusion probabilities. For drawing the
samples and for calculating the inclusion probabilities the statistical software R (package
sampling) was used.
Since agricultural area tends to be concentrated in one or more clusters in a province, PPS
sampling without further stratification would lead to a concentration of samples in a few spots and
possibly do not cover every district. Therefore, in all PPS provinces, the sample was stratified by
district.
In the remaining 7 provinces, a one-stage systematic random sampling approach was employed in
which a sampling rule was applied that ensured good geographic coverage. Starting from a
randomly chosen cell, every kth element from then onwards was chosen, where k is determined by
the number of cells in the frame and the desired sample size (the actual sample size might differ
slightly).
In Nangarhar province, the districts Dara-e-Nur, Kuzkunar, Kama, Behsud, Jalalabad and
partially Surkhrod were excluded from the frame.
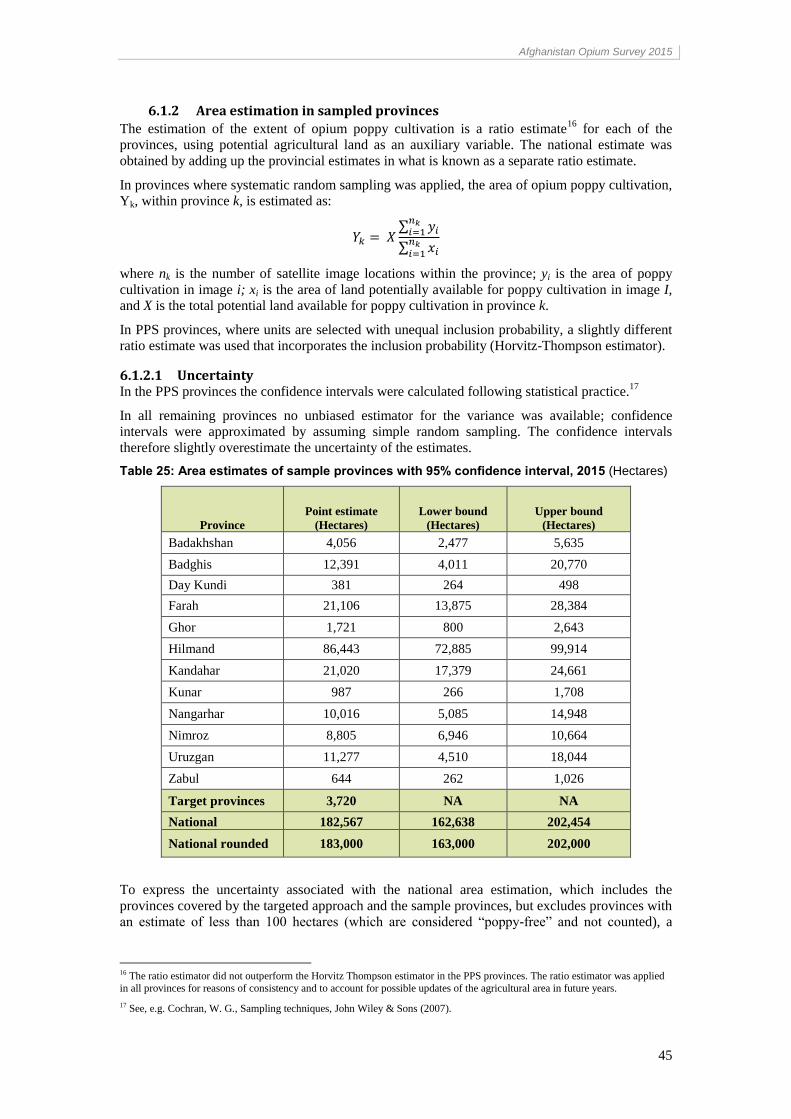
Afghanistan Opium Survey 2015
45
6.1.2 Area estimation in sampled provinces
The estimation of the extent of opium poppy cultivation is a ratio estimate16
for each of the
provinces, using potential agricultural land as an auxiliary variable. The national estimate was
obtained by adding up the provincial estimates in what is known as a separate ratio estimate.
In provinces where systematic random sampling was applied, the area of opium poppy cultivation,
Yk, within province k, is estimated as:
𝑌𝑘 = 𝑋∑ 𝑦𝑖
𝑛𝑘𝑖=1
∑ 𝑥𝑖𝑛𝑘
𝑖=1
where nk is the number of satellite image locations within the province; yi is the area of poppy
cultivation in image i; xi is the area of land potentially available for poppy cultivation in image I, and X is the total potential land available for poppy cultivation in province k.
In PPS provinces, where units are selected with unequal inclusion probability, a slightly different
ratio estimate was used that incorporates the inclusion probability (Horvitz-Thompson estimator).
6.1.2.1 Uncertainty In the PPS provinces the confidence intervals were calculated following statistical practice.
17
In all remaining provinces no unbiased estimator for the variance was available; confidence
intervals were approximated by assuming simple random sampling. The confidence intervals
therefore slightly overestimate the uncertainty of the estimates.
Table 25: Area estimates of sample provinces with 95% confidence interval, 2015 (Hectares)
Province
Point estimate
(Hectares)
Lower bound
(Hectares)
Upper bound
(Hectares)
Badakhshan 4,056 2,477 5,635
Badghis 12,391 4,011 20,770
Day Kundi 381 264 498
Farah 21,106 13,875 28,384
Ghor 1,721 800 2,643
Hilmand 86,443 72,885 99,914
Kandahar 21,020 17,379 24,661
Kunar 987 266 1,708
Nangarhar 10,016 5,085 14,948
Nimroz 8,805 6,946 10,664
Uruzgan 11,277 4,510 18,044
Zabul 644 262 1,026
Target provinces 3,720 NA NA
National 182,567 162,638 202,454
National rounded 183,000 163,000 202,000
To express the uncertainty associated with the national area estimation, which includes the
provinces covered by the targeted approach and the sample provinces, but excludes provinces with
an estimate of less than 100 hectares (which are considered “poppy-free” and not counted), a
16 The ratio estimator did not outperform the Horvitz Thompson estimator in the PPS provinces. The ratio estimator was applied
in all provinces for reasons of consistency and to account for possible updates of the agricultural area in future years.
17 See, e.g. Cochran, W. G., Sampling techniques, John Wiley & Sons (2007).
Afghanistan Opium Survey 2015
46
range was calculated by adding the poppy area figures of the target provinces to the upper and
lower limits of the 95% confidence interval at the national level.
6.1.3 Area estimation in target provinces
The consensus view of those working in Afghanistan was that the MCN/UNODC surveillance
system developed in the provinces can identify sites where poppy was grown, with further inputs
being obtained from the survey of village headmen. Fieldworkers visited potential poppy-growing
sites to confirm the situation and provided GPS references for the sites. If geographical clusters of
sites were identified, targeted satellite images were obtained to measure the areas involved. The
total poppy area of a target province is equal to the poppy area measured on the imagery without
any further calculation. For a list of provinces for which the target approach was used see Table 4.
In provinces where satellite images were targeted, the estimated area under opium poppy
cultivation is not affected by sampling errors, although they may be affected by the omission of
areas with very little cultivation. Area estimates of target provinces should therefore be considered
as a minimum estimate.
6.1.4 District level estimation
District level results are indicative only. For district level estimation all cells are used which have
the majority of agricultural area in that district. That means that in certain cases, agricultural area
and poppy cultivation is accounted for in a neighbouring district and not within the district where
cultivation occurred. This is, however, in most cases set off by those cells, where the contrary is
the case.
6.1.5 Accuracy assessment
Due to the difficult security situation in many parts of Afghanistan, which prevented surveyors
from carrying GPS and mapping equipment, an insufficient number of ground segments could be
visited in order to conduct a systematic accuracy assessment.
6.1.6 Estimation of the net cultivation area
The area figure presented is the net harvestable opium poppy cultivation area. The effect of poppy
eradication activities was taken into account based on data from the eradication verification
survey, which provides exact GPS coordinates of all eradicated fields supplemented with
additional information. The gross cultivation areas would be the net cultivation plus eradication.
In provinces where the poppy area is estimated with a sampling approach, the first step is to
calculate the gross poppy cultivation area. The total area eradicated in those provinces is then
deducted from the mid-point estimate of the provincial cultivation estimate to obtain the net
cultivation area. If eradication activities were carried out after the date of the image acquisition, no
adjustment is necessary as the poppy present in the image reflects the gross poppy area. If
eradication activities were carried out in a sample block before the date of the image acquisition,
the area interpreted as poppy would not reflect the gross area. Therefore, the eradicated fields are
added to the interpreted fields. The adjusted poppy area figure for the block is then used for the
provincial estimate.
In provinces where the poppy areas is estimated with a targeted approach (census), eradication
activities that happened before the date of the image acquisition are already reflected, as these
fields no longer appear as poppy in the image. Fields that were eradicated after the date of the
images acquisition are simply deleted.
6.2 Possible impact of the change of study design
Caution is needed when interpreting the extent of change in area under cultivation: Between 2014
and 2015, the availability of improved technology allowed MCN/UNODC to acquire satellite
imagery at much more locations than in the years before. This has led to a much better
geographical coverage by satellite imagery of provinces where a sample approach is used for area
estimation. With the greater number of images and the better coverage, estimates are of higher
accuracy.
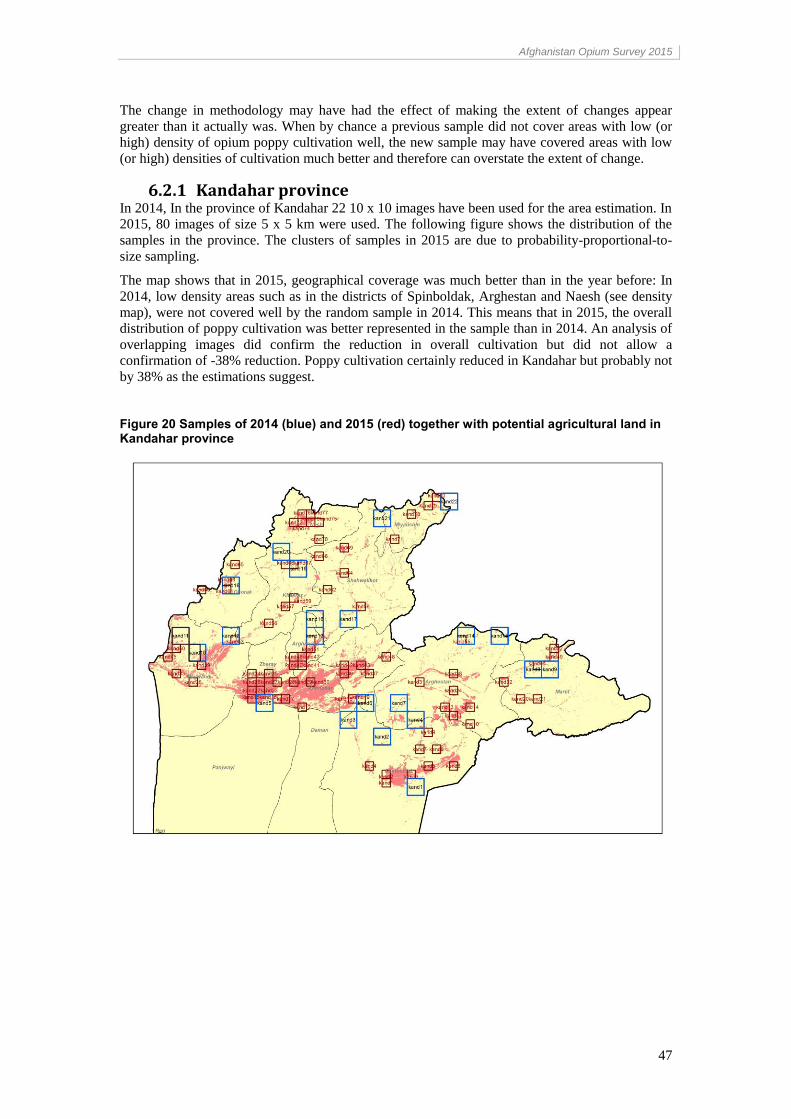
Afghanistan Opium Survey 2015
47
The change in methodology may have had the effect of making the extent of changes appear
greater than it actually was. When by chance a previous sample did not cover areas with low (or
high) density of opium poppy cultivation well, the new sample may have covered areas with low
(or high) densities of cultivation much better and therefore can overstate the extent of change.
6.2.1 Kandahar province In 2014, In the province of Kandahar 22 10 x 10 images have been used for the area estimation. In
2015, 80 images of size 5 x 5 km were used. The following figure shows the distribution of the
samples in the province. The clusters of samples in 2015 are due to probability-proportional-to-
size sampling.
The map shows that in 2015, geographical coverage was much better than in the year before: In
2014, low density areas such as in the districts of Spinboldak, Arghestan and Naesh (see density
map), were not covered well by the random sample in 2014. This means that in 2015, the overall
distribution of poppy cultivation was better represented in the sample than in 2014. An analysis of
overlapping images did confirm the reduction in overall cultivation but did not allow a
confirmation of -38% reduction. Poppy cultivation certainly reduced in Kandahar but probably not
by 38% as the estimations suggest.
Figure 20 Samples of 2014 (blue) and 2015 (red) together with potential agricultural land in Kandahar province
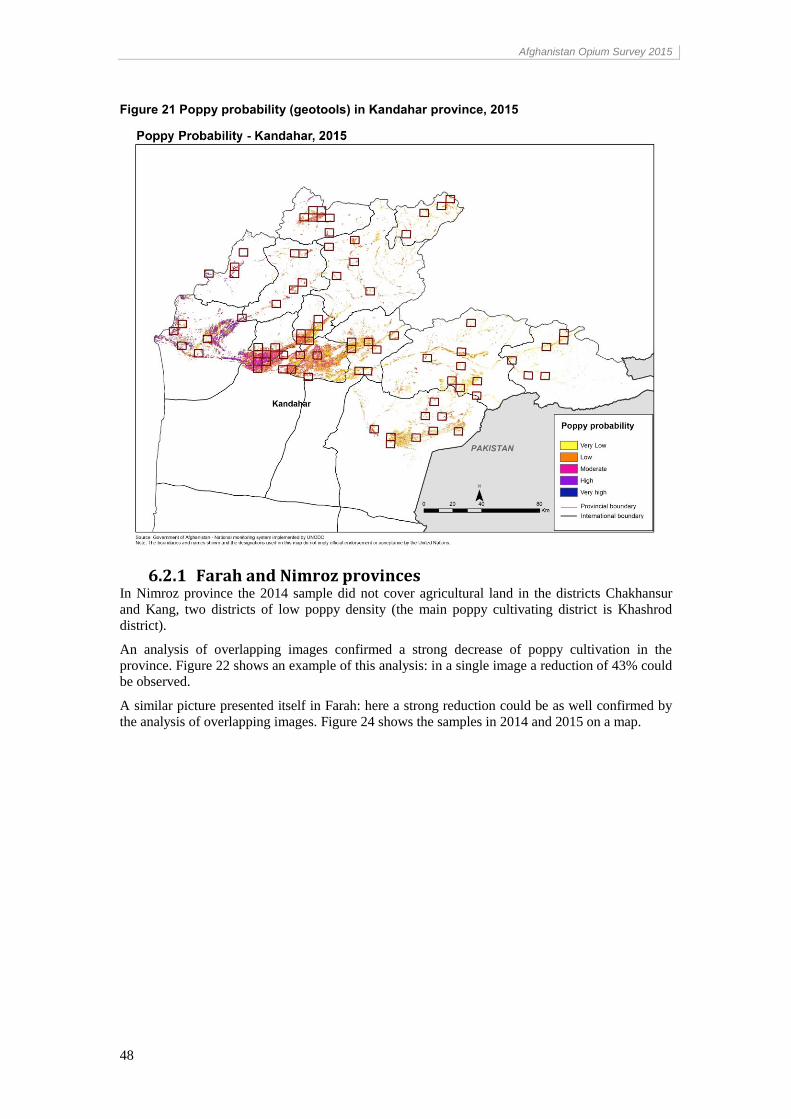
Afghanistan Opium Survey 2015
48
Figure 21 Poppy probability (geotools) in Kandahar province, 2015
6.2.1 Farah and Nimroz provinces In Nimroz province the 2014 sample did not cover agricultural land in the districts Chakhansur
and Kang, two districts of low poppy density (the main poppy cultivating district is Khashrod
district).
An analysis of overlapping images confirmed a strong decrease of poppy cultivation in the
province. Figure 22 shows an example of this analysis: in a single image a reduction of 43% could
be observed.
A similar picture presented itself in Farah: here a strong reduction could be as well confirmed by
the analysis of overlapping images. Figure 24 shows the samples in 2014 and 2015 on a map.
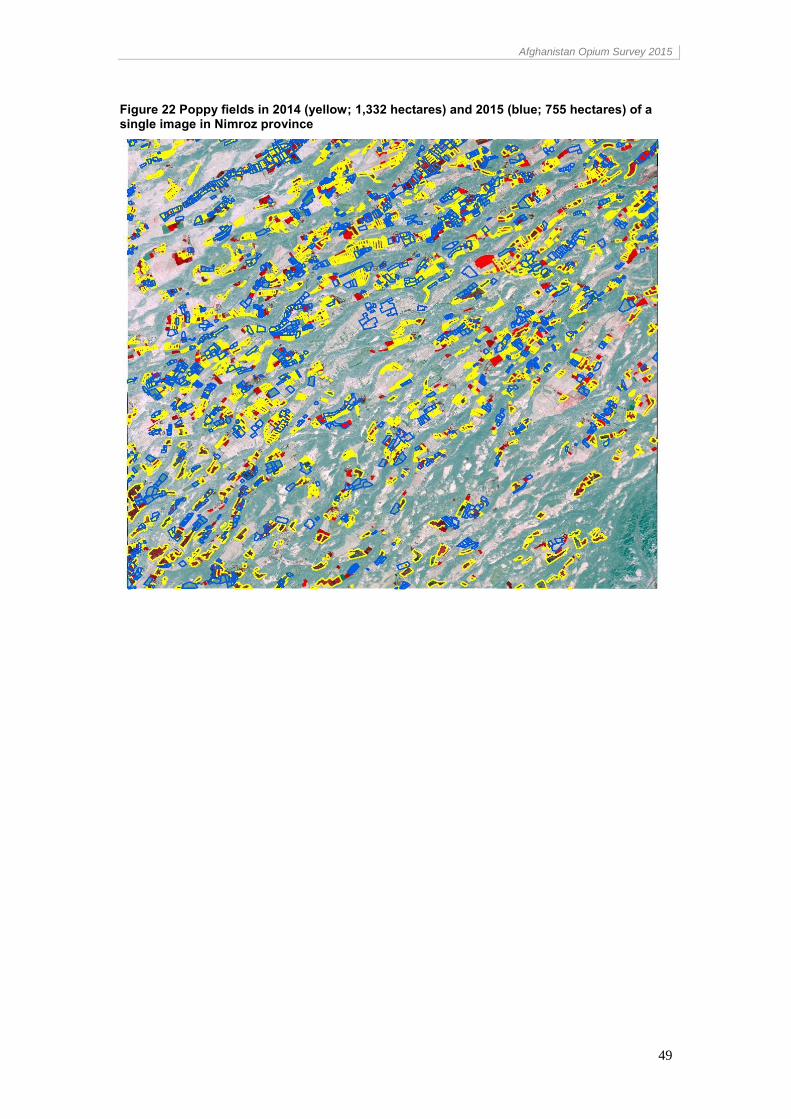
Afghanistan Opium Survey 2015
49
Figure 22 Poppy fields in 2014 (yellow; 1,332 hectares) and 2015 (blue; 755 hectares) of a single image in Nimroz province
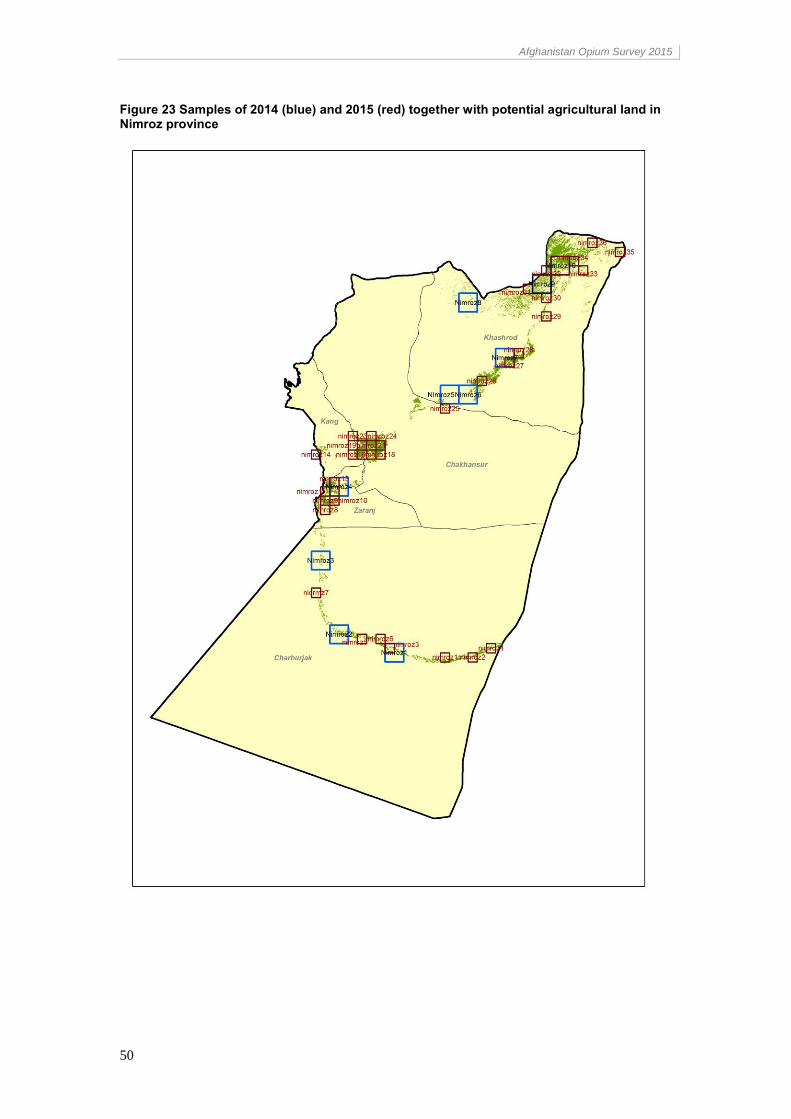
Afghanistan Opium Survey 2015
50
Figure 23 Samples of 2014 (blue) and 2015 (red) together with potential agricultural land in Nimroz province
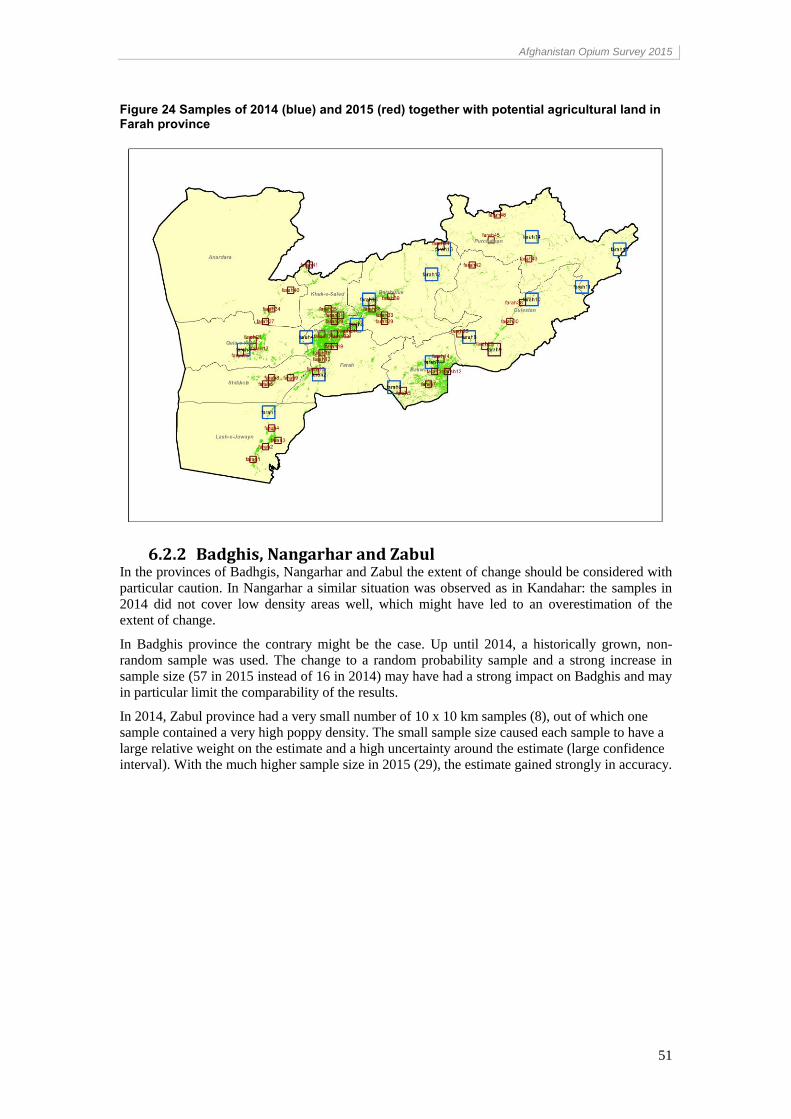
Afghanistan Opium Survey 2015
51
Figure 24 Samples of 2014 (blue) and 2015 (red) together with potential agricultural land in Farah province
6.2.2 Badghis, Nangarhar and Zabul In the provinces of Badhgis, Nangarhar and Zabul the extent of change should be considered with
particular caution. In Nangarhar a similar situation was observed as in Kandahar: the samples in
2014 did not cover low density areas well, which might have led to an overestimation of the
extent of change.
In Badghis province the contrary might be the case. Up until 2014, a historically grown, non-
random sample was used. The change to a random probability sample and a strong increase in
sample size (57 in 2015 instead of 16 in 2014) may have had a strong impact on Badghis and may
in particular limit the comparability of the results.
In 2014, Zabul province had a very small number of 10 x 10 km samples (8), out of which one
sample contained a very high poppy density. The small sample size caused each sample to have a
large relative weight on the estimate and a high uncertainty around the estimate (large confidence
interval). With the much higher sample size in 2015 (29), the estimate gained strongly in accuracy.
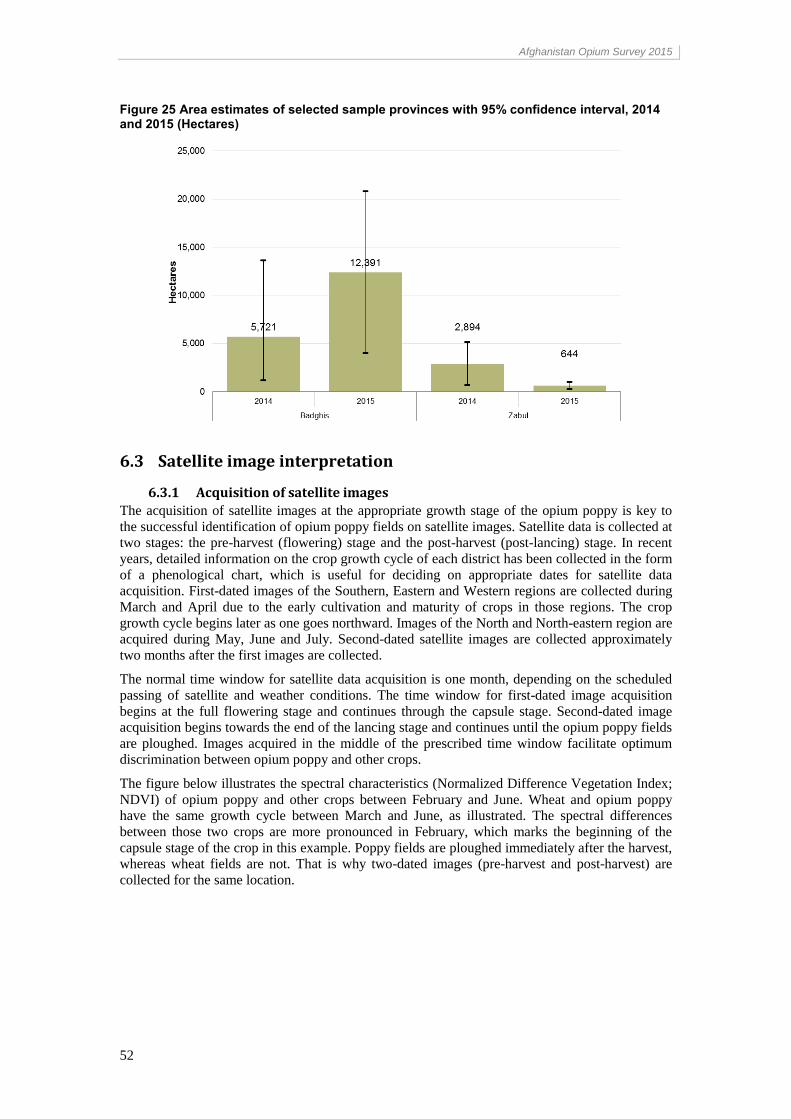
Afghanistan Opium Survey 2015
52
Figure 25 Area estimates of selected sample provinces with 95% confidence interval, 2014 and 2015 (Hectares)
6.3 Satellite image interpretation
6.3.1 Acquisition of satellite images
The acquisition of satellite images at the appropriate growth stage of the opium poppy is key to
the successful identification of opium poppy fields on satellite images. Satellite data is collected at
two stages: the pre-harvest (flowering) stage and the post-harvest (post-lancing) stage. In recent
years, detailed information on the crop growth cycle of each district has been collected in the form
of a phenological chart, which is useful for deciding on appropriate dates for satellite data
acquisition. First-dated images of the Southern, Eastern and Western regions are collected during
March and April due to the early cultivation and maturity of crops in those regions. The crop
growth cycle begins later as one goes northward. Images of the North and North-eastern region are
acquired during May, June and July. Second-dated satellite images are collected approximately
two months after the first images are collected.
The normal time window for satellite data acquisition is one month, depending on the scheduled
passing of satellite and weather conditions. The time window for first-dated image acquisition
begins at the full flowering stage and continues through the capsule stage. Second-dated image
acquisition begins towards the end of the lancing stage and continues until the opium poppy fields
are ploughed. Images acquired in the middle of the prescribed time window facilitate optimum
discrimination between opium poppy and other crops.
The figure below illustrates the spectral characteristics (Normalized Difference Vegetation Index;
NDVI) of opium poppy and other crops between February and June. Wheat and opium poppy
have the same growth cycle between March and June, as illustrated. The spectral differences
between those two crops are more pronounced in February, which marks the beginning of the
capsule stage of the crop in this example. Poppy fields are ploughed immediately after the harvest,
whereas wheat fields are not. That is why two-dated images (pre-harvest and post-harvest) are
collected for the same location.
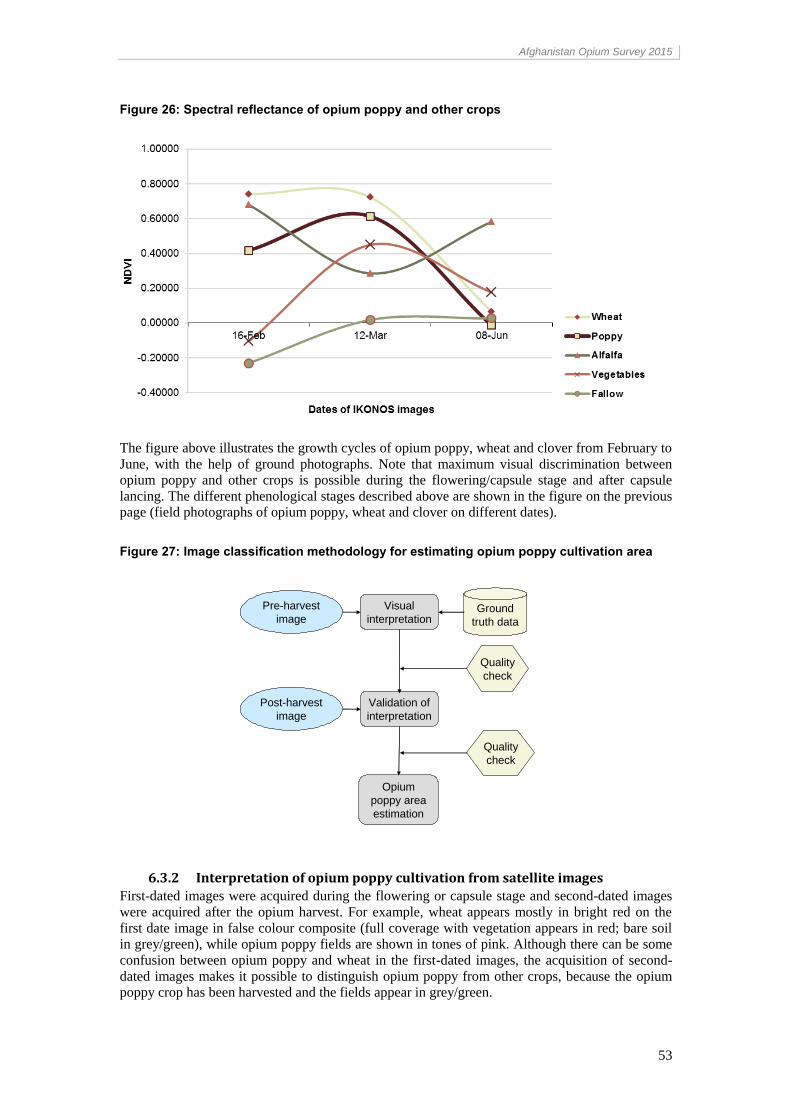
Afghanistan Opium Survey 2015
53
Figure 26: Spectral reflectance of opium poppy and other crops
The figure above illustrates the growth cycles of opium poppy, wheat and clover from February to
June, with the help of ground photographs. Note that maximum visual discrimination between
opium poppy and other crops is possible during the flowering/capsule stage and after capsule
lancing. The different phenological stages described above are shown in the figure on the previous
page (field photographs of opium poppy, wheat and clover on different dates).
Figure 27: Image classification methodology for estimating opium poppy cultivation area
6.3.2 Interpretation of opium poppy cultivation from satellite images
First-dated images were acquired during the flowering or capsule stage and second-dated images
were acquired after the opium harvest. For example, wheat appears mostly in bright red on the
first date image in false colour composite (full coverage with vegetation appears in red; bare soil
in grey/green), while opium poppy fields are shown in tones of pink. Although there can be some
confusion between opium poppy and wheat in the first-dated images, the acquisition of second-
dated images makes it possible to distinguish opium poppy from other crops, because the opium poppy crop has been harvested and the fields appear in grey/green.
Pre-harvest
imageGround
truth data
Visual
interpretation
Post-harvest
image
Validation of
interpretation
Opium
poppy area
estimation
Quality
check
Quality
check
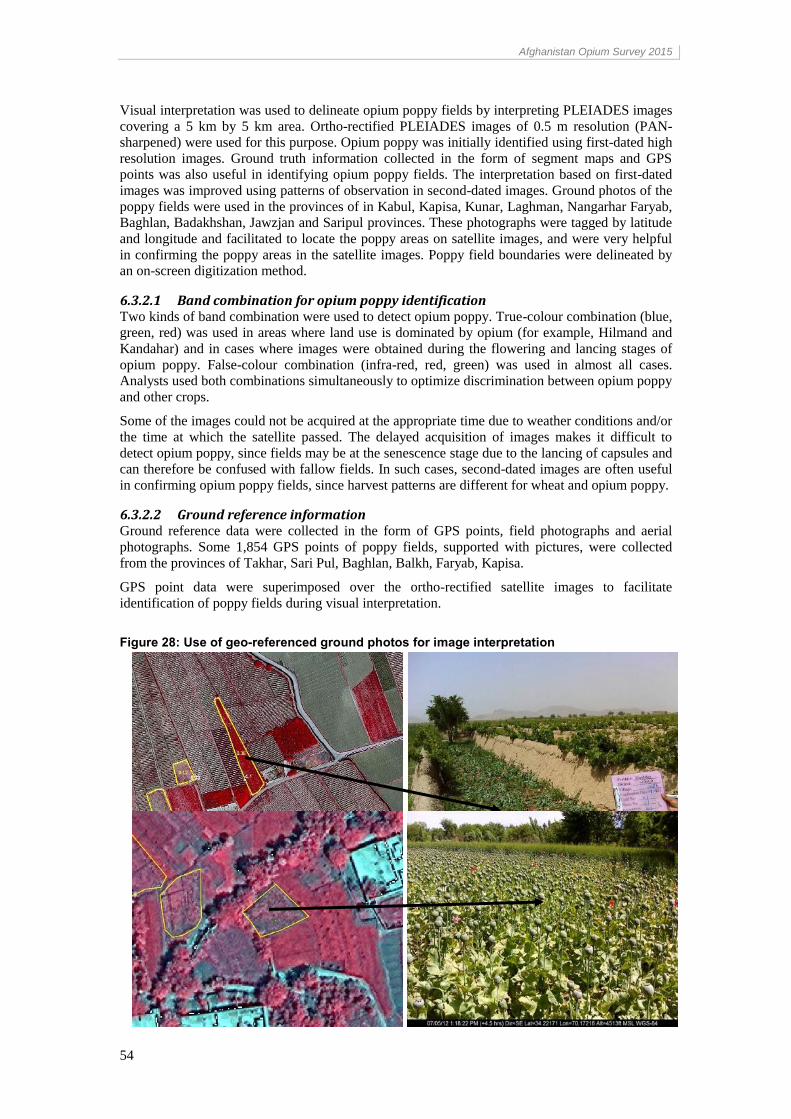
Afghanistan Opium Survey 2015
54
Visual interpretation was used to delineate opium poppy fields by interpreting PLEIADES images
covering a 5 km by 5 km area. Ortho-rectified PLEIADES images of 0.5 m resolution (PAN-
sharpened) were used for this purpose. Opium poppy was initially identified using first-dated high
resolution images. Ground truth information collected in the form of segment maps and GPS
points was also useful in identifying opium poppy fields. The interpretation based on first-dated
images was improved using patterns of observation in second-dated images. Ground photos of the
poppy fields were used in the provinces of in Kabul, Kapisa, Kunar, Laghman, Nangarhar Faryab,
Baghlan, Badakhshan, Jawzjan and Saripul provinces. These photographs were tagged by latitude
and longitude and facilitated to locate the poppy areas on satellite images, and were very helpful
in confirming the poppy areas in the satellite images. Poppy field boundaries were delineated by
an on-screen digitization method.
6.3.2.1 Band combination for opium poppy identification Two kinds of band combination were used to detect opium poppy. True-colour combination (blue,
green, red) was used in areas where land use is dominated by opium (for example, Hilmand and
Kandahar) and in cases where images were obtained during the flowering and lancing stages of
opium poppy. False-colour combination (infra-red, red, green) was used in almost all cases.
Analysts used both combinations simultaneously to optimize discrimination between opium poppy
and other crops.
Some of the images could not be acquired at the appropriate time due to weather conditions and/or
the time at which the satellite passed. The delayed acquisition of images makes it difficult to
detect opium poppy, since fields may be at the senescence stage due to the lancing of capsules and
can therefore be confused with fallow fields. In such cases, second-dated images are often useful
in confirming opium poppy fields, since harvest patterns are different for wheat and opium poppy.
6.3.2.2 Ground reference information Ground reference data were collected in the form of GPS points, field photographs and aerial
photographs. Some 1,854 GPS points of poppy fields, supported with pictures, were collected
from the provinces of Takhar, Sari Pul, Baghlan, Balkh, Faryab, Kapisa.
GPS point data were superimposed over the ortho-rectified satellite images to facilitate
identification of poppy fields during visual interpretation.
Figure 28: Use of geo-referenced ground photos for image interpretation
Satellite image (infra-red) Field photograph (natural colour)
Satellite image (infra-red) Field photograph (natural colour)
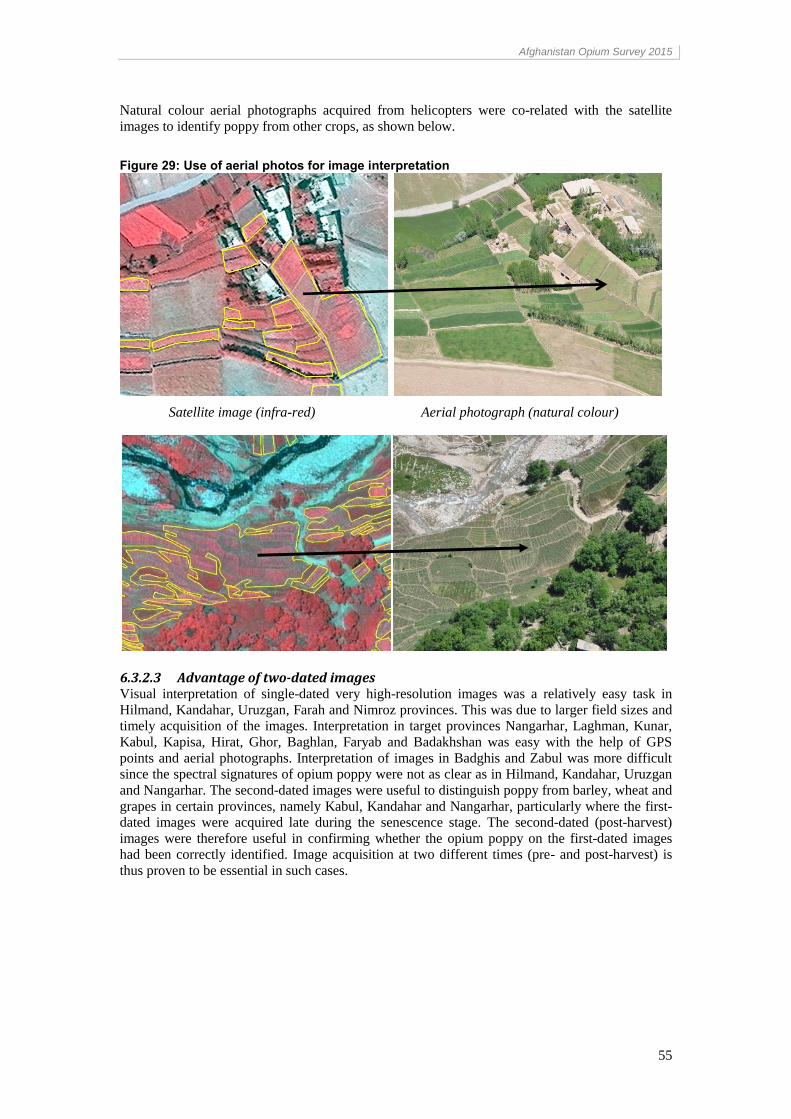
Afghanistan Opium Survey 2015
55
Natural colour aerial photographs acquired from helicopters were co-related with the satellite
images to identify poppy from other crops, as shown below.
Figure 29: Use of aerial photos for image interpretation
Satellite image (infra-red) Aerial photograph (natural colour)
Satellite image (infra-red) Aerial photograph (natural colour)
6.3.2.3 Advantage of two-dated images Visual interpretation of single-dated very high-resolution images was a relatively easy task in
Hilmand, Kandahar, Uruzgan, Farah and Nimroz provinces. This was due to larger field sizes and
timely acquisition of the images. Interpretation in target provinces Nangarhar, Laghman, Kunar,
Kabul, Kapisa, Hirat, Ghor, Baghlan, Faryab and Badakhshan was easy with the help of GPS
points and aerial photographs. Interpretation of images in Badghis and Zabul was more difficult
since the spectral signatures of opium poppy were not as clear as in Hilmand, Kandahar, Uruzgan
and Nangarhar. The second-dated images were useful to distinguish poppy from barley, wheat and
grapes in certain provinces, namely Kabul, Kandahar and Nangarhar, particularly where the first-
dated images were acquired late during the senescence stage. The second-dated (post-harvest)
images were therefore useful in confirming whether the opium poppy on the first-dated images
had been correctly identified. Image acquisition at two different times (pre- and post-harvest) is
thus proven to be essential in such cases.
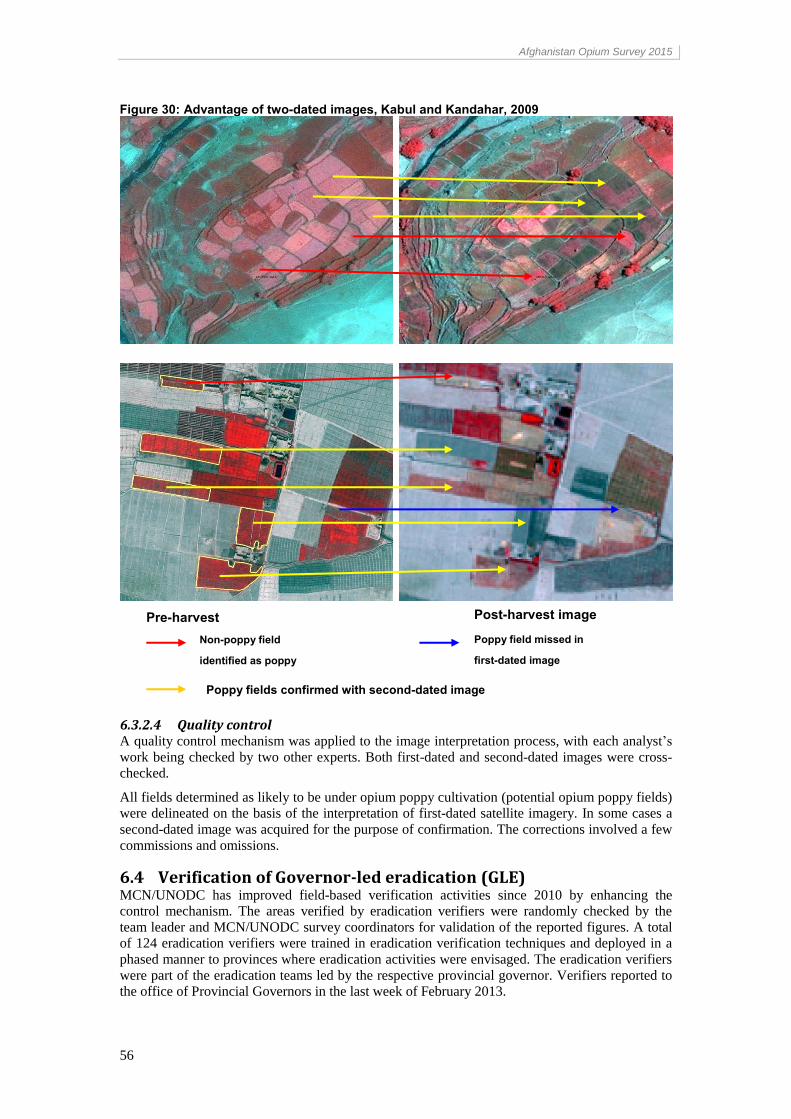
Afghanistan Opium Survey 2015
56
Figure 30: Advantage of two-dated images, Kabul and Kandahar, 2009
6.3.2.4 Quality control A quality control mechanism was applied to the image interpretation process, with each analyst’s
work being checked by two other experts. Both first-dated and second-dated images were cross-
checked.
All fields determined as likely to be under opium poppy cultivation (potential opium poppy fields)
were delineated on the basis of the interpretation of first-dated satellite imagery. In some cases a
second-dated image was acquired for the purpose of confirmation. The corrections involved a few
commissions and omissions.
6.4 Verification of Governor-led eradication (GLE) MCN/UNODC has improved field-based verification activities since 2010 by enhancing the
control mechanism. The areas verified by eradication verifiers were randomly checked by the
team leader and MCN/UNODC survey coordinators for validation of the reported figures. A total
of 124 eradication verifiers were trained in eradication verification techniques and deployed in a
phased manner to provinces where eradication activities were envisaged. The eradication verifiers
were part of the eradication teams led by the respective provincial governor. Verifiers reported to the office of Provincial Governors in the last week of February 2013.
Pre-harvest image
Post-harvest image
Non-poppy field
identified as poppy
Poppy field missed in
first-dated image
Poppy fields confirmed with second-dated image
Afghanistan Opium Survey 2015
57
Verification methodology for GLE:
Eradication verifiers were part of the Governor-led eradication teams.
The verifiers took measurements of each eradicated field by their pace length, converted
them into metres and calculated the area in jerib (1 jerib=2000 m2), collected field
coordinates using new GPS cameras and took photographs.
The verifiers drew sketch maps of each field as a reference for area calculations.
The verification-reporting officers in Kabul obtained the provisional data from the
verifiers by telephone (mobile/satellite phones) and updated the database on a daily basis.
The verifiers filled in hardcopy survey forms and submitted them to UNODC regional
offices. The forms were then sent to the Kabul office for data entry. Quality control was
undertaken by MCN/UNODC survey coordinators at the regional level. Eradicated fields
were revisited randomly by team leaders and MCN/UNODC survey coordinators to check
the accuracy of the reports. Further validation of the results was done using data obtained
through helicopter flights, as well as from satellite imagery, to calculate the final area of
eradicated poppy fields wherever possible.
In Hilmand province, the area calculations of the eradicated poppy fields was facilitated
by calculating the area of fields automatically using a standard template in Excel file, thus
avoiding manual calculation errors at the field level.
MCN/UNODC published periodical reports on a weekly basis to inform stakeholders of
eradication activities. The eradication figures provided in these reports were considered
provisional until they were finalized based on field checks and/or checks based on the
satellite image interpretation.
6.5 Opium yield and production
6.5.1 Estimating opium yield
The relationship between poppy capsule volume per square metre and dry opium yield is used to
estimate opium production.18
It takes the form of a non-rectangular hyperbola.
Non-rectangular hyperbola formula for opium yield as function of capsule volume:
Y = [(VC + 1495) – ((VC + 1495)2 – 395.259 VC)
0.5] / 1.795
where
Y = Dry opium gum yield (kg/ha), and
VC = Mature capsule volume (cm3/m
2).
In the yield survey, data on the number of yield capsules per plot and capsule volume are
collected. The survey follows the procedure established in the UNODC Guidelines for Yield
Assessment.
An imaginary transect was drawn on each surveyed field, along which three one-metre square
plots were selected. In each plot, the number of flower buds, flowers, immature capsules and
mature capsules that were expected to yield opium were counted, and the diameter and height of
10 to 15 opium-yielding capsules were measured with a calliper. The capsule volume per square
metre was calculated with these data and entered into the formula for the yield calculation. Each
plot thus provided one yield observation. The simple average of the three plots in a field is the
field yield. The simple average of all fields in a region is the regional yield. A range was
calculated to express the uncertainty of the yield estimate due to sampling with the 95%
confidence interval.
18
UNODC Guidelines for yield assessment of opium gum and coca leaf from brief field visits, UN New York, 2001,
ST/NAR/33. See also UNODC (2003): Limited opium yield assessment surveys. Technical report: Observations and findings.
Guidance for future activities. In: Scientific and Technical Notes, SCITEC/19, December 2003.
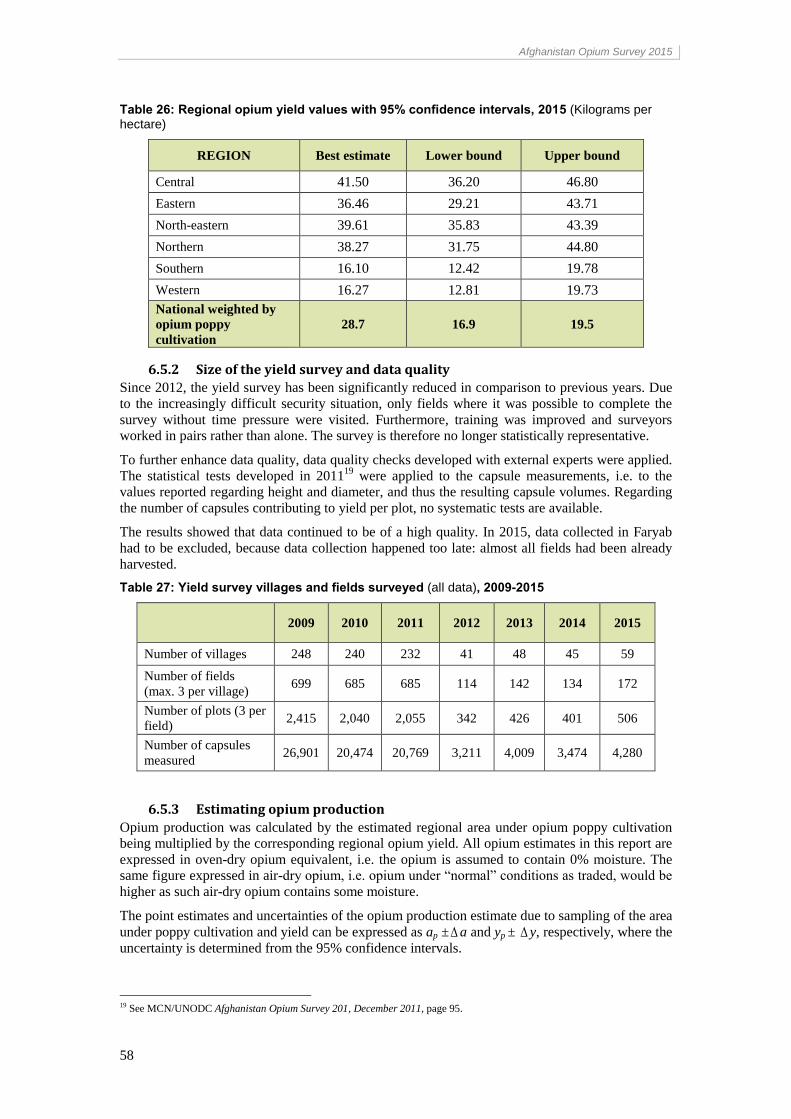
Afghanistan Opium Survey 2015
58
Table 26: Regional opium yield values with 95% confidence intervals, 2015 (Kilograms per hectare)
REGION Best estimate Lower bound Upper bound
Central 41.50 36.20 46.80
Eastern 36.46 29.21 43.71
North-eastern 39.61 35.83 43.39
Northern 38.27 31.75 44.80
Southern 16.10 12.42 19.78
Western 16.27 12.81 19.73
National weighted by
opium poppy
cultivation
28.7 16.9 19.5
6.5.2 Size of the yield survey and data quality
Since 2012, the yield survey has been significantly reduced in comparison to previous years. Due
to the increasingly difficult security situation, only fields where it was possible to complete the
survey without time pressure were visited. Furthermore, training was improved and surveyors
worked in pairs rather than alone. The survey is therefore no longer statistically representative.
To further enhance data quality, data quality checks developed with external experts were applied.
The statistical tests developed in 201119
were applied to the capsule measurements, i.e. to the
values reported regarding height and diameter, and thus the resulting capsule volumes. Regarding
the number of capsules contributing to yield per plot, no systematic tests are available.
The results showed that data continued to be of a high quality. In 2015, data collected in Faryab
had to be excluded, because data collection happened too late: almost all fields had been already
harvested.
Table 27: Yield survey villages and fields surveyed (all data), 2009-2015
2009 2010 2011 2012 2013 2014 2015
Number of villages 248 240 232 41 48 45 59
Number of fields
(max. 3 per village) 699 685 685 114 142 134 172
Number of plots (3 per
field) 2,415 2,040 2,055 342 426 401 506
Number of capsules
measured 26,901 20,474 20,769 3,211 4,009 3,474 4,280
6.5.3 Estimating opium production
Opium production was calculated by the estimated regional area under opium poppy cultivation
being multiplied by the corresponding regional opium yield. All opium estimates in this report are
expressed in oven-dry opium equivalent, i.e. the opium is assumed to contain 0% moisture. The
same figure expressed in air-dry opium, i.e. opium under “normal” conditions as traded, would be
higher as such air-dry opium contains some moisture.
The point estimates and uncertainties of the opium production estimate due to sampling of the area
under poppy cultivation and yield can be expressed as ap ±a and yp ± y, respectively, where the
uncertainty is determined from the 95% confidence intervals.
19 See MCN/UNODC Afghanistan Opium Survey 201, December 2011, page 95.
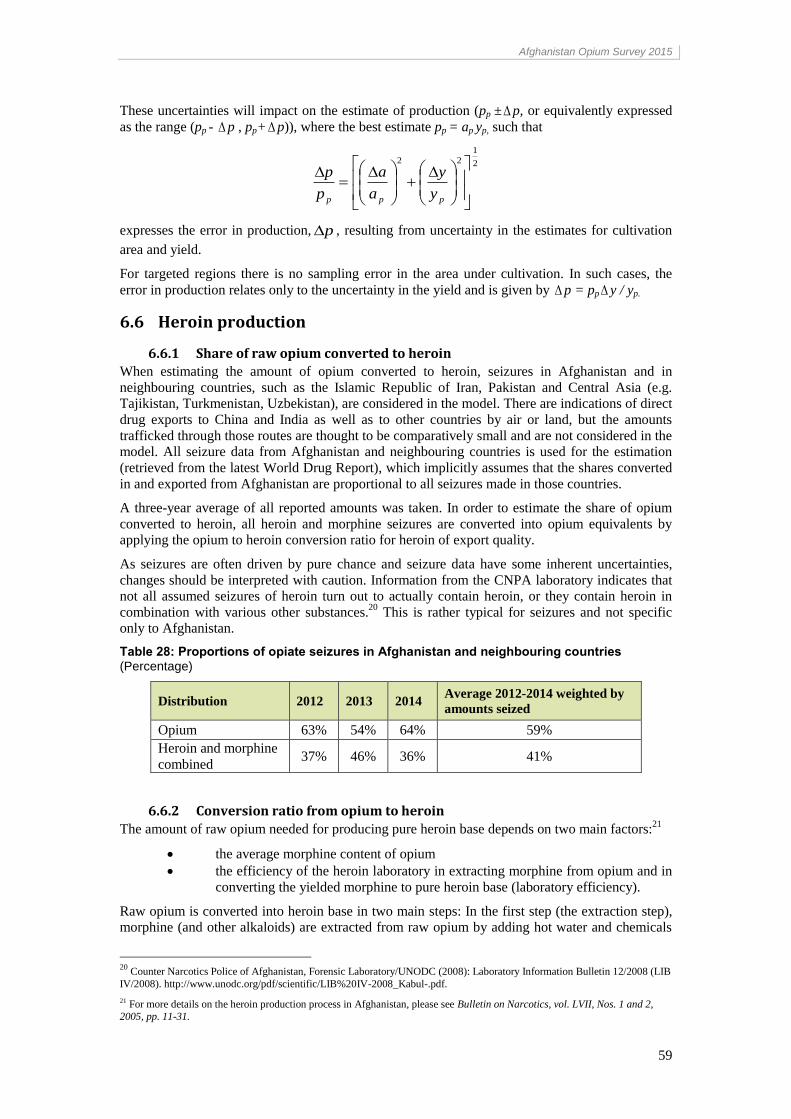
Afghanistan Opium Survey 2015
59
These uncertainties will impact on the estimate of production (pp ±p, or equivalently expressed
as the range (pp - p , pp+p)), where the best estimate pp = ap yp, such that
2
1
22
ppp y
y
a
a
p
p
expresses the error in production, p , resulting from uncertainty in the estimates for cultivation
area and yield.
For targeted regions there is no sampling error in the area under cultivation. In such cases, the
error in production relates only to the uncertainty in the yield and is given by p = pp y / yp.
6.6 Heroin production
6.6.1 Share of raw opium converted to heroin
When estimating the amount of opium converted to heroin, seizures in Afghanistan and in
neighbouring countries, such as the Islamic Republic of Iran, Pakistan and Central Asia (e.g.
Tajikistan, Turkmenistan, Uzbekistan), are considered in the model. There are indications of direct
drug exports to China and India as well as to other countries by air or land, but the amounts
trafficked through those routes are thought to be comparatively small and are not considered in the
model. All seizure data from Afghanistan and neighbouring countries is used for the estimation
(retrieved from the latest World Drug Report), which implicitly assumes that the shares converted
in and exported from Afghanistan are proportional to all seizures made in those countries.
A three-year average of all reported amounts was taken. In order to estimate the share of opium
converted to heroin, all heroin and morphine seizures are converted into opium equivalents by
applying the opium to heroin conversion ratio for heroin of export quality.
As seizures are often driven by pure chance and seizure data have some inherent uncertainties,
changes should be interpreted with caution. Information from the CNPA laboratory indicates that
not all assumed seizures of heroin turn out to actually contain heroin, or they contain heroin in
combination with various other substances.20
This is rather typical for seizures and not specific
only to Afghanistan.
Table 28: Proportions of opiate seizures in Afghanistan and neighbouring countries (Percentage)
Distribution 2012 2013 2014 Average 2012-2014 weighted by
amounts seized
Opium 63% 54% 64% 59%
Heroin and morphine
combined 37% 46% 36% 41%
6.6.2 Conversion ratio from opium to heroin
The amount of raw opium needed for producing pure heroin base depends on two main factors:21
the average morphine content of opium
the efficiency of the heroin laboratory in extracting morphine from opium and in
converting the yielded morphine to pure heroin base (laboratory efficiency).
Raw opium is converted into heroin base in two main steps: In the first step (the extraction step),
morphine (and other alkaloids) are extracted from raw opium by adding hot water and chemicals
20
Counter Narcotics Police of Afghanistan, Forensic Laboratory/UNODC (2008): Laboratory Information Bulletin 12/2008 (LIB
IV/2008). http://www.unodc.org/pdf/scientific/LIB%20IV-2008_Kabul-.pdf.
21 For more details on the heroin production process in Afghanistan, please see Bulletin on Narcotics, vol. LVII, Nos. 1 and 2,
2005, pp. 11-31.
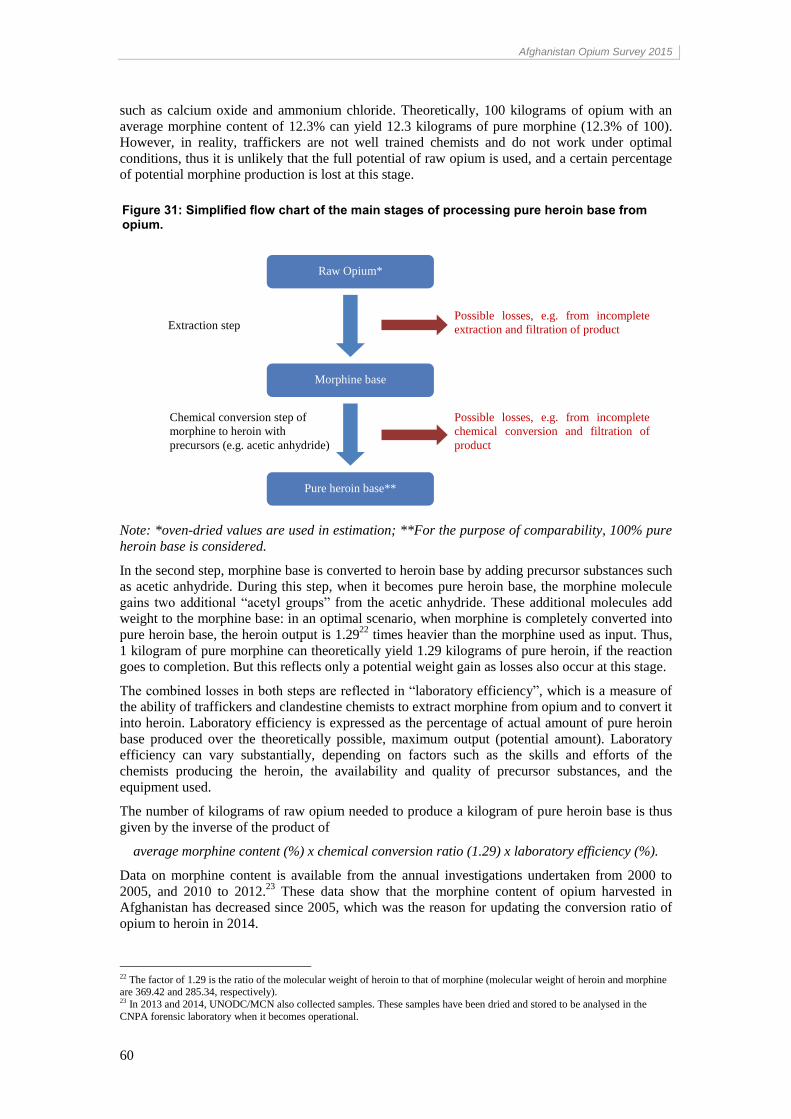
Afghanistan Opium Survey 2015
60
such as calcium oxide and ammonium chloride. Theoretically, 100 kilograms of opium with an
average morphine content of 12.3% can yield 12.3 kilograms of pure morphine (12.3% of 100).
However, in reality, traffickers are not well trained chemists and do not work under optimal
conditions, thus it is unlikely that the full potential of raw opium is used, and a certain percentage
of potential morphine production is lost at this stage.
Note: *oven-dried values are used in estimation; **For the purpose of comparability, 100% pure
heroin base is considered.
In the second step, morphine base is converted to heroin base by adding precursor substances such
as acetic anhydride. During this step, when it becomes pure heroin base, the morphine molecule
gains two additional “acetyl groups” from the acetic anhydride. These additional molecules add
weight to the morphine base: in an optimal scenario, when morphine is completely converted into
pure heroin base, the heroin output is 1.2922
times heavier than the morphine used as input. Thus,
1 kilogram of pure morphine can theoretically yield 1.29 kilograms of pure heroin, if the reaction
goes to completion. But this reflects only a potential weight gain as losses also occur at this stage.
The combined losses in both steps are reflected in “laboratory efficiency”, which is a measure of
the ability of traffickers and clandestine chemists to extract morphine from opium and to convert it
into heroin. Laboratory efficiency is expressed as the percentage of actual amount of pure heroin
base produced over the theoretically possible, maximum output (potential amount). Laboratory
efficiency can vary substantially, depending on factors such as the skills and efforts of the
chemists producing the heroin, the availability and quality of precursor substances, and the
equipment used.
The number of kilograms of raw opium needed to produce a kilogram of pure heroin base is thus
given by the inverse of the product of
average morphine content (%) x chemical conversion ratio (1.29) x laboratory efficiency (%).
Data on morphine content is available from the annual investigations undertaken from 2000 to
2005, and 2010 to 2012.23
These data show that the morphine content of opium harvested in
Afghanistan has decreased since 2005, which was the reason for updating the conversion ratio of
opium to heroin in 2014.
22 The factor of 1.29 is the ratio of the molecular weight of heroin to that of morphine (molecular weight of heroin and morphine are 369.42 and 285.34, respectively). 23 In 2013 and 2014, UNODC/MCN also collected samples. These samples have been dried and stored to be analysed in the
CNPA forensic laboratory when it becomes operational.
Morphine base
Pure heroin base**
Extraction step
Chemical conversion step of
morphine to heroin with
precursors (e.g. acetic anhydride)
Raw Opium*
Possible losses, e.g. from incomplete
extraction and filtration of product
Possible losses, e.g. from incomplete
chemical conversion and filtration of
product
Figure 31: Simplified flow chart of the main stages of processing pure heroin base from opium.
Afghanistan Opium Survey 2015
61
Between 2000 and 2003, 39 opium samples from different regions of Afghanistan, which
contained an average of 15.0% morphine content (95% confidence interval ±1.32),24
were
analysed. In 2004 and 2005, a total of 56 opium samples was collected and analysed, which had an
average morphine content of 13.6% (95% confidence interval ±1.2).25
From 2010 to 2012, 57
opium samples from all regions of Afghanistan were collected and analysed, which presented a
statistically significant26
lower average morphine content of 12.3% (95% confidence interval
±0.7)27
than the average from 2000 to 2005. A trend analysis of all yearly data reveals a
statistically significant28
declining trend of average morphine content.
Based on recent trends, the simple29
average of the morphine content of all samples collected
between 2010 and 2012 was used (12.3%) for the calculations of the conversion ratio. When more
data becomes available, the morphine content will be updated.
While there is updated information on morphine content available, little is known about the
laboratory efficiency of heroin laboratories in Afghanistan.
When the opium/heroin conversion ratio was revised in 2005, the underlying assumption was a
laboratory efficiency of 60-70% together with a heroin purity range of 45-85%. These percentages
were based on interviews with key informants and seizure data for purity.
In the same year, a study30
conducted by the Federal Criminal Police Office, Wiesbaden, Germany
was published, in which white heroin hydrochloride was produced by using locally seized
substances and equipment. In this experiment, a laboratory efficiency31
of 34% was achieved in
the conversion of raw opium of low quality (8.5% morphine content) to pure heroin base. This is
the only study available to date that has investigated laboratory efficiency in Afghanistan32
under
local conditions. The study has a number of limitations, including a limited number of
experiments performed by only two “heroin cooks”.
The main uncertainty surrounding the conversion ratio of opium to pure heroin base is thus due to
a lack of information on the average efficiency of heroin laboratories in Afghanistan: the
processing of illicit heroin from opium is normally carried out with readily available equipment
such as buckets, barrels, pots and cloth.33
Precursors and chemicals used, such as acetic anhydride,
ammonium chloride, acids, bases and solvents, are of unknown purities. Furthermore, laboratory
operators may be experienced but seldom have any background in chemistry. All these factors
considered, laboratory efficiency can vary anywhere from 30% to 70% efficiency and an
assumption of either percentage could be either a gross under- or over-estimation.
When estimating the quantity of pure heroin base yielded from annual Afghan opium production,
UNODC/MCN uses a laboratory efficiency of 34% for the estimation of the conversion ratio of
opium to pure heroin base. If 70% laboratory efficiency could be achieved the conversio ratio
from opium to pure heroin base would change from 18.5:1 to 9:1. The estimated heroin production
would thus almost double. If more data on laboratory efficiency becomes available, the ratio will
be updated.
24 UNODC, SCITEC/19, Limited Opium Yield Assessment Surveys, December 2003. 25 Analysis of the raw data used in B. Remberg, A.F. Sterrantino, R. Artner, C. Janitsch, L. Krenn, Science in drug control: the
alkaloid content of Afghan opium, Chemistry and Biodiversity, 5 (2008), pp. 1770–1779. 26 p<0.05. 27 Recent data collected by UNODC/MCN. 28 p<0.001. 29 Analysis revealed that there are no statistically significant differences between regions in the data collected between 2010 and 2012. Therefore, the data has not been weighted according to production.
30 Bulletin on Narcotics, vol. LVII, Nos. 1 and 2, 2005, pp. 11-31. 31 In the study, 70 kilograms of raw opium with 8.5% morphine content were converted to 2.9 kilograms of pure heroin hydrochloride, which is equivalent to 2.64 kilograms of pure heroin base – assuming no further losses at this stage. 32 A DEA study on heroin laboratory efficiency in Colombia estimated an overall laboratory efficiency of 67.2% under local
conditions from opium (latex) to heroin HCl. This study is not applicable to Afghanistan, because in Colombia processors use a unique method known as the “ammonia method” (key chemicals are ammonia and ethyl acetate) to extract morphine base from
opium latex. 33 Bulletin on Narcotics, vol. LVII, Nos. 1 and 2, 2005.
Afghanistan Opium Survey 2015
62
6.6.1 Heroin of export quality – purity
The amount of pure heroin produced can only be a theoretical measure of the heroin output of
Afghanistan opium production: heroin is rarely traded in its pure form and comes as brown heroin
base or white heroin (heroin hydrochloride). It is also cut with diluents such as caffeine,
chloroquine, phenolphthalein and paracetamol. When aiming to reflect local markets and estimate
heroin availability for consumption, an estimate of the amount of heroin of export quality (quality
of heroin traded by traffickers at the wholesale level) produced in a given year is a more
informative measure.
Scarce data is available for the purity of heroin exported from Afghanistan. In 2014 and in 2015,
the typical purity of heroin of wholesale quality reported by Turkey has been used for estimating
purity of export quality. Turkey is an important transit country for opiates trafficked from
Afghanistan to Europe and reports purities on a regular basis. However, the percentage is only a
single data point and can therefore only give a rough indication for the actual average purity of
heroin trafficked out of Afghanistan.
6.7 Average farm-gate price and farm-gate value of opium production
Since 2009, farm-gate prices at harvest time have been derived from the opium price monitoring
system and refer to the month when opium harvesting actually took place in the different regions
of the country, which is thought to reflect opium prices at harvest time better. To calculate the
national average price, regional price averages were weighted by regional opium production. The
opium price in the Central region was calculated from the annual village survey, as there is no
monthly opium price monitoring in that region.
The farm-gate value of opium production is the product of potential opium production at the
national level multiplied by the weighted average farm-gate price of dry opium at harvest time.
The upper and lower limits of the range of the farm-gate value were determined by using the
upper and lower opium production estimate.
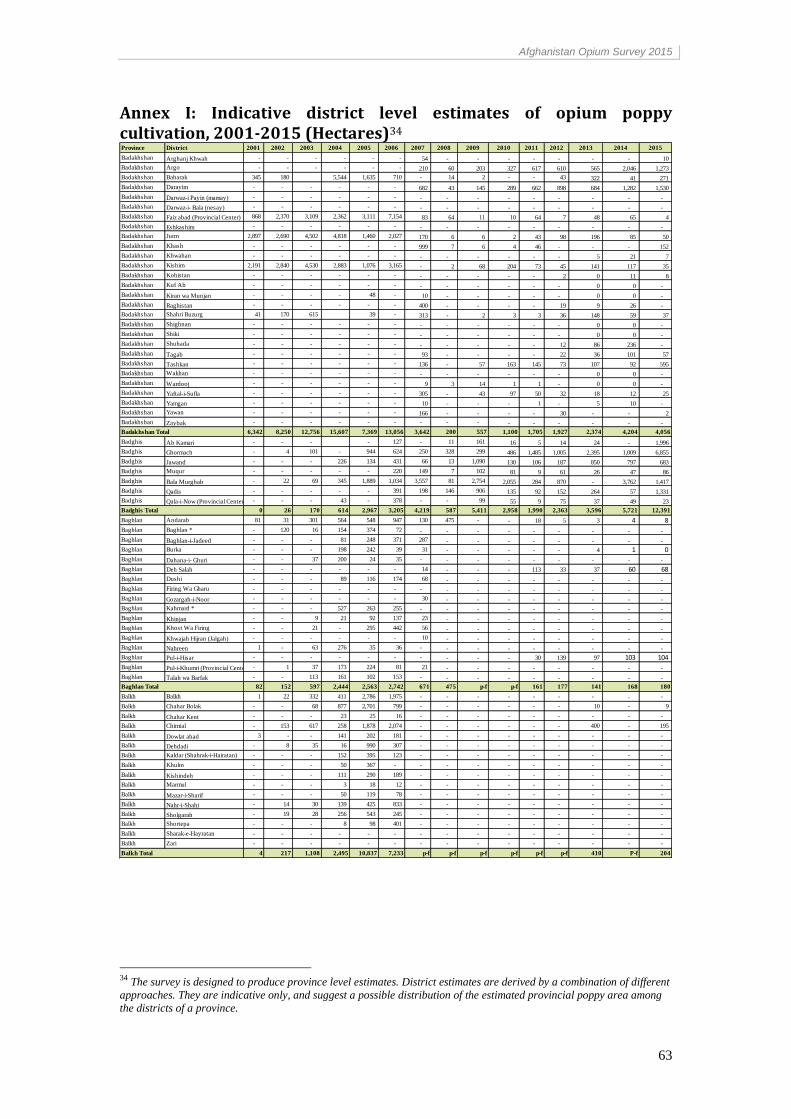
Afghanistan Opium Survey 2015
63
Annex I: Indicative district level estimates of opium poppy cultivation, 2001-2015 (Hectares)34
34 The survey is designed to produce province level estimates. District estimates are derived by a combination of different
approaches. They are indicative only, and suggest a possible distribution of the estimated provincial poppy area among
the districts of a province.
Province District 2001 2002 2003 2004 2005 2006 2007 2008 2009 2010 2011 2012 2013 2014 2015
Badakhshan Arghanj Khwah - - - - - - 54 - - - - - - - 10
Badakhshan Argo - - - - - - 210 60 203 327 617 610 565 2,046 1,273
Badakhshan Baharak 345 180 5,544 1,635 710 - 14 2 - - 43 322 41 271
Badakhshan Darayim - - - - - - 682 43 145 289 662 898 684 1,282 1,530
Badakhshan Darwaz-i Payin (mamay) - - - - - - - - - - - - - - -
Badakhshan Darwaz-i- Bala (nesay) - - - - - - - - - - - - - - -
Badakhshan Faiz abad (Provincial Center) 868 2,370 3,109 2,362 3,111 7,154 83 64 11 10 64 7 48 65 4
Badakhshan Eshkashim - - - - - - - - - - - - - - -
Badakhshan Jurm 2,897 2,690 4,502 4,818 1,460 2,027 170 6 6 2 43 98 196 85 50
Badakhshan Khash - - - - - - 999 7 6 4 46 - - - 152
Badakhshan Khwahan - - - - - - - - - - - - 5 21 7
Badakhshan Kishim 2,191 2,840 4,530 2,883 1,076 3,165 - 2 68 204 73 45 141 117 35
Badakhshan Kohistan - - - - - - - - - - - 2 0 11 8
Badakhshan Kuf Ab - - - - - - - - - - - - 0 0 -
Badakhshan Kiran wa Munjan - - - - 48 - 10 - - - - - 0 0 -
Badakhshan Raghistan - - - - - - 400 - - - - 19 9 26 -
Badakhshan Shahri Buzurg 41 170 615 39 - 313 - 2 3 3 36 148 59 37
Badakhshan Shighnan - - - - - - - - - - - - 0 0 -
Badakhshan Shiki - - - - - - - - - - - - 0 0 -
Badakhshan Shuhada - - - - - - - - - - - 12 86 236 -
Badakhshan Tagab - - - - - - 93 - - - - 22 36 101 57
Badakhshan Tashkan - - - - - - 136 - 57 163 145 73 107 92 595
Badakhshan Wakhan - - - - - - - - - - - - 0 0 -
Badakhshan Wardooj - - - - - - 9 3 14 1 1 - 0 0 -
Badakhshan Yaftal-i-Sufla - - - - - - 305 - 43 97 50 32 18 12 25
Badakhshan Yamgan - - - - - - 10 - - - 1 - 5 10 -
Badakhshan Yawan - - - - - - 166 - - - - 30 - - 2
Badakhshan Zaybak - - - - - - - - - - - - - - -
6,342 8,250 12,756 15,607 7,369 13,056 3,642 200 557 1,100 1,705 1,927 2,374 4,204 4,056
Badghis Ab Kamari - - - - 127 - 11 161 16 5 14 24 - 1,996
Badghis Ghormach - 4 101 - 944 624 250 328 299 486 1,485 1,005 2,395 1,009 6,855
Badghis Jawand - - - 226 134 431 66 13 1,090 130 106 187 850 797 683
Badghis Muqur - - - - - 220 149 7 102 81 9 61 26 47 86
Badghis Bala Murghab - 22 69 345 1,889 1,034 3,557 81 2,754 2,055 284 870 - 3,762 1,417
Badghis Qadis - - - - - 391 198 146 906 135 92 152 264 57 1,331
Badghis Qala-i-Now (Provincial Center) - - - 43 - 378 - - 99 55 9 75 37 49 23
0 26 170 614 2,967 3,205 4,219 587 5,411 2,958 1,990 2,363 3,596 5,721 12,391
Baghlan Andarab 81 31 301 564 548 947 130 475 - - 18 5 3 4 8
Baghlan Baghlan * - 120 16 154 374 72 - - - - - - - - -
Baghlan Baghlan-i-Jadeed - - - 81 248 371 287 - - - - - - - -
Baghlan Burka - - - 198 242 39 31 - - - - - 4 1 0
Baghlan Dahana-i- Ghuri - - 37 200 24 35 - - - - - - - - -
Baghlan Deh Salah - - - - - - 14 - - - 113 33 37 60 68
Baghlan Dushi - - - 89 116 174 68 - - - - - - - -
Baghlan Firing Wa Gharu - - - - - - - - - - - - - - -
Baghlan Gozargah-i-Noor - - - - - - 30 - - - - - - - -
Baghlan Kahmard * - - - 527 263 255 - - - - - - - - -
Baghlan Khinjan - - 9 21 92 137 23 - - - - - - - -
Baghlan Khost Wa Firing - - 21 - 295 442 56 - - - - - - - -
Baghlan Khwajah Hijran (Jalgah) - - - - - - 10 - - - - - - - -
Baghlan Nahreen 1 - 63 276 35 36 - - - - - - - - -
Baghlan Pul-i-Hisar - - - - - - - - - - 30 139 97 103 104
Baghlan Pul-i-Khumri (Provincial Center) - 1 37 173 224 81 21 - - - - - - - -
Baghlan Talah wa Barfak - - 113 161 102 153 - - - - - - - - -
82 152 597 2,444 2,563 2,742 671 475 p-f p-f 161 177 141 168 180
Balkh Balkh 1 22 332 411 2,786 1,975 - - - - - - - - -
Balkh Chahar Bolak - - 68 877 2,701 799 - - - - - - 10 - 9
Balkh Chahar Kent - - - 23 25 16 - - - - - - - - -
Balkh Chimtal - 153 617 258 1,878 2,074 - - - - - - 400 - 195
Balkh Dowlat abad 3 - - 141 202 181 - - - - - - - - -
Balkh Dehdadi - 8 35 16 990 307 - - - - - - - - -
Balkh Kaldar (Shahrak-i-Hairatan) - - - 152 395 123 - - - - - - - - -
Balkh Khulm - - - 50 367 - - - - - - - - - -
Balkh Kishindeh - - - 111 290 189 - - - - - - - - -
Balkh Marmul - - - 3 18 12 - - - - - - - - -
Balkh Mazar-i-Sharif - - - 50 119 78 - - - - - - - - -
Balkh Nahr-i-Shahi - 14 30 139 425 833 - - - - - - - - -
Balkh Sholgarah - 19 28 256 543 245 - - - - - - - - -
Balkh Shortepa - - - 8 98 401 - - - - - - - - -
Balkh Sharak-e-Hayratan - - - - - - - - - - - - - - -
Balkh Zari - - - - - - - - - - - - - - -
4 217 1,108 2,495 10,837 7,233 p-f p-f p-f p-f p-f p-f 410 P-f 204
Badakhshan Total
Badghis Total
Baghlan Total
Balkh Total
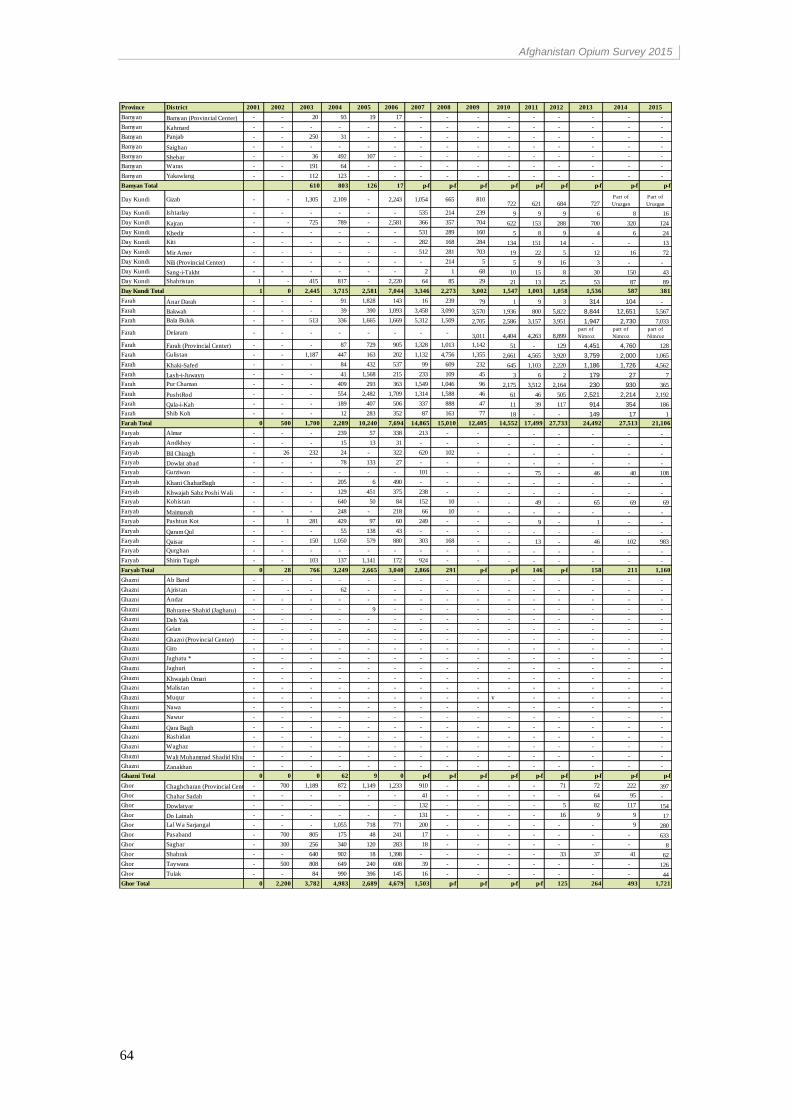
Afghanistan Opium Survey 2015
64
Province District 2001 2002 2003 2004 2005 2006 2007 2008 2009 2010 2011 2012 2013 2014 2015
Bamyan Bamyan (Provincial Center) - - 20 93 19 17 - - - - - - - - -
Bamyan Kahmard - - - - - - - - - - - - - - -
Bamyan Panjab - - 250 31 - - - - - - - - - - -
Bamyan Saighan - - - - - - - - - - - - - - -
Bamyan Shebar - - 36 492 107 - - - - - - - - - -
Bamyan Waras - - 191 64 - - - - - - - - - - -
Bamyan Yakawlang - - 112 123 - - - - - - - - - - -
610 803 126 17 p-f p-f p-f p-f p-f p-f p-f p-f p-f
Day Kundi Gizab - - 1,305 2,109 - 2,243 1,054 665 810 722 621 684 727
Part of
Uruzgan
Part of
Uruzgan
Day Kundi Ishtarlay - - - - - - 535 214 239 9 9 9 6 8 16
Day Kundi Kajran - - 725 789 - 2,581 366 357 704 622 153 288 700 320 124
Day Kundi Khedir - - - - - - 531 289 160 5 8 9 4 6 24
Day Kundi Kiti - - - - - - 282 168 284 134 151 14 - - 13
Day Kundi Mir Amor - - - - - - 512 281 703 19 22 5 12 16 72
Day Kundi Nili (Provincial Center) - - - - - - - 214 5 5 9 16 3 - -
Day Kundi Sang-i-Takht - - - - - - 2 1 68 10 15 8 30 150 43
Day Kundi Shahristan 1 - 415 817 - 2,220 64 85 29 21 13 25 53 87 89
1 0 2,445 3,715 2,581 7,044 3,346 2,273 3,002 1,547 1,003 1,058 1,536 587 381
Farah Anar Darah - - - 91 1,828 143 16 239 79 1 9 3 314 104 -
Farah Bakwah - - - 39 390 1,093 3,458 3,090 3,570 1,936 800 5,822 8,844 12,651 5,567
Farah Bala Buluk - - 513 336 1,665 1,669 5,312 1,509 2,705 2,586 3,157 3,951 1,947 2,730 7,033
Farah Delaram - - - - - - - - 3,011 4,404 4,263 8,899
part of
Nimroz
part of
Nimroz
part of
Nimroz
Farah Farah (Provincial Center) - - - 87 729 905 1,328 1,013 1,142 51 - 129 4,451 4,760 128
Farah Gulistan - - 1,187 447 163 202 1,132 4,756 1,355 2,661 4,565 3,920 3,759 2,000 1,065
Farah Khaki-Safed - - - 84 432 537 99 609 232 645 1,103 2,220 1,186 1,726 4,562
Farah Lash-i-Juwayn - - - 41 1,568 215 233 109 45 3 6 2 179 27 7
Farah Pur Chaman - - - 409 293 363 1,549 1,046 96 2,175 3,512 2,164 230 930 365
Farah PushtRod - - - 554 2,482 1,709 1,314 1,588 46 61 46 505 2,521 2,214 2,192
Farah Qala-i-Kah - - - 189 407 506 337 888 47 11 39 117 914 354 186
Farah Shib Koh - - - 12 283 352 87 163 77 18 - - 149 17 1
0 500 1,700 2,289 10,240 7,694 14,865 15,010 12,405 14,552 17,499 27,733 24,492 27,513 21,106
Faryab Almar - - - 239 57 338 213 - - - - - - - -
Faryab Andkhoy - - - 15 13 31 - - - - - - - - -
Faryab Bil Chiragh - 26 232 24 - 322 620 102 - - - - - - -
Faryab Dowlat abad - - - 78 133 27 - - - - - - - - -
Faryab Gurziwan - - - - - - 101 - - - 75 - 46 40 108
Faryab Khani ChaharBagh - - - 205 6 490 - - - - - - - - -
Faryab Khwajah Sabz Poshi Wali - - - 129 451 375 238 - - - - - - - -
Faryab Kohistan - - - 640 50 84 152 10 - - 49 - 65 69 69
Faryab Maimanah - - - 248 - 218 66 10 - - - - - - -
Faryab Pashtun Kot - 1 281 429 97 60 249 - - - 9 - 1 - -
Faryab Qaram Qul - - - 55 138 43 - - - - - - - - -
Faryab Qaisar - - 150 1,050 579 880 303 168 - - 13 - 46 102 983
Faryab Qurghan - - - - - - - - - - - - - - -
Faryab Shirin Tagab - - 103 137 1,141 172 924 - - - - - - - -
0 28 766 3,249 2,665 3,040 2,866 291 p-f p-f 146 p-f 158 211 1,160
Ghazni Ab Band - - - - - - - - - - - - - - -
Ghazni Ajristan - - - 62 - - - - - - - - - - -
Ghazni Andar - - - - - - - - - - - - - - -
Ghazni Bahram-e Shahid (Jaghatu) - - - - 9 - - - - - - - - - -
Ghazni Deh Yak - - - - - - - - - - - - - - -
Ghazni Gelan - - - - - - - - - - - - - - -
Ghazni Ghazni (Provincial Center) - - - - - - - - - - - - - - -
Ghazni Giro - - - - - - - - - - - - - - -
Ghazni Jaghatu * - - - - - - - - - - - - - - -
Ghazni Jaghuri - - - - - - - - - - - - - - -
Ghazni Khwajah Omari - - - - - - - - - - - - - - -
Ghazni Malistan - - - - - - - - - - - - - - -
Ghazni Muqur - - - - - - - - - v - - - - -
Ghazni Nawa - - - - - - - - - - - - - - -
Ghazni Nawur - - - - - - - - - - - - - - -
Ghazni Qara Bagh - - - - - - - - - - - - - - -
Ghazni Rashidan - - - - - - - - - - - - - - -
Ghazni Waghaz - - - - - - - - - - - - - - -
Ghazni Wali Muhammad Shadid Khugyani- - - - - - - - - - - - - - -
Ghazni Zanakhan - - - - - - - - - - - - - - -
0 0 0 62 9 0 p-f p-f p-f p-f p-f p-f p-f p-f p-f
Ghor Chaghcharan (Provincial Center) - 700 1,189 872 1,149 1,233 910 - - - - 71 72 222 397
Ghor Chahar Sadah - - - - - - 41 - - - - - 64 95 -
Ghor Dowlatyar - - - - - - 132 - - - - 5 82 117 154
Ghor Do Lainah - - - - - - 131 - - - - 16 9 9 17
Ghor Lal Wa Sarjangal - - - 1,055 718 771 200 - - - - - - 9 280
Ghor Pasaband - 700 805 175 48 241 17 - - - - - - - 633
Ghor Saghar - 300 256 340 120 283 18 - - - - - - - 8
Ghor Shahrak - - 640 902 18 1,398 - - - - - 33 37 41 62
Ghor Taywara - 500 808 649 240 608 39 - - - - - - - 126
Ghor Tulak - - 84 990 396 145 16 - - - - - - - 44
0 2,200 3,782 4,983 2,689 4,679 1,503 p-f p-f p-f p-f 125 264 493 1,721
Farah Total
Faryab Total
Ghazni Total
Ghor Total
Bamyan Total
Day Kundi Total
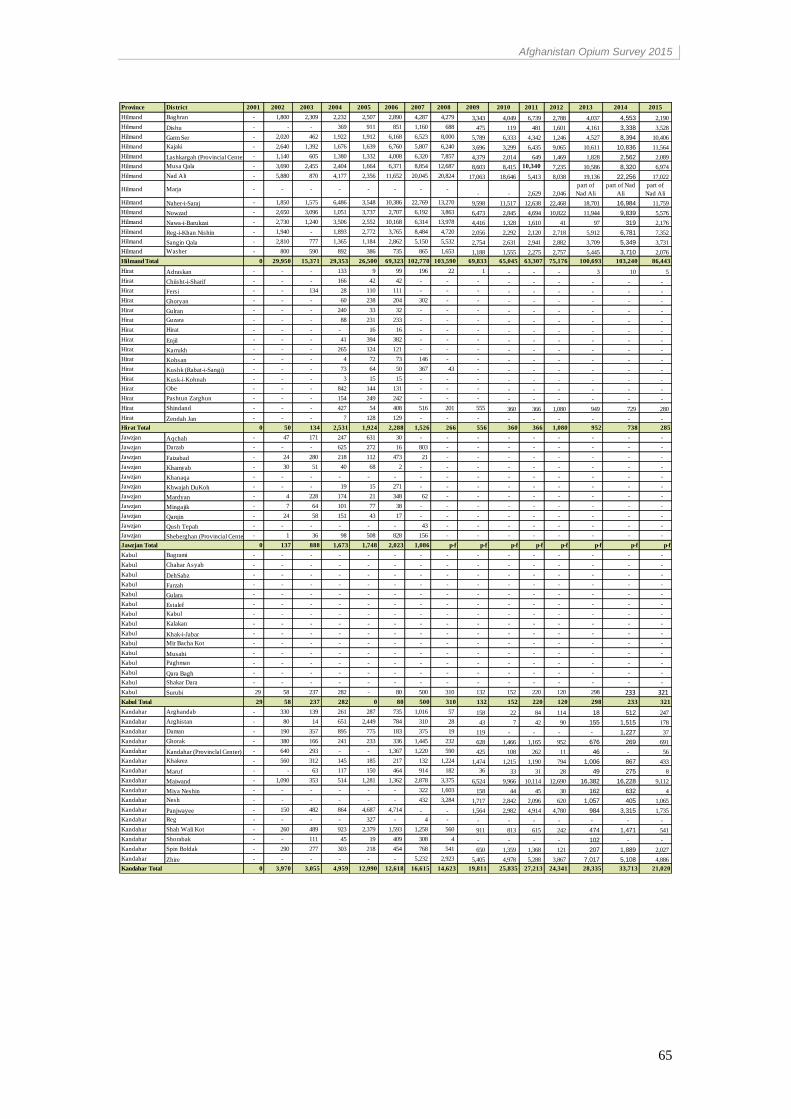
Afghanistan Opium Survey 2015
65
Province District 2001 2002 2003 2004 2005 2006 2007 2008 2009 2010 2011 2012 2013 2014 2015
Hilmand Baghran - 1,800 2,309 2,232 2,507 2,890 4,287 4,279 3,343 4,049 6,739 2,788 4,037 4,553 2,190
Hilmand Dishu - - - 369 911 851 1,160 688 475 119 481 1,601 4,161 3,338 3,528
Hilmand Garm Ser - 2,020 462 1,922 1,912 6,168 6,523 8,000 5,789 6,333 4,342 1,246 4,527 8,394 10,406
Hilmand Kajaki - 2,640 1,392 1,676 1,639 6,760 5,807 6,240 3,696 3,299 6,435 9,065 10,611 10,836 11,564
Hilmand Lashkargah (Provincial Center) - 1,140 605 1,380 1,332 4,008 6,320 7,857 4,379 2,014 649 1,469 1,828 2,562 2,089
Hilmand Musa Qala - 3,690 2,455 2,404 1,664 6,371 8,854 12,687 8,603 8,415 10,340 7,235 10,586 8,320 6,974
Hilmand Nad Ali - 5,880 870 4,177 2,356 11,652 20,045 20,824 17,063 18,646 5,413 8,038 19,136 22,256 17,022
Hilmand Marja - - - - - - - - - - 2,629 2,046
part of
Nad Ali
part of Nad
Ali
part of
Nad Ali
Hilmand Naher-i-Saraj - 1,850 1,575 6,486 3,548 10,386 22,769 13,270 9,598 11,517 12,638 22,468 18,701 16,984 11,759
Hilmand Nowzad - 2,650 3,096 1,051 3,737 2,707 6,192 3,863 6,473 2,845 4,694 10,822 11,944 9,839 5,576
Hilmand Nawa-i-Barukzai - 2,730 1,240 3,506 2,552 10,168 6,314 13,978 4,416 1,328 1,610 41 97 319 2,176
Hilmand Reg-i-Khan Nishin - 1,940 - 1,893 2,772 3,765 8,484 4,720 2,056 2,292 2,120 2,718 5,912 6,781 7,352
Hilmand Sangin Qala - 2,810 777 1,365 1,184 2,862 5,150 5,532 2,754 2,631 2,941 2,882 3,709 5,349 3,731
Hilmand Washer - 800 590 892 386 735 865 1,653 1,188 1,555 2,275 2,757 5,445 3,710 2,076
0 29,950 15,371 29,353 26,500 69,323 102,770 103,590 69,833 65,045 63,307 75,176 100,693 103,240 86,443
Hirat Adraskan - - - 133 9 99 196 22 1 - - - 3 10 5
Hirat Chiisht-i-Sharif - - - 166 42 42 - - - - - - - - -
Hirat Fersi - - 134 28 110 111 - - - - - - - - -
Hirat Ghoryan - - - 60 238 204 302 - - - - - - - -
Hirat Gulran - - - 240 33 32 - - - - - - - - -
Hirat Guzara - - - 88 231 233 - - - - - - - - -
Hirat Hirat - - - - 16 16 - - - - - - - - -
Hirat Enjil - - - 41 394 382 - - - - - - - - -
Hirat Karrukh - - - 265 124 121 - - - - - - - - -
Hirat Kohsan - - - 4 72 73 146 - - - - - - - -
Hirat Kushk (Rabat-i-Sangi) - - - 73 64 50 367 43 - - - - - - -
Hirat Kusk-i-Kohnah - - - 3 15 15 - - - - - - - - -
Hirat Obe - - - 842 144 131 - - - - - - - - -
Hirat Pashtun Zarghun - - - 154 249 242 - - - - - - - - -
Hirat Shindand - - - 427 54 408 516 201 555 360 366 1,080 949 729 280
Hirat Zendah Jan - - - 7 128 129 - - - - - - - - -
0 50 134 2,531 1,924 2,288 1,526 266 556 360 366 1,080 952 738 285
Jawzjan Aqchah - 47 171 247 631 30 - - - - - - - - -
Jawzjan Darzab - - - 625 272 16 803 - - - - - - - -
Jawzjan Faizabad - 24 280 218 112 473 21 - - - - - - - -
Jawzjan Khamyab - 30 51 40 68 2 - - - - - - - - -
Jawzjan Khanaqa - - - - - - - - - - - - - - -
Jawzjan Khwajah DuKoh - - - 19 15 271 - - - - - - - - -
Jawzjan Mardyan - 4 228 174 21 348 62 - - - - - - - -
Jawzjan Mingajik - 7 64 101 77 38 - - - - - - - - -
Jawzjan Qarqin - 24 58 151 43 17 - - - - - - - - -
Jawzjan Qush Tepah - - - - - - 43 - - - - - - - -
Jawzjan Sheberghan (Provincial Center) - 1 36 98 508 828 156 - - - - - - - -
0 137 888 1,673 1,748 2,023 1,086 p-f p-f p-f p-f p-f p-f p-f p-f
Kabul Bagrami - - - - - - - - - - - - - - -
Kabul Chahar Asyab - - - - - - - - - - - - - - -
Kabul DehSabz - - - - - - - - - - - - - - -
Kabul Farzah - - - - - - - - - - - - - - -
Kabul Gulara - - - - - - - - - - - - - - -
Kabul Estalef - - - - - - - - - - - - - - -
Kabul Kabul - - - - - - - - - - - - - - -
Kabul Kalakan - - - - - - - - - - - - - - -
Kabul Khak-i-Jabar - - - - - - - - - - - - - - -
Kabul Mir Bacha Kot - - - - - - - - - - - - - - -
Kabul Musahi - - - - - - - - - - - - - - -
Kabul Paghman - - - - - - - - - - - - - - -
Kabul Qara Bagh - - - - - - - - - - - - - - -
Kabul Shakar Dara - - - - - - - - - - - - - - -
Kabul Surubi 29 58 237 282 - 80 500 310 132 152 220 120 298 233 321
29 58 237 282 0 80 500 310 132 152 220 120 298 233 321
Kandahar Arghandab - 330 139 261 287 735 1,016 57 158 22 84 114 18 512 247
Kandahar Arghistan - 80 14 651 2,449 784 310 28 43 7 42 90 155 1,515 178
Kandahar Daman - 190 357 895 775 183 375 19 119 - - - - 1,227 37
Kandahar Ghorak - 380 166 241 233 336 1,445 232 628 1,466 1,165 952 676 269 691
Kandahar Kandahar (Provinclal Center) - 640 293 - - 1,367 1,220 590 425 108 262 11 46 - 56
Kandahar Khakrez - 560 312 145 185 217 132 1,224 1,474 1,215 1,190 794 1,006 867 433
Kandahar Maruf - - 63 117 150 464 914 182 36 33 31 28 49 275 8
Kandahar Maiwand - 1,090 353 514 1,281 1,362 2,878 3,375 6,524 9,966 10,114 12,690 16,382 16,228 9,112
Kandahar Miya Neshin - - - - - - 322 1,603 158 44 45 30 162 632 4
Kandahar Nesh - - - - - - 432 3,284 1,717 2,842 2,096 620 1,057 405 1,065
Kandahar Panjwayee - 150 482 864 4,687 4,714 - - 1,564 2,982 4,914 4,780 984 3,315 1,735
Kandahar Reg - - - - 327 - 4 - - - - - - - -
Kandahar Shah Wali Kot - 260 489 923 2,379 1,593 1,258 560 911 813 615 242 474 1,471 541
Kandahar Shorabak - - 111 45 19 409 308 4 - - - - 102 - -
Kandahar Spin Boldak - 290 277 303 218 454 768 541 650 1,359 1,368 121 207 1,889 2,027
Kandahar Zhire - - - - - - 5,232 2,923 5,405 4,978 5,288 3,867 7,017 5,108 4,886
0 3,970 3,055 4,959 12,990 12,618 16,615 14,623 19,811 25,835 27,213 24,341 28,335 33,713 21,020
Jawzjan Total
Kabul Total
Kandahar Total
Hilmand Total
Hirat Total
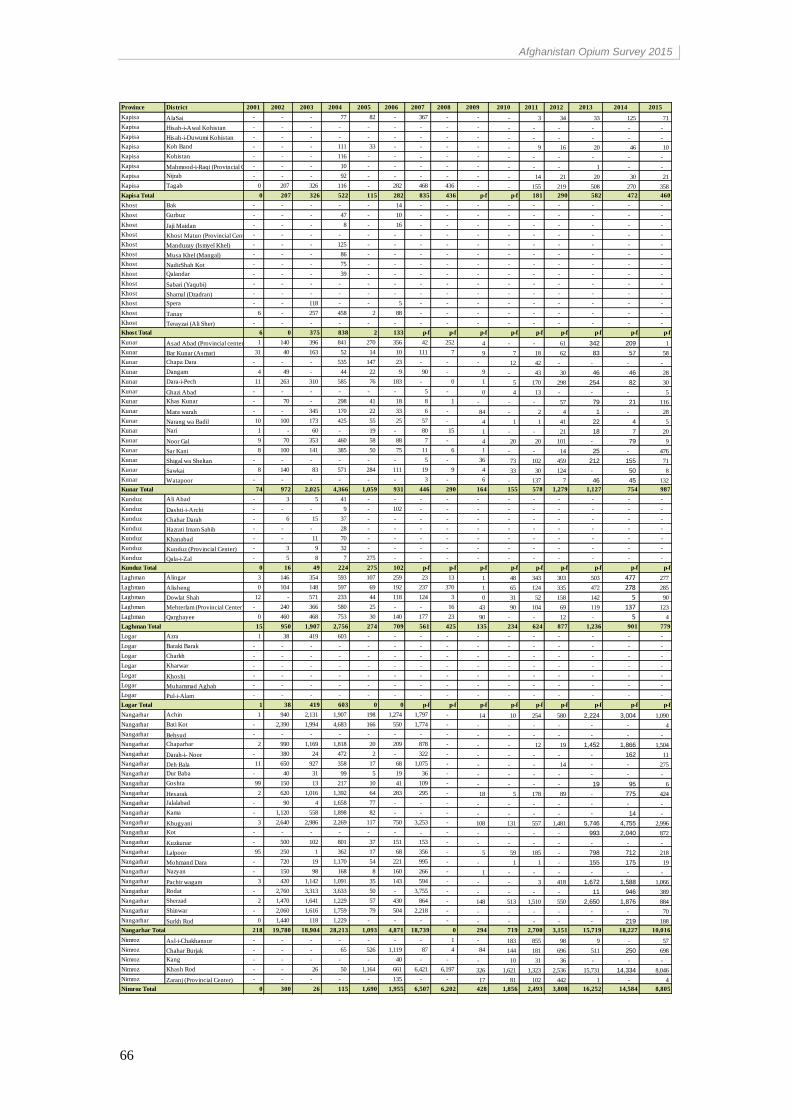
Afghanistan Opium Survey 2015
66
Province District 2001 2002 2003 2004 2005 2006 2007 2008 2009 2010 2011 2012 2013 2014 2015
Kapisa AlaSai - - - 77 82 - 367 - - - 3 34 33 125 71
Kapisa Hisah-i-Awal Kohistan - - - - - - - - - - - - - - -
Kapisa Hisah-i-Duwumi Kohistan - - - - - - - - - - - - - - -
Kapisa Koh Band - - - 111 33 - - - - - 9 16 20 46 10
Kapisa Kohistan - - - 116 - - - - - - - - - - -
Kapisa Mahmood-i-Raqi (Provincial Center)- - - 10 - - - - - - - - 1 - -
Kapisa Nijrab - - - 92 - - - - - - 14 21 20 30 21
Kapisa Tagab 0 207 326 116 - 282 468 436 - - 155 219 508 270 358
0 207 326 522 115 282 835 436 p-f p-f 181 290 582 472 460
Khost Bak - - - - - 14 - - - - - - - - -
Khost Gurbuz - - - 47 - 10 - - - - - - - - -
Khost Jaji Maidan - - - 8 - 16 - - - - - - - - -
Khost Khost Matun (Provincial Center) - - - - - - - - - - - - - - -
Khost Manduzay (Ismyel Khel) - - - 125 - - - - - - - - - - -
Khost Musa Khel (Mangal) - - - 86 - - - - - - - - - - -
Khost NadirShah Kot - - - 75 - - - - - - - - - - -
Khost Qalandar - - - 39 - - - - - - - - - - -
Khost Sabari (Yaqubi) - - - - - - - - - - - - - - -
Khost Shamul (Dzadran) - - - - - - - - - - - - - - -
Khost Spera - - 118 - - 5 - - - - - - - - -
Khost Tanay 6 - 257 458 2 88 - - - - - - - - -
Khost Terayzai (Ali Sher) - - - - - - - - - - - - - - -
6 0 375 838 2 133 p-f p-f p-f p-f p-f p-f p-f p-f p-f
Kunar Asad Abad (Provincial center) 1 140 396 841 270 356 42 252 4 - - 61 342 209 1
Kunar Bar Kunar (Asmar) 31 40 163 52 14 10 111 7 9 7 18 62 83 57 58
Kunar Chapa Dara - - - 535 147 23 - - - 12 42 - - - -
Kunar Dangam 4 49 - 44 22 9 90 - 9 - 43 30 46 46 28
Kunar Dara-i-Pech 11 263 310 585 76 183 - 0 1 5 170 298 254 82 30
Kunar Ghazi Abad - - - - - - 5 - 0 4 13 - - - 5
Kunar Khas Kunar - 70 - 298 41 18 8 1 - - - 57 79 21 116
Kunar Mara warah - - 345 170 22 33 6 - 84 - 2 4 1 - 28
Kunar Narang wa Badil 10 100 173 425 55 25 57 - 4 1 1 41 22 4 5
Kunar Nari 1 - 60 - 19 - 80 15 1 - - 21 18 7 20
Kunar Noor Gal 9 70 353 460 58 88 7 - 4 20 20 101 - 79 9
Kunar Sar Kani 8 100 141 385 50 75 11 6 1 - - 14 25 - 476
Kunar Shigal wa Sheltan - - - - - - 5 - 36 73 102 459 212 155 71
Kunar Sawkai 8 140 83 571 284 111 19 9 4 33 30 124 - 50 8
Kunar Watapoor - - - - - - 3 - 6 - 137 7 46 45 132
74 972 2,025 4,366 1,059 931 446 290 164 155 578 1,279 1,127 754 987
Kunduz Ali Abad - 3 5 41 - - - - - - - - - - -
Kunduz Dashti-i-Archi - - - 9 - 102 - - - - - - - - -
Kunduz Chahar Darah - 6 15 37 - - - - - - - - - - -
Kunduz Hazrati Imam Sahib - - - 28 - - - - - - - - - - -
Kunduz Khanabad - - 11 70 - - - - - - - - - - -
Kunduz Kunduz (Provincial Center) - 3 9 32 - - - - - - - - - - -
Kunduz Qala-i-Zal - 5 8 7 275 - - - - - - - - - -
0 16 49 224 275 102 p-f p-f p-f p-f p-f p-f p-f p-f p-f
Laghman Alingar 3 146 354 593 107 259 23 13 1 48 343 303 503 477 277
Laghman Alisheng 0 104 148 597 69 192 237 370 1 65 124 335 472 278 285
Laghman Dowlat Shah 12 - 571 233 44 118 124 3 0 31 52 158 142 5 90
Laghman Mehterlam (Provincial Center) - 240 366 580 25 - - 16 43 90 104 69 119 137 123
Laghman Qarghayee 0 460 468 753 30 140 177 23 90 - - 12 - 5 4
15 950 1,907 2,756 274 709 561 425 135 234 624 877 1,236 901 779
Logar Azra 1 38 419 603 - - - - - - - - - - -
Logar Baraki Barak - - - - - - - - - - - - - - -
Logar Charkh - - - - - - - - - - - - - - -
Logar Kharwar - - - - - - - - - - - - - - -
Logar Khoshi - - - - - - - - - - - - - - -
Logar Muhammad Aghah - - - - - - - - - - - - - - -
Logar Pul-i-Alam - - - - - - - - - - - - - - -
1 38 419 603 0 0 p-f p-f p-f p-f p-f p-f p-f p-f p-f
Nangarhar Achin 1 940 2,131 1,907 198 1,274 1,797 - 14 10 254 580 2,224 3,004 1,090
Nangarhar Bati Kot - 2,390 1,994 4,683 166 550 1,774 - - - - - - - 4
Nangarhar Behsud - - - - - - - - - - - - - - -
Nangarhar Chaparhar 2 990 1,169 1,818 20 209 878 - - - 12 19 1,452 1,866 1,504
Nangarhar Darah-i- Noor - 380 24 472 2 - 322 - - - - - - 162 11
Nangarhar Deh Bala 11 650 927 358 17 68 1,075 - - - - 14 - - 275
Nangarhar Dur Baba - 40 31 99 5 19 36 - - - - - - - -
Nangarhar Goshta 99 150 13 217 10 41 109 - - - - - 19 95 6
Nangarhar Hesarak 2 620 1,016 1,392 64 283 295 - 18 5 178 89 - 775 424
Nangarhar Jalalabad - 90 4 1,658 77 - - - - - - - - - -
Nangarhar Kama - 1,120 558 1,898 82 - - - - - - - - 14 -
Nangarhar Khugyani 3 2,640 2,986 2,269 117 750 3,253 - 108 131 557 1,481 5,746 4,755 2,996
Nangarhar Kot - - - - - - - - - - - - 993 2,040 872
Nangarhar Kuzkunar - 500 102 801 37 151 153 - - - - - - - -
Nangarhar Lalpoor 95 250 1 362 17 68 356 - 5 59 185 - 798 712 218
Nangarhar Mohmand Dara - 720 19 1,170 54 221 995 - - 1 1 - 155 175 19
Nangarhar Nazyan - 150 98 168 8 160 266 - 1 - - - - - -
Nangarhar Pachir wagam 3 420 1,142 1,091 35 143 594 - - - 3 418 1,672 1,588 1,066
Nangarhar Rodat - 2,760 3,313 3,633 50 - 3,755 - - - - - 11 946 389
Nangarhar Sherzad 2 1,470 1,641 1,229 57 430 864 - 148 513 1,510 550 2,650 1,876 884
Nangarhar Shinwar - 2,060 1,616 1,759 79 504 2,218 - - - - - - - 70
Nangarhar Surkh Rud 0 1,440 118 1,229 - - - - - - - - - 219 188
218 19,780 18,904 28,213 1,093 4,871 18,739 0 294 719 2,700 3,151 15,719 18,227 10,016
Nimroz Asl-i-Chakhansur - - - - - - - 1 - 183 855 98 9 - 57
Nimroz Chahar Burjak - - - 65 526 1,119 87 4 84 144 181 696 511 250 698
Nimroz Kang - - - - - 40 - - - 10 31 36 - - -
Nimroz Khash Rod - - 26 50 1,164 661 6,421 6,197 326 1,621 1,323 2,536 15,731 14,334 8,046
Nimroz Zaranj (Provincial Center) - - - - - 135 - - 17 81 102 442 1 - 4
0 300 26 115 1,690 1,955 6,507 6,202 428 1,856 2,493 3,808 16,252 14,584 8,805
Kunduz Total
Laghman Total
Logar Total
Nangarhar Total
Nimroz Total
Kapisa Total
Khost Total
Kunar Total
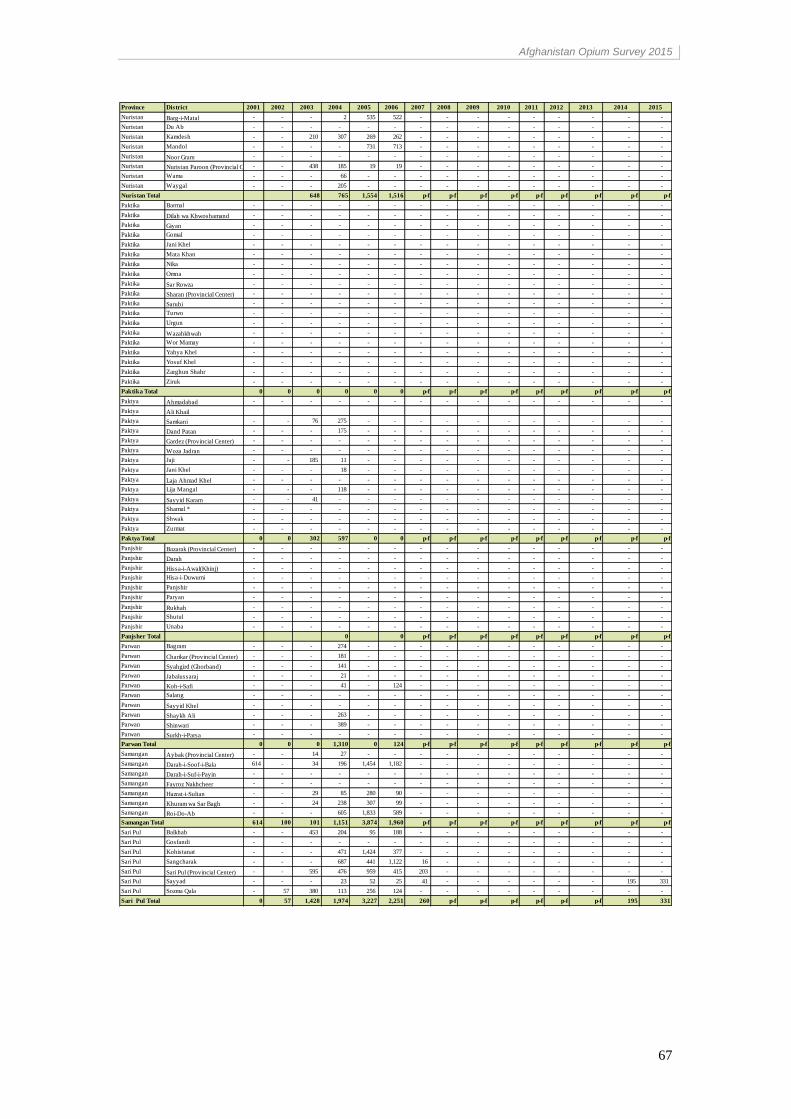
Afghanistan Opium Survey 2015
67
Province District 2001 2002 2003 2004 2005 2006 2007 2008 2009 2010 2011 2012 2013 2014 2015
Nuristan Barg-i-Matal - - - 2 535 522 - - - - - - - - -
Nuristan Du Ab - - - - - - - - - - - - - - -
Nuristan Kamdesh - - 210 307 269 262 - - - - - - - - -
Nuristan Mandol - - - - 731 713 - - - - - - - - -
Nuristan Noor Gram - - - - - - - - - - - - - - -
Nuristan Nuristan Paroon (Provincial Center)- - 438 185 19 19 - - - - - - - - -
Nuristan Wama - - - 66 - - - - - - - - - - -
Nuristan Waygal - - - 205 - - - - - - - - - - -
648 765 1,554 1,516 p-f p-f p-f p-f p-f p-f p-f p-f p-f
Paktika Barmal - - - - - - - - - - - - - - -
Paktika Dilah wa Khwoshamand - - - - - - - - - - - - - - -
Paktika Giyan - - - - - - - - - - - - - - -
Paktika Gomal - - - - - - - - - - - - - - -
Paktika Jani Khel - - - - - - - - - - - - - - -
Paktika Mata Khan - - - - - - - - - - - - - - -
Paktika Nika - - - - - - - - - - - - - - -
Paktika Omna - - - - - - - - - - - - - - -
Paktika Sar Rowza - - - - - - - - - - - - - - -
Paktika Sharan (Provincial Center) - - - - - - - - - - - - - - -
Paktika Sarubi - - - - - - - - - - - - - - -
Paktika Turwo - - - - - - - - - - - - - - -
Paktika Urgun - - - - - - - - - - - - - - -
Paktika Wazahkhwah - - - - - - - - - - - - - - -
Paktika Wor Mamay - - - - - - - - - - - - - - -
Paktika Yahya Khel - - - - - - - - - - - - - - -
Paktika Yosuf Khel - - - - - - - - - - - - - - -
Paktika Zarghun Shahr - - - - - - - - - - - - - - -
Paktika Ziruk - - - - - - - - - - - - - - -
0 0 0 0 0 0 p-f p-f p-f p-f p-f p-f p-f p-f p-f
Paktya Ahmadabad - - - - - - - - - - - - - - -
Paktya Ali Khail
Paktya Samkani - - 76 275 - - - - - - - - - - -
Paktya Dand Patan - - - 175 - - - - - - - - - - -
Paktya Gardez (Provincial Center) - - - - - - - - - - - - - - -
Paktya Woza Jadran - - - - - - - - - - - - - - -
Paktya Jaji - - 185 11 - - - - - - - - - - -
Paktya Jani Khel - - - 18 - - - - - - - - - - -
Paktya Laja Ahmad Khel - - - - - - - - - - - - - - -
Paktya Lija Mangal - - - 118 - - - - - - - - - - -
Paktya Sayyid Karam - - 41 - - - - - - - - - - - -
Paktya Shamul * - - - - - - - - - - - - - - -
Paktya Shwak - - - - - - - - - - - - - - -
Paktya Zurmat - - - - - - - - - - - - - - -
0 0 302 597 0 0 p-f p-f p-f p-f p-f p-f p-f p-f p-f
Panjshir Bazarak (Provincial Center) - - - - - - - - - - - - - - -
Panjshir Darah - - - - - - - - - - - - - - -
Panjshir Hissa-i-Awal(Khinj) - - - - - - - - - - - - - - -
Panjshir Hisa-i-Duwumi - - - - - - - - - - - - - - -
Panjshir Panjshir - - - - - - - - - - - - - - -
Panjshir Paryan - - - - - - - - - - - - - - -
Panjshir Rukhah - - - - - - - - - - - - - - -
Panjshir Shutul - - - - - - - - - - - - - - -
Panjshir Unaba - - - - - - - - - - - - - - -
Panjsher Total 0 0 p-f p-f p-f p-f p-f p-f p-f p-f p-f
Parwan Bagram - - - 274 - - - - - - - - - - -
Parwan Charikar (Provincial Center) - - - 181 - - - - - - - - - - -
Parwan Syahgird (Ghorband) - - - 141 - - - - - - - - - - -
Parwan Jabalussaraj - - - 21 - - - - - - - - - - -
Parwan Koh-i-Safi - - - 41 - 124 - - - - - - - - -
Parwan Salang - - - - - - - - - - - - - - -
Parwan Sayyid Khel - - - - - - - - - - - - - - -
Parwan Shaykh Ali - - - 263 - - - - - - - - - - -
Parwan Shinwari - - - 389 - - - - - - - - - - -
Parwan Surkh-i-Parsa - - - - - - - - - - - - - - -
0 0 0 1,310 0 124 p-f p-f p-f p-f p-f p-f p-f p-f p-f
Samangan Aybak (Provincial Center) - - 14 27 - - - - - - - - - - -
Samangan Darah-i-Soof-i-Bala 614 - 34 196 1,454 1,182 - - - - - - - - -
Samangan Darah-i-Suf-i-Payin - - - - - - - - - - - - - - -
Samangan Fayroz Nakhcheer - - - - - - - - - - - - - - -
Samangan Hazrat-i-Sultan - - 29 85 280 90 - - - - - - - - -
Samangan Khuram wa Sar Bagh - - 24 238 307 99 - - - - - - - - -
Samangan Roi-Do-Ab - - - 605 1,833 589 - - - - - - - - -
614 100 101 1,151 3,874 1,960 p-f p-f p-f p-f p-f p-f p-f p-f p-f
Sari Pul Balkhab - - 453 204 95 188 - - - - - - - - -
Sari Pul Gosfandi - - - - - - - - - - - - - - -
Sari Pul Kohistanat - - - 471 1,424 377 - - - - - - - - -
Sari Pul Sangcharak - - - 687 441 1,122 16 - - - - - - - -
Sari Pul Sari Pul (Provincial Center) - - 595 476 959 415 203 - - - - - - - -
Sari Pul Sayyad - - - 23 52 25 41 - - - - - - 195 331
Sari Pul Sozma Qala - 57 380 113 256 124 - - - - - - - - -
0 57 1,428 1,974 3,227 2,251 260 p-f p-f p-f p-f p-f p-f 195 331
Paktika Total
Paktya Total
Parwan Total
Samangan Total
Sari Pul Total
Nuristan Total
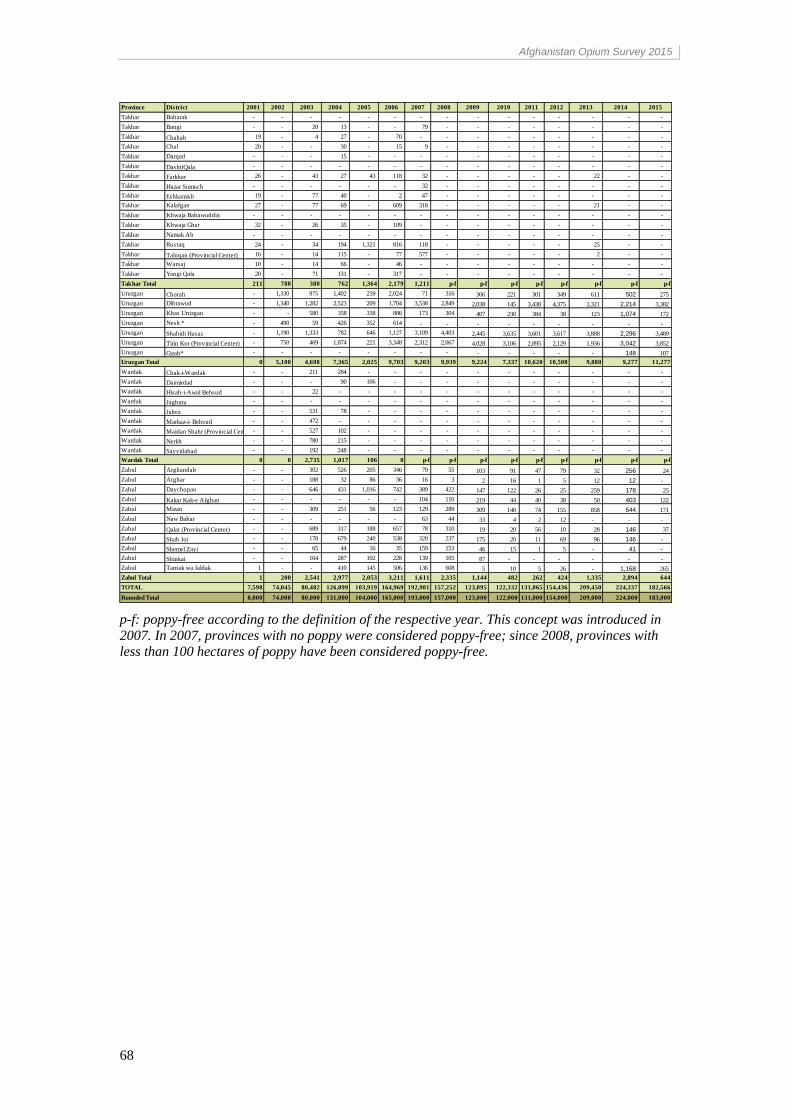
Afghanistan Opium Survey 2015
68
p-f: poppy-free according to the definition of the respective year. This concept was introduced in
2007. In 2007, provinces with no poppy were considered poppy-free; since 2008, provinces with less than 100 hectares of poppy have been considered poppy-free.
Province District 2001 2002 2003 2004 2005 2006 2007 2008 2009 2010 2011 2012 2013 2014 2015
Takhar Baharak - - - - - - - - - - - - - - -
Takhar Bangi - - 20 13 - - 79 - - - - - - - -
Takhar Chahab 19 - 4 27 - 70 - - - - - - - - -
Takhar Chal 20 - - 30 - 15 9 - - - - - - - -
Takhar Darqad - - - 15 - - - - - - - - - - -
Takhar DashtiQala - - - - - - - - - - - - - - -
Takhar Farkhar 26 - 43 27 43 118 32 - - - - - 22 - -
Takhar Hazar Sumuch - - - - - - 32 - - - - - - - -
Takhar Eshkamish 19 - 77 40 - 2 47 - - - - - - - -
Takhar Kalafgan 27 - 77 69 - 609 318 - - - - - 21 - -
Takhar Khwaja Bahawuddin - - - - - - - - - - - - - - -
Takhar Khwaja Ghar 32 - 26 35 - 109 - - - - - - - - -
Takhar Namak Ab - - - - - - - - - - - - - - -
Takhar Rustaq 24 - 34 194 1,321 816 118 - - - - - 25 - -
Takhar Taloqan (Provincial Center) 16 - 14 115 - 77 577 - - - - - 2 - -
Takhar Warsaj 10 - 14 66 - 46 - - - - - - - - -
Takhar Yangi Qala 20 - 71 131 - 317 - - - - - - - - -
211 788 380 762 1,364 2,179 1,211 p-f p-f p-f p-f p-f p-f p-f p-f
Uruzgan Chorah - 1,330 975 1,402 259 2,024 71 316 306 221 301 349 611 502 275
Uruzgan Dihrawud - 1,340 1,282 2,523 209 1,704 3,538 2,849 2,038 145 3,438 4,375 3,321 2,214 3,382
Uruzgan Khas Uruzgan - - 580 358 338 886 173 304 407 230 384 38 123 1,074 172
Uruzgan Nesh * - 490 59 426 352 614 - - - - - - - - -
Uruzgan Shahidi Hasas - 1,190 1,333 782 646 1,127 3,109 4,403 2,445 3,635 3,601 3,617 3,888 2,296 3,489
Uruzgan Tirin Kot (Provincial Center) - 750 469 1,874 221 3,348 2,312 2,067 4,028 3,106 2,895 2,129 1,936 3,042 3,852
Uruzgan Gizab* - - - - - - - - - - - - - 148 107
0 5,100 4,698 7,365 2,025 9,703 9,203 9,939 9,224 7,337 10,620 10,508 9,880 9,277 11,277
Wardak Chak-i-Wardak - - 211 284 - - - - - - - - - - -
Wardak Daimirdad - - - 90 106 - - - - - - - - - -
Wardak Hisah-i-Awal Behsud - - 22 - - - - - - - - - - - -
Wardak Jaghatu - - - - - - - - - - - - - - -
Wardak Jalrez - - 531 78 - - - - - - - - - - -
Wardak Markaz-i- Behsud - - 472 - - - - - - - - - - - -
Wardak Maidan Shahr (Provincial Center)- - 527 102 - - - - - - - - - - -
Wardak Nerkh - - 780 215 - - - - - - - - - - -
Wardak Sayyidabad - - 192 248 - - - - - - - - - - -
0 0 2,735 1,017 106 0 p-f p-f p-f p-f p-f p-f p-f p-f p-f
Zabul Arghandab - - 302 526 205 346 79 55 103 91 47 79 32 256 24
Zabul Atghar - - 188 32 86 36 16 3 2 16 1 5 12 12 -
Zabul Daychopan - - 646 431 1,016 742 389 422 147 122 26 25 259 178 25
Zabul Kakar Kak-e Afghan - - - - - - 104 110 219 44 40 38 50 403 122
Zabul Mizan - - 309 251 56 123 129 289 309 140 74 155 858 544 171
Zabul Naw Bahar - - - - - - 63 44 33 4 2 12 - - -
Zabul Qalat (Provincial Center) - - 689 317 188 657 78 310 19 20 56 10 28 146 37
Zabul Shah Joi - - 178 679 240 538 320 237 175 20 11 69 96 146 -
Zabul Shemel Zayi - - 65 44 16 35 159 153 46 15 1 5 - 41 -
Zabul Shinkai - - 164 287 102 228 139 105 87 - - - - - -
Zabul Tarnak wa Jaldak 1 - - 410 145 506 136 608 5 10 5 26 - 1,168 265
1 200 2,541 2,977 2,053 3,211 1,611 2,335 1,144 482 262 424 1,335 2,894 644
7,598 74,045 80,482 126,899 103,919 164,969 192,981 157,252 123,095 122,332 131,065 154,436 209,450 224,337 182,566
8,000 74,000 80,000 131,000 104,000 165,000 193,000 157,000 123,000 122,000 131,000 154,000 209,000 224,000 183,000
Uruzgan Total
Wardak Total
Zabul Total
TOTAL
Rounded Total
Takhar Total
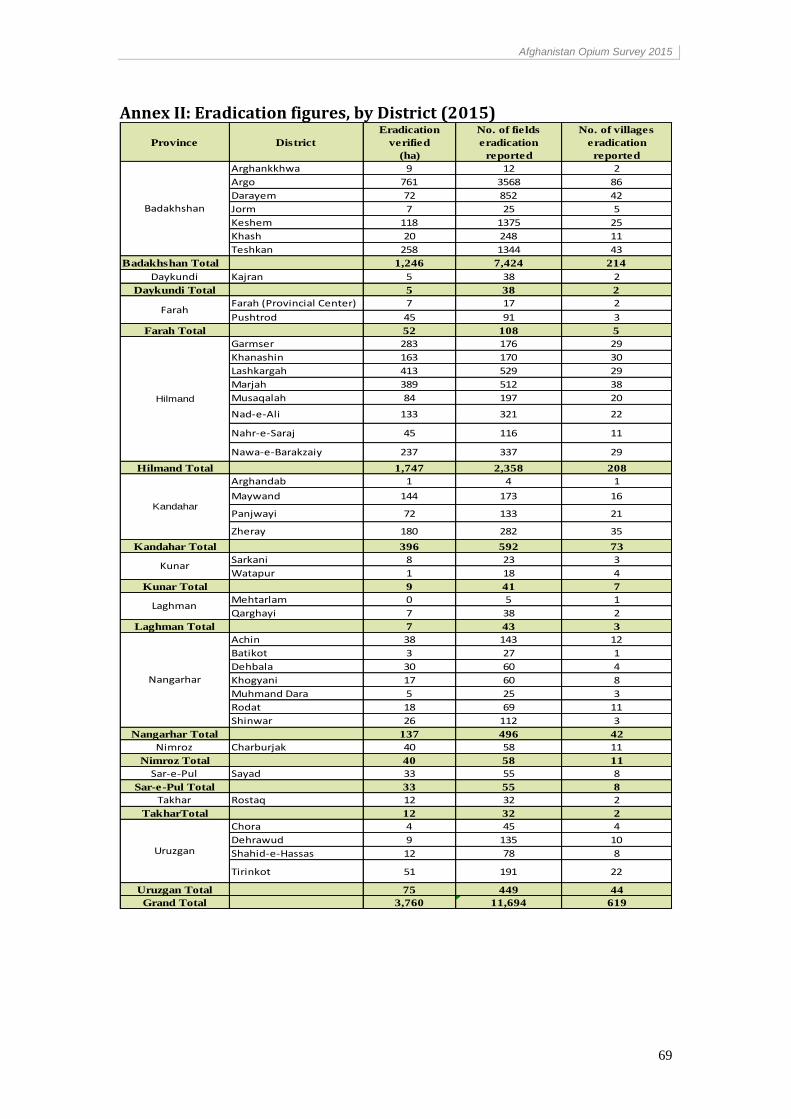
Afghanistan Opium Survey 2015
69
Annex II: Eradication figures, by District (2015)
Province District
Eradication
verified
(ha)
No. of fields
eradication
reported
No. of villages
eradication
reported
Arghankkhwa 9 12 2
Argo 761 3568 86
Darayem 72 852 42
Jorm 7 25 5
Keshem 118 1375 25
Khash 20 248 11
Teshkan 258 1344 43
Badakhshan Total 1,246 7,424 214
Daykundi Kajran 5 38 2
Daykundi Total 5 38 2
Farah (Provincial Center) 7 17 2
Pushtrod 45 91 3
Farah Total 52 108 5
Garmser 283 176 29
Khanashin 163 170 30
Lashkargah 413 529 29
Marjah 389 512 38
Musaqalah 84 197 20
Nad-e-Ali 133 321 22
Nahr-e-Saraj 45 116 11
Nawa-e-Barakzaiy 237 337 29
Hilmand Total 1,747 2,358 208
Arghandab 1 4 1
Maywand 144 173 16
Panjwayi 72 133 21
Zheray 180 282 35
Kandahar Total 396 592 73
Sarkani 8 23 3
Watapur 1 18 4
Kunar Total 9 41 7
Mehtarlam 0 5 1
Qarghayi 7 38 2
Laghman Total 7 43 3
Achin 38 143 12
Batikot 3 27 1
Dehbala 30 60 4
Khogyani 17 60 8
Muhmand Dara 5 25 3
Rodat 18 69 11
Shinwar 26 112 3
Nangarhar Total 137 496 42
Nimroz Charburjak 40 58 11
Nimroz Total 40 58 11
Sar-e-Pul Sayad 33 55 8
Sar-e-Pul Total 33 55 8
Takhar Rostaq 12 32 2
TakharTotal 12 32 2
Chora 4 45 4
Dehrawud 9 135 10
Shahid-e-Hassas 12 78 8
Tirinkot 51 191 22
Uruzgan Total 75 449 44
Grand Total 3,760 11,694 619
Uruzgan
Hilmand
Farah
Laghman
Kandahar
Kunar
Nangarhar
Badakhshan