Embed Size (px)
Citation preview

AfghanistanCannabis survey 2010
June 2011
Vienna International Centre, PO Box 500, 1400 Vienna, Austria Tel.: (+43-1) 26060-0, Fax: (+43-1) 26060-5866, www.unodc.org A
FGH
AN
ISTA
N C
AN
NA
BIS
SU
RV
EY
2010
Government of AfghanistanMinistry of Counter Narcotics

Afghanistan Cannabis Survey 2010
ABBREVIATIONS ANDS Afghanistan National Development Strategy AOPS Annual Opium Poppy Survey CNPA Counter Narcotics Police of Afghanistan ICMP Illicit Crop Monitoring Programme (UNODC) MCN Ministry of Counter-Narcotics NDCS National Drug Control Strategy UNODC United Nations Office on Drugs and Crime
ACKNOWLEDGEMENTS The following organizations and individuals contributed to the implementation of the 2010 Afghanistan Cannabis Survey and to the preparation of this report: Ministry of Counter-Narcotics: Mohammad Ibrahim Azhar (Deputy Minister), Haroon Rashid Sherzad (Director General), Policy & Coordination, Mir Abdullah (Director of Survey and Monitoring Directorate), Saraj Ahmad (Deputy Director of Survey and Monitoring Directorate). Survey Coordinators: Eshaq Masumi (Central Region), Abdul Mateen (Eastern Region), Abdul Latif Ehsan (Western Region), Fida Mohammad (Northern Region), Mohammed Ishaq Anderabi (North-Eastern Region), Khalil Ahmad (Southern Region), Khiali Jan Mangal (Eradication Verification Reporter), Sayed Najibullah Ahmadi (Economic specialist), Mohammad Khyber Wardak (Database officer), Mohammad Sadiq Rizaee (Remote Sensing), Shiraz Khan Hadawe (GIS & Remote Sensing Analyst), Mohammad Ajmal (Data entry), Sahar (Data entry), Mohammad Hakim Hayat (Data entry). United Nations Office on Drugs and Crime (Kabul): Jean-Luc Lemahieu (Country Representative), Ashita Mittal (Deputy Representative, Programme), Devashish Dhar (International Project Coordinator), Ziauddin Zaki (National Project Coordinator), Abdul Mannan Ahmadzai (Survey Officer), Noor Mohammad Sadiq (Database Developer) Remote sensing analysts: Ahmad Jawid Ghiasee and Sayed Sadat Mehdi Eradication reporters: Ramin Sobhi and Zia Ulhaq Sidiqi Survey Coordinators: Abdul Basir Basiret (Eastern Region), Abdul Jalil (Northern Region), Sayed Ahmad (Southern Region), Fawad Ahmad Alaie (Western Region), Mohammad Rafi (North-eastern Region), Rahimullah Omar (Central Region), Provincial Coordinators: Fazal Mohammad Fazli (Southern Region), Mohammad Alam Ghalib Eastern Region), Altaf Hussain Joya (Western Region), Lutfurhaman Lutfi (Northern Region). United Nations Office on Drugs and Crime (Vienna): Sandeep Chawla (Director, Division for Policy Analysis and Public Affairs), Angela Me (Chief, Statistics and Surveys Section-SASS), Martin Raithelhuber (Programme Officer), Philip Davis (Statistician), Coen Bussink (GIS & Remote Sensing Expert), Dorien Braam (Consultant) (all SASS), Suzanne Kunnen (Public Information Assistant, Studies and Threat Analysis Section). The implementation of the survey would not have been possible without the dedicated work of the field surveyors, who often faced difficult security conditions. The Afghanistan Cannabis Survey 2010 was financed by the United States of America. The MCN/UNODC Illicit Crop Monitoring activities in Afghanistan were made possible by financial contributions from the Governments of Germany, Norway, the United Kingdom and the United States of America. This report has not been formally edited.

Afghanistan Cannabis Survey 2010
3
TABLE OF CONTENTS
EXECUTIVE SUMMARY ..........................................................................................................................7 1 INTRODUCTION .....................................................................................................................................9 2 FINDINGS................................................................................................................................................12
CANNABIS CULTIVATION ......................................................................................................................... 12 CANNABIS AND OPIUM CULTIVATION .................................................................................................. 15 CANNABIS YIELD ........................................................................................................................................ 26 POTENTIAL CANNABIS PRODUCTION.................................................................................................... 27 REASONS FOR CULTIVATING CANNABIS.............................................................................................. 27 AGRICULTURAL ASSISTANCE RECEIVED ............................................................................................. 31 ACCESS TO FACILITIES .............................................................................................................................. 32 INCOME SOURCES OF FARMERS AND CANNABIS CULTIVATION................................................... 33 CANNABIS CULTIVATING HOUSEHOLDS.............................................................................................. 37 INCOME FROM CANNABIS ........................................................................................................................ 37 CANNABIS PRICES....................................................................................................................................... 39 CANNABIS RESIN SEIZURES IN AFGHANISTAN AND NEIGHBOURING COUNTRIES................... 41 PAYMENT OF TAX ON CANNABIS (USHER)........................................................................................... 44 FARM-GATE VALUE OF CANNABIS RESIN PRODUCTION.................................................................. 46
3 METHODOLOGY ..................................................................................................................................47 SURVEY COMPONENTS.............................................................................................................................. 47 ESTIMATIONS ............................................................................................................................................... 51
ANNEX:.......................................................................................................................................................55 CANNABIS GARDA PROCESSING IN LOGAR PROVINCE .................................................................... 55 PICTURES OF CANNABIS FIELDS AT FLOWERING STAGE................................................................. 56

Afghanistan Cannabis Survey 2010
4
INDEX OF TABLES__________________________________________________________________
Table 1: Cannabis cultivation by province, 2009 and 2010............................................................................. 13 Table 2: Cannabis and opium cultivation by province, 2010.......................................................................... 14 Table 3: Cannabis and opium cultivation status 2009 vs. 2010 by number of provinces (34 provinces) .... 15 Table 4: Average cannabis garda yield by region (kg/ha), 2010..................................................................... 26 Table 5: Potential cannabis resin garda production, 2010.............................................................................. 27 Table 6: Farm-gate prices of cannabis resin (garda) by region (US$/kg), January 2011............................. 39 Table 7: Farm-gate hashish price as proportion of cannabis garda powder price (US$/kg) ....................... 41 Table 8: Sample and target provinces 2010...................................................................................................... 51 Table 9: Cannabis garda production (mt), 2010 .............................................................................................. 52 Table 10: Prices of 2nd and 3rd garda reported by headmen as proportion of 1st garda, 2010 ..................... 53 Table 11: Farm-gate prices of cannabis, January 2011................................................................................... 53 Table 12: Farm-gate value of cannabis production (US$), 2010 .................................................................... 53 Table 13: Gross income from cannabis resin per hectare (US$/ha), 2010 ..................................................... 54
INDEX OF PHOTOS________________________________________________________________
Photo 1: Morphological differences between male and female cannabis plants ............................................. 9 Photo 2: Cannabis at flowering stage, Baghlan province, 2010...................................................................... 15 Photo 3: Cannabis field in flowering stage as seen on a false-colour satellite image, central Kandahar
province, 2010............................................................................................................................................ 17 Photo 4: Cannabis in flowering stage, Dehsala district, Baghlan province, 2010 ......................................... 18 Photo 5: Cannabis field (mono-crop) in flowering stage, central Kandahar province, 2010 ....................... 20 Photo 6: Cannabis field in Paktya province, 2010 ........................................................................................... 25 Photo 7: Mature female cannabis plant with resin glands .............................................................................. 26
INDEX OF FIGURES__________________________________________________________________
Figure 1: Change of cannabis cultivation occurrence by region, 2005 - 2010 ............................................... 16 Figure 2: Years of cannabis cultivation between 2004-2009 reported by farmers who cultivated cannabis
at least once during 2004-2009 but not in 2010 (n=889).........................................................................17 Figure 3: Varieties of cannabis cultivated in 2009 and 2010 as reported by cannabis farmers................... 19 Figure 4: Cannabis cropping patterns reported by cannabis cultivating farmers, 2010 (n=333)................ 20 Figure 5: Regional cannabis cropping patterns reported by farmers growing cannabis, 2010 (n=333)..... 21 Figure 6: Cannabis cultivation frequency 2005-2010 of farmers cultivating cannabis in 2010 (n=333) ..... 22 Figure 7: Years of cannabis cultivation between 2005-2010 reported by cannabis growing farmers in 2010
(n=333) ....................................................................................................................................................... 22 Figure 8: Reasons for cultivating cannabis in 2009 and 2010 (n = 333)......................................................... 27 Figure 9: Reasons for stopping cannabis cultivation (n = 889)....................................................................... 28 Figure 10: Conditions for potentially resuming cannabis cultivation in future, reported by farmers who
stopped cultivation (n=889) ...................................................................................................................... 29 Figure 11: Reasons for never cultivating cannabis 2010 (n = 3,134) .............................................................. 29 Figure 12: Reasons for potentially cultivating cannabis in future as reported by farmers who never grown
cannabis in 2009 and 2010 (n=3,134)....................................................................................................... 30 Figure 13: Ratio of farmer status to land ......................................................................................................... 31 Figure 14: Types of agricultural assistance received in 2010 as reported by headmen (n=591).................. 31 Figure 15: Access to services in the cannabis risk area, 2010 (n = 1,452) ...................................................... 32
Afghanistan Cannabis Survey 2010
5
Figure 16: Access to schools in the cannabis risk area, by cannabis growing status, 2010 .......................... 33 Figure 17: Contributions to 2009 income in cannabis-growing households by source (data collected in
2010) ........................................................................................................................................................... 34 Figure 18: Contributions to 2009 income in non-cannabis growing (stopped cannabis cultivation in 2010
or before) households by source (data collected in 2010).......................................................................34 Figure 19: Contributions to 2009 income in non-cannabis growing (farmers who never cultivated
cannabis) households by source (data collected in 2010) ....................................................................... 35 Figure 20: Distribution of cultivated area under main cash crops for cannabis farmers, 2010 (n=333) .... 36 Figure 21: Coping strategies for the reduced income after having stopped cannabis cultivation ............... 36 Figure 22: Average annual per hectare income from cannabis and opium (US$/ha), 2010......................... 37 Figure 23: Comparison of expenditure distribution per hectare of opium and cannabis cultivation, 201038 Figure 24: Monthly farm-gate prices of cannabis garda (best quality, 1st garda) by region, Jan. 2006 –
Feb. 2011 .................................................................................................................................................... 40 Figure 25: Average annual prices of cannabis products in Pakistan and Afghanistan, 2006-2010............. 41 Figure 26: Cannabis resin seizures in Afghanistan, Iran and Pakistan (kg), 2001-2010.............................. 42 Figure 27: Pakistan, cannabis resin seizure amounts (kg) and number of cases, 2001-2009 ....................... 43 Figure 28: Cannabis resin seizures (kg), 2001-2009......................................................................................... 43 Figure 29: Payment of usher by region reported by cannabis farmers in 2010 (n=333) .............................. 44 Figure 30: Type of usher payment made by cannabis farmers (n=145) ........................................................ 45 Figure 31: Recipients of usher payment as reported by cannabis farmers (n=145) ..................................... 45 Figure 32: Farm-gate value of cannabis resin and opium production (US$ million), 2009 and 2010 ......... 46
INDEX OF MAPS
Map 1: Cannabis cultivation status by province, 2010.................................................................................... 11 Map 2: Planting dates of cannabis, 2010 .......................................................................................................... 23 Map 3: Harvesting dates of cannabis, 2010 ...................................................................................................... 24 Map 4: Cannabis risk area and selected villages for the cannabis village survey, 2010.............................. 48 Map 5: Sampling frame and selected cells for the cannabis satellite survey, 2010 ...................................... 49

Afghanistan Cannabis Survey 2010
6
Fact Sheet Afghanistan Cannabis Survey 2010
2009 Change on 2009 2010
Cannabis cultivation1 10,000 – 24,000 ha * 9,000 – 29,000 ha
No. of provinces with cannabis cultivation 17 +2 19
Average cannabis resin powder (garda) yield from cannabis in mono-crop cultivation
1st garda: 68 kg/ha 2nd garda: 46 kg/ha 3rd garda: 30 kg/ha Total: 145 kg/ha
-12%
1st garda: 63 kg/ha 2nd garda: 41 kg/ha 3rd garda: 24 kg/ha Total: 128 kg/ha
Potential cannabis resin powder (garda) production 1,500 – 3,500 mt * 1,200 – 3,700 mt
Cannabis-growing households 40,000 (25,000 - 60,000) +18% 47,000
(27,000 - 88,000) Average cannabis cultivated per cannabis growing-household 0.4 ha 0.33 ha
Average opium poppy cultivated per opium-growing household 0.5 ha 0.49 ha
Proportion of cannabis farmers who also grew opium 67% 61%
Average farm-gate prices of cannabis resin at the time of resin processing (January), weighted by production2
1st garda: US$ 35/kg 2nd garda: US$ 24/kg 3rd garda: US$ 12/kg
+146% +175% +225%
1st garda: US$ 86/kg 2nd garda: US$ 66/kg 3rd garda: US$ 39/kg
Total farm-gate value of cannabis resin production (all garda qualities)
US$ 39 – 94 million * US$ 85 – 263 million
As % of GDP3 0.4% - 0.9% 0.7% - 2.0% Average yearly gross income from cannabis of cannabis-growing households
US$ 1,553 +93% US$ 3,000
Average yearly gross income from opium of opium-growing households
US$ 1,786 +36% US$ 2,433
Income from cannabis per ha (gross/net)** US$ 3,900 / 3,341 +131%/+150% US$ 9,000 / 8,341
Income from opium per ha (gross/net)** US$ 3,600 / 2,005 +36%/+45% US$ 4,900 / 2,900
Income from wheat per ha (gross/net)** US$ 1,200 / 960 -36%/-38% US$ 770 / 600
* Due to the uncertainty associated with the estimate, a change rate could not be calculated. ** Income figures are indicative only as they do not include all expenditure and income components associated with cultivation.
1 Cannabis cultivation was defined as mono-crop cannabis cultivated in fields in the cannabis risk area (22 of the 34 provinces of Afghanistan) . Small-scale and mixed cultivation could not be considered. 2 In 2009, the simple average price of cannabis garda was reported. However, in line with other reports and to improve comparability, the average price weighted by production is presented here for both years. 3 Nominal GDP of the respective year. Source: Gov. of Afghanistan, Central Statistical Office.

Afghanistan Cannabis Survey 2010
7
EXECUTIVE SUMMARY
This 2010 Afghanistan Cannabis Survey updates the first-ever Afghanistan Cannabis Survey that was produced in 2009 by the UNODC and the Ministry of Counter Narcotics (MCN). Based on years of evidence from cannabis seizures that pointed to Afghanistan as a main cannabis producer, the 2009 survey was the initial effort to systemically estimate cannabis cultivation and production in the country. The findings confirmed Afghanistan’s role as a major grower of cannabis, but also discovered that the country produced more cannabis resin or hashish than any other nation. The reason why was found to be the country’s high yields, up to 145 kg of resin per hectare as compared to Morocco’s 40 kg per hectare. The 2010 survey – based on data from yield studies, satellite imagery and village-level interviews with farmers and headmen – found indications of both stability and change relative to the 2009 survey. Once again, due to very high yields, Afghanistan produced the world’s largest supply of hashish, with a production estimate of between 1,200 and 3,700 tons of cannabis resin a year – an estimate largely unchanged from the year before when the resin yield was estimated to be 1,500 to 3,500 tons a year. Also relatively stable was the amount of land devoted to growing cannabis, with between 9,000 and 29,000 hectares under cannabis cultivation in 2010. The number of Afghanistan’s 34 provinces that grow cannabis, however, increased from 17 in 2009 to 19 in 2010. No significant cannabis cultivation was reported in the remaining 15 provinces. In Afghanistan, cannabis is planted between April and June and harvested between October and January. While cannabis is mainly cultivated as a mono crop, some farmers cultivate cannabis along with other crops on so-called ‘bunds’ along the boundaries or edges of fields. Most cannabis fields require irrigation. The regional distribution of cannabis cultivation continued to change, especially when examined over the last six years. In 2005, cannabis cultivation was concentrated in the northern part of the country; then, between 2005-2009, the centre of cannabis cultivation shifted to the southern part of the country; and in 2010, cannabis cultivation appeared to be more widely distributed. Still, cannabis cultivation has long been associated with opium cultivation and insecurity and in 2010 that connection persisted. Most cannabis is cultivated in the insecure south where most opium is also produced. More than 60% of cannabis farmers also cultivated opium in 2010. Money and poverty alleviation remain the primary reasons reported by farmers to cultivate cannabis and in 2010 farmers had more incentives to grow cannabis than ever. While prices levels of cannabis in Afghanistan remained relatively stable between 2006-2009, prices rose sharply in 2010, particularly in the Northern and North-eastern regions of the country. Farmers’ gross income from cannabis per hectare in 2010 increased 130%, from US$ 3,900/ha in 2009 to US$ 9,000/ha in 2010. This greatly exceeded farmers’ gross income from opium (US$ 4,900/ha) and farmers’ gross income from wheat (US$ 770/ha). Comparatively, gross income from opium increased by 36% in 2010 over 2009, while gross income from wheat fell by nearly half (47%). Consequently, the average gross household income from cannabis-growing households nearly doubled, from US$1,553 in 2009 to US$3,000 in 2010. Similarly, the percentage of GDP represented by the total farm-gate value of cannabis resin more than doubled, from up to 0.9% in 2009 to up to 2% in 2010. Farm-gate prices of cannabis resin powder (garda) varied considerably between the North/North-eastern and other regions. This likely reflects differences in quality (proportion of resin to plant material) as well as other factors such as the degree of resin supply and demand.

Afghanistan Cannabis Survey 2010
8
Farmers cited the Government ban and the religious ban on cannabis cultivation most frequently when asked why they had stopped cannabis cultivation in 2010. However, considerably fewer farmers in 2010 mentioned the Government ban than in 2009.

Afghanistan Cannabis Survey 2010
9
1 INTRODUCTION
This report presents the results of the second dedicated Afghanistan Cannabis Survey implemented by UNODC and the Ministry of Counter Narcotics (MCN). The first survey was carried out in 2009, as evidence from cannabis resin seizures had long pointed to Afghanistan as one of the world’s main producers of the drug. The survey consisted of village level interviews with farmers and headmen, yield studies and satellite image interpretation. The main village survey with headmen and farmer interviews was implemented between July and September 2010. Cannabis resin yield was investigated through the information provided by headmen and farmers during the village survey and a yield observation study undertaken in January 2011, when the actual resin production took place. The lower cannabis area estimate is based on the interpretation of 157 very high resolution satellite images, the higher estimate is based on headmen estimates of cannabis cultivation in their village. As in 2009, the estimation of cannabis cultivation and production in 2010 was in many ways more complicated than for opium poppy. The amount of small-scale cannabis cultivation in kitchen gardens and along the boundaries of fields (“bunds”) is difficult to quantify and cannot be captured with the methodology used. The fact that in some provinces cannabis is intercropped with licit crops makes the interpretation of satellite images and responses from farmers difficult. Such mixed fields, which do not show a typical cannabis reflectance pattern in images, cannot be identified with the current methodology. Thus, the area estimate from the remote sensing survey refers only to the mono-crop cannabis fields and does not consider cannabis in kitchen-gardens, along field boundaries and in mixed fields. The volatile situation in southern Afghanistan made the collection of ground truth information to support the satellite image analysis difficult in many areas and impossible in others. The 2010 cannabis survey has been implemented within the technical framework of UNODC’s Illicit Crop Monitoring Programme (ICMP) under the project AD/AFG/F98. The objective of ICMP is to assist the international community in monitoring the extent and evolution of illicit crops within the context of the Political Declaration and Plan of Action on International Cooperation towards an Integrated and Balanced Strategy to Counter the World Drug Problem, adopted by Member States in 2009. 4
Photo 1: Morphological differences between male and female cannabis plants
Cannabis female plant in Dand district (Kandahar) Cannabis male plant with flower buds (Kandahar)
4 E/2009/28, E/CN.7/2009/12, Political Declaration and Plan of Action on International Cooperation towards an Integrated and Balanced Strategy to Counter the World Drug Problem.

Afghanistan Cannabis Survey 2010
10
Botanical information on the cannabis plant5:
Cannabis - also known as “marijuana” or “marihuana” - is a plant under the Cannabaceae family. It is a dioecious plant, meaning that the male and female flowers develop on separate plants, although monoecious examples with both sexes on one plant are also found. The development of branches containing flowering organs varies greatly between male and female plants. Female flowers are tightly crowded between small leaves while male flowers hang in long, loose, multi-branched, clustered limbs up to 30 centimetres (12 inches) long and shed their pollen and die several weeks prior to seed ripening on the female plant. The female plants tend to be shorter and have more branches than the male ones. Female plants are leafy to the top with many leaves surrounding the flowers, while male plants have fewer leaves near the top with few if any leaves along the extended flowering limbs and can produce hundreds of seeds. Stems are erect, green and hollow and longitudinally grooved. It has been noted that the height of cannabis plants has gone up to 1-3 meters in different parts of Afghanistan. Cannabis normally matures annual and timing is influenced by the age of the plant, changes in the photo-period (length of daylight), and other environmental conditions. Flowering: Flowering usually starts when darkness exceeds eleven hours per day. The flowering cycle lasts around four to 12 weeks depending on environmental conditions. Harvesting: Floral clusters should be harvested when resin secretion and associated terpenoid and cannabinoid biosynthesis are at their peak which is just after the pistils have begun to turn brown but before the calyx stops growing. The floral clusters are responsible for the production of seeds, drugs, and aromatic resins. Yield: Yield varies across the different regions of the country. The product obtained from the dried cannabis plant through threshing and sieving is a powdery substance with varying proportions of resin and other plant matter, locally called “garda”. Further processing is required to turn garda into hashish or “charas” as it is called in the local language, the consumable form of cannabis resin.
5. Information from David T. Brown (1998): Cannabis, the Genus Cannabis. Amsterdam; Robert C. Clarke (1981): Marijuana Botany. Oakland; and from UNODC internal reports on cannabis in Afghanistan.

Afghanistan Cannabis Survey 2010
11
Map
1: C
anna
bis c
ultiv
atio
n st
atus
by
prov
ince
, 201
0
PA
KIS
TA
NP
AK
IST
AN
TU
RK
ME
NIS
TA
NT
UR
KM
EN
IST
AN
TA
JIK
IST
AN
TA
JIK
IST
AN
UZ
BE
KIS
TA
NU
ZB
EK
IST
AN
IRA
NIR
AN
Hira
t Fara
h
Gho
r
Hilm
and
Kand
ahar
Nim
roz
Bada
khsh
anBa
lkh
Gha
zni
Zabu
l
Fary
ab
Badg
his
Pakt
ika
Bagh
lan
Bam
yan
Sari
Pul
Takh
ar
Day
kund
i
Jaw
zjan
War
dak
Uru
zgan
Sam
anga
n
Nur
ista
n
Kund
uz
Kuna
r
Kabu
l
Khos
tNan
garh
arLo
gar
Parw
an Pakt
iyaPa
njsh
ir
Lagh
man
Kapi
sa
g,
Sou
rce:
MC
N-
UN
OD
CA
fgha
nist
anC
anna
bis
Sur
vey
2010
Not
e:T
hebo
unda
ries
and
nam
es
show
na
ndth
ede
sig
natio
nsu
sed
onth
ism
apdo
noti
mpl
yof
ficia
len
dors
emen
tora
ccep
tanc
eby
the
Un
ited
Nat
ions
.Geo
grap
hic
proj
ectio
n:W
GS
84
015
030
075
KmLege
ndC
anna
bis
culti
vatio
n
Inte
rnat
iona
lbou
ndar
y
Can
nabi
scu
ltiva
tion
Out
side
surv
eyed
cann
abis
risk
area
(no
culti
vatio
nre
porte
d)
No
cann
abis
culti
vatio
n
Prov
inci
albo
unda
ry

Afghanistan Cannabis Survey 2010
12
2 FINDINGS
The 2010 cannabis survey covered the “cannabis risk area” in Afghanistan, i.e. 22 provinces, where cannabis cultivation had been observed or reported in past surveys. Field information from the other 12 provinces indicated that cannabis cultivation either did not exist or was limited to kitchen gardens or other forms of small-scale, non-commercial cultivation. The main components of the survey were a socio-economic survey conducted in 1,452 villages in 22 provinces of Afghanistan that included interviews with village headman plus individual interviews with three farmers per village, and the analysis of 157 high-resolution satellite images in 17 provinces. The survey covered only fields with mono-crop cannabis. Small-scale cultivation e.g. in kitchen gardens, flower pots, along the walls of compounds, along the boundaries of fields, “wild cannabis” or cannabis inter-cropped with other crops in the same field at the same time could not be considered for the area and production estimates of this survey. However, the survey investigated these cultivation patterns through farmers’ interviews and found that the vast majority of farmers grow cannabis as a mono-crop.
Cannabis cultivation
Cannabis cultivation in Afghanistan in 2010 ranged from 9,000 ha to 29,000 ha. Due to the uncertainties associated with the area estimates, a mid-point estimate could not be calculated. Cannabis cultivation was found to be much lower than opium poppy cultivation, which in 2010 amounted to 123,000 ha. The estimation methodology did not allow this survey to produce cannabis area estimates at the provincial level with sufficient accuracy, although over half of cannabis cultivation in 2010 was estimated to be in the Southern region. By and large this regional disparity with a concentration in the south reflects the current pattern of opium cultivation but is less pronounced, as cannabis was also found in several poppy-free provinces. Cannabis cultivation was found in all 17 provinces covered by satellite images and the village survey and in two more surveyed provinces covered only by the village survey (Khost and Kunduz). The provinces of Khost and Day Kundi, which were outside the cannabis risk area defined for the 2009 survey, were covered by the 2010 survey and cannabis cultivation was observed in both provinces. In Jawzjan province, which had cannabis cultivation in 2009, no evidence of large cannabis fields was found in 2010.

Afghanistan Cannabis Survey 2010
13
Table 1: Cannabis cultivation by province, 2009 and 2010
PROVINCE Cannabis cultivation 2009
Cannabis cultivation 2010
Kabul No cultivation reported* No cultivation reported* Khost No cultivation reported* Yes Logar Yes Yes Paktya Yes Yes Panjshir No cultivation reported* No cultivation reported* Parwan No cultivation reported* No cultivation reported* Wardak No cultivation reported* No cultivation reported* Ghazni No cultivation reported* No cultivation reported* Paktika No cultivation reported* No cultivation reported* Central Region Yes Yes Kapisa No cultivation reported* No cultivation reported* Kunar No cultivation reported* No cultivation reported* Laghman No cultivation reported* No cultivation reported* Nangarhar Yes Yes Nuristan No cultivation reported* No cultivation reported* Eastern Region Yes Yes Badakhshan Yes Yes Takhar Yes Yes Kunduz No Yes North-eastern Region Yes Yes Baghlan Yes Yes Balkh Yes Yes Bamyan No No Faryab Insignificant Yes Jawzjan Yes No Samangan No cultivation reported* No cultivation reported* Sari Pul No No Northern Region Yes Yes Hilmand Yes Yes Kandahar Yes Yes Uruzgan Yes Yes Zabul Yes Yes Day Kundi No cultivation reported* Yes Southern Region Yes Yes Badghis Yes Yes Farah Yes Yes Ghor No cultivation reported* No cultivation reported* Hirat Yes Yes Nimroz Yes Yes Western Region Yes Yes Total (rounded) 10,000-24,000 9,000-29,000
* These provinces were outside the cannabis risk area defined by the cannabis survey.

Afghanistan Cannabis Survey 2010
14
Table 2: Cannabis and opium cultivation by province, 2010
PROVINCE Opium cultivation 2010 (ha)
Cannabis cultivation 2010
Kabul 152 No cultivation reported* Khost Poppy-free Yes Logar Poppy-free Yes Paktya Poppy-free Yes Panjshir Poppy-free No cultivation reported* Parwan Poppy-free No cultivation reported* Wardak Poppy-free No cultivation reported* Ghazni Poppy-free No cultivation reported* Paktika Poppy-free No cultivation reported* Central Region 152 Yes Kapisa Poppy-free No cultivation reported* Kunar 154 No cultivation reported* Laghman 234 No cultivation reported* Nangarhar 719 Yes Nuristan Poppy-free No cultivation reported* Eastern Region 1,107 Yes Badakhshan 1,100 Yes Takhar Poppy-free Yes Kunduz Poppy-free Yes North-eastern Region 1,100 Yes Baghlan Poppy-free Yes Balkh Poppy-free Yes Bamyan Poppy-free No Faryab Poppy-free Yes Jawzjan Poppy-free No Samangan Poppy-free No cultivation reported* Sari Pul Poppy-free No Northern Region Poppy-free Yes Hilmand 65,045 Yes Kandahar 25,835 Yes Uruzgan 7,337 Yes Zabul 483 Yes Day Kundi 1,547 Yes Southern Region 100,247 Yes Badghis 2,958 Yes Farah 14,552 Yes Ghor Poppy-free No cultivation reported* Hirat 360 Yes Nimroz 2,039 Yes Western Region 19,909 Yes Total (rounded) 123,000 9,000-29,000
* These provinces were outside the cannabis risk area defined for the 2010 cannabis survey. The 12 provinces outside the cannabis risk area were considered to be without cannabis cultivation as defined for this survey as field information from survey activities in 2009 and 2010 did not indicated the existence of significant cannabis cultivation.

Afghanistan Cannabis Survey 2010
15
Cannabis and opium cultivation
As in 2009, in 2010 most of the large scale cannabis cultivation occurred in the Southern region where most of the opium cultivation (82%) was found in 2010. All five of the Southern provinces (Hilmand, Kandahar, Uruzgan, Zabul and Day Kundi) were affected by cannabis cultivation. There is a clear geographic association between opium and cannabis cultivation at the provincial level. This association exists at a household level, too, with almost two thirds of cannabis-growing households (61%) also reporting poppy cultivation in the preceding season. The link between cannabis and opium cultivation appears to exist at the trading level as well. Information gathered during 2010 surveyor debriefings indicated that a large proportion of cannabis traders trade also opium.
Table 3: Cannabis and opium cultivation status 2009 vs. 2010 by number of provinces (34 provinces)
Cultivation status 2009 2010
Cannabis only 7 8 Opium poppy only 4 3 Cannabis and opium poppy 10 11 Neither cannabis nor opium poppy 13 12
Note: Provinces with less than 100 ha of poppy cultivation are considered to be ’poppy-free’. For cannabis, no such threshold was applied as provincial estimates are not available.
Photo 2: Cannabis at flowering stage, Baghlan province, 2010

Afghanistan Cannabis Survey 2010
16
Cultivation trends
A dedicated survey to measure the extend of cultivation and production of cannabis in Afghanistan was undertaken only in the last two years, 2009-2010. However, information on cannabis cultivation was also collected during the Annual Opium Surveys from 2005 to 2010 where, information was collected on farmers’ intentions to cultivate cannabis in that year. Some information on trends over that period can be drawn from that source, although there are some limitations. The village level interviews undertaken during the opium survey were conducted during the opium cultivation period (spring) and before cannabis, a summer crop was planted. Thus, the reporting was based on farmers intention rather than actual cultivation as farmers could still change their decision on the summer cultivation. Furthermore, the existence of cannabis cultivation could not be verified by the surveyors during the opium surveys since the crop was not yet visible on the fields. Given these limitations, an accurate area estimate of cannabis cultivation could not be made on the basis of interviews done during the opium poppy survey, but some conclusions can be drawn:
• During the period under review (2005-2010), the proportion of villages reporting cannabis cultivation was always much smaller than the proportion of opium-cultivating villages. Typically, the samples showed about two to four times more opium-cultivating than cannabis-cultivating villages.
• The lower proportion of cannabis-cultivating villages and the smaller area of cannabis cultivated per village compared to opium cultivation, indicate that the level of cannabis cultivation in the years 2005 to 2010 was well below the level of opium cultivation in the same period.
• The proportion of villages in the sample reporting cannabis cultivation in the Southern region dramatically increased between 2005 – 2009, slightly decreased in 2010, while the number of cannabis cultivating villages in the Northern region decreased between 2005 – 2009, and slightly increased in 2010. Due to the low number of cannabis villages found in all years, it is difficult to assess whether these proportional changes indicate a change in cannabis cultivation in absolute terms in these regions.
The information on cannabis collected through the Annual Opium Surveys cannot be compared with the information collected during the two cannabis survey as the opium survey covers all provinces of Afghanistan whereas the cannabis survey covers only provinces identified as the ‘cannabis risk area’. In addition, only a small proportion of villages included in the opium surveys reported cannabis cultivation and this limited the reliability of the information collected on cannabis.
Figure 1: Change of cannabis cultivation occurrence by region, 2005 - 2010
0%
10%
20%
30%
40%
50%
60%
70%
80%
90%
100%
2005 2006 2007 2008 2009 2010
Can
nabi
s vi
llage
s in
AO
PS a
s %
of t
otal
vill
ages
Central Eastern Northeastern Northern Southern Western

Afghanistan Cannabis Survey 2010
17
Source: Annual Opium Poppy Surveys 2005-2010 Still, data collected from farmers who were not cultivating cannabis in 2010 but had an history of cannabis cultivation (n=889) confirm the North-South shift of cultivation. More farmers from other than the Southern and Western regions were cultivating cannabis in the early years between 2004-2009, while the pattern reversed in the late years. 6
Figure 2: Years of cannabis cultivation between 2004-2009 reported by farmers who cultivated cannabis at least once during 2004-2009 but not in 2010 (n=889)
0
50
100
150
200
250
300
350
2004 2005 2006 2007 2008 2009
Num
ber o
f far
mer
s cu
ltiva
ting
cann
abis
Souther/Western regions Other regions
Photo 3: Cannabis field in flowering stage as seen on a false-colour satellite image, central Kandahar province, 2010
6 The group of active cannabis farmers in 2010 showed a slightly different pattern: Here, the number of cannabis-cultivating farmers in other regions stagnated in the years 2004 to 2007 and only then increased, whereas in the Southern and Western regions, the number of cultivating farmers increased steadily and strongly in all years. The difference may be due to the fact that the sample size of active cannabis cultivating farmers in 2010 (n=333) is much smaller than the sample of farmers who stopped cannabis cultivation and does not cover all regions well.

Afghanistan Cannabis Survey 2010
18
Photo 4: Cannabis in flowering stage, Dehsala district, Baghlan province, 2010
Note: Upper image: false-colour satellite image with cannabis fields delineated in yellow. The green dot indicates the location of the photo below on the satellite image.

Afghanistan Cannabis Survey 2010
19
Cannabis varieties
So far, there has not been a comprehensive botanical study on cannabis varieties cultivated in Afghanistan. The information on varieties stems from farmers’ responses and reflects their naming conventions. It is possible that the same varieties are known by different local names or that the same name is used for different varieties. There are many local names given to cannabis in different regions. Mazari (Balkhi), Watani, Logari Shadani, Kharwari Shadani, Azraki Shadani, Machalghu Shadani, Gerd Lemanay, Sra chars and Surkhabi Shadani are the names of the varieties reported by farmers during the survey in 2010. The most popular cannabis variety in Afghanistan reported in 2010 was the Mazari (Balkhi) variety (47%) followed by Watani variety (35%). Mazari (Balkhi) variety was the most commonly reported variety in the Southern and North-eastern regions (54% and 59% respectively). In the Eastern region, Watani was the most commonly cultivated cannabis variety (73%). Logari Shadani was the most cultivated variety in the Central and Northern regions, (35% and 40% respectively).
Figure 3: Varieties of cannabis cultivated in 2009 and 2010 as reported by cannabis farmers
1%
0%
5%
0%
1%
1%
2%
4%
0%
6%
5%
5%
5%
7%
58%
0%
1%
1%
2%
2%
3%
3%
6%
35%
47%
0% 32% 64%
Bangi Hirati
Chaghali tokhom
Sabz Bang
Spera Botay
Unknown
Kandahari
Surkhabi Shadani
Sra chars
Gard Lemanay
Machalogh Shadani
Azraki Shadani
Kharwari Shadani
Logari Shadani
Watani
Mazari (Balkhi)
2009 2010
Cannabis cultivation pattern
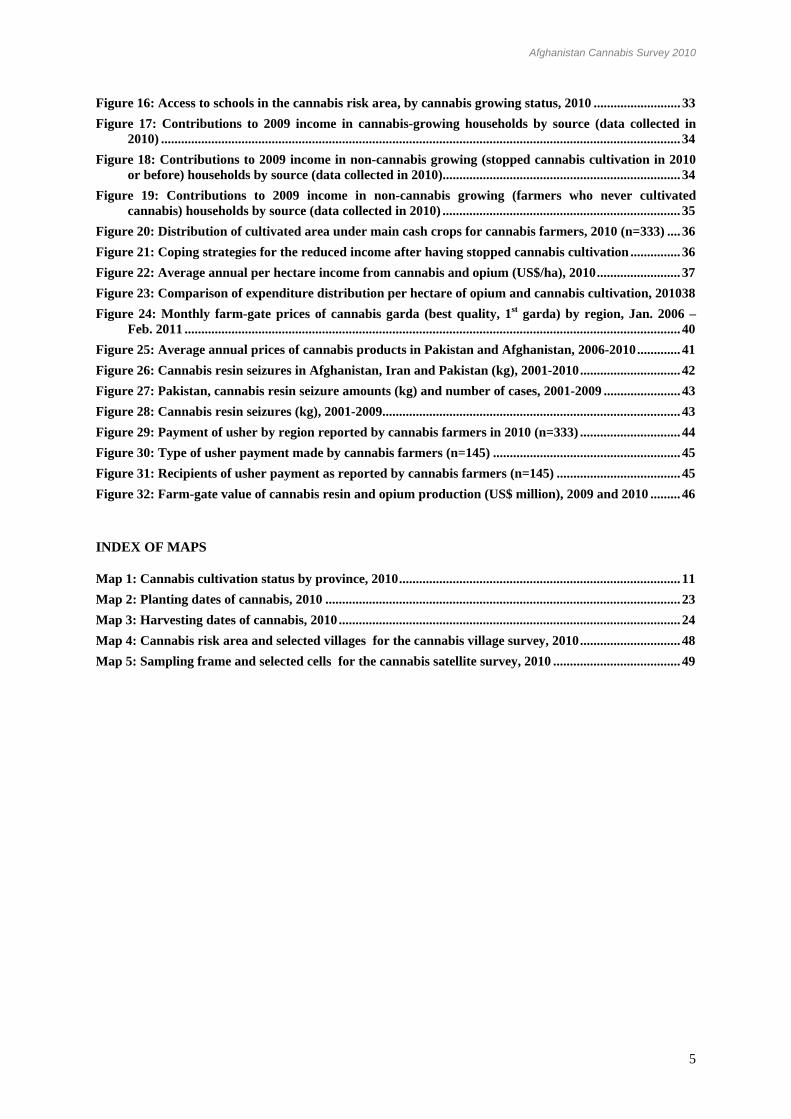
Cannabis is cultivated as a summer crop after the cultivation of winter crops such as wheat or poppy. It is an annual plant and has to be planted fresh every year. In Afghanistan, cannabis is mainly grown as a mono-crop, but also mixed cropping patterns exist. In addition, cannabis cultivation is found along field boundaries, which are often elevated in the form of small dykes called “bunds”. Among the farmers who grew cannabis in 2010, 89.7% cultivated it only as a mono-crop, 3.2% grew it as mono/mixed as well as on bunds, 3.1% cultivated cannabis as mono-crop in some fields and mixed in others, and 2.4% cultivated cannabis only mixed with other crops. The results indicate that mono-cropping is the predominant cultivation technique for cannabis, although farmer interviews did not provide a precise estimate of the proportion of mono-crop cannabis within the total area under cannabis cultivation.
Afghanistan Cannabis Survey 2010
20
Figure 4: Cannabis cropping patterns reported by cannabis cultivating farmers, 2010 (n=333)
Mono only, 89.7%
Mixed only, 2.4%
Mono and on bunds, 0.9%
Mono and mixed, 3.1%
Mixed and on bunds, 0.4%
Mono, mixed and on bunds, 3.2%
On bunds only, 0.3%
Significant regional differences in cannabis cropping patterns were observed between the Central and other regions. In the Central region, most of the cannabis farmers (79%) reported their cultivation pattern as mono-mixed and on bunds while in all other regions most of the farmers reported mono-crop cultivation. Mono-cropping was reported more frequently in 2010 than in 2009, when only 72% of cannabis farmers reported mono-cropping.
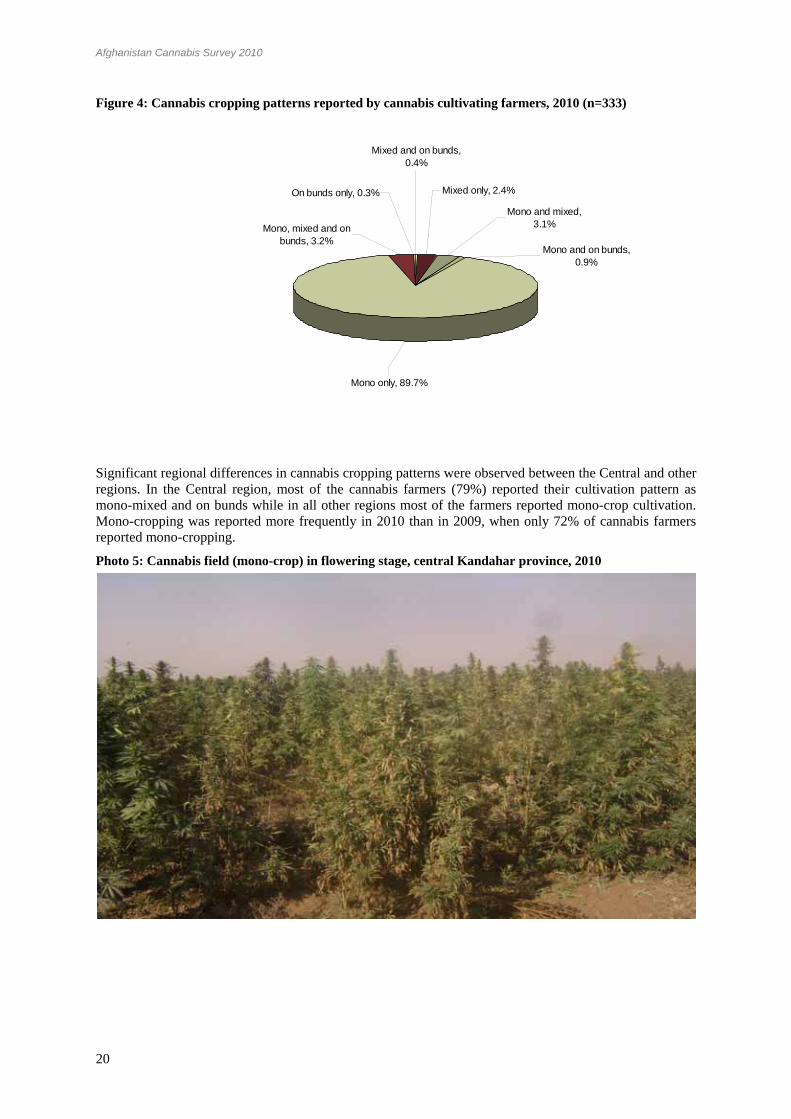
Photo 5: Cannabis field (mono-crop) in flowering stage, central Kandahar province, 2010

Afghanistan Cannabis Survey 2010
21
Figure 5: Regional cannabis cropping patterns reported by farmers growing cannabis, 2010 (n=333)
0%
10%
20%
30%
40%
50%
60%
70%
80%
90%
100%
Central Eastern North-eastern
Northern Southern Western
% o
f can
nabi
s fa
rmer
s
On bunds onlyMono, mixed and on bundsMono and on bundsMono and mixedMixed onlyMixed and on bundsMono only
Cannabis is often cultivated mixed with other crops, reportedly in order to protect other crops against insects but also to disguise its illicit cultivation. Licit crops which are often found mixed with cannabis include vegetables, cotton, maize and saffron. Cultivation on bunds is often done for personal use. In the fields surrounded by cannabis, farmers often grow other cash crops such as cotton, okra, and vegetables such as carrot, cucumber, mung bean, etc.
Frequency of cannabis cultivation between 2005-2010
In the village survey, farmers who grew cannabis in 2010 (n=333) were asked if and in which years they cultivated cannabis in the previous five years (since 2005). Only a small proportion of farmers (3%) were new cannabis farmers, i.e. having begun cannabis cultivation in 2010. Just over half of the cannabis farmers had cultivated cannabis on average only every second year or less often in the period 2005 to 2010. Less than half of the farmers cultivating cannabis in 2010 reported cannabis cultivation in most years but only a small proportion (6%) had cultivated in every year of the observation period 2005-2010. Some differences were found between farmers in the Southern region and other regions where the farmers who currently cultivate cannabis cultivated cannabis in the last 6 years more frequently than in the other regions. In the Southern region, 45% of cannabis farmers grew cannabis in 2010 as well as three or four other years between 2005-2009. In other regions the same percentage was almost half (24%). Nearly half of farmers (48%) in the Southern region had cultivated cannabis in 2010 as well as one or two other years between 2005-2009. This was true also for almost two thirds (65%) of farmers in other regions.

Afghanistan Cannabis Survey 2010
22
Figure 6: Cannabis cultivation frequency 2005-2010 of farmers cultivating cannabis in 2010 (n=333)
Frequent (in 2010 and 3 or 4
more years)41%
Infrequent (in 2010 and up to 2
more years)50%
Every year6%
Only in 20103%
This relatively high rate indicates that in the Southern region cannabis cultivation may be a more permanent feature of households’ agricultural portfolio than in other regions. It also suggests that in other regions cannabis might be easier to substitute: households can choose to cultivate cannabis only occasionally and they may have other options when they do not cultivate cannabis. It is possible that the regional shift of cannabis cultivation observed since 2005 is to some extent the result of an intensification in the Southern region (farmers growing cannabis more often, growing cannabis in most years instead of sporadically) and a corresponding cut-back in the Northern region (farmers growing less often, longer intervals between years in which they grow cannabis). Still, the regional disparity observed between the Southern region and the rest of the survey area was less pronounced in 2010 than in 2009. However, changes in cannabis cultivation frequency do not directly indicate corresponding changes in cultivated area, which is determined not only by the number of farmers growing cannabis but also by the average area cultivated by each farmer.
Figure 7: Years of cannabis cultivation between 2005-2010 reported by cannabis growing farmers in 2010 (n=333)
3% 4%
48%
65%
45%
24%
5% 7%
0%
10%
20%
30%
40%
50%
60%
70%
80%
90%
100%
Souther region Other regions
Started 2010 2010 and 1 or 2 more years since 2005
2010 and 3 or 4 more years since 2005 2010 and every year since 2005

Afghanistan Cannabis Survey 2010
23
Map
2: P
lant
ing
date
s of c
anna
bis,
2010
UZ
BE
KIS
TA
NU
ZB
EK
IST
AN
TAJI
KIS
TAN
IRA
NP
AK
IST
AN
PA
KIS
TA
N
IND
IA
TU
RK
ME
NIS
TA
NT
UR
KM
EN
IST
AN
Hira
t
Fara
h
Gho
r
Hilm
and
Nim
roz
Kand
ahar
Bada
khsh
an
Gha
zni
Balk
h
Zabu
l
Fary
ab
Bagh
lan
Badg
his
Pakt
ika
Sari
Pul
Takh
ar
Bam
yan
Day
Kun
di
Jaw
zjan
Uru
zgan
War
dak
Nur
ista
n
Kund
uz
Sam
anga
n
Kuna
r
Kabu
l
Loga
r
Khos
tPa
ktya
Parw
an
Nan
garh
ar
Panj
shir
Lagh
man
Kapi
sa
Re
g
Dis
hu
Ch
ahar
Bu
rjak
Wa
khan
Adr
ask
an
Ga
rmS
erJaw
and
Ana
rD
ara
h
Gu
lran
Gh
ory
an
Gu
lista
n
Na
wu
r
Shi
ndan
d
Re
g-i-
Kh
anN
ishi
n
Yaka
wla
ng
Na
dA
li
Ob
e
Giz
ab
Go
ma
l
Koh
ista
nat
Qa
dis
Da
ma
n
Wa
sher
Asl
-i-C
hakh
ansu
r
Mar
uf
Pan
jway
ee
Pur
Cha
ma
n
Sha
hrak
Kha
shR
od
Tula
k
No
wza
d
Bal
aB
ulu
k
Khu
lm
Wa
ras
Kiti
Spi
nB
old
ak
Do
La
inah
Pas
aban
dTa
ywa
ra
Ch
ora
h
Sho
raba
k
Wa
rsa
j
Arg
his
tan
Fers
i
Shi
ghna
n
Qa
isar
Bal
kha
b
Lash
-i-J
uw
ayn
Bag
hran
Sag
har
Enj
il
Du
shi
Qa
la-i
-Kah
Bal
aM
urg
hab
Kira
nw
aM
un
jan
Kaj
aki
Mai
wa
nd
Shi
nka
i
Bak
wa
h
Koh
san
Shi
bK
oh
Kaj
ran
Jag
huri
Na
wa
De
lara
m
Ru
staq
Man
dol
MirA
mo
r
Pan
jab
Jurm
Koh
ista
n
Wo
rM
am
ay
Alm
ar
She
me
lza
i
Kar
rukh
Ne
sh
Khe
dir
Tag
ab
Lalw
aS
arja
ngal
Ro
i-Do-
Ab
Ch
imta
l
Turw
o
Arg
o
Kuf
Ab
Do
wla
tab
ad
Zari
Yam
gan
Sha
hW
ali
Ko
t
Zayb
ak
Ajri
stan
Sai
ghan
Par
yan
Gir
o
Gu
rziw
an
Gh
ora
k
Zurm
at
Sur
ub
i
Sho
lgar
ah
Qa
rqin
Jalr
ez
Tala
hw
aB
arfa
k
Miz
an
Bar
mal
Shu
had
a
Ch
iisht
-i-S
har
if
Say
yad
Do
wla
tya
r
Azr
aIs
hta
rlay
Sho
rTe
pa
San
g-i-T
akh
t
Kah
ma
rd
Bur
ka
Khi
njan
Kal
dar
Do
wla
tab
ad
Ra
ghis
tan
Kam
desh
Zhir
e
And
ar
Da
rah
Qa
ram
Qul
Ch
aghc
hara
n(P
rovi
nci
alC
ente
r)
Pas
htun
Ko
t
Kan
g
Qa
la-i
-Zal
Zen
dah
Jan
Mal
ista
n
Gh
orm
ach
Sha
hJo
i
Kha
kre
z
Mar
kaz-
i-B
ehs
ud
Kha
sU
ruzg
an
Ge
lan
Sha
hris
tan
Jaji
Muq
ur
She
bar
Ab
Ka
ma
ri
Dih
raw
ud
Fark
har
Shi
rinT
agab
Da
rah
-i-S
oof-
i-Bal
a
Bag
hlan
-i-Ja
dee
d
Mus
aQ
ala
Na
wa
-i-B
aru
kza
i
Bar
g-i
-Ma
tal
Qa
raB
agh
Da
ych
opan
Khw
ajah
Du
Ko
h
Muq
ur
Shi
ki
Kha
k-i-
Sa
fed
Arg
ha
ndab
Fara
h(P
rovi
ncia
lC
ent
er)
Kus
hk(R
abat
-i-S
ang
i)
Na
ri
Faiz
abad
Wa
zahk
hw
ah
Min
gajik
Kis
hin
deh
Kho
stw
aFi
ring
Go
sfa
ndi
Sha
hidi
Ha
sas
And
arab
Alin
gar
Kis
him
Wa
rdoo
j
Ab
Ba
nd
Kus
k-i-K
ohna
h
Kha
nab
ad
Na
wB
aha
r
Na
hre
en
Na
her-
i-S
araj
Bil
Ch
iragh
Pas
htun
Zar
ghu
n
Pul
-i-A
lam
Esh
kash
im
Nijr
ab
Jan
iKh
el
Wa
ygal
Khu
ram
wa
Sar
Bag
h
Ban
gi
Ch
ahab
Tash
kan
Du
Ab
Niiz
am
-i-S
hah
id(G
uza
rah
)D
aim
ird
ad
Say
yid
abad
Qu
rgha
n
Na
hr-i
-Sh
ahi
Bal
kh
Da
hana
-i-G
hur
i
Ch
ahar
Sa
dah
San
gcha
rak
Kha
mya
b
Da
rah
-i-S
uf-i
-Pa
yin
Ch
ahar
Dar
ah Ne
rkh
Sha
ykh
Ali
Ha
zra
tiIm
amS
ahib
Tag
ab
Qa
rgha
yee
Pul
-i-H
isar
Sur
kh-
i-P
ars
aShi
nwar
i
Ch
ahar
Ke
nt
No
orG
ram
De
hY
ak
Mar
dya
n
Tarn
akw
aJ
alda
k
Khw
aha
n
Spe
ra
He
sara
k
Tan
ay
Mar
mul
Ach
in
Urg
un
Alis
heng
Sar
iP
ul(P
rovi
nci
alC
ente
r)
His
ah-i-
Aw
alB
ehs
ud
Esh
kam
ish
Om
na
Jag
hatu
She
berg
han
(Pro
vinc
ialC
ent
er)
Ch
ak-i
-War
dak
Ch
al
Sal
ang
Qu
shT
epah
Miy
aN
esh
in
Qa
lat
(Pro
vin
cia
lCen
ter)
Atg
har
Go
shta
Koh
ista
n
Da
ray
im
Khu
gyan
i
Sha
hriB
uzu
rg
Bam
yan
(Pro
vin
cial
Cen
ter)
Yaw
an
Fayr
oz
Na
khch
ee
rH
azr
at-i
-Su
ltan
Kho
shi
Lalp
oor
Tirin
Kot
(Pro
vinc
ialC
ent
er)
Da
shti
-i-A
rchi
Sar
Row
za
Ayb
ak
(Pro
vinc
ial
Ce
nte
r)
Dila
hw
aK
hw
osh
ama
nd
Kab
ul
Da
rwa
z-i-
Bal
a(n
esay
)
Ro
dat
Koh
-i-S
afi
Na
ma
kA
b
She
rza
d
Kal
afg
an
Da
rqa
d
Kha
rwar
Ali
Ab
ad
Kak
arK
ak-
eA
fgha
n
Kot
Sar
-i-P
ol
Da
rwa
z-iP
ayin
(mam
ay)
Arg
ha
ndab
De
hSa
bz
Wa
gha
z
Kha
niC
hah
arB
agh
Yafta
l-i-S
ufla
Yosu
fK
hel
Gh
azi
Aba
dD
ara
-i-P
ech
Sur
ub
i
Kha
k-i-
Jab
ar
Bag
ram
De
hS
ala
h
And
khoy
Bak
Ziru
k
Soz
ma
Qa
la
Kha
sh
Arg
ha
njK
hwah
De
hB
ala
Ra
shid
an
Beh
sud
Nu
rista
nP
aro
on(P
rovi
nci
alC
ente
r)
Bah
arak
Gu
rbuz
Kam
a
Pus
htR
od
San
gin
Qa
la
Giy
an
Ch
ark
h
Pag
hman
Mat
aK
han
No
org
al
Wo
zaJ
adra
n
Shu
tul
Ahm
adab
ad
Sam
kan
i
Pac
hir
wa
gam
Khw
aja
Gh
ar
Zarg
hun
Sh
ahr
Kha
sK
una
r
De
hdad
i
Lash
kar
gah
(Pro
vin
cial
Cen
ter)
Zan
akh
an
Hir
at
Jaji
Ma
idan
Bah
arak
Du
rB
aba
Zara
nj(P
rov
inci
alC
ente
r)
Khw
ajah
Hijr
an
(Jal
gah)
Na
zya
n
Firin
gw
aG
har
u
Da
shti
Qal
a
Kan
dah
ar(P
rovi
ncla
lC
ent
er)
Ch
owke
y
Un
aba
Qa
la-i
-No
w(P
rovi
ncia
lCe
nte
r)
Nili
(Pro
vinc
ialC
ent
er)
Shi
galw
aS
hel
tan
Yang
iQa
la
Da
ngam
Sar
Ka
ni
Tera
yza
i(A
liS
her
)
Bah
ram
-eS
hahi
d(J
agh
atu
)
Shi
nwar
Shw
ak
Est
alef
Mus
ahi
Kho
stM
atu
n(P
rovi
ncia
lCe
nte
r)
Go
zarg
ah
-i-N
oor
Mai
ma
nah
Gu
lara
Sha
hrak
-i-H
aira
tan
75°E
75°E
72°E
72°E
69°E
69°E
66°E
66°E
63°E
63°E
36°N
36°N
33°N
33°N
30°N
30°N
Suru
bi Jaji
Azra
Alin
gar
Taga
b
Qar
ghay
ee
Tana
y
Achi
n
Alis
heng
Gos
hta La
lpoo
rR
odat
Hes
arak
Khug
yani
Sper
a
Sher
zad
Kot
Bak
Deh
Bal
a
Behs
ud
AlaS
ai Gur
buz
Kam
a
Noo
rgal
Surk
hR
ud
Sam
kani
Pach
irw
agam
Khas
Kun
arKu
zkun
ar
Woz
aJa
dran
Dar
a-i-P
ech
Jaji
Mai
dan
Cha
paD
ara
Dur
Baba
Naz
yan
Saba
ri(Y
aqub
i)
Cho
wke
y
Khos
hi
Deh
Sab
z
Laja
Ahm
adK
hel
Bagr
am
SarK
ani
Meh
tarL
am(P
rovi
ncia
lCen
ter)
Nad
irSha
hK
otTe
rayz
ai(A
liS
her)
Bagr
ami
Shin
war
Dar
ah-i-
Noo
r
Dan
dP
atan
Jani
Khe
l
Khos
tMat
un(P
rovi
ncia
lCen
ter)
Moh
man
dD
ara
Mar
aw
arah
Wat
ahpo
or
East
ern
regi
on
Geo
grap
hic
Pro
ject
ionD
atum
:WG
S84
Mar
ch/A
pril/M
ay
Mar
ch/A
pril/M
ay/J
un
Mar
ch/M
ay/J
un
Inte
rnat
iona
lbou
ndar
ies
Prov
inci
albo
unda
ries
Lege
ndpl
antin
_dat
esNo
data
April
April/
May
July
Jun
Jun/
July
Mar
ch
Mar
ch/A
pril
Mar
ch/J
uly
Mar
ch/M
ay
May
May
/July
May
/Jun
010
020
030
050
km
Afghanistan Cannabis Survey 2010
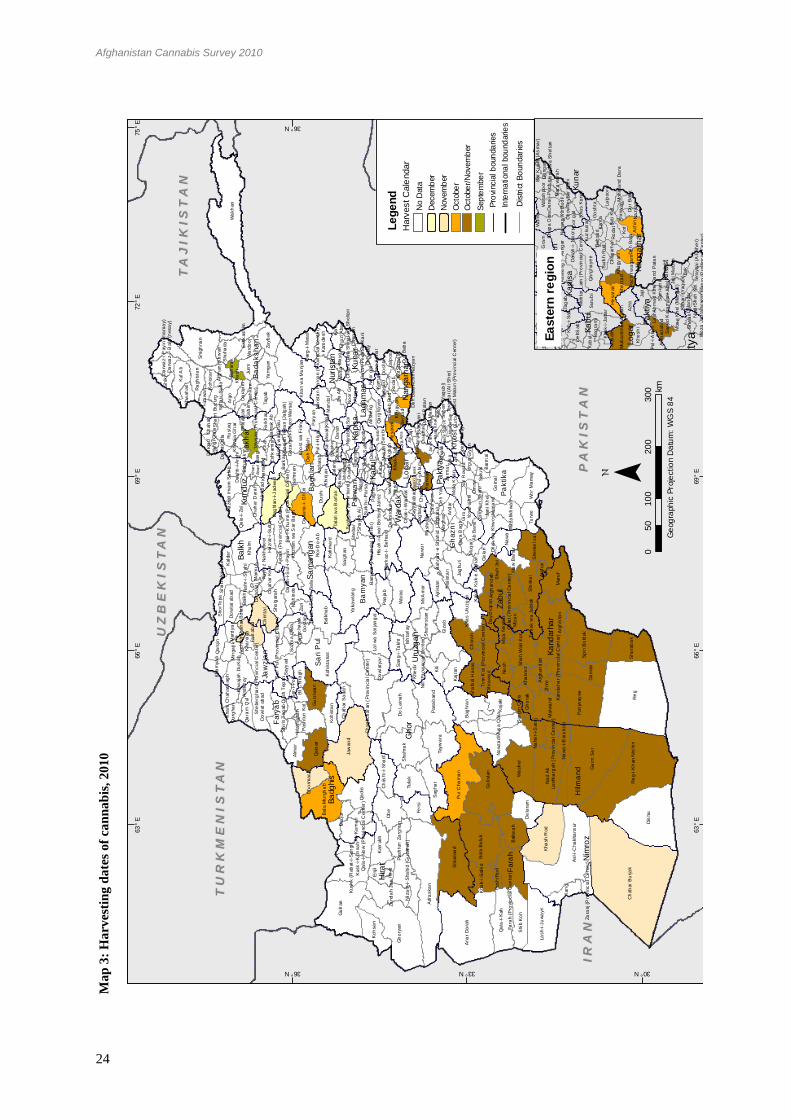
24
M
ap 3
: Har
vest
ing
date
s of c
anna
bis,
2010
Bara
kiB
arak
Azra
Jani
Khe
l
Chak
man
i
Jaji
Lija
Man
gal
Panj
sher
Jaba
lussa
raj
Nadi
rSha
hK
Man
doZ
ayi
Mus
aK
hel
Suro
bi
Guld
ara
Khan
Abad
Chah
arik
ar
Nirk
h
Zana
Khan
TU
RK
ME
NIS
TA
NT
UR
KM
EN
IST
AN
UZ
BE
KIS
TA
NU
ZB
EK
IST
AN
TA
JIK
IST
AN
TA
JIK
IST
AN
PA
KIS
TA
NP
AK
IST
AN
IRA
NIR
AN
Hira
t
Far
ah
Hilm
and
Gho
r
Nim
roz
Kand
arha
r
Ba
daks
han
Uru
zgan
Gh
azn
i
Zabu
l
Balk
h
Far
yab
Pa
ktik
a
Badg
his
Ba
ghla
nS
ari
Pul
Ba
mya
n
Tak
har
Jaw
zja
n
Pa
rwa
n
War
dak
Sam
anga
n
Kund
uz
Nur
ista
n
Pakt
ya
Kuna
r
Kabu
l
Nan
garh
ar
Kh
ost
Loga
r
Lagh
man
Kapi
sa
Re
g
Dis
hu
Ch
ahar
Bu
rjak
Wa
khan
Adr
ask
an
Ga
rmS
er
Jaw
and
Ana
rD
ara
h
Gu
lran
Gh
ory
an
Gu
lista
n
Na
wu
r
Shi
ndan
d
Re
g-i-
Kh
anN
ishi
n
Yaka
wla
ng
Na
dA
li
Ob
e
Giz
ab
Go
ma
l
Koh
ista
nat
Qa
dis
Da
man
Wa
sher
Asl
-i-C
hakh
ans
ur
Mar
uf
Pan
jway
ee
Pur
Cha
ma
n
Sha
hra
k
Kha
shR
od
Tula
k
No
wza
d
Bal
aB
ulu
k
Khu
lm
Wa
ras
Kiti
Spi
nB
old
ak
Do
Lai
nah
Pas
ab
and
Tayw
ara
Ch
ora
h
Sho
rab
ak
Wa
rsa
j
Arg
his
tan
Fers
i
Shi
ghna
n
Qa
isar
Bal
kha
b
Lash
-i-J
uw
ayn
Bag
hra
n
Sag
har
Enj
il
Du
shi
Qa
la-i-
Kah
Kira
nw
aM
unj
an
Kaj
aki
Mai
wa
nd
Shi
nka
i
Bak
wa
h
Koh
san
Shi
bK
oh
Kaj
ran
Jag
huri
Na
wa
De
lara
m
Ru
staq
Man
dol
MirA
mor
Pan
jab
Jurm
Koh
ista
n
Wo
rM
am
ay
Alm
ar
She
me
lza
i
Kar
rukh
Ne
sh
Khe
dir
Tag
ab
Lalw
aS
arja
ng
al
Ro
i-Do-
Ab
Ch
imta
l
Turw
o
Arg
o
Kuf
Ab
Do
wla
tab
ad
Zari
Yam
gan
Sha
hW
aliK
ot
Zayb
ak
Qa
la-i-
Zal
Ajri
stan
Sai
ghan
Par
yan
Gir
o
Gu
rziw
an
Gh
ora
k
Sho
lgar
ah
Qa
rqin
Jalr
ez
Tala
hw
aB
arfa
k
Sha
hris
tan
Miz
an
Bar
mal
Shu
hada
Ch
iisht
-i-S
harif
Say
yad
Do
wla
tya
r
Ish
tarl
ay
Sho
rTe
pa
San
g-i-
Takh
t
Kah
ma
rd
Bur
ka
Khi
njan
Kal
dar
Do
wla
tab
ad
Ra
ghis
tan
Kam
desh
Zhire
And
ar
Da
rah
Qa
ram
Qul
Bal
kh
Bal
aM
urg
ha
b
Ch
aghc
har
an(P
rov
inci
alC
en
ter)
Pas
htu
nK
ot
Kan
g
Zend
ah
Jan
Mal
ista
n
Gh
orm
ach
Zurm
at
Sur
ubi
Sha
hJo
i
Kha
kre
z
Mar
kaz
-i-
Be
hsu
d
Kha
sU
ruzg
an
Ge
lan
Jaji
Muq
ur
She
bar
Ab
Ka
ma
ri
Dih
raw
ud
Azr
a
Fark
har
Shi
rinT
agab
Da
rah
-i-S
oof-
i-Ba
la
Bag
hlan
-i-J
adee
d
Mus
aQ
ala
Na
wa
-i-B
aru
kza
i
Bar
g-i-
Mat
al
Qa
raB
agh
Da
ych
opan
Khw
ajah
Du
Ko
h
Muq
ur
Shi
ki
Kha
k-i-
Saf
ed
Arg
han
dab
Fara
h(P
rovi
nci
alC
ente
r)
Kus
hk
(Rab
at-i
-San
gi)
Na
ri
Faiz
abad
Wa
zahk
hw
ah
Min
gajik
Kis
hin
deh
Kho
stw
aF
irin
gG
osf
and
i
Sha
hidi
Ha
sas
And
ara
b
Alin
gar
Kis
him
Wa
rdo
oj
Ab
Ba
nd
Kus
k-i-
Koh
nah
Kha
naba
d
Na
wB
aha
r
Na
hre
en
Na
her-
i-Sar
aj
Bil
Chi
ragh
Pas
htu
nZa
rghu
n
Pul
-i-A
lam
Esh
kas
him
Nijr
ab
Jan
iKh
el
Wa
ygal
Khu
ram
wa
Sar
Ba
gh
Ban
gi
Ch
ahab
Tash
kan
Du
Ab
Niiz
am
-i-S
hahi
d(G
uza
rah
)
Da
imir
dad
Say
yid
abad
Qu
rgha
n
Na
hr-i
-Sh
ahi
Da
hana
-i-G
hur
i
Ch
ahar
Sa
dah
San
gcha
rak
Kha
mya
b
Da
rah
-i-S
uf-i
-Pay
in
Ch
ahar
Dar
ah
Ne
rkh
Sha
ykh
AliHa
zrat
iIm
am
Sa
hib
Tag
ab
Qa
rgha
yee
Pul
-i-H
isar
Sur
kh-
i-P
ars
aShi
nwar
i
Ch
ahar
Ke
nt
No
orG
ram
De
hY
ak
Mar
dya
n
Tarn
akw
aJa
ldak
Khw
ahan
Spe
ra
He
sara
k
Tan
ay
Mar
mul
Ach
in
Urg
un
Alis
heng
Sar
iP
ul(P
rovi
nci
alC
ente
r)
His
ah-i-
Aw
alB
ehs
ud
Esh
kam
ish
Om
na
Jag
hatu
She
berg
han
(Pro
vin
cial
Cen
ter)
Ch
ak-i
-War
dak
Ch
al
Sal
ang
Qu
shT
epah
Miy
aN
esh
inQ
ala
t(P
rov
inci
alC
en
ter) A
tgh
ar
Go
shta
Koh
ista
n
Da
rayi
m
Khu
gyan
i
Sha
hri
Buz
urg
Bam
yan
(Pro
vin
cia
lCen
ter)
Yaw
an
Fayr
oz
Na
khch
eer
Ha
zrat
-i-S
ulta
n
Lalp
oor
Tirin
Kot
(Pro
vin
cia
lCen
ter)
Da
shti
-i-A
rchi
Sar
Row
za
Ayb
ak
(Pro
vin
cial
Cen
ter)
Dila
hw
aK
hwo
sha
ma
nd
Kab
ul
Da
rwa
z-i-
Bal
a(n
esa
y)
Ro
dat
Koh
-i-S
afi
Na
mak
Ab
She
rza
d
Kal
afg
an
Da
rqa
d
Kha
rwar
Muh
amm
ad
Agh
ah
Ali
Ab
ad
Kha
naqa
Kak
ar
Ka
k-e
Afg
han
Kot
Sar
-i-P
ol
Da
rwa
z-iP
ayin
(ma
ma
y)
Arg
han
dab
De
hSa
bz
Wa
ghaz
Ch
apa
Dar
a
Kha
niC
hah
arB
agh
Yafta
l-i-S
ufla
Yosu
fK
hel
Gh
azi
Aba
dA
laS
ai
Da
ra-i
-Pe
ch
Sur
ubiK
hak-
i-Ja
bar
Bag
ram
De
hS
ala
h
And
khoy
Bak
Ziru
k
Wa
ma
Sya
hg
ird(G
hor
band
)
Soz
ma
Qa
la
Kha
sh
Arg
han
jKh
wah
De
hB
ala
Ra
shid
an
Beh
sud
Nu
rista
nP
aro
on
(Pro
vinc
ial
Ce
nte
r)
Ch
ahar
Bo
lak
Bah
ara
k
Gu
rbuz
Kam
a
Pus
htR
od
San
gin
Qa
la
Giy
an
Ch
arkh
Pag
hman
Mat
aK
han
His
sa-i
-Aw
al(K
hin
j)
No
org
al
Shu
tul
Sur
kh
Ru
d
Sam
kan
i
Talo
qan
(Pro
vin
cia
lCen
ter)
Khw
aja
Gh
ar
Zarg
hun
Sh
ahr
Kha
sK
una
r
De
hdad
i
Lash
karg
ah(P
rov
inci
alC
en
ter)
Hir
at
Jaji
Ma
idan
Nik
a
Bah
ara
k
Du
rB
aba
Zara
nj(P
rovi
ncia
lCe
nte
r)
Khw
ajah
Hijr
an
(Ja
lgah
)
Na
zya
n
Sab
ari
(Yaq
ubi)
Firin
gw
aG
har
u
Da
shti
Qa
la
Kan
daha
r(P
rovi
ncl
alC
ente
r)
Ch
owke
yQ
ala
-i-N
ow
(Pro
vinc
ialC
ent
er)
Nili
(Pro
vinc
ial
Ce
nter
)
Shi
galw
aS
hel
tan
Yang
iQa
la
Da
ngam
Sar
Ka
ni
Tera
yza
i(A
liS
her
)
Bah
ram
-eS
hah
id(J
agh
atu)
Shi
nwar
Aqc
ha
h
Shw
ak
Da
ndP
ata
n
Pul
-i-K
hum
ri(P
rovi
ncia
lC
ent
er)
Mus
ahi
Kho
stM
atu
n(P
rovi
ncia
lCen
ter)
Go
zarg
ah-
i-Noo
rM
aim
ana
h
Sha
hra
k-i-
Ha
irata
n
75°E
75°E
72°E
72°E
69°E
69°E
66°E
66°E
63°E
63°E
36°N
36°N
33°N
33°N
30°N
30°N
ktya
Sur
ub
i Jaji
Azr
a
Alin
gar
Nijr
ab
Tag
ab
Qa
rgha
yee
He
sara
k
Ach
in
Alis
heng
Go
shta
Kho
shi
Lalp
oor
Ro
dat
No
orG
ram
Kot
Ala
Sa
iB
agra
m
Khu
gyan
i
Koh
-i-S
afi
She
rza
d
De
hSab
z
Do
wla
tS
hah
Ch
apa
Dar
a
Kab
ul
Pul
-i-A
lam
Da
ra-i
-Pe
ch
Kha
k-i-
Jaba
r
Bak
De
hB
ala
Beh
sud K
ama
Muh
am
ma
dA
gha
h
No
org
al
Ahm
adab
ad
Sur
kh
Rud
Sam
kan
i
Bag
ram
i
Pac
hirw
aga
m
Say
yid
Kar
am
Kha
sK
una
r
Wo
zaJa
dra
n
Kuz
kun
ar
Jaji
Ma
idan
Du
rB
aba
Na
zya
n
Sab
ari(
Yaq
ubi)
Ch
owke
y
Laja
Ah
ma
dK
hel
Da
ngam
Sar
Kan
i
Meh
tar
Lam
(Pro
vin
cia
lCen
ter)
Wa
tah
poor
Mus
aK
hel
(Ma
ngal
)
Na
dirS
hah
Kot
Ch
apar
ha
r
Shi
nwar
Tera
yza
i(A
liS
he
r)
Da
rah
-i-N
oor
Shi
galw
aS
hel
tan
Bat
iKot
Qa
raB
agh Shw
ak
Da
ndP
ata
n
Qa
lan
dar
Jan
iKh
el
Mus
ahi
Moh
ma
ndD
ara
Mar
aw
ara
h
Kho
stM
atu
n(P
rovi
ncia
lCe
nte
r)Na
ran
gw
aB
ad
il
Koh
Ban
dB
arK
unar
(As
ma
r)M
and
olS
ayyi
dK
hel
Wa
ma
Loga
rN
anga
rhar
Kabu
lKu
nar
Pakt
iya
Khos
t
Lagh
man
Kapi
sa
East
ern
regi
on
Geo
grap
hic
Proj
ectio
nD
atum
:WG
S84
Oct
ober
/Nov
embe
r
Prov
inci
albo
unda
ries
Lege
ndH
arve
stC
alen
dar
Oct
ober
Sept
embe
r
Inte
rnat
iona
lbou
ndar
ies
Dis
trict
Boun
darie
s
No
Dat
a
Nov
embe
rD
ecem
ber
010
020
030
050
km
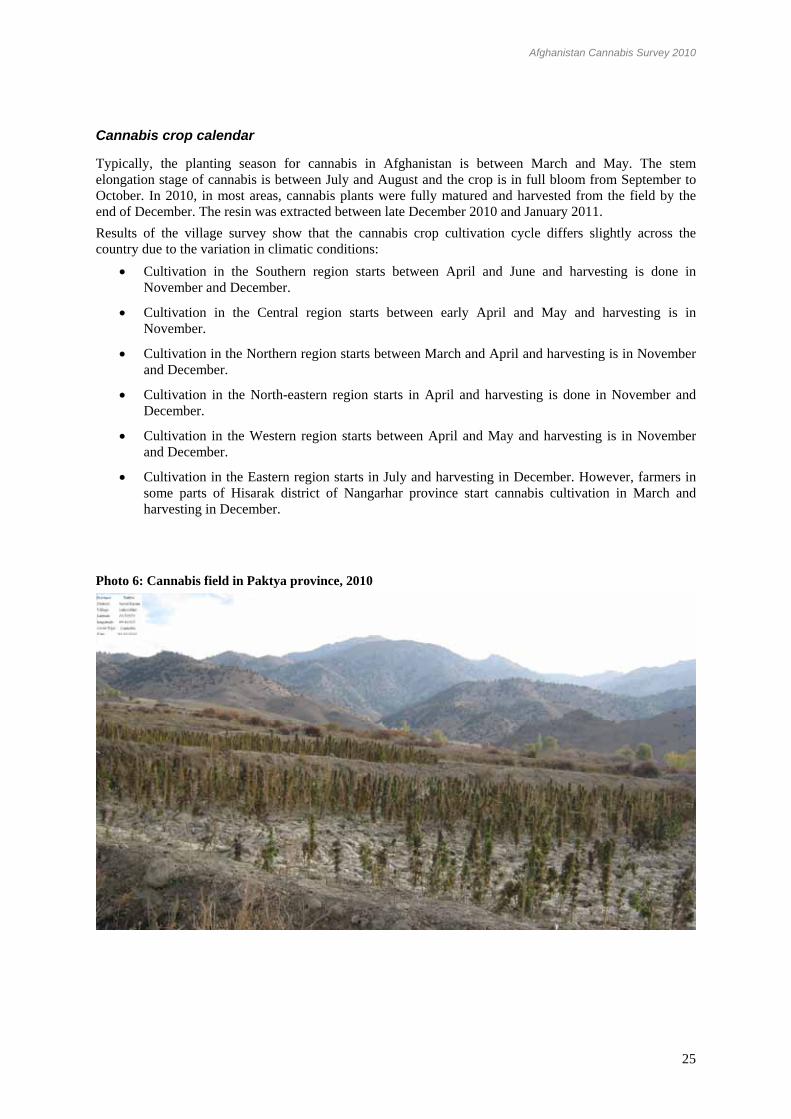
Afghanistan Cannabis Survey 2010
25
Cannabis crop calendar
Typically, the planting season for cannabis in Afghanistan is between March and May. The stem elongation stage of cannabis is between July and August and the crop is in full bloom from September to October. In 2010, in most areas, cannabis plants were fully matured and harvested from the field by the end of December. The resin was extracted between late December 2010 and January 2011. Results of the village survey show that the cannabis crop cultivation cycle differs slightly across the country due to the variation in climatic conditions:
• Cultivation in the Southern region starts between April and June and harvesting is done in November and December.
• Cultivation in the Central region starts between early April and May and harvesting is in November.
• Cultivation in the Northern region starts between March and April and harvesting is in November and December.
• Cultivation in the North-eastern region starts in April and harvesting is done in November and December.
• Cultivation in the Western region starts between April and May and harvesting is in November and December.
• Cultivation in the Eastern region starts in July and harvesting in December. However, farmers in some parts of Hisarak district of Nangarhar province start cannabis cultivation in March and harvesting in December.
Photo 6: Cannabis field in Paktya province, 2010

Afghanistan Cannabis Survey 2010
26
Cannabis yield
The production of cannabis resin in Afghanistan involves several steps (see also photos in Annex 1)7. First, the cannabis plants need to be dried, then the dried cannabis plants are threshed and sieved to produce a powdery substance locally called “garda”. Through repeated sieving, farmers produce a graded quality which contains different concentrations of cannabis resin. Based on the quantity and quality of cannabis resin, garda is categorized as first garda, second garda and third garda. The first garda is considered to be the best quality since it contains the highest proportion of resin. It is also more expensive than the second and third garda qualities. It is not yet known how exactly farmers and traders determine the garda grade other than counting the number of sieving processes performed to extract the resin. The first, gentle shaking of the plant and sieving of plant material usually produces first garda quality, although this first garda powder may later be mixed with garda from subsequent sieving rounds and still be called and traded as “first” garda. Most cannabis farmers sell garda (resin) to traders in its powdery form, although some process it further into hashish, which is locally called “charas”. This transformation of garda into hashish is usually done by traders. Hashish is the final product used for trafficking and consumption. The information collected during the survey suggests that the amount of hashish produced from 1 kg of cannabis garda varies across regions probably due to the different hashish production methods. With the current knowledge of different hashish production methods used in Afghanistan, it is reasonable to assume a 1:1 conversion rate of cannabis garda into hashish.
Photo 7: Mature female cannabis plant with resin glands
Mature female Cannabis plant with buds cultivated in North Afghanistan
Research indicates that regional differences exist in processing cannabis into garda. For the purpose of estimating yield and production, provinces were grouped into two regions, North/North-east (N/NE) and South, East, West and Central (S-E-W-C). In the North and North-eastern region, processing methods resulted in a higher quality but less quantity of first garda, whereas in the South, East, West and Central a larger production of first garda was obtained but with a lower quality (less resin and more plant material). The garda from the North and North-eastern region (Mazari or Balkhi garda) contains more resin without the mixture of cannabis leaves, in contrast to other regions where, during the processing of first garda, farmers mix the resin with cannabis leaves.
Table 4: Average cannabis garda yield by region (kg/ha), 2010
Region 1st garda (kg/ha)
2nd garda (kg/ha)
3rd garda (kg/ha)
Total yield (kg/ha)
N/NE (n=14) 35 36 29 99
S-E-W-C (n=25) 67 42 24 133
Weighted average* 63 41 24 128
* Weighted by production,. n refers to number of surveyed fields.
7 More information on cannabis resin yield and hashish production can be found in UNODC/MCN: Afghanistan Cannabis Survey 2009, April 2010.

Afghanistan Cannabis Survey 2010
27
Potential cannabis production
Total cannabis garda production, including all garda qualities, was estimated in 2010 to be between 1,200 mt and 3,700 mt. This estimation range reflects the range reported for the cannabis cultivation area. Most of the produced garda was of first quality. There are no standards across regions for garda qualities and garda of one quality type may not be homogenous. The survey did not investigate THC content or other chemical properties of garda produced in Afghanistan, hence its potency level is unknown.
Table 5: Potential cannabis resin garda production, 2010
1st garda (mt)
2nd garda (mt)
3rd garda (mt)
Rounded total (mt)
Lower bound 588 385 228 1,200 Upper bound 1,832 1,199 709 3,700 As % of total garda 49% 32% 19% 100%
Reasons for cultivating cannabis
Cannabis-cultivating farmers were asked for their most important reasons for doing so. The two most frequently reported reasons in 2010 were, the high sales price of hashish compared to licit crops (55.6%) and poverty alleviation (31.2%). Other reasons why farmers cultivated cannabis included personal consumption (5.7%) and high market demand (5.5%). In 2010, there was a strong increase in the proportion of farmers mentioning “High sale price of hashish” as their main reason compared to 2009, reflecting the sharp increase of cannabis price of cannabis in 2010.
Figure 8: Reasons for cultivating cannabis in 2009 and 2010 (n = 333)
0.8%
1.1%
2.9%
6.6%
21.2%
6.0%
3.0%
10.0%
5.0%
4.0%
39.0%
0.2%
0.7%
1.1%
5.5%
5.7%
31.2%
55.6%
0.0% 30.0% 60.0%
No control from Government
No support from Government
Common to grow
Resistant against disease
Low cost of inputs(seeds,fertilizer,labour)
Other
Easy/experienced to grow
Enough yield
High income from little land
High demand for hashsih
For personal consumption
Poverty alleviation
High sale price of hashish
2009 2010
Reason for stopping cannabis cultivation
Like opium poppy, cannabis is an illicit crop in Afghanistan and the possession of cannabis products is a legal offence. A high number of farmers reported that they stopped cannabis cultivation because of the government ban (19.3%). The other dominant reasons were that cultivation is against Islam (18.5%), followed by its negative impacts on human beings (9.9%) and a lack of water and/or land (8.4%). Other reasons included fear of eradication, poor yield, low sale price of hashish, decisions of elders and Shura, resin processing taking too long, a lack of experience, unsuitable climate conditions, and having sufficient income from other crops.

Afghanistan Cannabis Survey 2010
28
A much lower proportion of farmers mentioned the government ban on cannabis cultivation in 2010 than in 2009 as their main reason for having stopped cultivation. On the other hand, a larger proportion reportedly the fear of eradication, although there are no reports of cannabis eradication in recent years.
Figure 9: Reasons for stopping cannabis cultivation (n = 889)
1.7%
3.4%
2.9%
4.6%
0.6%
8.9%
5.4%
5.0%
7.6%
1.9%
1.4%
4.4%
19.6%
32.7%
0.1%
0.2%
0.4%
0.4%
1.2%
1.7%
2.4%
2.6%
6.3%
6.4%
7.1%
7.4%
7.6%
8.4%
9.9%
18.5%
19.3%
0.0% 18.0% 36.0%
No response/No data
Support from Government
Income from other source
Government campaign
Fear of imprisonment
Enough income from other crops
Climate conditions not suitableLack of experience
Resing processing is too long
Elders and Shura decision
Other
Low sale price of hashish
Poor yield
Fear of eradication
Lack of water/land
Negative impact on human beings
Against Islam
Banned by Government
2009 2010
Conditions for potentially resuming cannabis cultivation in future
The farmers who stopped cannabis cultivation were asked under what conditions they would restart cultivation. Most farmers responded that they would grow cannabis again if the sale price of hashish was high (67.2%).
Reason for never cultivating cannabis
Farmers who never grew cannabis were asked for the most important reasons why they never cultivated cannabis. The most frequently mentioned reason for never growing cannabis was that it is forbidden by Islam (54.6%). The second reason was the government ban on cannabis cultivation (10.7%), followed by farmers not being accustomed to growing cannabis (8.8%). In addition, farmers said they never grew cannabis because of its negative impact on human beings (6.5%), their lack of experience (6.3%), and unsuitable climate conditions (3.3%). Other reasons included the lack of water and/or land to cultivate cannabis on, the poor yield, the decision made by the elders Shura and having enough income from other crops.

Afghanistan Cannabis Survey 2010
29
Figure 10: Conditions for potentially resuming cannabis cultivation in future, reported by farmers who stopped cultivation (n=889)
1.4%
1.7%
7.3%
17.7%
18.6%
10.6%
2.0%
5.6%
35.0%
1.6%
1.9%
3.0%
3.5%
5.7%
8.3%
8.7%
67.2%
0.0% 35.0% 70.0%
Less efforts to cultivate cannabis
If more land available
No control from governement
Good income
No eradication
If Elders and Shura allow
For personal consumption
If hashish price is rising
If no support from Government
Other
If more water available
Poverty alleviation
High sale price of hashish
2009 2010
Figure 11: Reasons for never cultivating cannabis 2010 (n = 3,134)
0.0%
0.0%0.1%
0.2%0.3%
0.3%0.3%
0.5%0.5%
0.9%1.7%
2.2%2.7%
3.3%6.3%
6.5%8.8%
10.7%54.6%
0% 30% 60%
Support from abroad
Government controlSupport from Government/NGOs
Enough income from other sourcesMore efforts to cultivate cannabis
Fear of eradicationLack of market
Low sale price of hashishOther
Enough income from other crops
Elders and Shura decisionPoor yield
Lack of water/landClimate conditions not suitable
Lack of experienceNegative impact on human beings
Not a customBanned by Government
Against Islam

Afghanistan Cannabis Survey 2010
30
Conditions which would lead farmers who had never grown cannabis to start cultivating it
Farmers who had never grown cannabis were asked under what conditions they would start cultivating cannabis. The conditions included a high sale price of hashish (66.0%), lack of support from the government (16.4%), if elders and Shura allowed it (4.7%), and poverty alleviation (3.7%). Few farmers reported that they would start if they own more land, if they gain experience in cannabis cultivation (both 3.3%) and if it became a custom (1.8%).
Figure 12: Reasons for potentially cultivating cannabis in future as reported by farmers who never grown cannabis in 2009 and 2010 (n=3,134)
0.8%
1.2%
2.3%
2.8%
16.5%
16.2%
20.2%
40.1%
0.9%
1.8%
3.3%
3.3%
3.7%
4.7%
16.4%
66.0%
0.0% 35.0% 70.0%
No control from government
if enough water available
No eradication
To receive advance money
Good income
Other
If it becomes a custom
If I gain experience in cannabis cultivation
If more land available
Poverty alleviation
If Elders and Shura allow
If no support from Government
High sales price of hashish
2009 2010
Land tenure
Most of the surveyed cannabis farmers own (part of) the land they cultivated.8 However, in all regions there were also a number of farmers who were sharecroppers and/or tenants and did not own any land. Cannabis farmers on average own 83% of the total land they cultivate. Farmers who cultivated cannabis at least once between 2004 and 2009 but not in 2010, on average, own 77% of the land they cultivate. Farmers who never cultivated cannabis own 82% of their cultivated land. These results indicate that there is no significant difference in land tenure between cannabis-cultivating farmers and farmers who did not cultivate cannabis in 2010.
8 Farmers were asked about the tenure status of the land they cultivated in general and not which type of land they used to cultivate cannabis. The question whether cannabis is rather grown on land owned or under share-cropping or other tenancy arrangements needs to be clarified in future surveys.
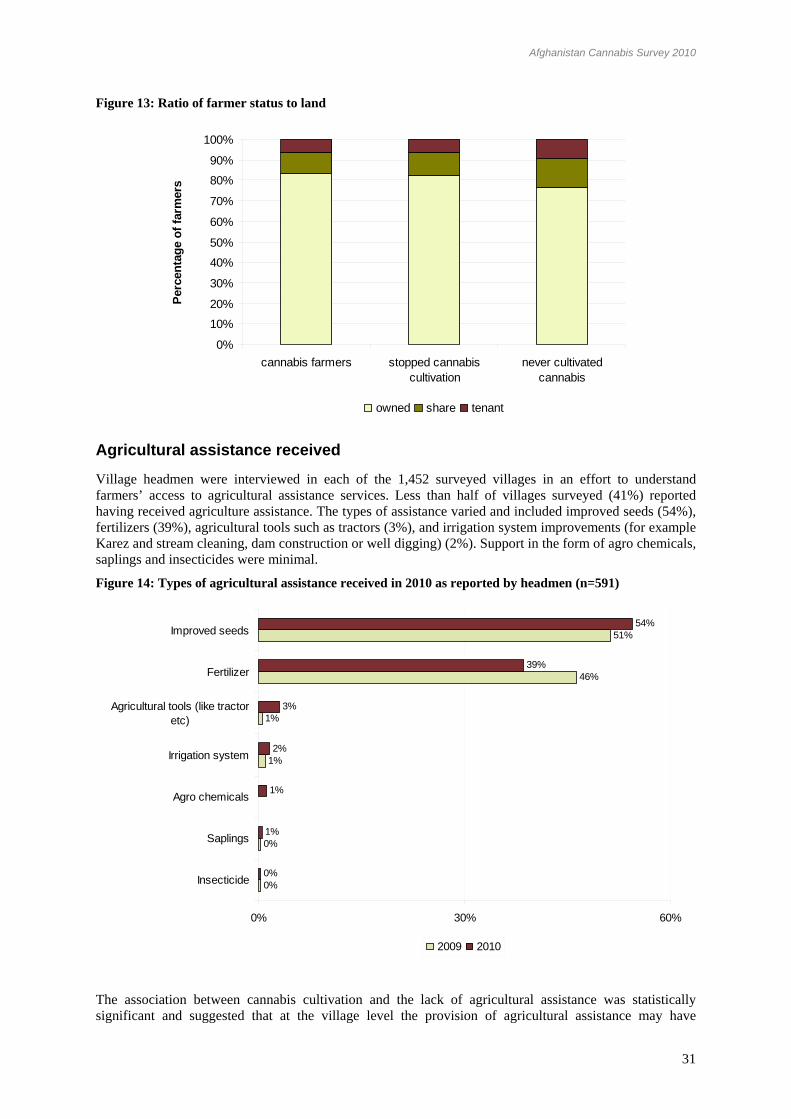
Afghanistan Cannabis Survey 2010
31
Figure 13: Ratio of farmer status to land
0%
10%
20%
30%
40%
50%
60%
70%
80%
90%
100%
cannabis farmers stopped cannabiscultivation
never cultivatedcannabis
Perc
enta
ge o
f far
mer
s
owned share tenant
Agricultural assistance received
Village headmen were interviewed in each of the 1,452 surveyed villages in an effort to understand farmers’ access to agricultural assistance services. Less than half of villages surveyed (41%) reported having received agriculture assistance. The types of assistance varied and included improved seeds (54%), fertilizers (39%), agricultural tools such as tractors (3%), and irrigation system improvements (for example Karez and stream cleaning, dam construction or well digging) (2%). Support in the form of agro chemicals, saplings and insecticides were minimal.
Figure 14: Types of agricultural assistance received in 2010 as reported by headmen (n=591)
0%
0%
1%
1%
46%
51%
0%
1%
1%
2%
3%
39%
54%
0% 30% 60%
Insecticide
Saplings
Agro chemicals
Irrigation system
Agricultural tools (like tractoretc)
Fertilizer
Improved seeds
2009 2010
The association between cannabis cultivation and the lack of agricultural assistance was statistically significant and suggested that at the village level the provision of agricultural assistance may have

Afghanistan Cannabis Survey 2010
32
influenced the decision of cultivating cannabis in 2010. Villages that received some kind of agricultural assistance were less likely to grow cannabis than villages that did not. However, other factors may also have played a role, for instance the security situation which influences the delivery of agricultural assistance, especially in the Southern region where most cannabis cultivation occurs.
Access to facilities
All village headmen were interviewed on the status and availability of basic development facilities in their villages. Information was collected on access to credit, electricity, irrigation, markets for agricultural products, medical facilities, off-farm employment opportunities, telephones, drinking water, road and transportation, school, vocational skills training and access to TV/radio.
Figure 15: Access to services in the cannabis risk area, 2010 (n = 1,452)
0% 10% 20% 30% 40% 50% 60% 70% 80% 90% 100%
Road and transportation
Drinkable water
Irrigation water
School
TV/radio
Phones
Medical center
Market for agricultural products
Electricity
Credit
Off-farm employment opportunities
Training on vocational skills
Village without access Village with access
According to the information provided by headmen, over three quarters of the villages had no access to credit, electricity, markets for agricultural products, off-farm employment opportunities or vocational skills training. Over three quarters of the villages had access to drinkable water, irrigation water, road and transportation, school and TV/radio. Almost two thirds of the villages had access to telephones, while half of the villages had access to a medical centre.
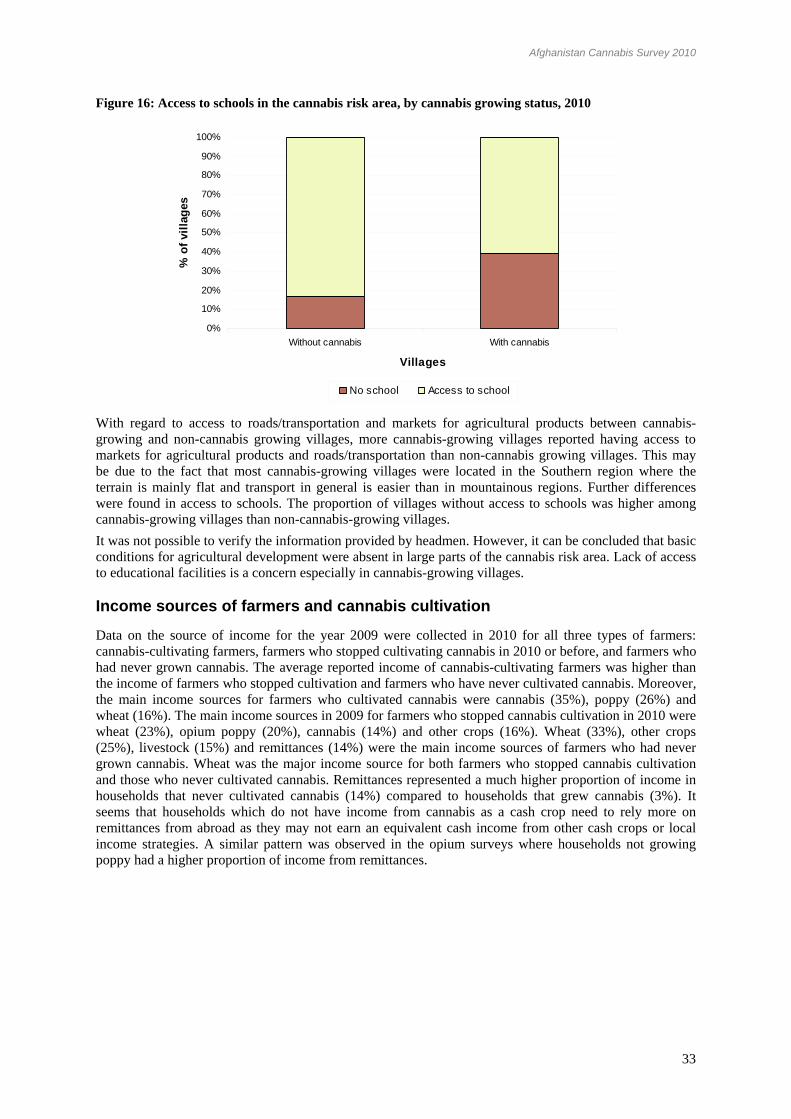
Afghanistan Cannabis Survey 2010
33
Figure 16: Access to schools in the cannabis risk area, by cannabis growing status, 2010
0%
10%
20%
30%
40%
50%
60%
70%
80%
90%
100%
Without cannabis With cannabis
Villages
% o
f vill
ages
No school Access to school
With regard to access to roads/transportation and markets for agricultural products between cannabis-growing and non-cannabis growing villages, more cannabis-growing villages reported having access to markets for agricultural products and roads/transportation than non-cannabis growing villages. This may be due to the fact that most cannabis-growing villages were located in the Southern region where the terrain is mainly flat and transport in general is easier than in mountainous regions. Further differences were found in access to schools. The proportion of villages without access to schools was higher among cannabis-growing villages than non-cannabis-growing villages. It was not possible to verify the information provided by headmen. However, it can be concluded that basic conditions for agricultural development were absent in large parts of the cannabis risk area. Lack of access to educational facilities is a concern especially in cannabis-growing villages.
Income sources of farmers and cannabis cultivation
Data on the source of income for the year 2009 were collected in 2010 for all three types of farmers: cannabis-cultivating farmers, farmers who stopped cultivating cannabis in 2010 or before, and farmers who had never grown cannabis. The average reported income of cannabis-cultivating farmers was higher than the income of farmers who stopped cultivation and farmers who have never cultivated cannabis. Moreover, the main income sources for farmers who cultivated cannabis were cannabis (35%), poppy (26%) and wheat (16%). The main income sources in 2009 for farmers who stopped cannabis cultivation in 2010 were wheat (23%), opium poppy (20%), cannabis (14%) and other crops (16%). Wheat (33%), other crops (25%), livestock (15%) and remittances (14%) were the main income sources of farmers who had never grown cannabis. Wheat was the major income source for both farmers who stopped cannabis cultivation and those who never cultivated cannabis. Remittances represented a much higher proportion of income in households that never cultivated cannabis (14%) compared to households that grew cannabis (3%). It seems that households which do not have income from cannabis as a cash crop need to rely more on remittances from abroad as they may not earn an equivalent cash income from other cash crops or local income strategies. A similar pattern was observed in the opium surveys where households not growing poppy had a higher proportion of income from remittances.

Afghanistan Cannabis Survey 2010
34
Figure 17: Contributions to 2009 income in cannabis-growing households by source (data collected in 2010)
Cannabis35%
Wheat16%
Other crops9%
Other2%
Live stock7%
Daily/Monthly wages
2%
Poppy26%
Remittances3%
Renting0%
Figure 18: Contributions to 2009 income in non-cannabis growing (stopped cannabis cultivation in 2010 or before) households by source (data collected in 2010)
Cannabis14%
Wheat23% Daily/Monthly
wages 5%
Live stock11%
Other crops16%
Other3%
Renting1%
Poppy20%
Remittances7%

Afghanistan Cannabis Survey 2010
35
Figure 19: Contributions to 2009 income in non-cannabis growing (farmers who never cultivated cannabis) households by source (data collected in 2010)
Renting1%
Remittances14%
Other crops25%
Other6%
Live stock15%
Wheat33%
Daily/Monthlywages
7%
Cannabis and other cash crops
Farmers who cultivated cannabis also cultivated several other cash crops such as cotton, poppy and vegetables. This indicates that cannabis is not the only cash crop cannabis-farmers plant, but typically one of several cash crops that make up a diversified cash crop strategy. There is a clear difference between the Southern region and other regions in how farmers divide the area dedicated to cash crops. In the Southern region, overall, 12% of the area cultivated with cash crops was cultivated with cannabis and opium poppy (37%). Other major cash crops were vegetables (26%) and ‘other crops’ (19%). This confirms the close link between cannabis and poppy cultivation in that region, as well as the fact that poppy is still the dominant illicit crop. In other regions, ‘other crops’ take up 62% of the cultivated area, followed by vegetables (28%) and cotton (7%). Cannabis is only cultivated on 1% of the area utilized for cash crops. This indicates that cannabis-growing farmers in these regions have other cash crop options in addition to cannabis. There is currently no detailed information available on what kind of crops the ‘other’ category includes. Since this category is a large percentage of the available cultivated area, more detailed research is required.

Afghanistan Cannabis Survey 2010
36
Figure 20: Distribution of cultivated area under main cash crops for cannabis farmers, 2010 (n=333)
Cannabis, 1%
Cotton, 6%
Cotton, 7%
Poppy, 37%
Poppy, 2%
Vegetable, 26%
Vegetable, 28%
Other, 19%
Other, 63%
Cannabis, 12%
Southern region Other regions
Coping strategy for the reduced income of farmers who stopped cultivating cannabis
Farmers who stopped cannabis cultivation were asked if their income had decreased, increased or had not changed. About 30% reported that their income had decreased and that they had difficulties coping with the situation. Many had to obtain a loan (35.4%) and/or had to reduce household expenses (24.3%). Some farmers reported that they had to engage in wage labor (15.4%). The proportion of farmers who had to obtain a loan after stopping cannabis cultivation (35.4%) is higher than in 2009 (6.5%) and it raises a concern as these farmers may more easily resume cannabis cultivation to repay their debt if other income strategies are not viable or economically attractive.
Figure 21: Coping strategies for the reduced income after having stopped cannabis cultivation
3.2%
3.7%
9.0%
2.3%
3.6%
32.0%
39.7%
6.5%
0.1%
0.5%
0.7%
4.5%
6.0%
13.1%
15.4%
24.3%
35.4%
0.0% 23.0% 46.0%
Other
Income from licit crop
Enough Income from other crops
Having cannabis in stock
Other employment
Selling livestock
Support from abroad
Enough income for survival
Labour work
Reduced household expenses
Obtained loan
2009 2010

Afghanistan Cannabis Survey 2010
37
Cannabis cultivating households
Based on headmen interviews, the number of cannabis-growing households in 2010 was estimated at 47,000 households. The number is consistent with the range that can be calculated on the basis of the area under cannabis cultivation (9,000 ha to 29,000 ha) and the estimated average area under cannabis cultivation per household (0.33 ha). Based on this calculation, the number of households involved in cannabis cultivation ranges between 27,000 and 88,000. Despite the uncertainty expressed in the range, this confirms that in 2010 the number of cannabis-growing households was much lower than the number of poppy-growing households (248,700). The estimated number of cannabis-growing households in 2010 increased by 18% from 2009 (40,000 households). However, as the average cannabis area cultivated per household was smaller in 2010 than in 2009 (0.33 ha compared to 0.4 ha), the increase in households does not necessarily mean an increase in total cannabis area. If the number of households involved in cannabis cultivation would be estimated on the basis of headmen interviewed in 2010 during the opium village survey, the number would be 53,000 households. This estimate is within the uncertainty range discussed above, but the number calculated on the basis of the cannabis village survey (48,000) provides a more accurate account. The cannabis village survey targets more specifically the cannabis risk area and collects information at the time when cannabis is cultivated. The opium survey is implemented in most regions before the cannabis season and reflects the number of households the are expected to grow cannabis.
Income from cannabis
Based on average prices at harvest time and the average 2010 resin yield, farmers achieved a gross cash income per hectare of US$ 9,022/ha (rounded US$ 9,000/ha) from cannabis resin. This is significantly higher than the gross income from opium in 2010 (US$ 4,900/ha). The gross income from cannabis resin does not take into account the potential value of cannabis by-products such as cannabis seeds or stalks.
Figure 22: Average annual per hectare income from cannabis and opium (US$/ha), 2010
2,900
8,3412,000
659
0
2000
4000
6000
8000
10000
Opium Cannabis
US$
/ ha
Net income Expenditure
With an average of 0.33 ha per household, the average gross income from cannabis per household amounted to about US$ 3,000. This is higher than the gross income per household from opium in 2010 (US$ 2,400). The expenditure per hectare of cannabis cultivation was estimated at US$ 659/ha or 7% of gross income. The relatively low proportion of expenditures compared with the gross income is due to the massive increase of cannabis farm-gate prices between 2009-2010 and the relative little increase in the prices of agricultural inputs. The costs associated to cannabis cultivation is much lower than the costs for opium cultivation, which was estimated at US$ 2,000/ha or 41% of gross income from opium per hectare. For opium cultivation, lancing costs constituted more than half of all expenditures, in contrast to cannabis

Afghanistan Cannabis Survey 2010
38
where cultivation, harvesting and cannabis extraction (sieving) accounted for less than half of the total expenditure per hectare. Fertilizer and ploughing labour costs were also important expenditures. In combination with a relatively high gross income per hectare, these relatively low expenses make cannabis a much more profitable crop than opium poppy. However, the survey showed that a much smaller number of households was involved in cannabis cultivation and that the average area cultivated with cannabis per household was smaller than the average area households cultivate for opium poppy. In addition, mixed cropping with cannabis cultivation is common in some regions, but very rare in opium cultivation.
Figure 23: Comparison of expenditure distribution per hectare of opium and cannabis cultivation, 2010 Expenditure distribution for cannabis cultivation (US$ 659/ha)
Fertilizer19%
Harvesting (Reaping, sieving)
40%
Weeding8%Seed
2%Other
expenses8%
Labour(Ploughing)
15%
Irrigation9%
Expenditure distribution for opium poppy cultivation (US$ 2,000/ha)
Irriggation3%
Fertilizer24%
Lancing53%
Weeding11%
Seed0.5%
Plough8%
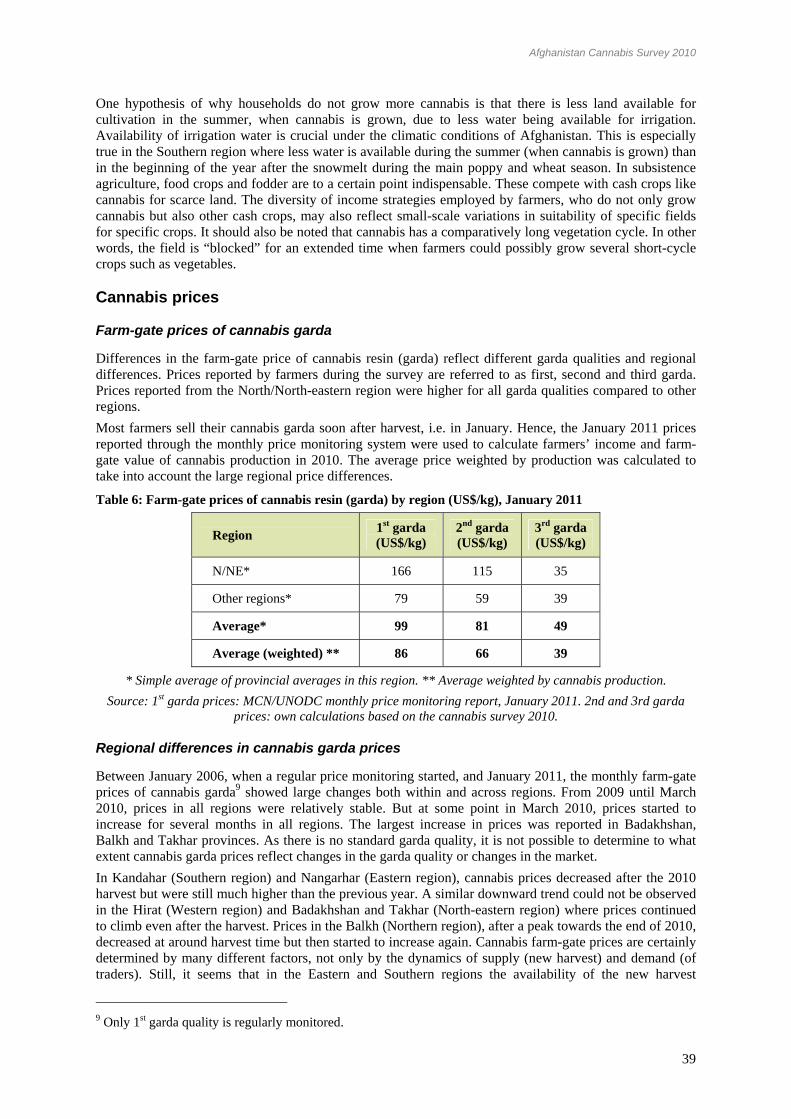
Afghanistan Cannabis Survey 2010
39
One hypothesis of why households do not grow more cannabis is that there is less land available for cultivation in the summer, when cannabis is grown, due to less water being available for irrigation. Availability of irrigation water is crucial under the climatic conditions of Afghanistan. This is especially true in the Southern region where less water is available during the summer (when cannabis is grown) than in the beginning of the year after the snowmelt during the main poppy and wheat season. In subsistence agriculture, food crops and fodder are to a certain point indispensable. These compete with cash crops like cannabis for scarce land. The diversity of income strategies employed by farmers, who do not only grow cannabis but also other cash crops, may also reflect small-scale variations in suitability of specific fields for specific crops. It should also be noted that cannabis has a comparatively long vegetation cycle. In other words, the field is “blocked” for an extended time when farmers could possibly grow several short-cycle crops such as vegetables.
Cannabis prices
Farm-gate prices of cannabis garda
Differences in the farm-gate price of cannabis resin (garda) reflect different garda qualities and regional differences. Prices reported by farmers during the survey are referred to as first, second and third garda. Prices reported from the North/North-eastern region were higher for all garda qualities compared to other regions. Most farmers sell their cannabis garda soon after harvest, i.e. in January. Hence, the January 2011 prices reported through the monthly price monitoring system were used to calculate farmers’ income and farm-gate value of cannabis production in 2010. The average price weighted by production was calculated to take into account the large regional price differences.
Table 6: Farm-gate prices of cannabis resin (garda) by region (US$/kg), January 2011
Region 1st garda (US$/kg)
2nd garda (US$/kg)
3rd garda (US$/kg)
N/NE* 166 115 35
Other regions* 79 59 39
Average* 99 81 49
Average (weighted) ** 86 66 39
* Simple average of provincial averages in this region. ** Average weighted by cannabis production. Source: 1st garda prices: MCN/UNODC monthly price monitoring report, January 2011. 2nd and 3rd garda
prices: own calculations based on the cannabis survey 2010.
Regional differences in cannabis garda prices
Between January 2006, when a regular price monitoring started, and January 2011, the monthly farm-gate prices of cannabis garda9 showed large changes both within and across regions. From 2009 until March 2010, prices in all regions were relatively stable. But at some point in March 2010, prices started to increase for several months in all regions. The largest increase in prices was reported in Badakhshan, Balkh and Takhar provinces. As there is no standard garda quality, it is not possible to determine to what extent cannabis garda prices reflect changes in the garda quality or changes in the market. In Kandahar (Southern region) and Nangarhar (Eastern region), cannabis prices decreased after the 2010 harvest but were still much higher than the previous year. A similar downward trend could not be observed in the Hirat (Western region) and Badakhshan and Takhar (North-eastern region) where prices continued to climb even after the harvest. Prices in the Balkh (Northern region), after a peak towards the end of 2010, decreased at around harvest time but then started to increase again. Cannabis farm-gate prices are certainly determined by many different factors, not only by the dynamics of supply (new harvest) and demand (of traders). Still, it seems that in the Eastern and Southern regions the availability of the new harvest
9 Only 1st garda quality is regularly monitored.

Afghanistan Cannabis Survey 2010
40
contributed to a fall in prices which however remained higher than the previous year. In the other regions, such a seasonal effect was not observed or at least not as clearly. The fact that the decrease in cannabis yield was much more pronounced in the Northern and North-eastern region compared to other regions would support the assumption that the absence of a seasonal price dip in the North-eastern region corresponds to an unmet regional demand for cannabis. The post-harvest price dip in the Northern region was also weak and short-lived. Given the multitude of cannabis products available on the market, the dynamics of cannabis prices need to be supplemented by additional information on the types of products and trafficking patterns which are currently not available.
Figure 24: Monthly farm-gate prices of cannabis garda (best quality, 1st garda) by region, Jan. 2006 – Feb. 2011
0
20
40
60
80
100
120
140
160
180
200
220
Jan-06 Jan-07 Jan-08 Jan-09 Jan-10 Jan-11
US$/
kg
Badakhshan Balkh Hirat Nangarhar Kandahar Takhar
Source: MCN/UNODC monthly price monitoring system
Farm-gate prices of hashish
Headmen in practically all cannabis-cultivating villages reported farm-gate prices for hashish. This indicates that in all villages some farmers process cannabis garda into hashish, locally also called charas. However, interviews with farmers during the yield observation survey revealed that most farmers do not produce hashish but sell cannabis garda. Out of 39 farmers interviewed during the yield observation survey, only 18 produced hashish.10 The conversion from garda to hashish requires a considerable input of labour and/or the availability of machines, which need access to electricity and are not easily available in the rural area. These machines are therefore usually used by traders rather than by farmers explaining why most farmers do not process cannabis garda into hashish, despite the increase in value.
10 The exact proportion of farmers engaged in converting cannabis garda into hashish or the quantity of garda being processed by farmers could not be quantified as this was not part of the main survey questionnaire.

Afghanistan Cannabis Survey 2010
41
Figure 25: Average annual prices of cannabis products in Pakistan and Afghanistan, 2006-2010
0
100
200
300
400
500
600
US$
/kg
Peshaw ar, Pakistan (hashish,best quality, w holesale)
199 267 270 253 531
Afghanistan (cannabis 1stgarda, farm-gate)
51 60 56 50 95
2006 2007 2008 2009 2010
Source: MCN/UNODC monthly price monitoring.
Note: The price for cannabis garda in the graph refers to the annual average price (simple average of all regions) and differs from the weighted average price at the time of resin processing.
The average wholesale price of best quality hashish in Peshawar, Pakistan (US$ 531/kg) in 2010 was over six times the farm-gate price of cannabis resin (garda) at the time of resin processing in Afghanistan (US$ 86/kg). This price difference is higher than for opium, which was traded at US$ 261/kg in Peshawar while the farm-gate prices of dry opium at harvest time was US$ 169/kg. The different prices reported for hashish grading seem to reflect different cannabis garda qualities (1st, 2nd and 3rd garda). Hashish prices at the farm-gate were 1.1 times more than the price of 1st and 2nd cannabis garda (powder) and 1.2 times more than the price of 3rd garda. This relatively small increase in value for processing garda powder into hashish, may explain why most farmers do not engage in this activity and prefer to sell unprocessed garda powder.
Table 7: Farm-gate hashish price as proportion of cannabis garda powder price (US$/kg)
Region 1st garda hashish
(US$/kg)
2nd garda hashish
(US$/kg)
3rd garda hashish
(US$/kg) N/NE 1.0 1.0 1.0 S-E-W-C 1.1 1.1 1.2 Average 1.1 1.1 1.2
Note: Calculated from headmen’s responses at the time of the survey.
Cannabis resin seizures in Afghanistan and neighbouring countries
The 2010 cannabis survey indicates a relative stability in terms of cannabis cultivation No direct, quantitative estimate is available for cannabis cultivation and production before 2008 but the question remains on the levels before 2009 and their trends. Drug seizure trends do not directly reflect trends in drug production as they depend on many factors such as law enforcement strategies and priorities, trafficking dynamics, and, sometimes, chance. Thus, they should be interpreted with caution. Nevertheless, over the years, seizures of cannabis in Afghanistan and neighbouring countries should reflect large-scale changes in production levels assuming that there was no significant change in law enforcement
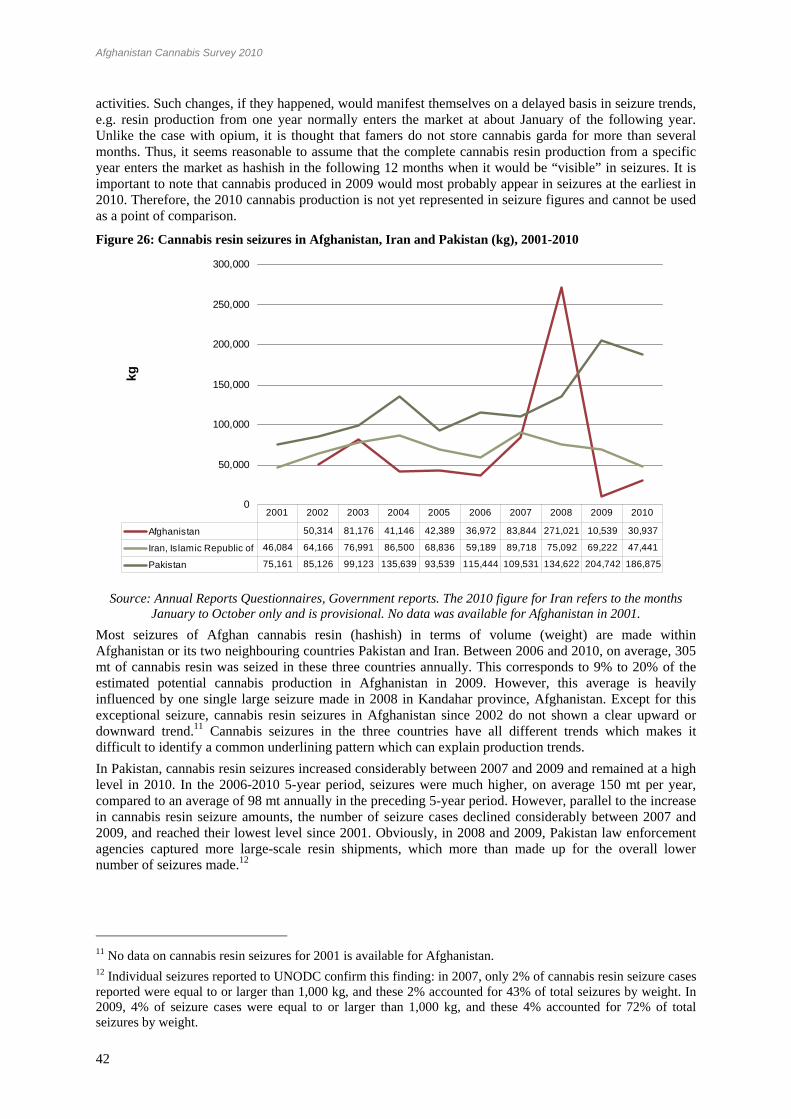
Afghanistan Cannabis Survey 2010
42
activities. Such changes, if they happened, would manifest themselves on a delayed basis in seizure trends, e.g. resin production from one year normally enters the market at about January of the following year. Unlike the case with opium, it is thought that famers do not store cannabis garda for more than several months. Thus, it seems reasonable to assume that the complete cannabis resin production from a specific year enters the market as hashish in the following 12 months when it would be “visible” in seizures. It is important to note that cannabis produced in 2009 would most probably appear in seizures at the earliest in 2010. Therefore, the 2010 cannabis production is not yet represented in seizure figures and cannot be used as a point of comparison.
Figure 26: Cannabis resin seizures in Afghanistan, Iran and Pakistan (kg), 2001-2010
0
50,000
100,000
150,000
200,000
250,000
300,000
kg
Afghanistan 50,314 81,176 41,146 42,389 36,972 83,844 271,021 10,539 30,937
Iran, Islamic Republic of 46,084 64,166 76,991 86,500 68,836 59,189 89,718 75,092 69,222 47,441
Pakistan 75,161 85,126 99,123 135,639 93,539 115,444 109,531 134,622 204,742 186,875
2001 2002 2003 2004 2005 2006 2007 2008 2009 2010
Source: Annual Reports Questionnaires, Government reports. The 2010 figure for Iran refers to the months
January to October only and is provisional. No data was available for Afghanistan in 2001. Most seizures of Afghan cannabis resin (hashish) in terms of volume (weight) are made within Afghanistan or its two neighbouring countries Pakistan and Iran. Between 2006 and 2010, on average, 305 mt of cannabis resin was seized in these three countries annually. This corresponds to 9% to 20% of the estimated potential cannabis production in Afghanistan in 2009. However, this average is heavily influenced by one single large seizure made in 2008 in Kandahar province, Afghanistan. Except for this exceptional seizure, cannabis resin seizures in Afghanistan since 2002 do not shown a clear upward or downward trend.11 Cannabis seizures in the three countries have all different trends which makes it difficult to identify a common underlining pattern which can explain production trends. In Pakistan, cannabis resin seizures increased considerably between 2007 and 2009 and remained at a high level in 2010. In the 2006-2010 5-year period, seizures were much higher, on average 150 mt per year, compared to an average of 98 mt annually in the preceding 5-year period. However, parallel to the increase in cannabis resin seizure amounts, the number of seizure cases declined considerably between 2007 and 2009, and reached their lowest level since 2001. Obviously, in 2008 and 2009, Pakistan law enforcement agencies captured more large-scale resin shipments, which more than made up for the overall lower number of seizures made.12
11 No data on cannabis resin seizures for 2001 is available for Afghanistan. 12 Individual seizures reported to UNODC confirm this finding: in 2007, only 2% of cannabis resin seizure cases reported were equal to or larger than 1,000 kg, and these 2% accounted for 43% of total seizures by weight. In 2009, 4% of seizure cases were equal to or larger than 1,000 kg, and these 4% accounted for 72% of total seizures by weight.

Afghanistan Cannabis Survey 2010
43
Figure 27: Pakistan, cannabis resin seizure amounts (kg) and number of cases, 2001-2009
0
50,000
100,000
150,000
200,000
250,000
2001 2002 2003 2004 2005 2006 2007 2008 2009
Pakistan Seizures (kg) Pakistan Seizures (no. of cases)
Source: Annual Reports Questionnaires. Seizure trends of cannabis resin in Iran show a different pattern. Since 2007, resin seizures have declined steadily. The 2006-2010 5-year average amount of cannabis resin seized (68 mt) is practically the same as in the 2001-2005 5-year period (69 mt).13 Not all cannabis resin seized in the Gulf countries or in Central Asia is of Afghan origin. Furthermore, not all countries in these two regions report cannabis resin seizures every year and it is not known if no seizures were made or if seizures made were reported. These shortcomings aside, in Central Asia cannabis resin seizures between 2005 and 2009 increased every year. However, the total amount seized – less than 1 mt on average per year in that period – is small compared to the amount seized in Afghanistan, Iran and Pakistan.
Figure 28: Cannabis resin seizures (kg), 2001-2009
0
2,000
4,000
6,000
8,000
10,000
12,000
14,000
16,000
2001 2002 2003 2004 2005 2006 2007 2008 2009
kg
Gulf countries Central Asia
Source: Annual Reports Questionnaires. Figures for Central Asia do not include Tajikistan. In the past decade, cannabis resin seizures in the Gulf region varied considerably from year to year and therefore a clear trend cannot be identified. On average, the annual amount of resin seized was larger between 2001 and 2005 (8 mt) than between 2006 and 2009 (6 mt).
13 For 2010, seizure figures in Iran refer to the months January to October only and are provisional. The final annual figure may be higher.

Afghanistan Cannabis Survey 2010
44
The interpretation of seizure trends in the three countries of Afghanistan, Iran and Pakistan is complicated by the fact that Pakistan reports that almost all the resin seized is of Afghan origin, whereas Iran reports that seizures partly originate from Afghanistan and partly from Pakistan. Thus, some of the Afghan cannabis resin reportedly reaches Iran via Pakistan, a route also known for opiate trafficking. However, an analysis of individual seizure data from Pakistan does not point to Iran as a destination country of cannabis resin shipments seized in Pakistan. Still, for a portion of individual seizures the destination country is not reported. That country could be Iran.14 Taking these considerations into account, the diverging seizure trends in Iran and Pakistan could be due to a change in trafficking routes, a change in trafficking volume or both. To a certain extent, there seems to be some compensation between falling seizure levels in Iran and rising seizures levels in Pakistan. The diverging trend between seizure cases and kilogramme amounts observed in Pakistan since 2007 could indicate a change in trafficking structures to fewer but larger shipments. However, more information is needed to get a clearer picture of the trafficking situation. All in all, cannabis resin seizure trends in the region are diverse and their interpretation with regard to potential cannabis production levels is extremely complicated. The information available does not necessarily indicate that cannabis production levels, as reflected in seizures, changed significantly from the first half of the 2000 decade and the second, nor did a clear seizure trend emerge in the region.
Payment of tax on cannabis (usher)
Usher is an informal tax of about 10% of the value of agricultural products paid by farmers to groups which control territories in rural Afghanistan. Slightly less than half of cannabis farmers (44%) reported paying usher on their cannabis production. There were strong regional differences: More than 50% of cannabis farmers in the Southern and Central regions reported paying usher, while few farmers in the Northern, North-eastern regions paid usher. In the Western region about 30% of farmers reported paying usher and no usher payment was reported in the Eastern region. This regional pattern is similar to the usher payment pattern reported in the Annual Opium Survey 2010 where mostly farmers in the Southern region reported paying usher on opium, compared to only a small proportion of farmers in other regions.
Figure 29: Payment of usher by region reported by cannabis farmers in 2010 (n=333)
0%
10%
20%
30%
40%
50%
60%
70%
80%
90%
100%
Central Eastern North andNorth-eastern
Southern Western Average
% o
f can
nabi
s fa
rmer
s
Usher paid No usher paid
More than two thirds of the affected cannabis farmers reported paying usher only in cash, while 14% reported paying usher in cash as well as in kind, and 9% reported paying usher only in kind.
14 Source: UNODC Individual Seizure Database (IDS).

Afghanistan Cannabis Survey 2010
45
Figure 30: Type of usher payment made by cannabis farmers (n=145)
Usher paid in cash and
in kind 14%
Usher paid only in kind
9%
Usher paid only in cash
77%
More than half of cannabis farmers (55%) reported paying usher to their Mullah, 39% to poor people, 6% to the Taliban and only 1% to Government officials.
Figure 31: Recipients of usher payment as reported by cannabis farmers (n=145)
1%
6%
39%
55%
0% 30% 60%
Government officials
Taliban
Poor people
Mullah
Ush
er p
aid
to
Number of responses (multiple responses possible)

Afghanistan Cannabis Survey 2010
46
Farm-gate value of cannabis resin production
The farm-gate value of cannabis garda production in 2010 was estimated to range between US$ 85 million and US$ 263 million. The farm-gate value of cannabis production corresponds to 0.7% to 2.0% of the 2010 Afghanistan GDP. This is still much lower than the farm-gate value of opium production. However, comparing 2009 with 2010, the difference between the farm-gate value of cannabis and opium is shrinking.
Figure 32: Farm-gate value of cannabis resin and opium production (US$ million), 2009 and 2010
85
324
484
39
94
263
728
559
0
100
200
300
400
500
600
700
800
2009cannabis
2009 opium 2010cannabis
2010 opium
US
$ m
illio
n
Note: the bars indicate the upper and lower bound of the estimation ranges.
Source: MCN/UNODC Afghanistan opium surveys 2009 and 2010, MCN/UNODC Afghanistan cannabis survey 2009.

Afghanistan Cannabis Survey 2010
47
3 METHODOLOGY
The survey had three main components: • A questionnaire survey in a sample of villages, randomly selected under an area frame sampling
approach, with interviews of village headmen and three farmers per village. • A remote sensing survey using a sample of satellite images, randomly selected under an area
frame sampling approach. • A yield observation survey, which investigates cannabis yield per field, harvest and processing of
cannabis. Information from different survey instruments was complemented by information from the monthly price monitoring system, which also covers cannabis resin, and from the Annual Opium Surveys where appropriate.
Survey components
Village survey
The sampling follows the guidelines of an area frame sampling design. An area frame sampling design is a widely used methodology in agricultural statistics. For the aims of this survey the following steps were carried out. Construction of the sampling frame: The purpose of stratification in any survey is to reduce the variance of the variables under study in each stratum. The village frame is a list of villages compiled by The Central Statistical Office in Afghanistan and AIMS. It contains the village name, district name, province name, location, number of households, and average household size. It has 41,419 villages in total. By consultations with survey coordinators in Afghanistan, it was concluded that several provinces in Afghanistan have little or almost null cannabis cultivation. In order to optimize resources, it was decided to exclude these provinces from the sampling frame. Hence, only 22 out of the 34 provinces in Afghanistan were targeted as potential areas with cannabis cultivation (cannabis risk area). Considering only the cannabis risk area, the sampling frame consists of 25,526 villages. Sample size: More than one item or characteristic is usually measured in surveys and often the number is large. If a desired degree of precision is prescribed for each item, the sample size calculations lead to a series of conflicting values for n (see Cochran, Wiley 1977 for formulae). To determine the sample size for the cannabis survey in Afghanistan, two constraints were considered. First, it was assumed that not much about the amount of cannabis cultivation was known. Second, there is a budget constraint due to field and operations costs, limiting the village survey to cover up to 1,529 villages.
Data collection and data entry
The village survey was carried out by experienced surveyors of UNODC/MCN Afghanistan under the close supervision of UNODC/MCN Survey Coordinators, who have also been involved in the opium poppy survey for many years. The methodology of the cannabis survey 2010 covered various tools, such as the village survey through a questionnaire of different types of farmers: “cannabis growing”, “stopped cannabis growing” and “never grown cannabis”. The village survey also included interviews of 1,452 village headmen to understand the extent of cannabis crop cultivation and socio-economic factors behind cultivation. In addition to the village survey, other important methods such as ground truth collection for the imagery interpretation, area estimation of cannabis field as well as the growth calendar of the crop and yield survey. In fact, the survey methodology was based on a sampling approach and was combined with the use of satellite imagery and extensive field visits. For this task, 129 surveyors visited 1,452 responsive villages out of a total of 1,529 sampled villages spread over 22 provinces and 232 districts. Altogether, 129 surveyors interviewed 4,356 farmers in the village survey.

Afghanistan Cannabis Survey 2010
48
Map
4: C
anna
bis r
isk
area
and
sele
cted
vill
ages
for
the
cann
abis
vill
age
surv
ey, 2
010 !
!
!
!!!
!
!
!!
!
!
!!
!! !!
!!!
!
! !
!
!!
!
!
!
!
!!
! !
!!
!!
!
!
!
! !!! !
!
!
!
!
!!
! ! !
!
!!
!
! !! ! !
!!
!
!!
!
!!
!!
!!!
!!
!
!
!!
!
! !!
!
!
! !!
!!
!!
!
!
!
!
!
! !
!
!!
!
!
!!
! ! !!!
!!!!
!
!
!!!!!!
!
!
!
! !
!
!!!!
!
!
!
!! ! !! !
!
!
!
!
!! !
!
!
! ! !
!
!
!
!
!
!
! ! !
!
!
!
! ! !!
!!
!
!
!
!
!
!!!!
!!
!
!
!
!
!!
!!
!! !
!
!
!
!!
!
!
!
!
!
!
!
!
!!!
!
! ! !
!!
!!
!!
!!
!
!
!
!
!!
!
! !!
! !
!
!
!
!!
!! !
!!
!
!
!
!! ! !!
!
!!
!
!
!
!
!
!!
!
!!
!
!!!
!!
!
!
!!
!!
!!
!!
!
!
!
!
!
!!!
! !
!
!!
!!
!
!!
!! !
!!
!
!
!! !!
!
! !!
!
!
!
!! ! !!!
!
!
!
!
!! !
!!! !
!
!
!
!
!!!
!!
!
!
!
!
!
!!
!!! !
!
!!
!
!! !!
!!
!!
!!
!!
!
! !
!!
!
!
!
!!
!! !
!
!
!
!
!!
!! !
!! !
!
!
!
!
! !
!!!
!
!
!
!!
!!!
!!
!!
!
!!
!!!
!
!
!
!
!
!!
!
!
!
!
!!
!
!!
!! ! !
! !
!
!
!
!!
!
!! !
!!!
!
!!
!!!!
!
!
!
!
!!
!
!!!
!
! !
!!
!
!!
!
! !
!
!
!
!!! !!
!!
!
!
!
!
!
!
!!
!!!
!!
!
! !! !
! !
!
!
!
!
!!!
!
!!
!
!
!!!!
!
!!!
! !
!
!!
! !
!!
!
!
!
!
!!
! !
!
!!
!
!
!
!
!!
!! !
!
!
!
!
!
!!!
!!!
!
!
!
!
! !!!!
! !
!
!
! ! !! ! ! ! !
!
!
!
!
!!
!!
!
!
!
!
! !!
!
!! !
!
!
!
!
!!
! !
!!
!
!
!
!
!!
!
!
!!!
!
!
!
!
!!!
!
!
!
!
!
!! !
!!
!!!
!
!
!
!!
!
!
!
!!
!
!
!!
!!
!!!
!
!
!! !
!
!
!!
!
!! !!! ! !
! !
!
!
!
!!
!
!!
!
!
!
!
! !
!
!!
!
!
!!
!
!
!
!!!
! !
!
!
!
!
!!
!!! !
!!
!
!!
!
!
!!
!
!
!
!
!
!
! !!!
!
!
!!
!
!
!!!
!
!
!!! !
!!
! !
!
!
!
!! !
!
!
!
!
!
!
!!
!!
!
!!
!
!
!
!
! !!
!! !
!
!
!
!!
! !!!
!
!
!
!
!! !!
!
! !!
!
!!!
!!! !!
!
!!
!!!
!!
! !
!
!!
!! !
! !
!
!
!
!!!
! !!
!
!
!
!!
!!
!!
!
!
!
!!
!!
!!
!!
!
!!
!
!! ! ! !!
!
!
!
!!
! !!!
!
!
!
!
!!
!!
!
!
!
!
!
! !! !
!! !
!
!
!
!!!
! ! !
!
!
!
!!! !!
!!! !!
!!
! ! !! !
!!
!
!
!
!
!!
!!!
!
!!
!
!
!
!
!
!
! !!
!
!
!!
!
!
!
!
!
!!
!
!
!!
! !!
!
! !
!
!!!
!
!
!
!!
!
!
!
!
!
!
!
!!
!
!
!
!
!
!
!
!
!
!
!
!
! !
!
! !
!
!
!
!
!
! !
!
!
!
!
!
!
!
!
!!
!
!
!
! !!! !! !
!!
!
! !
!
!
!
!
!
!
!
!
!
!
!
!
!
!
!!!
!
!
!
!
!!
!!
!!!!
!!
!
!
!!
!!
!
!
!
!!
! !
!!
!
!!
!
!
!
!
!
!
!
!
!!!
!
!!
!
!
!!
!
!
!
! !
!
!
!
!
!
!
!!
!
!!
!!
!
!
!
!
!
!
! !!
!
! !
!
!
!
!
!
!! !
!
!
!
!
!
!
!!
!
! !
!
!
! ! ! !!
!
!
!
!
!
!
!!
!
!
!
!!
!
!
!
!
!
!
!
!
!!
!
!
!
!
!
!!
!! !
!
!
!
!!
!
! !!
!
!
!
!!
!!
!
!
!
!
!!
!
! !!
!
!
!
!
!
!
! !!!
!
!
!
!
!
!
!!! !
!
! !
! !
!
!
!
!
! !!
!
!
! !!
!
!
!
!
!!!
!!
!
!!
!!!
!
!
!
!!
!
!
!
! !
!
!
!
! !!!
!
! ! ! !!
!!
!
!
!
!
!!
!!
!
!!
!!
!
!
!
!
!
!! ! !
!
!
!
! !
!
!
!
!
!
!
! !! !
! !
!
!
!
!
!!!
! !
!!
!
!
!
!!
!
!
!
!
!
! !!
! !
!
!
!
!
!
!!!!!
!! !
!
!
!
!
!
!
!!
!!
!
!
!
!
!
!
! !!!
! ! !!
!
!
!
!
!
!
! !!
!
!!! ! !
!
!
!
!
!
!
!! !
!! !
!
!
!
!
PA
KIS
TA
NP
AK
IST
AN
TU
RK
ME
NIS
TA
NT
UR
KM
EN
IST
AN
TA
JIK
IST
AN
TA
JIK
IST
AN
UZ
BE
KIS
TA
NU
ZB
EK
IST
AN
IRA
NIR
AN
Hira
t Fara
h
Gho
r
Hilm
and
Kand
ahar
Nim
roz
Bada
khsh
an
Balk
h
Gha
zni
Zabu
l
Fary
ab
Badg
his
Pakt
ika
Bagh
lan
Bam
yan
Sari
Pul
Takh
ar
Day
kund
i
Jaw
zjan
War
dak
Uru
zgan
Sam
anga
n
Nur
ista
n
Kund
uz
Kuna
rKa
bul
Loga
r
Khos
tNan
garh
ar
Parw
an Pakt
iyaPa
njsh
ir
Lagh
man
Kapi
sa
SM
CN
UN
OD
CAf
hi
tC
biS
2010
¯0
150
300
75Km
Prov
inci
albo
unda
ry
Inte
rnat
iona
lbou
ndar
y
Dis
ricts
boun
dary
Lege
nd!
Sele
cted
villa
ges
Sam
plin
gfra
me

Afghanistan Cannabis Survey 2010
49
Map
5: S
ampl
ing
fram
e an
d se
lect
ed c
ells
for
the
cann
abis
sate
llite
surv
ey, 2
010
PA
KIS
TA
NP
AK
IST
AN
TU
RK
ME
NIS
TA
NT
UR
KM
EN
IST
AN
TA
JIK
IST
AN
TA
JIK
IST
AN
UZ
BE
KIS
TA
NU
ZB
EK
IST
AN
IRA
NIR
AN
Hira
t Fara
h
Gho
r
Hilm
and
Kand
ahar
Nim
roz
Bada
khsh
an
Balk
h
Gha
zni
Zabu
l
Fary
ab
Badg
his
Pakt
ika
Bagh
lan
Bam
yan
Sari
Pul
Takh
ar
Day
kund
i
Jaw
zjan
War
dak
Uru
zgan
Sam
anga
n
Nur
ista
n
Kund
uz
Kuna
rKa
bul
Khos
tNan
garh
arLo
gar
Parw
an Pakt
iyaPa
njsh
ir
Lagh
man
Kapi
sa
¯0
150
300
75Km
Pro
vinc
ialb
ound
ary
Inte
rnat
iona
lbou
ndar
y
Sam
plin
gfra
me-
2010
Lege
nd
Ran
dom
lyse
lect
edce
lls

Afghanistan Cannabis Survey 2010
50
The data was collected by the trained surveyors through the questionnaire prepared for interviewing farmers cultivating cannabis, farmers who stopped cultivating cannabis, farmers who had never grown cannabis and headman of the village to know his perception regarding cannabis cultivation. The questionnaire also covered socioeconomic aspects of farmers, reasons for growing, accessibility of loans for the crop and other licit crops, access to other financial institutions and other aid organizations in the area. All the questionnaires were reviewed by the regional Survey Coordinators and sent to UNODC or MCN central survey section. The data were entered by the data clerks based in Ministry of Counter Narcotics (MCN) under the supervision of the Data Management Officer of UNODC, survey section.
Remote sensing survey
Twenty-two provinces were identified as associated with cannabis cultivation. Based on field reports and the 2009 cannabis survey, the level of cannabis cultivation in six provinces was expected to be too low for a sampling approach to be successful with the available means for acquiring satellite imagery. For these provinces, a targeting approach was used, i.e. based on field information, imagery was acquired over all areas from where current cannabis cultivation was reported. Out of the six provinces foreseen targeted, satellite images were only acquired over Baghlan. In the remaining five provinces, no cannabis cultivation was reported (Jawzjan, Sari Pul, Bamyan) or not enough information (Khost, Kunduz) was received to be able to target the fields with imagery. In the remaining 16 provinces, a sampling approach was used. To increase the number of images and improve the sample, the image size was set to 8 km by 8 km. Total number of images that could be purchased was 180. Approximately 160 were available for sampling and 20 for targeted provinces. Very high resolution satellite images were acquired for the remote sensing survey. Number of images by province for 16 sampled provinces determined by:
1. allocated proportional to square-root of irrigated area, with further condition of
2. minimum of 8 images per province
This gives a total of 169 sample images. Cells crossing a boundary are assigned to the province in which they have the most irrigated area. Cells with less than 1 km2 of irrigated land are excluded from selection, although they still contribute to total irrigated area in a province. Within each province, cells selected by PPS using irrigated area as a auxiliary variable. Because of replacement, and therefore the chance of a cell being selected more than once, 161 cells were eventually selected. With the exception of 2 images, all were acquired. The final sample represents 7.0% (161/2298) of cells but 17.8% (331,801 ha / 1,868,332 ha) of total irrigated area over the 16 provinces. In the 2009 and 2010 cannabis surveys, it was noticed that the active agricultural area identified on the imagery used for the cannabis survey was much smaller than the potential agricultural land (“ag mask”) based on which the sampling was done. The active agricultural land by definition is smaller than the potential agricultural land. However, the differences were larger than those observed in the poppy cultivation season. In 2009, e.g. some sample cells which had some potential agricultural land, did not contain any active agriculture at the time of cannabis cultivation. UNODC, together with academic partners, is undertaking research to better understand the year-to-year changes of the active agricultural land and differences between winter and summer agricultural seasons in Afghanistan.
Ground truth collection
Ground truth information (GPS points) was collected in Paktya, Baghlan and Logar provinces. In Nangarhar province ground truth information was collected through a segment survey (GPS points and field mapping). The collection of ground truth in most of the Southern region was difficult for the surveyors and survey coordinators.

Afghanistan Cannabis Survey 2010
51
Table 8: Sample and target provinces 2010
Province Approach No. of images sampled/acquired
Badakhshan Sampled 8/8 Badghis Sampled 8/8 Balkh Sampled 13/13 Day Kundi Sampled 8/8 Farah Sampled 12/12 Faryab Sampled 14/13 Hilmand Sampled 13/13 Hirat Sampled 15/15 Kandahar Sampled 14/14 Logar Sampled 6/6 Nangarhar Sampled 10/10 Nimroz Sampled 8/7 Paktya Sampled 7/5 Takhar Sampled 9/9 Uruzgan Sampled 8/8 Zabul Sampled 8/8 Total (sample) 16 provinces 161/157 Baghlan Targeted na/2 Bamyan Targeted na/0 Jawzjan Targeted na/0 Khost Targeted na/0 Kunduz Targeted na/0 Sari Pul Targeted na/0 Total (targeted) 6 provinces 2 images
na – not applicable. Note that the number of images actually sampled(161) is lower than the calculated sample size of 169 because of replacement and therefore the chance of a cell being selected more than once.
Cannabis Yield Observation Survey
Practical observations on yield processing were carried out during the cannabis harvest and cannabis garda processing with selected farmers. Forty-nine fields were identified, 39 of them with mono-crop cannabis, the others with cannabis in mixed cultivation. Farmers were interviewed on the yield obtained from a previously identified field, including all yield qualities, as well as on the cannabis extraction method used, cannabis seed yield, timing and duration of harvesting, drying, and garda extraction, people involved and hashish production.
Capacity building
UNODC and MCN Survey Coordinators and Assistant Coordinators were trained through the following training workshops:
• Training of trainers for Survey Coordinators (SC) and assistant survey coordinators of UNODC and MCN
• Training for surveyors hired by the SCs • Training for data clerks on data cleaning procedure by the UNODC data programmer
Estimations
Area estimation
The estimated cannabis area in Afghanistan in 2010 is presented as a range, from 9,000 ha to 29,000 ha. The range expresses the uncertainty associated with the estimation.

Afghanistan Cannabis Survey 2010
52
The remote sensing survey was conducted with limited ground reference information available. Certain types of cannabis cultivation such as cultivation in kitchen gardens, mixed crops, and cannabis along field bunds are difficult or impossible to detect with the methodology applied. The amount of cannabis cultivation of these types could not be estimated. It is assumed that the best estimate of the remote sensing survey represents a minimum estimate. It was therefore used to establish the lower bound of the area estimation range. The results from the remote sensing survey were used to calculate the lower bound of the range, with the exception of two provinces, Logar and Paktya. In Logar, cannabis is mainly cultivated on the bunds of fields, which could not be detected on satellite imagery. In Paktya, a relatively small variety was cultivated, with a low plant density. This pattern did not give a clearly identifiable signature and texture on the imagery. For these two provinces, the area estimate from the village survey was used for the calculation of the lower bound. For the calculation of the upper bound the estimates from the village survey were used. Headmen report the number of cannabis growing households in the village, the area covered by cannabis in the village and the total number of households. Thus, the average cannabis area cultivated per household in each village could be calculated and extrapolated to the sampling frame.
Yield and production
Cannabis yield was estimated based on the results of the cannabis yield observation survey. This survey was conducted in January 2011, when farmers actually processed the harvested and dried cannabis plants to obtain cannabis resin. In January 2011, surveyors went to selected farmers and witnessed the cannabis resin (garda) production from these fields. The garda yield of different qualities was measured. Yield information from 39 mono-crop cannabis fields was used for the estimate and used to calculate the average yield for all garda qualities separately. Regional differences exist in processing cannabis to obtain garda. This information was used to stratify the yield observations into two yield regions, one comprising the fields in the Northern and North-eastern and the other fields in the Southern, Eastern, Central and Western regions. In general, in the North and Northeast of the country, the processing methods employed result in first garda of higher quality but less quantity, whereas in other regions a larger proportion of first garda is obtained, which however is of lower quantity (less resin and more plant material). Cannabis production for all garda qualities was estimated by multiplying the average regional yield with the lower and upper value of the cannabis cultivation range, respectively. For this purpose, it was assumed that 19% of cultivation took place in the N-NE region and 81% in the other regions of the cannabis risk area. These proportions correspond to the cannabis cultivation areas in these regions based on the results of the remote sensing survey.
Table 9: Cannabis garda production (mt), 2010
Yield region Area
proportion 1st garda
(mt) 2nd garda
(mt) 3rd garda
(mt) Total (mt)
N-NE 0.14 47 48 39 134 S-E-C-W 0.86 541 337 189 1,067 Total lower bound 588 385 228 1,201 Rounded 1,200 N-NE 0.14 147 150 121 418 S-E-C-W 0.86 1,686 1,049 588 3,323 Total upper bound 1,832 1,199 709 3,740 Rounded 3,700
Thus, total cannabis production including all garda qualities was estimated to range from 1,200 mt to 3,700 mt (rounded).
Cannabis-growing households
The number of cannabis-cultivating households was estimated from information provided by headmen in the sample villages on the number of households involved in cannabis cultivation compared to the total
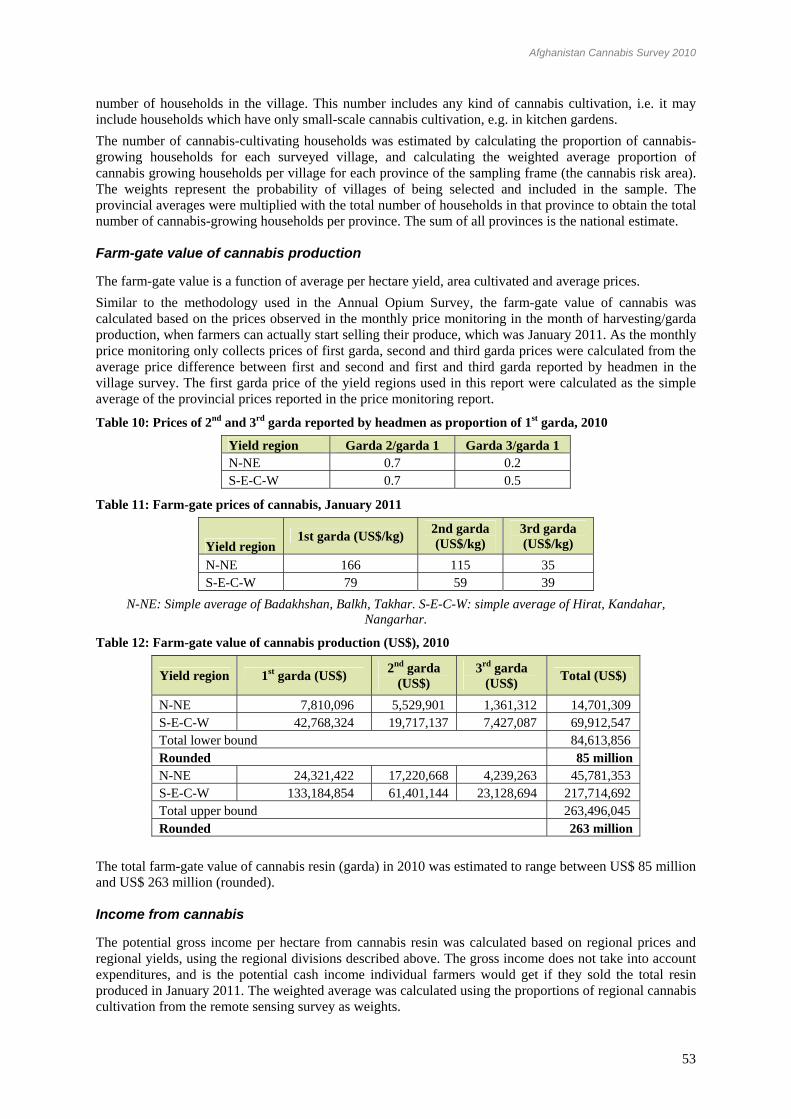
Afghanistan Cannabis Survey 2010
53
number of households in the village. This number includes any kind of cannabis cultivation, i.e. it may include households which have only small-scale cannabis cultivation, e.g. in kitchen gardens. The number of cannabis-cultivating households was estimated by calculating the proportion of cannabis-growing households for each surveyed village, and calculating the weighted average proportion of cannabis growing households per village for each province of the sampling frame (the cannabis risk area). The weights represent the probability of villages of being selected and included in the sample. The provincial averages were multiplied with the total number of households in that province to obtain the total number of cannabis-growing households per province. The sum of all provinces is the national estimate.
Farm-gate value of cannabis production
The farm-gate value is a function of average per hectare yield, area cultivated and average prices. Similar to the methodology used in the Annual Opium Survey, the farm-gate value of cannabis was calculated based on the prices observed in the monthly price monitoring in the month of harvesting/garda production, when farmers can actually start selling their produce, which was January 2011. As the monthly price monitoring only collects prices of first garda, second and third garda prices were calculated from the average price difference between first and second and first and third garda reported by headmen in the village survey. The first garda price of the yield regions used in this report were calculated as the simple average of the provincial prices reported in the price monitoring report.
Table 10: Prices of 2nd and 3rd garda reported by headmen as proportion of 1st garda, 2010
Yield region Garda 2/garda 1 Garda 3/garda 1 N-NE 0.7 0.2 S-E-C-W 0.7 0.5
Table 11: Farm-gate prices of cannabis, January 2011
Yield region 1st garda (US$/kg) 2nd garda
(US$/kg) 3rd garda (US$/kg)
N-NE 166 115 35 S-E-C-W 79 59 39
N-NE: Simple average of Badakhshan, Balkh, Takhar. S-E-C-W: simple average of Hirat, Kandahar, Nangarhar.
Table 12: Farm-gate value of cannabis production (US$), 2010
Yield region 1st garda (US$) 2nd garda (US$)
3rd garda (US$) Total (US$)
N-NE 7,810,096 5,529,901 1,361,312 14,701,309 S-E-C-W 42,768,324 19,717,137 7,427,087 69,912,547 Total lower bound 84,613,856 Rounded 85 million N-NE 24,321,422 17,220,668 4,239,263 45,781,353 S-E-C-W 133,184,854 61,401,144 23,128,694 217,714,692 Total upper bound 263,496,045 Rounded 263 million
The total farm-gate value of cannabis resin (garda) in 2010 was estimated to range between US$ 85 million and US$ 263 million (rounded).
Income from cannabis
The potential gross income per hectare from cannabis resin was calculated based on regional prices and regional yields, using the regional divisions described above. The gross income does not take into account expenditures, and is the potential cash income individual farmers would get if they sold the total resin produced in January 2011. The weighted average was calculated using the proportions of regional cannabis cultivation from the remote sensing survey as weights.

Afghanistan Cannabis Survey 2010
54
Table 13: Gross income from cannabis resin per hectare (US$/ha), 2010
Region 1st garda (US$/ha)
2nd garda (US$/ha)
3rd garda (US$/ha)
Total (US$/ha)
N-NE 5,787 4,098 1,009 10,894 S-E-C-W 5,326 2,456 925 8,707 Weighted national average* 9,022 Rounded 9,000
* Weighted by proportion of cannabis cultivation per region. Farmers reported in the village survey an average of 0.33 ha of cannabis cultivation per household. Using this figure and multiplying it by the per hectare income, on average, in 2010 cannabis-farming households had a cash income of US$ 3,000.

Afghanistan Cannabis Survey 2010
55
ANNEX:
Cannabis garda processing in Logar province
Cannabis plants with seeds being ready for resin (garda) processing in Mohammad Agha district of Logar province
Cannabis plants broken in to pieces being ready for resin (garda) processing in Mohammad Agha district of Logar province
Cannabis plant stored inside the room Cannabis resin (garda) after conversion processing
Cannabis seeds separated from resin (garda) Cannabis stems after separation from garda and seeds
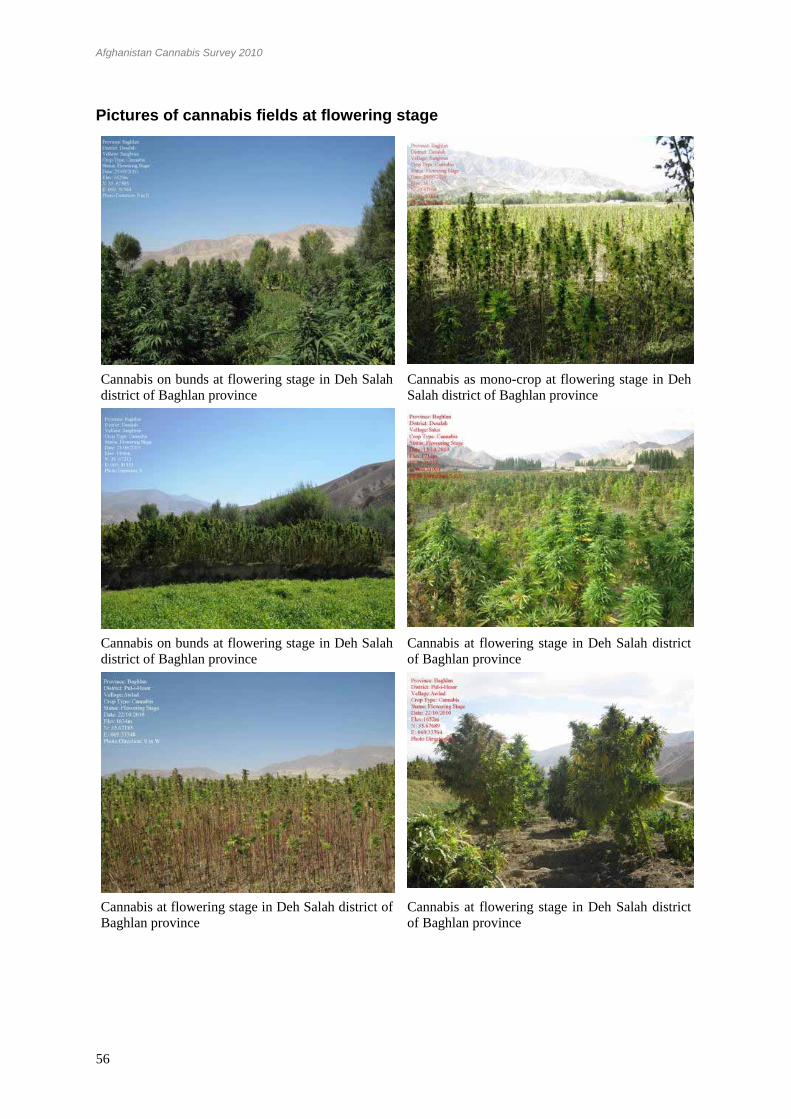
Afghanistan Cannabis Survey 2010
56
Pictures of cannabis fields at flowering stage
Cannabis on bunds at flowering stage in Deh Salah district of Baghlan province
Cannabis as mono-crop at flowering stage in Deh Salah district of Baghlan province
Cannabis on bunds at flowering stage in Deh Salah district of Baghlan province
Cannabis at flowering stage in Deh Salah district of Baghlan province
Cannabis at flowering stage in Deh Salah district of Baghlan province
Cannabis at flowering stage in Deh Salah district of Baghlan province