Embed Size (px)
Citation preview
Building Intermap’sData Management System InterfaceUsing ArcPublisher and ArcReader
Richard Asselin
Intermap Technologies Corp.
2 Gurdwara RdSuite 200
Ottawa, ON K2E 1A2(613) 226-5442
www.intermaptechnologies.com
1
Abstract
Intermap is in the business of creating digital descriptions of the Earth’s surface.Our unique data acquisition technology enables Intermap to quickly andaffordably acquire large and continuous datasets. Through our NEXTMap
program, we're acquiring complete and accurate map databases of entirecountries - something never before undertaken on a commercial basis.
Managing such a large undertaking demands a thorough understanding of what’shappening in production, and where the work is heading. A tool called the “Data
Management System – Explorer” (DMSe) was developed to aid production staffand management to tackle this daunting task.
This paper focuses on the design, development, and implementation of theDMSe. Details are given regarding the programming of the ArcReader /Microsoft SQL Server production database interface, as well as the various DMSe
database views and stored procedures. Timesaving tips are also discussed,allowing for speedier changes to the DMSe with minimal or no downtime.
2
Introduction
Intermap and the NEXTMap Program
Less than a decade later after its establishment in 1996, Intermap Technologieshas employees and operations worldwide that serve a growing digital elevationmodel (DEM) and geographic information system (GIS) marketplace.
Intermap is in the business of creating and licensing accurate digital descriptionsof the surface of the earth through the use of their STAR mapping technology.
They have acquired, and continue to build, a library of elevation data andimagery products that provide a precise and accurate digital model of the shapeof the earth's surface at an unprecedented accuracy. These products serve a
wide range of commercial, government, military and consumer applications.
The demand for detailed, accurate and low-cost digital topographic maps of the
world has never been greater. Intermap answered that demand with NEXTMap.
Their unique data acquisition technology enables them to quickly and affordably
acquire large and continuous datasets, at night or in cloudy conditions. Throughthe NEXTMap program, they’re acquiring complete and accurate map databases
of entire countries - something never before undertaken on a commercial basis.Intermap’s data library currently features the national coverage of Great Britain,Jamaica, Puerto Rico, Indonesia, Solomon Islands and the island nation of
Vanuatu. The data collection of the United States is currently underway, withinitial collections in Mississippi, West Virginia, California and Florida.
Data Management System
In order to process such a large dataset in a timely and efficient manner, greatefforts have gone towards automating parts of production and simplifying themanagement of the production flow. One such effort was the development of
the Data Management System, or DMS. The DMS, as its main role, aidsmanagers and employees control the flow of data through the productionprocess. The DMS consists of a set of tools accessible through one location.
Some of these tools interact with the production database and the editingsoftware. The other part of the DMS, the “DMS – explorer”, serves as the eyesinto the production process. The DMSe, created using ArcPublisher and
ArcReader, allows users to, at a glance, see the exact location of a tile inproduction process. The user can then drill in for more details on that specific
tile. The DMSe will be the focus of this paper.
3
Outline
This paper will begin by giving a general description of the production flow fromthe initial acquisition planning right through to the final delivery of data toIntermap’s online store. The second section will delve further into the actual
data editing, focusing on the software used to create Intermap’s products, andspecifically on the Data Management System. The final section will focus entirelyon the DMSe and how it was developed to interface with the production
database. This paper will conclude with lessons learned, as well as what thefuture holds for the DMSe.
IFSAR Data Processing
Overview
Intermap is in the business of collecting Interferometric Synthetic Aperture Radar(IFSAR) data for creating highly accurate yet affordable Digital Elevation Models
(DEMs) and Orthorectified Radar Images (ORIs) of the Earth. Intermap deliversthree core products to its clients: Digital Surface Models (DSMs), Digital Terrain
Models (DTMs), and the aforementioned ORIs. ORIs look somewhat likemonochromatic aerial photos and are always generated in pairs for any particularscene. The pairing of the ORIs allows Intermap to create DSMs. ORIs and DSMs
display the first surface on the ground that the radar strikes, including terrainfeatures, buildings, power lines, and vegetation such as large trees or forests.Through a combination of automated tools and manual editing, a DTM is created
by digitally removing cultural features, as well as treed areas, from the DSM.
Intermap’s data acquisition / editing processes follow an ISO framework,
meaning that the activities have been structured in terms of well-defined anddocumented processes. As such, core products are produced to tightlycontrolled specifications. The general flow of data from the initial contract award
right to the final delivery occurs as follows:
4
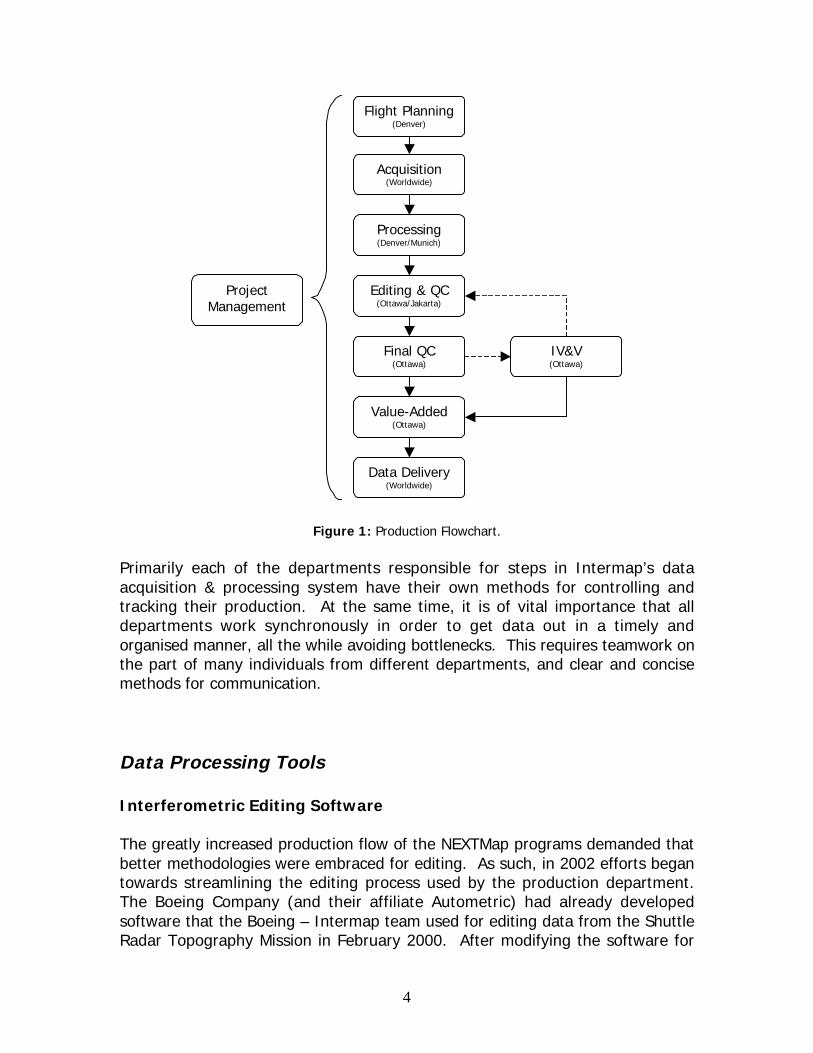
Figure 1: Production Flowchart.
Primarily each of the departments responsible for steps in Intermap’s data
acquisition & processing system have their own methods for controlling andtracking their production. At the same time, it is of vital importance that alldepartments work synchronously in order to get data out in a timely and
organised manner, all the while avoiding bottlenecks. This requires teamwork onthe part of many individuals from different departments, and clear and concisemethods for communication.
Data Processing Tools
Interferometric Editing Software
The greatly increased production flow of the NEXTMap programs demanded that
better methodologies were embraced for editing. As such, in 2002 efforts begantowards streamlining the editing process used by the production department.The Boeing Company (and their affiliate Autometric) had already developed
software that the Boeing – Intermap team used for editing data from the ShuttleRadar Topography Mission in February 2000. After modifying the software for
Flight Planning(Denver)
ProjectManagement
Acquisition(Worldwide)
Processing(Denver/Munich)
Editing & QC(Ottawa/Jakarta)
Final QC(Ottawa)
Value-Added(Ottawa)
Data Delivery(Worldwide)
IV&V(Ottawa)

5
use on Intermap’s Star data, it was renamed IES (“Interferometric EditingSoftware”). The SRTM & IES software included one very important advantage
over most commercial off-the-shelf software packages: it offered the ability tocontrol production flow using a relational database management system. Tilespassing through the editing process were controlled by the database, and the
history of the tile was tracked in the database. Additional functionality such asan operator’s access level for the software, or a tile’s difficulty rating were alsoincluded in the database design. The software also had the ability to
automatically launch certain processes based on the tile’s state. For example,once interactive editing was completed, the software would automatically check
the edges for any errors.
Data Management System
The software – database interface, although a great improvement over the oldmanual editing process, introduced a new challenge to the production
environment. Management had to manually edit fields in the database in orderto get data through the production process. This manual editing of tables was,for obvious reasons, a big concern for the database administration team. The
probability of introducing erroneous data into the database was rather high.Accordingly, a new toolset was introduced into the production environment: theData Management System (DMS). The major goal of the DMS was to provide to
the end user a simplified interface into the production database. Tools to changethe editing state of tiles, as well as perform and track Quality Control of tileswere built into the DMS. The other major goal was to provide a one-stop
shopping location for all DMS-related tasks. Users logged in to a secure web-based environment and were, based on their access level, presented with a listof available tools. The DMS in a sense became the control interface for the IES
software and the other production editing processes.
Data Management System “Explorer”
Overview
While the web-based DMS solved the issue of getting information into the
production database, there was still the challenge of getting information out tothe user. With all the information stored in the database, there was still no wayto view what was going on in production other than viewing a tabular report of
all tiles and their associated editing information. While useful, tabular reportshave one major shortcoming, in that they don’t allow easy “at a glance” viewingof adjacent tiles or editing areas. They also make it more difficult to interpret
information from a multitude of tables. Intermap needed a way to get thatinformation out to the user without having to train all people on the intricacies of
6
the database tables and structure. From this need came the birth of the DataManagement System “Explorer” (DMSe). The DMSe provided a graphical
interface, through ESRI’s ArcReader, to the production database allowing usersthe ability to quickly see a tile’s editing status, while still giving the option ofdrilling down further into the details of the tile.
DMSe Design Goals
One of the major goals of the latest version of the DMSe was to facilitate the“DMSe experience.” Since the DMSe was intended to be the gateway to the
production environment, ease of use was of the utmost importance. In order tomeet this goal, focus was placed on four main areas: a live join to the database,better integration with the DMS tools, an easier at-a-glance understanding of
where tiles were in the editing process, and more information basemap layers.
Basemap Layers
Only basemap layers that would be of use in the editing process were included,such as the various hydrology, transportation, and urban area layers. While not
directly used in the production process, these layers do provide a general idea ofthe degree of difficulty that an operator will encounter during editing. This inturn allows the production coordinator to more easily assign work to operators
based on their experience levels or editing specialties. Additional layers such aspolitical boundaries provide information more generally used by projectmanagers during the initial stages of the production process.
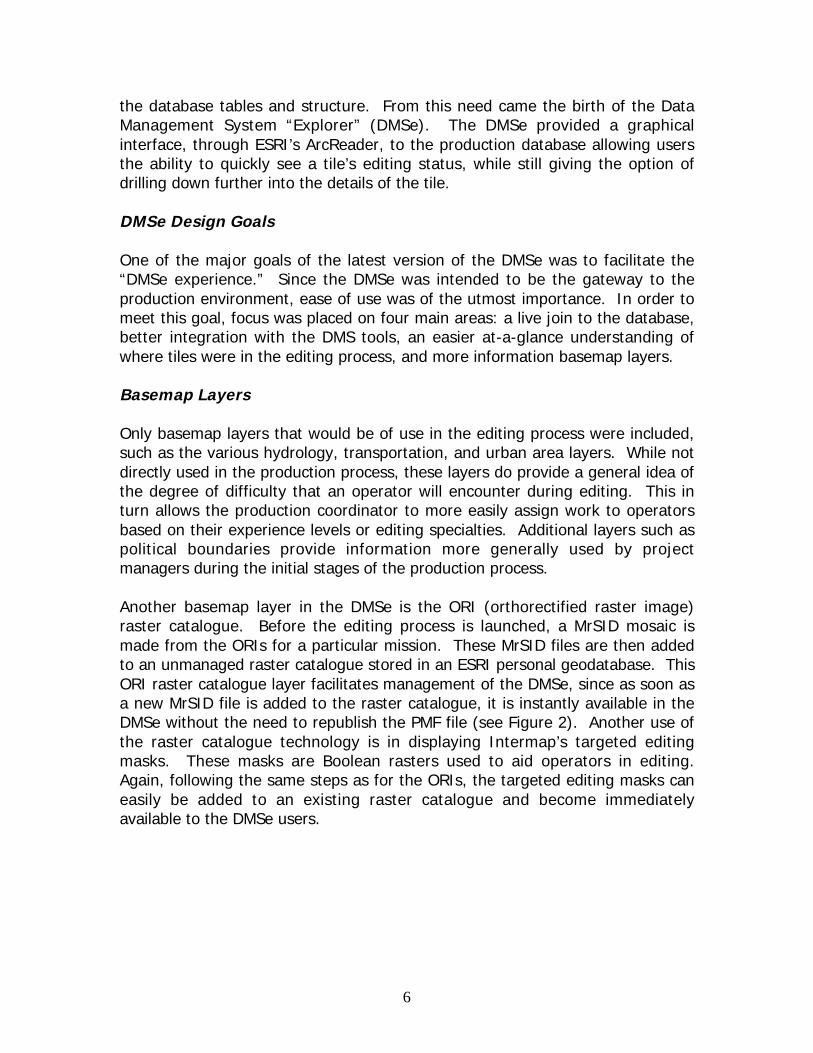
Another basemap layer in the DMSe is the ORI (orthorectified raster image)raster catalogue. Before the editing process is launched, a MrSID mosaic is
made from the ORIs for a particular mission. These MrSID files are then addedto an unmanaged raster catalogue stored in an ESRI personal geodatabase. This
ORI raster catalogue layer facilitates management of the DMSe, since as soon asa new MrSID file is added to the raster catalogue, it is instantly available in theDMSe without the need to republish the PMF file (see Figure 2). Another use of
the raster catalogue technology is in displaying Intermap’s targeted editingmasks. These masks are Boolean rasters used to aid operators in editing.Again, following the same steps as for the ORIs, the targeted editing masks can
easily be added to an existing raster catalogue and become immediatelyavailable to the DMSe users.
7
Figure 2: Orthorectified Raster Image catalogue.
Live Database Join
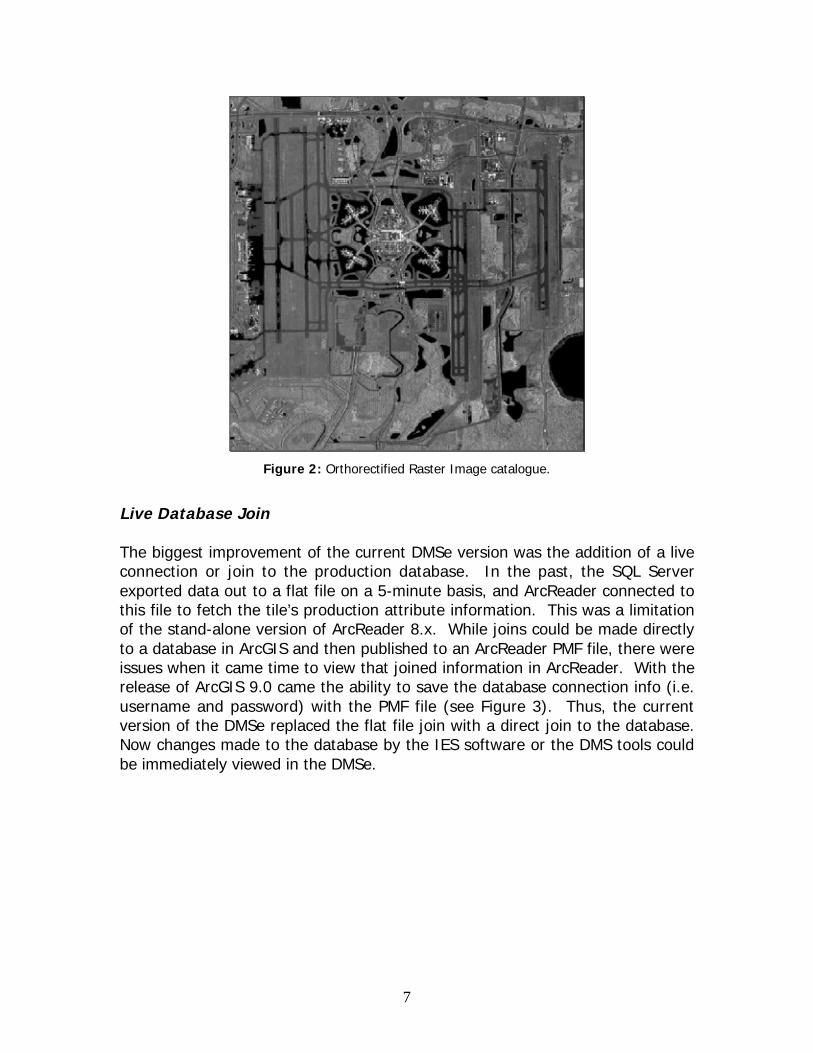
The biggest improvement of the current DMSe version was the addition of a liveconnection or join to the production database. In the past, the SQL Server
exported data out to a flat file on a 5-minute basis, and ArcReader connected tothis file to fetch the tile’s production attribute information. This was a limitationof the stand-alone version of ArcReader 8.x. While joins could be made directly
to a database in ArcGIS and then published to an ArcReader PMF file, there wereissues when it came time to view that joined information in ArcReader. With therelease of ArcGIS 9.0 came the ability to save the database connection info (i.e.
username and password) with the PMF file (see Figure 3). Thus, the currentversion of the DMSe replaced the flat file join with a direct join to the database.Now changes made to the database by the IES software or the DMS tools could
be immediately viewed in the DMSe.
8
Figure 3: Database Connection Properties.
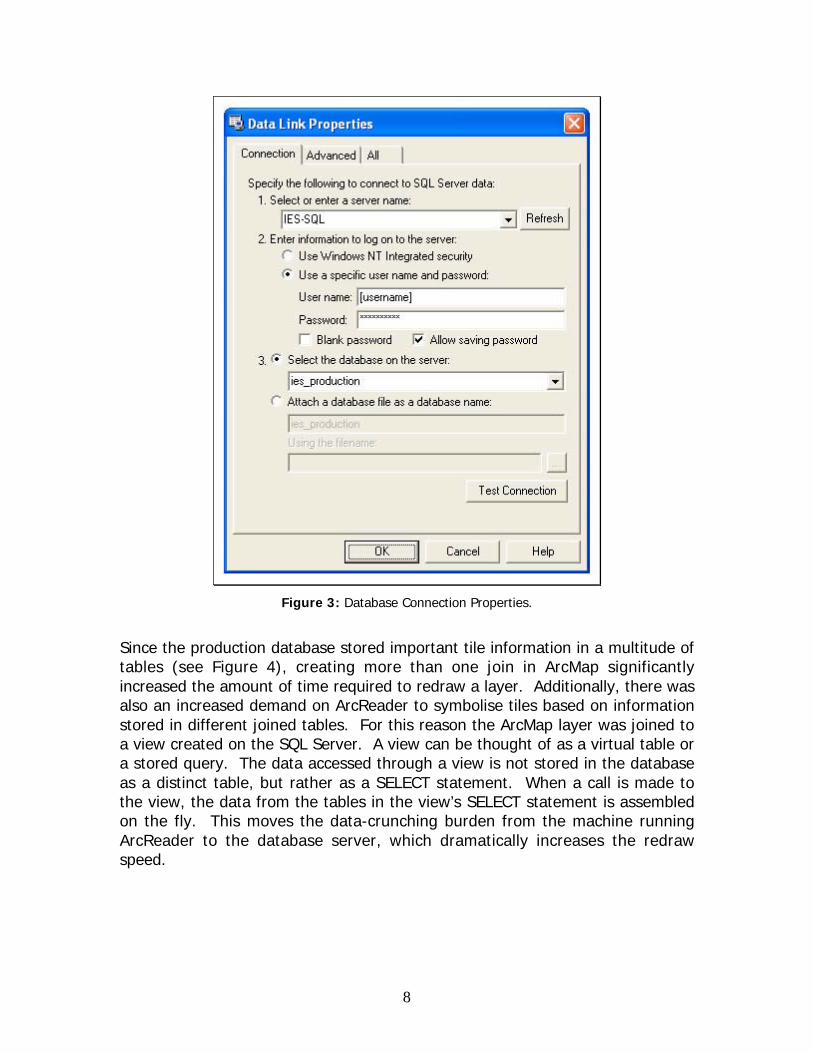
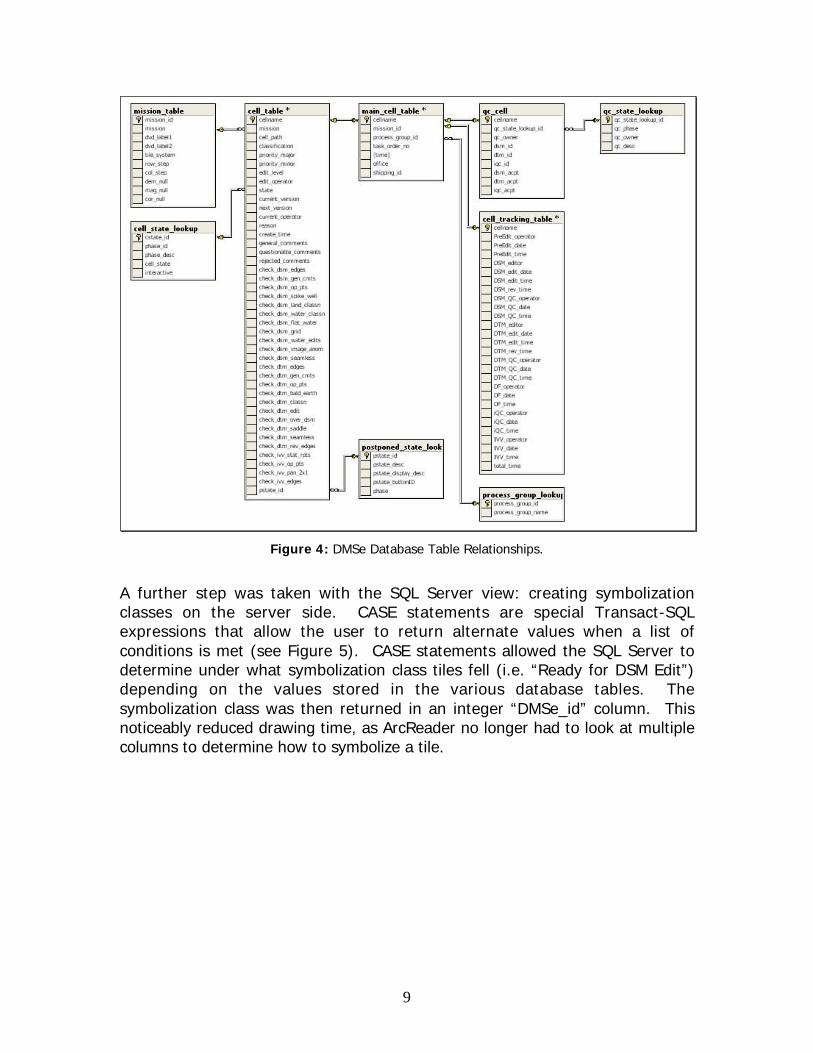
Since the production database stored important tile information in a multitude oftables (see Figure 4), creating more than one join in ArcMap significantly
increased the amount of time required to redraw a layer. Additionally, there wasalso an increased demand on ArcReader to symbolise tiles based on information
stored in different joined tables. For this reason the ArcMap layer was joined toa view created on the SQL Server. A view can be thought of as a virtual table ora stored query. The data accessed through a view is not stored in the database
as a distinct table, but rather as a SELECT statement. When a call is made tothe view, the data from the tables in the view’s SELECT statement is assembledon the fly. This moves the data-crunching burden from the machine running
ArcReader to the database server, which dramatically increases the redrawspeed.
9
Figure 4: DMSe Database Table Relationships.
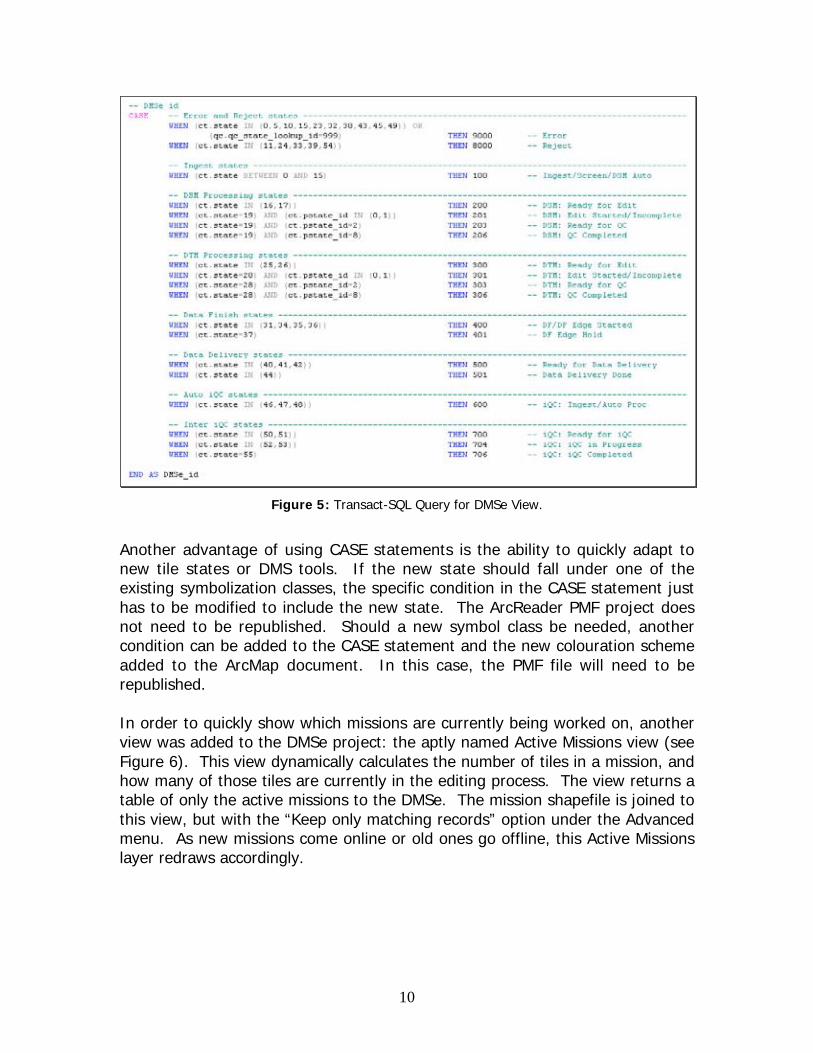
A further step was taken with the SQL Server view: creating symbolizationclasses on the server side. CASE statements are special Transact-SQLexpressions that allow the user to return alternate values when a list of
conditions is met (see Figure 5). CASE statements allowed the SQL Server todetermine under what symbolization class tiles fell (i.e. “Ready for DSM Edit”)depending on the values stored in the various database tables. The
symbolization class was then returned in an integer “DMSe_id” column. Thisnoticeably reduced drawing time, as ArcReader no longer had to look at multiplecolumns to determine how to symbolize a tile.
10
Figure 5: Transact-SQL Query for DMSe View.
Another advantage of using CASE statements is the ability to quickly adapt tonew tile states or DMS tools. If the new state should fall under one of theexisting symbolization classes, the specific condition in the CASE statement just
has to be modified to include the new state. The ArcReader PMF project doesnot need to be republished. Should a new symbol class be needed, anothercondition can be added to the CASE statement and the new colouration scheme
added to the ArcMap document. In this case, the PMF file will need to berepublished.
In order to quickly show which missions are currently being worked on, anotherview was added to the DMSe project: the aptly named Active Missions view (see
Figure 6). This view dynamically calculates the number of tiles in a mission, andhow many of those tiles are currently in the editing process. The view returns atable of only the active missions to the DMSe. The mission shapefile is joined to
this view, but with the “Keep only matching records” option under the Advancedmenu. As new missions come online or old ones go offline, this Active Missionslayer redraws accordingly.

11
Figure 6: Active Mission Layer in the DMSe.
Multi-Site Functionality
Given the nature of business today, often times companies will be faced with thetask of managing and controlling production at a multitude of different
production centres. Intermap is no different from other companies in thisrespect, as they are currently faced with maintaining three production centres.The IES editing software, being controlled by a database, and given that a
disconnection of one production centre from a localized database could be costly,has gone the route of giving each production centre their own database to work
from. As such, managing production over three databases poses its ownlimitations. The DMSe had to connect to these three databases, of which onelies on a separate network. As such, three separate versions of the DMSe were
created, with each office receiving its own copy. For users with VPN accessbetween the two networks, a full version was published, allowing all productioncentre layers to be displayed simultaneously.
Comprehensive Symbolization
One of the major goals of the DMSe was to facilitate understanding the locationof editing for all users. Since the roles of the DMSe users are pretty varied, thisposed a challenge. Upper level managers do not need to see as much detail
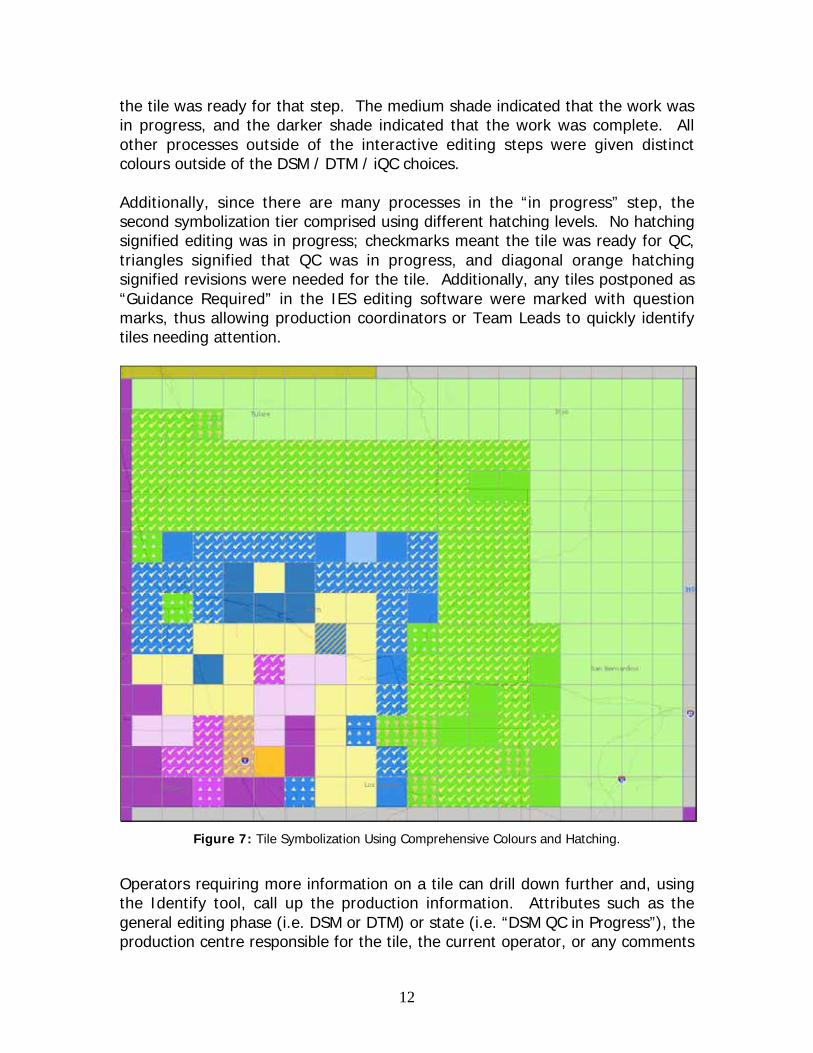
about the interactive editing as, for example, an editor. For this reason a 2-tiered approach to symbolization was embraced. The first tier was the basecolour of the tile. The three major steps in the editing process that some users
would want to drill down in more detail (DSM edit, DTM edit, and theIndependent QC, or iQC, step) were given each their own colour: DSM = green,DTM = blue, and iQC = purple. The lighter shades of each colour signified that
12
the tile was ready for that step. The medium shade indicated that the work wasin progress, and the darker shade indicated that the work was complete. All
other processes outside of the interactive editing steps were given distinctcolours outside of the DSM / DTM / iQC choices.
Additionally, since there are many processes in the “in progress” step, thesecond symbolization tier comprised using different hatching levels. No hatchingsignified editing was in progress; checkmarks meant the tile was ready for QC,
triangles signified that QC was in progress, and diagonal orange hatchingsignified revisions were needed for the tile. Additionally, any tiles postponed as
“Guidance Required” in the IES editing software were marked with questionmarks, thus allowing production coordinators or Team Leads to quickly identifytiles needing attention.
Figure 7: Tile Symbolization Using Comprehensive Colours and Hatching.
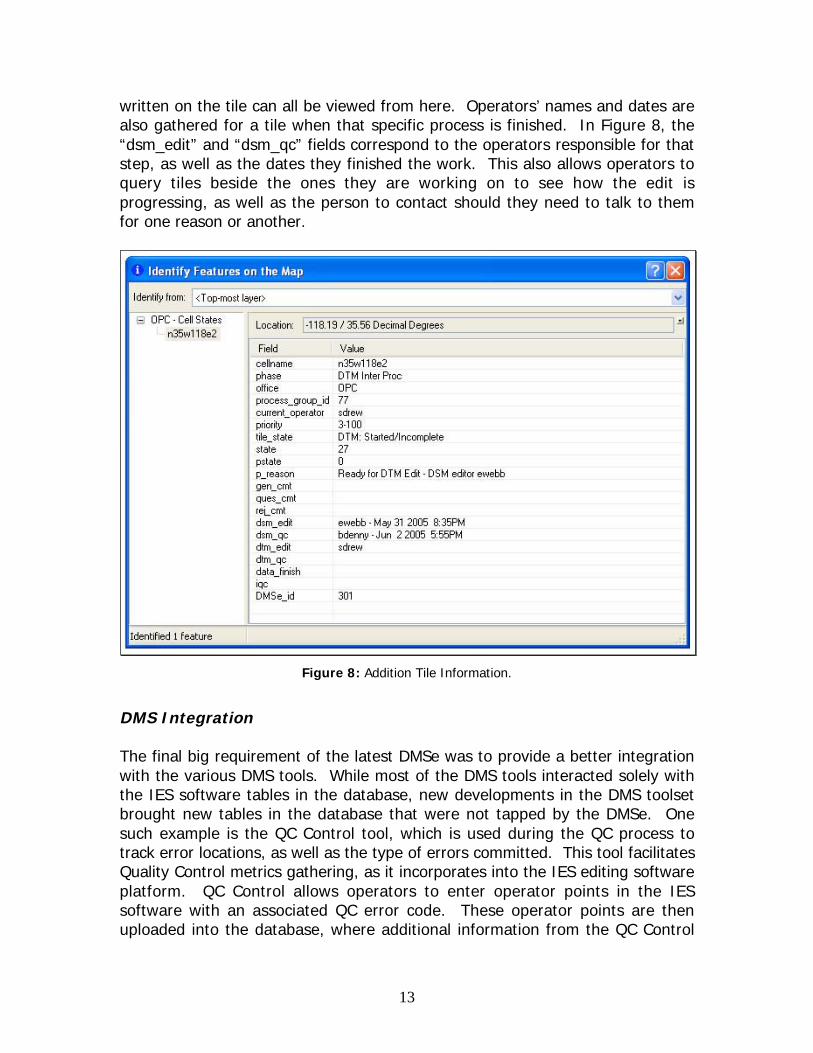
Operators requiring more information on a tile can drill down further and, usingthe Identify tool, call up the production information. Attributes such as the
general editing phase (i.e. DSM or DTM) or state (i.e. “DSM QC in Progress”), theproduction centre responsible for the tile, the current operator, or any comments
13
written on the tile can all be viewed from here. Operators’ names and dates arealso gathered for a tile when that specific process is finished. In Figure 8, the
“dsm_edit” and “dsm_qc” fields correspond to the operators responsible for thatstep, as well as the dates they finished the work. This also allows operators toquery tiles beside the ones they are working on to see how the edit is
progressing, as well as the person to contact should they need to talk to themfor one reason or another.
Figure 8: Addition Tile Information.
DMS Integration
The final big requirement of the latest DMSe was to provide a better integration
with the various DMS tools. While most of the DMS tools interacted solely withthe IES software tables in the database, new developments in the DMS toolsetbrought new tables in the database that were not tapped by the DMSe. One
such example is the QC Control tool, which is used during the QC process totrack error locations, as well as the type of errors committed. This tool facilitatesQuality Control metrics gathering, as it incorporates into the IES editing software
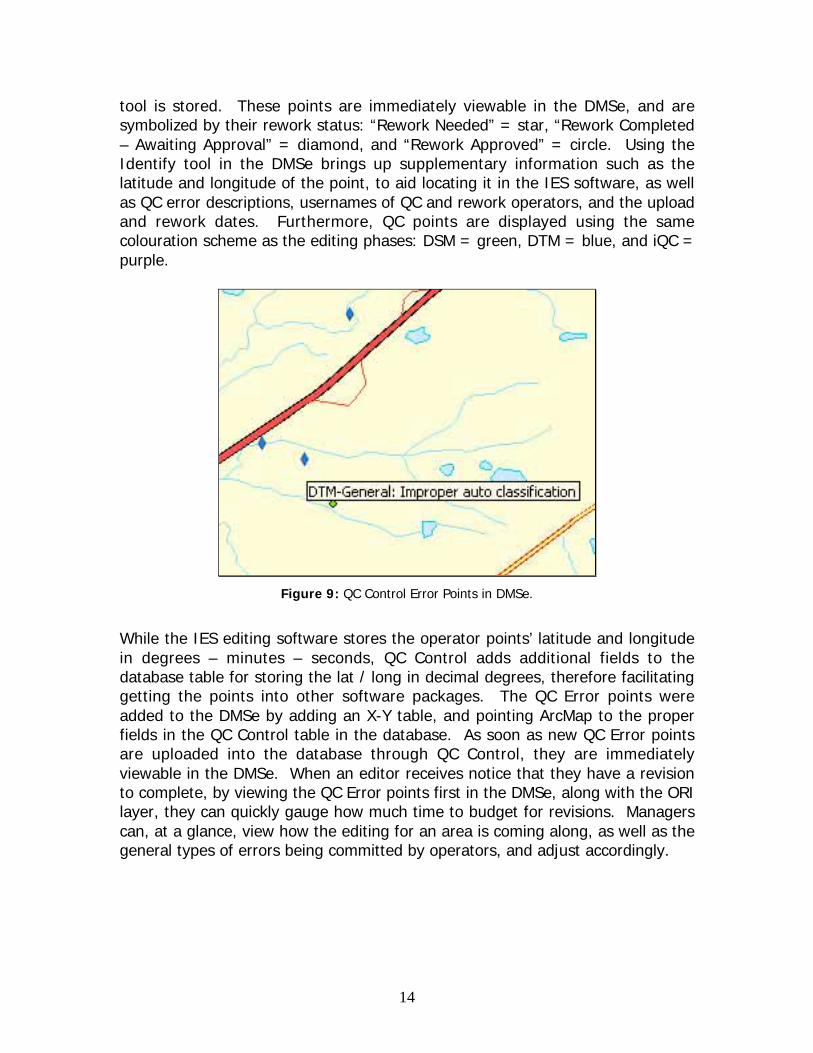
platform. QC Control allows operators to enter operator points in the IESsoftware with an associated QC error code. These operator points are thenuploaded into the database, where additional information from the QC Control
14
tool is stored. These points are immediately viewable in the DMSe, and aresymbolized by their rework status: “Rework Needed” = star, “Rework Completed
– Awaiting Approval” = diamond, and “Rework Approved” = circle. Using theIdentify tool in the DMSe brings up supplementary information such as thelatitude and longitude of the point, to aid locating it in the IES software, as well
as QC error descriptions, usernames of QC and rework operators, and the uploadand rework dates. Furthermore, QC points are displayed using the samecolouration scheme as the editing phases: DSM = green, DTM = blue, and iQC =
purple.
Figure 9: QC Control Error Points in DMSe.
While the IES editing software stores the operator points’ latitude and longitude
in degrees – minutes – seconds, QC Control adds additional fields to thedatabase table for storing the lat / long in decimal degrees, therefore facilitatinggetting the points into other software packages. The QC Error points were
added to the DMSe by adding an X-Y table, and pointing ArcMap to the properfields in the QC Control table in the database. As soon as new QC Error pointsare uploaded into the database through QC Control, they are immediately
viewable in the DMSe. When an editor receives notice that they have a revisionto complete, by viewing the QC Error points first in the DMSe, along with the ORIlayer, they can quickly gauge how much time to budget for revisions. Managers
can, at a glance, view how the editing for an area is coming along, as well as thegeneral types of errors being committed by operators, and adjust accordingly.

15
Conclusion
Lessons Learned
As previously stated, with the release of ArcGIS 9.0, improved database
connection parameters greatly improved the DMSe functionality by allowing alive connection to the database, rather than the 5-minute delay of the previous
version. Moving the data-crunching strain to the database further improved theperformance of the DMSe, as it was no longer necessary for ArcReader to dealwith determining symbolization from multiple fields. The use of dynamic views
also facilitates adjusting to new states or procedures in the IES editing software.Using a comprehensive symbolization plan also makes it easier for a multitude ofuser-access levels to effortlessly, at a glance, determine the level of information
they need.
Limitations
The IES editing software is a memory intensive program, for just reasons.ArcReader itself is another burden on the system. Certain workstations that
don’t perform as well as others, for one reason or another, will occasionally workbetter if ArcReader is not used by the operator. Whether a problem resides inthe installation of ArcReader or the computer itself, in either case the operator of
that computer is presented with an issue that hinders his or her performance.For these reasons, the development of an ArcIMS solution for trackingproduction flow would take the processing burden off the editing workstations
and put it in the hands of a dedicated web-server. Should time and budgetsallow, Intermap might very well embrace a web-based version of the DMSe.
The default legend size as well caused some issues with properly displaying thesymbolization pattern chosen for this project. Due to the small size of the legend
boxes, certain hatching patterns were not visible. Since the DMSe uses the samebase colouration for tiles that are considered “in progress”, this made it difficultat first to understand what each hatching pattern referred to. Over time, this
problem has diminished, as users become more familiar with the patterns.Perhaps a future modified version of the DMSe will contain a better reference forusers.
Advantages
Certainly, the incorporation of many different levels of information into one all-inclusive package has greatly facilitated the task of managing production. Alllevels of users, from VPs to editors can open the DMSe, and quickly get the
information they need about an area. The integration of DMS tool data into theDMSe has also led to a more thorough understanding of the production flow.
16
Whereas in the past certain steps in the process may not have been visiblethrough the DMSe, the new version completely amalgamates all DMS – tile
specific information into its symbolization.
The ability for managers and coordinators to view information from different
production centres facilitates the ability to easily and quickly track what’shappening in production, and to adjust accordingly. Whereas in the past it wascommonplace for discussions of production progress to occur over email, now
with the click of a button information can be viewed by any party with lesschance for confusion.
Intermap has embraced the challenge of providing first-class, countrywidedatasets to its clients in a timely manner. Modifications were made to the editing
software to better handle the dramatically increased data flow throughproduction. Whenever the flow of data through a production centre increases, itbecomes all the more important that management and coordinators have an
easy way to better control that data flow. The DMSe has fulfilled thoserequirements completely, by providing a leading edge tool for the leading edgeNEXTMap production environment.

17
Author Information
Richard Asselin
Geospatial Database Applications DeveloperIntermap Technologies Corp.2 Gurdwara Rd, Suite 200
Ottawa, ON K2E 1A2Phone: (613) 226-5442Fax: (613) 226-5529
Email: [email protected]