Embed Size (px)
Citation preview

Aerospace Structural Materials Handbook Supplement GRCop-84
Dr. David L. Ellis Case Western Reserve University
10900 Euclid Avenue Cleveland, OH 44106-7204
2 1 6-433-8736 [email protected]
This report is a preprint of an article submitted to a journal for publication. Because of changes that may be made before formal publication, this preprint is made available with the understanding that it will not be cited or reproduced without the permission of the author.
https://ntrs.nasa.gov/search.jsp?R=20020070630 2018-07-09T05:57:02+00:00Z

1 General GRCop-84 is a high strength-high conductivity copper-based alloy developed at NASA Glenn
Research Center for combustion chamber liners of regeneratively cooled rocket engines. It also has promise for other high heat flux applications operating at temperatures up to 700C (1 292F) and potentially higher.
The alloy must be made by powder metallurgy techniques such as gas atomization. Slower cooling rates such as those experienced during casting do not develop a proper microstructure. Once made into powder, the alloy exhibits excellent processability using conventional consolidation and forming techniques, e.g., extrusion and rolling.
GRCop-84 is strengthened by a combination of dispersion and precipitation strengthening by fine (50-500 nanometer (2-20 microinch)) CrzNb particles and Hall-Petch strengthening from a fine copper grain size (Ref. 1) . The presence of a high volume fraction of particles prevents grain boundary sliding at high temperatures and contributes to the alloy's overall good high temperature mechanical properties.
Maximum thermal conductivity is obtained by using two alloying elements (Cr, Nb) with limited solubility in solid Cu that form a high temperature intermetallic compound with an even lower solid solubility (Ref. 2). The resulting mamx of the alloy is nearly pure copper. The limited solubility also minimizes CrzNb particle coarsening at elevated temperatures and enhances microstructural and mechanical property stability. Further enhancement of the microstructural stability is obtained by using a high volume fraction (-14 vol.%) of CrzNb particles that effectively pin grain growth.
I . I Commercial Designation GRCop-84
7.2 Alternate Designations Cu-8 Cr-4 Nb
1.3 Specifications
1.4 Composition There are no formal compositional specifications. However, five heats of GRCop-84 produced by
Crucible Research were used to generate a database of thermophysical and mechanical properties. These powder lots were designated Powder Lots 3A-3E. The range of their chemistries was used to set the compositions for future heats. The compositional ranges for GRCop-84 are presented in Table 1.3.1. The mechanical and most thermophysical properties presented are based on material with 150-250 ppm by weight Fe. Subsequent work has identified Fe as detrimental to thermal conductivity, and a of 120 ppm by weight has been placed on future heats.
In addition to the normal chemical composition ranges, the ratio of Cr to Nb is specified to ensure the CrzNb particles are Cr rich. Failure to meet the specified ratios will result in that will form niobium hydrides when exposed to high pressure hydrogen (Ref. 3).
In addition, prior work (Ref. 4) was done with powder produced by Special Metals Corp. The powder was tested in only the as-extruded condition. For the creep data, the results were includedfor the as-extruded GRCop-84 lives to extend the range of lives and provide better quantitative results for the lives as a function of stress. The chemical composition of Powder Lot SM-2 (Table 1.3.2) was slightly different in that the Cr:Nb ratio was specified to be lower. It also contained a higher level of trace impurities.
1.3.1 [Table] Chemical composition of GRCop-84 I .3.2 [Table] Chemical composition of Powder Lot SM-2
1.5 Heat Treatment Solution Heat Treat and Age. GRCop-84 undergoes the majority of its CrzNb precipitation while
the copper is still liquid (Ref. 5). As such, it is more of a dispersion strengthened alloy than a precipitation
strengthened alloy. However, careful TEM analysis revealed subsequent CrzNb precipitation during cooling of the powder and following high temperature processing, i.e., extrusion (Ref 6). These are uncontrolled processes and no successful heat treatment has been developed to improve strength.
Annealing. The suggested full anneal for GRCop-84 is 400C (752F) for one hour. An inert atmosphere, reducing atmosphere or vacuum suitable for copper-based alloys is acceptable for GRCop-84.
1.6 Hardness The average hardness of fully annealed GRCop-84 is Rockwell B 72.8. The hardness can be
increased to Rockwell B 84.5 by cold working.
I. 7 Forms and Conditions Available GRCop-84 is a powder metallurgy (P/M) alloy. It has been successfully extruded into round and
rectangular bars. These bars have been further processed to plate and sheet by warm rolling. GRCop-84 has also been hot isostatic pressed (HIPed) and vacuum plasma sprayed (VPSed) into near-net shapes.
1.8 Melting and Casting Practice Melting. The alloy must be produced in an inert or reducing gas environment @referred) or under
vacuum to prevent oxygen contamination. Alumina-based refractories cannot be used for the melting due to interaction with the molten alloy (Ref. 7). Yttria, zirconia and other oxide refractories with high chemical stability are suitable for melting. A melt temperature of at least 1750C (31 82F) is required to dissolve all alloying additions into the molten copper.
Chill Block Melt S~inning. The alloy was first successfully produced using Chill Block Melt Spinning (Ref. 8). This method produces a finer microstructure and should provide improvements in mechanical properties. This production method has not been developed on a commercial basis.
Powder Atomization. Standard powder atomization processing has been successfully used to produce GRCop-84. The tundish and nozzle need to be made from high stability oxide rehctories or other compatible materials. Supersonic atomization to produce finer powders does increase the mechanical properties slightly but also increases oxygen content, which lowers thermal conductivity.
Extrusion. Extrusion is the best documented method for consolidation of GRCop-84. Extrusion can be done in the temperature range of 830-885C (1525-1625F) with 857C (1575F) being the preferred temperature. A minimum reduction ratio of 6:1 by area is required to achieve full consolidation for a round-to-round extrusion. Extrusion ratios greater than 8: 1 by area are recommended.
Vacuum ~ lasma svrav (VPS). VPS has been used to successfully produce combustion chamber liners and is suitable for other parts as well (Ref. 9, 10). VPS parameters used for other copper-based alloys are suitable for initial depositions with normal fine-tuning for specific VPS units required. An argon-4% or greater hydrogen carrier gas or equivalent is required to prevent oxidation during VPS. VPS densities are typically greater than 97%. A HIP cycle of 208 MPa (30 ksi) for 1 hr at 954C (1 750F) can be used to achieve full density.
Hot Isostatic Pressing (H1Pin~). HIPing has been used to successfully consolidate GRCop-84, but requires further refinement to maximize mechanical properties. GRCop-84 has been successhlly consolidated at 954-1010C (1750-1850F) using a pressure of 207 MPa (30 ksi). The HIPing times were 1- 4 hr. Data on HIPed GRCop-84 reported here is based on billets produced by HIPing at 954C (1 750F) for I hr using a pressure of 207 MPa (30 ksi).
I . 9 Special Considerations The alloy is not suitable for casting due to the formation of very large, stable Cr2Nb particles
during slow cooling that cannot be refined. The alloy exhibits negligible ability to undergo a solution heat treatment and precipitation aging
thermal cycle due to extremely limited solubility of Cr and Nb in solid Cu. Minimization of impurities such as 0 and Fe are critical to maintaining the high thermal
conductivity of the alloy. A Cr:Nb ratio greater than 1.15 by weight (Cr:Nb atomic ratio greater than 2.05: 1) is required to
prevent potential hydrogen embrittlement (Ref.3).

2 Physical Properties and Environmental Effects
2. I Thermal Properties
2.1 .I Melting Range GRCop-84 has a solidus of 1080k10C (1976118F). The liquidus is ill defined, but is in the range
of 1735-1800C (3155-3272F). Full melting of GRCop-84 is readily evident by visual inspection since the Cr2Nb particles can be readily observed floating on the surface of the melt and dissolve into the molten copper when the liquidus temperature is achieved.
2.1.2 Phase Changes GRCop-84 undergoes no phase changes below the solidus temperature.
2.1.2.1 Time-temperature-transformation diagrams
2.1.3 Thermal Conductivity The thermal conductivity of GRCop-84 was measured using a combination of the Kohlrausch and
laser flash techniques (Ref 11). The lower confidence interval for the thermal conductivity of GRCop-84 over the temperature range of -193-900C (-3 15-1652F) is given by the equation
A(T),,,, ,,, = 6893 - 3466 ln(T) + 599.5 [ln(~)]' - 34.18 [ln(T)F - r(1- a,8) x 6.633
where T is in Kelvin, t(1-a, 8) is the value for the t-distribution with 8 degrees of freedom associated with 1-a cumulative probability, and L(T) is the thermal conductivity in WlmK. The model and the lower 95% confidence interval are shown in Figure 2.1.3.1. Other confidence intervals can be calculated by adjusting a.
The equation for thermal conductivity is based on five GRCop-84 powder lots that had a high Fe content (150-250 ppm). As seen in Figure 2.1.3.2, lowering the Fe content to 120 ppm had a significant effect on the thermal conductivity of GRCop-84, especially in the range of 25-350C (77-662F). The low Fe material is more representative of anticipated future GRCop-84 thermal conductivities results.
2.1.3.1 [Figure] High Fe GRCop-84 Thermal Conductivity 2.1.3.2 [Figure] Low Fe GRCop-84 Thermal Conductivity
2.1.4 Thermal Expansion Thermal expansion of GRCop-84 was measured from -203C (-333F) to 900C (1 652F) using push
rod dilatometers (Ref 1 1). The thermal expansion over this temperature range is given by the equation
where T is in Kelvin, t(1-a12, 10) is the value for the t-distribution with 10 degrees of freedom associated with 1-0(/2 cumulative probability, and cr(T) is the thermal expansion in percent. The regression model and a two-sided 95% confidence interval are presented in Figure 2.1.4.1. The equation assumes a two-sided confidence interval but can be easily modified to a one-sided confidence interval. Different confidence intervals can be calculated by adjusting a.
2.1.4.1 [Figure] Thermal Expansion of GRCop-84
2.1.5 Specific Heat The specific heat of GRCop-84 was determined using a differential scanning calorimeter (DSC)
(Ref 12). The lower confidence interval for the specific heat of GRCop-84 over the temperature range of - 100-900C (-148- 1652F) is given by the equation

where T is in Kelvin, t(1-4 8) is the value for the t-distribution with 8 degrees of freedom associated with I-a cumulative probability, and cp(T) is the heat capacity in J/gK. Adjusting the value of t(1-a, 8) allows calculation of various confidence limits. The second half of the expression also can be modified to calculate both one and two sided confidence intervals. Both the regression model and the lower 95% confidence interval are shown in Figure 2.1.5.1.
2.1.5.1 [Figure] Specific Heat
2.1.6 Thermal Diffusivity The thermal diffisivity of GRCop-84 was measured using the laser flash technique (Ref 12). The
lower confidence interval for the thermal difisivity of GRCop-84 over the temperature range of 25-900C (77-1 652F) is given by the equation
a ,,,,,,,,, (T) = 0 . 8 7 2 6 - 1 . 9 1 0 ~ l O ~ ~ + 4 . 1 5 3 ~ 1 0 ~ ~ ~ ~ - 3 . 5 8 8 ~ 1 0 - ' ~ ~ ~
- t(l -a,l1),/(2.392 x + (6.654 x lo-' + 2.660x10-~T)*
where T is in Kelvin, t(1-a, 11) is the value for the t-distribution with 8 degrees of freedom associated with I -a cumulative probability, and a(T) is the thermal difisivity in cm2/sec. The regression model and the lower 95% confidence intervaI are shown in Figure 2.1.6.1.
2.1.6.1 [Figure] Thermal Diffisivity
2.2 Other Physical Properties
2.2.1 Density The room temperature density of GRCop-84 with a 95% confidence interval is 8.62k0.08 g/cm3
(0.3 1 1 k0.003 lbiin3).
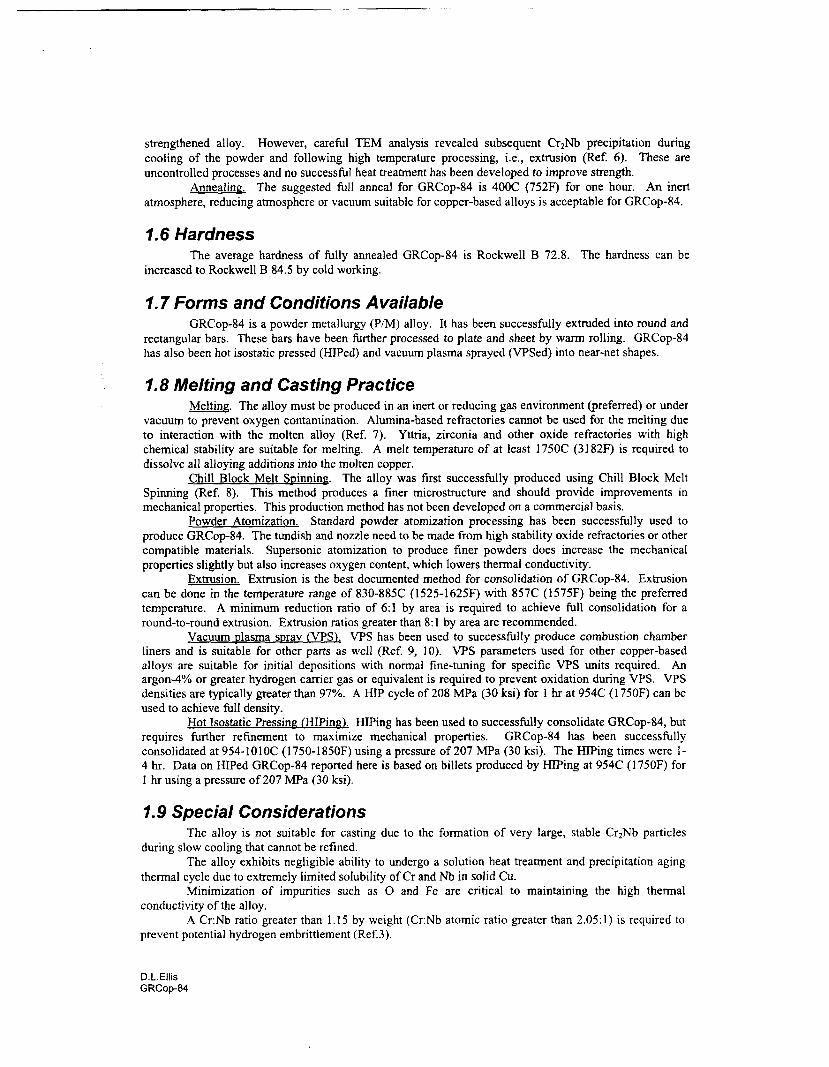
2.2.2 Electrical Properties During the Kohlrausch thermal conductivity testing, the electrical resistivity of GRCop-84 was
measured over the temperature range of -193-200C (-315-392F) (Ref 12). These results are presented in Figure 2.2.2.1. In addition, a single sample has been tested to -243C (-405F), and its results are shown in Figure 2.2.2.2. The lower temperature data match well with the more extensive data at higher temperatures. The electrical resistivity of GRCop-84 over the temperature range of -193-200C (-3 15- 392F) is given by the equation
p(T)= 0 . 2 8 6 5 - 2 . 8 8 6 x 1 0 " T + 1 . 0 2 1 x l 0 ~ ~ ~ - 2 . 8 5 9 x 1 0 ~ ~ ~ ~ where T is in Kelvin and p(T) is in whm-cm. No estimation of a confidence interval was made because the variability of the data was less than the estimated experimental error. As a guideline, a variation of 0.5 percent would overestimate a one-sided 95 percent confidence interval.
2.2.2.1 [Figure] GRCop-84 Electrical Resistivity 2.2.2.2 [Figure] GRCop-84 Cryogenic Electrical Resistivity

2.2.3 Magnetic Properties
3 Mechanical Properties
3. I Specified Mechanical Properties
3.2 Mechanical Properties at Room Temperature
3.2.1 Tension Stress-strain diagrams and Tensile Properties
3.2.2 Compression Stress-strain diagrams and Tensile Properties
3.2.3 Impact
3.2.4 Bending
3.2.5 Torsion and Shear
3.2.6 Bearing
3.2.7 Stress Concentration
3.2.7.1 Notch Properties
3.2.7.2 Fracture Toughness
3.2.8 Combined Loading
3.3 Mechanical Properties at Various Temperatures
3.3.1 Tension Stress-Strain Diagram and Tensile Properties All tensile testing was conducted using strain rate control and a strain rate of 0.005 mmlmmlmin
(0.005 inlinlmin). An extensometer was used to measure strain up to 15 percent. At 15 percent the extensometer was removed, and the balance of the test was conducted using crosshead displacement to control the strain rate.
GRCop-84 exhibits behavior typical of most copper alloys. As shown in Figure 3.3.1.1, plastic strain occurs very soon after application of a stress, and the early portion of the curve is more typically an arc rather than straight line. After the yield stress is achieved, the alloy exhibits an extended period of plastic deformation. Even after the ultimate tensile strength is achieved and the samples begin necking, GRCop-84 exhibits considerable elongation prior to failure.
3.3.1.1 [Figure] Typical GRCop-84 stress-strain curves
As-processed condition Yield strength. The lower confidence interval for the 0.2% offset yield strength of GRCop-84 is
given by the equations

Extruded
HIPed :
where T is in Kelvin, t(1-a, v) is the value for the t-distribution with v degrees of freedom associated with 1-a cumulative probability, and ao.zohorrset(T) is in MPa. Adjusting the value of t(1-a, v) allows calculation of differing confidence limits and both one and two sided confidence intervals. The regression models and lower 95% confidence intervals are shown in Figures 3.3.1.2-3.
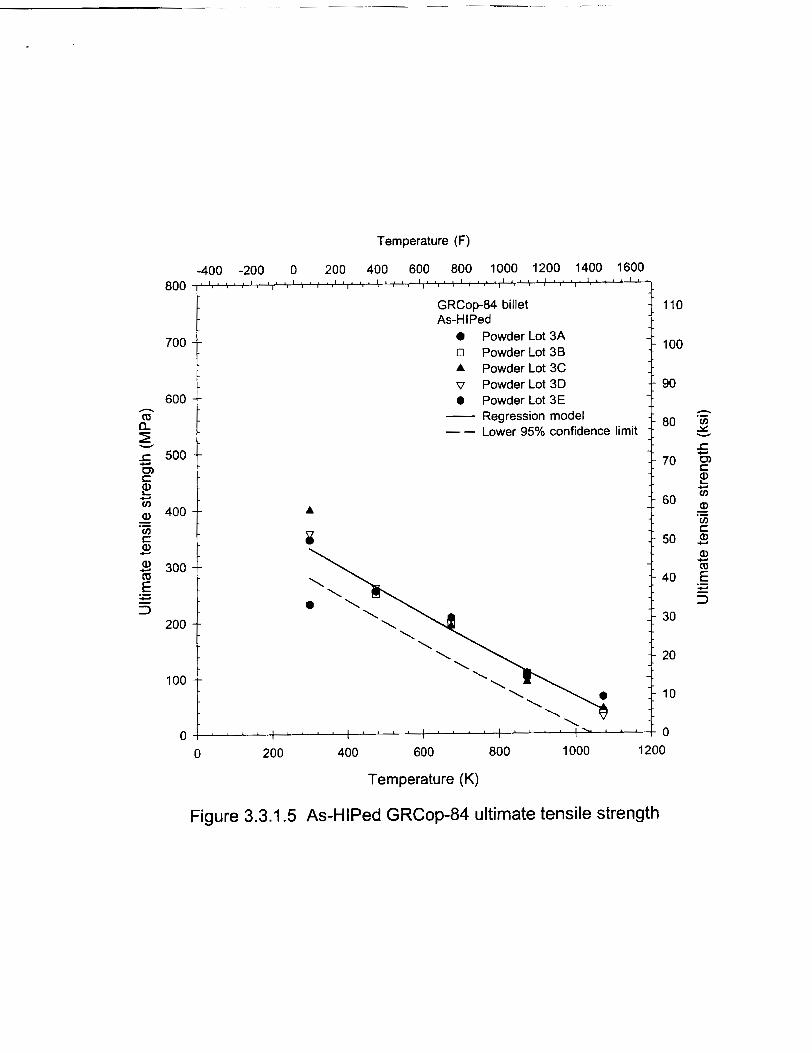
3.3.1.2 [Figure] 0.2% offset yield strength of as-extruded GRCop-84 3.3.1.3 [Figure] 0.2% offset yield strength of as-HIPed GRCop-84 Ultimate tensile strength. The lower confidence interval for the ultimate tensile strength of
GRCop-84 is given by the equations Extruded :
HIPed :
where T is in Kelvin, t(1-a, v) is the value for the t-distribution with v degrees of freedom associated with 1-a cumulative probability, and ouTs(T) is in MPa. The regression models and lower 95% confidence intervals are shown in Figures 3.3.1.4-5.
3.3.1.4 [Figure] Ultimate tensile strength of as-extruded GRCop-84 3.3.1.5 [Figure] Ultimate tensile strength of as-HIPed GRCop-84 Elongation. The lower confidence interval of the elongation of GRCop-84 is given by the
equations Extruded :
&(T) = 17.16+0.034 T-8.1 1 4 ~ 1 0 - ~ T2 +4.907xl0" T' - f(1-a,31)x2.52
HIPed :
&(T) = -17.94+0.209 T -3.28x10⁴ T2 + 1 . 4 3 ~ 1 0 - ~ T3 - f(1-a,19)x4.55
where T is in Kelvin, t(1-a, v) is the value for the t-distribution with v degrees of freedom associated with 1-a cumulative probability, and E(T) is in percent. The regression models and the lower 95% confidence intervals are shown in Figures 3.3.1.6-7.
3.3.1.6 [Figure] Elongation of as-extruded GRCop-84 3.3.1.7 [Figure] Elongation of as-HIPed GRCop-84 Reduction in area. The lower confidence interval for the reduction in area of GRCop-84 is given
by the equations Extruded :
RA(T) = 5.73+0.239 T - 4 . 1 8 3 ~ 1 0 ~ T2 + 1 . 9 5 6 ~ 1 0 ' ~ T3 - t(l -a,31)x12.32
HIPed :
RA(T) =-96.92+0.763 T-1.23~10" T2+5.88x10-' T3 - f(1-a,19)x11.65
where T is in Kelvin, t(1-a, v) is the value for the t-distribution with v degrees of freedom associated with 1-a cumulative probability, and RA(T) is in percent. The regression models and the lower 95% confidence intervals are shown in Figures 3.3.1.8-9.
3.3.1.8 [Figure] Elongation of as-extruded GRCop-84 3.3.1.9 [Figure] Elongation of as-HIPed GRCop-84
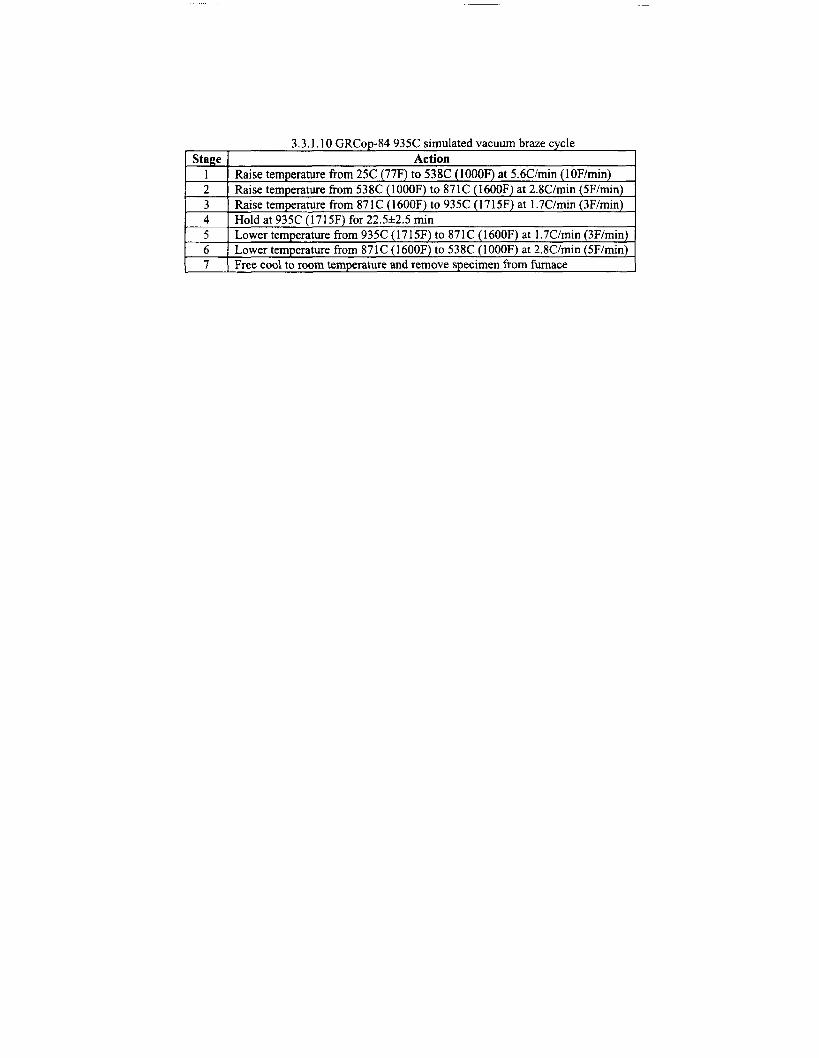
Brazed condition To simulate a typical high temperature brazing cycle, GRCop-84 was subjected to the simulated
vacuum braze cycle detailed in Table 3.3.1.10. This braze cycle represents a typical high temperature braze that may be encountered when joining a GRCop-84 liner to a steel support jacket for a thrust cell. The

braze cycle coarsens the CrzNb particles and lowers the strength of GRCop-84. The effects will be less pronounced for lower temperature braze cycles.
3.3.1.10 [Table] GRCop-84 simulated braze cycle Yield strenpth. The 0.2% offset yield strength of GRCop-84 is given by the equations Extruded :
HIPed :
where T is in Kelvin, t(l-a, v) is the value for the t-distribution with v degrees of freedom associated with I -a cumulative probability, and 00.2% OfM(T) is in MPa. Adjusting the value of t(1 -a, v) allows calculation of differing confidence limits and both one and two sided confidence intervals. The regression models and the lower 95% confidence intervals are shown in Figures 3.3.1.1 1 1-12.
3.3.1.1 1 [Figure] 0.2% offset yield strength of extruded and brazed GRCop-84 3.3.1.12 [Figure] 0.2% offset yield strength of HIPed and brazed GRCop-84 Ultimate tensile streneth. The ultimate tensile strength of GRCop-84 is given by the equations Extruded :
o,(T) =621.8-0.939 T+3.763x10⁴ T2 - ;(I-a,32)x26.12
HIPed :
where T is in Kelvin, t(l -a, v) is the value for the t-distribution with v degrees of freedom associated with I -a cumulative probability, and cUTS(T) is in MPa. Adjusting the value of t(1-a, v) allows calculation of differing confidence limits and both one and two sided confidence intervals. The regression models and the lower 95% confidence intervals are shown in Figures 3.3.1.13-14.
3.3.1.13 [Figure] Ultimate tensile strength of extruded and brazed GRCop-84 3.3.1.14 [Figure] Ultimate tensile strength of HIPed and brazed GRCop-84 Eloneation. The elongation of GRCop-84 is given by the equations Extruded :
E(T) =17.71+0.071 T-1.694x10⁴ T 2 +9.882x10⁴ T 3 -t(l-a,31)x5.839
HIPed :
where T is in Kelvin, t(1-a, v) is the value for the t-distribution with v degrees of freedom associated with 1-a cumulative probability, and E(T) is in percent. Adjusting the value of t(1-a, v) allows calculation of differing confidence limits and both one and two sided confidence intervals. The regression models and the lower 95% confidence intervals are shown in Figures 3.3.1.15-1 6.
3.3.1.1 5 [Figure] Elongation of extruded and brazed GRCop-84 3.3.1.16 [Figure] Elongation of extruded and brazed GRCop-84 Reduction in area. The reduction in area of GRCop-84 is given by the equations Extruded :
HIPed :
where T is in Kelvin, t(l -a, V) is the value for the t-distribution with v degrees of freedom associated with I-a cumulative probability, and RA(T) is in percent. Adjusting the value of t(1-a, v) allows calculation of differing confidence limits and both one and two sided confidence intervals. The regression models and the lower 95% confidence intervals are shown in Figures 3.3.1.17- 18.
3.3.1.17 [Figure] Reduction in area of extruded and brazed GRCop-84 3.3.1.18 [Figure] Reduction in area of HPed and brazed GRCop-84

3.3.2 Compression Stress-strain diagrams and Tensile Properties
3.3.3 Impact
3.3.4 Bending
3.3.5 Torsion and Shear
3.3.6 Bearing
3.3.7 Stress Concentration
3.3.7.1 Notch Properties
3.3.7.2 Fracture Toughness
3.3.8 Combined Loading
3.4 Creep and Creep Rupture Properties Twical Creep Curves. GRCop-84 was vacuum creep tested using constant load test frames. The
creep of GRCop-84 normally consists of a short-lived primary creep stage followed by an extended secondary creep stage. Third stage creep may or may not be observed. Examples of high stress-short life tests are presented in Figures 3.4.1-4. The shape of the curves is essentially identical for lower stress- longer life tests.
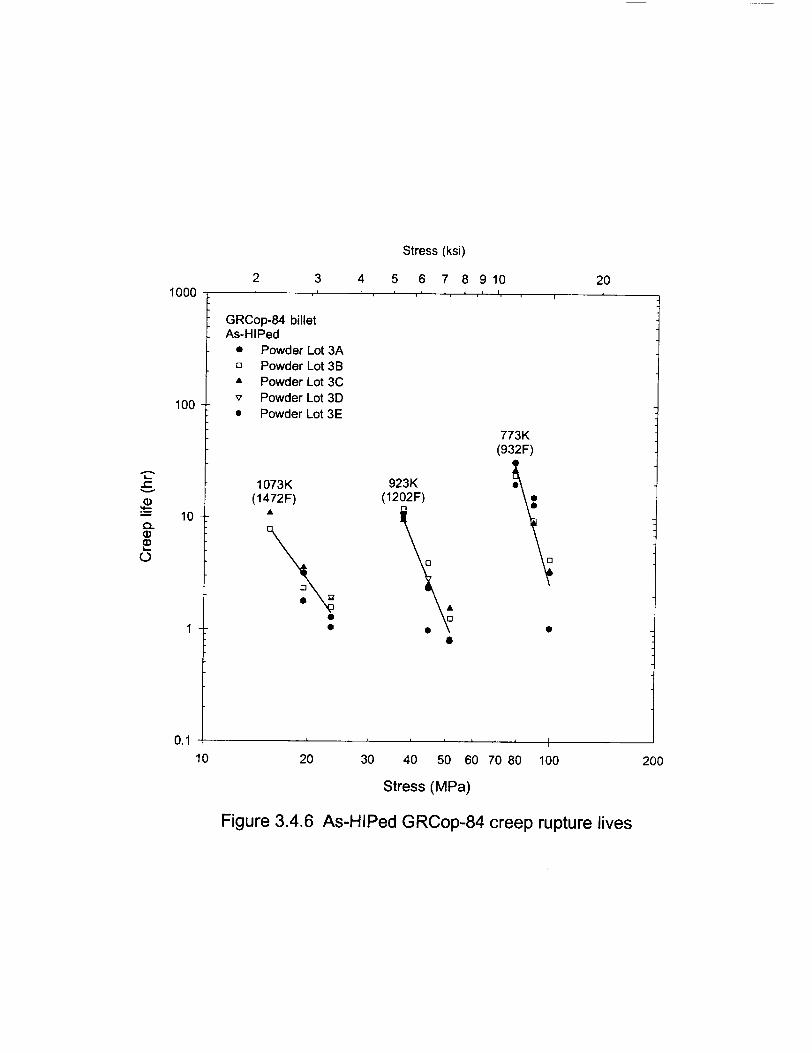
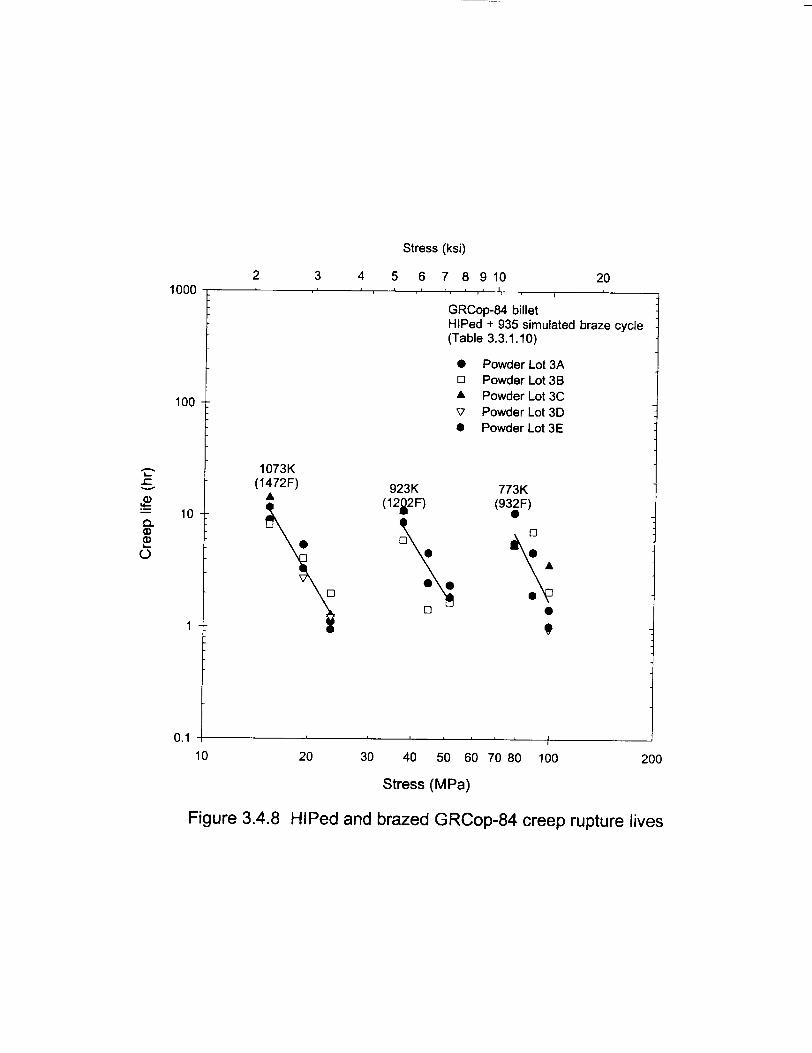
3.4.1 [Figure] Typical as-extruded GRCop-84 creep curves 3.4.2 [Figure] Typical as-HIPed GRCop-84 creep curves 3.4.3 [Figure] Typical extruded and brazed GRCop-84 creep curves 3.4.4 [Figure] Typical HPed and brazed HIPed GRCop-84 creep curves C r e e ~ Ruvture Lives. The creep lives of GRCop-84 have been determined at 500, 650 and 800C
(932, 1202 and 1472F). The majority of the work has concentrated on shorter duration testing with lives less than 50 hours.
During development, specimens from Powder Lot SM-2 were tested at lower stresses (Ref. 3). The data has been included with the as-extruded data from Powder Lots 3A-E to extend the range of creep lives and provide more accurate prediction capability. The results are presented in Figures 3.4.5-8. The creep lives for the four conditions and three temperatures tested are given by the equations
D.L. Ellis GRCOD-84

As - extruded
773 K
923 K 1073 K I t = exp(7.947 - 5.193 ln(o))
As - HIPed
1073 K / t=exp(7.171-5.1621n(o)) where o is stress in MPa and t is life in hours. No confidence intervals are presented because a
full statistical analysis has not been conducted. The equations are also valid only over the stress ranges tested at those particular temperatures.
3.4.5 [Figure] Creep rupture lives of as-extruded GRCop-84 3.4.6 Figure] Creep rupture lives of as-HIPed GRCop-84 3.4.7 [Figure] Creep rupture lives of extruded and brazed GRCop-84 3.4.8 [Figure] Creep rupture lives of HIPed and brazed HIPed GRCop-84
r = exp(1 8.47 - 8.43 1 ln(o))
t = exp(15.21-8.3021n(o))
773 K 923 K
1073 K
Extruded and brazed
3.5 Fatigue Properties
t = exp(2 1.34 - 10.49 ln(o))
t = e ~ ~ ( 1 2 . 6 1 - 7.3901n(o))
t = e ~ ~ ( 5 . 9 4 5 - 4.2241n(o))
773 K 923 K
1073 K
3.5.1 Conventional High-Cycle Fatigue
t = exp(37.34 - 17.891n(o))
t = exp(14.12 -8.1521n(o))
t = exp(9.502-6.8511n(o))
3.5.2 Low-Cycle Fatigue The low cycle fatigue (LCF) lives were measured using fully reversed (R=-I) strain controlled
testing. The strain rate was 0.002 mm/mm/sec (0.002 inlinlsec). To prevent oxidation, an argon atmosphere was used to protect the specimens. Statistical analysis indicated no significant differences between the as-processed and brazed conditions. Temperature exerted a minimal effect on the LCF life of GRCop-84. A statistical difference was noted between the 600C (1 112F) tests and the room temperature and 400C (752F) tests, but the difference was minimal in engineering terms. The major effect was the consolidation method used.
All extruded GRCop-84 data was combined into a single regression model. The lower confidence interval for the LCF life of extruded GRCop-84 between room temperature and 600C (1 112F) is given by the equations
As - Extruded N - 0.108 1~~ - 0 . 8 9 6 ~ 1 . 0 7 ~ ~ 0 ~ ~ 2
f - e x p ( 9 . 3 8 4 ~ 1 0 - ~ ~ - 4 . 0 2 0 ~ 1 0 - ~ ~ ~ +0.26621n(A~)' -*(I -a,45)x0.3107)
Brazed N I = 6.587 1 0-2 &-0 8 9 6 5 - 1 . 0 7 @ 1 0 - ~ ~ exP(l . 0 2 3 ~ lo-' T - 4 . 0 2 0 ~ T I • 0.2662 I ~ ( A E ) ~ - (1 - ~ t , 4 5 ) ~ 0 . 3 107)
where T is in Kelvin, he is the total strain range in mmtmm (idin), t(1-a, V) is the value for the t- distribution with v degrees of freedom associated with I-a cumulative probability, and Nf is life in cycles. The results are shown in Figures 3.5.2.1-4. For clarity, the room temperature and elevated temperature data and curves are presented separately.
HIPed and brazed

All HIPed data were collected into a single regression model once it was determined that processing and temperature did not exert a statistically significant effect. The LCF lives of HPed GRCop- 84 up to 600C (752F) were analyzed in accordance with ASTM E 739 rather than through a full statistical analysis. This gives a slightly different form to the equation, but still allows for the assignment of confidence intervals to the results. The LCF life of HIPed GRCop-84 is given by the equation
N , = exp(- 2.27 I ~ ( A E ) - 2.32 i- 1.4854-,/- 0.954 + 0 . 2 2 0 l n ( ~ ~ ) )
where AE is the stress range in mmlmm (idin), F(l-a,2,25) is the value of the F distribution with 2 degrees of freedom for the numerator and 25 degrees of freedom for the denominator associated with 1 -a probability, and Nf is life in cycles. The results are shown in Figure 3.5.2.5.
3.5.2.1 [Figure] GRCop-84 as-extruded room temperature low cycle fatigue lives 3.5.2.2 [Figure] GRCop-84 as-extruded elevated temperature low cycle fatigue lives 3.5.2.3 [Figure] GRCop-84 extruded and brazed room temperature low cycle fatigue lives 3.5.2.4 [Figure] GRCop-84 extruded and brazed elevated temperature low cycle fatigue lives 3.5.2.5 [Figure] GRCop-84 HIPed low cycle fatigue lives
3.5.3 Fatigue Crack Propagation
3.6 Elas tic Properties
3.6.1 Poisson's Ratio
3.6.2 Modulus of Elasticity
3.6.3 Modulus of Rigidity
3.6.4 Tangent Modulus
3.6.5 Secant Modulus
4 Fabrication
4.1 Forming Cold Rolline. GRCop-84 has been successfully cold rolled to a maximum reduction of 25% in
thickness prior to annealing, but it is suggested that the material be annealed after every 20% reduction in thickness. Reductions in thickness greater than 25% without an annealing step will lead to catastrophic failure of the piece.
Warm Rolling. Tensile properties comparable to as-extruded GRCop-84 are achieved by warm rolling GRCop-84 in the temperature range of 250-350C (482-662F). Single pass reductions of up to 15% are easily achieved. A rolling temperature in excess of 500C (932F) should be avoided since it degrades mechanical properties.
X-ray pole figures indicated that there was no or minimal crystallographic texture developed during the warm rolling process. Any texture observed could be removed by annealing. Specimens have been tested in both the longitudinal and long transverse direction. No significant difference in properties has been observed even when a slight crystallographic texture was present. The effect of warm rolling temperature on mechanical properties is shown in Figures 4.1.1-4. The GRCop-84 sheet had a total reduction of 95% in 15% reduction steps.
4.1.1 [Figure] Effect of warm rolling temperature on room temperature GRCop-84 tensile properties
4.1.2 [Figure] Elevated temperature warm rolled GRCop-84 0.2 percent offset yield strength

4.1.3 [Figure] Elevated temperature warm rolled GRCop-84 ultimate tensile strength 4.1.4 [Figure] Elevated temperature warm rolled GRCop-84 elongation
4.2 Machining and Grinding GRCop-84 machines similarly to other copper-based alloys. Conventional carbide tooling is
suitable for most operations. GRCop-84 can also be wire electrical discharge machined (EDMed).
4.3 Joining
4.4 Surface Treating
References 1. Anderson, K. R., "Effects of Thermal and Mechanical Processing on Microstructures and
Desired Properties of Particle Strengthened Cu-Cr-Nb Alloys", NASA CR-2000-2098 12, NASA GRC, Cleveland, OH (Feb. 2000).
2. Michal, G. M. and Ellis, D. L., "Design Of A Cu-Based Alloy Using CrzNb Precipitates," submitted to Acta Metallurgica et Materialia, .
3. Ellis, D. L.; Misra, A. K.; and Dreshfield, R. L., "Effect of Hydrogen on Cr2Nb and Cu- Cr-Nb Alloys," Effect of Hydrogen on the Behavior of Materials, Proc. of Fifih International Conference, Moran, WY, Sept. 11-14, 1994, eds. A.W. Thompson and N.R. Moody, TMS, Warrendale, PA (Oct. 1996).
4. Ellis, D. L. and Michal, G. M., "Mechanical and Thermal Properties of Two Cu-Cr-Nb Alloys and NARloy-Z," NASA CR-198529, NASA Lewis Research Center, Cleveland, OH (Oct. 1996)
5. Ellis, D. L. and Michal, G . M., "Formation of Cr and Cr2Nb Precipitates in Rapidly
Solidified Cu-Cr-Nb Ribbon," Ultramicroscopy, Vol. 30, Nos. 112, pp. 210-21 6. 6. Anderson, K. R.; Groza, J. R.; Dreshfield, R. L.; and Ellis, D. L., "Microstructural
Evaluation of Precipitation-Strengthened Cu-8 Cr-4 Nb Alloy," Materials Science and Engineering, A169, (1993), pp. 167-1 75.
7. Ellis, D. L.; Michal, G. M.; and Orth, N. W., "Production and Processing of Cu-Cr-Nb Alloys," Scripta MetaIlurgica et Materialia, Vol. 24, pp. 885-890.
8. Ellis, D. L. and Michal, G. M., "Precipitation Strengthened High Strength, High Conductivity Cu-Cr-Nb Alloys Produced by Chill Block Melt Spinning," NASA CR- 185 144, NASA LeRC, Cleveland, OH, (Sept. 1989).
9. Holmes, R.; Ellis, D.; and McKechnie, T., "Robust Low Cost AerospikeIRLV Combustion Chamber By Advanced Vacuum Plasma Process," 36Ih Annual Space Congress, Cocoa Beach, FL, (April 27-29, 1999)
10. Hickman, R.; McKechnie; and Holmes, R., "Materials Properties of Vacuum Plasma Sprayed Cu-8Cr-4Nb for Liquid Rocket Engines", 3Th AIAA/ASMELiAE/ASEE/Joint Propulsion Conference, 8-1 1 July 2001, Salt Lake City, UT, AIAA 2001-3693
11. Ellis, D. L. and Keller, D. J., "Thermophysical Properties of GRCop-84," NASA CR- 2000-2 10055, NASA GRC, Cleveland, OH, (June 2000).
Extended Bibliography 1. Elam, S.; Lee, J., Holmes, R.; and Zimmerman, F., "Lightweight Chambers for Thrust
Assemblies," 5r"' International Astronautical Congress, 1-5 October 2001, Toulouse, France
2 . Thomas-Ogbuji, L. U. and Humphrey, D. L., "Oxidation Behavior of GRCop-84 (Cu- 8Cr-4Nb) at Intermediate and High Temperatures," NASA CR-2000-210369, NASA GRC, (Aug. 2000)

3. Ellis, D. L. and Yun, H. M., "Progress Report On Development Of A Cu-8 Cr-4 Nb Alloy Database For The Reusable Launch Vehicle (RLV)," Copper 1999 (Fourth International Conference), Phoenix, AZ, (Oct. 10- 13, 1999)
4. Anderson, K. R.; Groza, J. R.; Dreshfield, R. L.; and Ellis, D. L., "High Performance Dispersion Strengthened Cu-8 Cr-4 Nb Alloy," Met. Trans A, Vol. 26A, pp. 2197-2206, (Sept. 1995).
5. Ellis, D. L.; Michal, G. M.; and Dreshfield, R. L., "A New Cu-8 Cr-4 Nb Alloy For High Temperature Applications," Materials Technology, Vol. 5, No. 5/6, (May/June 1995).
6 . Ellis, D. L.; Dreshfield, R. L.; Vemlli, M. J.; and Ulmer, D. G., "Mechanical Properties of a Cu-8 Cr-4 Nb Alloy," Earth-to-Orbit Conference, Huntsville, AL (May 1994).
7. Ellis, D. L. and Dreshfield, R. L., "Preliminary Evaluation of a Powder Metal Copper-8 Cr-4 Nb Alloy," Proc, of the Advanced Earth-to-Orbit Conference, NASA MSFC, Huntsville, AL, (May 19-21, 1992).
8. Ellis, D. L. and Michal, G. M., "Identification of Cr and CrZNb Precipitates in As-Melt
Spun Cu-Cr-Nb Ribbon," Proceedings of the 46th Annual Meeting of the Electron Microscopy Society of America, Milwaukee, WI (1988).


Table 1.4.2 Chemical composition of Powder Lot SM-2
1 Alloy ( GRCop-84 1
Niobium I 5.79 Chrom~um:Niobium Ratio 1 1.11
I I Weight Percent Chromium 6.45
Al 160 ppm
Mn Fe 1 460ppm
30 ppm
0 Ti
Copper
Ni 1 230ppm 640 ppm 110 ppm
Bal.

Temperature (F)
Temperature (K)
360
p 340
E
2 & 320 > .- + 0 3 -0 C
8 300 -- - m E Q)
280 -:
260 --
Figure 2.1.3.1 High Fe GRCop-84 thermal conductivity
GRCop-84 bar As-extruded
Powder Lot 3A -- Powder Lot 3B --
A Powder Lot 3C
v o Powder Lot 3D Powder Lot 3E
L
-- 210
-- 200 -- - Regression model -
. . . . . . . Lower 95% Confidence limit --
--
. . ....[3-. . . . . 8;- 150
1

Temperature (K)
Temperature (F)
-400 -200 0 200 400 600 4 800 1 1000 I 1200 I 1400 I 1600 I
Figure 2.1.3.2 Low Fe GRCop-84 thermal conductivity
-
360
340 --
1 ~ ~ ~ 1 ~ ~ ~ ' ~ ~ ~ 1 1 ~ ~ " ~ ' " " " ' " " '
- GRCop-84 bar - As-extruded
0 150-250 ppm Fe GRCop-84 ~ 2 0 ppm Fe GRCop-84
- - 150-250 ppm Fe GRCop-84 regression model -
. . . . . . . 150-250 ppm Fe GRCop-84 upper 95% confidence limit
2 E 320 --
> C .- > z= ? 300
XJ C
8 - E 5 280 e
260
- ~ 2 0 ppm Fe GRCop-84 regression model -
-
--
--
0 0
-- 8-- 0
-- --
- -

Temperature (F)
-400 -200 0 200 400 600 800 1000 1200 1400 1600 1800
Upper 95% confidence limit
Lower 95% confidence limit
0 200 400 600 800 1000 1200
Temperature (K)
Figure 2.1.4.1 GRCop-84 thermal expansion

Temperature (F)
t .nn-RA har GRC,, . --.
As-extruded Powder Lot 3A Powder Lot 38
A Powder Lot 3C v Powder Lot 3D
Powder Lot 3E - Regression model , . . . . . . Lower 95% confidence limit
Temperature (K)
Figure 2.1.5.1 GRCop-84 specific heat
Temperature (F)
Temperature (K)
1.00
0.95
0.90
h cn N- 6 0.85 V
2? .- > .- fn 3 0.80 !E w - m
0.75 -- Q)
E 0.70 --
0.65 --
0.60
Figure 2.1.6.1 GRCop-84 thermal diffusivity
-400 -200 0 200 400 600 800 1000 1200 1400 1600 , l m v I s a g 1 8 B - 1 ; c : a , m c r * l s b i ~ a L i l m a l a ' s ~ : ~ # , s l ' d , c a , 3 ! m , n ~ 1 8 1 , b n 8 a ;
GRCop-84 bar As-extruded
Powder Lot 3A -- Powder Lot 3B -
A Powder Lot 3C v Powder Lot 3E
-- Temp vs 3E -- - Regression model . . . . . . . Lower 95% confidence interval
'- 0.15
0.14
--
--
. -- I l . l l l , , , , l , , , , l , , , , l , , , , - I I I I I

Temperature (F)
Temperature (K)
Figure 2.2.2.1 GRCop-84 electrical resistivity
_
- 1.6
1.4
1.2 .;- .- E c 0 3.
--1.0 ; ?z > .- C V) .- Lo
-- 0.8 2 - m 0 .- L C
0
-- 0.6 ;
-- 0.4
- 0.2
0.0
-400 -300 -200 -100 0 100 200 300 400
0 100 200 300 400 500
4 --
h
E Y 3 - - E c 0 5 V
>r .+, .- > .- 4 V) .- V)
2 2 - - - (P 0 .- L c. 0 Q)
ii
1
0
I t I I I I I ~ ( I ~ , ~ ~ , " , ~ ~ ' l ' ' I ~ l I ~ a ~ ~ / I I I I I I I I I I I I . , , I t , 4 ' , ' I , '
GRCop-84 bar As-extruded
-
Powder Lot 3E 0 Powder Lot 3B A Powder Lot 3C -- v Powder Lot 3D
Powder Lot 3E - Regression model --
--
I I / I . I " ' k ; ' a n D I
Temperature (F)
GRCop-84 Bar As-extruded Powder Lot 3C
Temperature (K)
Figure 2.2.2.2 GRCop-84 cryogenic electrical resistivity

Extensometer removal
Strain (percent)
(I) (I)
30
Figure 3.3.1 .I Typical GRCop-84 stress-strain curves

Temperature (F)
Temperature (K)
-400 -200 0 200 400 600 800 1000 1200 1400 1600 l , , , l l , , , # l i l , , l , , , , l , , , , l , , , , , , , , , ,
I r I 8 8 8 8 I - v r t m s ~ r n ! 8 c ~ ~ l L 1 ! 3 a ! a : 1 * m a
Figure 3.3. I .2 As-extruded 0.2 percent offset GRCop-84 yield strength
GRCop-84 bar
-0 As-extruded
Powder Lot 3A
-- 50
-- 45 Powder Lot 3B
A Powder Lot 3C v Powder Lot 3D
Powder Lot 3E - Regression model
l I I I I l , , , , f , , l , l , , , , ~ , . , , , I I I I I 0

Temperature (F)
Temperature (K)
GRCop-84 billet As-HIPed
Powder Lot 3A
Figure 3.3.1.3 As-HIPed 0.2 percent offset GRCop-84 yield strength
-- 45
Powder Lot 3B -
A Powder Lot 3C v Powder Lot 3D
-- 40 h
Powder Lot 3E V)
- s - Regression model A-
-- 35 5 Lower 95% confidence limit .- rn C 2?
-- 30 Zi 9 a,

Temperature (F)
Temperature (K)
-400 -200 0 200 400 600 800 1000 1200 1400 1600 800 ~ 1 ~ ~ ~ ~ ' : ' ~ ~ ~ ~ ~ ~ ~ ' ~ ~ ~ ~ ~ ' ~ l ~ ~ u ~ ~ L ~ ~ ~ ~ 1 l ~ ~ ~ ~ " : ~ ~ ~ ~ l ' i ~ ~ ~ ~ ~ ! ~ ~ ~ ~ , ~ 1 8 ~ ~ ~ : 1 r ~ ~
Figure 3.3.1 -4 As-extruded GRCop-84 ultimate tensile strength
700 Powder Lot 38
A Powder Lot 3C v Powder Lot 3D
Powder Lot 3E - Regression model
-- 20
GRCop84 bar As-extruded
-- Powder Lot 3A
-- 110
Temperature (F)
GRCop-84 billet 110 As-HIPed
Powder Lot 3A Powder Lot 38
100
A Powder Lot 3C v Powder Lot 3D 90
Powder Lot 3E - Regression model h
-- 80 Lower 95% confidence limit s.
Temperature (K)
Figure 3.3.1.5 As-HIPed GRCop-84 ultimate tensile strength

Temperature (F)
C 0 .- +
I 5 0 iii
e 0
/-- 1 \ 1 8 / 1 V
/ /
'1. v / --+-
GRCOD-84 Bar AS-extruded
Powder Lot 3A Powder Lot 38
A Powder Lot 3C v Powder Lot 3 0
Powder Lot 3E - Regression model -- Lower 95% confidence limit
Temperature (K)
Figure 3.3.1.6 As-extruded G RCop-84 elongation

Temperature (F)
GRCop-84 billet As-HIPed
Powder Lot 3A Powder Lot 3B
A Powder Lot 3C v Powder Lot 3D
Powder Lot 3E A v - Regression model
Temperature (K)
Figure 3.3.1.7 As-HIPed GRCop-84 elongation

Temperature (F)
GRCop-84 bar As-extruded
Powder Lot 3A Powder Lot 3B
A Powder Lot 3C - v Powder Lot 3D
Powder Lot 3E - Regression model -- Lower 95% confidence limit -
! 0 - v
Temperature (K)
Figure 3.3.1.8 As-extruded GRCop-84 reduction in area

Temperature (F)
GRCop-84 Billet As-HIPed
Powder Lot 3A Powder Lot 3B
A Powder Lot 3C v Powder Lot 3D
Powder Lot 3E - Regression model -- Lower 95% confidence limit
-
Q -
Temperature (K)
Figure 3.3.1.9 As-HIPed GRCop-84 reduction in area

Temperature (F)
-400 -200 0 200 400 600 800 1000 1200 1400 1600 350 " ~ ' ~ ' ~ ' ~ " I ' ' ~ ' ~ ' ~ " ~ ' I " " ! ' ' ' " ' " ' ' ' ' ' ' ' ' ' ' I , ~ ~ ~ l ~ ~ . . " ' " ' . ' : ' : L , ' ~
-- 50 GRCop-84 bar Extruded + 935 simulated braze cycle -- (Table 3.3.1 .I 0) -- 45
Temperature (K)
- - Powder Lot 3A -* Powder Lot 3B
-0
Figure 3.3.1 .I 1 Brazed extruded 0.2 percent offset GRCop-84 yield strength
'- 40 A Powder Lot 3C h
cn v Powder Lot 3D Y - V
Powder Lot 3E .- 35 5 - Regression model U) t -- Lower 95% confidence limit -1 2
-- 30 Z -- 9 Q) .- >
-- 25 , S - % -- 20 a 2
:15 % * 0
-- 10
-
-- 5
1 1 L 1 1 1 L 1 ' ~ ; ' ~ c 8 ; L 1 , \ + 0 I
0 200 400 600 800 1000 1200

Temperature (F)
Temperature (K)
-400 -200 0 200 400 600 800 1000 1200 1400 1600
Figure 3.3.1 . I2 Brazed HlPed 0.2 percent offset GRCop-84 yield strength
--
- g -- 20 a, 2
-- :I 15 2i n! 0
-- 10
-- -
-- 5
i
l l l l l l l l l l l l l l l l l l l I , , , , , l , j , , l l , , I , z I 8 r 8 , , I 7 8 , l l ~ ~ ~ ~ ~ ! ~ ~ ~ ~ l ~ l , ~ ~ r ~ : i ~ ~ ~
GRCop-84 billet HlPed + 935C simulated braze cycle -.
-- 50
(Table 3.3.1.10) -- -
Powder Lot 3A Powder Lot 3B
A Powder Lot 3C v Powder Lot 3D
-- - Powder Lot 3E
- Regression model -- Lower 95% confidence limit --
--
0 -r
-- 45
- 40 h V) Y w
-- 35 5 U) c 22
-- 30 '; rn - a, .- =-l
25 , a,

Temperature (F)
Temperature (K)
-400 -200 0 200 400 600 800 1000 1200 1400 1600
Figure 3.3.1 .I 3 Brazed extruded GRCop-84 ultimate tensile strength
110
100
-- 90
1: 80 .- In ?5
-- 70 c 2 -
-: 60 - .- V) s a -- 50 ; - E
-- 40
-- 30
20 ; lo
0
800 " ~ ' ~ ' ~ ' ~ " ~ " ~ ' ~ ' ~ ' " ' ~ " " ~ " " ' 1 1 " " ~ ' ' ' ' ' ' I j l , l l l l m ~ l ~ , ~ 2
0 200 400 600 800 1000 1200
700
GRCop-84 bar -- Extruded + 935C simulated braze cycle -: (Table 3.3.1 . lo) -- 1-
v Powder Lot 3A Powder Lot 3B
A Powder Lot 3C - v Powder Lot 3D
Powder Lot 3E - Regression model - -- Lower 95% confidence limit
-
200 --
100 --
I I ~ I I
0 I I I I I I ~ 8 m a ' " L a ; a a L ' , I

Temperature (F)
Temperature (K)
--
--
--
Figure 3.3.1 . I 4 Brazed HlPed GRCop-84 ultimate tensile strength
-400 -200 0 200 400 600 800 1000 1200 1400 1600 l l l l l l l l l i l r l l ~ l , , r I l , , l # l l l r , l r . , I 1 , , , . 1 1 c , , 1 , , 1 . ,
I ' ' ' r T m , # I ' " . I " " , " : 1 '
GRCop-84 billet HlPed + 935C simulated braze cycle (Table 3.3.1.10) -- -
Powder Lot 3A Powder Lot 3B
A Powder Lot 3C -- v Powder Lot 3D
Powder Lot 3E - Regression model
-- -- Lower 95% confidence limit --
-
- --
--
-
.-
I % , , l t , , , , l , , , , / , , l , l , , , , I I I I
-- 110 -1
-- 100
-- 90
:: 80 - .- V)
C -- 70
C
E? - -- 60 ; - .-
rn c aJ
-- 50 ; C z
-- 40 5
30
20
10
0

Temperature (F)
/ ~xtrucjed + 935 simulated braze cycle \ -- (Table 3.3.1.10)
-
\ v Powder Lot 3A
/' \
Powder Lot 3B \ * /
\-- /
A Powder Lot 3C A -- v Powder Lot 3D
-
Powder Lot 3E - Regression model -- Lower 95% confidence limit
l , ~ ~ ~ l ~ ~ L ' ; ' " ~ ~ ~ ~ I I I I I
I I
0 200 400 600 800 1000 1200
Temeprature (K)
Figure 3.3.1.15 Brazed extruded GRCop-84 elongation

Temperature (F)
Temperature (K)
30
25
h + I= a 2 20 a a V
t 0 .- CI
15 -- 0 - U1
10 --
5 --
0 0
Figure 3.3. I. 16 Brazed HlPed GRCop-84 elongation
L
GRCop-84 billet HlPed + 935C simulated braze cycle (Table 3.3.1.10)
-- - Powder Lot 3A Powder Lot 38
A A Powder Lot 3C
-- v Powder Lot 3D - Powder Lot 3E - Regression model Lower 95% confidence limit -
-- -
-
- \ \ \
I . a . . I , , , , I , , , , l , , , . , ~ , , , I I I 1
200 400 600 800 1000 1200
-1
-

Temperature (F)
GRCop-84 bar Extruded + 935C simulated braze cycle (Table 3.3.1.10)
Powder Lot 3A Powder Lot 38
A Powder Lot 3C v Powder Lot 3D
Powder Lot 3E - Regression model -- Lower 95% confidence limit
Temperature (K)
Figure 3.3.1 . I7 Brazed extruded GRCop-84 reduction in area

Temperature (F)
GRCop-84 billet HlPed + 935C simulated braze cycle (Table 3.3.1 . lo) 1
Powder Lot 3A Powder Lot 3 8 -
A Powder Lot 3C v Powder Lot 3D
Powder Lot 3E - Regression model -- Lower 95% confidence limit
-
Temperature (K)
Figure 3.3.1.18 Brazed HlPed GRCop-84 reduction in area

Time (hr)
12 I s s ' n I ' 3 I ~ s ' ' I s s
Figure 3.4.1 Typical as-extruded GRCop-84 creep curves
10
- GRCop-84 bar - As-extruded
1073K123.2 MPa - -- 923W51.2 MPa (1472F13.36 ksi)
773W119.0 MPa - (932Fl17.25 ksi) -
8 --
h 4
C a, 2 a, Q 6 -- V
c .- E G
-
-
I I I I L .
0 I a I I f ' ' ' ' I I m I
I
0 2 4 6 8 10

Time (hr)
16 l r ~ ~ ~ l l l l l l l l l l l l , , ,
Figure 3.4.2 Typical as-HIPed GRCop-84 creep curves
14 --
- GRCop-84 billet - As-HIPed 773W88.6 MPa
(932Fl12.84 ksi) - - -
1073W19.3 MPa (1472Ft2.80 ksi)
12 -- -
-
923W44.3 MPa -
-
4
2 --
0
--
-
l l l l l , , , . , , , , , , l , , , I I I I

1 ' ' 1 1 1 1 1 1 1 ( l " " 1 I r t 8
-
1073W17.4 MPa -
923W37.4 MPa - (1202Fl5.42 ksi)
-
-
GRCop-84 bar -
Extruded + 935C simulated braze cycle -
(Table 3.3.1 .I 0) 1
Time (hr)
Figure 3.4.3 Typical extruded and brazed GRCop-84 creep curves

18 i n - ~ ~ l t . ~ ~ ~ ~ ~ r ~
- GRCop-84 billet - HlPed + 935C simulated braze cycle
-
I I I I , I , , . , , , , , , I I
0 2 4 6
Time (hr)
Figure 3.4.4 Typical extruded and brazed GRCop-84 creep curves

Stress (ksi)
I (1472F) a 0 923K
(1202F) GRCop-84 bar As-extruded A 0 A
a Powder Lot 3A 773K o Powder Lot 38 (932 F)
- A Powder Lot 3C - v Powder Lot 3D a
- Powder Lot 3E o Powder Lot SM-2
I I
10 20 30 40 50 60 70 80 100 200
Stress (MPa)
Figure 3.4.5 As-extruded GRCop-84 creep rupture lives
Stress (ksi)
Stress (MPa)
2 3 4 5 6 7 8 9 1 0 20
Figure 3.4.6 As-H IPed GRCop-84 creep rupture lives
1000
100 -:
h L c - - 10 -: n a
- I I
: GRCop-84 billet - As-HIPed
Powder Lot 3A Powder Lot 38
A Powder Lot 3C v Powder Lot 3D -
Powder Lot 3E
1073K (1472F)
A -
j
\ 1
0.1
-:
I

Stress (ksi)
Stress (MPa)
2 3 4 5 6 7 8 9 1 0 20
Figure 3.4.7 Brazed extruded GRCop-84 creep rupture life
-
1000 --
100 -:
- L
5 al tf: - n
l o - : 6
1
I I
GRCop-84 bar Extruded + 935C simulated braze cycle (Table 3.3.1.10) -
a Powder Lot 3A o Powder Lot 3B 773K A Powder Lot 3C (932F) v Powder Lot 3D o
Powder Lot 3E 923K -
(1 202F) 1073K
(1472F) o 0
a
fy A v O a v
V
m
-r \ I - v v -
Stress (ksi)
Stress (MPa)
1000
100
n L r - - 10 n Q,
5
1 -:
0.1
Figure 3.4.8 HlPed and brazed GRCop-84 creep rupture lives
2 3 4 5 6 7 8 9 1 0 20 - I I
GRCop-84 billet HlPed + 935 simulated braze cycle (Table 3.3.1 .lo)
Powder Lot 3A Powder Lot 3B
-: A Powder Lot 3C - v Powder Lot 3D
Powder Lot 3E
1073K
(1472F) 923K 773K (932 F)
-: a
5 a 9
I I
-

I I I
-- -
- GRCop-84 bar &
As-extruded Powder Lot 3A
O Powder Lot 3C A Powder Lot 3D v Powder Lot 3E - Regression model -- Lower 95% confidence limit
Life (cycles)
Figure 3.5.2.1 GRCop-84 as-extruded room temperature low cycle fatigue life

Life (cycles)
10
h w C a, 2 a, a V
8 I-; C F C .- 2 z
0.1 T
Figure 3.5.2.2 GRCop-84 as-extruded elevated temperature low cycle fatigue life
I I I
873K (1 112F)
- GRCop-84 bar As-extruded
Powder Lot 3A Powder Lot 3C
A Powder Lot 3D v Powder Lot 3E
I I I t I
I

Life (cycles)
10
n + C Q)
2 Q) n V
% 1 - 1 c !! K .- !! i5
Figure 3.5.2.3 GRCop-84 extruded and brazed room temperature low cycle fatigue life
, I I
-
- GRCop-84 bar Extruded + 935C simulated braze cycle (Table 3.3.1.10)
Powder Lot 3A Powder Lot 3C
A Powder Lot 3D v Powder Lot 3E - Regression model -- Lower 95% confidence limit

Life (cycles)
h C
C a 2 a a V
$ 1 - 1 C P C .- 2 f j
0.1
Figure 3.5.2.4 GRCop-84 extruded and brazed elevated temperature low cycle fatigue life
873K (11 12F)
GRCop84 bar -
Extruded + 935C simulated braze cycle (Table 3.3.1.1 0)
Powder Lot 3A Powder Lot 3C
A Powder Lot 3D v Powder Lot 3E
I I I I I I
lo1 1 02 1 o3 1 o4 1 05

GRCop-84 billet HlPed
23C as-HIPed 400C as-HIPed
I A 600C as-HIPed v 23C HlPed + 935C simulated braze cycle (Table 3.3.1.10)
400C HlPed + simulated 935C braze cycle (Table 3.3.1.10) Regression model
. . . . . . . I - 95% confidence interval
Life (cycles)
Figure 3.5.2.5 HlPed GRCop-84 low cycle fatigue lives

t GRCop-84 sheet . . . . . . . . . . . . . . . . . . . . . . . . . . . . . . . . . . . . . . . . . . . . . . . . . . . . . . . . . . . . . . . . . . Extruded + warm rolled 600
0.2% offset yield strength UTS Elongation
. . . . . . . . . . . . . . . . . . . . . . . .
As-extruded 523K / 482F 573K / 572F 623K / 662F
Rolling temperature
Figure 4.1.1 Room temperature strength and ductility of warm rolled GRCop-84

Temperature (F)
Temperature (C)
Figure 4.1 -2 Elevated temperature 0.2 percent offset yield strength of w a n rolled GRCop-84
-
- 20 -
.- m 5.
- 1 5 K 2 C m P Q) .- X C a &'
- 1 0 C o K Q)
2 a n
2 - 5
0
140
h
120 2 u
5 0) c 100 F C tn u - 0 .- >, 80 C
Q)
d E 60 -- Q)
2 0 n
40 -- 0
20 --
0 400
800 1000 1200 1400 1600 1 6 0 ~ 1 ' " " " " 1 " " ' " " 1 ' t
GRCop-84 sheet Extruded + warm rolled
Rolled 523K (482F) -- v Rolled 573K (572F)
Rolled 623K (662F)
--
--
--
(regression model)
I , , , , l l l l t l l l l l l L ' l I
I
500 600 700 800 900

Temperature (F)
Temperature (C)
800 1000 1200 1400 1600
Figure 4.1.3 Elevated temperature ultimate tensile strength of warm rolled GRCop-84
--
-
I , , , , I , , , , l , , l , I , l j .
I
l I I I # t I I I I I I I I I I I n I I I I
GRCop-84 sheet Extruded + warm rolled
Rolled at 523K (482F) v Rolled at 573K (572F)
Rolled at 623K (662F) --
--
--
As-extruded UTS (regression model)
'
. -
-
-
-

Temperature (F)
Temperature (K)
1000 1100 1200 1300 1400
Figure 4.1.4 Elevated temperature warm rolled GRCop-84 elongation
70
60
h 50
+ C a, 2 a n V
r 40 0 .- C m 13, C 0 z
30
20
" " " " " " " " " ' " " " "
- GRCop-84 sheet v - Extruded + warm rolled
Warm rolled at 523K (482F) v Warm rolled at 573K (572F)
-- Warm rolled at 623K (662F) - v
- As-extruded elongation 8
- --
V
v -- -
-
-- -
- m
- --