Embed Size (px)
Citation preview
U.S. DEPARTMENT OF THE INTERIORU.S. GEOLOGICAL SURVEY
AEROMAGNETIC AND GRAVITY MAPS OF THE CENTRAL MARYSVALE VOLCANIC FIELD,
SOUTHWESTERN UTAH
By
David L. Campbell, Thomas A. Steven, Charles G. Cunningham, and Peter D. Rowley
Pamphlet to accompanyGEOLOGIC INVESTIGATIONS SERIES I–2645–B

ii
The photograph on the cover of the map jacket shows a view looking west-southwest into the Mount Belknap calderafrom a point on its eastern topographic wall. Mount Belknap (elev. 12,139 ft) is the peak on the right. The smoothslopes and cliffs reflect the eruptive sequence of ash flow tuffs and cliff-forming rhyolite lava flows.
iii
CONTENTS
Abstract . . . . . . . . . . . . . . . . . . . . . . . . . . . . . . . . . . . . . . . . . . . . . . . . . . . . . . . . . . . . . . . . . . . . . . . . . . . . . . . . . . . 1
Introduction and previous work . . . . . . . . . . . . . . . . . . . . . . . . . . . . . . . . . . . . . . . . . . . . . . . . . . . . . . . . . . . . . . . . . 1
Regional geologic setting . . . . . . . . . . . . . . . . . . . . . . . . . . . . . . . . . . . . . . . . . . . . . . . . . . . . . . . . . . . . . . . . . . . . . 3Pioche-Marysvale igneous belt . . . . . . . . . . . . . . . . . . . . . . . . . . . . . . . . . . . . . . . . . . . . . . . . . . . . . . . . . . 3Marysvale volcanic field . . . . . . . . . . . . . . . . . . . . . . . . . . . . . . . . . . . . . . . . . . . . . . . . . . . . . . . . . . . . . . . 4
Density and magnetic properties . . . . . . . . . . . . . . . . . . . . . . . . . . . . . . . . . . . . . . . . . . . . . . . . . . . . . . . . . . . . . . . . 7Data acquisition . . . . . . . . . . . . . . . . . . . . . . . . . . . . . . . . . . . . . . . . . . . . . . . . . . . . . . . . . . . . . . . . . . . . . 7Discussion of density and magnetic properties . . . . . . . . . . . . . . . . . . . . . . . . . . . . . . . . . . . . . . . . . . . . . . 7Generalizations about density and magnetic properties . . . . . . . . . . . . . . . . . . . . . . . . . . . . . . . . . . . . . . 11
Degree of alteration of rocks of the Bullion Canyon and Mount Belknap Volcanics . . . . . . . . . 11Composition of intrusive rocks . . . . . . . . . . . . . . . . . . . . . . . . . . . . . . . . . . . . . . . . . . . . . . . . . . 13Degree of welding of tuffs . . . . . . . . . . . . . . . . . . . . . . . . . . . . . . . . . . . . . . . . . . . . . . . . . . . . . . 13Composition of extrusive rocks . . . . . . . . . . . . . . . . . . . . . . . . . . . . . . . . . . . . . . . . . . . . . . . . . . 13Koenigsberger ratios . . . . . . . . . . . . . . . . . . . . . . . . . . . . . . . . . . . . . . . . . . . . . . . . . . . . . . . . . . 13
Sources of geophysical data . . . . . . . . . . . . . . . . . . . . . . . . . . . . . . . . . . . . . . . . . . . . . . . . . . . . . . . . . . . . . . . . . . 14Aeromagnetic data source . . . . . . . . . . . . . . . . . . . . . . . . . . . . . . . . . . . . . . . . . . . . . . . . . . . . . . . . . . . . . 14Gravity data sources . . . . . . . . . . . . . . . . . . . . . . . . . . . . . . . . . . . . . . . . . . . . . . . . . . . . . . . . . . . . . . . . . 15
Bouguer slab formula . . . . . . . . . . . . . . . . . . . . . . . . . . . . . . . . . . . . . . . . . . . . . . . . . . . . . . . . . . 15
Interpretation of geophysical features . . . . . . . . . . . . . . . . . . . . . . . . . . . . . . . . . . . . . . . . . . . . . . . . . . . . . . . . . . . 15Three gravity and magnetic domains: A generalized description . . . . . . . . . . . . . . . . . . . . . . . . . . . . . . . 16Basin-and-range features . . . . . . . . . . . . . . . . . . . . . . . . . . . . . . . . . . . . . . . . . . . . . . . . . . . . . . . . . . . . . . 16
Pavant Range homocline . . . . . . . . . . . . . . . . . . . . . . . . . . . . . . . . . . . . . . . . . . . . . . . . . . . . . . . 16Clear Creek downwarp, Dry Wash and Cove Fort faults . . . . . . . . . . . . . . . . . . . . . . . . . . . . . . . 17Sevier fault zone and related fault trough . . . . . . . . . . . . . . . . . . . . . . . . . . . . . . . . . . . . . . . . . . 17Marysvale Valley block . . . . . . . . . . . . . . . . . . . . . . . . . . . . . . . . . . . . . . . . . . . . . . . . . . . . . . . . 19Sulphurdale-Sheeprock fault zone . . . . . . . . . . . . . . . . . . . . . . . . . . . . . . . . . . . . . . . . . . . . . . . . 19
Calderas . . . . . . . . . . . . . . . . . . . . . . . . . . . . . . . . . . . . . . . . . . . . . . . . . . . . . . . . . . . . . . . . . . . . . . . . . . 19Three Creeks caldera . . . . . . . . . . . . . . . . . . . . . . . . . . . . . . . . . . . . . . . . . . . . . . . . . . . . . . . . . . 19Big John caldera . . . . . . . . . . . . . . . . . . . . . . . . . . . . . . . . . . . . . . . . . . . . . . . . . . . . . . . . . . . . . 20Monroe Peak caldera . . . . . . . . . . . . . . . . . . . . . . . . . . . . . . . . . . . . . . . . . . . . . . . . . . . . . . . . . . 20Mount Belknap caldera . . . . . . . . . . . . . . . . . . . . . . . . . . . . . . . . . . . . . . . . . . . . . . . . . . . . . . . . 22Red Hills caldera . . . . . . . . . . . . . . . . . . . . . . . . . . . . . . . . . . . . . . . . . . . . . . . . . . . . . . . . . . . . . 22
Other igneous features . . . . . . . . . . . . . . . . . . . . . . . . . . . . . . . . . . . . . . . . . . . . . . . . . . . . . . . . . . . . . . . . 22Sulphurdale–Cove Fort area . . . . . . . . . . . . . . . . . . . . . . . . . . . . . . . . . . . . . . . . . . . . . . . . . . . . 22Mill Creek–Red Narrows–Sevier Canyon area . . . . . . . . . . . . . . . . . . . . . . . . . . . . . . . . . . . . . . 23Possible sources for aeromagnetic lows in the northern domain . . . . . . . . . . . . . . . . . . . . . . . . . 24Mount Holly–Bellyache Canyon low . . . . . . . . . . . . . . . . . . . . . . . . . . . . . . . . . . . . . . . . . . . . . . 25Selected local plutons . . . . . . . . . . . . . . . . . . . . . . . . . . . . . . . . . . . . . . . . . . . . . . . . . . . . . . . . . 26
Summary and conclusions . . . . . . . . . . . . . . . . . . . . . . . . . . . . . . . . . . . . . . . . . . . . . . . . . . . . . . . . . . . . . . . . . . . . 26
Acknowledgments . . . . . . . . . . . . . . . . . . . . . . . . . . . . . . . . . . . . . . . . . . . . . . . . . . . . . . . . . . . . . . . . . . . . . . . . . . 27
References cited . . . . . . . . . . . . . . . . . . . . . . . . . . . . . . . . . . . . . . . . . . . . . . . . . . . . . . . . . . . . . . . . . . . . . . . . . . . 28
Index to geophysical features discussed . . . . . . . . . . . . . . . . . . . . . . . . . . . . . . . . . . . . . . . . . . . . . . . . . . . . . . . . . 50
iv
Map A. Aeromagnetic map . . . . . . . . . . . . . . . . . . . . . . . . . . . . . . . . . . . . . . . . . . . . . . . . . . . . . . . . . . . . . . Map sheetMap B. Bouguer gravity map . . . . . . . . . . . . . . . . . . . . . . . . . . . . . . . . . . . . . . . . . . . . . . . . . . . . . . . . . . . . Map sheet
FIGURES1. Index map of Utah . . . . . . . . . . . . . . . . . . . . . . . . . . . . . . . . . . . . . . . . . . . . . . . . . . . . . . . . . . . . . . . . . . . . . . . . . . 22. Composite aeromagnetic map of southeastern Nevada and southwestern Utah . . . . . . . . . . . . . . . . . . . . Map sheet3. RTP composite aeromagnetic map of southeastern Nevada and southwestern Utah . . . . . . . . . . . . . . . . . Map sheet4. Topographic map of the central Marysvale volcanic field . . . . . . . . . . . . . . . . . . . . . . . . . . . . . . . . . . . . Map sheet5. Schematic geologic map of the central Marysvale volcanic field . . . . . . . . . . . . . . . . . . . . . . . . . . . . . . . . . . . . . . 56. Geologic map overlay for the central Marysvale volcanic field . . . . . . . . . . . . . . . . . . . . . . . . . . . . . . . . . . . . . . . 67. Histograms of physical properties . . . . . . . . . . . . . . . . . . . . . . . . . . . . . . . . . . . . . . . . . . . . . . . . . . . . . . . . . . . . . . 98. Graphs of correlations between pairs of physical properties . . . . . . . . . . . . . . . . . . . . . . . . . . . . . . . . . . . . . . . . . 109. Graphs of statistical means and extremes for physical properties . . . . . . . . . . . . . . . . . . . . . . . . . . . . . . . . . . . . . 12
10. Key to aeromagnetic map of the central Marysvale volcanic field . . . . . . . . . . . . . . . . . . . . . . . . . . . . . . Map sheet11. Key to Bouguer gravity map of the central Marysvale volcanic field . . . . . . . . . . . . . . . . . . . . . . . . . . . . Map sheet12. Bouguer slab formula graph . . . . . . . . . . . . . . . . . . . . . . . . . . . . . . . . . . . . . . . . . . . . . . . . . . . . . . . . . . . . . . . . . 15
TABLES1. Description and physical properties of rock samples from the central Marysvale volcanic field. . . . . . . . . . . . . . 332. Description of map units for the central Marysvale volcanic field . . . . . . . . . . . . . . . . . . . . . . . . . . . . . . . . . . . . 413. Abbreviations used in this report to indicate sample classes . . . . . . . . . . . . . . . . . . . . . . . . . . . . . . . . . . . . . . . . . 444. Summary of properties found for duplicate samples . . . . . . . . . . . . . . . . . . . . . . . . . . . . . . . . . . . . . . . . . . . . . . . 44
5(a). Statistics of density measurements . . . . . . . . . . . . . . . . . . . . . . . . . . . . . . . . . . . . . . . . . . . . . . . . . . . . . . . . . . . . 455(b). Statistics of susceptibility measurements . . . . . . . . . . . . . . . . . . . . . . . . . . . . . . . . . . . . . . . . . . . . . . . . . . . . . . . . 465(c). Statistics of NRM measurements . . . . . . . . . . . . . . . . . . . . . . . . . . . . . . . . . . . . . . . . . . . . . . . . . . . . . . . . . . . . . . 475(d). Statistics of Koenigsberger Q measurements . . . . . . . . . . . . . . . . . . . . . . . . . . . . . . . . . . . . . . . . . . . . . . . . . . . . 48
6. Typical values of physical properties for rocks of the central Marysvale volcanic field . . . . . . . . . . . . . . . . . . . . 49
1
AEROMAGNETIC AND GRAVITY MAPSOF THE CENTRAL MARYSVALE VOLCANIC FIELD,
SOUTHWESTERN UTAH
By David L. Campbell, Thomas A. Steven,
Charles G. Cunningham, and Peter D. Rowley
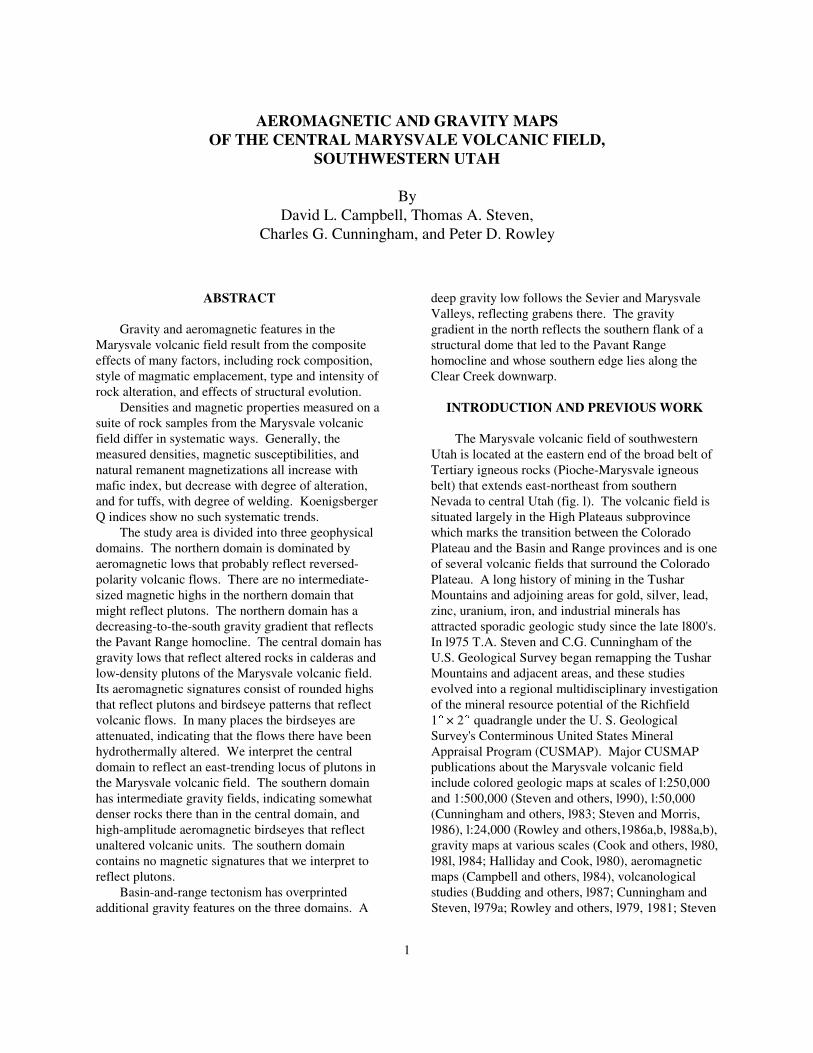
ABSTRACT
Gravity and aeromagnetic features in theMarysvale volcanic field result from the compositeeffects of many factors, including rock composition,style of magmatic emplacement, type and intensity ofrock alteration, and effects of structural evolution.
Densities and magnetic properties measured on asuite of rock samples from the Marysvale volcanicfield differ in systematic ways. Generally, the The Marysvale volcanic field of southwesternmeasured densities, magnetic susceptibilities, and Utah is located at the eastern end of the broad belt ofnatural remanent magnetizations all increase with Tertiary igneous rocks (Pioche-Marysvale igneousmafic index, but decrease with degree of alteration, belt) that extends east-northeast from southernand for tuffs, with degree of welding. Koenigsberger Nevada to central Utah (fig. l). The volcanic field isQ indices show no such systematic trends. situated largely in the High Plateaus subprovince
The study area is divided into three geophysical which marks the transition between the Coloradodomains. The northern domain is dominated by Plateau and the Basin and Range provinces and is oneaeromagnetic lows that probably reflect reversed- of several volcanic fields that surround the Coloradopolarity volcanic flows. There are no intermediate- Plateau. A long history of mining in the Tusharsized magnetic highs in the northern domain that Mountains and adjoining areas for gold, silver, lead,might reflect plutons. The northern domain has a zinc, uranium, iron, and industrial minerals hasdecreasing-to-the-south gravity gradient that reflects attracted sporadic geologic study since the late l800's. the Pavant Range homocline. The central domain has In l975 T.A. Steven and C.G. Cunningham of thegravity lows that reflect altered rocks in calderas and U.S. Geological Survey began remapping the Tusharlow-density plutons of the Marysvale volcanic field. Mountains and adjacent areas, and these studiesIts aeromagnetic signatures consist of rounded highs evolved into a regional multidisciplinary investigationthat reflect plutons and birdseye patterns that reflect of the mineral resource potential of the Richfield volcanic flows. In many places the birdseyes are 1(× 2( quadrangle under the U. S. Geologicalattenuated, indicating that the flows there have been Survey's Conterminous United States Mineralhydrothermally altered. We interpret the central Appraisal Program (CUSMAP). Major CUSMAPdomain to reflect an east-trending locus of plutons in publications about the Marysvale volcanic fieldthe Marysvale volcanic field. The southern domain include colored geologic maps at scales of l:250,000has intermediate gravity fields, indicating somewhat and 1:500,000 (Steven and others, l990), l:50,000denser rocks there than in the central domain, and (Cunningham and others, l983; Steven and Morris,high-amplitude aeromagnetic birdseyes that reflect l986), l:24,000 (Rowley and others,1986a,b, l988a,b),unaltered volcanic units. The southern domain gravity maps at various scales (Cook and others, l980,contains no magnetic signatures that we interpret to l98l, l984; Halliday and Cook, l980), aeromagneticreflect plutons. maps (Campbell and others, l984), volcanological
Basin-and-range tectonism has overprinted studies (Budding and others, l987; Cunningham andadditional gravity features on the three domains. A Steven, l979a; Rowley and others, l979, 1981; Steven
deep gravity low follows the Sevier and MarysvaleValleys, reflecting grabens there. The gravitygradient in the north reflects the southern flank of astructural dome that led to the Pavant Rangehomocline and whose southern edge lies along theClear Creek downwarp.
INTRODUCTION AND PREVIOUS WORK
2
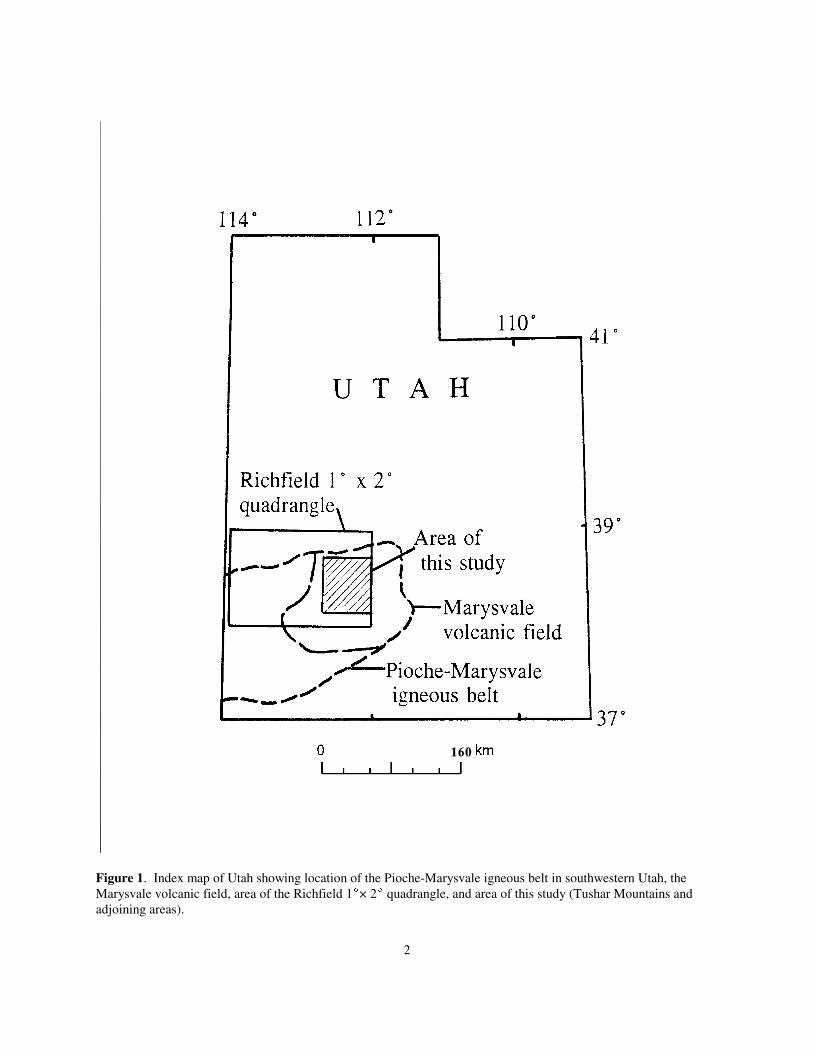
Figure 1. Index map of Utah showing location of the Pioche-Marysvale igneous belt in southwestern Utah, theMarysvale volcanic field, area of the Richfield 1(× 2( quadrangle, and area of this study (Tushar Mountains andadjoining areas).
3
and others, l979; Steven, Cunningham, and Anderson,l984; Steven, Rowley, and Cunningham, 1984),various geophysical studies (Campbell and Flanigan,l982; Earth Sciences Laboratory, l978; Flanigan andCampbell, l98l; Ross and others, l982), radiometricmaps (Schutter and others, 1989), geochemicalinvestigations (Miller and others, l984a,b,c), studiesof ore deposits (Beaty and others, l986; Cunningham,Rye, and others, l984; Cunningham and Steven,l979b,c,d; Steven, l984; Steven and others, 1981;Steven, Cunningham, and Anderson, 1984), and amineral resource appraisal (Steven and Morris, l986). More recent work bearing on the study area includesadditional geologic mapping (Rowley and others,1987; Anderson and others, 1990a,b), ore deposit andgeochemical studies (Cunningham and others, 1994,1997; Cunningham, Rassmussen, and others, 1998;Cunningham, Unruh, and others, 1998), and tectonicsummaries (Anderson and Barnhard, 1992; Rowleyand others, 1998; Rowley, 1998).
This report presents a color aeromagnetic map atscale 1:100,000 of the Tushar Mountains andsurrounding areas (hereafter called the study area;map A, map sheet). Map A shows much more detailthan the earlier aeromagnetic map of the study area(Campbell and others, 1984), which was flown withwider line spacing. This report also presents a1:100,000 scale color map of complete Bouguergravity anomalies in the study area (map B, mapsheet). A colored geologic map of the study area atthis same scale has been compiled by Rowley andothers (in press); that geologic map (I-2645-A) is acompanion map to this report (I-2645-B), and shouldbe used together with it. This report also describesthe gravity and aeromagnetic signatures of particulargeologic features in the study area and presentsdensity, magnetic susceptibility, and natural remanentmagnetization (NRM) measurements made on 88samples of igneous rocks. Small-scale versions ofregional aeromagnetic (figs. 2 and 3, map sheet),topographic (fig. 4, map sheet), and geologic mapsshowing structures and alteration patterns (figs. 5 and6) of the study area are included. Detailed versionsof these maps have been published at l:50,000 scale(geology: Cunningham and others, l983; alteredrocks: Cunningham, Steven, Rowley, and others,l984; gravity: Cook and others, l984; aeromagneticdata from an earlier survey: Campbell and others,l984), and these maps can be used for details.
REGIONAL GEOLOGIC SETTING
PIOCHE-MARYSVALE IGNEOUS BELT
The Pioche-Marysvale igneous belt (fig. 1)comprises an east-northeast-trending series ofOligocene, Miocene, and post-Miocene volcanicrocks and intrusions in southeastern Nevada andsouthwestern to south-central Utah. These igneousfeatures include the Indian Peaks caldera complex(IPCC, figs. 2 and 3; Best and Grant, 1987; Rowleyand others, in press) northeast of the town of Pioche,Nev., and the Marysvale volcanic field, whichsurrounds the town of Marysvale, Utah, as well asmany igneous centers in between. Definitiveboundaries of the Pioche-Marysvale belt are, to anextent, uncertain; by common agreement, it shouldinclude areas of observed volcanic and plutonic unitsthat crop out at the surface, as well as intrusions thatmay be present at depth but can only be inferred. Intheir study of the Richfield, Utah, quadrangle, Stevenand Morris (1986) drew boundary lines around areaswith igneous outcrops of different ages; one of theseboundaries (RBIC, surrounding Oligocene andlowermost Miocene calc-alkalic igneous centers) isreproduced on figures 2 and 3.
Because most large igneous deposits in theWestern United States give rise to aeromagneticanomalies, it is reasonable to ask whether the Pioche-Marysvale belt can be defined by aeromagneticcriteria. Figure 2 is a regional aeromagnetic map, onwhich a series of regional magnetic highs is apparentalong the Pioche-Marysvale belt. On this map aparallel belt of magnetic lows occurs just north of thehighs; these could be polarity lows, an expected partof the magnetic signature of bodies having inducedmagnetism. The phenomenon of polarity lows keepsmagnetic highs from falling directly over their sourcebodies. In order to disperse the polarity lows, theobserved fields are analytically reduced-to-pole(RTP), as in figure 3. An RTP magnetic map is onestep removed from the observed data and can leadone astray when interpreting bodies that have strongmagnetic remanence. Used with caution, however,and subject to field checking, RTP maps can beuseful for making generalized interpretations. Asmentioned above, the magnetic highs on RTP mapsfall over their source bodies, so that by tracing acontour one can draw an outline parallel to the(depth- and susceptibility-weighted) edge of a sourcebody. Such outlines will usually locate either plutonsor sequences of normal-magnetic-polarity volcanicrocks. For a general discussion of the RTP process,
4
see Blakely (1994). represented by many lava flows derived fromThe RTP process has shrunk the continuous band scattered sources. The earliest mafic flows to be
of polarity lows north of the Pioche-Marysvale belt to erupted, at about 22 Ma, are potassium-richa smaller low just north of the RBIC boundary in the (shoshonites), whereas later mafic flows are morepresent study area (fig. 3). Other RTP lows are also normal basalts or basaltic andesites (Best and others,seen to the south of the Pioche-marysvale belt. Such l980).lows commonly reflect basalts or other mafic volcanic Altered rocks belonging to both the older androcks that have reversed magnetic polarity. As younger rock assemblages are widespread in thediscussed below, we think basalts and tuffs having volcanic field and are commonly associated withstrong reversed magnetic polarity may be present in known ore deposits or with potentially mineralizedboth the northern and southern parts of the study area. areas (Steven and Morris, 1986; Cunningham andSuch rocks may not be so prevalent along parts of the others, 1994). Many of the intermediate-compositionPioche-marysvale belt where RTP processing has rocks in the central part of the study area (discusseddispersed the aeromagnetic lows. below) have been pervasively propylitically altered.
MARYSVALE VOLCANIC FIELD in replacement alunite deposits north and northeast of
The Marysvale volcanic field has a geologic Rye, and others, l984; Beaty and others, l986). Mosthistory similar to that of many other volcanic fields in of the alteration in the vicinity of Alunite Ridge,the Western United States. It contains early-erupted, including vein alunite, is genetically associated withvoluminous, intermediate-composition, calc-alkaline an unexposed stock (Cunningham, Rye, and others,volcanic rocks of middle Oligocene to earliest 1984; Cunningham and others, 1997; Beaty andMiocene age that were followed by a bimodal others, 1986), and took place at 14 Ma.assemblage of alkali rhyolite tuff and lava flows and The Tushar Mountains and adjoining areas are inlocal basalt flows, mostly of Miocene age. the High Plateaus subprovince, which forms theThroughout its igneous history, sporadic ash-flow transition between the Colorado Plateau and theeruptions resulted in the formation of calderas (fig. Basin and Range provinces. Most of the northerly5). striking major faults in the area (fig. 6) are basin-and-
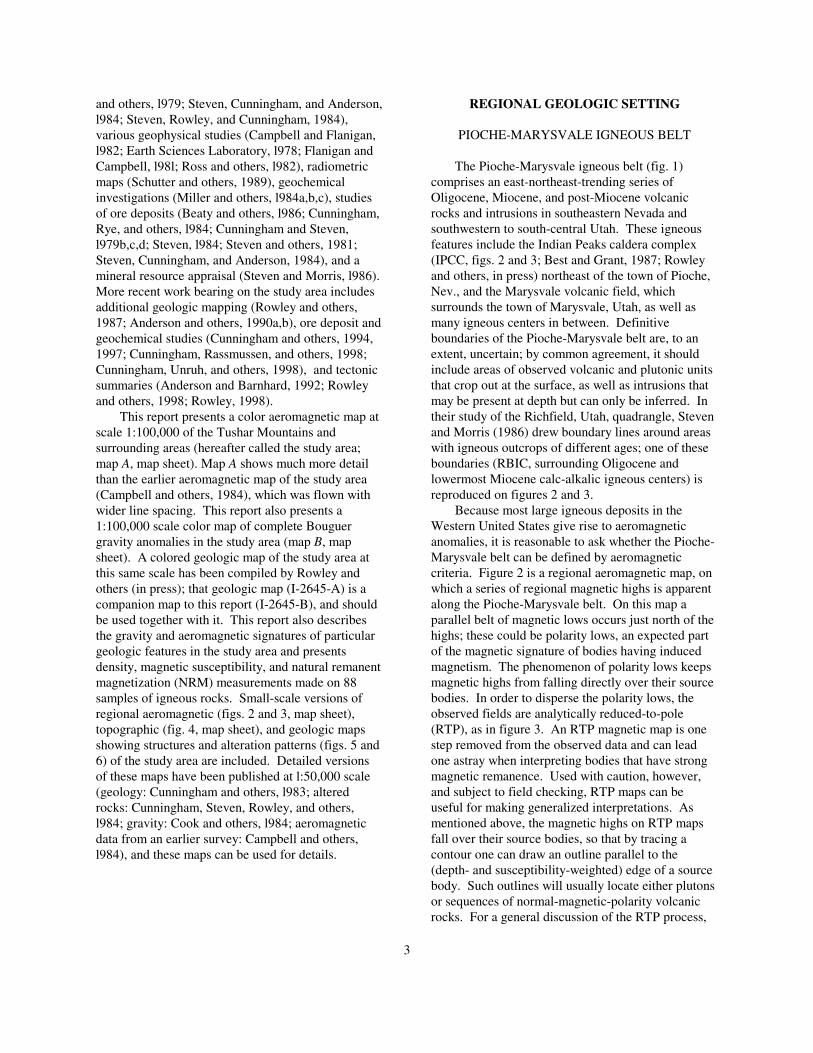
The intermediate-composition volcanic rocks range structures. Most of the present topographywere erupted from just before 30 Ma to about 22 Ma reflects basin-range block faulting that was developedfrom scattered to clustered volcanoes. In the Tushar at 8-5 Ma (Steven and others, l979; Rowley andMountains most of these rocks are hornblende- others, l98l). East-striking structural elements havebiotite-bearing calc-alkalic rocks of the Bullion been noted in the study area as well as in other partsCanyon Volcanics. Eruption of the Three Creeks of the High Plateaus and Great Basin. TheseTuff Member of the Bullion Canyon Volcanics at 27 elements include easterly striking faults and folds asMa resulted in the Three Creeks caldera (Steven, well as easterly alignments of intrusions, volcanicl98l) in the southern Pavant Range. Near the end of centers, mineral deposits, hydrothermally alteredintermediate-composition volcanism, the eruption of areas, geophysical anomalies, and springs. Thesethe Delano Peak Tuff Member of the Bullion Canyon observations lead to the definition of “transverseVolcanics led to the Big John caldera (Steven, zones,” some of them hundreds of kilometers long,Cunningham, and Anderson, l984), and the eruption that formed generally parallel to the extensionof the Osiris Tuff, also near 23 Ma (Rowley and direction synchronously with Cenozoic (of basin-and-others, l988a,b), led to the Monroe Peak caldera. range and older episodes) normal faults that are
The most voluminous rocks in the bimodal suite oriented generally perpendicular to the extensionare the crystal-poor alkali-rhyolite ash-flow tuff units direction (Rowley and others, 1998; Rowley, 1998). and lava flows of the Mount Belknap Volcanics Two such zones, the Cove Fort transverse zone and(Cunningham and Steven, l979a; Budding and others, the Blue Ribbon transverse zone, bound the centrall987). The widespread Joe Lott Tuff Member is a domain (fig. 5) of the Marysvale volcanic field andvariably welded ash-flow tuff unit whose eruption extend well to the west (figs. 2 and 3). resulted in the Mount Belknap caldera. The eruptionof the Red Hills Tuff Member of the Mount BelknapVolcanics resulted in the small Red Hills caldera. The mafic end member of the bimodal suite is
Argillic and advanced argillic alteration that resulted
Marysvale took place at 23-22 Ma (Cunningham,
Figure 5. Schematic geologic map of the central Marysvale volcanic field, Utah, showing general locations of caldera walls (hachures on inside), altered areas (shaded areas), and selected mines and mining areas (asterisks).
5
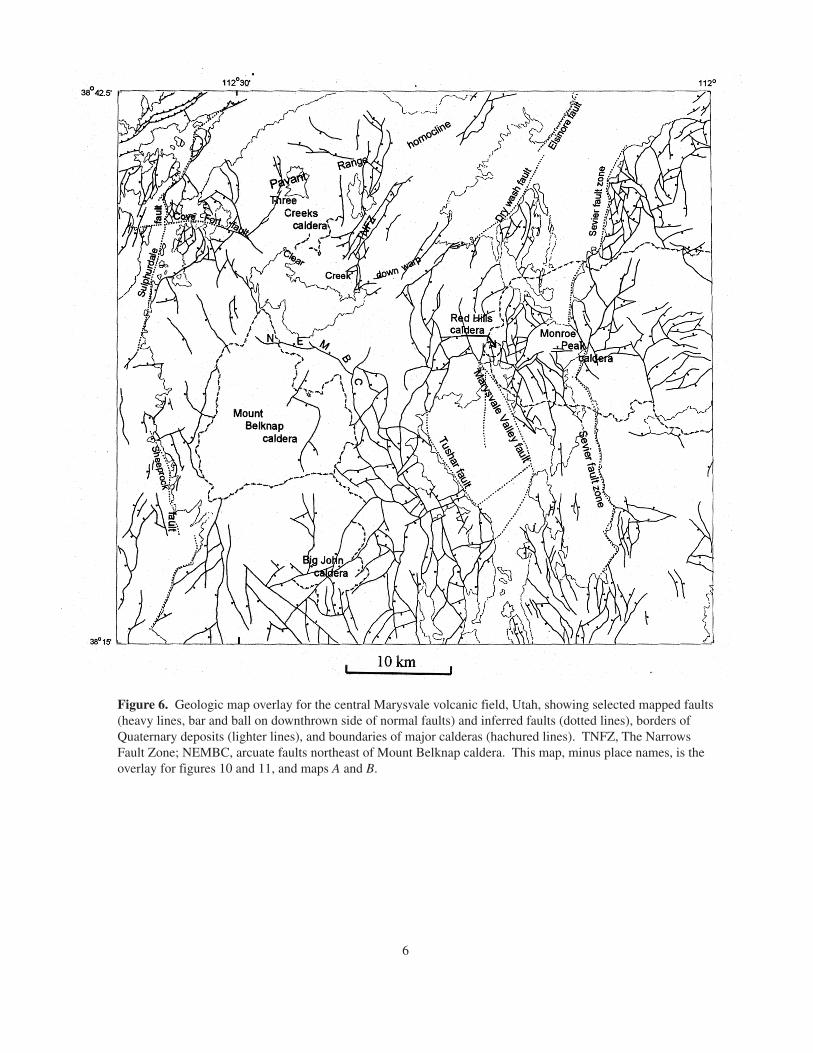
Figure 6. Geologic map overlay for the central Marysvale volcanic field, Utah, showing selected mapped faults (heavy lines, bar and ball on downthrown side of normal faults) and inferred faults (dotted lines), borders of Quaternary deposits (lighter lines), and boundaries of major calderas (hachured lines). TNFZ, The Narrows Fault Zone; NEMBC, arcuate faults northeast of Mount Belknap caldera. This map, minus place names, is the overlay for figures 10 and 11, and maps A and B.
6
7
DENSITY AND MAGNETIC PROPERTIES
DATA ACQUISITION
Dry bulk density, magnetic susceptibility, andnatural remanent magnetization (NRM) weremeasured on samples of 88 igneous rocksrepresenting the time-space-composition variations inigneous rocks of the Marysvale volcanic field (table1). Preliminary data were reported in Mackie andCunningham (1982), but magnetic properties were re-measured for this report. The measurements andsample localities are listed in table l, and lithologicdescriptions of the rock units cited there are given intable 2. The results are graphically portrayed infigures 7-9, with statistics given in table 5.
Dry bulk density of fist-sized samples wasmeasured by the buoyancy method (Johnson, l979). Samples were weighed dry (dry weight=W ), thend
saturated with water in a vacuum chamber for 48hours, and then weighed while submerged in water ofdensity ' (submerged weight=W ). The bulk volumew w
(V ) was determined by V =W /' , and the dry bulkb b w w
density (' ) was determined by ' =W /V .b b d b
Magnetic susceptibilities and NRM values weremeasured on dry chips of each sample, about 1 cm in3
size, in the USGS Paleomagnetic Laboratory, Denver,Colo. The chips were spalled off the larger samplesas gently as possible to avoid changing NRM bymechanical shock, and it is thought that errors fromthis possible cause are small. Susceptibilities weremeasured at a frequency of 600 Hz in a smallcalibrated coil having an induction field of 0.1millitesla. NRM values were measured at 90 Hz witha spinner magnetometer having a sensitivity < 1.0 ×10 amperes/ meter. The Koenigsberger Q, the-5
dimensionless ratio of NRM (permanent) to inducedmagnetization, was calculated for each sample bydividing measured NRM (in emu/cm ) by an induced3
magnetization value found by multiplying themeasured susceptibility (cgs system) by 0.54 oersted,a value that represents the general magnitude of theEarth’s magnetic field in the study area.
Susceptibility and NRM for 5 of the 88 sampleswere measured twice, using different chips from thesame original sample. Table 4 gives the results forthese duplicate samples. All the repeatedsusceptibilities were within a few percent of eachother. The NRM values, however, were not. The twoNRM values for samples M859, M930D, and 79-1518 differed by 6-9 percent, while those for sample79-1517 differed by 35 percent and those for sampleM798 were different by a factor of almost 2.
Differences in Q were similar, reflecting the NRMvariations that went into the Q calculation. We thinkthat most of these differences represent genuinevariations in magnetic properties from place to placewithin the rock sample itself. In turn, this means thatall NRM and Q values cited below should beregarded as samples from a distribution of values inthe parent rocks that may vary by as much as,perhaps, a factor of 2. Note, though, that this likelyvariability is diminished by using logarithms of themeasured values, which we do below. For cases ofduplicate samples, values given in table 1 and infigures 7-9 were those for the chip having the largerNRM.
DISCUSSION OF DENSITY AND MAGNETIC PROPERTIES
Because this set of sample measurements is quiteextensive, we used it to look for systematicdifferences between rock types and for correlationsbetween the different physical properties that weremeasured. The samples were divided by rock typeinto classes (table 3). One division was betweenextrusive rocks (denoted X or OX) and intrusiverocks from the study area (I). X and OX rocks weresubdivided into extrusive rhyolites (-R), dacites andother intermediate composition rocks (-D), basaltsand other mafic composition rocks (-B), and tuffs. The tuffs were further divided according to theirdegree of welding: poorly welded (-TP), moderatelywelded (-TM), and densely welded (-TD). I rockswere subdivided into intrusive rhyolites (-R), graniticrocks (-G), and monzonites (-M).
Rocks in many parts of the study area have beenpervasively propylitically or argillically altered. Therefore, another division of samples was made toindicate degree of alteration. Unaltered or freshsamples were denoted U. Samples of rocks that arepropylitically altered were denoted as "slightlyaltered" (S). Samples that are at least partlyargillically altered were termed "moderately altered"(M), and rocks that have been subjected to advancedargillic alteration, especially where alunite has beenformed, were termed "highly altered" (H). The rockswere subdivided into those of the Bullion CanyonVolcanics (denoted -BC) and Mount BelknapVolcanics (-MB). The X class mentioned abovedenotes extrusive rocks of the -BC and -MB suites,and OX denotes extrusive rocks that are neither -MBnor -BC. Class -BC includes seven samples that are,in fact, from units of the Monroe Peak caldera(Rowley and others, in press); these have been
8
included with true Bullion Canyon Volcanic rocks low range for both susceptibility and NRM. Samplebecause of their petrological affinities and similar M91, a moderately welded tuff of the Mount Belknapages. Note that class I includes eight samples of Volcanics, also falls in the low range of susceptibility. Bullion Canyon Volcanic rocks that are intrusive innature.
The measured susceptibilities of five of thehighly altered samples turned out to be small butnegative. These five samples were not used inmaking the graphs that show susceptibility andKoenigsberger Q, or in the statistical analyses(below) of susceptibility and Q. Negativesusceptibility values suggest that all induced magneticdomains have disappeared in those samples —essentially, their crystal structure has been sodisrupted that it does not support a bulk inducedmagnetization, and the remaining measured valuecomes from the molecular/atomic level. Thisnegative, or diamagnetic, susceptibility is present inall matter, but is usually masked by the strongereffects of crystalline structure.
Figure 7 shows histograms for the resultingmeasurements. Shading patterns of the histogramboxes indicate degree of alteration (H, M, S, and U)for extrusive rocks of the Bullion Canyon Volcanicsand Mount Belknap Volcanics, with the remainingsamples aggregated together as either other (non -BCor -MB) extrusive rocks or intrusive rocks. Histogram intervals are linear for the density graph,but logarithmic for the susceptibility, NRM, andKoenigsberger Q graphs. The logarithmic intervalsreflect the fact that the magnetic property valuesspread over many orders of magnitude, and they upward.suggest that these three physical properties may be Except for the comments about lightning strikes,distributed log-normally. the above generalizations do not seem to hold for the
The density histogram (upper left panel, fig. 7) Koenigsberger Q values (lower right panel, fig. 7).shows that most of the low-density samples are Figure 8 shows how well physical propertiesaltered Bullion Canyon or Mount Belknap Volcanics. correlate with each other. Correlation coefficients rAll the other samples in the low-density group were calculated for all pairs of physical properties; r(< 2.26 g/cm ) are ash-flow tuffs. High density equals 1.00 if the variables are perfectly correlated,3
samples (> 2.6 g/cm ) are generally intermediate- and -1.00 if they are perfectly anti-correlated, and 0.00 if3
mafic-composition extrusive rocks and intrusive they are uncorrelated. There is a fair correlationrocks, all but one of them (M330) monzonites. The (r=0.58) between density and the logarithm ofone highly altered sample in the high-density group is susceptibility (fig. 8, upper left panel), whichM53, which consists of a tightly meshed intergrowth improves only slightly (r=0.60) if the altered samplesof alunite (density about 2.7 g/cm ) and quartz. are not used. There is good correlation between log3
The susceptibility and NRM histograms (upper NRM and log susceptibility (fig. 8, upper right panel;right and lower left panels, respectively, fig. 7) show r=0.81 for all samples, but r=0.56 for fresh samplessimilar trends. As with density, altered samples of only), and a poor correlation between log NRM andBullion Canyon and Mount Belknap Volcanics density (fig. 8, lower left panel; r=0.49 for allgenerally fall in the lower ranges of both histograms samples, r=0.32 for fresh samples only). There is no(< 1.0E-05 cgs for susceptibility, and < 2.5E-05 correlation between Q and density (fig. 8, lower rightemu/cm for NRM). One unaltered sample, M583, a panel; r=0.03 and -0.01). As would be expected3
rhyolite of the Mount Belknap Volcanics, falls in the because Q is calculated from both NRM and
Most tuffs, though, have medium susceptibility andquite high NRM. As with density, samples ofintermediate- and mafic-composition extrusive rocksand intrusive rocks, especially monzonites, tend tofall in the high ranges of the susceptibility and NRMhistograms (> 1.4E-03 cgs for susceptibility and > 1.0E-03 emu/cm for NRM). Sample M739, a3
densely welded mafic tuff of Albinus Canyon, alsofalls in the high-susceptibility range. Besides theintermediate- and mafic-composition extrusive andintrusive rocks cited above, the high range of theNRM histogram contains many samples ofmoderately and densely welded tuffs (M928, M908,M520, M75, M472, M859, and M145B, listed inorder of increasing NRM) and two other samples,M581 and M263. M581 and M263 were collectednear the summits of Mount Baldy and Delano Peak,respectively, so that their high NRM values may haveresulted from lightning strikes on those peakssometime in the past. Other samples collected fromhigh elevations, so that they could also have beenstruck by lightning, include M145B, M859, andM903. Lightning strikes typically raise NRM values,sometimes by as much as 2 orders of magnitude, butseldom or never decrease them (J. Rosenbaum, U.S.Geological Survey, oral commun., 1998). Therefore,possible lightning strikes could have biased thehistograms for NRM, and consequently for Q,
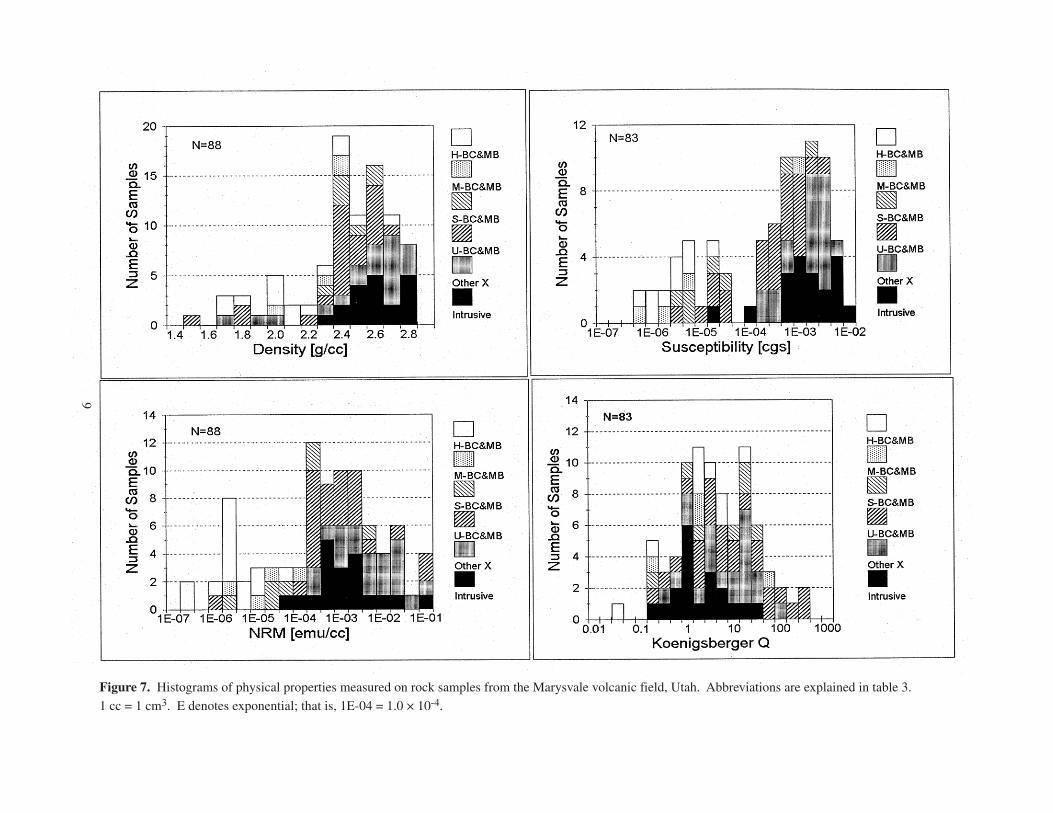
Figure 7. Histograms of physical properties measured on rock samples from the Marysvale volcanic field, Utah. Abbreviations are explained in table 3.
1 cc = 1 cm3. E denotes exponential; that is, 1E-04 = 1.0 × 10⁻⁴.
9
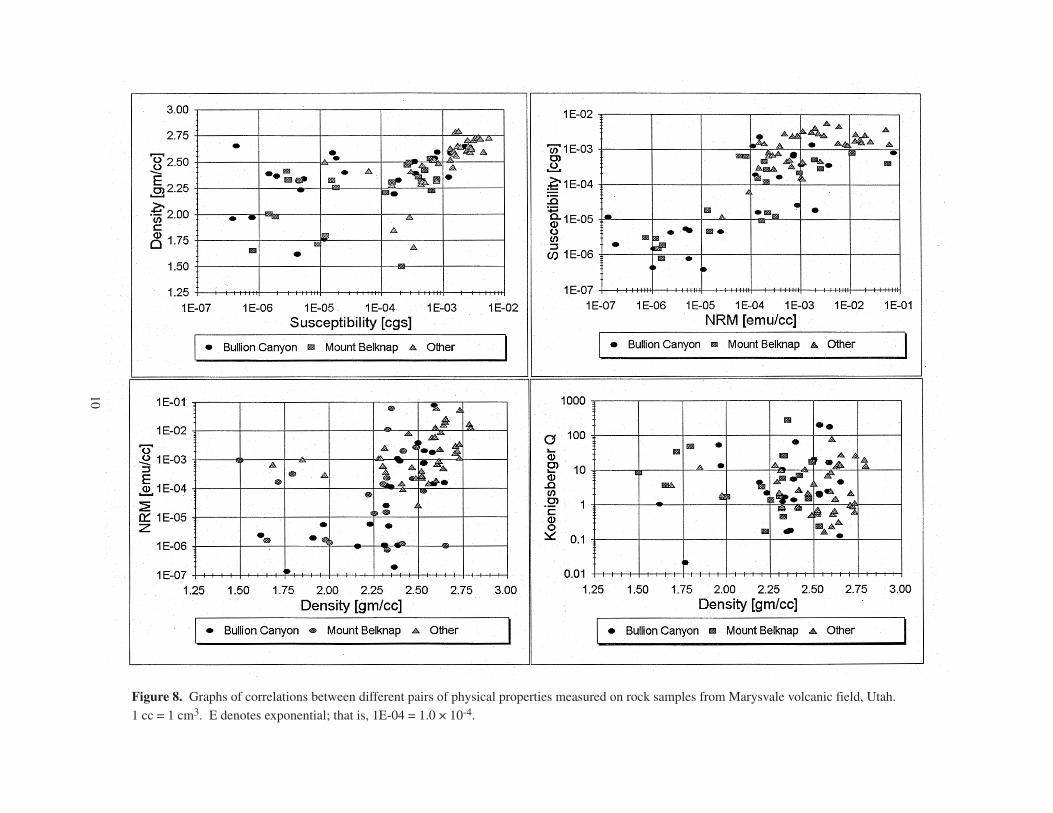
Figure 8. Graphs of correlations between different pairs of physical properties measured on rock samples from Marysvale volcanic field, Utah.
1 cc = 1 cm3. E denotes exponential; that is, 1E-04 = 1.0 × 10⁻⁴.
10
11
susceptibility, log Q correlates to some extent with m+SE, and m+SD in table 5 represent appropriateboth (r=0.51 and 0.62 for log NRM and r=-0.09 and antilogs. -0.31 for log susceptibility; not shown on fig. 8). Figure 9 presents bar-and-box charts to show
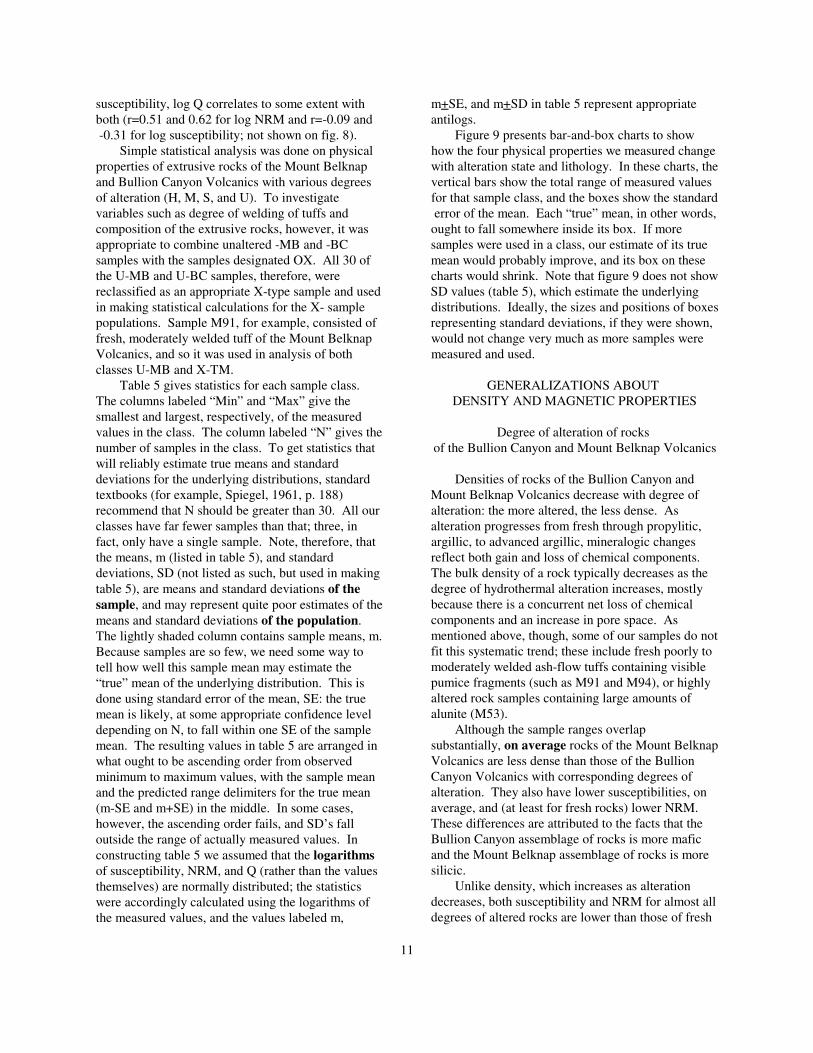
Simple statistical analysis was done on physical how the four physical properties we measured changeproperties of extrusive rocks of the Mount Belknap with alteration state and lithology. In these charts, theand Bullion Canyon Volcanics with various degrees vertical bars show the total range of measured values of alteration (H, M, S, and U). To investigate for that sample class, and the boxes show the standardvariables such as degree of welding of tuffs and error of the mean. Each “true” mean, in other words,composition of the extrusive rocks, however, it was ought to fall somewhere inside its box. If moreappropriate to combine unaltered -MB and -BC samples were used in a class, our estimate of its truesamples with the samples designated OX. All 30 of mean would probably improve, and its box on thesethe U-MB and U-BC samples, therefore, were charts would shrink. Note that figure 9 does not showreclassified as an appropriate X-type sample and used SD values (table 5), which estimate the underlying in making statistical calculations for the X- sample distributions. Ideally, the sizes and positions of boxespopulations. Sample M91, for example, consisted of representing standard deviations, if they were shown,fresh, moderately welded tuff of the Mount Belknap would not change very much as more samples wereVolcanics, and so it was used in analysis of both measured and used.classes U-MB and X-TM.
Table 5 gives statistics for each sample class. GENERALIZATIONS ABOUT The columns labeled “Min” and “Max” give the DENSITY AND MAGNETIC PROPERTIESsmallest and largest, respectively, of the measuredvalues in the class. The column labeled “N” gives the Degree of alteration of rocks number of samples in the class. To get statistics that of the Bullion Canyon and Mount Belknap Volcanicswill reliably estimate true means and standarddeviations for the underlying distributions, standard Densities of rocks of the Bullion Canyon andtextbooks (for example, Spiegel, 1961, p. 188) Mount Belknap Volcanics decrease with degree ofrecommend that N should be greater than 30. All our alteration: the more altered, the less dense. Asclasses have far fewer samples than that; three, in alteration progresses from fresh through propylitic,fact, only have a single sample. Note, therefore, that argillic, to advanced argillic, mineralogic changesthe means, m (listed in table 5), and standard reflect both gain and loss of chemical components. deviations, SD (not listed as such, but used in making The bulk density of a rock typically decreases as thetable 5), are means and standard deviations of thesample, and may represent quite poor estimates of themeans and standard deviations of the population. The lightly shaded column contains sample means, m. Because samples are so few, we need some way totell how well this sample mean may estimate the“true” mean of the underlying distribution. This isdone using standard error of the mean, SE: the truemean is likely, at some appropriate confidence leveldepending on N, to fall within one SE of the samplemean. The resulting values in table 5 are arranged inwhat ought to be ascending order from observedminimum to maximum values, with the sample meanand the predicted range delimiters for the true mean(m-SE and m+SE) in the middle. In some cases,however, the ascending order fails, and SD’s falloutside the range of actually measured values. Inconstructing table 5 we assumed that the logarithmsof susceptibility, NRM, and Q (rather than the valuesthemselves) are normally distributed; the statisticswere accordingly calculated using the logarithms ofthe measured values, and the values labeled m,
degree of hydrothermal alteration increases, mostlybecause there is a concurrent net loss of chemicalcomponents and an increase in pore space. Asmentioned above, though, some of our samples do notfit this systematic trend; these include fresh poorly tomoderately welded ash-flow tuffs containing visiblepumice fragments (such as M91 and M94), or highlyaltered rock samples containing large amounts ofalunite (M53).
Although the sample ranges overlapsubstantially, on average rocks of the Mount BelknapVolcanics are less dense than those of the BullionCanyon Volcanics with corresponding degrees ofalteration. They also have lower susceptibilities, onaverage, and (at least for fresh rocks) lower NRM. These differences are attributed to the facts that theBullion Canyon assemblage of rocks is more maficand the Mount Belknap assemblage of rocks is moresilicic.
Unlike density, which increases as alterationdecreases, both susceptibility and NRM for almost alldegrees of altered rocks are lower than those of fresh
Figure 9. Graphs of statistical means (boxes) and extremes (bars) for physical properties measured on rock samples from Marysvale volcanic field, Utah.
Single line denotes only one sample in the class. Abbreviations are explained in table 3. 1 cc = 1 cm3. E denotes exponential; that is, 1E-04 = 1.0 ×1 0-4.
12
13
rocks by at least a factor of 10. Bullion Canyon Composition of intrusive rocksVolcanic rocks that are only slightly altered, however,must be exempted from this statement: they have Although their ranges overlap, on average,susceptibility and NRM values that are comparable to density, susceptibility, and NRM all increase slightlythose of fresh Mount Belknap Volcanic rocks. As as one proceeds from intrusive rhyolites, throughwith density, these differences may reflect general granite, to monzonites (table 6). This is as expecteddifferences in composition between the two rock from increasing mafic indices and the higher iron andassemblages. For most rocks in this suite, mafic magnesium contents of monzonites.index will correlate with magnetite content, which, in Intrusive rocks have generally higherturn, will account for most of the magnetic properties. susceptibility and lower Q (especially granite) thanAs the degree of alteration increases, magnetite most extrusive ones. Their lower Q probably reflectsbecomes oxidized to hematite or hydrated to limonite. their slower cooling; hence, larger crystals and inter-This magnetite conversion presumably is complete in crystal magnetic domains. Big magnetic domains thatall moderately and highly altered samples but may are not pinned by crystal boundaries are moreonly be incipient in many of the slightly altered susceptible to growth by magnetic induction.Bullion Canyon Volcanic rock samples. We see that,except for slightly altered Bullion Canyon Volcanics, Degree of welding of tuffsall altered volcanic rocks in the study area haverelatively low magnetizations compared with fresh On average, both density and susceptibility ofvolcanic rocks. Therefore, we expect areas tuffs increase markedly with their degree of welding,containing large amounts of altered rocks to show and NRM probably increases somewhat (table 6). lower anomalies on an aeromagnetic map than will Tuffs, like other rapidly cooled volcanic rocks fromareas of fresh volcanic rocks. the Marysvale volcanic field, have generally high Q.
There is only one sample (M223) in class M-MB, and both its susceptibility and NRM are very Composition of extrusive rockshigh compared to those of other altered samples. TheM223 chip resembles an altered rhyolite, for it is On moving from extrusive rhyolites, throughbleached a uniform white. Examination of the sample intermediate-composition extrusive rocks, to mafic-with a hand lens, however, shows that it contains composition extrusive rocks, susceptibility and NRMmany tiny fragments of a black mineral. We infer substantially increase, and density moderatelyfrom the high values of susceptibility and NRM for increases (table 6). Again, this is in line withsample M223 that this mineral is finely disseminated increasing mafic index and likely correspondingmagnetite. increase in magnetite content. The mafic extrusive
Koenigsberger ratios, Q, do not vary in any clear rocks (class X-B) have, on average, the highestway with degree of alteration. This does not change density, susceptibility and NRM of all the rockour conclusion that altered rocks have negligible classes analyzed. magnetizations, however: if both NRM andsusceptibility are negligibly small (as in most altered Koenigsberger ratiosunits), then the rock is effectively nonmagnetic and itsQ is irrelevant. Most of the above generalizations agree with
In interpreting gravity and magnetic maps it can what we expect from general principles, and so arebe useful to have a framework of “typical” values of reassuring but not surprising. Probably the mostphysical properties to refer to, however imprecise. Such typical values for rocks in the study area arelisted in table 6. Table 6 must be used cautiously, inconjunction with the fuller set of values in table 5,and with the clear realization that the underlyingsuites of rocks vary continuously with respect todegree of alteration and composition. Ourclassifications have broken these underlyingcontinuums into useful subgroups, but they arearbitrary.
important lesson from figure 8 is that, on average, allvolcanic rocks from the Marysvale volcanic fieldhave high Q, generally in the range from 2 to 10. Their remanent (paleomagnetic) magnetizations, inother words, will be 2-10 times stronger than thosearising through induction by the present-day Earth’sfield. Hence, the magnetization directions that werefrozen into the rocks when they cooled may still beprevalent today, overpowering the inducedmagnetizations that align with the direction of thepresent Earth’s field. We were not able to measure
14
these directions, for our samples were not oriented. attempt to correct possible blemishes by furtherIn principle, the vector sum of the two magnetizations processing.in high-Q rocks could point in any direction. In Figure 10 (map sheet) is a key to map A, showingpractice, however, Tertiary volcanic rocks in the the aeromagnetic data in color-shaded relief form. InWestern United States tend to have net magnetization this presentation, the aeromagnetic map is treated as adirections that are roughly aligned either with thepresent Earth’s field direction (normal magnetizationdirection) or against it (reversed magnetizationdirection; see, for example, Bath, 1968). DuringOligocene through Holocene time, the Earth’s fieldhas been reversed about half of the time (GeologicalSociety of America, 1984), so that reversedmagnetizations should be common. This means thatextreme lows on the aeromagnetic map, particularly ifthey fall over thick flow sequences, likely reflectreversed magnetizations in those flows.
SOURCES OF GEOPHYSICAL DATA
AEROMAGNETIC DATA SOURCE
The aeromagnetic data shown on map A (mapsheet; U.S. Department of Energy, 1982) werecollected by Geodata International, Inc., undercontract with the U.S. Department of Energy (DOE)as part of the National Uranium Resource Evaluation two places on the map (strip A and strip B on fig.(NURE) program. Nominal survey altitude was 122 10) where apparent leveling problems persist. Bothm above ground level. The flight lines were oriented involve two or more adjacent flight lines that appeareast-west at a nominal line spacing of 400 m; three to be properly leveled with respect to each other, butnorth-south tie lines were spaced 12-20 km apart. The main purpose of the survey was to collectdetailed spectrometric radiometric data over theMarysvale volcanic field, an area of many uraniumprospects. As for most NURE studies, aeromagneticdata were collected incidentally to the radiometricdata. The radiometric data have been reprocessedand presented at 1:100,000 scale by Schutter andothers (1989). This NURE survey area is almost, butnot quite, the same as the area of the companiongeologic map by Rowley and others (in press); so asto facilitate comparison with that geologic map, thearea of map A was made coincident with it. Thecolored part of the map shows the NURE survey area.
The aeromagnetic data on map A are thosesupplied to DOE by the contractor. The close line-spacing of the original survey, the sensitivity of themagnetometer used to collect the data (thought to be1-2 nanotesla, nT), and the wide range of observedmagnetic fields in the study area make for a goodlevel of detail on this data set. In order to preservesuch detail insofar as possible, we felt it best to showcontractor-supplied survey data on map A, and not
topographic surface, and is illuminated by acomputer-driven “sun” that casts shadows. The sunin figure 10 is at an elevation of 60( and azimuth of180(. The scene is illuminated from due south, inother words, perpendicular to the flight lines, anorientation that highlights certain blemishes in thedata set. In particular, this orientation will show upproblems in “leveling” the flight lines. If the surveyaircraft flies too high, the aeromagnetic fields itmeasures will be somewhat weaker than if it were atcorrect altitude; if too low, they will be somewhatstronger. To correct for this, data from each flightline are shifted down or up (leveled) so that the finalcomposited survey will show fields that varysmoothly from one flight line to the next. Imperfectleveling will show up as shadows along flight lines ona color-shaded-relief map.
Figure 10 shows some flight-line shadowing; thisalerts us to be wary of apparent east-west-alignedfeatures on map A, which may be caused all or in partby flight-line-related artifacts. In particular, there are
that seem to have field values that are too low (stripA) or high (strip B) with respect to nearby flightlines.
Strip A (fig. 10) extends from the southern partof the Mount Belknap caldera east to the south-central Marysvale Valley. This strip appears to havebeen misleveled such that fields along it came outsome 25-50 nT (that is, 1-2 color contours on map A)low. In particular, one should mentally discount theobvious east-west-trending aeromagnetic gradients atabout lat 38(23' N. connecting the low in the southernpart of the Mount Belknap caldera with that in theMarysvale Valley. No such feature occurs on anearlier aeromagnetic map of the area (see below), soit is almost certainly a data-processing artifact.
Strip B (fig. 10) extends from the northernmostapex of the Mount Belknap caldera eastwards forabout 15 km. Fields in this strip appear to be as muchas 50-100 nT (that is, 2-4 color contours on map A)too high. The east-trending band of lows just southof strip B (labeled “rn”; discussed below) appears onan earlier aeromagnetic map that had north-southflight lines (Campbell and others, 1984), so we may
15
infer that it is strip B that is misleveled, rather thanthe rn low. High Y appears on both maps, so it is notclear whether the strip B mislevel extends that far to �g [mGal] = 41.89 T [km ] �' [g/cm ].the east. This interpretation is complicated, however,because the older map does show a minor highelongated to the east in about the middle third of stripB, and a corresponding high is seen to extend abovelocal magnetic background on map A. Thus not all ofthe strip B high can be attributed to data-processing large anomalous body, however, this geometricalartifacts. Nevertheless, one probably should factor nearly equals 1.00, so the formula can be useddisregard the sharp east-west-trending aeromagnetic to estimate the body’s thickness, T. The densitygradients on map A that define the north and south difference, �', represents the density of the bodyedges of strip B.
GRAVITY DATA SOURCES
Map B (map sheet) is a complete Bouguergravity anomaly map of the study area, and figure 11(map sheet) is a key to features on map B that arediscussed herein. Map B was made using more than2,300 gravity stations from the U.S. GeologicalSurvey gravity files. In making complete Bouguergravity maps, one must correct for the gravitationalattraction of rocks under and near each gravitystation. Such corrections assume a constant densityvalue for all rocks in the study area, ideally thedensity of the “average” rock there. For regionalgravity maps, it is customary to use a reductiondensity of 2.67 g/cc— the density of average crustalrocks. That density, however, is too high for rocks ofthe Marysvale volcanic field (fig. 7). Instead, areduction density of 2.40 g/cm was used in making3
map B.Map B may be compared with gravity maps of
the Richfield sheet (Cook and others, 1981) and ofthe state of Utah (Cook and others, 1975, 1989). Amajor characteristic of such regional gravity maps isthat they strongly reflect basins (as gravity lows) andranges (gravity highs). By making appropriateassumptions (Jachens and Moring, 1990), othergravity maps may be derived in which this basin-and-range effect is much reduced. Such “basementgravity” maps let us see gravity features that mayhave been masked by basin-and-range signatures (seeSaltus and Jachens, 1995).
Bouguer slab formula
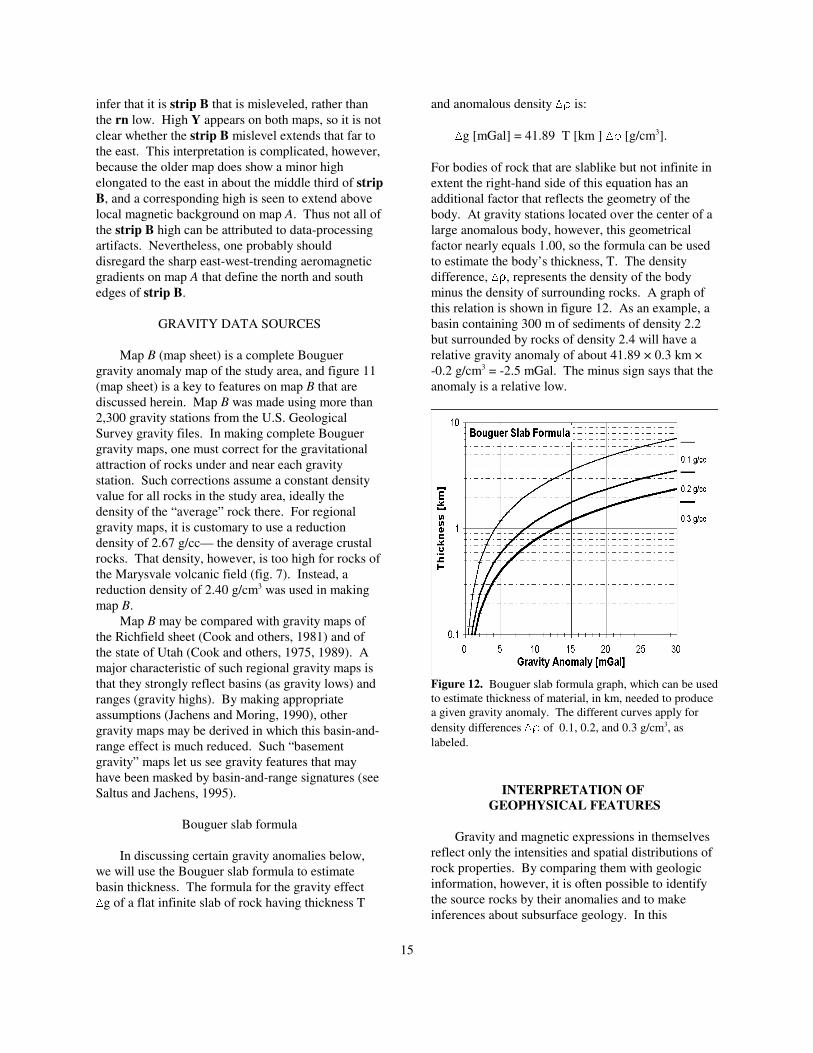
In discussing certain gravity anomalies below,we will use the Bouguer slab formula to estimatebasin thickness. The formula for the gravity effect �g of a flat infinite slab of rock having thickness T
and anomalous density �' is:
3
For bodies of rock that are slablike but not infinite inextent the right-hand side of this equation has anadditional factor that reflects the geometry of thebody. At gravity stations located over the center of a
minus the density of surrounding rocks. A graph ofthis relation is shown in figure 12. As an example, abasin containing 300 m of sediments of density 2.2but surrounded by rocks of density 2.4 will have arelative gravity anomaly of about 41.89 × 0.3 km × -0.2 g/cm = -2.5 mGal. The minus sign says that the3
anomaly is a relative low.
Figure 12. Bouguer slab formula graph, which can be usedto estimate thickness of material, in km, needed to producea given gravity anomaly. The different curves apply for density differences �' of 0.1, 0.2, and 0.3 g/cm , as3
labeled.
INTERPRETATION OF GEOPHYSICAL FEATURES
Gravity and magnetic expressions in themselvesreflect only the intensities and spatial distributions ofrock properties. By comparing them with geologicinformation, however, it is often possible to identifythe source rocks by their anomalies and to makeinferences about subsurface geology. In this
16
overview of the Tushar Mountains area, we focus on are observable as single fractures, but elsewhere theymajor features of the geologic (Rowley and others, in mark the approximate position of major displacementpress; figs. 5 and 6), gravity (map B), and magnetic within a broader zone of distributed offsets. Other(map A) maps. major zones are inferred from geophysical data rather
THREE GRAVITY AND MAGNETIC DOMAINS: of dots on the overlay map (fig. 6).A GENERALIZED DESCRIPTION
Broadly speaking, the study area can be dividedon the basis of gravity and aeromagnetic maps into The Pavant Range, which occupies the north-three east-northeast-trending geophysical domains central part of the map area north of the Clear Creek(fig. 5). The southern domain includes about one- downwarp and west of the Elsinore and Dry Washsixth of the study area and is an area of “birdseye” faults (figs. 4 and 6), consists of a south- to southeast-magnetics (closely interspersed highs and lows) and dipping homocline of volcanic rocks. Dips in themoderate gravity values. The central domain homocline vary from only a few degrees south in theincludes about half of the study area and is an area of vicinity of the Three Creeks caldera to as much asgenerally high magnetic values and low gravity 15( southeast adjacent to the Elsinore fault. Thevalues. The northern domain includes the remaining homocline formed in latest Miocene time (7-5 Ma)one-third of the study area and is characterized during the main pulse of basin-and-range tectonism ingenerally by very low magnetic values and by gravity this part of Utah (Rowley and others, l98l), when ahighs (more precisely, a southeasterly decreasing dome some 80-l00 km across was pushed up. Thisgravity gradient). These three domains generally dome, now collapsed, includes the Pavant Range andreflect pre-basin-and-range tectonic and magmatic adjacent areas to the west and northwest (T.A. Stevenactivity. Superposed on these domains are north- or and H.T. Morris, unpub. data, 1985); the Pavantnorth-northeast-trending features; on the gravity map range homocline represents its southern flank.these generally reflect basin-and-range tectonic The Pavant Range homocline is reflected in theevents, but on the magnetic map they are largely due gravity data (map B) by a relatively smooth gravityto boundaries of calderas that occupy the central gradient that decreases from about -l65 mGal near thedomain. northwest corner of the study area to about -200 mGal
The low gravity area of the central domain is part near the southeast margin of the homocline.of a regional low that contains some of the lowest Regionally, this gradient follows the southeast flankcomplete Bouguer gravity anomaly values in Utah of the Pavant Range for a distance of at least 100 km,(Cook and others, l975, l98l, 1989; Halliday and between the towns of Gunnison and Sulphurdale; it isCook, l980). This gravity low corresponds to the relatively insensitive to topography, to the differencesMarysvale volcanic field. Similar features in between volcanic and sedimentary bedrock, or to theColorado having corresponding outcrops of Tertiary presence or absence of significant alluvial fill. Thisextrusive and intrusive rocks have been interpreted to regional-scale gravity gradient is thus presumed toindicate the distribution of underlying batholiths reflect a major deep-seated source. In a review of(Plouff and Pakiser, l972; Tweto and Case, l972). regional geophysical parameters extending nearly
BASIN-AND-RANGE FEATURES interpreted this gradient to reflect the southeastern
Several major basin-and-range fault zones in the thinning has brought dense subcrustal rocks up tostudy area are reflected on gravity and magnetic shallower levels. This interpretation accounts notmaps. These fault zones were especially active in only for the gravity gradient associated with thelatest Miocene time, 8-5 Ma (Rowley and others, Pavant Range, but also for the doming and concurrentl98l), when the present fault-block topography collapse of the distended near-surface rocks over aformed in this part of the High Plateaus. Extensional large area of regional gravity highs located to thetectonism at this time formed a welter of faults northwest of the study area.throughout the study area (fig. 6); here we areconcerned only with the major zones, those thatbound major mountain masses or deeply subsidedbasins. Some of the major zones shown on figure 6
than from surface geology. These are shown by lines
Pavant Range homocline
across Utah, Thompson and Zoback (l979)
edge of an area in west-central Utah where crustal
17
Clear Creek downwarp, tilted body of Miocene (l5-7 Ma) fluvial andDry Wash and Cove Fort faults lacustrine sediments of the Sevier River Formation
The Clear Creek downwarp (fig. 6) is an east-trending, broad faulted syncline that extends betweenthe Pavant Range and the Tushar Mountains. Thisfeature had a long and complex history ofdevelopment, extending from middle Oligocene atleast to the end of the Miocene, so that it may predatedevelopment of the Pavant Range homocline, whichnow forms the northern limb of the syncline. Themajor Clear Creek downwarp displacement shown bysurface geology took place during basin-and-rangetectonism in latest Miocene time. Some of the gravityand magnetic trends within this downwarp do nothave clearly recognized counterparts in the mappedgeology, and they may reflect buried discontinuitiesrelated to the development of the downwarp.
The surface manifestations of the Clear Creekdownwarp begin at its eastern end as a curvingcontinuation of the Dry Wash fault. The Dry Washfault bounds the southeastern margin of part of thePavant Range homocline, and it is one of a series ofnortheast-striking, oblique slip (normal and left-lateral) faults (Anderson and Barnhard, 1992) alongthe west side of a deep fault trough between theupfaulted horst blocks of the northern Sevier Plateauand the Pavant Range (discussed in the next sectionof this report). The Dry Wash fault dips northwestand splits the fault trough into tilted blocks, whereasother faults farther north (for example, the Elsinorefault) dip east and define the west flank of a graben.The Dry Wash fault extends southwest from ClearCreek across the trend of the Clear Creek downwarpand dies out as shown on figure 6. (See discussion ofRed Narrows area, below.)
At the east end of the Clear Creek downwarp, themajor geologic displacement consists of an enechelon line of steep monoclines, down to the north. These monoclines end abruptly on the westapproximately at The Narrows against a northeast-trending fault or fault zone (TNFZ on fig. 6); fartherwest the downwarp consists of a broad, open synclinethat can be recognized to the crest of the mountains. From this point westward, the trend is marked by theCove Fort fault, which formed before 23 Ma and thuswas not part of the main late Miocene pulse of basin-and-range tectonism.
Gravity and magnetic trends along the ClearCreek downwarp reflect some of the geologic featuresdescribed above. Deep gravity and magnetic lowsjust northwest of the northern part of Dry Wash fault(the Joseph Flats low, jf on figs. 10 and 11) reflects a
(Rowley and others, 1994). While the jf gravity lowprobably reflects low-density Sevier River Formationsediments under Joseph Flats, the jf magnetic lowmay reflect more than merely nonmagnetic sediments. In particular, it is not erased by RTP processing (fig.3), arguing that reversed-polarity volcanic flows(tuffs?) may floor the Joseph Flats half-graben andother regions to the west.
For much of its length, the Dry Wash fault isinferred to lie between the jf gravity and magneticlows and the NDWF highs (figs. 10 and 11) that areadjacent to the southeast. Highs NDWF and itscontinuation, DWF, arc southwestward, continuing toapproximately mark the southern boundary of theClear Creek downwarp from where it passes underthe Dry Wash fault, on the east, to within about 2 kmof The Narrows, on the west. This suggests that themapped en echelon monoclines in this region may benear-surface responses to displacement on a singledeep-seated, north-side-down zone of displacement. The western edge of this downthrown block probablylies along the same north-northeast-trending normalfaults that truncate the homoclines (TNFZ, fig. 6);they also truncate magnetic low tn (and its buriedreversed-polarity flows?) on the west. Like the JosephFlats block, this downthrown block may also containlow-density sediments, reflected by gravity low tn onfigure 11. West of TNFZ, where the Clear Creekdownwarp is expressed as a broad syncline, themagnetic signature is less-well defined, but may bereflected by an arcuate set of magnetic highs, CCDon figure 10. Highs CCD may reflect normal-polarity flows in the trough of the syncline, whosesurfaces are sculpted by topography. Gravity featuresin this segment include a minor high (CC on fig. 11),but are poorly controlled by too-sparse gravitystations (map B). Furthermore, the southern part ofthe Pavant Range regional gravity gradient mayobscure local subtle gravity signatures here.
Sevier fault zone and related fault trough
A deep structural and topographic troughbetween the northern Sevier Plateau and the PavantRange enters the northeastern part of the map area(Sevier Valley, fig. 4). This trough extends south-southwest to opposite the trend of the Clear Creekdownwarp, and then bends south, continuing to thesouthern edge of the map area. It is approximatelybounded by the Sevier fault zone (fig. 6) on the east,
18
and by the Tushar fault, Dry Wash fault, Elsinore caldera to the east and Mount Belknap Volcanics tofault, and their extensions (fig. 6) on the west. the west—affect the geophysical signature of theDifferent segments of the trough show different central part of the structural trough. The Monroegravity and magnetic configurations, and these will be Peak caldera (fig. 6) has been traced westward acrossdescribed in sequence from north to south. The the eastern boundary fault (Sevier fault zone) nearlyMarysvale Valley (fig. 4), between the Tushar and to the western margin of the structural trough in theMarysvale Valley faults (fig. 6), is then discussed central part of the map area (Cunningham and others,separately. 1983; Rowley and others, 1986a,b, 1988a,b).
At its north end, between the Elsinore and Sevier Caldera rocks are widely exposed throughout this partfaults (fig. 6), the trough is a well-defined graben of the trough, and many of the outcrops are athaving a significant thickness of alluvial fill. structural and stratigraphic levels comparable to thoseAbundant gravity stations define a deep low (about exposed in the eastern part of the caldera, high in the25 mGal, nsv, fig. 11) that has sharp marginsreflecting the graben's border faults. Assuming thedensity difference between horst rocks and graben fillis 0.3 g/cm , the Bouguer slab formula (fig. 12)3
predicts as much as 2,000 m of sediments there. Magnetic data show a broad, featureless low overmost of the graben. Broad magnetic highs within thegraben near its eastern boundary fault (the Sevierfault zone) may be due to magnetic sediments in west of the fault zone is a broad gravity low (csv, fig.alluvial fans at the mouths of streams draining the 11). This point is further discussed in the “Calderas”highlands to the east and southeast. This segment of section, below.the Sevier fault zone is clearly defined on the The Sevier fault zone continues south from themagnetic map by the western edge of a deep low on Monroe Peak caldera area as a clearly definedthe Sevier Plateau (tcl, fig. 10). Surface geology overmost of tcl consists of a jumble of small fault blocksthat make up the Thompson Creek landslide. Low tclprobably reflects volcanic rocks having strongreversed remanent magnetization. The Three Creeksmember of the Bullion Canyon Volcanics that cropsout there has at least one subunit that was found bypaleomagnetic measurements to be reverselypolarized (the Wah Wah Springs Tuff of Caskey andShuey, 1975). Some of the tuffs there weredownslumped in the Thompson Creek landslide, buttheir consequent reorientations were probably limitedto a few tens of degrees, not enough to greatly changetheir general (reversed) aeromagnetic signature. Additional reversed-polarity units may also bepresent at depth.
Farther south, where the northwest-dipping DryWash fault marks the western margin of a tiltedintratrough fault block, the exposed low ridge ofbedrock in the footwall of the fault is marked by a (ELB, fig. 11), by the adjacent gravity low to the eastlow linear gravity high (NDWF, fig. 11) and by a (elb, fig. 11), and by an elongated gravity low thatlarger triangular-shaped magnetic high (NDWF, fig.10). Magnetic high NDWF probably reflects volcanicsequences such as the Joe Lott Tuff Member (Tmj,table 2) that crop out in the low footwall ridge ofbedrock and that are probably present beneathsurficial alluvium in the valley to the east.
Rocks from nearby sources—Monroe Peak
northern Sevier Plateau. Source intrusions of theMount Belknap Volcanics (Tmi, table 2) also occupysome of the western part of the Monroe Peak calderaarea. These relations suggest that density differencesacross the eastern margin of the fault trough shouldbe minor. Nevertheless, the trend of the Sevier faultzone and the related trough west of it are quite clearon map B, for the whole western third of the caldera
topographic scarp. A narrow, linear magnetic low(sfz, fig. 10) marks part of this segment of the faultzone. The gravity low (labeled ssv for this portion ofits length, fig. 11) continues from the north, followingthe structural trough, and reflecting alluvial fill in thevalley between the fault zone and a medial bedrockridge that is centered in the downfaulted trough formost of its length in the southern half of the map area.
Near the southern margin of the map area theregional fault trough is less sharply defined by gravityand magnetic data, although still quite apparent in thetopography. The fault zones along the eastern andwestern margins are broader and more diffuse, andmany slivers of bedrock cut by numerous dispersedfaults crop out in the eastern half of the trough. Thedeepest part of the trough is near its western margin. These relationships are mirrored in the gravityconfiguration by a gravity ridge that correlates withthe topographic ridge in the center of the trough
parallels the western margin of the trough andcontinues off the southern edge of the study area (pr,fig. 11).
The structural trough near the southern margin ofthe map area loses definition in the magnetic datawithin the area of dispersed faults. The magneticbirdseyes here reflect volcanic flows, with the highest
19
amplitude birdseyes (ELB, fig. 10) coinciding withbasalt units.
Marysvale Valley block expression, and a relative gravity high (SBV, fig. 11)
A downfaulted block occupies the western part alluvium. This alluvial fill is cut by a braided seriesof the structural trough in the central part of the map of Pleistocene-Holocene faults of small displacementarea between the Tushar fault on the west and theMarysvale Valley fault on the east (fig. 6). Thisblock is very deeply downfaulted at its southern endbut only slightly so at its northern end. It is filledwith a thick accumulation of fluvial and lacustrinedeposits of the Miocene Sevier River Formation andwith Quaternary alluvium. This alluvial filldepositionally onlaps the early to middle Miocenerhyolite lava flows of the Mount Belknap Volcanicsexposed in the northern part of the basin. A deepgravity low (mv, fig. 11) clearly reflects this alluvial of it, have magnetic expression, with the exposedfill and suggests it is thickest in the southern two- volcanic rocks in the footwall being expressed by athirds of the basin. Low mv is about 25 mGals deep.Assuming the density of sediments in the MarysvaleValley is some 2.00 g/cm and that of surrounding pattern of anomalies. In particular, magnetic low br3
rocks is about 2.40 g/cm , the Bouguer slab formula (fig. 10) falls over mafic volcanic rocks of Miocene3
(fig. 12) predicts about 1,500 m of alluvial fill there. age that cap Black Ridge (Tpm, table 2; sampleThe magnetic configuration (map A) shows birdseyes M824, table 1); we infer these rocks to carry reversedover lava flows in the northern Marysvale Valley, but magnetic polarity.a relatively featureless low (mv, fig. 10) over thealluvium in the south, consistent with the expectedsignature of weakly magnetized alluvium.
Sulphurdale-Sheeprock fault zone
A complex zone of en echelon faults bounds thewest side of the Tushar Mountains (fig. 4), just withinthe western margin of the map area (fig. 6). For themost part, these faults separate mountainous bedrockareas from alluviated valleys to the west. Thecontrast in densities is reflected by a linear gravitygradient along the trend of the Sulphurdale fault (sul,fig. 11). The eastern flanks of a basaltic andesiteshield volcano centered just off the western margin ofthe map area give rise to the minor gravity highlabeled SV (compare sample 79-S-44B). Near thenorth end of the Sulphurdale fault, bedrock isexposed on both sides of the fault and its gravityexpression disappears. Alluvium-filled valleys aremore prominent southward, where the gravity lowwest of the fault deepens.
The Sheeprock fault bounding the east side ofBeaver Valley farther south is marked by aprominent, low topographic scarp along the westmargin of the Tushar Mountains. Near the north endof the fault a gravity low (bv, fig. 11) marks an area
of late Miocene rhyolite lava flows and alluvial valleyfill in Beaver Valley (Evans and Steven, 1982). Farther south the mapped fault loses gravity
extends out to the west-southwest over valley fill
(Machette and others, 1984) along SBV. Theserelations probably indicate that a shallow shelf ofbedrock underlies thin valley fill just west of theSheeprock fault and that a buried scarp farther westseparates this shelf from thicker fill in the center ofBeaver Valley. Note, though, that there are fewgravity stations near the southern two-thirds of theSheeprock fault to control the fields shown there.
Parts of the Sheeprock fault and, even more, theunnamed en echelon border fault south and southeast
pattern of birdseye anomalies and the alluviated areasin the hanging wall by a broader and more simple
CALDERAS
The study area includes five calderas that formedin response to ash-flow eruptions (Steven, Rowley,and Cunningham, l984; figs. 5 and 6). From oldest toyoungest, these are the Three Creeks caldera (about27 Ma), Big John caldera (about 23 Ma), MonroePeak caldera (about 23 Ma), Mount Belknap caldera(about 19 Ma), and Red Hills caldera (about 19 Ma;Steven, Rowley and Cunningham, 1984). Three ofthem are marked by subtle-to-strong gravity lows,whereas their magnetic expressions are variable.
Three Creeks caldera
The Three Creeks caldera in the northwesternpart of the map area (Steven, l98l; fig. 6) underliespart of a local high on the relatively smooth gravitygradient of the Pavant Range, described above. Agravity terrace on a 1:250,000-scale regional gravitymap (Cook and others, l98l) was interpreted bySteven, Rowley, and Cunningham (l984, fig. 9) toreflect a relatively dense source pluton atconsiderable depth whose more silicic cap had beenexpelled by the ash-flow eruptions that led to calderacollapse. The data on map B show this gravity
20
terrace as a crescentic concave-north high (CC, fig.11) that is mostly outside the topographic wall of thecaldera. Part of the gravity terrace may reflect theClear Creek downwarp (above), and, at any rate,gravity stations in this area are too sparse to define itsdetails. A similar configuration was described bySteven (l989) for the Crystal Peak caldera l00 km tothe northwest, where a gravity anomaly associatedwith the caldera exceeds the dimensions of thesubsided block and was interpreted to reflect a largersource magma chamber.
The Three Creeks caldera has no clear magneticexpression (map A). If there were a pluton below thecaldera, we would expect it to have normal magneticpolarity, so as to give rise to a local magnetic high. No such magnetic high is seen, however. Themagnetic signature of a large area north of the ClearCreek downwarp (TC, fig. 10), including the ThreeCreeks caldera area, consists of local magnetic highsthat follow topographic highs and especially deepmagnetic lows that follow topographic lows (comparefigs. 4 and 10 to see this correlation). We interpretthat the local magnetic highs must be due to normal- (features BC, discussed below), whereas thickerpolarity flows of Bullion Canyon Volcanic rocks that sequences of (unaltered) bimodal assemblageare exposed at the surface and are sculpted by that extrusive rocks (Mount Belknap Volcanics) lead totopography. The extreme lows that fall over the higher amplitude magnetic birdseyes. deeper valleys incised into the Pavant Range arguethat in these places the streams have cut away most of Monroe Peak calderathe normal-polarity rocks and have nearly exposedreversed-polarity units underneath. The Monroe Peak caldera occupies the east-
Big John caldera
The Big John caldera, in the southwestern part ofthe study area, is a shallow trapdoor-type subsidencestructure having a west-facing topographic wall alongits eastern side (Steven, Cunningham, and Anderson,l984). A broad, shallow gravity trough (bj, fig. 11)extends north-northwest across the eastern part of thecaldera, parallel to the topographic wall and in thegeneral position of deepest subsidence. The westernmargin of the caldera is an obscure hingeline, and theflank of the gravity trough appears to be similarlydiffuse in this direction. The gravity data do notindicate any specific intrusion occupying a sourcemagma chamber, which Steven, Rowley, andCunningham (l984) postulated to lie at relatively deeplevels beneath the caldera area. Gravity stationsthere, however, are too sparse to make very reliableinterpretations. Gravity low bj more clearly reflects slightly below that exposed in the eastern part of thethe presence of the subsided basin and the younger, caldera. In addition, the western one-third of thelighter fill within it; some of this fill includes caldera contains intrusive rocks of the younger Mountrelatively light rhyolitic welded ash-flow tuff of the Belknap Volcanics (Tmi, table 2) and many irregular
Mount Belknap Volcanics. What was once thenorthern part of the Big John caldera is nowobliterated by the younger Mount Belknap caldera. Gravity stations in that area are also too sparse tohelp resolve that boundary.
Magnetic anomalies in and near the Big Johncaldera are mostly low-amplitude birdseyes that makefor a mottled green pattern on map A. Although thereare moderately to highly altered rocks just outside theBig John caldera both to the east and west (fig. 5),rocks in the heart of the caldera are unaltered or onlymildly (propylitically) altered (Cunningham, Steven,Rowley, and others, 1984). Exposures within thecaldera are a complex mix of intermediate-composition lava flows (Tbc, table 2) and post-caldera rhyolite welded tuff (Tmj, table 2). Correlation between map B and the companiongeologic map (Rowley and others, in press) showsthat this subdued birdseye pattern generally reflectsthicker sequences of Bullion Canyon Volcanicsextrusive rocks. By contrast, Bullion CanyonVolcanics intrusive rocks lead to magnetic highs
central part of the study area. In general, the area ofthe caldera is marked by subtle gravity lows (csv andmp, fig. 11). As described by Steven, Rowley, andCunningham (l984), the upper part of the calderablock consists of a cylinder of cogenetic intracalderawelded tuff more than 500 m thick; this tuff is widelyaltered, and its base has been invaded by numerousshallow plutons, some of which reached within 400 mor less of the surface. Post-subsidence lava flowsderived from these shallow intrusions covered thefloor of the caldera to local depths of as much as 400m. The eastern two-thirds of the caldera is within thenorthern Sevier Plateau, one of the major topographichighs in this part of Utah. The Sevier fault zonealong the west side of the plateau cuts across thecaldera and exposes its core in cross section over avertical distance of about l,500 m. The western one-third of the caldera exposes the upper part of thecaldera fill at a structural and stratigraphic level only
21
patches of Mount Belknap Volcanics lava flows and m high, and the gravity change across it is about 12welded tuffs. Younger alluvium is widely present in mGal. The Bouguer slab formula (fig. 12)the western part of the caldera, but only locally is it accordingly predicts a density difference of aboutmore than a few tens of meters thick. 0.19 g/cm between the juxtaposed rocks. Of
The eastern part of the caldera, in the Sevier samples collected from inside the caldera, monzonitesPlateau, is marked by a broad gravity low. Geologic from east of the fault (M569, M755, M914, andmapping based on generally good exposures shows M915) all have densities close to 2.5 g/cm , whereasthat the northern margin of the caldera is nearly samples collected west of the fault (M27A, M30,vertical and partly occupied by a postcaldera M47B, M49A, M50, M519, M522, M549, M608,monzonitic intrusion. Relatively silicic intracaldera M621, M713A, M713B, M851, M867, and M873)fill cut by a resurgent pluton is in steep contact with have widely varying densities. Five of these samplesandesitic lava flows in the caldera wall. These are altered and have densities in the range 1.617 tolithologies, though contrasting, may represent rocks 2.162 g/cm . The rest fall into two groups: Monroeof similar densities (table 6), which might lead to Peak caldera rocks, having densities in the rangeminimal gravity change at the northern caldera wall; 2.520-2.736 g/cm , and two samples (M49A andif anything, one might expect the monzonite M549) of later intrusive rocks of the Mount Belknapintrusions inside the wall to lead to slightly higher Volcanics series (Tmi, table 2), having densities ofgravity fields there. Observed gravity anomalies 2.319 and 2.291 g/cm , respectively. These latter tworange from a high of about -190 mGal just north of samples represent rocks from the eastern source areathe caldera wall to a low near -200 mGal one-quarter of the rhyolitic Mount Belknap Volcanics, whichto one-third of the way into the caldera, to the south. began intruding under the western one-third of theThere are enough gravity stations to demonstrate that pre-existing Monroe Peak caldera about 21 Mathis low exists, but they are too sparse to control its (Cunningham and Steven, 1979a; Cunningham,configuration closely. There may be a post-caldera Unruh, and others, 1998). We interpret that gravitypluton of higher density rock buried in the northernSevier Plateau immediately north of, and perhapsextending under, the Monroe Peak caldera (SP, fig. thereby. Present outcrops of unit Tmi probably11); this could be the source pluton for the represent cupolas on an extensive batholith orOligocene-Miocene volcanic rocks of Signal Park. complex of stocks (Mount Belknap Volcanics were
The south wall of the Monroe Peak caldera in the produced from this area from 21 Ma to 18 Ma, so thatSevier Plateau area is fairly well defined by gravitydata near the eastern edge of the study area, buttoward the western edge of the plateau the gravity lowextends southwest out of the area of the caldera(Cook and others, 1984). In this same area, advancedargillic alteration formed alunite deposits as much asl.2 km outside the topographic wall and perhaps asmuch as 2 km outside the structural wall of thecaldera (Cunningham, Steven, Rowley, and others,l984). This alteration could have been related to anunderlying postcaldera pluton, which also may beresponsible for the gravity low.
The western one-third of the Monroe Peakcaldera, west of the Sevier fault zone, is marked by aneven deeper gravity low (csv, fig. 11) than thatcharacterizing the caldera farther east. Although thisarea is nominally within a basin-and-range graben,caldera rocks are widely exposed. Here monzonite orother intrusions originally emplaced at depth in theMonroe Peak caldera have been juxtaposed east ofthe Sevier fault zone against rocks originallyemplaced at higher levels west of it (Rowley andothers, in press). The fault scarp here is some 1,500
3
3
3
3
3
low csv reflects such source intrusions of the MountBelknap Volcanics and rocks that were altered
more than one stock under csv is likely (Cunninghamand Steven, 1979a; Cunningham, Unruh and others,1998). These intrusions may have a density of about2.3 g/cm and have an aggregate thickness of more3
than 1,400 m. Their eastern boundary may havelocalized the position of the later basin-and-rangeSevier fault zone. A great subcircular area of high magnetic valuesat least 35 km across occupies the central part of thenorthern Sevier Plateau (CCP, fig. 10), and iscentered on and includes all of the Monroe Peakcaldera. CCP clearly reflects rocks of highmagnetization within the caldera, but it also extendsseveral kilometers both north and south of thecaldera, covering the mafic andesite volcanic centernear Signal Peak to the north and the andesitic ventfacies rocks of the Langdon Mountain volcanic centerto the south.
The magnetic high that extends across the easternMonroe Peak caldera (CCP, fig. 10) is subdued orabsent west of the Sevier fault zone. To some extent,this may reflect the altered rocks present there (fig.5). It could also reflect the above-inferred Mount
22
Belknap Volcanics source plutons under gravity low intracaldera rhyolites.csv (fig. 11). The (unaltered) Monroe Peak calderarock samples cited above have an averagesusceptibility of about 2.9× 10 cgs, while the two-3
cited samples of unit Tmi both had lowersusceptibilities, 0.79 × 10 and 0.44 × 10 cgs. If-3 -3
Tmi rocks are pervasively present at depth, theirrelatively lower susceptibilities would explain therelatively lower observed aeromagnetic values westof the central part of the Sevier fault zone.
Mount Belknap caldera
The Mount Belknap caldera, in the west-centralpart of the study area, is marked by a 10-mGalbullseye gravity low centered in its southwest-centralpart (mb, fig. 11). The caldera outline is irregular,probably as a result of caving of unstable segments ofthe oversteepened wall during collapse of the calderaabout l9 Ma. The actual subsided block is believed tobe an oval about 8 × ll km across (Steven, Rowley,and Cunningham, l984), based in part on outcrops ofwall rocks and in part on the gravity configuration. Inparticular, two outward projections of the caldera’stopographic wall, to the north and to the east, arebelieved to have resulted from caving and to beunderlain by inward-dipping walls that intersect thestructural margin at depths of 2 km or less (Buddingand others, l987). Cunningham and Steven (l979a)suggested that the underlying source magma chamberlay at shallow depths, with a top 3-4 km below the(then) surface. Gravity low mb probably reflectsthick accumulations of rhyolites in the caldera. Assuming a density difference of 0.2 g/cm between3
caldera rhyolite and underlying rocks, the Bouguerslab formula (fig. 12) predicts a thickness of about1,200 m of rhyolite in the center of the MountBelknap caldera.
An oval magnetic low (smb, fig. 10) parallels thesouth margin of the Mount Belknap caldera in thesame area where vents for voluminous intracalderarhyolite lava flows have been postulated(Cunningham and Steven, l979a). This low liesbetween, and nearly connects, two outcrops(Cunningham and others, 1983) of an intracalderastock consisting of quartz latite (Tmic, table 2;sample M251). This stock cuts nearby rhyolite units,and its fluidal texture suggests that it was forcefullyinjected. Our interpretation is that the unit Tmicstock is present under low smb, that it is nonmagneticrelative to the surrounding rhyolitic flows, and that itrepresents a relatively local dike injected from adeeper parent magma up through a fairly thick pad of
The aeromagnetic anomaly pattern in the south-central Mount Belknap caldera and in its eastern,shallower, lobe consists of low-amplitude birdseyeslike those observed over the deeper parts of the BigJohn caldera. In both cases these magnetic patternsare thought to reflect varied alteration patterns in theintracaldera rhyolite. Most samples from these partsof the Mount Belknap caldera have lowsusceptibilities, but some (compare M206, M223) areless altered and have higher susceptibilities. A zoneof altered rocks (fig. 5) was mapped (Cunningham,Steven, Rowley, and others, 1984; fig. 5) across thesouthern Mount Belknap caldera and outside it to theeast. The mapped alteration zone does not extendsouth into the Big John caldera, but otherwise itgenerally corresponds to regions of subdued magneticbirdseyes on map A. Indeed, it may be possible tooutline regions containing thick sequences of alteredrocks by looking for this characteristic aeromagneticpattern.
The magnetic pattern over the northern lobe ofthe Mount Belknap caldera also consists of birdseyes,but of higher amplitudes. Such a pattern typicallycharacterizes volcanic flows. Caldera rocks in thisarea (compare sample M859) are unaltered. Also,precaldera wall rocks may underlie this part of thecaldera at relatively shallow depths, locally adding tothe magnetic complexity.
Red Hills caldera
The small Red Hills caldera along the westernedge of the older Monroe Peak caldera is only aboutl.2 km across. A poorly controlled (by one stationonly) gravity low extends into the caldera from theMarysvale Valley low (mv, fig.11) to the south-southwest. Its magnetic signature consists of stronglocal highs on its east and west edges and broaderlows on its north and south edges.
OTHER IGNEOUS FEATURES
Sulphurdale–Cove Fort area
The area northwest of the Mount Belknap calderaand east of the Sulphurdale fault is marked by abroad, extreme magnetic high (S, for “Sulphurdalehigh,” fig. 10) and an equally broad, very deep low(cf, for “Cove Fort low,” fig. 10) to the north. Thetransition between high and low makes a steep, east-trending magnetic gradient. It is remarkable that themost prominent high and the most prominent low in
23
the study area should be so juxtaposed, and the shortly before 23 Ma (Tbci, table 2; samples M929,question arises whether they are related. In M930A,D) crop out in that area; these may coalesceparticular, could the Cove Fort low be a polarity into a single pluton at depth.effect of the Sulphurdale high? There are geothermal prospects near Cove Fort,
The first answer to this question is that low cf istoo broad and deep to be a simple polarity low fromhigh S. This is shown by the fact that low cf is notsubstantially reduced by RTP processing (figs. 2 and3). If both S and cf have a common source body,then that body is not magnetized along the directionof the Earth’s present-day field, as we supposed forthe RTP calculation.
The question then becomes whether S and cfcould be polarity pairs from a common body that ismagnetized in some other direction. Such a commonsource body would have to be large (some 15 km indiameter), and it would have to have high maficmineral content so as to give rise to such a strongmagnetization. If such a stock were present, itpresumably would be part of the Pioche-Marysvalebelt (fig. 1); hence, of Oligocene or Miocene age. Except in certain accreted terranes along the Pacificcoast, western North American stocks of similar agecommonly have paleomagnetizations of normal orreversed polarity, whereas near-zero (horizontal)paleomagnetic inclinations are rare. Furthermore,such large stocks cool slowly, giving rise to medium-or coarse-grained textures. Rocks that have suchtextures are prone to viscous remagnetization, so thattheir net magnetizations align with the present-dayfield direction, masking and replacing earliercomponents of magnetization in other directions. Paleomagnetic components in such rocks are minor, Mount Belknap caldera gravity low, mb, from thecan be recovered only with painstaking work, and extreme northwestern part of the Marysvale Valleydefinitely are not observable on aeromagnetic maps. A stock that has a net nearly horizontal magnetizationis therefore unlikely anywhere in western NorthAmerica.
We conclude that the Sulphurdale high and CoveFort low do not reflect a common source stock. Separate stocks under S and cf are still possible.According to the above argument, however, suchstocks cannot maintain a reversed polarity. Wetherefore interpret that since low cf is not reduced byRTP processing, it must arise from reversed polarityflows, rather than a stock, in this area. We haveinferred such flows to be present throughout thenorthern domain of the study area, causing lows tcl,jf, tn, and lows in area TC, as well as cf.
The Sulphurdale magnetic high (S, fig. 10) is of Sevier Canyon for 10–12 km. As discussed above,interpreted to reflect a large pluton. Several pre-caldera monzonite intrusions that were emplaced
and many solfataras and thermal springs nearby(Steven and Morris, 1983, 1986; Ross and others,1982). These thermal features probably originatefrom a cooling pluton at depth, the likely magmasource for Quaternary rhyolites and basalts that arewest of the Sulphurdale fault. Gravity high SV (fig.11) falls over one such Quaternary flow and mayreflect this source pluton, as well. Because the plutonis still cooling, those parts of it that are now belowCurie temperature should carry present-day (normal)magnetic polarity. We have not identified anyaeromagnetic features that clearly relate to such apluton, however.
Mill Creek–Red Narrows–Sevier Canyon area
Several interesting, still poorly understood,geological and geophysical features lie along and nearthe Mill Creek–Sevier Canyon streams (fig. 4) whoseheadwaters form along the northeast margin of theMount Belknap caldera. An arcuate zone of faults(labeled NEMBC, fig. 6) roughly parallels thenortheast margin of the Mount Belknap caldera. These faults may have formed in early Miocene timeby resurgent uplift of a trapdoor block including thecaldera. The NEMBC faults approximately bound onthe northeast a gravity ridge (K and contiguous areato the south-southeast, fig. 11) that separates the
low, mv. Gravity high K probably reflects the quartzmonzonite pluton that crops out there (Tbci, table 2;samples M98, M177). Gold and silver producedduring 1892–1937 in the Kimberly mining district(fig. 5) were mined from deposits near veins that cutthis pluton. The gravity ridge extending south-southeast from K may reflect intermediate-composition volcanic rocks in the wall of the calderathat occur there in an upfaulted block. Sparse gravitystations in this area keep gravity high K and thegravity ridge to the south-southeast from being wellcontrolled.
At Red Narrows (fig. 5) there is a deep, east-trending magnetic low (rn, fig. 10) whose source isunknown. Low rn extends east from the headwaters
rn is not an artifact of aeromagnetic data processing,for it appears on separate surveys flown in different
24
directions. Low rn has no explanation in surface and possibly jf.geology, which consists of extensive sedimentary Sample M874 comes from Mill Creek, and has arocks of the Sevier River Formation, the underlying density of 2.032 g/cm . Using this density togetherJoe Lott Member tuff (Tmj, table 2), and, at its with the map B reduction density of 2.40 g/cm in theeastern end, Quaternary landslide material. Low rn isdeep enough to suggest a reversed-polarity unit at of material is needed to explain the 5-mGal low sc. depth, perhaps the same as that which causes low cf. Doing the same for low tn, and using a density ofLows rn and cf are separated, however, by an east-trending group of irregular highs under strip B; asdiscussed above, at least some of these highs persistdespite probable misleveling of strip B. This patternof local highs on background lows resembles that tn low. Both thicknesses, however, are notseen in area TC to the north, where that patternreflects local topography. Here, though, suchpaleotopography, if present, is buried under ash-flowtuffs of unit Tmj. An alternative, less favored,explanation for anomaly rn is that it might reflect aswarm of east-trending, reversed-polarity dikes at thisplace. These dikes would have to be thin, so as to bequenched quickly enough to lock in the reversedpolarity, and there would have to be a number ofthem to make up the observed width of anomaly rn. Such dikes, if present, could explain observedthermal and chamical anomalies at the Red Narrowsclay-pits. Dike swarms, however, are not common inthe Marysvale volcanic field. Whatever its cause,anomaly rn lies along, and helps define, the muchlonger east-striking Cove Fort transverse zone (figs. 2and 3; Rowley and others, 1998).
Voluminous (150 km ) ash-flow tuffs of the Joe3
Lott Tuff Member of the Mount Belknap Volcanics,unit Tmj, spewed northward from the Mount Belknapcaldera at the time of its collapse, 19 Ma (Buddingand others, 1987). The main channel for the early JoeLott Member tuffs is speculated to have been nearMill Creek, north of Red Narrows (Budding andothers, 1987), but later tuffs must have inundatedmuch of the countryside. Remnants of unit Tmj occurnorth to about lat 38(30' N. over most the width ofthe study area, from near Cove Fort, on the west, tothe Sevier Valley, on the east. Four subunits of unitTmj have been recognized having a total measuredstratigraphic thickness of 164 m (Budding and others,1987). In much of the highlands north of MountBelknap caldera and locally over the rest of its extent,unit Tmj is capped by sedimentary rocks of the SevierRiver Formation.
Gravity low sc falls over Mill Creek and theheadwaters of Sevier Canyon, and it may mark thepaleotopographic channel followed by early tuffs ofunit Tmj. Other parts of this channel are suggestedby the northeast alignment of gravity lows mb, sc, tn,
3
3
Bouguer slab formula (fig. 12), we find about 300 m
1.71 g/cm (sample M91), we find about 180 m of3
low-density material is needed to explain the >5-mGal low there. This is somewhat more than the totalthickness of unit Tmj measured in the vicinity of the
unreasonable values for depth of a paleovalley thatcould channel early ash-flow tuffs of unit Tmj. Atany rate, the Bouguer slab formula (fig. 12) and theapproximate values used with it are best used toconstrain geologic scenarios and not to do preciseanalyses. Notice that the measured densities of thesesamples of unit Tmj decrease away from the sourcearea, the Mount Belknap caldera, as they should forsuch ash-flow units.
Possible sources for aeromagnetic lows in the northern domain
Widespread ash-flow tuffs make excellentcandidates for the reversed-polarity unit(s) that wepostulate underlie much of the northern domain of thestudy area. Tuff units are quenched quickly, so thatthey can acquire and hold the magnetic direction thatthe Earth’s field had at the time of their eruption. Ideally, because they have still higher mafic mineralcontent, basalts would be even better candidates forthis role, but basalts are sparse in the Marysvalevolcanic field relative to rhyolitic tuffs and,furthermore, their mode of extrusion is such that theymight not blanket paleotopography as well as tuffs. The reversed-polarity unit(s) we are looking for musthave covered a vast area, and they had to haveblanketed that area thickly enough everywhere toleave no bare spots in the resulting magnetic low.
Caskey and Shuey (1975) made paleomagneticmeasurements of many volcanic units of mostlyOligocene age in the Cove Fort–Sulphurdale area. Several units they measured had reversed polarity,among them the Wales Canyon Tuff (Tw on thecompanion map by Rowley and others, in press; notlisted in table 2; no samples), the Wah Wah SpringsFormation (Tnw on the companion map of Rowleyand others, in press), and several other tuffs formerlycorrelated with the Needles Range Group (Tn, table2). The Wales Canyon Tuff has a thickness of 60 m(Caskey and Shuey, 1975) at the place where it crops
25
out, a strip underlying magnetic low wc (fig. 10), andit strikes north-northeast for a total distance of about8 km. Unit Tw could underlie much of thesouthwestern Pavant Range at depth, so as to causethe northern-domain magnetic low, but theaeromagnetic low, wc, over its outcrop is notimpressive. Some other (deeper?) unit is probablyresponsible, but it remains unidentified. A possiblecandidate is a unit or units formerly correlated withthe Needles Range Group (see Tn, table 2) but nowlargely correlated with the Three Creeks TuffMember of the Bullion Canyon Volcanics (Tbct, table2), which crop out in several places in the northerndomain of the study area and which may underliemuch of the rest of it. Recall that we have interpretedthe local lows interspersed with highs in area TC (fig.10) to reflect reversed polarity units that may crop out mhbc is a deep low or series of lows that extendsin canyons or be shallowly buried there. Many such from Mount Holly ski area in the Big John caldera,lows do correlate with the Three Creeks Member of on the west, to Bellyache Canyon, draining intothe Bullion Canyon Volcanics (Tbct, table 2), so we southern Marysvale Valley, on the east. Theinterpret that at least some (deeper?) subunits of unit principal exposed geologic units in the area of lowTcbt carry strong reversed polarity. Note, though,that at least one sample of unit Tbct (M908, table 1)showed normal polarity in a field test. Because manyrelative highs in area TC correlate with rocks of the table 2; sample M261), and the Delano Peak TuffBullion Canyon Volcanics (Tbc, table 2) that locally Member (Tbcd, table 2; sample M902). As was theoverlie unit Tbct, we also interpret that these localrocks of unit Tbc carry normal polarity.
Area TC falls over a block that is faulted up correlate with the edges of the aeromagnetic feature. relative to blocks to the southeast (across TNFZ, fig. For that reason, and because Bullion Canyon6) and southwest (across the Cove Fort fault and Volcanics in other parts of the study area have aother faults splaying from it, fig. 6). These nearby different aeromagnetic signature (subdued birdseyes),blocks also display deep aeromagnetic lows (jh andcf, fig. 10), so they too must contain reversed-polarityunits. The northeastern part of jh (fig. 10) correlateswith basaltic andesites (Ta, table 2) that cover theslopes of hills of the Pavant Range just northwest ofJoseph Flats (fig. 4). Low jh extends far to thesouthwest, however, over an upthrown block largelycapped by Joe Lott Tuff Member (Tmj, table 2). Elsewhere, at Red Narrows (fig. 4), unit Tmj appearsto be normally polarized (see above discussion ofaeromagnetic low rn). This normally polarizedmagnetization is probably weak, though, formeasured samples (M91, M92, M809) of unit Tmjhave relatively low susceptibility and NRM values.Therefore, the southwestern extension of low jh mayreflect a reversed-polarity unit buried under unit Tmj.
There are no geologic units that clearly correlatewith low cf. Finding the source rocks for low cf,therefore, remains an unsolved puzzle ininterpretating map A. Such source rocks must be
buried, and they must be extensive at depth. Adifficulty with ascribing northern-domain lows to anyburied unit is that, in this study area, the units thatoverlie it may carry normal polarity. The fields ofany such overlying normal-polarity units will opposethose of the buried reversed-polarity unit. The deeperthe proposed source unit, the thicker it must be andthe stronger its reversed-polarity NRM must be toexplain the northern-domain low. Note, though, thatmore than one reversed-polarity unit may beresponsible for the lows.
Mount Holly–Bellyache Canyon low
Aeromagnetic low rn has an interestingcounterpart to the south in low mhbc, fig. 10. Low
mhbc are three subunits of the Bullion CanyonVolcanics; the Upper Member (Tbu, table 2; samplesM263, M903, and M905), the Middle Member (Tbm,
case with low rn, the exposed units under low mhbcare areally extensive, and their boundaries do not
we think it unlikely that they are the source rocks formhbc. The eastern end of mhbc occurs overvolcanic rocks of the Mount Dutton Formation (Td,table 2; samples M468, M470, and 78-698), andseveral local lows extending south from it also fallover either unit Td or surficial alluvium that probablycovers unit Td. Therefore, we interpret that lowmhbc is due to buried parts of unit Td that havereversed magnetic polarity. Source vents for theupper Oligocene–lower Miocene Mount DuttonFormation are thought to lie to the south of here(Rowley and others, 1994). As is the case for rn, wefurther interpret that these source flows may havepooled in a topographic low. Our tentative picture,therefore, is that by late Oligocene– early Miocenetime, the central part of the ancestral Marysvalevolcanic field contained at least two deep east-trending canyons, in which there accumulateddeposits of tuffs of the Needles Range Group and theThree Creeks Tuff Member of the Bullion CanyonVolcanics, coming from the north, and lava flows and
26
mud flows of Mount Dutton Formation, coming from alteration has proceeded to the extent that alunite isthe south. This east-trending feature may be related formed (for example, sample M53). Gravity stationsto the Blue Ribbon transverse zone, located farther to in the Marysvale volcanic field are too sparse to bethe south (fig 2; Rowley and others, 1998; Rowley, able to pick out medium- to small-sized, alunite-1998). altered areas on a gravity map, however. Hematite is
Selected local plutons environment that leads to the formation of alunite;
Many other aeromagnetic features on map A of alunite-altered rocks, like those of most otherremain to be interpreted. Some of these are local altered rocks, are low. highs that are wider than the birdseyes due to The densest rocks in the Marysvale volcanic fieldvolcanic rocks and that probably reflect either plutons are basalts having typical bulk densities of about 2.6or volcanic units such as basalt flows or tuffs. In g/cm ; these rocks also have the highest typicalmany places, the probable source rocks crop out and magnetic susceptibility (20 × 10 cgs) and NRM (45can be identified by correlating the features on map A × 10 emu/cm ). Typical values of density, magneticwith geologic units on the companion geologic map susceptibility and NRM increase with mafic index forof Rowley and others (in press) or on the 1:50,000- both extrusive and intrusive rock samples from thescale map of Cunningham and others (1983). Marysvale volcanic field. Rocks of the BullionExamples include highs LJ (fig. 10) and theFormation of Lousy Jim (Sigmund, 1979; Tlj, table 2;sample M505); high B (fig. 10) and Tertiary basalts(Tbas, table 2; sample M801); highs BC and Y (fig.10) and Bullion Canyon Volcanic intrusive (Tbci,table 2: no nearby samples) and, to a lesser extent, extrusive (Tbc, table 2) rocks. High Y is particularlynoteworthy because it may reflect a plutonresponsible for the 14-Ma Rhyolite of Big Star(Cunningham and others, 1983) and associatednatroalunite deposits north of the Red Hills caldera.
One particular use of detailed aeromagnetic mapssuch as map A is to identify reentrant lows intobroader highs, for these can reflect altered parts ofplutons that may be significant in exploring for baseand precious metals. An example from this studyarea is the Indian Peaks high (IP, fig. 10) andassociated Mystery Sniffer mine (fig. 5), discussed byCunningham, Steven, Campbell, and others (1984).
SUMMARY AND CONCLUSIONS
Density and magnetic properties were measuredfor 88 samples of igneous rocks from the Marysvalevolcanic field. Dry bulk density, magneticsusceptibility, and NRM generally decrease as thedegree of alteration increases, reflecting increases incontent of hydrated low-density minerals, increases inporosity, and decreases in magnetite content. Thisimplies that larger volumes of altered rock may showup as lows on both gravity (map B) and aeromagneticmaps (map A). An exception, important in theMarysvale volcanic field because of the kind ofaltered rock present, is the increase in density when
the stable iron-oxide mineral in the acid sulfate
consequently, the magnetic susceptibility and NRM
3
-4
-4 3
Canyon Volcanics have typical values of these threeproperties that are somewhat higher thancorresponding values for rocks of the Mount BelknapVolcanics. This reflects the changeover from earlierrocks of intermediate composition (Bullion CanyonVolcanics) to later alkali rhyolite rocks of thebimodal suite (Mount Belknap Volcanics).
No such systematic variations were seen inmeasured values of Koenigsberger Q ratios. Typicalunaltered igneous rocks from the Marysvale volcanicfield have high values of Q, however; so that theirpermanent magnetization (NRM) componentsoutweigh their induced magnetization (susceptibility)components. This in turn implies that theaeromagnetic fields seen on map A result principallyfrom NRM. Therefore, volcanic flows that wereextruded during reversed-polarity epochs may carryreversed magnetizations, and, hence, appear as deeplows on aeromagnetic maps. For plutons, however, itis likely that the observed NRM principally reflects aviscous magnetization component that is now alignedwith the present Earth’s field, so that plutons shouldcarry normal magnetization and appear as highs onmap A.
The Pioche-Marysvale igneous belt shows up onthe regional magnetic map as a belt of magnetic highsflanked to the north and (in places) south by magneticlows. Some of these lows are dispersed by RTPprocessing, a technique that reduces polarity lows andmoves magnetic signatures more directly over theirsource bodies. The lows in the northern part of thestudy area remain, however, implying that these lowsare due to sources with reversed magnetization. The study area can be divided into threegeophysical domains on the basis of their gravity and
27
aeromagnetic signatures. The northern domain has a porphyritic, intrusions into an earlier pluton. Wherestrong gravity gradient decreasing to the south and the rocks are of the bimodal assemblage, alteredlow or very low aeromagnetic fields. The central zones can show up as areas of attenuated birdseyes ondomain has low gravity fields and moderate the aeromagnetic map. Such attenuated birdseyesaeromagnetic fields including several large highs. typically appear as mottled shades of green on map A,The southern domain has intermediate gravity fields and are evident in the Kimberly and Central Miningand birdseye (high spatial-frequency highs and lows) Areas (fig. 5). This generalization is clouded,magnetic fields. A deep, south-trending gravity lowalong the Sevier and Marysvale Valleys cuts all threedomains, reflecting through-going basin-and-rangegraben(s).
Aeromagnetic lows in the northern domain areinterpreted to reflect sequences of reversed-polaritytuffs that may include units of the late Oligocene–early Miocene Three Creeks Member of the BullionCanyon Volcanics. As these tuffs spread to the souththey may have accumulated in a paleo-valley locatedat the boundary between northern and centraldomains. There are no aeromagnetic features that canbe interpreted to reflect plutons in the northerndomain of the study area. The gravity gradient in thenorthern domain probably reflects the southern flankof a regional structural dome centered north of thestudy area. This dome, the Sevier River oval (T.A.Steven, written commun., 1985) may represent amantle upwarp of basin-and-range and older age(Thompson and Zoback, 1979). As the dome pushedup, the overlying volcanic units were stretched andfaulted in ways that are reflected on the aeromagneticmap.
The central domain marks the eruptive center ofthe Marysvale volcanic field. Its northern boundaryis the Cove Fort transverse zone, and its southernboundary is the Blue Ribbon transverse zone (Rowleyand others, 1998; Rowley, 1998). The generalgravity low there probably reflects the lower densitiesof these igneous intrusions, whereas the generalaeromagnetic high of the central domain reflects theirnormal-polarity (viscous) NRM. Particular magnetichighs may mark particular intrusion complexes southof Sulphurdale, north of the Red Hills caldera, andunder the central Sevier Plateau, among others. Deepgravity lows associated with the Big John and MountBelknap calderas reflect accumulations of relativelylight rhyolitic volcanic rocks that have accumulatedtherein. The central domain contains many areas ofaltered rocks, and the hydrothermal processes thatgave rise to this alteration also emplaced base- andprecious-metal deposits in the domain. Areas ofaltered rocks contribute to gravity lows in calderasand show up on the aeromagnetic map as reentrantlows into highs that reflect plutons. Such reentrantlows can help locate subsequent, sometimes
however, because unaltered Bullion CanyonVolcanics extrusive rocks also have this attenuatedbirdseye signature.
The southern domain is characterized by high-amplitude birdseyes that reflect tuffs and mafic lavaflows and mudflow breccias. Deeper lows mayreflect reversed-polarity volcanics, possibly of theMount Dutton Formation. We interpret that at leastone such reversed-polarity unit may have onlappedfrom the south to collect in a paleovalley locatedalong the boundary between central and southerndomains. There are no large aeromagnetic highs thatwe can ascribe to plutons in the southern domain ofthe study area.
Calderas in the study area have variable gravityand aeromagnetic signatures that reflect their differentsizes and characters. The Red Hills caldera is sosmall that no clear gravity or aeromagnetic signaturecan be ascribed definitely to it. The Three Creekscaldera may give rise to a subtle gravity high. Itsaeromagnetic signature, if any, has now been maskedby later reversed- and normal-polarity flows thatblanketed the area. Gravity lows reflecting low-density intracaldera flows, and low-amplitudebirdseye aeromagnetic patterns reflecting the variedcompositions and alteration patterns of theseintracaldera flows, are associated with both Big Johnand Mount Belknap calderas. Because the MountBelknap caldera was a deep caldron, whereas the BigJohn caldera was a shallow trapdoor subsidencestructure, the gravity low over the Mount Belknapcaldera is relatively deeper. Magnetic highs in theeastern part of the Monroe Peak caldera apparentlyreflect local plutons. The deep gravity low in itswestern one-third probably reflects a complex ofpost-caldera intrusions that were the eastern sourcezone for the Mount Belknap Volcanics. All fivecalderas in the study area evidently were smallenough to be supported in large part by the localcrust, for they do not show the gravity highs thatcharacterize resurgent domes that have isostaticallyrebounded.
28
ACKNOWLEDGMENTS
We thank the USGS Paleomagnetism Laboratory,Denver, Colo., for use of their facilities, Rob Meyerfor measuring susceptibility and remanance of ourrock samples, and Tien Grauch and Viki Bankey forcareful reviews of the manuscript.
REFERENCES CITED volcanic field, west-central Utah: U.S.
Anderson, J.J., Rowley, P.D., Blackman, J.T.,Mehnert, H.H., and Grant, T.C., 1990a, Geologicmap of the Circleville Canyon area, southernTushar Mountains and northern MarkaguntPlateau, Beaver, Garfield, Iron, and PiuteCounties, Utah: U.S. Geological SurveyMiscellaneous Investigations Series Map I-2000,scale 1:50,000.
Anderson, J.J, Rowley, P.D., Machette, M.N.,Decatur, S.H., and Mehnert, H.H., 1990b,Geologic map of the Nevershine Hollow area,eastern Black Mountains, southern TusharMountains, and northern Markagunt Plateau,Beaver and Iron Counties, Utah: U.S. GeologicalSurvey Miscellaneous Investigations Series MapI-1999, scale 1:50,000.
Anderson, R.E., and Barnhard, T.P., 1992,Neotectonic framework of the central sevierValley area, Utah, and its relationship toseismicity, in Gori, P.L., and Hays, W.W., eds.,Assessment of regional earthquake hazards andrisk along the Wasach front, Utah: U.S.Geological Survey Professional Paper 1500-K,47 p.
Bath, G.D., 1968, Aeromagnetic anomalies related toremanent magnetism in volcanic rock, NevadaTest Site, in Eckel, E.B., ed., Nevada Test Site:Geological Society of America Memoir 110, p.135-146.
Beaty, D.W., Cunningham, C.G., Rye, R.O., Steven,T.A., and Gonzalez-Urien, E., 1986, Geologyand geochemistry of the Deer Trail Pb-Zn-Ag-Au-Cu manto deposits, Marysvale District, west-central Utah: Economic Geology, v. 81, no. 8, p.1932-1952.
Best, M.G.,and Grant, S.K., 1987, Stratigraphy of thevolcanic Needles Range Group in southwesternUtah: U.S. Geological Survey Professional Paper1433-A, 28 p.
Best, M.G., McKee, G.H., and Damon, P.E., 1980,Space-time-composition patterns of lateCenozoic mafic volcanism, southwestern Utah
and adjoining areas: American Journal ofScience, v. 280, p. 1035-1050.
Blakely, R.J., 1994, Potential theory in gravity andmagnetic applications: New York, N.Y.,Cambridge University Press, p. 330-342.
Budding, K.E., Cunningham, C.G., Zielinski, R.A.,Steven, T.A., and Stern, C.R., 1987, Petrologyand chemistry of the Joe Lott Tuff Member ofthe Mount Belknap Volcanics, Marysvale
Geological Survey Professional Paper 1354, 47p.
Campbell, D.L., Cunningham, C.G., Steven, T.A.,Rowley, P.D., Glassgold, L.B., and Anderson,J.J., 1984, Aeromagnetic and geologic map ofthe Tushar Mountains and adjoining areas,Marysvale volcanic field, Utah: U.S. GeologicalSurvey Miscellaneous Investigations Series MapI-1430-D, scale 1:50,000.
Campbell, D.L., and Flanigan, V.J., 1982,Geophysical measurements in the Beaver Basin,west-central Utah; Part 2 — Resistivity, IP, andseismic investigations: U.S. Geological SurveyOpen-File Report 82-420, 44 p.
Caskey, C.F., and Shuey, R.T., 1975, Mid-Tertiaryvolcanic stratigraphy, Sevier–Cove Fort area,central Utah: Utah Geology, v. 2, no. 1, p. 17-25.
Cook, K.L., Adhidjaja, J.I., and Gabbert, S.C., 1981,Complete Bouguer gravity anomaly andgeneralized geology map of Richfield 1(× 2(
quadrangle, Utah: State of Utah Department ofNatural Resources and Energy, Utah Geologicaland Mineral Survey, Map 59, scale 1:250,000.
Cook, K.L., Bankey, Viki, Mabey, D.R., andDePangher, M., 1989, Complete Bouguer gravityanomaly map of Utah: State of Utah Departmentof Natural Resources and Energy, UtahGeological and Mineral Survey, Map 122, 1sheet, scale 1:500,000.
Cook, K.L., Halliday, M.E., Cunningham, C.G.,Steven, T.A., Rowley, P.D., Glassgold, L.B.,Anderson, J.J., and Coles, L.L., 1984, CompleteBouguer gravity anomaly and geologic map ofthe Tushar Mountains and adjoining areas,Marysvale volcanic field, Utah: U.S. GeologicalSurvey Miscellaneous Investigations Series MapI-1430-C, scale 1:50,000.
Cook, K.L., Montgomery, J.R., Smith, J.R., and Gray,E.G., 1975, Simple Bouguer gravity anomalymap of Utah: State of Utah Department ofNatural Resources and Energy, Utah Geologicaland Mineral Survey, Map 37, scale 1:1,000,000.
Cook, K.L., Serpa, L.F., and Pe, W., 1980, Detailed
29
gravity and aeromagnetic surveys of the Cove Glassgold, L.B., and Anderson, J.J., 1983,Fort Sulphurdale KGRA and vicinity, Millard Geologic map of the Tushar Mountains andand Beaver counties, Utah: University of Utah, adjoining areas, Marysvale volcanic field, Utah: Department of Geology and Geophysics, Topical U.S. Geological Survey MiscellaneousReport DOE/ET/2839230, DOE/DGE Contract Investigations Series Map I-1430-A, scaleAC07-78ET28392, 88 p. 1:50,000.
Cunningham, C.G., Rasmussen, J.D., Steven, T.A., Cunningham, C.G., Steven, T.A., Rowley, P.D.,Rye, R.O., Rowley, P.D., Romberger, Glassgold, L.B., and Anderson, J.J., 1984, MapS.B., and Selverstone, J., 1998, Hydrothermal of argillic and advanced argillic alteration anduranium deposits containing molybdenum and principal hydrothermal quartz and alunite veinsfluorite in the Marysvale volcanic field, west- in the Tushar Mountains and adjoining areas,central Utah: Mineralium Deposita, v. 33, no. 4, Marysvale volcanic field, Utah: U.S. Geologicalp. 447-494. Survey Miscellaneous Investigations Series Map
Cunningham, C.G., Rye, R.O., Bethke, P.M., and I-1430-B, scale 1:50,000.Logan, M.A.V., 1997, Vein alunite formed by Cunningham, C.G., Steven, T.A., Rowley, P.D.,episodic degassing of an epizonal stock [abs.]: Naeser, C.W., Mehnert, H.H., Hedge, C.E., andEos, American Geophysical Union, v. 78, no. 46, Ludwig, K.R., 1994, Evolution of volcanic rocksp. F746. and associated ore deposits in the Marysvale
Cunningham, C.G., Rye, R.O., Steven, T.A., and volcanic field, Utah: Economic Geology, v. 89,Mehnert, H.H., 1984, Origins and exploration p. 2003-2005.significance of replacement and vein-type alunite Cunningham, C.G., Unruh, D.M., Steven, T.A.,deposits in the Marysvale volcanic field, west- Rowley, P.D., Naeser, C.W., Mehnert, H.H.,central Utah: Economic Geology, v. 79, no. 1, p. Hedge, C.E., and Ludwig, K.R., 1998,50-71. Geochemistry of volcanic rocks in the Marysvale
Cunningham, C.G., and Steven, T.A., 1979a, Mount volcanic field, west-central Utah, in Friedman,Belknap and Red Hills calderas and associated J.D., and Huffman, A.C., Jr., eds., Laccolithrocks, Marysvale volcanic field, west-central complexes of southeastern Utah: Time ofUtah: U.S. Geological Survey Bulletin 1468, 34 emplacement and tectonic setting–Workshopp. proceedings: U.S. Geological Survey Bulletin
Cunningham, C.G., and Steven, T.A., 1979b, 2158, p. 223-232. Environments favorable for the occurrence of Earth Sciences Laboratory, 1978, Residualuranium within the Mount Belknap caldera, aeromagnetic map, Cove Fort–Sulphurdale, DogBeaver Valley and Sevier River Valley, west- Valley areas, Utah: Salt Lake City, Utah,central Utah: U.S. Geological Survey Open-File University of Utah Research Institute, Open-FileReport 79-434, 15 p. Data UT/CFS/ESL-1, scale 1:62,500.
Cunningham, C.G., and Steven, T.A., 1979c, Evans, S.H., Jr., and Steven, T.A., 1982, Rhyolites inUranium in the Central Mining Area, Marysvale the Gillies Hill–Woodtick Hill area, Beaverdistrict, west-central Utah: U.S. Geological County, Utah: Geolological society of AmericaSurvey Miscellaneous Investigations Series Map Bulletin, v. 93, no. 11, p. 1131-1141.I-1177, scale 1:24,000. Flanigan, V.J., and Campbell, D.L., 1981,
Cunningham, C.G., and Steven, T.A., 1979d, Geophysical studies in the Beaver Basin, west-Geologic map of the Deer Trail central Utah; Part 1 — Slingram, magnetic, andMountain–Alunite Ridge mining area, west- spontaneous polarization profiles: U.S.central Utah: U.S. Geological Survey Geological Survey Open-File Report 81-199, 5Miscellaneous Investigations Series Map I-1230, p., 11 figs.scale 1:24,000. Geological Society of America, 1984, Decade of
Cunningham, C.G., Steven, T.A., Campbell, D.L., North American Geology Geologic Time Scale:Naeser, C.W., Pitkin, J.A., and Duval, J.S., 1984, Geological Society of America Map and ChartMultiple episodes of igneous activity, Series MC-50.mineralization, and alteration in the western Halliday, M.E., and Cook, K.L., 1980, RegionalTushar Mountains, Utah: U.S. Geological gravity survey, northern Marysvale volcanicSurvey Professional Paper 1299-A, 21 p. field, south-central Utah: Geological Society of
Cunningham, C.G., Steven, T.A., Rowley, P.D., America Bulletin, Part I, v. 91, p. 502-508.
30
Jachens, R.C, and Moring, B.C., 1990, Maps of the geologic and geophysical case study: Salt Lakethickness of Cenozoic deposits and the isostatic City, Utah Earth Sciences Laboratory, Universityresidual gravity over basement for Nevada: U.S. of Utah Research Institute.Geological Survey Open-file Report 90-404, 15 Rowley, P.D., 1998, Cenozoic transverse zones andp. igneous belts in the Great Basin, western United
Johnson, G.R., 1979, Textural properties: U.S. States—Their tectonic and economicGeological Survey Circular 789, p. 67-74. implications, in Faulds, J.E., and Stewart, J.H.,
Machette, M.N., Steven, T.A., Cunningham, C.G., eds., Accomodation zones and transfer zones: theand Anderson, J.J., 1984, Geologic map of the regional segmentation of the Basin and RangeBeaver quadrangle, Beaver and Piute Counties, province: Geological Society of America SpecialUtah: U.S. Geological Survey Miscellaneous Paper 323, 266 p.Investigations Series Map I-1520, scale Rowley, P.D., Cunningham, C.G., Steven, T.A.,1:50,000. Mehnert, H.H., and Naeser, C.W., 1988a,
Mackie, R.L., and Cunningham, C.G., 1982, Density Geologic map of the Marysvale quadrangle,and magnetic susceptibility measurements of Piute County, Utah: Utah Geological andigneous rocks from the Marysvale volcanic field, Mineral Survey Map 105, scale 1:24,000;west-central Utah: U.S. Geological Survey Open- includes 15-p. drop-in pamphlet.File Report 82-892, 25 p. Rowley, P.D., Cunningham, C.G., Steven, T.A.,
Miller, W.R., Motooka, J.M., Cunningham, C.G., Mehnert, H.H., and Naeser, C.W., 1988b,Steven, T.A., Rowley, P.D., and Anderson, J.J., Geologic map of the Antelope Range quadrangle,1984a, Distribution of anomalous trace elements Sevier and Piute Counties, Utah: Utahin the nonmagnetic fraction of heavy-mineral Geological and Mineral Survey Map 106, scaleconcentrates of stream sediments, shown on a 1:24,000; includes 14-p. drop-in pamphlet.geologic base map of the Tushar Mountains and Rowley, P.D., Cunningham, C.G., Steven, T.A.,adjoining areas, Marysvale volcanic field, Utah: Mehnert, H.H., and Naeser, C.W., 1998,U.S. Geological Survey Miscellaneous Cenozoic igneous and tectonic setting of theInvestigations Series Map I-1430-E, scale Marysvale volcanic field and its relation to other1:50,000. igneous centers in Utah and Nevada, in
Miller, W.R., Motooka, J.M., Cunningham, C.G., Friedman, J.D., and Huffman, A.C., Jr., eds.Steven, T.A., Rowley, P.D., and Anderson, J.J., Lacolith complexes of southeastern Utah: time of1984b, Distribution of anomalous trace elements emplacement and tectonic setting — Workshopin the magnetic fraction of heavy-mineral proceedings: U.S. Geological Survey Bulletinconcentrates of stream sediment, shown on a 2158, p. 167-201.geologic base map of the Tushar Mountains and Rowley, P.D., Cunningham, C.G., Steven, T.A.,adjoining areas, Marysvale volcanic field, Utah: Workman, J.B., Anderson, J.J., and Theissen,U.S. Geological Survey Miscellaneous K.M, in press, Geologic map of the centralInvestigations Series Map I-1430-F, scale Marysvale volcanic field, southwestern Utah:1:50,000. U.S. Geological Survey Geologic Investigations
Miller, W.R., Motooka, J.M., Cunningham, C.G., Series I-2645-A, scale 1:100,000.Steven, T.A., Rowley, P.D., and Anderson, J.J., Rowley, P.D., Hereford, Richard, and Williams,1984c, Distribution of anomalous trace elements 1987, Geologic map of the Adams Head–Johnsin the less-than-180-micrometer fraction of Valley area, southern Sevier Plateau, Garfieldstream sediments, shown on a geologic base map County, Utah: U.S. Geological Surveyof the Tushar Mountains and adjoining areas, Miscellaneous Investigations Series Map I-1798,Marysvale volcanic field, Utah: U.S. Geological scale 1:50,000.Survey Miscellaneous Investigations Series Map Rowley, P.D., Mehnert, H.H., Naeser, C.W., Snee,I-1430-G, scale 1:50,000. L.W., Cunningham, C.G., Steven, T.A.,
Plouff, Donald, and Pakiser, L.C., 1972, Gravity Anderson, J.J., Sable, E.G., and Anderson, R.E.,study of the San Juan Mountains, Colorado: U.S. 1994, Isotopic ages and stratigraphy of CenozoicGeological Survey Professional Paper 800-B, p. rocks of the Marysvale volcanic field andB183-B190. adjacent areas, west-central Utah: U.S.
Ross, H.P., Moore, J.N., and Christensen, O.D., Geological Survey Bulletin 2071, 35 p.1982, The Cove Fort–Sulfurdale KGRA, a Rowley, P.D., Steven, T.A., Anderson, J.J., and
31
Cunningham, C.G., 1979, Cenozoic stratigraphy Mountains, Utah, in Steven, T.A., ed., Igneousand structural framework of southwestern Utah: activity and related ore deposits in the westernU.S. Geological Survey Professional Paper 1149, and southern Tushar Mountains, Marysvale22 p. volcanic field, west-central Utah: U.S.
Rowley, P.D., Steven, T.A., and Mehnert, H.H., Geological Survey Professional Paper 1299-B, p.1981, Origin and structural implications of upper 23-33.Miocene rhyolites in Kingston Canyon, Piute Steven, T.A., Cunningham, C.G., and Machette,County, Utah: Geological Society of America M.N., 1981, Integrated uranium systems in theBulletin, Part I, v. 92, p. 590-602. Marysvale volcanic field, west-central Utah, in
Rowley, P.D., Williams, P.L., and Kaplan, A.M., Goodell, P.C., and Waters, A.C., eds., Uranium1986a, Geologic map of the Greenwich in volcanic and volcaniclastic rocks: Americanquadrangle, Piute County, Utah: U.S. Geological Association of Petroleum Geologists Studies inSurvey Geologic Quadrangle Map GQ-1589, Geology, no. 13, p. 111-122.scale 1:24,000. Steven, T.A., Cunningham, C.G., Naeser, C.W., and
Rowley, P.D., Williams, P.L., and Kaplan, A.M., Mehnert, H.H., 1979, Revised stratigraphy and1986b, Geologic map of the Koosharem radiometric ages of volcanic rocks and mineralquadrangle, Sevier and Piute Counties, Utah: deposits in the Marysvale area, west-centralU.S. Geological Survey Geologic Quadrangle Utah: U.S. Geological Survey Bulletin 1469, 40Map GQ-1590, scale 1:24,000. p.
Saltus, R.W., and Jachens, R.C., 1995, Gravity and Steven, T.A., and Morris, H.T., 1983, Geologic mapbasin-depth maps of the Basin and Range of the Cove Fort quadrangle, west-central Utah: Province, Western United States: U.S. U.S. Geological Survey MiscellaneousGeological Survey Geophysical Investigations Investigations Series Map I-1481, scaleMap GP-1012, scale 1:2,500,000. 1:50,000.
Schutter, T.A., Duval, J.S., Campbell, D.L., Pitkin, Steven, T.A., and Morris, H.T., 1986, SummaryJ.A., Steven, T.A., Cunningham, C.G., 1989, mineral resource appraisal of the Richfield Gamma-ray composite-color maps of the Tushar 1(× 2( quadrangle, west-central Utah: U.S.Mountains and adjoining areas, Marysvale Geological Survey Circular 916, 24 p.volcanic field, Utah: U.S. Geological Survey Steven, T.A., Morris, H.T., and Rowley, P.D., 1990,Miscellaneous Investigations Series Map I-1430- Geologic map of the Richfield 1(× 2(H, scale 1:100,000; 4 maps with text. quadrangle, west-central Utah: U.S. Geological
Sigmund, J.M., 1979, Geology of a Miocene Survey Miscellaneous Investigations Series Map,rhyodacite lava flow, southern Tushar I-1901, 3 maps on 1 sheet, scales 1:250,000 andMountains: Kent, Ohio, Kent State University, 1:500,000.M.S. thesis, 35 p. Steven, T.A., Rowley, P.D., and Cunningham, C.G.,
Spiegel, M.R., 1961, Theory and Problems of 1984, Calderas of the Marysvale volcanic field,Statistics: New York, McGraw-Hill Book west-central Utah: Journal of GeophysicalCompany, Schaum’s Outline Series, 359 p. Research, v. 89, B10, p. 8751-8764.
Steven, T.A., 1981, Three Creeks caldera, southern Thompson, G.A., and Zoback, M.L., 1979, RegionalPavant Range, Utah: Brigham Young University geophysics of the Colorado Plateau: Geology Studies, v. 28, pt. 3, p. 1-7. Tectonophysics, v. 61, p. 149-181.
Steven, T.A., 1984, ed., Igneous activity and related Tweto, Ogden, and Case, J.E., 1972, Gravity andore deposits in the western and southern Tushar magnetic features as related to geology in theMountains, Marysvale volcanic field, west- Leadville 30-minute quadrangle, Colorado: U.S.central Utah: U.S. Geological Survey Geological Survey Professional Paper 726-C, 31Professional paper 1299-A,B, 33 p. p. and 2 plates.
Steven, T.A., 1989, Geologic map of the Crystal Peak U.S. Department of Energy, 1982, Aerial radiometriccaldera, west-central Utah: U.S. Geological and magnetic survey, Marysvale detail survey,Survey Miscellaneous Investigation Series Map Richfield national topographic map sheet, Utah:I-2002, scale 1:100,000. U.S. Department of Energy Open-File Report
Steven, T.A., Cunningham, C.G., and Anderson, J.J., GJBX-37(78), 57 p.1984, Geologic history and uranium potential ofthe Big John caldera, southern Tushar
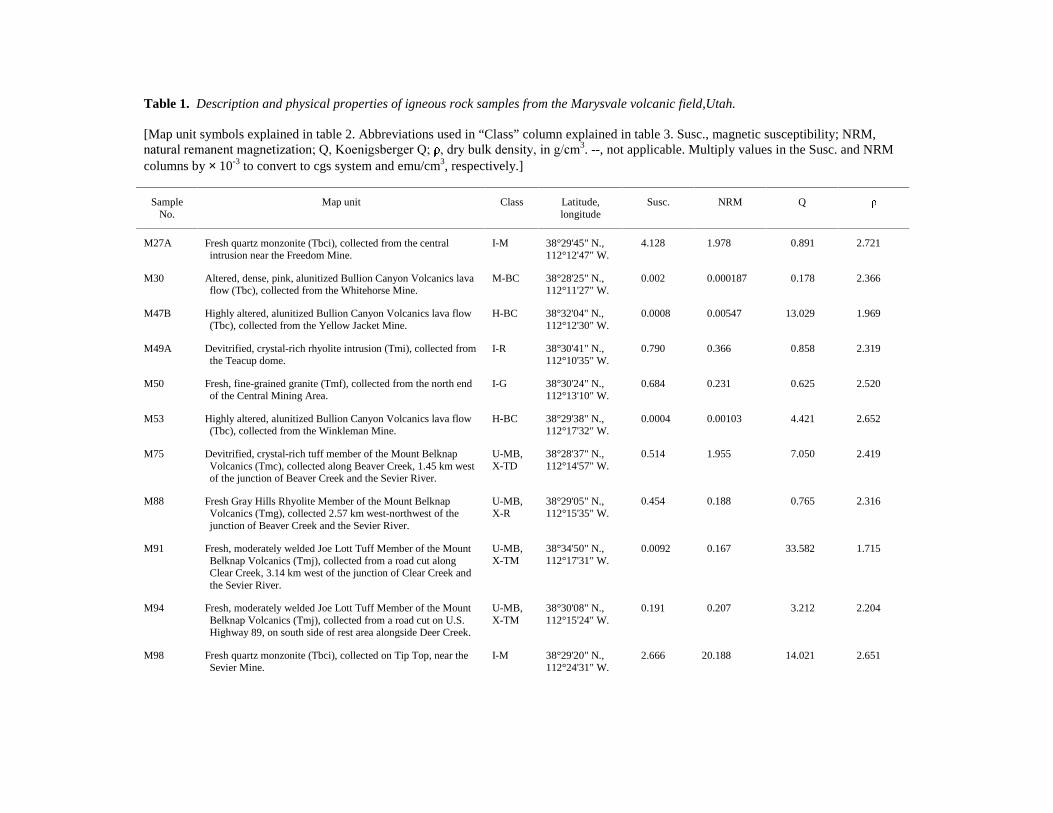
Table 1. Description and physical properties of igneous rock samples from the Marysvale volcanic field,Utah.
[Map unit symbols explained in table 2. Abbreviations used in “Class” column explained in table 3. Susc., magnetic susceptibility; NRM,QDWXUDO�UHPDQHQW�PDJQHWL]DWLRQ��4��.RHQLJVEHUJHU�4�� ��GU\�EXON�GHQVLW\��LQ�J�FP3. --, not applicable. Multiply values in the Susc. and NRMcolumns by × 10-3 to convert to cgs system and emu/cm3, respectively.]
SampleNo.
Map unit Class Latitude,longitude
Susc. NRM Q
M27A Fresh quartz monzonite (Tbci), collected from the centralintrusion near the Freedom Mine.
I-M 38°29'45" N.,112°12'47" W.
4.128 1.978 0.891 2.721
M30 Altered, dense, pink, alunitized Bullion Canyon Volcanics lavaflow (Tbc), collected from the Whitehorse Mine.
M-BC 38°28'25" N.,112°11'27" W.
0.002 0.000187 0.178 2.366
M47B Highly altered, alunitized Bullion Canyon Volcanics lava flow(Tbc), collected from the Yellow Jacket Mine.
H-BC 38°32'04" N.,112°12'30" W.
0.0008 0.00547 13.029 1.969
M49A Devitrified, crystal-rich rhyolite intrusion (Tmi), collected fromthe Teacup dome.
I-R 38°30'41" N.,112°10'35" W.
0.790 0.366 0.858 2.319
M50 Fresh, fine-grained granite (Tmf), collected from the north endof the Central Mining Area.
I-G 38°30'24" N.,112°13'10" W.
0.684 0.231 0.625 2.520
M53 Highly altered, alunitized Bullion Canyon Volcanics lava flow(Tbc), collected from the Winkleman Mine.
H-BC 38°29'38" N.,112°17'32" W.
0.0004 0.00103 4.421 2.652
M75 Devitrified, crystal-rich tuff member of the Mount BelknapVolcanics (Tmc), collected along Beaver Creek, 1.45 km westof the junction of Beaver Creek and the Sevier River.
U-MB,X-TD
38°28'37" N.,112°14'57" W.
0.514 1.955 7.050 2.419
M88 Fresh Gray Hills Rhyolite Member of the Mount BelknapVolcanics (Tmg), collected 2.57 km west-northwest of thejunction of Beaver Creek and the Sevier River.
U-MB,X-R
38°29'05" N.,112°15'35" W.
0.454 0.188 0.765 2.316
M91 Fresh, moderately welded Joe Lott Tuff Member of the MountBelknap Volcanics (Tmj), collected from a road cut alongClear Creek, 3.14 km west of the junction of Clear Creek andthe Sevier River.
U-MB,X-TM
38°34'50" N.,112°17'31" W.
0.0092 0.167 33.582 1.715
M94 Fresh, moderately welded Joe Lott Tuff Member of the MountBelknap Volcanics (Tmj), collected from a road cut on U.S.Highway 89, on south side of rest area alongside Deer Creek.
U-MB,X-TM
38°30'08" N.,112°15'24" W.
0.191 0.207 3.212 2.204
M98 Fresh quartz monzonite (Tbci), collected on Tip Top, near theSevier Mine.
I-M 38°29'20" N.,112°24'31" W.
2.666 20.188 14.021 2.651
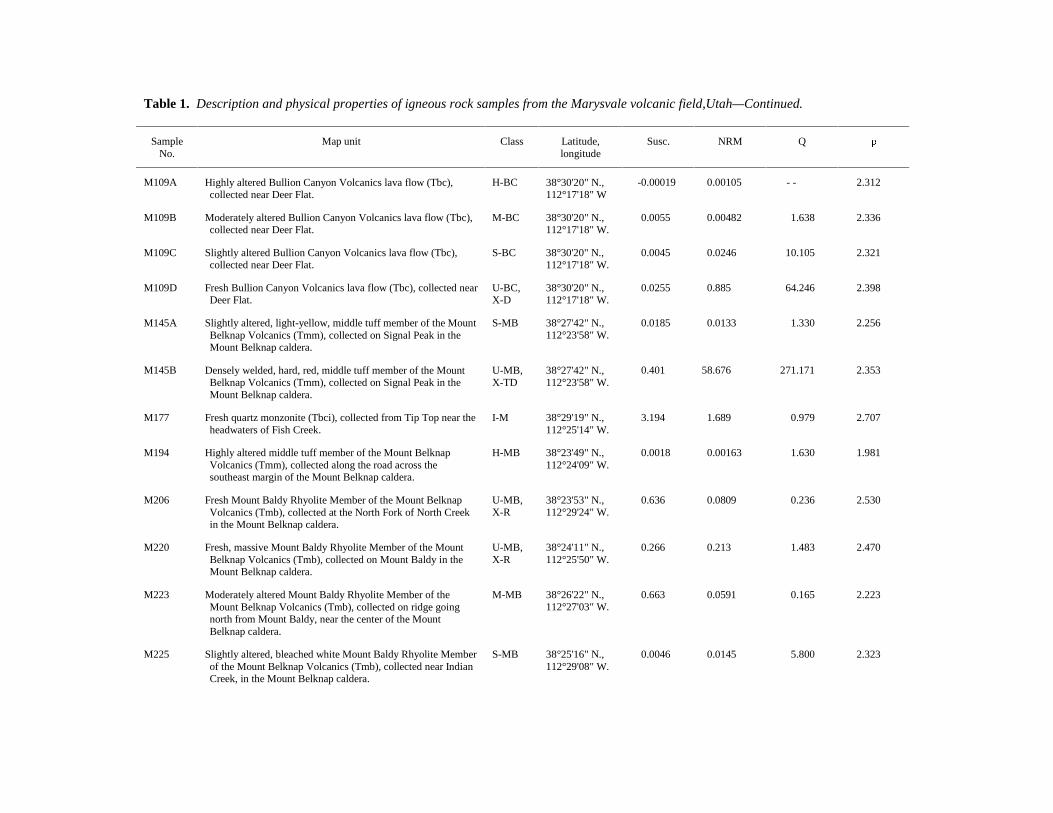
Table 1. Description and physical properties of igneous rock samples from the Marysvale volcanic field,Utah—Continued.
SampleNo.
Map unit Class Latitude,longitude
Susc. NRM Q
M109A Highly altered Bullion Canyon Volcanics lava flow (Tbc),collected near Deer Flat.
H-BC 38°30'20" N.,112°17'18" W
-0.00019 0.00105 - - 2.312
M109B Moderately altered Bullion Canyon Volcanics lava flow (Tbc),collected near Deer Flat.
M-BC 38°30'20" N.,112°17'18" W.
0.0055 0.00482 1.638 2.336
M109C Slightly altered Bullion Canyon Volcanics lava flow (Tbc),collected near Deer Flat.
S-BC 38°30'20" N.,112°17'18" W.
0.0045 0.0246 10.105 2.321
M109D Fresh Bullion Canyon Volcanics lava flow (Tbc), collected nearDeer Flat.
U-BC,X-D
38°30'20" N.,112°17'18" W.
0.0255 0.885 64.246 2.398
M145A Slightly altered, light-yellow, middle tuff member of the MountBelknap Volcanics (Tmm), collected on Signal Peak in theMount Belknap caldera.
S-MB 38°27'42" N.,112°23'58" W.
0.0185 0.0133 1.330 2.256
M145B Densely welded, hard, red, middle tuff member of the MountBelknap Volcanics (Tmm), collected on Signal Peak in theMount Belknap caldera.
U-MB,X-TD
38°27'42" N.,112°23'58" W.
0.401 58.676 271.171 2.353
M177 Fresh quartz monzonite (Tbci), collected from Tip Top near theheadwaters of Fish Creek.
I-M 38°29'19" N.,112°25'14" W.
3.194 1.689 0.979 2.707
M194 Highly altered middle tuff member of the Mount BelknapVolcanics (Tmm), collected along the road across thesoutheast margin of the Mount Belknap caldera.
H-MB 38°23'49" N.,112°24'09" W.
0.0018 0.00163 1.630 1.981
M206 Fresh Mount Baldy Rhyolite Member of the Mount BelknapVolcanics (Tmb), collected at the North Fork of North Creekin the Mount Belknap caldera.
U-MB,X-R
38°23'53" N.,112°29'24" W.
0.636 0.0809 0.236 2.530
M220 Fresh, massive Mount Baldy Rhyolite Member of the MountBelknap Volcanics (Tmb), collected on Mount Baldy in theMount Belknap caldera.
U-MB,X-R
38°24'11" N.,112°25'50" W.
0.266 0.213 1.483 2.470
M223 Moderately altered Mount Baldy Rhyolite Member of theMount Belknap Volcanics (Tmb), collected on ridge goingnorth from Mount Baldy, near the center of the MountBelknap caldera.
M-MB 38°26'22" N.,112°27'03" W.
0.663 0.0591 0.165 2.223
M225 Slightly altered, bleached white Mount Baldy Rhyolite Memberof the Mount Belknap Volcanics (Tmb), collected near IndianCreek, in the Mount Belknap caldera.
S-MB 38°25'16" N.,112°29'08" W.
0.0046 0.0145 5.800 2.323
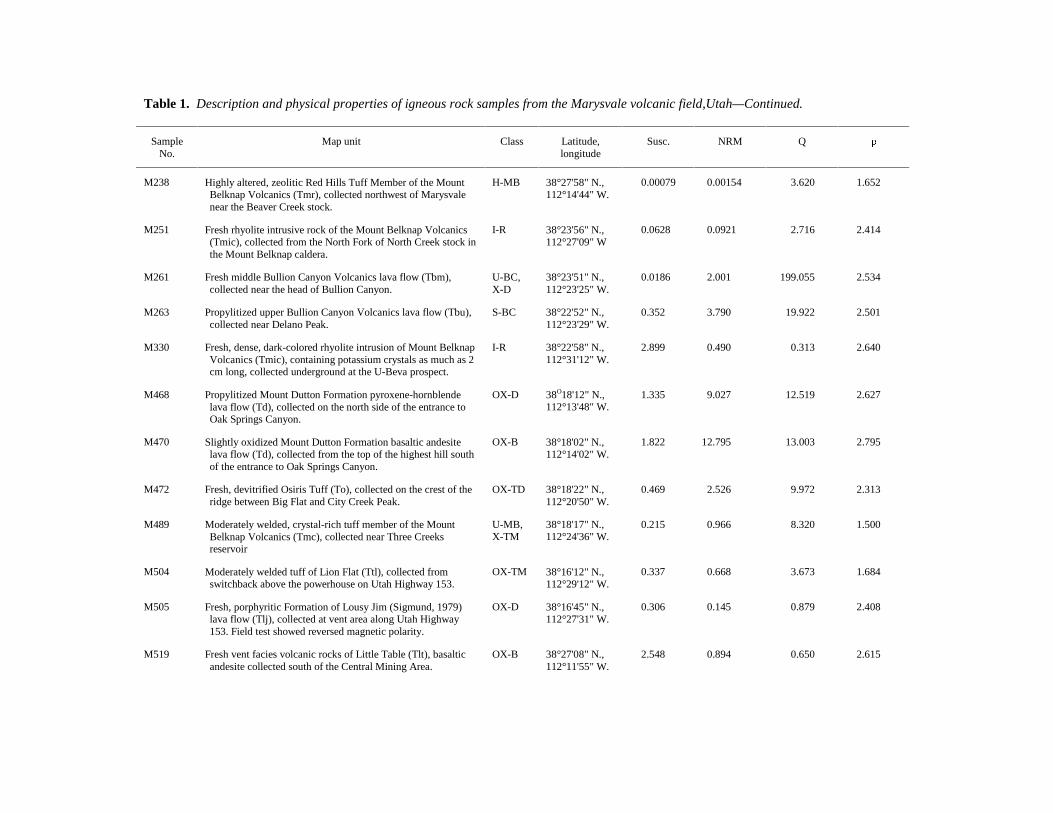
Table 1. Description and physical properties of igneous rock samples from the Marysvale volcanic field,Utah—Continued.
SampleNo.
Map unit Class Latitude,longitude
Susc. NRM Q
M238 Highly altered, zeolitic Red Hills Tuff Member of the MountBelknap Volcanics (Tmr), collected northwest of Marysvalenear the Beaver Creek stock.
H-MB 38°27'58" N.,112°14'44" W.
0.00079 0.00154 3.620 1.652
M251 Fresh rhyolite intrusive rock of the Mount Belknap Volcanics(Tmic), collected from the North Fork of North Creek stock inthe Mount Belknap caldera.
I-R 38°23'56" N.,112°27'09" W
0.0628 0.0921 2.716 2.414
M261 Fresh middle Bullion Canyon Volcanics lava flow (Tbm),collected near the head of Bullion Canyon.
U-BC,X-D
38°23'51" N.,112°23'25" W.
0.0186 2.001 199.055 2.534
M263 Propylitized upper Bullion Canyon Volcanics lava flow (Tbu),collected near Delano Peak.
S-BC 38°22'52" N.,112°23'29" W.
0.352 3.790 19.922 2.501
M330 Fresh, dense, dark-colored rhyolite intrusion of Mount BelknapVolcanics (Tmic), containing potassium crystals as much as 2cm long, collected underground at the U-Beva prospect.
I-R 38°22'58" N.,112°31'12" W.
2.899 0.490 0.313 2.640
M468 Propylitized Mount Dutton Formation pyroxene-hornblendelava flow (Td), collected on the north side of the entrance toOak Springs Canyon.
OX-D 38O18'12" N.,112°13'48" W.
1.335 9.027 12.519 2.627
M470 Slightly oxidized Mount Dutton Formation basaltic andesitelava flow (Td), collected from the top of the highest hill southof the entrance to Oak Springs Canyon.
OX-B 38°18'02" N.,112°14'02" W.
1.822 12.795 13.003 2.795
M472 Fresh, devitrified Osiris Tuff (To), collected on the crest of theridge between Big Flat and City Creek Peak.
OX-TD 38°18'22" N.,112°20'50" W.
0.469 2.526 9.972 2.313
M489 Moderately welded, crystal-rich tuff member of the MountBelknap Volcanics (Tmc), collected near Three Creeksreservoir
U-MB,X-TM
38°18'17" N.,112°24'36" W.
0.215 0.966 8.320 1.500
M504 Moderately welded tuff of Lion Flat (Ttl), collected fromswitchback above the powerhouse on Utah Highway 153.
OX-TM 38°16'12" N.,112°29'12" W.
0.337 0.668 3.673 1.684
M505 Fresh, porphyritic Formation of Lousy Jim (Sigmund, 1979)lava flow (Tlj), collected at vent area along Utah Highway153. Field test showed reversed magnetic polarity.
OX-D 38°16'45" N.,112°27'31" W.
0.306 0.145 0.879 2.408
M519 Fresh vent facies volcanic rocks of Little Table (Tlt), basalticandesite collected south of the Central Mining Area.
OX-B 38°27'08" N.,112°11'55" W.
2.548 0.894 0.650 2.615
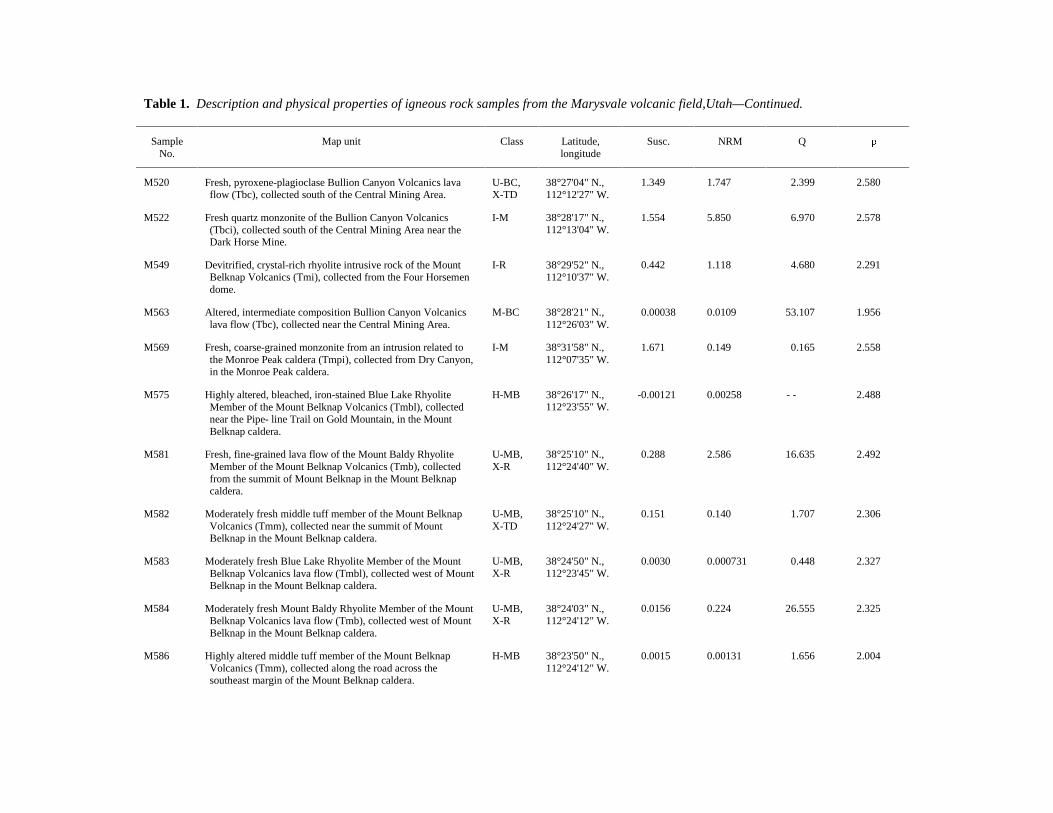
Table 1. Description and physical properties of igneous rock samples from the Marysvale volcanic field,Utah—Continued.
SampleNo.
Map unit Class Latitude,longitude
Susc. NRM Q
M520 Fresh, pyroxene-plagioclase Bullion Canyon Volcanics lavaflow (Tbc), collected south of the Central Mining Area.
U-BC,X-TD
38°27'04" N.,112°12'27" W.
1.349 1.747 2.399 2.580
M522 Fresh quartz monzonite of the Bullion Canyon Volcanics(Tbci), collected south of the Central Mining Area near theDark Horse Mine.
I-M 38°28'17" N.,112°13'04" W.
1.554 5.850 6.970 2.578
M549 Devitrified, crystal-rich rhyolite intrusive rock of the MountBelknap Volcanics (Tmi), collected from the Four Horsemendome.
I-R 38°29'52" N.,112°10'37" W.
0.442 1.118 4.680 2.291
M563 Altered, intermediate composition Bullion Canyon Volcanicslava flow (Tbc), collected near the Central Mining Area.
M-BC 38°28'21" N.,112°26'03" W.
0.00038 0.0109 53.107 1.956
M569 Fresh, coarse-grained monzonite from an intrusion related tothe Monroe Peak caldera (Tmpi), collected from Dry Canyon,in the Monroe Peak caldera.
I-M 38°31'58" N.,112°07'35" W.
1.671 0.149 0.165 2.558
M575 Highly altered, bleached, iron-stained Blue Lake RhyoliteMember of the Mount Belknap Volcanics (Tmbl), collectednear the Pipe- line Trail on Gold Mountain, in the MountBelknap caldera.
H-MB 38°26'17" N.,112°23'55" W.
-0.00121 0.00258 - - 2.488
M581 Fresh, fine-grained lava flow of the Mount Baldy RhyoliteMember of the Mount Belknap Volcanics (Tmb), collectedfrom the summit of Mount Belknap in the Mount Belknapcaldera.
U-MB,X-R
38°25'10" N.,112°24'40" W.
0.288 2.586 16.635 2.492
M582 Moderately fresh middle tuff member of the Mount BelknapVolcanics (Tmm), collected near the summit of MountBelknap in the Mount Belknap caldera.
U-MB,X-TD
38°25'10" N.,112°24'27" W.
0.151 0.140 1.707 2.306
M583 Moderately fresh Blue Lake Rhyolite Member of the MountBelknap Volcanics lava flow (Tmbl), collected west of MountBelknap in the Mount Belknap caldera.
U-MB,X-R
38°24'50" N.,112°23'45" W.
0.0030 0.000731 0.448 2.327
M584 Moderately fresh Mount Baldy Rhyolite Member of the MountBelknap Volcanics lava flow (Tmb), collected west of MountBelknap in the Mount Belknap caldera.
U-MB,X-R
38°24'03" N.,112°24'12" W.
0.0156 0.224 26.555 2.325
M586 Highly altered middle tuff member of the Mount BelknapVolcanics (Tmm), collected along the road across thesoutheast margin of the Mount Belknap caldera.
H-MB 38°23'50" N.,112°24'12" W.
0.0015 0.00131 1.656 2.004
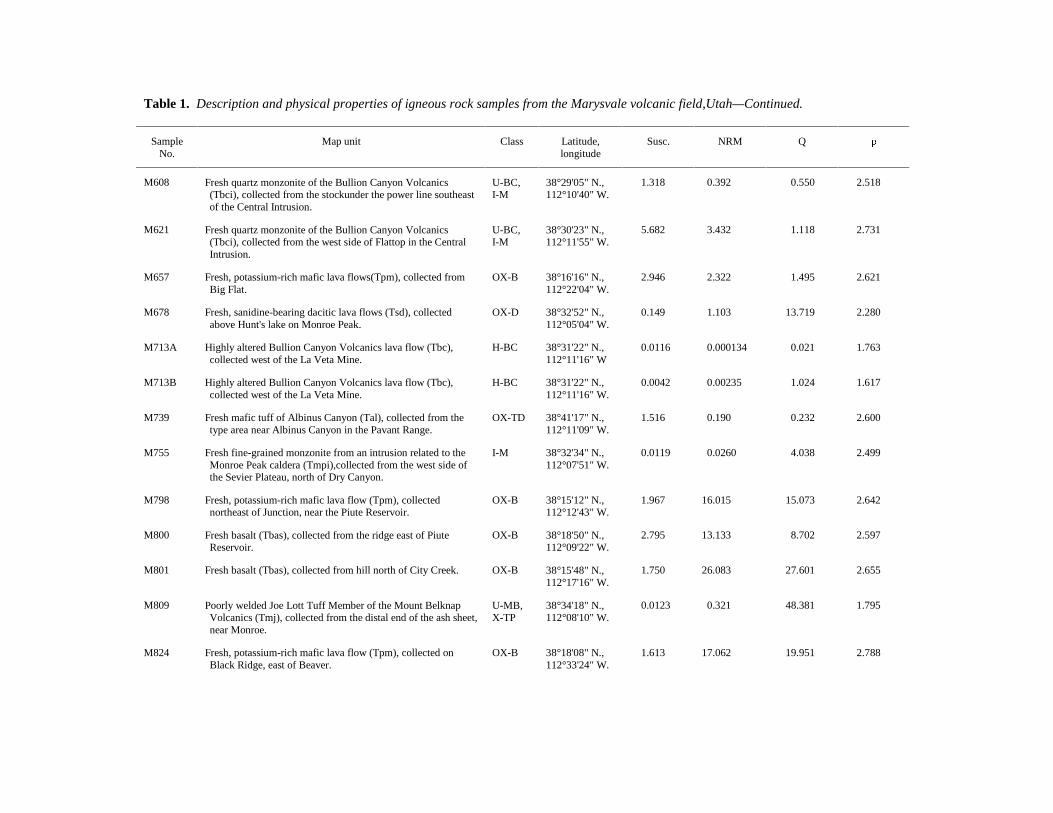
Table 1. Description and physical properties of igneous rock samples from the Marysvale volcanic field,Utah—Continued.
SampleNo.
Map unit Class Latitude,longitude
Susc. NRM Q
M608 Fresh quartz monzonite of the Bullion Canyon Volcanics(Tbci), collected from the stockunder the power line southeastof the Central Intrusion.
U-BC,I-M
38°29'05" N.,112°10'40" W.
1.318 0.392 0.550 2.518
M621 Fresh quartz monzonite of the Bullion Canyon Volcanics(Tbci), collected from the west side of Flattop in the CentralIntrusion.
U-BC,I-M
38°30'23" N.,112°11'55" W.
5.682 3.432 1.118 2.731
M657 Fresh, potassium-rich mafic lava flows(Tpm), collected fromBig Flat.
OX-B 38°16'16" N.,112°22'04" W.
2.946 2.322 1.495 2.621
M678 Fresh, sanidine-bearing dacitic lava flows (Tsd), collectedabove Hunt's lake on Monroe Peak.
OX-D 38°32'52" N.,112°05'04" W.
0.149 1.103 13.719 2.280
M713A Highly altered Bullion Canyon Volcanics lava flow (Tbc),collected west of the La Veta Mine.
H-BC 38°31'22" N.,112°11'16" W
0.0116 0.000134 0.021 1.763
M713B Highly altered Bullion Canyon Volcanics lava flow (Tbc),collected west of the La Veta Mine.
H-BC 38°31'22" N.,112°11'16" W.
0.0042 0.00235 1.024 1.617
M739 Fresh mafic tuff of Albinus Canyon (Tal), collected from thetype area near Albinus Canyon in the Pavant Range.
OX-TD 38°41'17" N.,112°11'09" W.
1.516 0.190 0.232 2.600
M755 Fresh fine-grained monzonite from an intrusion related to theMonroe Peak caldera (Tmpi),collected from the west side ofthe Sevier Plateau, north of Dry Canyon.
I-M 38°32'34" N.,112°07'51" W.
0.0119 0.0260 4.038 2.499
M798 Fresh, potassium-rich mafic lava flow (Tpm), collectednortheast of Junction, near the Piute Reservoir.
OX-B 38°15'12" N.,112°12'43" W.
1.967 16.015 15.073 2.642
M800 Fresh basalt (Tbas), collected from the ridge east of PiuteReservoir.
OX-B 38°18'50" N.,112°09'22" W.
2.795 13.133 8.702 2.597
M801 Fresh basalt (Tbas), collected from hill north of City Creek. OX-B 38°15'48" N.,112°17'16" W.
1.750 26.083 27.601 2.655
M809 Poorly welded Joe Lott Tuff Member of the Mount BelknapVolcanics (Tmj), collected from the distal end of the ash sheet,near Monroe.
U-MB,X-TP
38°34'18" N.,112°08'10" W.
0.0123 0.321 48.381 1.795
M824 Fresh, potassium-rich mafic lava flow (Tpm), collected onBlack Ridge, east of Beaver.
OX-B 38°18'08" N.,112°33'24" W.
1.613 17.062 19.951 2.788
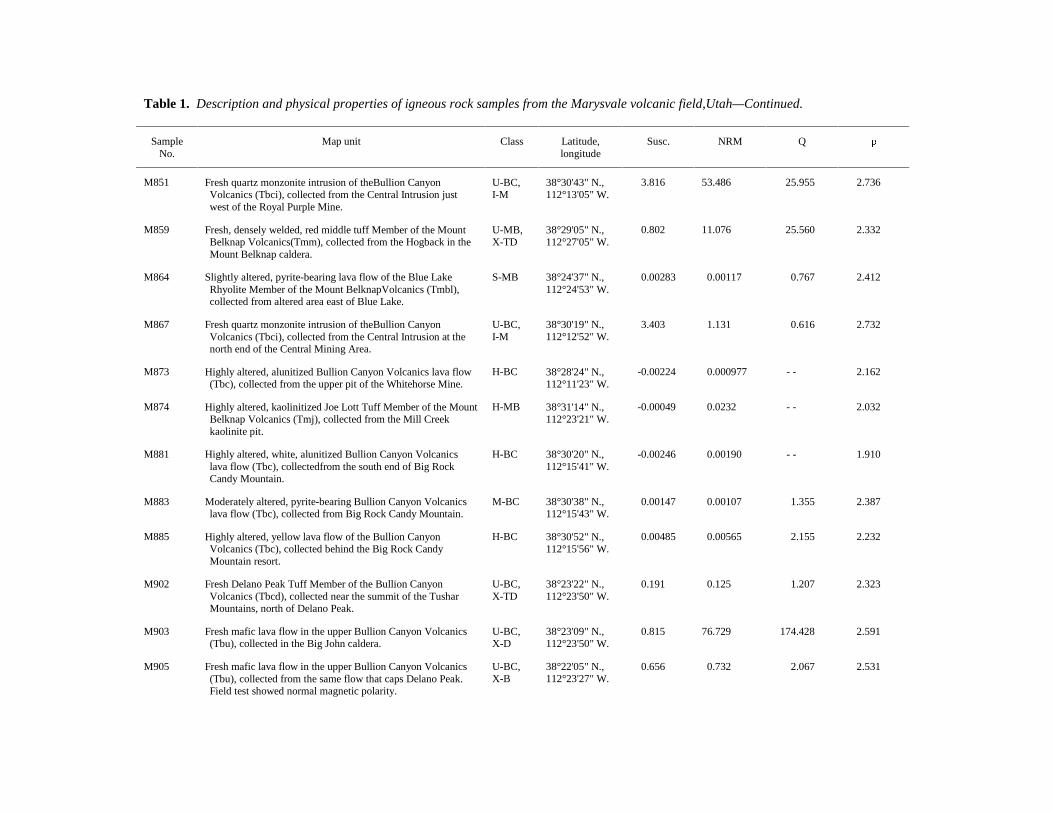
Table 1. Description and physical properties of igneous rock samples from the Marysvale volcanic field,Utah—Continued.
SampleNo.
Map unit Class Latitude,longitude
Susc. NRM Q
M851 Fresh quartz monzonite intrusion of theBullion CanyonVolcanics (Tbci), collected from the Central Intrusion justwest of the Royal Purple Mine.
U-BC,I-M
38°30'43" N.,112°13'05" W.
3.816 53.486 25.955 2.736
M859 Fresh, densely welded, red middle tuff Member of the MountBelknap Volcanics(Tmm), collected from the Hogback in theMount Belknap caldera.
U-MB,X-TD
38°29'05" N.,112°27'05" W.
0.802 11.076 25.560 2.332
M864 Slightly altered, pyrite-bearing lava flow of the Blue LakeRhyolite Member of the Mount BelknapVolcanics (Tmbl),collected from altered area east of Blue Lake.
S-MB 38°24'37" N.,112°24'53" W.
0.00283 0.00117 0.767 2.412
M867 Fresh quartz monzonite intrusion of theBullion CanyonVolcanics (Tbci), collected from the Central Intrusion at thenorth end of the Central Mining Area.
U-BC,I-M
38°30'19" N.,112°12'52" W.
3.403 1.131 0.616 2.732
M873 Highly altered, alunitized Bullion Canyon Volcanics lava flow(Tbc), collected from the upper pit of the Whitehorse Mine.
H-BC 38°28'24" N.,112°11'23" W.
-0.00224 0.000977 - - 2.162
M874 Highly altered, kaolinitized Joe Lott Tuff Member of the MountBelknap Volcanics (Tmj), collected from the Mill Creekkaolinite pit.
H-MB 38°31'14" N.,112°23'21" W.
-0.00049 0.0232 - - 2.032
M881 Highly altered, white, alunitized Bullion Canyon Volcanicslava flow (Tbc), collectedfrom the south end of Big RockCandy Mountain.
H-BC 38°30'20" N.,112°15'41" W.
-0.00246 0.00190 - - 1.910
M883 Moderately altered, pyrite-bearing Bullion Canyon Volcanicslava flow (Tbc), collected from Big Rock Candy Mountain.
M-BC 38°30'38" N.,112°15'43" W.
0.00147 0.00107 1.355 2.387
M885 Highly altered, yellow lava flow of the Bullion CanyonVolcanics (Tbc), collected behind the Big Rock CandyMountain resort.
H-BC 38°30'52" N.,112°15'56" W.
0.00485 0.00565 2.155 2.232
M902 Fresh Delano Peak Tuff Member of the Bullion CanyonVolcanics (Tbcd), collected near the summit of the TusharMountains, north of Delano Peak.
U-BC,X-TD
38°23'22" N.,112°23'50" W.
0.191 0.125 1.207 2.323
M903 Fresh mafic lava flow in the upper Bullion Canyon Volcanics(Tbu), collected in the Big John caldera.
U-BC,X-D
38°23'09" N.,112°23'50" W.
0.815 76.729 174.428 2.591
M905 Fresh mafic lava flow in the upper Bullion Canyon Volcanics(Tbu), collected from the same flow that caps Delano Peak.Field test showed normal magnetic polarity.
U-BC,X-B
38°22'05" N.,112°23'27" W.
0.656 0.732 2.067 2.531
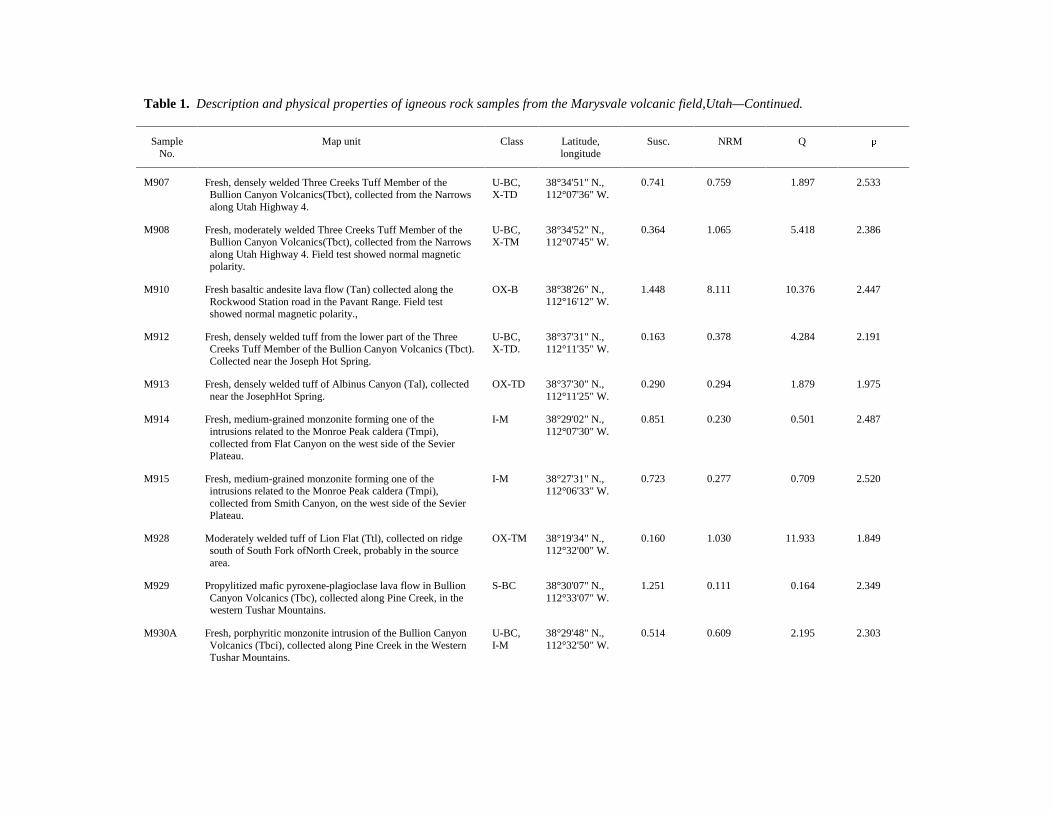
Table 1. Description and physical properties of igneous rock samples from the Marysvale volcanic field,Utah—Continued.
SampleNo.
Map unit Class Latitude,longitude
Susc. NRM Q
M907 Fresh, densely welded Three Creeks Tuff Member of theBullion Canyon Volcanics(Tbct), collected from the Narrowsalong Utah Highway 4.
U-BC,X-TD
38°34'51" N.,112°07'36" W.
0.741 0.759 1.897 2.533
M908 Fresh, moderately welded Three Creeks Tuff Member of theBullion Canyon Volcanics(Tbct), collected from the Narrowsalong Utah Highway 4. Field test showed normal magneticpolarity.
U-BC,X-TM
38°34'52" N.,112°07'45" W.
0.364 1.065 5.418 2.386
M910 Fresh basaltic andesite lava flow (Tan) collected along theRockwood Station road in the Pavant Range. Field testshowed normal magnetic polarity.,
OX-B 38°38'26" N.,112°16'12" W.
1.448 8.111 10.376 2.447
M912 Fresh, densely welded tuff from the lower part of the ThreeCreeks Tuff Member of the Bullion Canyon Volcanics (Tbct).Collected near the Joseph Hot Spring.
U-BC,X-TD.
38°37'31" N.,112°11'35" W.
0.163 0.378 4.284 2.191
M913 Fresh, densely welded tuff of Albinus Canyon (Tal), collectednear the JosephHot Spring.
OX-TD 38°37'30" N.,112°11'25" W.
0.290 0.294 1.879 1.975
M914 Fresh, medium-grained monzonite forming one of theintrusions related to the Monroe Peak caldera (Tmpi),collected from Flat Canyon on the west side of the SevierPlateau.
I-M 38°29'02" N.,112°07'30" W.
0.851 0.230 0.501 2.487
M915 Fresh, medium-grained monzonite forming one of theintrusions related to the Monroe Peak caldera (Tmpi),collected from Smith Canyon, on the west side of the SevierPlateau.
I-M 38°27'31" N.,112°06'33" W.
0.723 0.277 0.709 2.520
M928 Moderately welded tuff of Lion Flat (Ttl), collected on ridgesouth of South Fork ofNorth Creek, probably in the sourcearea.
OX-TM 38°19'34" N.,112°32'00" W.
0.160 1.030 11.933 1.849
M929 Propylitized mafic pyroxene-plagioclase lava flow in BullionCanyon Volcanics (Tbc), collected along Pine Creek, in thewestern Tushar Mountains.
S-BC 38°30'07" N.,112°33'07" W.
1.251 0.111 0.164 2.349
M930A Fresh, porphyritic monzonite intrusion of the Bullion CanyonVolcanics (Tbci), collected along Pine Creek in the WesternTushar Mountains.
U-BC,I-M
38°29'48" N.,112°32'50" W.
0.514 0.609 2.195 2.303
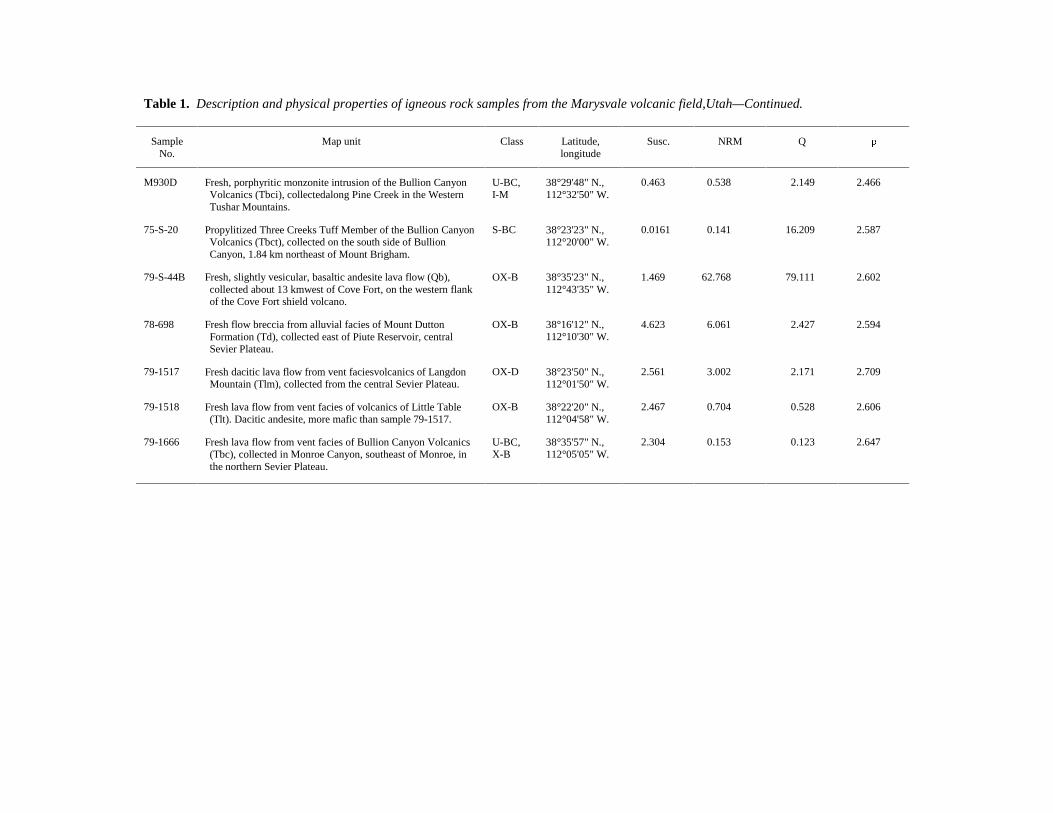
Table 1. Description and physical properties of igneous rock samples from the Marysvale volcanic field,Utah—Continued.
SampleNo.
Map unit Class Latitude,longitude
Susc. NRM Q
M930D Fresh, porphyritic monzonite intrusion of the Bullion CanyonVolcanics (Tbci), collectedalong Pine Creek in the WesternTushar Mountains.
U-BC,I-M
38°29'48" N.,112°32'50" W.
0.463 0.538 2.149 2.466
75-S-20 Propylitized Three Creeks Tuff Member of the Bullion CanyonVolcanics (Tbct), collected on the south side of BullionCanyon, 1.84 km northeast of Mount Brigham.
S-BC 38°23'23" N.,112°20'00" W.
0.0161 0.141 16.209 2.587
79-S-44B Fresh, slightly vesicular, basaltic andesite lava flow (Qb),collected about 13 kmwest of Cove Fort, on the western flankof the Cove Fort shield volcano.
OX-B 38°35'23" N.,112°43'35" W.
1.469 62.768 79.111 2.602
78-698 Fresh flow breccia from alluvial facies of Mount DuttonFormation (Td), collected east of Piute Reservoir, centralSevier Plateau.
OX-B 38°16'12" N.,112°10'30" W.
4.623 6.061 2.427 2.594
79-1517 Fresh dacitic lava flow from vent faciesvolcanics of LangdonMountain (Tlm), collected from the central Sevier Plateau.
OX-D 38°23'50" N.,112°01'50" W.
2.561 3.002 2.171 2.709
79-1518 Fresh lava flow from vent facies of volcanics of Little Table(Tlt). Dacitic andesite, more mafic than sample 79-1517.
OX-B 38°22'20" N.,112°04'58" W.
2.467 0.704 0.528 2.606
79-1666 Fresh lava flow from vent facies of Bullion Canyon Volcanics(Tbc), collected in Monroe Canyon, southeast of Monroe, inthe northern Sevier Plateau.
U-BC,X-B
38°35'57" N.,112°05'05" W.
2.304 0.153 0.123 2.647
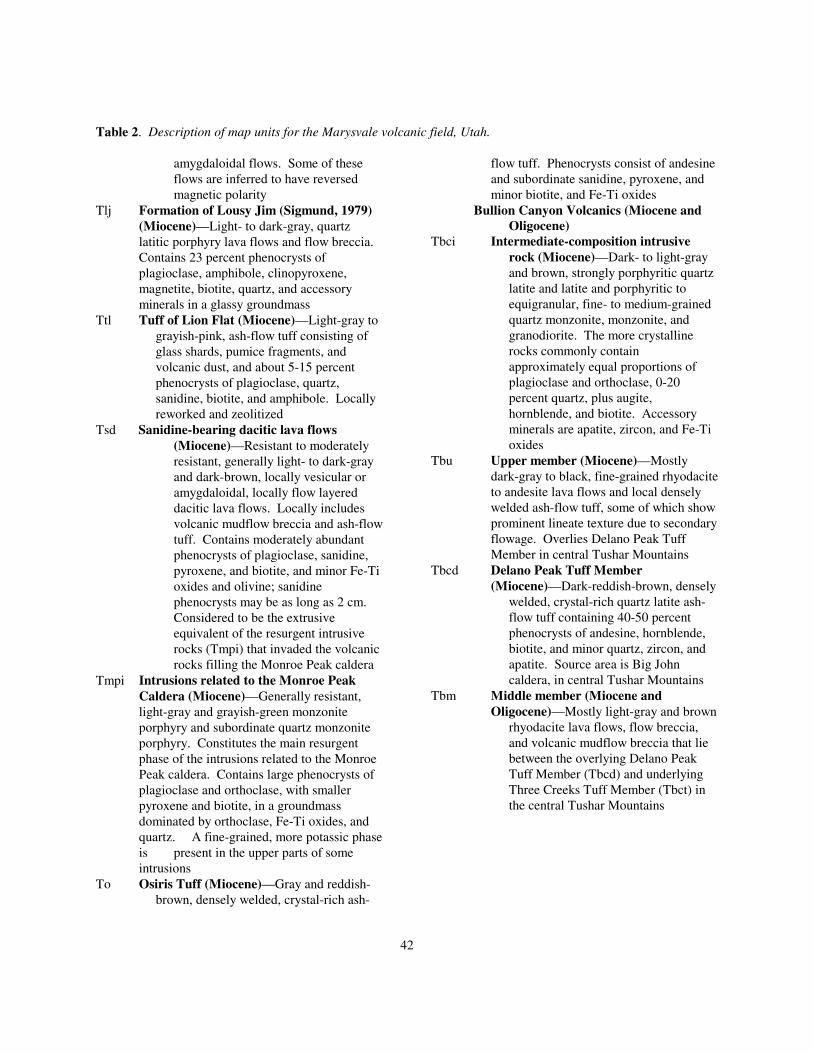
42
Table 2. Description of map units for the Marysvale volcanic field, Utah.
amygdaloidal flows. Some of these flow tuff. Phenocrysts consist of andesineflows are inferred to have reversed and subordinate sanidine, pyroxene, andmagnetic polarity minor biotite, and Fe-Ti oxides
Tlj Formation of Lousy Jim (Sigmund, 1979) Bullion Canyon Volcanics (Miocene and (Miocene)—Light- to dark-gray, quartz latitic porphyry lava flows and flow breccia. Contains 23 percent phenocrysts ofplagioclase, amphibole, clinopyroxene, magnetite, biotite, quartz, and accessoryminerals in a glassy groundmass
Ttl Tuff of Lion Flat (Miocene)—Light-gray to grayish-pink, ash-flow tuff consisting ofglass shards, pumice fragments, and volcanic dust, and about 5-15 percent phenocrysts of plagioclase, quartz, sanidine, biotite, and amphibole. Locallyreworked and zeolitized
Tsd Sanidine-bearing dacitic lava flows (Miocene)—Resistant to moderately resistant, generally light- to dark-grayand dark-brown, locally vesicular oramygdaloidal, locally flow layereddacitic lava flows. Locally includesvolcanic mudflow breccia and ash-flowtuff. Contains moderately abundant phenocrysts of plagioclase, sanidine,pyroxene, and biotite, and minor Fe-Tioxides and olivine; sanidinephenocrysts may be as long as 2 cm. Considered to be the extrusiveequivalent of the resurgent intrusiverocks (Tmpi) that invaded the volcanicrocks filling the Monroe Peak caldera
Tmpi Intrusions related to the Monroe Peak Caldera (Miocene)—Generally resistant, light-gray and grayish-green monzoniteporphyry and subordinate quartz monzoniteporphyry. Constitutes the main resurgentphase of the intrusions related to the Monroe Peak caldera. Contains large phenocrysts of plagioclase and orthoclase, with smallerpyroxene and biotite, in a groundmassdominated by orthoclase, Fe-Ti oxides, andquartz. A fine-grained, more potassic phaseis present in the upper parts of some intrusions
To Osiris Tuff (Miocene)—Gray and reddish-brown, densely welded, crystal-rich ash-
Oligocene)Tbci Intermediate-composition intrusive
rock (Miocene)—Dark- to light-gray and brown, strongly porphyritic quartz latite and latite and porphyritic toequigranular, fine- to medium-grainedquartz monzonite, monzonite, andgranodiorite. The more crystallinerocks commonly contain approximately equal proportions ofplagioclase and orthoclase, 0-20percent quartz, plus augite, hornblende, and biotite. Accessoryminerals are apatite, zircon, and Fe-Tioxides
Tbu Upper member (Miocene)—Mostly dark-gray to black, fine-grained rhyodaciteto andesite lava flows and local denselywelded ash-flow tuff, some of which showprominent lineate texture due to secondaryflowage. Overlies Delano Peak TuffMember in central Tushar Mountains
Tbcd Delano Peak Tuff Member (Miocene)—Dark-reddish-brown, densely
welded, crystal-rich quartz latite ash-flow tuff containing 40-50 percentphenocrysts of andesine, hornblende,biotite, and minor quartz, zircon, andapatite. Source area is Big Johncaldera, in central Tushar Mountains
Tbm Middle member (Miocene and Oligocene)—Mostly light-gray and brown
rhyodacite lava flows, flow breccia,and volcanic mudflow breccia that liebetween the overlying Delano PeakTuff Member (Tbcd) and underlyingThree Creeks Tuff Member (Tbct) inthe central Tushar Mountains
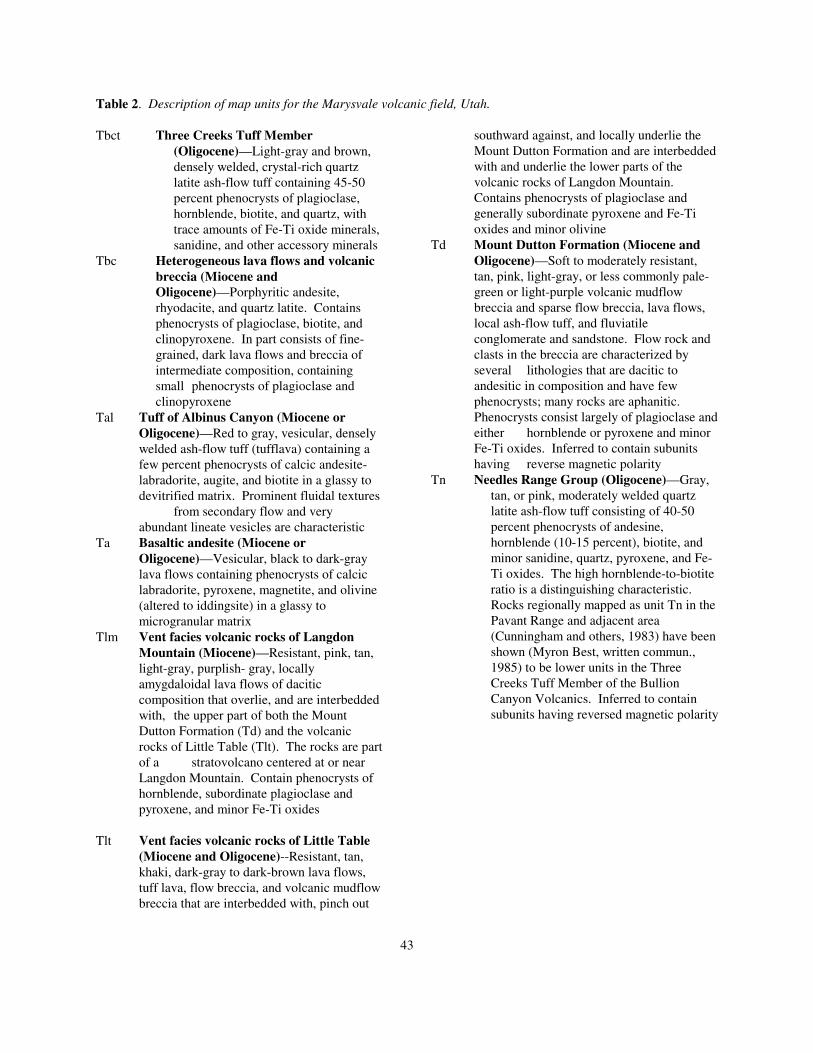
43
Table 2. Description of map units for the Marysvale volcanic field, Utah.
Tbct Three Creeks Tuff Member (Oligocene)—Light-gray and brown, densely welded, crystal-rich quartz latite ash-flow tuff containing 45-50 percent phenocrysts of plagioclase, hornblende, biotite, and quartz, withtrace amounts of Fe-Ti oxide minerals,sanidine, and other accessory minerals
Tbc Heterogeneous lava flows and volcanic breccia (Miocene andOligocene)—Porphyritic andesite, rhyodacite, and quartz latite. Contains phenocrysts of plagioclase, biotite, andclinopyroxene. In part consists of fine-grained, dark lava flows and breccia ofintermediate composition, containing small phenocrysts of plagioclase and clinopyroxene
Tal Tuff of Albinus Canyon (Miocene or Oligocene)—Red to gray, vesicular, densely welded ash-flow tuff (tufflava) containing afew percent phenocrysts of calcic andesite-labradorite, augite, and biotite in a glassy todevitrified matrix. Prominent fluidal textures
from secondary flow and very abundant lineate vesicles are characteristic
Ta Basaltic andesite (Miocene or Oligocene)—Vesicular, black to dark-gray lava flows containing phenocrysts of calciclabradorite, pyroxene, magnetite, and olivine(altered to iddingsite) in a glassy to microgranular matrix
Tlm Vent facies volcanic rocks of Langdon Mountain (Miocene)—Resistant, pink, tan, light-gray, purplish- gray, locallyamygdaloidal lava flows of daciticcomposition that overlie, and are interbeddedwith, the upper part of both the MountDutton Formation (Td) and the volcanicrocks of Little Table (Tlt). The rocks are partof a stratovolcano centered at or near Langdon Mountain. Contain phenocrysts of hornblende, subordinate plagioclase andpyroxene, and minor Fe-Ti oxides
Tlt Vent facies volcanic rocks of Little Table (Miocene and Oligocene)--Resistant, tan,khaki, dark-gray to dark-brown lava flows,tuff lava, flow breccia, and volcanic mudflowbreccia that are interbedded with, pinch out
southward against, and locally underlie theMount Dutton Formation and are interbeddedwith and underlie the lower parts of thevolcanic rocks of Langdon Mountain. Contains phenocrysts of plagioclase andgenerally subordinate pyroxene and Fe-Tioxides and minor olivine
Td Mount Dutton Formation (Miocene and Oligocene)—Soft to moderately resistant, tan, pink, light-gray, or less commonly pale-green or light-purple volcanic mudflowbreccia and sparse flow breccia, lava flows,local ash-flow tuff, and fluviatileconglomerate and sandstone. Flow rock andclasts in the breccia are characterized byseveral lithologies that are dacitic toandesitic in composition and have few phenocrysts; many rocks are aphanitic. Phenocrysts consist largely of plagioclase andeither hornblende or pyroxene and minorFe-Ti oxides. Inferred to contain subunitshaving reverse magnetic polarity
Tn Needles Range Group (Oligocene)—Gray, tan, or pink, moderately welded quartz latite ash-flow tuff consisting of 40-50 percent phenocrysts of andesine, hornblende (10-15 percent), biotite, andminor sanidine, quartz, pyroxene, and Fe-Ti oxides. The high hornblende-to-biotiteratio is a distinguishing characteristic. Rocks regionally mapped as unit Tn in thePavant Range and adjacent area(Cunningham and others, 1983) have beenshown (Myron Best, written commun.,1985) to be lower units in the ThreeCreeks Tuff Member of the BullionCanyon Volcanics. Inferred to containsubunits having reversed magnetic polarity
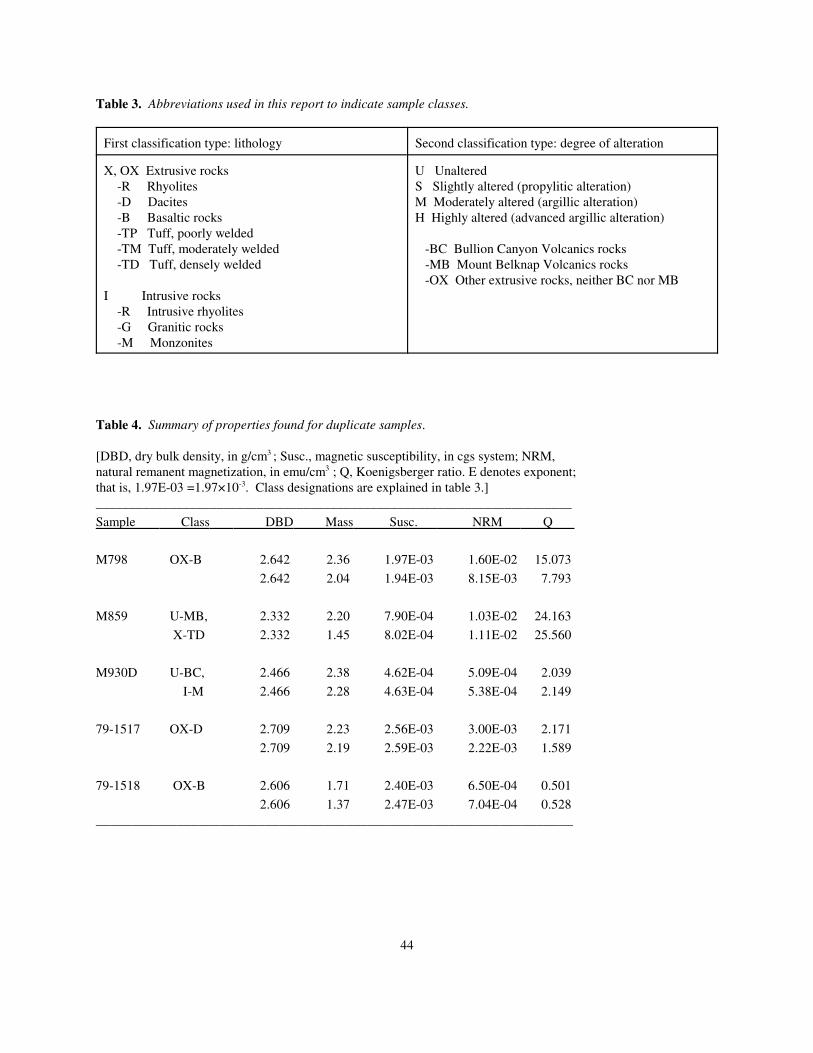
44
Table 3. Abbreviations used in this report to indicate sample classes.
First classification type: lithology Second classification type: degree of alteration
X, OX Extrusive rocks U Unaltered -R Rhyolites S Slightly altered (propylitic alteration) -D Dacites M Moderately altered (argillic alteration) -B Basaltic rocks H Highly altered (advanced argillic alteration) -TP Tuff, poorly welded -TM Tuff, moderately welded -BC Bullion Canyon Volcanics rocks -TD Tuff, densely welded -MB Mount Belknap Volcanics rocks
I Intrusive rocks -R Intrusive rhyolites -G Granitic rocks -M Monzonites
-OX Other extrusive rocks, neither BC nor MB
Table 4. Summary of properties found for duplicate samples. [DBD, dry bulk density, in g/cm ; Susc., magnetic susceptibility, in cgs system; NRM, 3
natural remanent magnetization, in emu/cm ; Q, Koenigsberger ratio. E denotes exponent; 3
that is, 1.97E-03 =1.97×10 . Class designations are explained in table 3.]-3
_______________________________________________________________________
Sample Class DBD Mass Susc. NRM Q
M798 OX-B 2.642 2.36 1.97E-03 1.60E-02 15.073
2.642 2.04 1.94E-03 8.15E-03 7.793
M859 U-MB, 2.332 2.20 7.90E-04 1.03E-02 24.163
X-TD 2.332 1.45 8.02E-04 1.11E-02 25.560
M930D U-BC, 2.466 2.38 4.62E-04 5.09E-04 2.039
I-M 2.466 2.28 4.63E-04 5.38E-04 2.149
79-1517 OX-D 2.709 2.23 2.56E-03 3.00E-03 2.171
2.709 2.19 2.59E-03 2.22E-03 1.589
79-1518 OX-B 2.606 1.71 2.40E-03 6.50E-04 0.501
2.606 1.37 2.47E-03 7.04E-04 0.528 _________________________________________________________________
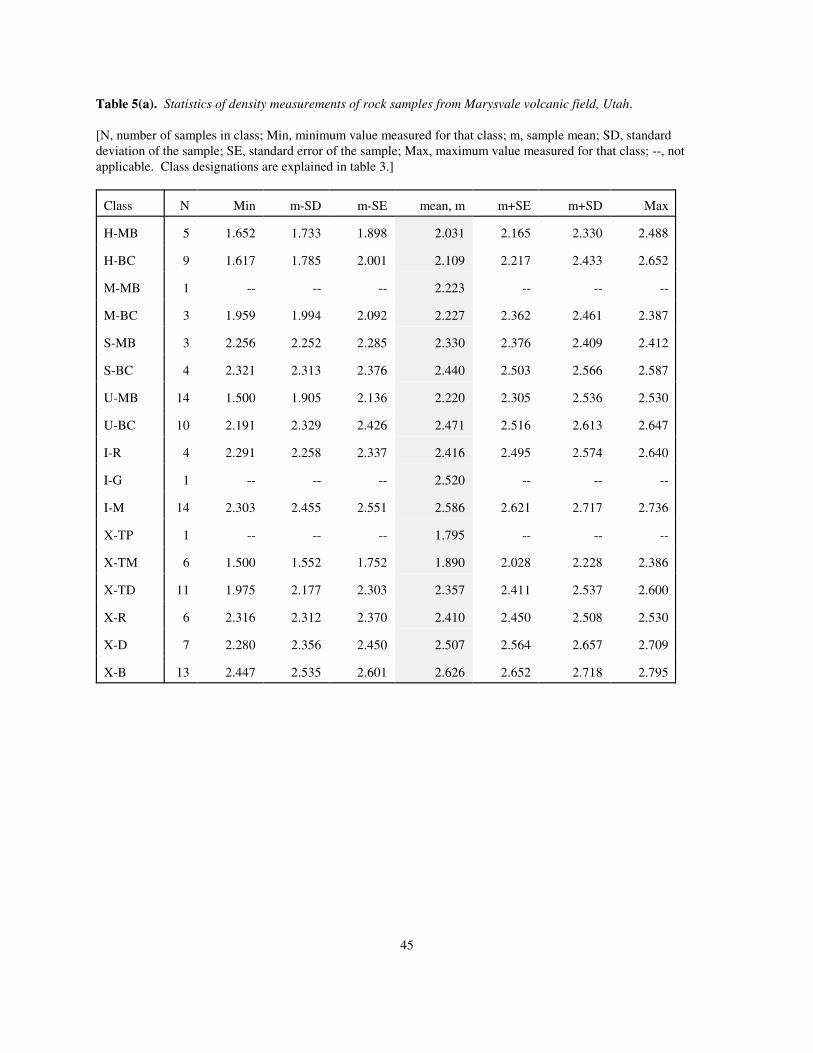
45
Table 5(a). Statistics of density measurements of rock samples from Marysvale volcanic field, Utah.
[N, number of samples in class; Min, minimum value measured for that class; m, sample mean; SD, standarddeviation of the sample; SE, standard error of the sample; Max, maximum value measured for that class; --, notapplicable. Class designations are explained in table 3.]
Class N Min m-SD m-SE mean, m m+SE m+SD Max
H-MB 5 1.652 1.733 1.898 2.031 2.165 2.330 2.488
H-BC 9 1.617 1.785 2.001 2.109 2.217 2.433 2.652
M-MB 1 -- -- -- 2.223 -- -- --
M-BC 3 1.959 1.994 2.092 2.227 2.362 2.461 2.387
S-MB 3 2.256 2.252 2.285 2.330 2.376 2.409 2.412
S-BC 4 2.321 2.313 2.376 2.440 2.503 2.566 2.587
U-MB 14 1.500 1.905 2.136 2.220 2.305 2.536 2.530
U-BC 10 2.191 2.329 2.426 2.471 2.516 2.613 2.647
I-R 4 2.291 2.258 2.337 2.416 2.495 2.574 2.640
I-G 1 -- -- -- 2.520 -- -- --
I-M 14 2.303 2.455 2.551 2.586 2.621 2.717 2.736
X-TP 1 -- -- -- 1.795 -- -- --
X-TM 6 1.500 1.552 1.752 1.890 2.028 2.228 2.386
X-TD 11 1.975 2.177 2.303 2.357 2.411 2.537 2.600
X-R 6 2.316 2.312 2.370 2.410 2.450 2.508 2.530
X-D 7 2.280 2.356 2.450 2.507 2.564 2.657 2.709
X-B 13 2.447 2.535 2.601 2.626 2.652 2.718 2.795

46
Table 5(b). Statistics of susceptibility measurements of rock samples from Marysvale volcanic field, Utah.
Class N Min m-SD m-SE mean, m m+SE m+SD Max
H-MB 3 7.89E-7 8.29E-7 1.06E-6 1.29E-6 1.57E-6 2.00E-6 1.85E-6
H-BC 6 4.33E-7 6.80E-7 1.54E-6 2.32E-6 3.50E-6 7.94E-6 1.16E-5
M-MB 1 -- -- -- 6.63E-4 -- -- --
M-BC 3 3.79E-7 3.82E-7 6.70E-7 1.45E-6 3.12E-6 5.48E-6 5.45E-6
S-MB 3 2.83E-6 2.36E-6 3.55E-6 6.23E-6 1.09E-5 1.65E-5 1.85E-5
S-BC 4 4.50E-6 5.48E-6 2.03E-5 7.52E-5 2.79E-4 1.03E-3 1.25E-3
U-MB 11 3.02E-6 1.87E-5 7.10E-5 1.16E-4 1.88E-4 7.12E-4 8.02E-4
U-BC 10 1.86E-5 6.08E-5 1.83E-4 3.04E-4 5.05E-4 1.51E-3 2.30E-3
I-R 4 6.28E-5 1.02E-4 2.26E-4 5.02E-4 1.11E-3 2.47E-3 2.90E-3
I-G 1 -- -- -- 6.84E-4 -- -- --
I-M 14 1.19E-5 2.57E-4 8.03E-4 1.22E-3 1.84E-3 5.75E-3 5.68E-3
X-TP 1 -- -- -- 1.23E-5 -- -- --
X-TM 6 9.20E-6 3.30E-5 7.40E-5 1.29E-4 2.25E-4 5.04E-4 3.64E-4
X-TD 11 1.51E-4 2.03E-4 3.55E-4 4.52E-4 5.76E-4 1.01E-3 1.52E-3
X-R 6 3.02E-6 1.15E-5 4.16E-5 1.01E-4 2.44E-4 8.79E-4 6.36E-4
X-D 7 1.86E-5 3.70E-5 1.21E-4 2.50E-4 5.14E-4 1.68E-3 2.56E-3
X-B 13 6.56E-4 1.25E-3 1.75E-3 1.99E-3 2.27E-3 3.17E-3 4.62E-3
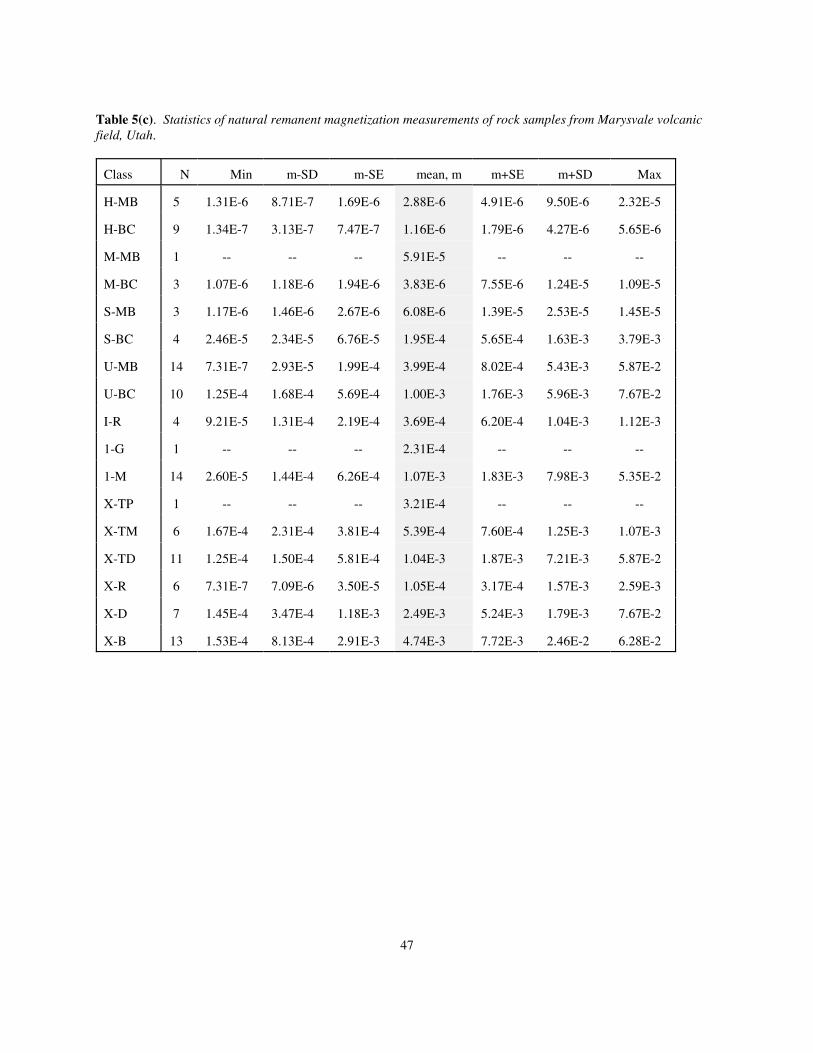
47
Table 5(c). Statistics of natural remanent magnetization measurements of rock samples from Marysvale volcanicfield, Utah.
Class N Min m-SD m-SE mean, m m+SE m+SD Max
H-MB 5 1.31E-6 8.71E-7 1.69E-6 2.88E-6 4.91E-6 9.50E-6 2.32E-5
H-BC 9 1.34E-7 3.13E-7 7.47E-7 1.16E-6 1.79E-6 4.27E-6 5.65E-6
M-MB 1 -- -- -- 5.91E-5 -- -- --
M-BC 3 1.07E-6 1.18E-6 1.94E-6 3.83E-6 7.55E-6 1.24E-5 1.09E-5
S-MB 3 1.17E-6 1.46E-6 2.67E-6 6.08E-6 1.39E-5 2.53E-5 1.45E-5
S-BC 4 2.46E-5 2.34E-5 6.76E-5 1.95E-4 5.65E-4 1.63E-3 3.79E-3
U-MB 14 7.31E-7 2.93E-5 1.99E-4 3.99E-4 8.02E-4 5.43E-3 5.87E-2
U-BC 10 1.25E-4 1.68E-4 5.69E-4 1.00E-3 1.76E-3 5.96E-3 7.67E-2
I-R 4 9.21E-5 1.31E-4 2.19E-4 3.69E-4 6.20E-4 1.04E-3 1.12E-3
1-G 1 -- -- -- 2.31E-4 -- -- --
1-M 14 2.60E-5 1.44E-4 6.26E-4 1.07E-3 1.83E-3 7.98E-3 5.35E-2
X-TP 1 -- -- -- 3.21E-4 -- -- --
X-TM 6 1.67E-4 2.31E-4 3.81E-4 5.39E-4 7.60E-4 1.25E-3 1.07E-3
X-TD 11 1.25E-4 1.50E-4 5.81E-4 1.04E-3 1.87E-3 7.21E-3 5.87E-2
X-R 6 7.31E-7 7.09E-6 3.50E-5 1.05E-4 3.17E-4 1.57E-3 2.59E-3
X-D 7 1.45E-4 3.47E-4 1.18E-3 2.49E-3 5.24E-3 1.79E-3 7.67E-2
X-B 13 1.53E-4 8.13E-4 2.91E-3 4.74E-3 7.72E-3 2.46E-2 6.28E-2
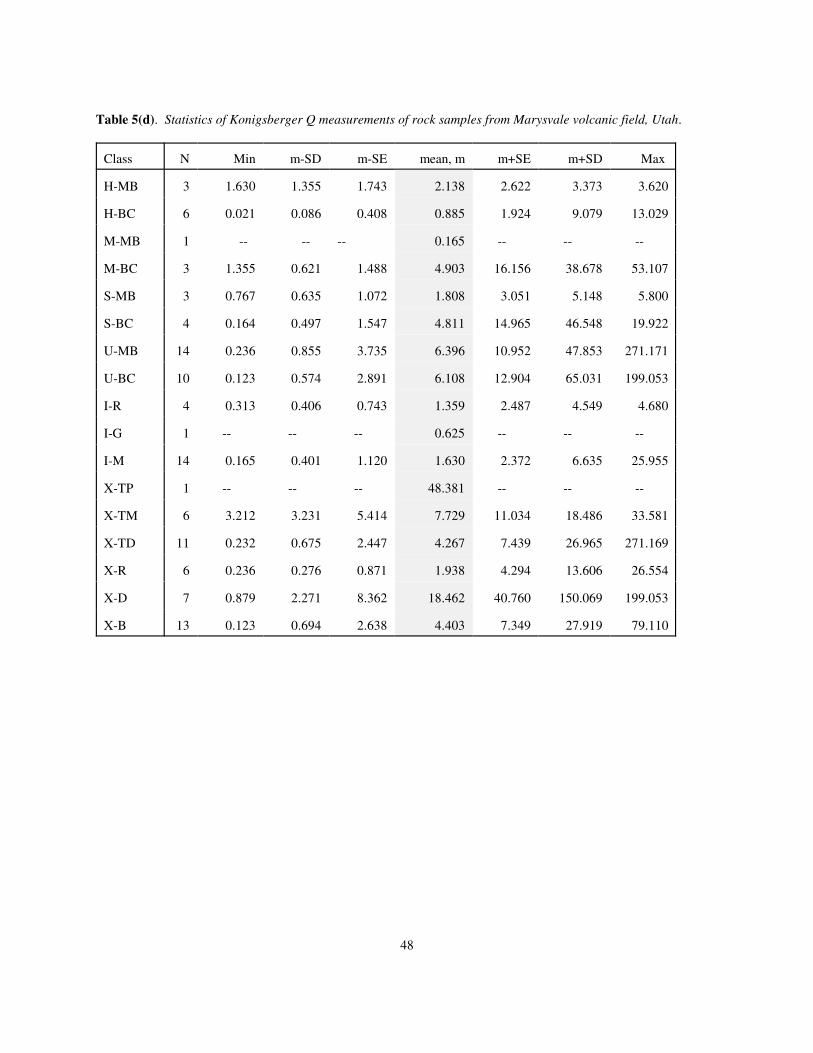
48
Table 5(d). Statistics of Konigsberger Q measurements of rock samples from Marysvale volcanic field, Utah.
Class N Min m-SD m-SE mean, m m+SE m+SD Max
H-MB 3 1.630 1.355 1.743 2.138 2.622 3.373 3.620
H-BC 6 0.021 0.086 0.408 0.885 1.924 9.079 13.029
M-MB 1 -- -- -- 0.165 -- -- --
M-BC 3 1.355 0.621 1.488 4.903 16.156 38.678 53.107
S-MB 3 0.767 0.635 1.072 1.808 3.051 5.148 5.800
S-BC 4 0.164 0.497 1.547 4.811 14.965 46.548 19.922
U-MB 14 0.236 0.855 3.735 6.396 10.952 47.853 271.171
U-BC 10 0.123 0.574 2.891 6.108 12.904 65.031 199.053
I-R 4 0.313 0.406 0.743 1.359 2.487 4.549 4.680
I-G 1 -- -- -- 0.625 -- -- --
I-M 14 0.165 0.401 1.120 1.630 2.372 6.635 25.955
X-TP 1 -- -- -- 48.381 -- -- --
X-TM 6 3.212 3.231 5.414 7.729 11.034 18.486 33.581
X-TD 11 0.232 0.675 2.447 4.267 7.439 26.965 271.169
X-R 6 0.236 0.276 0.871 1.938 4.294 13.606 26.554
X-D 7 0.879 2.271 8.362 18.462 40.760 150.069 199.053
X-B 13 0.123 0.694 2.638 4.403 7.349 27.919 79.110
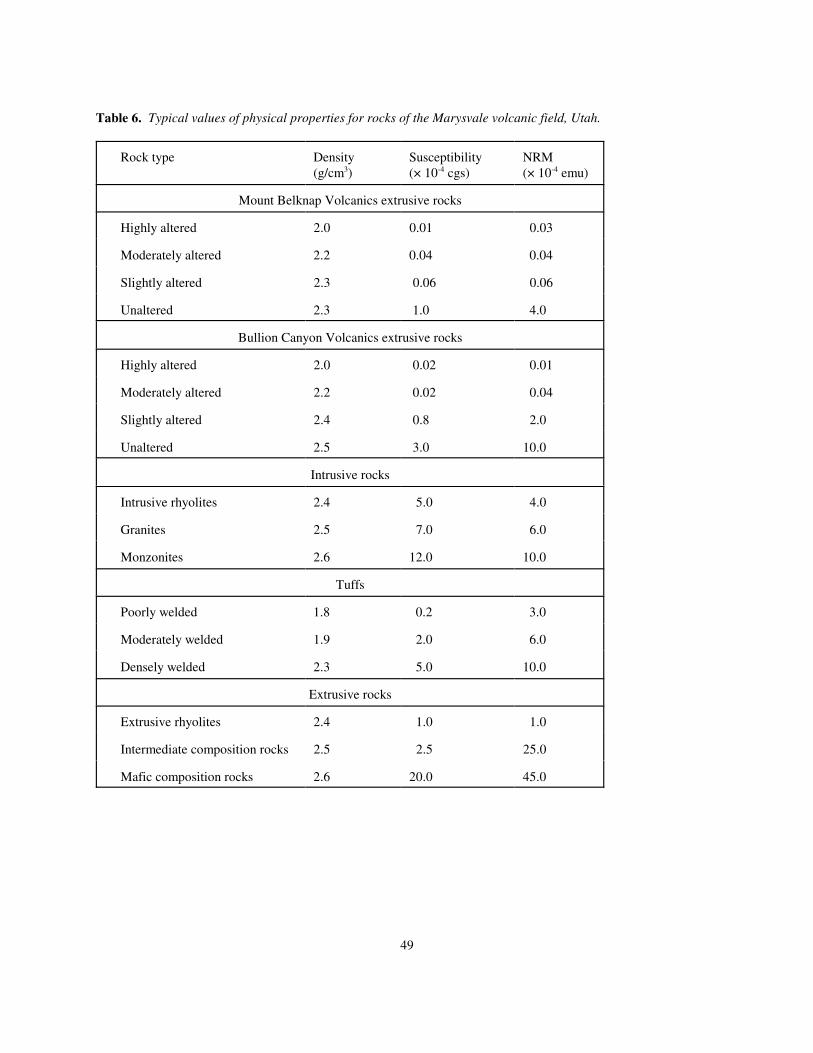
49
Table 6. Typical values of physical properties for rocks of the Marysvale volcanic field, Utah.
Rock type Density Susceptibility NRM(g/cm ) (× 10 cgs) (× 10 emu)3 -4 -4
Mount Belknap Volcanics extrusive rocks
Highly altered 2.0 0.01 0.03
Moderately altered 2.2 0.04 0.04
Slightly altered 2.3 0.06 0.06
Unaltered 2.3 1.0 4.0
Bullion Canyon Volcanics extrusive rocks
Highly altered 2.0 0.02 0.01
Moderately altered 2.2 0.02 0.04
Slightly altered 2.4 0.8 2.0
Unaltered 2.5 3.0 10.0
Intrusive rocks
Intrusive rhyolites 2.4 5.0 4.0
Granites 2.5 7.0 6.0
Monzonites 2.6 12.0 10.0
Tuffs
Poorly welded 1.8 0.2 3.0
Moderately welded 1.9 2.0 6.0
Densely welded 2.3 5.0 10.0
Extrusive rocks
Extrusive rhyolites 2.4 1.0 1.0
Intermediate composition rocks 2.5 2.5 25.0
Mafic composition rocks 2.6 20.0 45.0
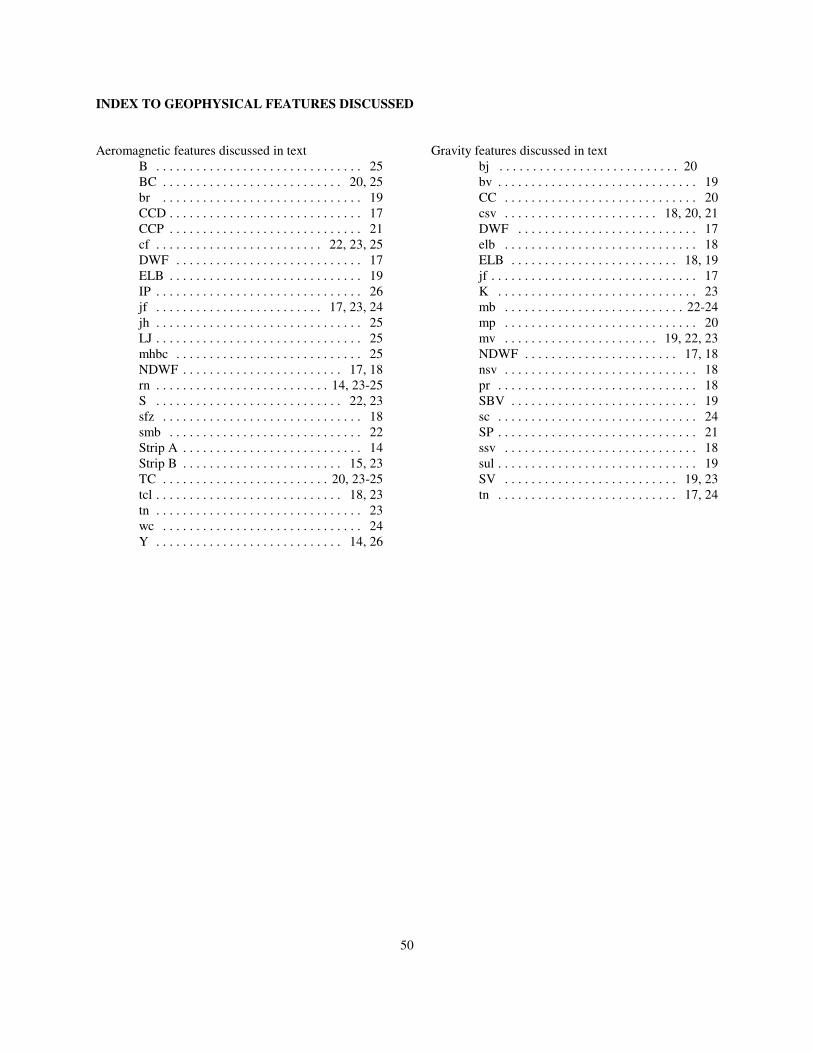
50
INDEX TO GEOPHYSICAL FEATURES DISCUSSED
Aeromagnetic features discussed in text Gravity features discussed in textB . . . . . . . . . . . . . . . . . . . . . . . . . . . . . . . 25BC . . . . . . . . . . . . . . . . . . . . . . . . . . . 20, 25br . . . . . . . . . . . . . . . . . . . . . . . . . . . . . . 19CCD . . . . . . . . . . . . . . . . . . . . . . . . . . . . . 17CCP . . . . . . . . . . . . . . . . . . . . . . . . . . . . . 21cf . . . . . . . . . . . . . . . . . . . . . . . . . 22, 23, 25DWF . . . . . . . . . . . . . . . . . . . . . . . . . . . . 17ELB . . . . . . . . . . . . . . . . . . . . . . . . . . . . . 19IP . . . . . . . . . . . . . . . . . . . . . . . . . . . . . . . 26jf . . . . . . . . . . . . . . . . . . . . . . . . . 17, 23, 24jh . . . . . . . . . . . . . . . . . . . . . . . . . . . . . . . 25LJ . . . . . . . . . . . . . . . . . . . . . . . . . . . . . . . 25mhbc . . . . . . . . . . . . . . . . . . . . . . . . . . . . 25NDWF . . . . . . . . . . . . . . . . . . . . . . . . 17, 18rn . . . . . . . . . . . . . . . . . . . . . . . . . . 14, 23-25S . . . . . . . . . . . . . . . . . . . . . . . . . . . . 22, 23sfz . . . . . . . . . . . . . . . . . . . . . . . . . . . . . . 18smb . . . . . . . . . . . . . . . . . . . . . . . . . . . . . 22Strip A . . . . . . . . . . . . . . . . . . . . . . . . . . . 14Strip B . . . . . . . . . . . . . . . . . . . . . . . . 15, 23TC . . . . . . . . . . . . . . . . . . . . . . . . . 20, 23-25tcl . . . . . . . . . . . . . . . . . . . . . . . . . . . . 18, 23tn . . . . . . . . . . . . . . . . . . . . . . . . . . . . . . . 23wc . . . . . . . . . . . . . . . . . . . . . . . . . . . . . . 24Y . . . . . . . . . . . . . . . . . . . . . . . . . . . . 14, 26
bj . . . . . . . . . . . . . . . . . . . . . . . . . . . 20bv . . . . . . . . . . . . . . . . . . . . . . . . . . . . . . 19CC . . . . . . . . . . . . . . . . . . . . . . . . . . . . . 20csv . . . . . . . . . . . . . . . . . . . . . . . 18, 20, 21DWF . . . . . . . . . . . . . . . . . . . . . . . . . . . 17elb . . . . . . . . . . . . . . . . . . . . . . . . . . . . . 18ELB . . . . . . . . . . . . . . . . . . . . . . . . . 18, 19jf . . . . . . . . . . . . . . . . . . . . . . . . . . . . . . . 17K . . . . . . . . . . . . . . . . . . . . . . . . . . . . . . 23mb . . . . . . . . . . . . . . . . . . . . . . . . . . . 22-24mp . . . . . . . . . . . . . . . . . . . . . . . . . . . . . 20mv . . . . . . . . . . . . . . . . . . . . . . . 19, 22, 23NDWF . . . . . . . . . . . . . . . . . . . . . . . 17, 18nsv . . . . . . . . . . . . . . . . . . . . . . . . . . . . . 18pr . . . . . . . . . . . . . . . . . . . . . . . . . . . . . . 18SBV . . . . . . . . . . . . . . . . . . . . . . . . . . . . 19sc . . . . . . . . . . . . . . . . . . . . . . . . . . . . . . 24SP . . . . . . . . . . . . . . . . . . . . . . . . . . . . . . 21ssv . . . . . . . . . . . . . . . . . . . . . . . . . . . . . 18sul . . . . . . . . . . . . . . . . . . . . . . . . . . . . . . 19SV . . . . . . . . . . . . . . . . . . . . . . . . . . 19, 23tn . . . . . . . . . . . . . . . . . . . . . . . . . . . 17, 24


![An integrated geothermal, gravity and aeromagnetic study ... · Geothermal data is one of the primary factors controlling hydrocarbon generation and migration [5, 6, 7]. Gravity and](https://img.pdfslide.us/doc/110x75/604cb08002dd244e8e501670/an-integrated-geothermal-gravity-and-aeromagnetic-study-geothermal-data-is.jpg)