Embed Size (px)
Citation preview
1American Institute of Aeronautics and Astronautics
Aerodynamics of Ice Remnants from Protected SurfacesAndy P. Broeren∗ and Michael B. Bragg†
University of Illinois at Urbana-Champaign, Urbana, Illinois 61801
This paper presents a compilation of aerodynamic data for airfoils with ice remnants.Ice remnants is defined as ice accretion associated with the operation of ice-protectionsystems. Changes in drag and maximum lift coefficient are summarized for many differentcases. It was found that there is a lack of data for residual ice simulations on airfoils, wherethe leading edge and stagnation region is free of ice roughness. In contrast, there arenumerous studies detailing the aerodynamic effects of intercycle ice. In the case of spanwise-ridge ice resulting from heated leading-edge ice-protection systems (runback ice) or SLDaccretions, there is also a lack of data for real ice accretion or high-fidelity simulations onairfoils. The existing data indicate that uniform, or standard roughness such as sandpaperthat is applied over the leading-edge and stagnation point region may be an adequaterepresentation of residual ice, but is likely too conservative in terms of maximum liftpenalty. For some intercycle accretions, like those resulting from one-minute deicer cycles,the lift and drag penalties could be adequately simulated with uniform roughness. As thedeicer cycle time increases from one to three minutes, intercycle ice shapes develop largerfeatures that lead to more significant separated flow areas and larger performance penalties.Some may have characteristics of spanwise-ridge ice that are often simulated with simplegeometric shapes. These results show a very large range of performance characteristicsfrom increases in maximum lift to very large decreases in maximum lift. It is difficult toevaluate some of these results because the simple geometries used to represent the ice ridgesdo not capture the complexities of the actual ice accretion. More data are needed to betterunderstand the flowfield physics.
I. IntroductionComprehensive reviews of iced-airfoil aerodynamics and performance have recently been compiled.1-3 These
reviews have tended to focus on ice accretions that form on unprotected airfoil and wing surfaces. While this is animportant area of icing research, aircraft certified for flight in icing conditions employ ice-protection systems (IPS)on the wing, tail and other components. In some cases, these ice-protection systems do not remove all ice on theairfoil/wing surface. The term “ice remnants” refers to this ice left over from the IPS operation. In the case ofpneumatic systems, electro-expulsive systems, hybrid systems or even some heated systems that operate on a cycle,residual and intercycle ice are types of ice remnants. Residual ice has been defined as the ice that remains on theairfoil/wing immediately after the IPS has been activated.4 Intercycle ice, on the other hand, refers to the ice thatbuilds up on the airfoil/wing between cycles, immediately before the IPS activation.5,6 Another type of ice remnanttakes the form of a spanwise-running ridge.4 Examples of this include runback ice in the case of bleed air or electro-thermal systems. For these systems any impinging water that does not evaporate runs downstream and freezes on anunheated portion of the airfoil/wing. Spanwise ridges may also form from water impingement and/or splashingdownstream of the protected region. The purpose of this paper is to survey previous research on ice remnants anddescribe what is known about the resulting aerodynamics and performance and to identify where more research isrequired. Where possible, the aerodynamics are described from a flowfield-physics perspective.
The classification of iced-airfoil aerodynamics by flowfield physics is the subject of a recent review by Bragg etal.3 The authors proposed four categories of ice accretion without regard to their formation, but instead, regardingtheir affect on the airfoil flowfield. The four categories: roughness, horn, streamwise and ridge result in differentflowfield aerodynamics. Roughness is most often associated with initial ice accretion. Its primary effects arepromotion of boundary-layer transition and removal of momentum from the boundary layer. This results in
∗ Research Scientist, Department of Aerospace Engineering, Senior Member AIAA.† Professor and Head, Department of Aerospace Engineering, Fellow AIAA.

American Institute of Aeronautics and Astronautics2
increased drag and trailing-edge separation that reduces the airfoil maximum lift coefficient (Cl,max). Horn iceusually results from glaze icing conditions and is characterized by the ice features that have surfaces nearlyperpendicular to the oncoming flow. The horns result in large separation bubbles on the airfoil. The separationbubbles greatly increase the drag and reduce the lift. The unsteady aspects of the flow also result in forcefluctuations and are very difficult to simulate computationally. Streamwise ice often results from rime icingconditions and is more conformal to the airfoil surface. While there is usually a small separation bubble on theairfoil, the stall is generally governed by trailing-edge separation instead of large bubble growth with increasedangle of attack as in the horn case. Finally, the ridge-ice category has much relevance to ice remnants consideredhere because this is often runback ice or ice accretion resulting from water impingement downstream, or near thelimits, of protected surfaces. The flowfield is dominated by a large separation bubble that forms downstream of theridge. The aerodynamics are different from the horn ice case because the boundary layer develops on the airfoilsurface upstream of the ridge. This means that the clean airfoil geometry plays a much larger role in determining theeffect of the separation bubble on the flowfield and aerodynamic performance. This paper describes to what extentthese categories may apply to ice remnants and considers where new categories may be needed.
Another recent review has considered icing effects on aerodynamic performance. Lynch and Khodadoust1 haveprovided and an excellent and exhaustive review of the effect of ice accretion on performance parameters like liftand drag. They compiled nearly all available and relevant experimental aerodynamic performance data for varioustypes of ice accretion and airfoil/wing geometries. The authors considered ice due to initial in-flight accretion,runback and ridge type accretion, large in-flight accretion and ground frost accretion. Of these categories, the initialaccretion and ridge-ice shapes are the most directly related to the present topic of ice remnants. In yet anotherreview of aircraft icing issues, Cebeci and Kafyeke2 describe the challenges of predicting the geometry and surfaceextent of ice remnants. They point out the potential aerodynamic significance of these types of accretions from anaircraft certification perspective.
The purpose of this paper is to survey previous research on ice remnants and describe what is known about theresulting aerodynamics and performance. The paper describes the aerodynamic effects of ice remnants as they relateto the aerodynamic effects of standard roughness and other contamination. In addition, this review will help identifyareas where more research is needed for a better understanding of the aerodynamics. Where possible, theaerodynamics are described from a flowfield-physics perspective. This approach follows the framework establishedby Bragg et al.3 but also relies on compilation of performance data. After a brief historical review of ice-remnantresearch, performance data are discussed for the various types of ice remnants. It is important to note that thisreview is invariably flawed, as is any review associated with an active research area. While this review brieflysummarizes our current understanding, continued research will, inevitably, modify and refine the ideas presentedhere. This is especially true in the present case, since ice-remnant research has not been explored in nearly the samedetail as ice accretion on unprotected surfaces. Further, the various types of ice-protection systems currently in useadd another independent variable to an already complex problem.
II. Literature ReviewThe purpose of this literature review is not to provide a complete guide to all ice-remnant research, but to
review some of the research known to the authors to be significant and representative in the history of ice-protectionsystems. The review includes added detail where the research considered aerodynamic effects. This is the mostrelevant to this paper. Since no new data were acquired for this study, the review of historical data is important as itforms the basis for the assessment of aerodynamic effects.
Some of the earliest ice-remnant research was performed by the National Advisory Committee for Aeronautics(NACA) and dates back to the 1950s. In 1953, Gray and von Glahn7 documented runback-ice shapes and resultingaerodynamic performance effects for a NACA 651-212 airfoil equipped with a hot-air anti-icing system in the LewisFlight Propulsion Laboratory Icing Research Tunnel. The thermal IPS was operated continuously at a temperatureand mass flow rate that evaporated approximately 28 to 44% of the impinging water. The system was also operatedin a periodic deicing mode using four-minute cycles. The authors documented the approximate size and location ofrunback ridges and the corresponding changes in airfoil drag, measured in-situ during the icing exposure using awake rake. Gray and von Glahn also made an insightful attempt to interpret their drag data in terms of theaerodynamic penalties measured by Jacobs8 for protuberances on an NACA 0012 airfoil. The authors realized thatJacobs’s protuberance could be interpreted as a simulation of the runback-ridge ice accretion. They applied thesedata carefully to further estimate the detrimental performance effects resulting from the documented accretions.

American Institute of Aeronautics and Astronautics3
Consistent with the understanding at the time, Gray and von Glahn echoed Jacob’s result that the largestaerodynamic penalties were associated with ridges located in the “leading-edge radius region.”
In 1956, Bowden9 published a report on residual and intercycle ice effects associated with pneumatic deicersinstalled on a NACA 0011 airfoil model. Bowden recorded the changes in airfoil performance (lift, drag andpitching moment) using force-balance measurements over the course of an icing exposure with a periodic deicercycling time. He investigated the effect of cycling times, operating pressure, inflation rates and the differencesbetween deicers with spanwise tubes and chordwise tubes. After investigating a range of icing conditions, Bowdenconcluded that the ice-removal characteristics of spanwise and chordwise tube layouts were very similar and thateach should be operated using one-minute cycles to obtain the minimum iced-airfoil drag. He showed that a steady-state accretion and shedding process was achieved after two or three deicer cycles. Following the work of Jacobs,8
Bowden also tested simulated ice shapes in the form of spanwise protuberances, or spoilers. He correlated the mostcritical protuberance location (defined in terms of increased drag coefficient) with the location of the maximumlocal air velocity (minimum Cp) on the model. While both Bowden, and Gray and von Glahn, provided excellentreports on ice remnants and performance effects, they were limited to the aerodynamic performance measurementsthat could be made. Their experimental apparatus was not able to accurately determine the effect of the iceremnants on maximum lift—a critical flight safety parameter.
With the commencement of the space program in 1959, icing research in the United States was mainlyconducted in the private sector and any research on the effects of ice remnants was, and remains, propriety. Icingresearch was reinvigorated at NASA in the late 1970s and work on ice remnants also resumed. For example,Albright et al.10 published a report in 1981 on the application of a pneumatic deicing system to a general aviationwing. Similar to the aforementioned studies, drag measurements were conducted in-situ during the icing tests. Thedrag increases due to residual and intercycle ice formation were similar in magnitude to the previous reports.
In the early 1990s engineers at NASA conducted a comprehensive study of low-power deicing systems.11-14
Eight different deicing systems were investigated in the NASA Lewis Icing Research Tunnel (IRT), using a 21-inchchord NACA 0012 airfoil at α = 4 deg. for both rime and glaze icing conditions. Four of these were various types ofpneumatic systems while the other four were various forms of electric devices. Shin and Bond12 reported residualand intercycle ice roughness heights on the leading edge and lower surface for seven of the eight systems using one-minute cycles. The residual ice thickness on the leading edge was zero (meaning that all of the ice was removed) forsix of the seven systems tested in the glaze icing condition. In the rime icing condition the residual ice roughnessheights ranged from k/c = 0 to 0.0066. On the lower surface, the residual roughness heights ranged from k/c =0.0005 to 0.0043 for the glaze icing condition and k/c = 0.0005 to 0.0033 for the rime icing condition. In contrast tothis, the intercycle ice heights were significantly larger. For example, the measurements on the leading edge rangedfrom k/c = 0.0022 to 0.0103 for the glaze icing condition and k/c = 0.0009 to 0.0067 for the rime icing condition.While the NASA studies provide excellent documentation about the residual and intercycle ice roughnesscharacteristics, no aerodynamic data were acquired. Shin and Bond12 also commented that the residual iceroughness observed may have significant aerodynamic effects, but that uniformly distributed roughness may not bean appropriate simulation.
Ice-remnant research continued in the 1990s with the Advanced General Aviation Transport Experiments(AGATE) program. This program was a cooperative effort among NASA, FAA, industry and universities to designan advanced general aviation aircraft. A task of the AGATE program was to investigate low-power deicing systemsand the resulting performance effects of residual and intercycle ice. This led to a number of studies. Reichhold andBragg15 reviewed previous research in this area and concluded that the aerodynamic effects could be significant forthe AGATE aircraft design. An icing-tunnel test program was conducted to evaluate residual and intercycle icecharacteristics for four different low-power deicing systems installed on an NLF 0414 airfoil model. Theaerodynamic performance effects were reported by Jackson and Bragg,16 Jackson17 and Gile-Laflin and Papadakis.18
Jackson and Bragg16 tested various roughness simulations and two-dimensional representations of the intercycle iceaccretions. Gile-Laflin and Papadakis18 tested three-dimensional castings made from molds of the intercycleaccretions. Both studies documented the reductions in lift and increases in drag for angles of attack up to andincluding stall.
Further research into residual and intercycle ice accretions was continued in the early 2000s for a conventionalpneumatic system. A cooperative program involving FAA, NASA, University of Illinois and industry wasestablished to document residual and intercycle ice characteristics and aerodynamic effects on a NACA 23012airfoil model equipped with a pneumatic deicer. Details regarding the ice accretion testing are given in references 6and 19. Aerodynamic testing of selected intercycle shapes was performed using castings made from molds of the

American Institute of Aeronautics and Astronautics4
ice accretions. These data are given in references 5, 6 and 19. The maximum lift penalties for intercycle iceaccretions resulting from three-minute deicer cycles were found to be on the order of 60%, while the increase inminimum drag was about 270%. Sandpaper roughness (40 and 80-grit) was also tested and resulted in about a 30%reduction in maximum lift and a 57% increase in minimum drag. The sandpaper roughness was not an accuratesimulation of the intercycle ice shapes, as it did not accurately represent the ice thickness and ridge-likecharacteristics. In a follow-on study by Broeren and Bragg,20 built-up roughness simulations were tested on smallerscale NACA 23012, NACA 3415 and NLF-0414 airfoils. The performance data for the NACA 23012 airfoilmatched the previous results with the ice castings simulations fairly well, thus indicating that the built-up roughnesssimulations were adequate. These roughness simulations were applied to the other two airfoils and the performancedegradations were found to be less severe than for the NACA 23012 airfoil. This result was consistent withprevious understanding of the effects of airfoil geometry and surface-pressure distribution.
The 1994 Roselawn ATR-72 accident has focused an enormous amount of research on super-cooled, large-droplet (SLD) ice accretion and performance effects. Miller et al.21 and Addy et al.22 conducted ice accretion testingin the NASA IRT for full-scale Twin Otter and NACA 23012 wing sections equipped with pneumatic deicers. Theyfound that a common characteristic of the intercycle ice was a spanwise-running ridge located near the downstreamedge of the active portion of the deicer on both upper and lower surfaces. Some runs performed at totaltemperatures near 32 deg. F also resulted in runback type ice formations downstream of the active portion of thedeicer. As the temperature was decreased, a more well-defined ridge formed near the active edge of the deicer andbecame more uniform spanwise and less prone to self-shedding. The ridge heights on the upper surface of the TwinOtter wing ranged from k/c = 0.004 to 0.010. The range was much larger on the NACA 23012 wing, from k/c = 0.0to 0.0277. Addy et al.,22 did measure some limited performance data for a subset of these runs in the IRT.
The aerodynamic effects of spanwise-running ridges were investigated by Lee and Bragg23,24 using simplegeometric simulations of various sizes and shapes on both NACA 23012 and NLF 0414 airfoils. The ice-shape stepheights ranged from k/c = 0.0056 to 0.0139 and four different geometries were tested. This work led to a newunderstanding of the primary effects of ice-shape size and location on airfoil lift and drag. Another importantconsideration was the pressure distribution of the clean airfoil. This work culminated in review articles25,26 that alsoinclude data for tests run on more airfoils. Similar experiments were carried out by Calay et al.27 using k/c = 0.0035shapes on a NACA 0012 airfoil to simulated runback ridges at three locations, x/c = 0.05, 0.15 and 0.25. Theirresults indicated that a ridge of this size can increase maximum lift and delay stall when located at x/c = 0.15 and0.25. Reductions in maximum lift occurred when the shapes were tested at x/c = 0.05. A large range of geometriesand sizes of ridge-ice shapes were also tested by Papadakis and Gile-Laflin28 on a modified NACA 63A-213 airfoilsection. Results similar to Lee and Bragg23-26 and Calay et al.27 were obtained. While these studies provide valuableinsight into the size, shape, location and airfoil-type effects an important consideration is that they were allperformed with relatively simple (and two-dimensional) simulations of ridge-type ice accretion. Bragg et al.3 pointout that spanwise variations in this type of ice accretion are large and could result in correspondingly large variationin the integrated performance.
The most recent study of runback ridge-type accretions was performed under a joint NASA and FAA program.Whalen et al.29 conducted icing-tunnel testing on a business jet wing model equipped with a bleed-air based thermalIPS. Runback-ice ridge geometries were documented for three simulated flight cases. These shapes were scaleddown and simulated for aerodynamic testing on NACA 23012 and 3415 airfoils. The step heights ranged in sizefrom k/c = 0.0035 to 0.007. For some cases, the simulations were built-up with roughness to more closely mimic theactual ice accretion. This was an attempt to incorporate some higher level of simulation fidelity that had not beenused in the previous studies.
This literature survey has covered the publicly available reports known to the authors to be significantcontributions to the aerodynamics of ice remnants. Relative to the numbers of studies cited by Lynch andKhodadoust1 and Bragg et al.,3 this is certainly a small number. The following analysis of these data furtherreinforces this point. In spite of this, the exercise remains an important one in terms of guiding future experimentsbased on priorities for the required data.
III. Aerodynamic Effects of Ice RemnantsAs the historical review has shown, ice remnants can take many forms ranging from small roughness to larger
intercycle accretions to spanwise-running ridges. A goal of this paper is to understand the aerodynamic similaritiesand differences among these cases. The following discussion is organized by the type of ice remnant. Effects ofresidual ice are considered first and then compared with the effects of intercycle ice. A discussion of roughness is
American Institute of Aeronautics and Astronautics5
included because this is often used in practice to simulate residual and intercycle ice accretions for aerodynamictesting. The effect of spanwise-ridge type ice shapes is then presented. Finally the discussion concludes with acomment on Reynolds number effects.
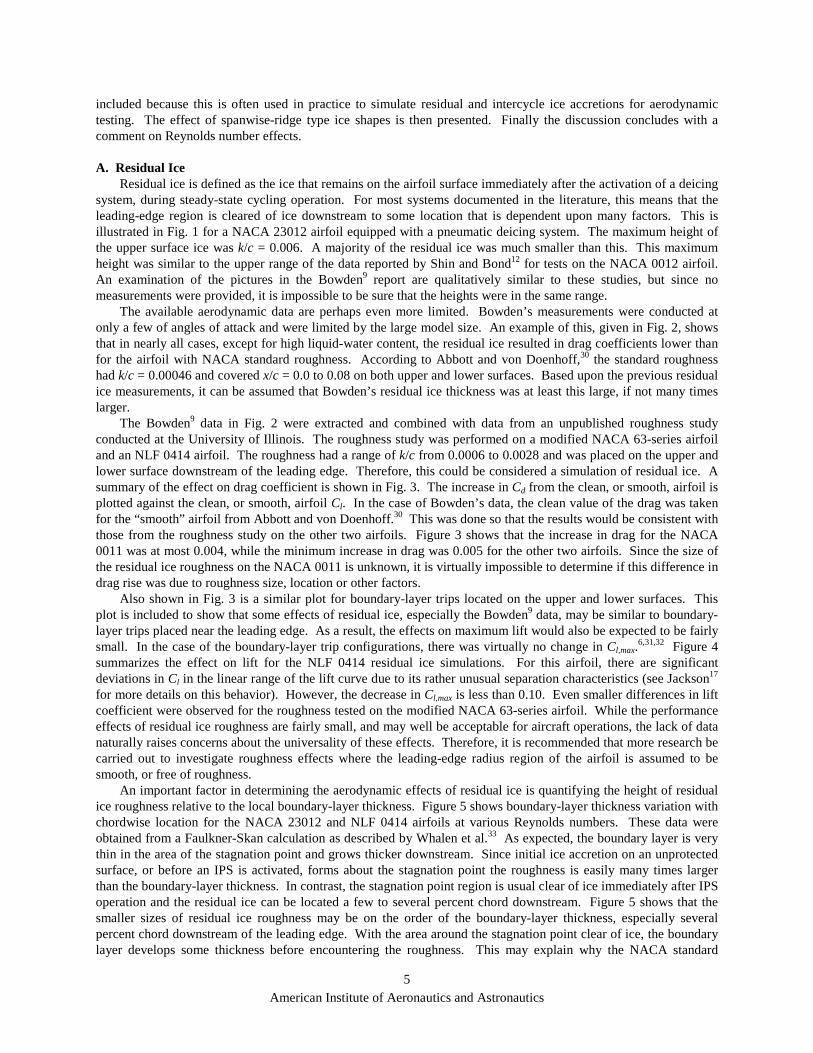
A. Residual IceResidual ice is defined as the ice that remains on the airfoil surface immediately after the activation of a deicing
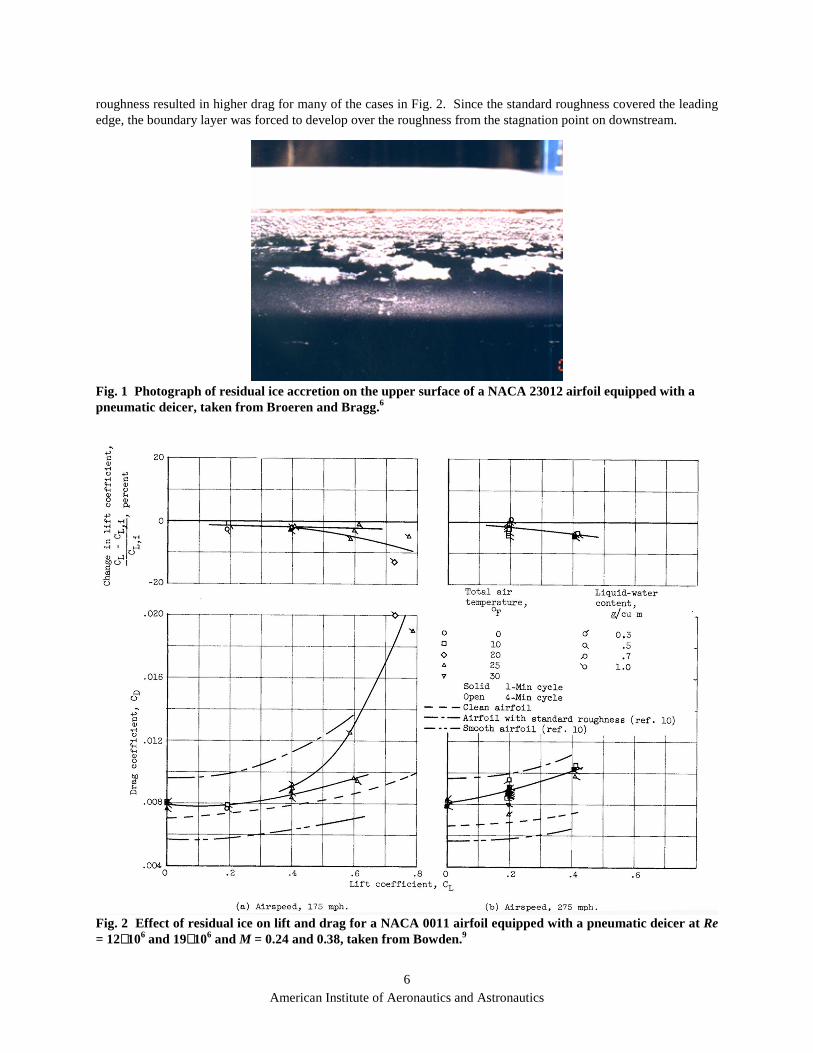
system, during steady-state cycling operation. For most systems documented in the literature, this means that theleading-edge region is cleared of ice downstream to some location that is dependent upon many factors. This isillustrated in Fig. 1 for a NACA 23012 airfoil equipped with a pneumatic deicing system. The maximum height ofthe upper surface ice was k/c = 0.006. A majority of the residual ice was much smaller than this. This maximumheight was similar to the upper range of the data reported by Shin and Bond12 for tests on the NACA 0012 airfoil.An examination of the pictures in the Bowden9 report are qualitatively similar to these studies, but since nomeasurements were provided, it is impossible to be sure that the heights were in the same range.
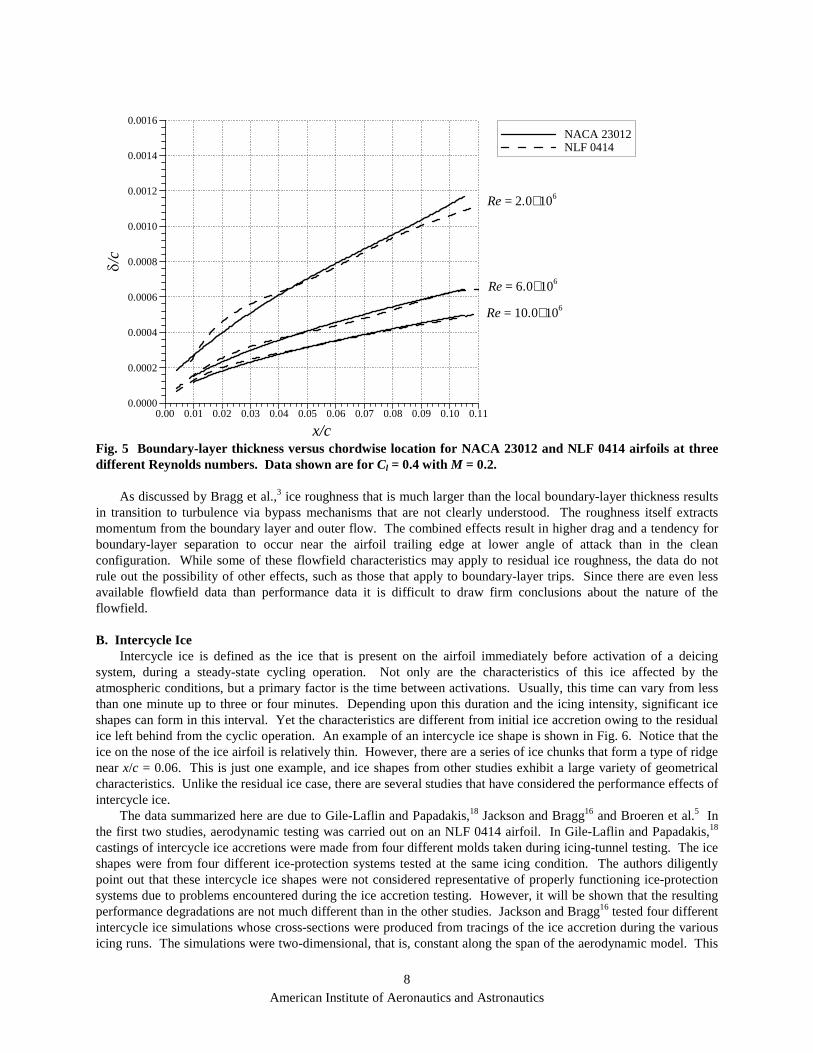
The available aerodynamic data are perhaps even more limited. Bowden’s measurements were conducted atonly a few of angles of attack and were limited by the large model size. An example of this, given in Fig. 2, showsthat in nearly all cases, except for high liquid-water content, the residual ice resulted in drag coefficients lower thanfor the airfoil with NACA standard roughness. According to Abbott and von Doenhoff,30 the standard roughnesshad k/c = 0.00046 and covered x/c = 0.0 to 0.08 on both upper and lower surfaces. Based upon the previous residualice measurements, it can be assumed that Bowden’s residual ice thickness was at least this large, if not many timeslarger.
The Bowden9 data in Fig. 2 were extracted and combined with data from an unpublished roughness studyconducted at the University of Illinois. The roughness study was performed on a modified NACA 63-series airfoiland an NLF 0414 airfoil. The roughness had a range of k/c from 0.0006 to 0.0028 and was placed on the upper andlower surface downstream of the leading edge. Therefore, this could be considered a simulation of residual ice. Asummary of the effect on drag coefficient is shown in Fig. 3. The increase in Cd from the clean, or smooth, airfoil isplotted against the clean, or smooth, airfoil Cl. In the case of Bowden’s data, the clean value of the drag was takenfor the “smooth” airfoil from Abbott and von Doenhoff.30 This was done so that the results would be consistent withthose from the roughness study on the other two airfoils. Figure 3 shows that the increase in drag for the NACA0011 was at most 0.004, while the minimum increase in drag was 0.005 for the other two airfoils. Since the size ofthe residual ice roughness on the NACA 0011 is unknown, it is virtually impossible to determine if this difference indrag rise was due to roughness size, location or other factors.
Also shown in Fig. 3 is a similar plot for boundary-layer trips located on the upper and lower surfaces. Thisplot is included to show that some effects of residual ice, especially the Bowden9 data, may be similar to boundary-layer trips placed near the leading edge. As a result, the effects on maximum lift would also be expected to be fairlysmall. In the case of the boundary-layer trip configurations, there was virtually no change in Cl,max.
6,31,32 Figure 4summarizes the effect on lift for the NLF 0414 residual ice simulations. For this airfoil, there are significantdeviations in Cl in the linear range of the lift curve due to its rather unusual separation characteristics (see Jackson17
for more details on this behavior). However, the decrease in Cl,max is less than 0.10. Even smaller differences in liftcoefficient were observed for the roughness tested on the modified NACA 63-series airfoil. While the performanceeffects of residual ice roughness are fairly small, and may well be acceptable for aircraft operations, the lack of datanaturally raises concerns about the universality of these effects. Therefore, it is recommended that more research becarried out to investigate roughness effects where the leading-edge radius region of the airfoil is assumed to besmooth, or free of roughness.
An important factor in determining the aerodynamic effects of residual ice is quantifying the height of residualice roughness relative to the local boundary-layer thickness. Figure 5 shows boundary-layer thickness variation withchordwise location for the NACA 23012 and NLF 0414 airfoils at various Reynolds numbers. These data wereobtained from a Faulkner-Skan calculation as described by Whalen et al.33 As expected, the boundary layer is verythin in the area of the stagnation point and grows thicker downstream. Since initial ice accretion on an unprotectedsurface, or before an IPS is activated, forms about the stagnation point the roughness is easily many times largerthan the boundary-layer thickness. In contrast, the stagnation point region is usual clear of ice immediately after IPSoperation and the residual ice can be located a few to several percent chord downstream. Figure 5 shows that thesmaller sizes of residual ice roughness may be on the order of the boundary-layer thickness, especially severalpercent chord downstream of the leading edge. With the area around the stagnation point clear of ice, the boundarylayer develops some thickness before encountering the roughness. This may explain why the NACA standard
American Institute of Aeronautics and Astronautics6
roughness resulted in higher drag for many of the cases in Fig. 2. Since the standard roughness covered the leadingedge, the boundary layer was forced to develop over the roughness from the stagnation point on downstream.
Fig. 1 Photograph of residual ice accretion on the upper surface of a NACA 23012 airfoil equipped with apneumatic deicer, taken from Broeren and Bragg.6
Fig. 2 Effect of residual ice on lift and drag for a NACA 0011 airfoil equipped with a pneumatic deicer at Re= 12×106 and 19×106 and M = 0.24 and 0.38, taken from Bowden.9

American Institute of Aeronautics and Astronautics7
Fig. 3 Effect on airfoil drag due to residual ice roughness (left) and boundary-layer trips. Bowden9 data atRe = 12×106 and 19×106, M = 0.24 and 0.38. Roughness on modified NACA 63-series and NLF 0414 applieddownstream of the leading edge on both upper and lower surfaces with k/c = 0.0006 to 0.0028 at Re = 1.8×10⁶
and M = 0.18. Upper and lower-surface boundary-layer trips: Broeren and Bragg6 at Re = 7.5×10⁶ and M =0.12, Sommers31 at Re = 3.0×10⁶ and M = 0.10, and McGhee et al.32 at Re = 6.0×10⁶ and M = 0.10.
Fig. 4 Effect of simulated residual ice roughness on NLF 0414 airfoil lift at Re = 1.8×10⁶ and M = 0.18.Roughness applied downstream of the leading edge on both upper and lower surfaces.
Cl,clean
Cd,
iced
-C
d,cl
ean
0.0 0.1 0.2 0.3 0.4 0.5 0.60.000
0.002
0.004
0.006
0.008
0.010
Bowden,9 NACA 0011, Residual IceMod. NACA 63-series, k/c = 0.0006 to 0.0028NLF 0414, k/c = 0.0006 to 0.0028
Cl,cleanC
d,tr
ippe
d-
Cd,
clea
n
0.0 0.1 0.2 0.3 0.4 0.5 0.60.000
0.002
0.004
0.006
0.008
0.010
Broeren and Bragg,6 NACA 23012Sommers,31 NLF 0414McGhee et al.,32 NLF 0414
α (deg.)
Cl
-10.0 -5.0 0.0 5.0 10.0 15.0 20.0-0.6
-0.4
-0.2
0.0
0.2
0.4
0.6
0.8
1.0
1.2
1.4Cleank/c = 0.0006 to 0.0011 roughnessk/c = 0.0011 to 0.0028 roughness
American Institute of Aeronautics and Astronautics8
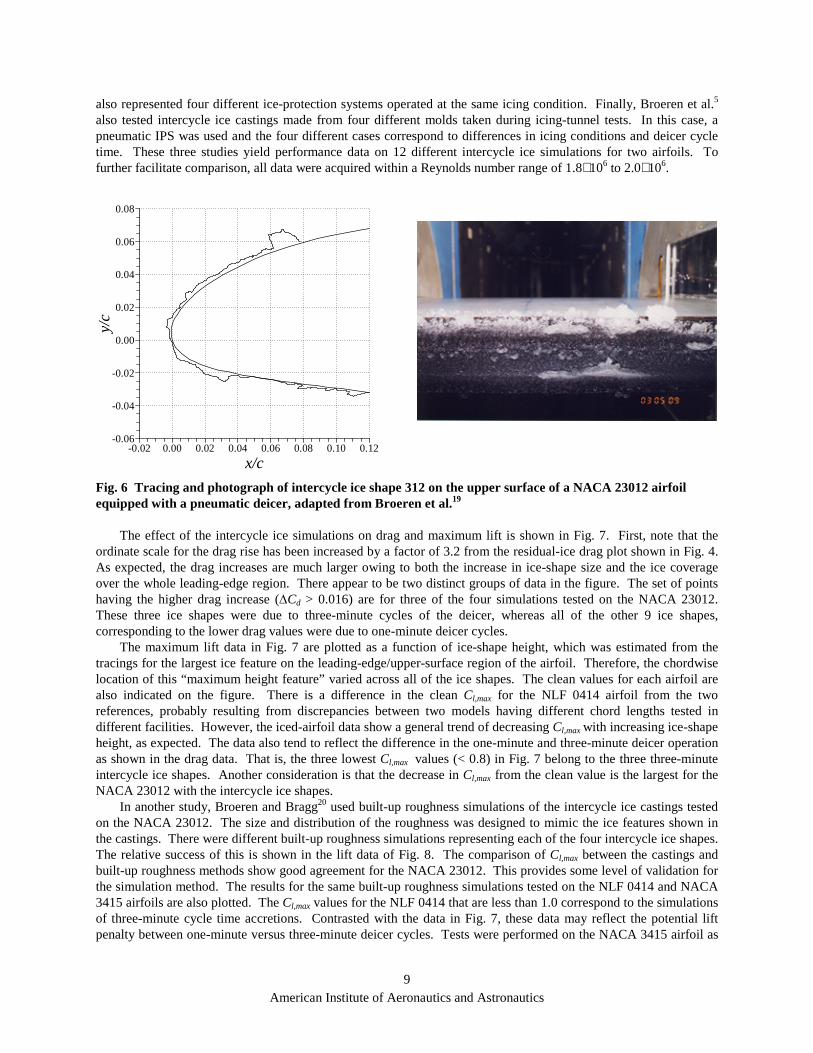
Fig. 5 Boundary-layer thickness versus chordwise location for NACA 23012 and NLF 0414 airfoils at threedifferent Reynolds numbers. Data shown are for Cl = 0.4 with M = 0.2.
As discussed by Bragg et al.,3 ice roughness that is much larger than the local boundary-layer thickness resultsin transition to turbulence via bypass mechanisms that are not clearly understood. The roughness itself extractsmomentum from the boundary layer and outer flow. The combined effects result in higher drag and a tendency forboundary-layer separation to occur near the airfoil trailing edge at lower angle of attack than in the cleanconfiguration. While some of these flowfield characteristics may apply to residual ice roughness, the data do notrule out the possibility of other effects, such as those that apply to boundary-layer trips. Since there are even lessavailable flowfield data than performance data it is difficult to draw firm conclusions about the nature of theflowfield.
B. Intercycle IceIntercycle ice is defined as the ice that is present on the airfoil immediately before activation of a deicing
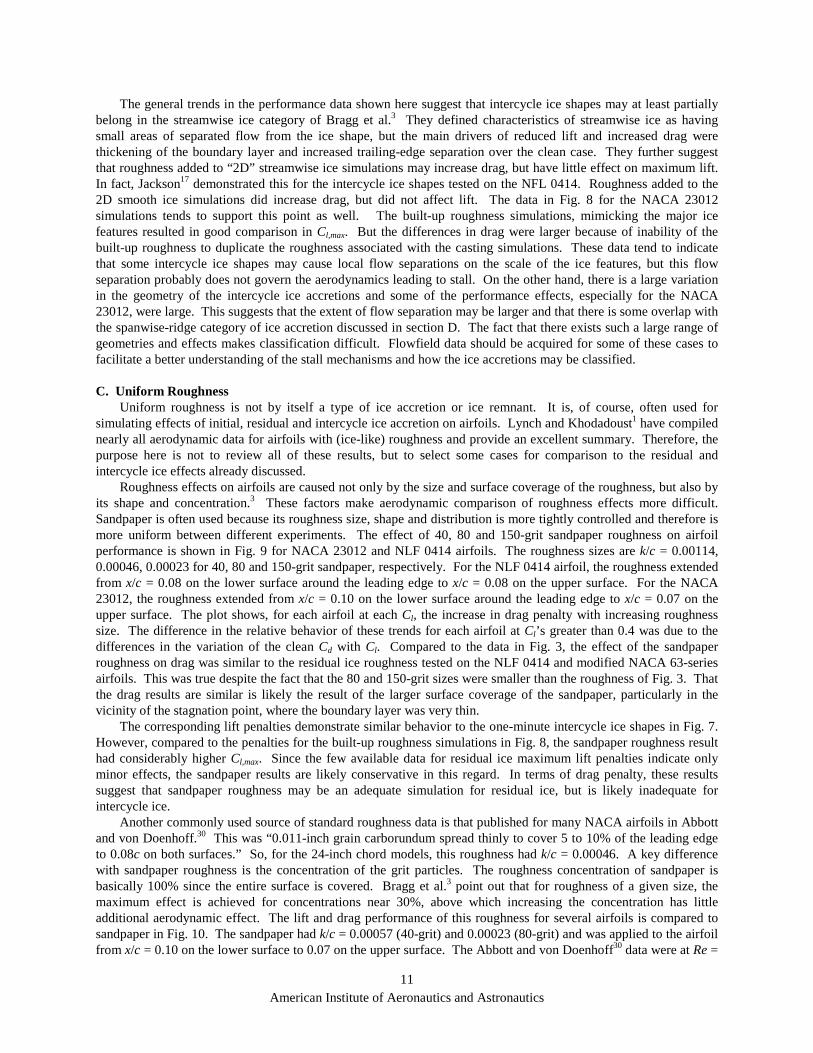
system, during a steady-state cycling operation. Not only are the characteristics of this ice affected by theatmospheric conditions, but a primary factor is the time between activations. Usually, this time can vary from lessthan one minute up to three or four minutes. Depending upon this duration and the icing intensity, significant iceshapes can form in this interval. Yet the characteristics are different from initial ice accretion owing to the residualice left behind from the cyclic operation. An example of an intercycle ice shape is shown in Fig. 6. Notice that theice on the nose of the ice airfoil is relatively thin. However, there are a series of ice chunks that form a type of ridgenear x/c = 0.06. This is just one example, and ice shapes from other studies exhibit a large variety of geometricalcharacteristics. Unlike the residual ice case, there are several studies that have considered the performance effects ofintercycle ice.
The data summarized here are due to Gile-Laflin and Papadakis,18 Jackson and Bragg16 and Broeren et al.5 Inthe first two studies, aerodynamic testing was carried out on an NLF 0414 airfoil. In Gile-Laflin and Papadakis,18
castings of intercycle ice accretions were made from four different molds taken during icing-tunnel testing. The iceshapes were from four different ice-protection systems tested at the same icing condition. The authors diligentlypoint out that these intercycle ice shapes were not considered representative of properly functioning ice-protectionsystems due to problems encountered during the ice accretion testing. However, it will be shown that the resultingperformance degradations are not much different than in the other studies. Jackson and Bragg16 tested four differentintercycle ice simulations whose cross-sections were produced from tracings of the ice accretion during the variousicing runs. The simulations were two-dimensional, that is, constant along the span of the aerodynamic model. This
x/c
δ/c
0.00 0.01 0.02 0.03 0.04 0.05 0.06 0.07 0.08 0.09 0.10 0.110.0000
0.0002
0.0004
0.0006
0.0008
0.0010
0.0012
0.0014
0.0016NACA 23012NLF 0414
Re = 2.0×10⁶
Re = 10.0×10⁶
Re = 6.0×10⁶
American Institute of Aeronautics and Astronautics9
also represented four different ice-protection systems operated at the same icing condition. Finally, Broeren et al.5
also tested intercycle ice castings made from four different molds taken during icing-tunnel tests. In this case, apneumatic IPS was used and the four different cases correspond to differences in icing conditions and deicer cycletime. These three studies yield performance data on 12 different intercycle ice simulations for two airfoils. Tofurther facilitate comparison, all data were acquired within a Reynolds number range of 1.8×10⁶ to 2.0×10⁶.
Fig. 6 Tracing and photograph of intercycle ice shape 312 on the upper surface of a NACA 23012 airfoilequipped with a pneumatic deicer, adapted from Broeren et al.19
The effect of the intercycle ice simulations on drag and maximum lift is shown in Fig. 7. First, note that theordinate scale for the drag rise has been increased by a factor of 3.2 from the residual-ice drag plot shown in Fig. 4.As expected, the drag increases are much larger owing to both the increase in ice-shape size and the ice coverageover the whole leading-edge region. There appear to be two distinct groups of data in the figure. The set of pointshaving the higher drag increase (∆Cd > 0.016) are for three of the four simulations tested on the NACA 23012.These three ice shapes were due to three-minute cycles of the deicer, whereas all of the other 9 ice shapes,corresponding to the lower drag values were due to one-minute deicer cycles.
The maximum lift data in Fig. 7 are plotted as a function of ice-shape height, which was estimated from thetracings for the largest ice feature on the leading-edge/upper-surface region of the airfoil. Therefore, the chordwiselocation of this “maximum height feature” varied across all of the ice shapes. The clean values for each airfoil arealso indicated on the figure. There is a difference in the clean Cl,max for the NLF 0414 airfoil from the tworeferences, probably resulting from discrepancies between two models having different chord lengths tested indifferent facilities. However, the iced-airfoil data show a general trend of decreasing Cl,max with increasing ice-shapeheight, as expected. The data also tend to reflect the difference in the one-minute and three-minute deicer operationas shown in the drag data. That is, the three lowest Cl,max values (< 0.8) in Fig. 7 belong to the three three-minuteintercycle ice shapes. Another consideration is that the decrease in Cl,max from the clean value is the largest for theNACA 23012 with the intercycle ice shapes.
In another study, Broeren and Bragg20 used built-up roughness simulations of the intercycle ice castings testedon the NACA 23012. The size and distribution of the roughness was designed to mimic the ice features shown inthe castings. There were different built-up roughness simulations representing each of the four intercycle ice shapes.The relative success of this is shown in the lift data of Fig. 8. The comparison of Cl,max between the castings andbuilt-up roughness methods show good agreement for the NACA 23012. This provides some level of validation forthe simulation method. The results for the same built-up roughness simulations tested on the NLF 0414 and NACA3415 airfoils are also plotted. The Cl,max values for the NLF 0414 that are less than 1.0 correspond to the simulationsof three-minute cycle time accretions. Contrasted with the data in Fig. 7, these data may reflect the potential liftpenalty between one-minute versus three-minute deicer cycles. Tests were performed on the NACA 3415 airfoil as
x/c
y/c
-0.02 0.00 0.02 0.04 0.06 0.08 0.10 0.12-0.06
-0.04
-0.02
0.00
0.02
0.04
0.06
0.08

American Institute of Aeronautics and Astronautics10
a way to gauge sensitivity to airfoil type. The data indicate iced-airfoil Cl,max values within the spread of the othertwo airfoils. Relative to the clean maximum lift, the NACA 23012 experienced more severe degradations than theother airfoils owing to its larger clean value. A comparison of the drag rise data in Fig. 8 for the NACA 23012airfoil indicates the difficulty in trying to simulate the ice castings with built-up roughness. The overall range of thedrag rise is similar to that shown in Fig. 7, with the larger values corresponding to simulations of ice accretions dueto the three-minute deicer cycle.
Fig. 7 Effect of simulated intercycle ice shapes on drag (left) and maximum lift.
Fig. 8 Effect of built-up roughness intercycle ice simulations on drag (left) and maximum lift, for threeairfoils, adapted from Broeren and Bragg.20
Cl,clean
Cd,
iced
-C
d,cl
ean
0.0 0.1 0.2 0.3 0.4 0.5 0.60.000
0.004
0.008
0.012
0.016
0.020
0.024
0.028
0.032
Gile-Laflin and Papadakis,18 NLF 0414, 4 ice shapes, Re = 1.8×10⁶, M = 0.06Jackson and Bragg,16 NLF 0414, 4 ice shapes, Re = 1.8×10⁶, M = 0.18Broeren and Bragg,20 NACA 23012, 4 ice shapes, Re = 2.0×10⁶, M = 0.10
k/c
Cl,m
ax
0.000 0.004 0.008 0.012 0.0160.0
0.2
0.4
0.6
0.8
1.0
1.2
1.4
1.6
Clean NLF 0414 (Ref. 16)
Clean NACA 23012Clean NLF 0414 (Ref. 18)
Cl,clean
Cd,
iced
-C
d,cl
ean
0.0 0.1 0.2 0.3 0.4 0.5 0.60.000
0.004
0.008
0.012
0.016
0.020
0.024
0.028
0.032
NACA 23012, 4 cast ice shapes, Re = 2.0×10⁶, M = 0.10NACA 23012, 4 built-up roughness simulations, Re = 1.8×10⁶, M = 0.18NLF 0414, 4 built-up roughness simulations, Re = 1.8×10⁶, M = 0.18NACA 3415, 4 built-up roughness simulations, Re = 1.8×10⁶, M = 0.18
k/c
Cl,m
ax
0.000 0.004 0.008 0.012 0.0160.0
0.2
0.4
0.6
0.8
1.0
1.2
1.4
1.6
Clean NLF 0414
Clean NACA 23012Clean NACA 3415
American Institute of Aeronautics and Astronautics11
The general trends in the performance data shown here suggest that intercycle ice shapes may at least partiallybelong in the streamwise ice category of Bragg et al.3 They defined characteristics of streamwise ice as havingsmall areas of separated flow from the ice shape, but the main drivers of reduced lift and increased drag werethickening of the boundary layer and increased trailing-edge separation over the clean case. They further suggestthat roughness added to “2D” streamwise ice simulations may increase drag, but have little effect on maximum lift.In fact, Jackson17 demonstrated this for the intercycle ice shapes tested on the NFL 0414. Roughness added to the2D smooth ice simulations did increase drag, but did not affect lift. The data in Fig. 8 for the NACA 23012simulations tends to support this point as well. The built-up roughness simulations, mimicking the major icefeatures resulted in good comparison in Cl,max. But the differences in drag were larger because of inability of thebuilt-up roughness to duplicate the roughness associated with the casting simulations. These data tend to indicatethat some intercycle ice shapes may cause local flow separations on the scale of the ice features, but this flowseparation probably does not govern the aerodynamics leading to stall. On the other hand, there is a large variationin the geometry of the intercycle ice accretions and some of the performance effects, especially for the NACA23012, were large. This suggests that the extent of flow separation may be larger and that there is some overlap withthe spanwise-ridge category of ice accretion discussed in section D. The fact that there exists such a large range ofgeometries and effects makes classification difficult. Flowfield data should be acquired for some of these cases tofacilitate a better understanding of the stall mechanisms and how the ice accretions may be classified.
C. Uniform RoughnessUniform roughness is not by itself a type of ice accretion or ice remnant. It is, of course, often used for
simulating effects of initial, residual and intercycle ice accretion on airfoils. Lynch and Khodadoust1 have compilednearly all aerodynamic data for airfoils with (ice-like) roughness and provide an excellent summary. Therefore, thepurpose here is not to review all of these results, but to select some cases for comparison to the residual andintercycle ice effects already discussed.
Roughness effects on airfoils are caused not only by the size and surface coverage of the roughness, but also byits shape and concentration.3 These factors make aerodynamic comparison of roughness effects more difficult.Sandpaper is often used because its roughness size, shape and distribution is more tightly controlled and therefore ismore uniform between different experiments. The effect of 40, 80 and 150-grit sandpaper roughness on airfoilperformance is shown in Fig. 9 for NACA 23012 and NLF 0414 airfoils. The roughness sizes are k/c = 0.00114,0.00046, 0.00023 for 40, 80 and 150-grit sandpaper, respectively. For the NLF 0414 airfoil, the roughness extendedfrom x/c = 0.08 on the lower surface around the leading edge to x/c = 0.08 on the upper surface. For the NACA23012, the roughness extended from x/c = 0.10 on the lower surface around the leading edge to x/c = 0.07 on theupper surface. The plot shows, for each airfoil at each Cl, the increase in drag penalty with increasing roughnesssize. The difference in the relative behavior of these trends for each airfoil at Cl’s greater than 0.4 was due to thedifferences in the variation of the clean Cd with Cl. Compared to the data in Fig. 3, the effect of the sandpaperroughness on drag was similar to the residual ice roughness tested on the NLF 0414 and modified NACA 63-seriesairfoils. This was true despite the fact that the 80 and 150-grit sizes were smaller than the roughness of Fig. 3. Thatthe drag results are similar is likely the result of the larger surface coverage of the sandpaper, particularly in thevicinity of the stagnation point, where the boundary layer was very thin.
The corresponding lift penalties demonstrate similar behavior to the one-minute intercycle ice shapes in Fig. 7.However, compared to the penalties for the built-up roughness simulations in Fig. 8, the sandpaper roughness resulthad considerably higher Cl,max. Since the few available data for residual ice maximum lift penalties indicate onlyminor effects, the sandpaper results are likely conservative in this regard. In terms of drag penalty, these resultssuggest that sandpaper roughness may be an adequate simulation for residual ice, but is likely inadequate forintercycle ice.
Another commonly used source of standard roughness data is that published for many NACA airfoils in Abbottand von Doenhoff.30 This was “0.011-inch grain carborundum spread thinly to cover 5 to 10% of the leading edgeto 0.08c on both surfaces.” So, for the 24-inch chord models, this roughness had k/c = 0.00046. A key differencewith sandpaper roughness is the concentration of the grit particles. The roughness concentration of sandpaper isbasically 100% since the entire surface is covered. Bragg et al.3 point out that for roughness of a given size, themaximum effect is achieved for concentrations near 30%, above which increasing the concentration has littleadditional aerodynamic effect. The lift and drag performance of this roughness for several airfoils is compared tosandpaper in Fig. 10. The sandpaper had k/c = 0.00057 (40-grit) and 0.00023 (80-grit) and was applied to the airfoilfrom x/c = 0.10 on the lower surface to 0.07 on the upper surface. The Abbott and von Doenhoff30 data were at Re =

American Institute of Aeronautics and Astronautics12
6.0×10⁶ and the Broeren et al.5 data were at Re = 7.5×10⁶. The data show that the NACA standard roughness testedon the various airfoils was comparable to the sandpaper effects. Also, there is good overlap with the data in Fig. 9,which have slightly higher ∆Cd and slightly lower Cl,max values due to the largest k/c value (0.00114). The data areprovided to show (1) the comparability of NACA standard roughness data to sandpaper roughness and (2) therelative insensitivity of Reynolds number in the airfoil-with-roughness data. More discussion on Reynolds numbereffects is given in Section IV.
Fig. 9 Effect of sandpaper roughness on drag (left) and maximum lift. Coverage for NLF 0414 was from x/c= 0.08 on the lower surface to x/c = 0.08 on the upper surface. Coverage for the NACA 23012 was from x/c =0.10 on the lower surface to x/c = 0.07 on the upper surface.
Fig. 10 Comparison of NACA standard roughness and sandpaper roughness effects on drag (left) andmaximum lift. Coverage for NACA standard roughness (k/c = 0.00046) was from x/c = 0.08 on the lowersurface to x/c = 0.08 on the upper surface. Coverage for the sandpaper roughness was x/c = 0.10 on the lowersurface to x/c = 0.07 on the upper surface.
Cl,clean
Cd,
iced
-C
d,cl
ean
0.0 0.1 0.2 0.3 0.4 0.5 0.60.000
0.004
0.008
0.012
0.016
0.020
0.024
0.028
0.032
Jackson,17 NLF 0414, 40, 80 and 150-grit sandpaper, Re = 1.8×10⁶, M = 0.18Broeren and Bragg,20 NACA 23012, 40, 80, 150-grit sandpaper, Re = 1.8×10⁶, M = 0.18
k/c
Cl,m
ax
0.000 0.001 0.002 0.003 0.0040.0
0.2
0.4
0.6
0.8
1.0
1.2
1.4
1.6
Clean NLF 0414
Clean NACA 23012
Cl,clean
Cd,
iced
-C
d,cl
ean
0.0 0.1 0.2 0.3 0.4 0.5 0.60.000
0.004
0.008
0.012
0.016
0.020
0.024
0.028
0.032
Abbott and von Doenhoff30 NACA 0012, 23012, 642-215, k/c = 0.00046 roughness, Re = 6.0×10⁶, M = 0.17Broeren et al.,5 NACA 23012, 40 and 80-grit sandpaper, Re = 7.5×10⁶, M = 0.21
k/c
Cl,m
ax
0.000 0.001 0.002 0.003 0.0040.0
0.2
0.4
0.6
0.8
1.0
1.2
1.4
1.6
1.8
2.0
Clean NACA 0012, 642-215
Clean NACA 23012 (Ref. 30)Clean NACA 23012 (Ref. 5)
American Institute of Aeronautics and Astronautics13
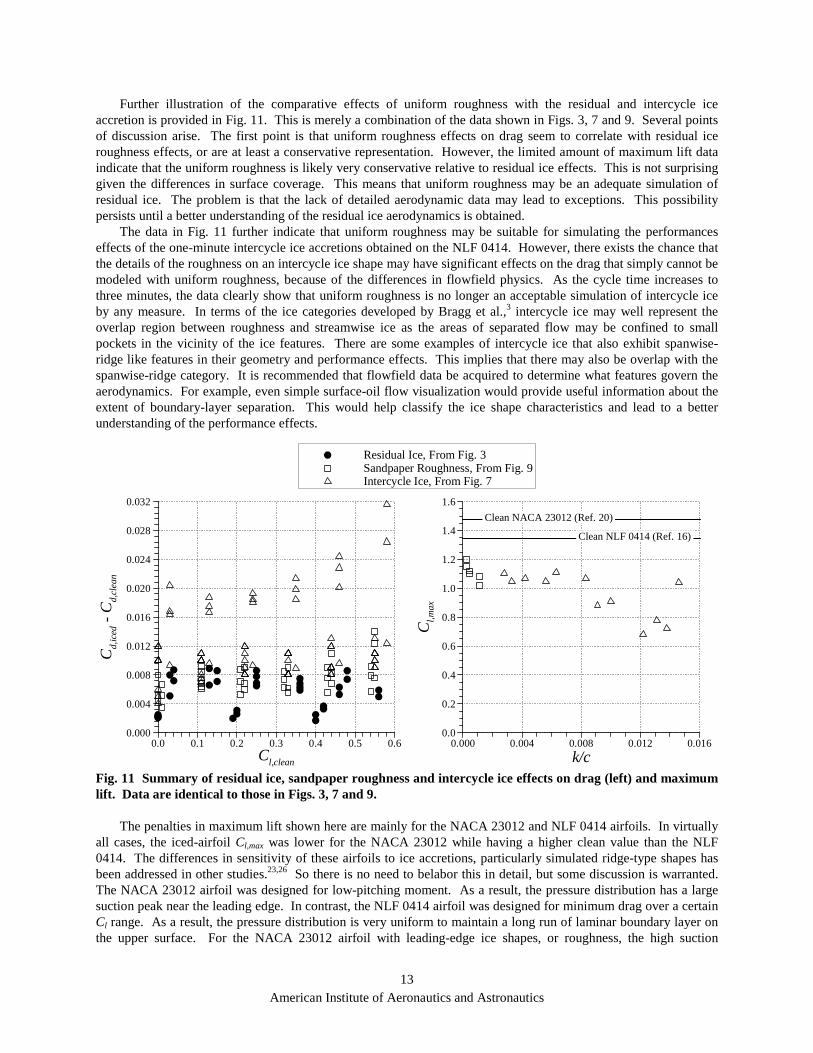
Further illustration of the comparative effects of uniform roughness with the residual and intercycle iceaccretion is provided in Fig. 11. This is merely a combination of the data shown in Figs. 3, 7 and 9. Several pointsof discussion arise. The first point is that uniform roughness effects on drag seem to correlate with residual iceroughness effects, or are at least a conservative representation. However, the limited amount of maximum lift dataindicate that the uniform roughness is likely very conservative relative to residual ice effects. This is not surprisinggiven the differences in surface coverage. This means that uniform roughness may be an adequate simulation ofresidual ice. The problem is that the lack of detailed aerodynamic data may lead to exceptions. This possibilitypersists until a better understanding of the residual ice aerodynamics is obtained.
The data in Fig. 11 further indicate that uniform roughness may be suitable for simulating the performanceseffects of the one-minute intercycle ice accretions obtained on the NLF 0414. However, there exists the chance thatthe details of the roughness on an intercycle ice shape may have significant effects on the drag that simply cannot bemodeled with uniform roughness, because of the differences in flowfield physics. As the cycle time increases tothree minutes, the data clearly show that uniform roughness is no longer an acceptable simulation of intercycle iceby any measure. In terms of the ice categories developed by Bragg et al.,3 intercycle ice may well represent theoverlap region between roughness and streamwise ice as the areas of separated flow may be confined to smallpockets in the vicinity of the ice features. There are some examples of intercycle ice that also exhibit spanwise-ridge like features in their geometry and performance effects. This implies that there may also be overlap with thespanwise-ridge category. It is recommended that flowfield data be acquired to determine what features govern theaerodynamics. For example, even simple surface-oil flow visualization would provide useful information about theextent of boundary-layer separation. This would help classify the ice shape characteristics and lead to a betterunderstanding of the performance effects.
Fig. 11 Summary of residual ice, sandpaper roughness and intercycle ice effects on drag (left) and maximumlift. Data are identical to those in Figs. 3, 7 and 9.
The penalties in maximum lift shown here are mainly for the NACA 23012 and NLF 0414 airfoils. In virtuallyall cases, the iced-airfoil Cl,max was lower for the NACA 23012 while having a higher clean value than the NLF0414. The differences in sensitivity of these airfoils to ice accretions, particularly simulated ridge-type shapes hasbeen addressed in other studies.23,26 So there is no need to belabor this in detail, but some discussion is warranted.The NACA 23012 airfoil was designed for low-pitching moment. As a result, the pressure distribution has a largesuction peak near the leading edge. In contrast, the NLF 0414 airfoil was designed for minimum drag over a certainCl range. As a result, the pressure distribution is very uniform to maintain a long run of laminar boundary layer onthe upper surface. For the NACA 23012 airfoil with leading-edge ice shapes, or roughness, the high suction
Cl,clean
Cd,
iced
-C
d,cl
ean
0.0 0.1 0.2 0.3 0.4 0.5 0.60.000
0.004
0.008
0.012
0.016
0.020
0.024
0.028
0.032
Residual Ice, From Fig. 3Sandpaper Roughness, From Fig. 9Intercycle Ice, From Fig. 7
k/c
Cl,m
ax
0.000 0.004 0.008 0.012 0.0160.0
0.2
0.4
0.6
0.8
1.0
1.2
1.4
1.6
Clean NLF 0414 (Ref. 16)
Clean NACA 23012 (Ref. 20)
American Institute of Aeronautics and Astronautics14
pressures on the leading edge cannot be achieved. The ice shapes, or roughness, also force a change of stall type totrailing-edge stall. The combination of these effects leads to the low values of Cl,max. The generation of lift on theNLF 0414 with leading-edge roughness or ice accretion can be maintained because the pressure distribution is moreuniform, nor does this force a change in stall type. The combination of these factors for the NLF 0414 make it lesssensitive to these accretions.
D. Spanwise-Ridge IceA separate category of ice remnants for spanwise-ridge ice was motivated, in part, by the differences in
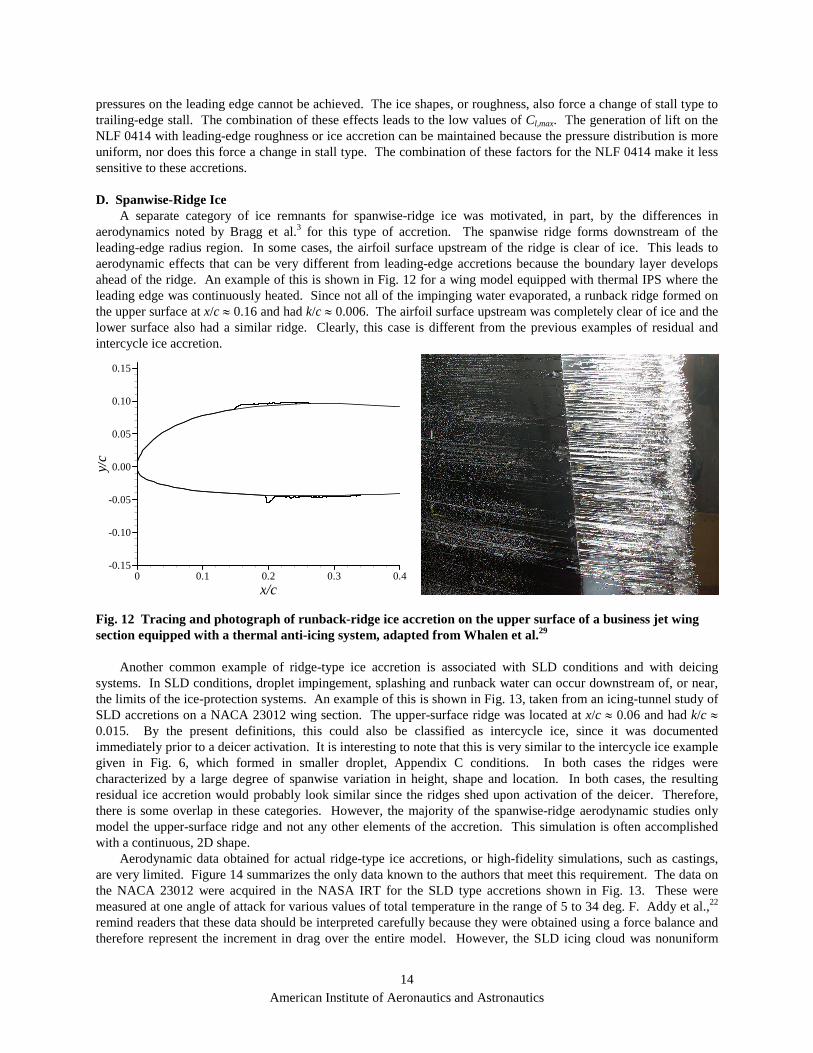
aerodynamics noted by Bragg et al.3 for this type of accretion. The spanwise ridge forms downstream of theleading-edge radius region. In some cases, the airfoil surface upstream of the ridge is clear of ice. This leads toaerodynamic effects that can be very different from leading-edge accretions because the boundary layer developsahead of the ridge. An example of this is shown in Fig. 12 for a wing model equipped with thermal IPS where theleading edge was continuously heated. Since not all of the impinging water evaporated, a runback ridge formed onthe upper surface at x/c ≈ 0.16 and had k/c ≈ 0.006. The airfoil surface upstream was completely clear of ice and thelower surface also had a similar ridge. Clearly, this case is different from the previous examples of residual andintercycle ice accretion.
Fig. 12 Tracing and photograph of runback-ridge ice accretion on the upper surface of a business jet wingsection equipped with a thermal anti-icing system, adapted from Whalen et al.29
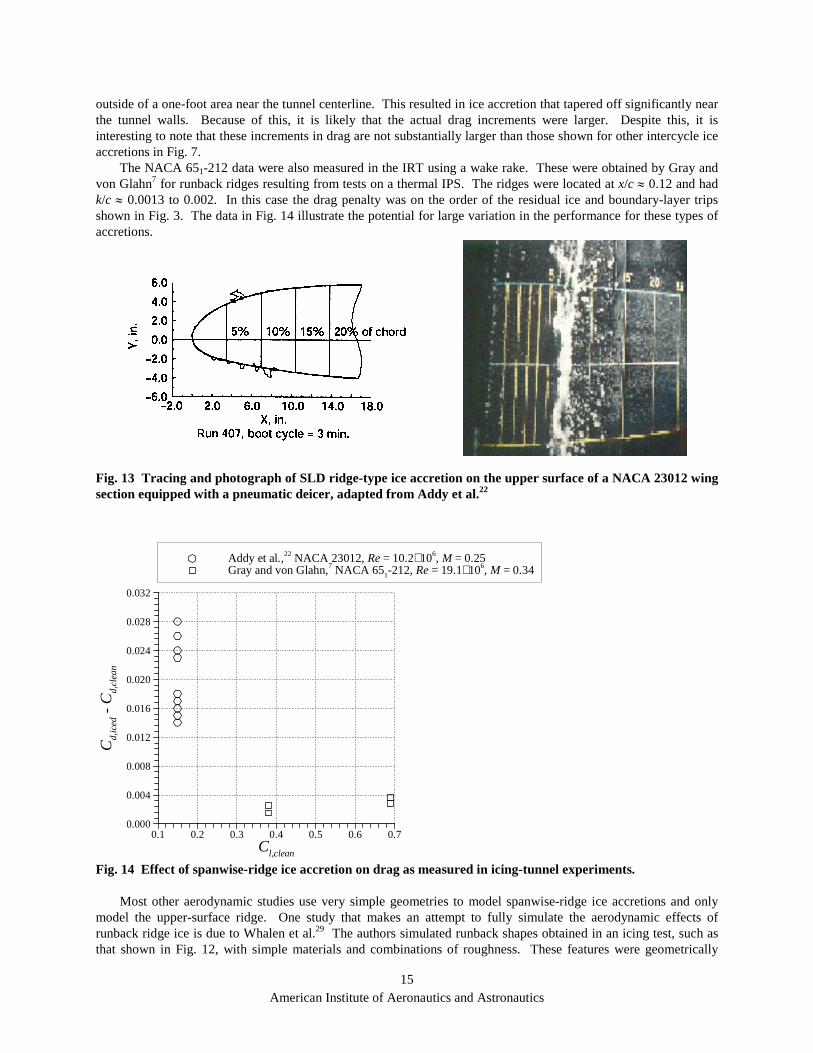
Another common example of ridge-type ice accretion is associated with SLD conditions and with deicingsystems. In SLD conditions, droplet impingement, splashing and runback water can occur downstream of, or near,the limits of the ice-protection systems. An example of this is shown in Fig. 13, taken from an icing-tunnel study ofSLD accretions on a NACA 23012 wing section. The upper-surface ridge was located at x/c ≈ 0.06 and had k/c ≈0.015. By the present definitions, this could also be classified as intercycle ice, since it was documentedimmediately prior to a deicer activation. It is interesting to note that this is very similar to the intercycle ice examplegiven in Fig. 6, which formed in smaller droplet, Appendix C conditions. In both cases the ridges werecharacterized by a large degree of spanwise variation in height, shape and location. In both cases, the resultingresidual ice accretion would probably look similar since the ridges shed upon activation of the deicer. Therefore,there is some overlap in these categories. However, the majority of the spanwise-ridge aerodynamic studies onlymodel the upper-surface ridge and not any other elements of the accretion. This simulation is often accomplishedwith a continuous, 2D shape.
Aerodynamic data obtained for actual ridge-type ice accretions, or high-fidelity simulations, such as castings,are very limited. Figure 14 summarizes the only data known to the authors that meet this requirement. The data onthe NACA 23012 were acquired in the NASA IRT for the SLD type accretions shown in Fig. 13. These weremeasured at one angle of attack for various values of total temperature in the range of 5 to 34 deg. F. Addy et al.,22
remind readers that these data should be interpreted carefully because they were obtained using a force balance andtherefore represent the increment in drag over the entire model. However, the SLD icing cloud was nonuniform
x/c
y/c
0 0.1 0.2 0.3 0.4-0.15
-0.10
-0.05
0.00
0.05
0.10
0.15
American Institute of Aeronautics and Astronautics15
outside of a one-foot area near the tunnel centerline. This resulted in ice accretion that tapered off significantly nearthe tunnel walls. Because of this, it is likely that the actual drag increments were larger. Despite this, it isinteresting to note that these increments in drag are not substantially larger than those shown for other intercycle iceaccretions in Fig. 7.
The NACA 651-212 data were also measured in the IRT using a wake rake. These were obtained by Gray andvon Glahn7 for runback ridges resulting from tests on a thermal IPS. The ridges were located at x/c ≈ 0.12 and hadk/c ≈ 0.0013 to 0.002. In this case the drag penalty was on the order of the residual ice and boundary-layer tripsshown in Fig. 3. The data in Fig. 14 illustrate the potential for large variation in the performance for these types ofaccretions.
Fig. 13 Tracing and photograph of SLD ridge-type ice accretion on the upper surface of a NACA 23012 wingsection equipped with a pneumatic deicer, adapted from Addy et al.22
Fig. 14 Effect of spanwise-ridge ice accretion on drag as measured in icing-tunnel experiments.
Most other aerodynamic studies use very simple geometries to model spanwise-ridge ice accretions and onlymodel the upper-surface ridge. One study that makes an attempt to fully simulate the aerodynamic effects ofrunback ridge ice is due to Whalen et al.29 The authors simulated runback shapes obtained in an icing test, such asthat shown in Fig. 12, with simple materials and combinations of roughness. These features were geometrically
Cl,clean
Cd,
iced
-C
d,cl
ean
0.1 0.2 0.3 0.4 0.5 0.6 0.70.000
0.004
0.008
0.012
0.016
0.020
0.024
0.028
0.032
Addy et al.,22 NACA 23012, Re = 10.2×10⁶, M = 0.25Gray and von Glahn,7 NACA 651-212, Re = 19.1×10⁶, M = 0.34

American Institute of Aeronautics and Astronautics16
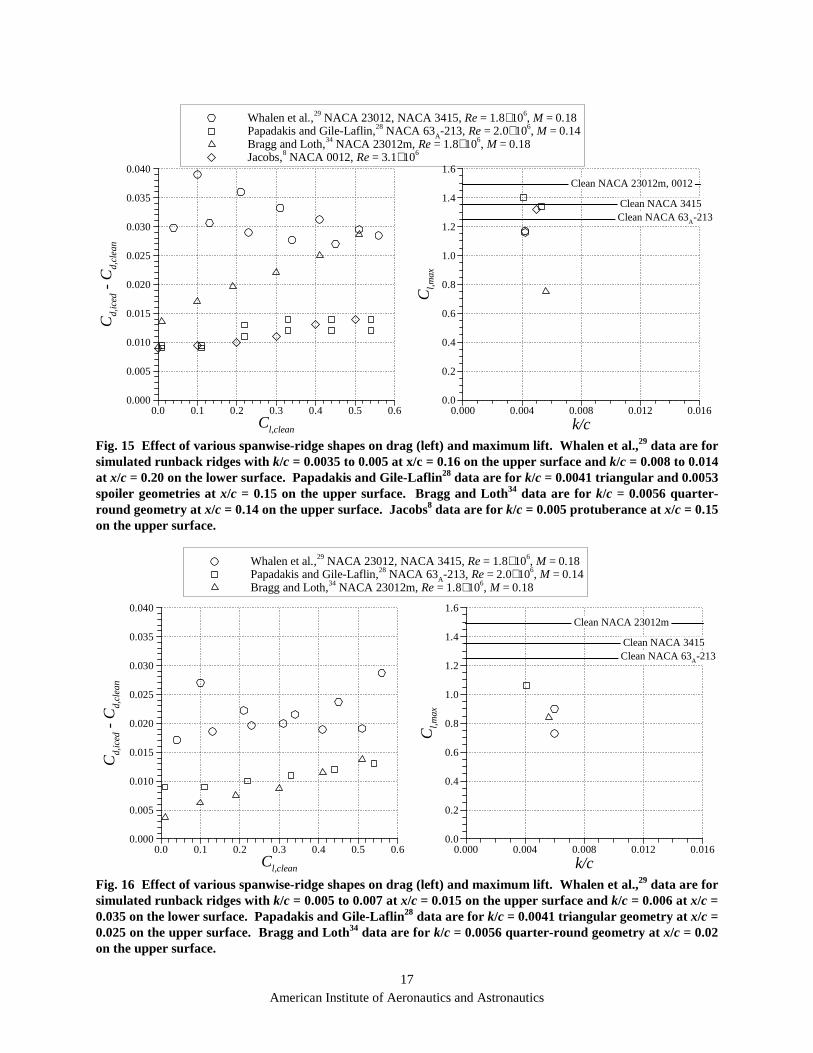
scaled from the icing-tunnel model down to smaller size aerodynamic models with NACA 23012 and NACA 3415airfoils. Two different cases were tested. In the first case, similar to Fig. 12, the upper and lower-surface ridgeswere located at x/c = 0.16 and x/c = 0.20, respectively and had heights from k/c = 0.0035 to 0.005 and k/c = 0.008 to0.014, respectively. The second case resulted from much colder temperatures which resulted in the ridges beinglocated closer to the leading edge. The upper and lower-surface ridges were located at x/c = 0.015 and x/c = 0.035,respectively and had heights from k/c = 0.005 to 0.007 and k/c = 0.006, respectively.
The aerodynamic results for the first case are plotted in Fig. 15 along with data from other studies. Papadakisand Gile-Laflin28 tested simple triangular and spoiler geometries on a modified NACA 63A-213 airfoil. These hadk/c = 0.0041 and 0.0053, respectively, and were located at x/c = 0.15 on the upper surface only. Bragg and Loth34
tested a forward-facing quarter-round on a NACA 23012m airfoil that had k/c = 0.0056 and was located at x/c = 0.14on the upper surface only. Also included in Fig. 15 are the classic protuberance data on the NACA 0012 due toJacobs.8 The protuberance had a spoiler-type geometry with k/c = 0.005 and was located at x/c = 0.15 on the uppersurface only. Therefore, Fig. 15 is a summary of the performance effects of these various geometries tested onvarious airfoils. Care has been taken to match, as closely as possible, the size and location of the ridges. Therefore,the differences in performance were due to ridge geometry and clean airfoil geometry.
The data show that the drag penalties for the Whalen et al.29 simulations were higher than most other cases.This probably results from the fact that they also tested a lower-surface runback ridge in addition to the upper-surface ridge. This, of course, is more realistic and probably more accurately reflects the true drag penalty of arunback-type ridge accretion. In this case, the drag rise for the ridge shapes was generally larger than for the three-minute intercycle accretions shown in Fig. 7. The data show that if only an upper-surface ridge is present, the dragpenalty could be in the range of small intercycle ice accretions.
The effect on maximum lift also shows a large variation. The simulated runback ice shapes tested by Whalen etal.29 had nearly the same Cl,max for both airfoils. This meant that the NACA 23012 experienced more of a reductiondue to its higher clean Cl,max value. However, the iced Cl,max in this case was much larger than the NACA 23012mwith the forward-facing quarter round. The lower-surface ridge present in the Whalen et al.29 simulations was notexpected to affect the Cl,max. So the major differences in the upper-surface ridge between the two studies wasgeometric. That is, the Whalen et al.29 ridge had a substantial chordwise extent (from x/c = 0.16 to ≈0.24) withspanwise variations in height due to the addition of grit roughness. The Bragg and Loth34 ridge was a simpleforward-facing quarter round. It is possible this difference in geometry resulted in the large difference in Cl,max
shown in Fig.15. Bragg et al.3 point out that the cross-sectional and spanwise geometry of ridge ice shapes are veryimportant factors in the resulting aerodynamics.
In the case of the Papadakis and Gile-Laflin28 data, the maximum lift performance was improved by theaddition of the ridge shapes over the clean model case. Such results are similar to those obtained by Calay et al.,27
who tested k/c = 0.0035 triangular shapes on a NACA 0012 airfoil at x/c = 0.15 and Re = 1.25×10⁶. (These datawere not plotted here because of model size limitations in that experiment.) Yet, a change of geometry to a spoilerprotuberance, an increase of k/c to 0.005 and an increase in Re to 3.1×10⁶, tested by Jacobs8 on a NACA 0012resulted in a Cl,max reduction. This sensitivity of Cl,max due to similar spanwise-ridge shapes is currently beingexplored by Whalen et al.33 The local boundary-layer thickness for larger angles of attack at x/c = 0.15 to 0.16 onthe upper surface can be on the same order of magnitude as the ridge heights tested. Therefore, it is not surprisingthat the small range of ridge heights shown in Fig. 15 have such large differences in performance. With ridgeheights approaching the boundary-layer thickness, the effects of ridge geometry, airfoil geometry and Reynoldsnumber all become much more important to the resulting aerodynamics. Unfortunately, there is little flowfield dataknown to the authors that would provide more insight into these effects.
The aerodynamic effect of the second set of runback ridge simulations tested by Whalen et al.29 is shown in Fig.16 along with data from other studies. The k/c = 0.0041 triangular geometry was tested by Papadakis and Gile-Laflin28 at x/c = 0.025. Bragg and Loth34 tested the k/c = 0.0056 quarter-round geometry at x/c = 0.02. The dragresults are similar to Fig. 15, where the Whalen et al.29 data had the largest drag penalty owing to the presence of thelower-surface ridge. It is interesting to note that this drag penalty was less than for the ridges located much fartherdownstream and that it was closer in magnitude to the three-minute intercycle ice accretions shown in Fig. 7. Thedifference in the Whalen et al.29 drag data may have also been due to differences in geometry between thesimulations in Figs. 15 and 16. The maximum lift reductions resulting from these ridge geometries are more typicalof leading-edge ice shapes. That is, no increases in Cl,max were observed. It is also noteworthy that the range ofCl,max in this case is also similar to the range shown in Fig. 7 for the intercycle ice shapes. With these ridge shapes
American Institute of Aeronautics and Astronautics17
Fig. 15 Effect of various spanwise-ridge shapes on drag (left) and maximum lift. Whalen et al.,29 data are forsimulated runback ridges with k/c = 0.0035 to 0.005 at x/c = 0.16 on the upper surface and k/c = 0.008 to 0.014at x/c = 0.20 on the lower surface. Papadakis and Gile-Laflin28 data are for k/c = 0.0041 triangular and 0.0053spoiler geometries at x/c = 0.15 on the upper surface. Bragg and Loth34 data are for k/c = 0.0056 quarter-round geometry at x/c = 0.14 on the upper surface. Jacobs8 data are for k/c = 0.005 protuberance at x/c = 0.15on the upper surface.
Fig. 16 Effect of various spanwise-ridge shapes on drag (left) and maximum lift. Whalen et al.,29 data are forsimulated runback ridges with k/c = 0.005 to 0.007 at x/c = 0.015 on the upper surface and k/c = 0.006 at x/c =0.035 on the lower surface. Papadakis and Gile-Laflin28 data are for k/c = 0.0041 triangular geometry at x/c =0.025 on the upper surface. Bragg and Loth34 data are for k/c = 0.0056 quarter-round geometry at x/c = 0.02on the upper surface.
Cl,clean
Cd,
iced
-C
d,cl
ean
0.0 0.1 0.2 0.3 0.4 0.5 0.60.000
0.005
0.010
0.015
0.020
0.025
0.030
0.035
0.040
Whalen et al.,29 NACA 23012, NACA 3415, Re = 1.8×10⁶, M = 0.18Papadakis and Gile-Laflin,28 NACA 63A-213, Re = 2.0×10⁶, M = 0.14Bragg and Loth,34 NACA 23012m, Re = 1.8×10⁶, M = 0.18Jacobs,8 NACA 0012, Re = 3.1×10⁶
k/cC
l,max
0.000 0.004 0.008 0.012 0.0160.0
0.2
0.4
0.6
0.8
1.0
1.2
1.4
1.6
Clean NACA 63A-213
Clean NACA 23012m, 0012
Clean NACA 3415
Cl,clean
Cd,
iced
-C
d,cl
ean
0.0 0.1 0.2 0.3 0.4 0.5 0.60.000
0.005
0.010
0.015
0.020
0.025
0.030
0.035
0.040
Whalen et al.,29 NACA 23012, NACA 3415, Re = 1.8×10⁶, M = 0.18Papadakis and Gile-Laflin,28 NACA 63A-213, Re = 2.0×10⁶, M = 0.14Bragg and Loth,34 NACA 23012m, Re = 1.8×10⁶, M = 0.18
k/c
Cl,m
ax
0.000 0.004 0.008 0.012 0.0160.0
0.2
0.4
0.6
0.8
1.0
1.2
1.4
1.6
Clean NACA 63A-213
Clean NACA 23012m
Clean NACA 3415

American Institute of Aeronautics and Astronautics18
located much closer to the leading edge, they are on the order of ten times larger than the local boundary-layerthickness (cf. Fig. 5). Therefore, the ridge geometry and clean airfoil geometry play less of a role than in theprevious case (Fig. 15), where such a large spread in the data was observed.
For the case of SLD-ridge type ice like those shown in Fig. 13, the authors are unaware of any aerodynamicdata available for high-fidelity simulations of the ice accretion. Instead, there have been numerous studies that havelooked at very simple geometric simulations. While these studies have yielded immensely valuable insight into sizeand location effects on various airfoils, it is difficult to relate the performance degradations to actual ice accretions.An example of some of these data are shown in Fig. 17. All of the data shown are for a simple geometric upper-surface ridge. For Bragg and Loth,34 the quarter-round geometry had k/c = 0.0139 and was located at x/c = 0.06.For Papadakis and Gile-Laflin,28 the triangular geometry had k/c = 0.0115 and was located at x/c = 0.05. ForJacobs,8 the protuberance had k/c = 0.0125 and was located at x/c = 0.05. These ridge simulations were chosen tocorrespond to the ridges shown in Figs. 6 and 13, both of which were located at x/c ≈ 0.06 and had k/c ≈ 0.015. Thelift and drag data in Fig. 17, show a large range of effects. For the NACA 23012 and 0012 airfoils, there is anextremely large increase in drag with Cl. This occurred because the airfoils with the ridges attached stalled at verylow Cl — 0.35 for the NACA 23012 and 0.50 for the NACA 0012. For the other two airfoils, the drag rise due to theridge shape did not increase in the same way because the maximum lift values were higher. The maximum lift valuefor the casting simulation of the accretion shown in Fig. 6 was 0.78 (cf. Fig. 7). This is over a factor of two largerthan the value of 0.35 for the quarter-round geometry in Fig. 17. Based on this, it is not surprising that theassociated drag penalty was also much lower. It is likely that the large difference in performance was due, in part, tothe spanwise variability of the ridge shown in Fig. 6. It was really made up of a discontinuous row of large icechunks. Also present in Fig. 6 was ice accretion on the leading edge, upstream of the ridge. The presences of thisice may have reduced the effect of spanwise ridge. Broeren et al.5 provide a more detailed comparison of thesecases with simple geometric ridge simulations.
Fig. 17 Effect of various spanwise-ridge shapes on drag (left) and maximum lift. Bragg and Loth34 data arefor k/c = 0.0139 quarter-round geometry at x/c = 0.06 on the upper surface. Papadakis and Gile-Laflin28 dataare for k/c = 0.0115 triangular geometry at x/c = 0.05 on the upper surface. Jacobs8 data are for k/c = 0.0125protuberance at x/c = 0.05 on the upper surface.
Cl,clean
Cd,
iced
-C
d,cl
ean
0.0 0.1 0.2 0.3 0.4 0.5 0.60.00
0.02
0.04
0.06
0.08
0.10
0.12
Bragg and Loth,34 NACA 23012m, NLF 0414, Re = 1.8×10⁶, M = 0.18Papadakis and Gile-Laflin,28 NACA 63A-213, Re = 2.0×10⁶, M = 0.14Jacobs,8 NACA 0012, Re = 3.1×10⁶
k/c
Cl,m
ax
0.000 0.004 0.008 0.012 0.0160.0
0.2
0.4
0.6
0.8
1.0
1.2
1.4
1.6
Clean NACA 63A-213
Clean NACA 23012m, 0012

American Institute of Aeronautics and Astronautics19
Figures 14 to 17 illustrate the need for aerodynamic data for iced-airfoil configurations that have high-fidelityspanwise-ridge simulations such as ice castings. Numerous studies have shown that the aerodynamic penalties ofridge-type accretions can be very large for simple geometries.23,24,26 The question is: how well do these simplegeometries actually simulate a real ice accretion? Bragg et al.3 point out that factors like cross-sectional geometryand spanwise variation can result in large variations in performance degradations. Lee35 notes that iced Cl,max valuescan be at least a factor of two larger due to changes in geometry and spanwise gaps in a k/c = 0.0139 ridge located atx/c = 0.10 on the upper surface of a NACA 23012m airfoil. The data presented in Figs. 14 to 17 would certainlysupport this conclusion. Without high-fidelity aerodynamic data, it is difficult to judge what the true performancedegradations are. Bragg et al.,3 suggest in their review that spanwise-ridge geometries can have potentially thelargest aerodynamic effect. This may well be true, but these data indicate that runback ridges may haveperformance effects on the order of initial roughness. Thus, there is a potential overlap with the previous ice-shapeclassifications as discussed in connection with intercycle ice. Further study may lead to an expansion of theclassification of these ice accretions, or perhaps, to another classification altogether.
IV. Reynolds Number EffectsNearly all of the aerodynamic data compiled in this paper were in the range of Re = 1.8×10⁶ to 3.1×10⁶, except
for the standard roughness data (Fig. 10) and the measurements made during icing tests. These lower-Reynoldsnumber data were selected in order to facilitate comparison across the various airfoils and icing simulationsconsidered. Fortunately, much is known about Reynolds and Mach number effects on iced airfoils. Bragg et al.,3
provide a detailed discussion on this, particularly for large ice accretions. For clean airfoils, increases in Reynoldsnumber from 2.0×10⁶ to 10×106 significantly increase Cl,max and reduce the drag. The percentage change in thesequantities varies depending upon the type of airfoil. In contrast, iced-airfoil Cl,max and drag are relatively insensitiveto changes in Reynolds number. This means that nearly all of the conclusions about ice remnants given in this papershould be valid at higher Reynolds number. In fact, aerodynamic data for the intercycle ice accretion simulations onthe NACA 23012 was obtained for Reynolds numbers as high as 10.5×106.5,6,19 The minor changes in Reynoldsnumber observed would in no way alter the conclusions of this paper. In addition, Broeren et al.5,6,19 also providehigher Reynolds number validation for the sandpaper roughness data. In this case, there is slightly more changewith Reynolds number, but it is still only a fraction of the clean model Reynolds number dependence. Anotherroughness study that showed Reynolds number insensitivity to large changes in Reynolds number was due toMorgan et al.36
There is one area of ice remnants where Reynolds number considerations may prove to be significant. That isfor the spanwise-ridge ice associated with runback ice accretions. The preliminary data shown here indicate that thesize of the runback ridges may be on the order of the boundary-layer thickness. In this case, the Reynolds numbermay play an important role in proper simulation and scaling of the runback ridges between icing-tunnel andaerodynamic testing. Unfortunately, the lack of full-scale data for this case leaves this an open question. Incontrast, high Reynolds number testing has been performed for the large, k/c = 0.0139 quarter-round ridge shapes onthe NACA 23012 airfoil for chordwise locations as far aft as x/c = 0.20.37 In this case, virtually no change in lift anddrag performance was observed up to Re = 10.5×10⁶. The potential for Reynolds number effects in the case of therunback ridge further suggests that an additional classification of ice shapes may be needed.
V. ConclusionThe overall objective of this paper was to survey previous research on airfoils with ice remnants and summarize
what is known about the resulting aerodynamics and performance. It was found that very little aerodynamic dataexist for residual ice. The available data indicate a range of drag penalties from those similar to boundary-layer tripsto that of uniform, or sandpaper, roughness. However, the maximum lift penalties for residual ice may be muchsmaller than for uniform roughness. An important difference is that in the case of residual ice, the leading edge maybe clear of ice for the first few percent chord, whereas in most roughness studies the roughness is applied around theleading edge. More aerodynamic data are required to understand the flow mechanisms that drive the increase indrag and that may potentially alter the stalling characteristics.
There are a number of good sources of data for intercycle ice accretions where high-fidelity simulations wereused for aerodynamic testing. The data indicate that drag increase and maximum lift reduction for intercycle iceaccretions resulting from one-minute deicer cycles are similar to those associated with sandpaper roughness.However, when the deicer cycle time was increased to three-minutes large degradations in performance wereobserved. This implies that the intercycle ice accretions represent an overlap region between roughness and

American Institute of Aeronautics and Astronautics20
streamwise ice accretion. It is likely that the boundary-layer separation some of the intercycle shapes was confinedto small areas and not a primary driver of the aerodynamics. In other cases, the intercycle ice geometry andperformance characteristics were more similar to spanwise-ridge type ice accretion. This means that larger scaleareas of separation may be a significant factor in the aerodynamics. Flowfield data, even basic flow visualization,would be very useful to fully document this and better understand how intercycle ice accretion relates to other ice-shape classifications.
Aerodynamic data for high-fidelity simulations of spanwise-ridge ice accretion are scarce. This is unfortunatebecause the data that do exist represent an enormous range of performance penalties. In some cases, simplegeometric simulations of runback ridges were found to result in an increase in maximum lift. While in other cases,large geometric simulations of spanwise (SLD) ridges were found to result in maximum lift coefficients as low as0.35. It is also known that the cross-sectional and spanwise geometry of spanwise-ridge accretions can be importantfactors in the aerodynamics. The small size of runback ridges may imply that there are larger Reynolds numbereffects than have previously been observed for iced airfoils. Because of these factors, it is highly recommended thatan effort be undertaken to evaluate the aerodynamics of spanwise-ridge type ice accretions using high-fidelitysimulations.
AcknowledgementsThe authors were supported in part by NASA and FAA research grants that both directly and indirectly
contributed to this work. The support and insight into iced-airfoil aerodynamics from Gene Addy, Mark Potapczuk,Tom Bond, Sam Lee and others at NASA Glenn Research Center along with Jim Riley and Gene Hill at FAA aregratefully acknowledged. The authors also thank Ed Whalen for contributing the boundary-layer thickness dataused in this paper.
References
1 Lynch, F.T., and Khodadoust, A., “Effects of Ice Accretions on Aircraft Aerodynamics,” Progress inAerospace Sciences, Vol. 37, 2001, pp. 669-767.
2 Cebeci, T., and Kafyeke, F., “Aircraft Icing,” Annual Review of Fluid Mechanics, Vol. 35, 2003, pp. 11-21.3 Bragg, M.B., Broeren, A.P., and Blumenthal, L.A., “Iced-Airfoil Aerodynamics,” Progress in Aerospace
Sciences, Vol. 41, No.5, July 2005, pp. 323-362.4 Society of Automotive Engineers, S.A.E. Aerospace Information Report, AIR5504, Sept. 2002.5 Broeren, A.P., Bragg, M.B., and Addy, H.E. Jr., “Effect of Intercycle Ice Accretion on Airfoil Performance,”
Journal of Aircraft, Vol. 41, No. 1, Jan.-Feb., 2004, pp. 165-174.6 Broeren, A.P., and Bragg, M.B., “Effect of Residual and Intercycle Ice Accretions on Airfoil Performance,”
Dept. of Transportation, Federal Aviation Administration Report DOT/FAA/AR-02/68, May 2002.7 Gray, V.H., and von Glahn, U.H., “Effect of Ice and Frost Formations on Drag of a NACA 651-212 Airfoil for
Various Modes of Thermal Ice Protection,” NACA TN-2962, June 1953.8 Jacobs, E.N., “Airfoil Section Characteristics as Affected by Protuberances,” NACA Rep. 446, 1932.9 Bowden, D.T., “Effect of Pneumatic De-Icers and Ice Formations on Aerodynamic Characteristics of an
Airfoil,” NACA TN-3564, Feb. 1956.10 Albright, A.E., Kohlman, D.L., Schweikhard, W.G., and Evanich, P., “Evaluation of a Pneumatic Boot
Deicing System on a General Aviation Wing Model,” NASA TM-82363, June 1981.11 Bond, T.H., Shin, J., Mesander, G.A., “Advanced Ice Protection Systems Test in the NASA Lewis Icing
Research Tunnel,” NASA TM-103757, May 1991.12 Shin, J., and Bond, T.H., “Surface Roughness Due to Residual Ice in the Use of Low Power Deicing
Systems,” AIAA Paper 93-0031, Jan. 1993, also NASA TM-105971, Jan. 1993.13 Bond, T.H., and Shin, J., “Results of Low Power Deicer Tests on a Swept Inlet Component in the NASA
Lewis Icing Research Tunnel,” AIAA Paper 93-0032, Jan. 1993.14 Bond, T.H., Shin, J., Mesander, G.A., and Yeoman, K.E., “Results of the USAF/NASA Low-Power Ice
Protection Systems Test in the NASA Lewis Icing Research Tunnel,” NASA TP-3319, Sept. 1993.15 Reichhold, J.D., and Bragg, M.B., “Residual Ice Characteristics and the Resulting Aerodynamic Performance
Penalties,” AGATE WP4.010, May 1998.16 Jackson, D.G., and Bragg, M.B., “Aerodynamic Performance of an NLF Airfoil with Simulated Ice,” AIAA
Paper 99-0373, Jan. 1999.

American Institute of Aeronautics and Astronautics21
17 Jackson, D.G., “Effect of Simulated Ice and Residual Ice Roughness on the Performance of a NaturalLaminar Flow Airfoil,” M.S. Thesis, Dept. of Aeronautical and Astronautical Eng., Univ. of Illinois at Urbana-Champaign, Urbana, Illinois, 1999.
18 Gile-Laflin, B.E., and Papadakis, M., “Experimental Investigation of Simulated Ice Accretions on a NaturalLaminar Flow Airfoil,” AIAA Paper 2001-0088, Jan. 2001.
19 Broeren, A.P., Addy, H.E. Jr., and Bragg, M.B., “Effect of Intercycle Ice Accretions on Airfoil Performance,”AIAA Paper 2002-0240, Jan. 2002.
20 Broeren, A.P., and Bragg, M.B., “Effect of Airfoil Geometry on Performance with Simulated Intercycle IceAccretions,” Journal of Aircraft, Vol. 42, No. 1, Jan.-Feb., 2005, pp. 121-130.
21 Miller, D.R., Addy, H.E., Jr., and Ide, R.F., “A Study of Large Droplet Ice Accretion in the NASA Lewis IRTat Near-Freezing Conditions,” AIAA Paper 96-0934, Jan. 1996.
22 Addy, H.E., Jr., Miller, D.R., and Ide, R.F., “A Study of Large Droplet Ice Accretion in the NASA LewisIRT at Near-Freezing Conditions; Part 2,” NASA TM-107424, Apr. 1997., Prepared for the InternationalConference on Aircraft Inflight Icing, FAA Springfield, VA., 1996.
23 Lee, S., and Bragg, M.B., “Effects of Simulated-Spanwise Ice Shapes on Airfoils: ExperimentalInvestigation,” AIAA Paper 99-0092, Jan. 1999.
24 Lee, S., and Bragg, M.B., “Experimental Investigation of Simulated Large-Droplet Ice Shapes on AirfoilAerodynamics,” Journal of Aircraft, Vol. 36, No. 5, Sept.-Oct. 1999, pp. 844-850.
25 Lee, S., Kim, H.S., and Bragg, M.B., “Investigation of Factors that Influence Iced-Airfoil Aerodynamics,”AIAA Paper 2000-0099, Jan. 2000.
26 Lee, S., and Bragg, M.B., “Investigation of Factors Affecting Iced-Airfoil Aerodynamics,” Journal ofAircraft, Vol. 40, No. 3, May-June, 2003, pp. 499-508.
27 Calay, R.K., Holdo, A.E., Mayman, P., and Lun, I, “Experimental Simulation of Runback Ice,” Journal ofAircraft, Vol. 34, No. 2, Mar.-Apr., 1997, pp. 206-212.
28 Papadakis, M., and Gile-Laflin, B.E., “Aerodynamic Performance of a Tail Section with Simulated IceShapes and Roughness,” AIAA Paper 2001-0539, Jan. 2001.
29 Whalen, E.A., Broeren, A.P., Bragg, M.B., and Lee, S., “Characteristics of Runback Ice Accretions and theirAerodynamic Effects,” AIAA Paper 2005-1065, Jan. 2005.
30 Abbott, I.H., and von Doenhoff, A.E., “Theory of Wing Sections,” Dover Publications, New York, 1959.31 Sommers, D.M., “Design and Experimental Results for a Flapped Natural-Laminar-Flow Airfoil for General
Aviation Applications,” NASA TP-1865, June 198132 McGhee, R.J., Viken, J.K., Pfenniger, W., Beasley, W.D., and Harvey, W.D., “Experimental Results for a
Flapped Natural-Laminar-Flow Airfoil with High Lift/Drag Ratio,” NASA TM-85788, May 1984.33 Whalen, E.A., Broeren, A.P., and Bragg, M.B., “Reynolds Number Considerations for Aerodynamic Testing
of Scaled Runback Ice Accretions,” AIAA Paper 2006-0260, Jan. 2006.34 Bragg, M.B., and Loth, E., “Effects of Large-Droplet Ice Accretion on Airfoil and Wing Aerodynamics and
Control,” Dept. of Transportation, Federal Aviation Administration Report DOT/FAA/AR-00/14, April. 2000.35 Lee, S., “Effects of Super-cooled, Large-droplet Icing on Aerofoil Aerodynamics,” Ph.D. Dissertation, Dept.
of Aeronautical and Astronautical Eng., Univ. of Illinois, Urbana, IL, 2001.36 Morgan, H.L. Jr., Ferris, J.C., and McGhee, R.J., “A Study of High-Lift Airfoils at High Reynolds Numbers
in the Langley Low-Turbulence Pressure Tunnel,” NASA TM-89125, July 1987.37 Broeren, A.P., Lee, S., LaMarre, C.M., and Bragg, M.B., “Effect of Airfoil Geometry on Performance with
Simulated Ice Accretions Volume 1: Experimental Investigation,” Dept. of Transportation, Federal AviationAdministration Report DOT/FAA/AR-03/64, Aug. 2003.