Embed Size (px)
Citation preview
Liu, X., Kamliya Jawahar, H., Azarpeyvand, M., & Theunissen, R. (2017).Aerodynamic performance and wake development of airfoils with serratedtrailing-edges. AIAA Journal, 55(11), 3669-3680. DOI: 10.2514/1.J055817
Peer reviewed version
Link to published version (if available):10.2514/1.J055817
Link to publication record in Explore Bristol ResearchPDF-document
This is the author accepted manuscript (AAM). The final published version (version of record) is available onlinevia AIAA at https://arc.aiaa.org/doi/10.2514/1.J055817. Please refer to any applicable terms of use of thepublisher.
University of Bristol - Explore Bristol ResearchGeneral rights
This document is made available in accordance with publisher policies. Please cite only the publishedversion using the reference above. Full terms of use are available:http://www.bristol.ac.uk/pure/about/ebr-terms

Take down policy
Explore Bristol Research is a digital archive and the intention is that deposited content should not beremoved. However, if you believe that this version of the work breaches copyright law please [email protected] and include the following information in your message:
• Your contact details• Bibliographic details for the item, including a URL• An outline of the nature of the complaint
On receipt of your message the Open Access Team will immediately investigate your claim, make aninitial judgement of the validity of the claim and, where appropriate, withdraw the item in questionfrom public view.
Aerodynamic Performance and Wake Development
of Airfoils with Serrated Trailing-Edges
Xiao Liu*, Hasan Kamliya Jawahar†, Mahdi Azarpeyvand‡ and Raf Theunissen§
University of Bristol, Bristol, United Kingdom, BS8 1TR
A comprehensive experimental study has been performed for symmetric NACA
0012 and cambered NACA 65(12)-10 airfoils with a variety of trailing-edge serra-
tions over a wide range of angles of attack. Results are presented for the aerody-
namic force measurements, wake development and energy content of the wake tur-
bulent structure at moderate chord based Reynolds numbers (Rec = 2×10⁵−6×10⁵).
The aerodynamic force measurements have shown that the use of trailing-edge ser-
rations for cambered airfoils can lead to significant reductions in the lift coefficient
at low angles of attack but does not particularly change the stall characteristics of
the airfoils. The wake flow results have shown that the use of serrations can lead to
considerable reduction of the wake turbulence intensity, which is shown to be due
to a complex interaction between the flow field over the tip and root planes of the
serration in the near-wake. Furthermore, power spectral density results pertaining
to wake turbulence indicate that the implementation of serrations de-energises the
wake flow over a wide range of frequencies.
*PhD Student, Department of Mechanical Engineering, [email protected]†PhD Student, Department of Aerospace Engineering, [email protected]‡Senior Lecturer and Royal Academy of Engineering research fellow, Department of Mechanical Engineering,
[email protected]§Lecturer, Department of Aerospace Engineering, [email protected]
1 of 28
American Institute of Aeronautics and Astronautics
Nomenclature
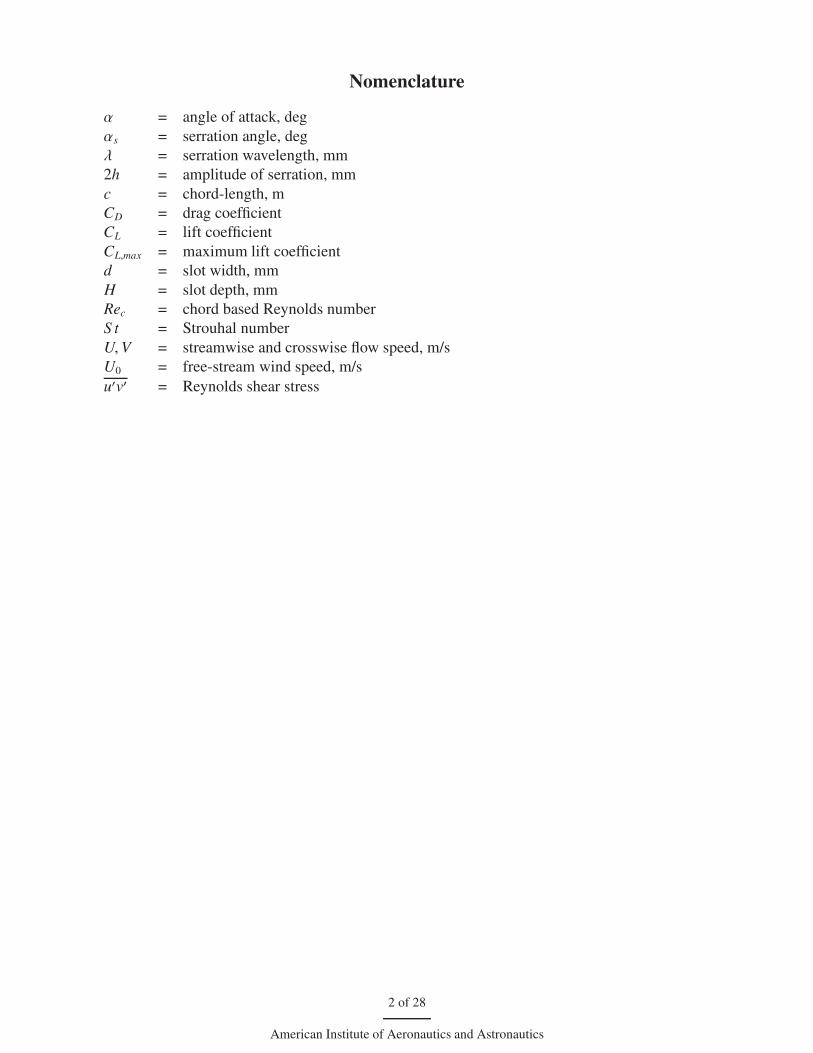
α = angle of attack, deg
αs = serration angle, deg
λ = serration wavelength, mm
2h = amplitude of serration, mm
c = chord-length, m
CD = drag coefficient
CL = lift coefficient
CL,max = maximum lift coefficient
d = slot width, mm
H = slot depth, mm
Rec = chord based Reynolds number
S t = Strouhal number
U,V = streamwise and crosswise flow speed, m/s
U0 = free-stream wind speed, m/s
u′v′ = Reynolds shear stress
2 of 28
American Institute of Aeronautics and Astronautics
I. Introduction
AIRFOIL self-noise and flow interaction noise are major components of the overall noise orig-
inating from airframes and jet engines [1] and are also a dominant noise source of modern
wind turbines [2]. One of the dominant causes of airfoil self-noise is due to the convection and
interaction of the airfoil’s turbulent boundary layer with the trailing-edge. Consequently, bound-
ary layer characteristics play an important role in the level of noise generated [3]. The resulting
trailing-edge noise is of dipolar nature and its acoustic power varies as a power of the velocity
with typical powers ranging between 4 and 5 [4]. Trailing-edge noise is highly significant at low
Mach numbers due to the efficient scattering of the turbulent fluctuations over the solid trailing-
edges [5]. In order to reduce this dominant trailing-edge noise, several passive methods such
as serrated trailing-edges [6–8], porous surface treatments [9–11], brushes [12, 13] and morph-
ing trailing-edges [14–16] have been under investigation over the past two decades. In particular,
serrated trailing-edges have received considerable interest due to their simple yet efficient noise re-
duction capabilities amongst all the other passive trailing-edge treatments. Recent research has also
shown that implementation of add-on trailing-edge serrations along the outboard blade section can
significantly reduce wind turbine aerodynamic noise [17]. Despite the numerous studies directed
toward noise reduction capabilities of serrations, the flow behaviour around serration structures and
their overall effect on the airfoil’s aerodynamic performance have remained largely unexplored.
The very first attempt in assessing the effectiveness of serrations for trailing-edge noise pur-
poses, is perhaps that of Howe [18–20]. Howe’s analytical investigations have shown that simple
modifications such as sawtooth and sinusoidal serrations to trailing-edge can reduce the efficiency
of the airfoil’s trailing-edge noise generation by introducing destructive sound interference. It was
shown that the magnitude of the noise reduction depended on the frequency, length and spanwise
spacing of the serration teeth. Howe’s mathematical model also showed that optimal attenuation
can be achieved with trailing-edge elements having a sharpness larger than 45◦. Despite provid-
ing fundamental insight in the aero-acoustic noise generation process, Howe’s model nevertheless
overestimates the absolute noise reduction levels when compared to experimental data. A much
more recent analytical model developed by Lyu et al. [21] has shown that in addition to the de-
3 of 28
American Institute of Aeronautics and Astronautics
structive interference predicted by Howe, there also exist some constructive sound interferences.
The comparison provided between the analytical and finite element results have shown a better
agreement with experimental data in terms of serrated trailing-edge noise reduction.
Experimental investigations on full scale wind turbine blades were carried out by Oerlemans et
al. [17] for an optimised airfoil geometry and airfoil with trailing-edge serrations. Results showed
noise reductions of 0.5 dB for an optimised airfoil and about 3.5 dB for a serrated airfoil at low fre-
quencies. More importantly, no degradation in the aerodynamic performances of the airfoils were
observed. This showed the effectiveness of trailing-edge serrations in reducing airfoil self-noise
without compromising aerodynamic performance for full scale applications. Gruber et al. [22–25]
carried out further studies with more complex trailing-edge serrations such as slotted edges, saw-
tooth with holes, slotted-sawtooth edges and serrations with random edges. The results from these
tests showed that the serration geometry plays a vital role in the frequency range and intensity
of noise reduction. Amongst all the tested serrations, sawtooth and slotted-sawtooth serrations
performed best yielding noise reductions in the order of 1-5 dB at low to mid frequency ranges
(300 Hz to 10 kHz). An increase in noise up to 1 dB was observed in the higher frequency range
(10 kHz to 20 kHz). A speculated reason for this increase in high frequency noise was the mis-
alignment of the serrations with the mean camber-line. Gruber also observed a marginal increase
in the high frequency noise by the use of slotted-sawtooth serrations when compared to other ge-
ometries [22]. This increase in high frequency noise was further investigated by Acre et al. [26]
using a sawtooth serration and by varying the serration flap angle. Acre et al. studied the flow
field around a sawtooth serrated trailing-edge fitted on a NACA 0018 airfoil using stereoscopic
Particle Image Velocimetry (PIV). The flow field and acoustic measurements were carried out for
low angles of attack, α = 0◦, 4◦ and 6◦. The results showed that serration flap angle can have a
considerable effect on the flow behaviour and this misalignment of the serration angle to the mean
camber-line is thought to be a key factor in the increase of high frequency noise. Vathylakis et
al. [27] tested modified sawtooth serrated trailing-edges fitted on a NACA 0012 airfoil to reduce
the high frequency noise observed in the previous tests. The space between the serrations (i.e. val-
leys) were filled with materials like porous nickel chromium foams, melamine foams, brushes, etc.
4 of 28
American Institute of Aeronautics and Astronautics
Acoustic measurements from these sawtooth serrations showed broadband noise reductions of up
to 7 dB. The modified poro-serrated trailing-edges were able to reduce the tonal noise component
from the vortex shedding and also kept the overall high frequency noise increase minimal, though
failing to reduce the broadband noise level compared to the clean serrations. The aerodynamic
measurements further showed a reduction of 4% in lift coefficient of the airfoil below the stall
angles for serrated trailing-edge compared to the baseline. This study also showed that the jet flow
through the serration valley is one of the key factors in the generation of high frequency noise for
serrated trailing-edges.
Gruber et al. [23] presented boundary layer measurements using hot-wire anemometry on a
single sawtooth of a serrated airfoil. The results showed that the tip of the trailing-edge has a
boundary layer 15% thicker than the baseline and root of the trailing-edge. They also observed
that the sharpness of the sawtooth affected the turbulent length scale and the turbulent intensity
in the boundary layer region compared to the baseline case. The effects of serrations on airfoil’s
laminar flow instabilitiy noise was carried out by Chong and Joseph [28]. They showed that the
sawtooth surface can trigger a bypass transition and prevent the boundary layer from becoming
separated, subsequently reducing the two-dimensionality and preventing the amplification of the
Tollmien-Schlichting waves. Moreau and Doolan [29] performed detailed acoustic studies on a
flat-plate fitted with serrated and sharp trailing-edge and showed noise reductions of up to 13 dB.
These were related to the attenuation of the vortex shedding at the vicinity of the trailing-edge.
They also showed that the turbulence fields were substantially modified by the trailing-edge ser-
rations. The relationship between the noise and near-field flow was further studied by Chong and
Vathylakis [30] using a highly equipped flat plate fitted with trailing-edge serrations. They found
coherent structures in the form of horseshoe vortices being convected along the edges of the ser-
ration and suggested that noise reduction was driven by the interaction between these horseshoe
and pressure driven oblique vortices. They also found that dominant fluctuating components were
present close to the sawtooth tip with higher frequencies present on the sides of the sawtooth edges.
This concurs with the other observations made by Gruber [24] and Vathylakis et al. [27], where
the results show that jet flow through the serration valley corresponds to the high frequency noise.
5 of 28
American Institute of Aeronautics and Astronautics
Simultaneously, many high fidelity computational studies were also carried out. One note-worthy
study was carried out by Jones and Sandberg [31]. They performed a high fidelity Direct Numer-
ical Simulation (DNS) for NACA 0012 airfoil with and without serration. The results yet again
confirmed that most of the noise radiation from the trailing-edge was solely due to the scatter-
ing process and that the hydrodynamic behavior at the trailing-edge is completely changed by the
trailing-edge serrations. They also showed that the flow is highly three-dimensional as the large
spanwise turbulent structures were found to be broken up by the serrations at the trailing-edge,
giving rise to horseshoe vortices. The PIV investigation by Acre et al. [26] also showed the highly
three-dimensional flow at the serrated trailing-edge having counter-rotating streamwise oriented
periodic structures at several spanwise locations. The results also confirmed the development of
streamwise horseshoe vortices emanating from the serrated trailing-edge even at low angles of at-
tack, such as α = 6◦. The magnitude of these streamwise vortices appears to increase as the angle
of attack is increased. Another very detailed three-dimensional time-resolved tomographic PIV
study over the serrations was carried out by Avallone et al. [32], for a symmetric NACA 0018 at
low angle of attack, α = 4◦. They reported that these counter-rotating streamwise-oriented vortical
structures developed from the side edge of the serration due to the imbalance of the pressure forces
and velocity between the suction and the pressure side of the serrations. They also showed that
this distorts the mean flow and affects the local effective angle of attack of the flow reaching the
serration and that it also plays an important role in increasing the broadband scattered noise. The
detailed PIV study around the sawtooth serrations by Acre et al. [26] and Avallone et al. [32] show
that three-dimensional streamwise-oriented vortices predominantly occupy the serration gap at low
to moderate angles of attack.
To further expand the existing knowledge and better understand the flow characteristics around
a symmetric NACA 0012 and highly chambered NACA 65(12)-10 airfoil, with and without a ser-
rated trailing-edge, a detailed study of the aerodynamic performance, wake development, turbu-
lence structures and mixing has been carried out and presented in a systematic manner in this paper.
Thorough flow measurements have been carried out using Laser Dopler Anemometry (LDA) and
Hot-Wire Anemometry (HWA). The wind tunnel and experimental setup along with the measure-
6 of 28
American Institute of Aeronautics and Astronautics
ment techniques employed in the current study are discussed in Sec. II. The aerodynamic results,
namely force measurements, wake development and the wake energy content, will be presented
and discussed in Sec. III for the two airfoils for a wide range of angles of attack (from α = −5◦ to
α = 20◦) and flow speeds (10 m/s to 60 m/s). Finally, Sec. IV concludes the paper.
II. Experimental Setup
A. Wind Tunnel Setup and Instrumentaion
A comprehensive study of the aerodynamic performance for a symmetrical NACA 0012 and a
cambered asymmetric NACA 65(12)-10 airfoil with and without trailing-edge serrations has been
performed at the wind tunnel facility of the University of Bristol. The aerodynamic force measure-
ments have been carried out in the large low-speed closed-circuit wind tunnel. This tunnel has an
octagonal working section of 2.1 m × 1.5 m × 2 m and a contraction ratio of 3:1. The tunnel is
capable of reaching speeds up to 60 m/s with a typical turbulence intensity of 0.25%. Aerodynamic
lift and drag forces for both airfoils were measured using a strain-gauge based AMTI OR6-7-2000
force balance, equipped with an AMTI MSA-6 amplifier and 16-bit A/D card. A thorough data
independency test using different sampling frequencies was carried out before choosing a sam-
pling frequency of 37 Hz. This frequency provided the best data independency with uncertainty
levels (at 95% confidence level) less than 3.5% for the lift and drag before stall and approximately
5% and below 10% for the lift and drag after stall. The final data sets were collected for a time
period of 30 s, resulting in 1000 independent samples for statistical post-processing. To reduce the
probable flow three-dimensionality effect associated with tip-flow separation, circular end-plates
with a diameter 0.34 m were used on the airfoil. The edges of these circular end-plates were cham-
fered to reduce flow distortion. The flow measurements were performed in the low turbulence
closed-circuit wind tunnel. This tunnel, with its octagonal working section of 0.8 m × 0.6 m ×
1 m, can attain a maximum velocity of 100 m/s, while maintaining a turbulence level as low as
0.05%, due to its 12:1 contraction ratio. Velocity measurements within the airfoil wake were car-
ried out using a two component Dantec Dynamics LDA system with 6-Watt argon-ion laser. The
system was operated in backscatter mode with a focal length of 600 mm. Velocity components
7 of 28
American Institute of Aeronautics and Astronautics
were measured in the prolonged spheroid shaped measurement volume, which had a diameter of
0.16 mm and length 2.9 mm. The system was mounted on a fully automated traverse system and
controlled by the inbuilt software used for data collection and post processing. Additional velocity
measurements of the steady and unsteady flow field within the airfoil wake were carried out us-
ing single-wire constant temperature hot-wire anemometry. Streamwise flow measurements were
taken using a Dantec 55P16 single sensor hot-wire probe with a 1.25 mm platinum-plated tungsten
wire of 5 µm diameter. The hot-wire probes were driven by a Dantec StreamlinePro CTA 91C10
module and controlled through a National Instrument NI9215 four channel module. The flow field
measurements were logged at a frequency of 40 kHz.
Blunt Airfoil
140 mm
Serrated Airfoil
Baseline
2h
10 mm
a) NACA 65(12)-10
Baseline
Blunt Airfoil
Serrated Airfoil
140 mm
10 mm
2h
b) NACA 0012
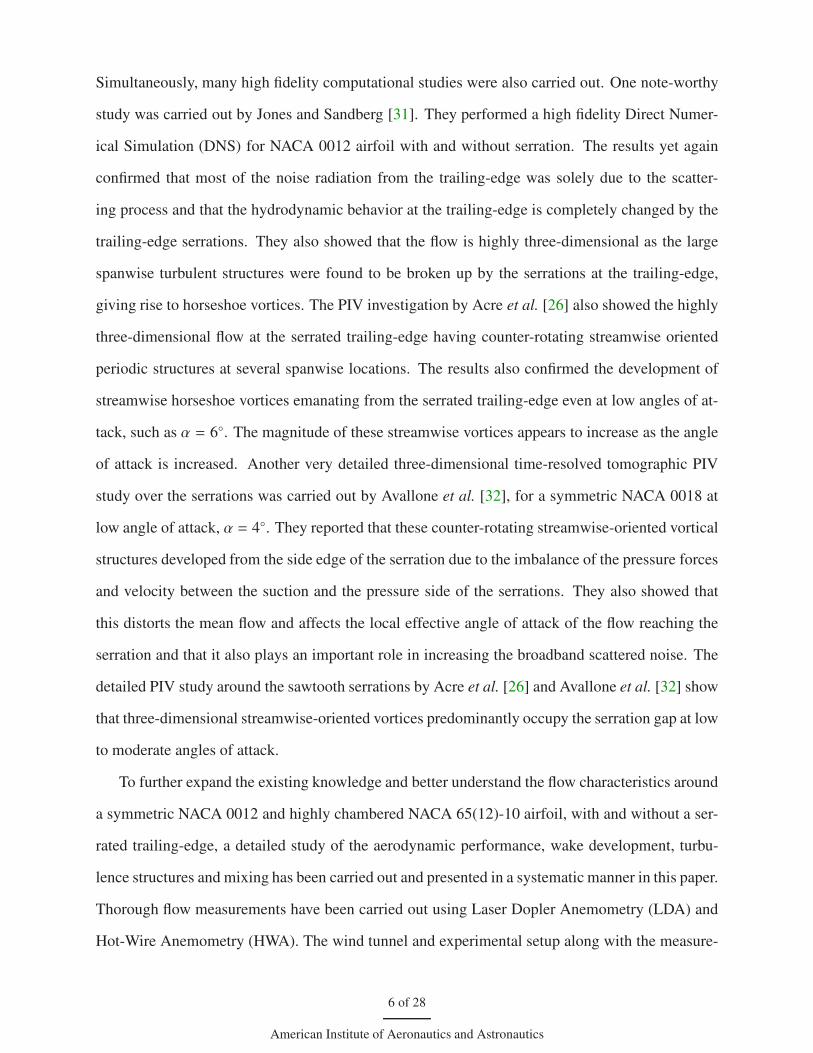
Fig. 1. Airfoil configurations employed in the current study
B. Airfoil and Serration Setup
The airfoils were manufactured from RAKU-TOOLr WB-1222 polyurethane board and machined
using a computer numerical control (CNC) machine resulting in a surface finish, which was suffi-
ciently smooth not to alter any flow transition process. Both the NACA 0012 and NACA 65(12)-10
airfoils were designed with a 1.8 mm blunt trailing-edge with a slot that had a depth of 15 mm and
thickness of 0.8 mm along the span-wise direction for the purpose of installing flat plate inserts and
serrations at the trailing-edge (see Fig. 1). Three airfoils have been considered seperately in this
study, namely Baseline, Blunt and serrated airfoil. The airfoils (Fig. 1a and 1b) have a span length
of L = 0.45 m but with varying chord-lengths. The Blunt airfoil has a chord-length of c = 0.14 m.
The Baseline airfoil has a slightly increased chord-length of c = 0.155 m, which was achieved
by flat plate inserts without serrations at the trailing-edge of the Blunt airfoil to achieve the same
8 of 28
American Institute of Aeronautics and Astronautics
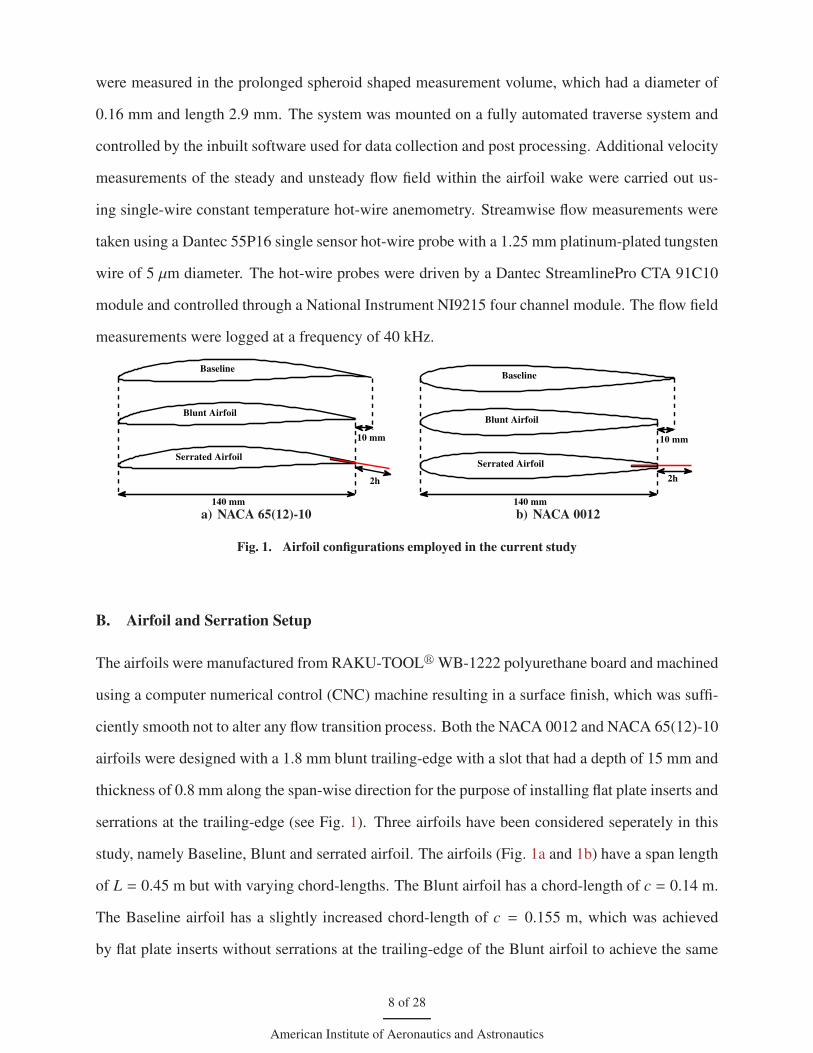
surface area as that of the serrated airfoil. There is no general consensus in the literature as to how
to define the trailing-edge serrations. There are two methods that have been previously used by
researchers: (i) to use the serration as a simple flap to the existing airfoil, which increases the air-
foil surface area and (ii) to keep the airfoil surface area constant, as suggested by Gruber [22–25].
Both of these approaches have been covered in the present study. Two types of serrations based
on their good noise reduction performance from previous analytical and experimental studies, as
discussed in Sec. I, were selected for the present study. The two types of serrations tested and
presented here are the sawtooth serration (Fig. 2a) and slotted-sawtooth serration (Fig. 2b). In
order to cover a wide range of serration angles, geometrical parameters of the serrations such as,
the amplitude (2h), periodicity wavelength (λ), angle of serration edge (αs), slot width (d) and slot
depth (H) were varied. The serration parameters presented in Table. 1 are selected due to their
excellent noise reduction performance, as demonstrated in previous experiments [22–25].
2h
Root
Serration angle(α
s)
Tip Wavelength (λ)
15 mm
a) Sawtooth
2h
Root
15 mm
Slot depth
(H)
Tip d
b) Slotted-sawtooth
Fig. 2. Serrated trailing-edge parameters definition.
Table 1. Geometrical parameters of the trailing-edge serrations used in the current study.
Configuration Serration Types 2h λ λ/h αs d H
(mm) (mm) - (deg.) (mm) (mm)
Case 1 Baseline 0 - - - - -
Case 2 Blunt 15 - - - - -
Case 3 sawtooth 30 3 0.2 2.86 - -
Case 4 sawtooth 30 9 0.6 8.53 - -
Case 5 sawtooth 30 24.8 1.5 22.5 - -
Case 6 slotted-sawtooth 30 9 0.6 8.53 0.5 15
Case 7 slotted-sawtooth 30 9 0.6 8.53 0.5 5
9 of 28
American Institute of Aeronautics and Astronautics
III. Results
A. Aerodynamic Force Measurements
The lift and drag measurements of NACA 65(12)-10 and NACA 0012 airfoils for the Baseline,
Blunt and serrated configurations were carried out for a wide range of angles of attack and at
moderate chord-based Reynolds numbers Rec = 2×10⁵ to 6×10⁵, corresponding to flow velocities
of U0 = 20 m/s to 60 m/s. However, for the purpose of brevity only the results for Rec = 3 × 10⁵
and 5 × 10⁵, corresponding to flow velocities U0 = 30 m/s and 50 m/s have been presented and
discussed. The tests were carried out for angles of attack (α) ranging from −5◦ to 20◦ and 0◦ to 20◦
for NACA 65(12)-10 and NACA 0012, respectively. The three tested sawtooth serrations (Fig. 2a)
have wavelengths of λ = 3 mm, 9 mm and 24.8 mm and amplitude of 2h = 30 mm. The slotted-
sawtooth serrations (Fig. 2b) have a wavelength and amplitude of λ = 9 mm and 2h = 30 mm,
along with slot width of d = 0.5 mm and two depths of H = 5 mm and 15 mm.
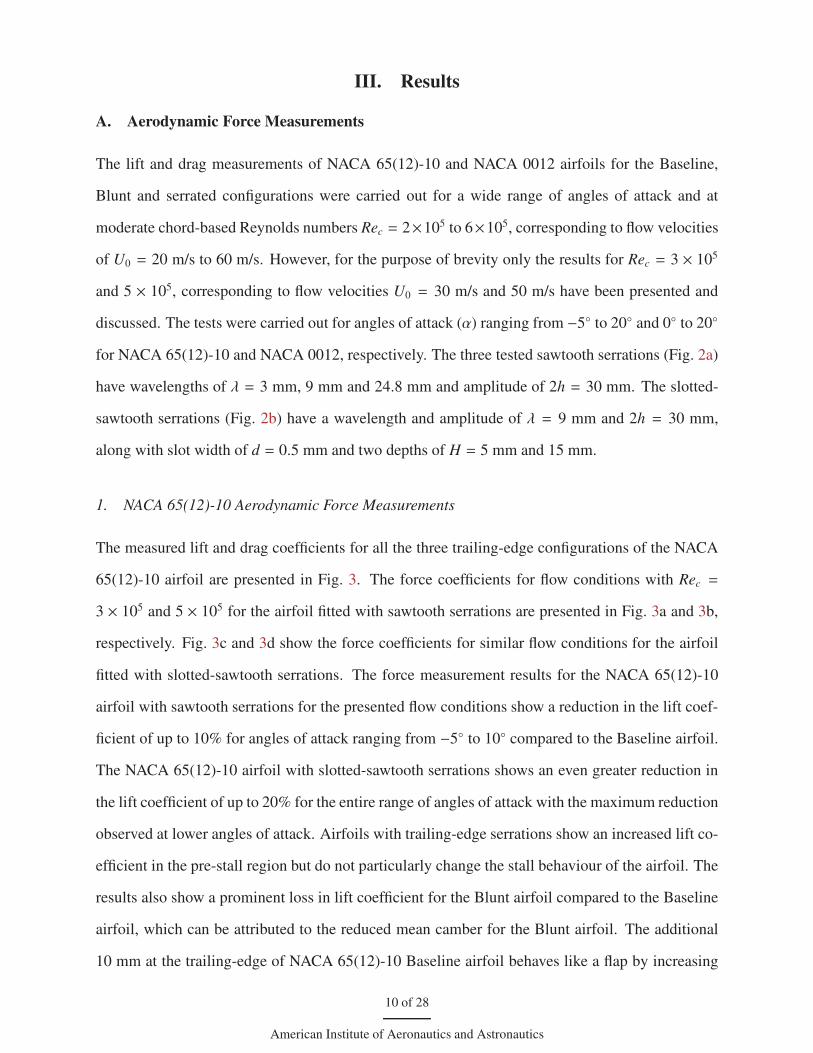
1. NACA 65(12)-10 Aerodynamic Force Measurements
The measured lift and drag coefficients for all the three trailing-edge configurations of the NACA
65(12)-10 airfoil are presented in Fig. 3. The force coefficients for flow conditions with Rec =
3 × 10⁵ and 5 × 10⁵ for the airfoil fitted with sawtooth serrations are presented in Fig. 3a and 3b,
respectively. Fig. 3c and 3d show the force coefficients for similar flow conditions for the airfoil
fitted with slotted-sawtooth serrations. The force measurement results for the NACA 65(12)-10
airfoil with sawtooth serrations for the presented flow conditions show a reduction in the lift coef-
ficient of up to 10% for angles of attack ranging from −5◦ to 10◦ compared to the Baseline airfoil.
The NACA 65(12)-10 airfoil with slotted-sawtooth serrations shows an even greater reduction in
the lift coefficient of up to 20% for the entire range of angles of attack with the maximum reduction
observed at lower angles of attack. Airfoils with trailing-edge serrations show an increased lift co-
efficient in the pre-stall region but do not particularly change the stall behaviour of the airfoil. The
results also show a prominent loss in lift coefficient for the Blunt airfoil compared to the Baseline
airfoil, which can be attributed to the reduced mean camber for the Blunt airfoil. The additional
10 mm at the trailing-edge of NACA 65(12)-10 Baseline airfoil behaves like a flap by increasing
10 of 28
American Institute of Aeronautics and Astronautics
the effective mean camber and down wash angle resulting in increased lift. The lift coefficient of
the serrated airfoils shows a significant increase in lift over the whole range of angles of attack
in comparison with the Blunt airfoil. For angles of attack larger than 10◦, the drag coefficient
of the sawtooth airfoils increases up to 10% relative to the Baseline and Blunt airfoil, while for
the slotted-sawtooth airfoils, drag coefficients increase up to 40% relative to the Blunt airfoil but
slightly decreases compared to those of the Baseline airfoil.
0
0.2
0.4
0.6
0.8
1
1.2
1.4
1.6
CL
0
0.2
0.4
0.6
0.8
CD
0
0.2
0.4
0.6
0.8
1
1.2
1.4
1.6
CL
0
0.2
0.4
0.6
0.8
CD
−5 0 5 10 15 200
0.2
0.4
0.6
0.8
1
1.2
1.4
1.6
α(deg)
CL
0
0.2
0.4
0.6
0.8
CD
−5 0 5 10 15 200
0.2
0.4
0.6
0.8
1
1.2
1.4
1.6
α(deg)
CL
0
0.2
0.4
0.6
0.8
CD
Blunt airfoil
(b) U0=50 m/s
(d) U0=50 m/s
Blunt airfoil
Blunt airfoil Blunt airfoil
Baseline
Baseline
Baseline
Baseline
(a) U0=30 m/s
(c) U0=30 m/s
Fig. 3. Lift and drag coefficient results for NACA 65(12)-10 fitted with different serrations at U0 = 30 m/s and
U0 = 50 m/s. Sawtooth serrations (a) and (b): Baseline (solid line); λ = 9 mm (triangles); λ = 24.8 mm
(squares); λ = 3 mm (circles). Slotted-sawtooth serrations (c) and (d): Baseline (solid line); H = 5 mm
(triangles); H = 15 mm (squares).
2. NACA 0012 Aerodynamic Force Measurements
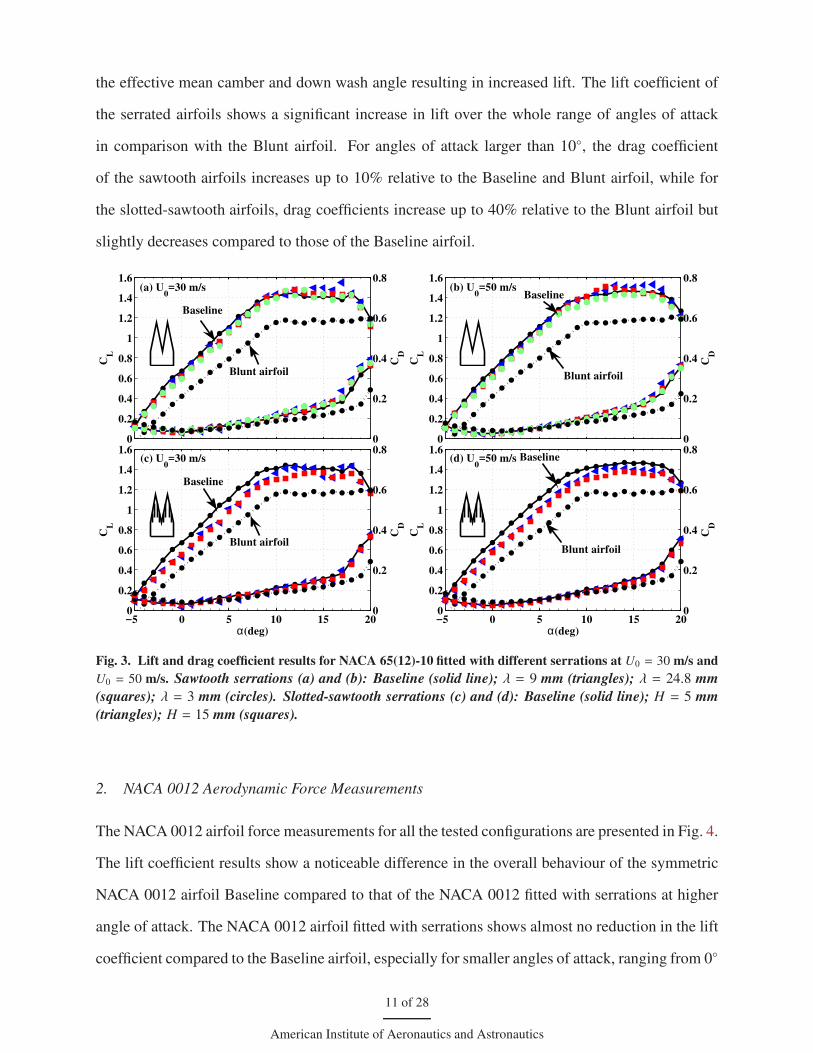
The NACA 0012 airfoil force measurements for all the tested configurations are presented in Fig. 4.
The lift coefficient results show a noticeable difference in the overall behaviour of the symmetric
NACA 0012 airfoil Baseline compared to that of the NACA 0012 fitted with serrations at higher
angle of attack. The NACA 0012 airfoil fitted with serrations shows almost no reduction in the lift
coefficient compared to the Baseline airfoil, especially for smaller angles of attack, ranging from 0◦
11 of 28
American Institute of Aeronautics and Astronautics
0
0.2
0.4
0.6
0.8
1
1.2
CL
0
0.2
0.4
0.6
CD
0
0.2
0.4
0.6
0.8
1
1.2
CL
0
0.2
0.4
0.6
CD
0 5 10 15 200
0.2
0.4
0.6
0.8
1
1.2
α(deg)
CL
0
0.2
0.4
0.6
CD
0 5 10 15 200
0.2
0.4
0.6
0.8
1
1.2
α(deg)
CL
0
0.2
0.4
0.6
CD
(c) U0=30 m/s
(a) U0=30 m/s
(d) U0=50 m/s
(b) U0=50 m/s
Baseline
Baseline
Baseline
Baseline
Blunt airfoil
Blunt airfoil
Blunt airfoil
Blunt airfoil
Fig. 4. Lift and drag coefficients for a NACA 0012 airfoil fitted with different serrations at U0 = 30 m/s and
U0 = 50 m/s. Sawtooth serrations (a) and (b): Baseline (solid line); λ = 9 mm (triangles); λ = 24.8 mm
(squares); λ = 3 mm (circles). Slotted-sawtooth serrations (c) and (d): Baseline (solid line); H = 5 mm
(triangles); H = 15 mm (squares).
to 9◦, showing that the effect of serrations on the lift coefficient is less significant for the symmetric
NACA 0012 airfoil compared to the NACA 65(12)-10, particularly at lower speeds. The serrations
significantly affect the maximum lift coefficient over the critical angles of attack ranging from 9◦
to 15◦, where a reduction in lift coefficient of up to 10% can be observed relative to the Baseline.
However, results show improvements in the lift performance at deep stall angles from 17◦ to 20◦
and also imply that serrations increase the stall angle from 13◦ to 14◦ for Rec = 5 × 10⁵. The lift
performance of the NACA 0012 airfoil with serrations is similar to or higher than the Blunt airfoil,
especially at higher angles of attack. The drag coefficient for the serration cases increases up to
10% compared to the Baseline airfoil between angles of attack 12◦ and 20◦.
As mentioned earlier, based on the previous analytical and experimental results discussed in
Sec. I, the serration topology involving sharp sawtooth (small αs) and slotted-sawtooth provide
large and robust noise reductions over a wide frequency range. The aerodynamic force measure-
ments presented here, however, have revealed that such effective trailing-edge treatments (in terms
12 of 28
American Institute of Aeronautics and Astronautics
of noise) are prone to significant aerodynamic losses at moderate Reynolds numbers and that they
are also highly dependant on airfoil shape. For symmetric airfoils the differences in the aerody-
namic performance between the sawtooth and slotted-sawtooth serrations were marginal. In case
of the cambered NACA 65(12)-10 airfoil, minimal loss in aerodynamic performance was observed
with sawtooth serration and slotted-sawtooth serrations led to an overall loss in lift and increased
drag.
B. Wake Development Analysis
Detailed wake flow measurements at several downstream locations have been performed using
LDA to better understand the effects of serration on the wake development. The wake measure-
ments were carried out at geometric angles of attack, α = 0◦, 5◦, 10◦ and 15◦ for a constant chord-
based Reynolds number of Rec = 3 × 10⁵, corresponding to a free stream velocity U0 = 30 m/s.
Wake profiles in vertical planes were logged at various downstream locations x/c = 0.2, 0.3,
0.5, 1.0, 1.5 and 2.0 relative to the trailing-edge of the Baseline airfoil and sawtooth serrations
(λ = 9 mm), tip and root. To accurately capture the flow behaviour within the wake region each
measurement line extended between -0.3 and 0.2 chord lengths along the y-axis and was populated
with 60 measurement points, yielding a spatial sampling resolution of ∆y/c ≈ 0.01. The relative
measurement error percentage at the peak location in wake velocity deficit was in the order of
0.01% and was negligible in the free stream region. Results for the streamwise wake velocity com-
ponents are presented in Figs. 5 to 13, to study the flow behaviour of both the NACA 65(12)-10
and NACA 0012 airfoils at various angles of attack.
1. NACA 65(12)-10 Wake Development
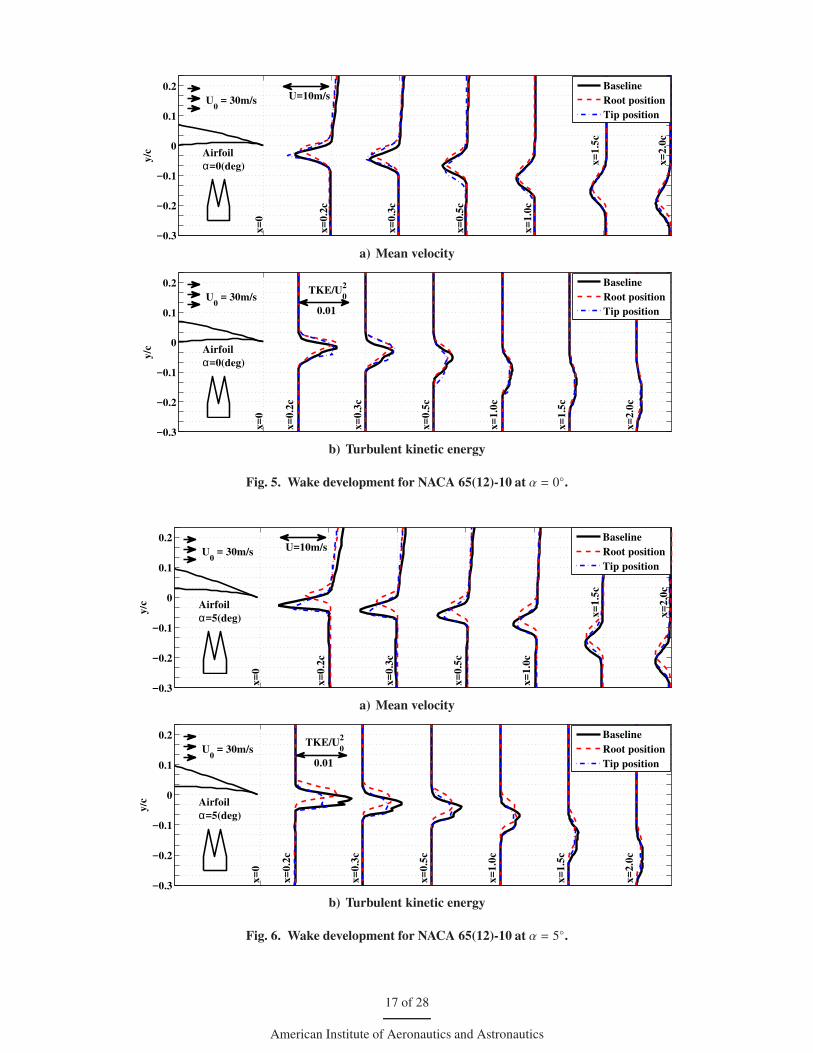
The wake velocity profiles for the NACA 65(12)-10 airfoil at α = 0◦ and 5◦ are presented in
Figs. 5a and 6a, respectively. In the near-wake region (x/c = 0.2, 0.3 and 0.5), for the NACA
65(12)-10 airfoil at α = 0◦ it can be observed that in the vertical plane covering the tip position of
the sawtooth serration case, the wake profiles are similar to that of the Baseline but with a slightly
higher velocity deficit. The higher velocity deficit of the tip-flow can be attributed to the increased
13 of 28
American Institute of Aeronautics and Astronautics
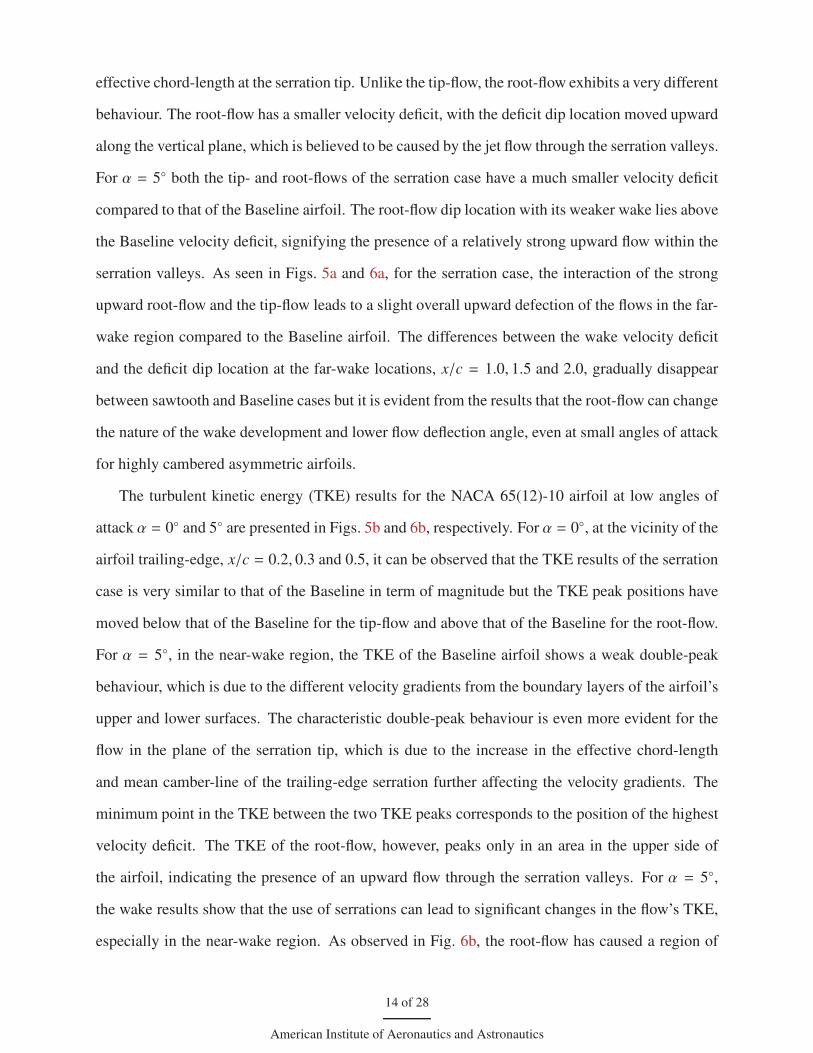
effective chord-length at the serration tip. Unlike the tip-flow, the root-flow exhibits a very different
behaviour. The root-flow has a smaller velocity deficit, with the deficit dip location moved upward
along the vertical plane, which is believed to be caused by the jet flow through the serration valleys.
For α = 5◦ both the tip- and root-flows of the serration case have a much smaller velocity deficit
compared to that of the Baseline airfoil. The root-flow dip location with its weaker wake lies above
the Baseline velocity deficit, signifying the presence of a relatively strong upward flow within the
serration valleys. As seen in Figs. 5a and 6a, for the serration case, the interaction of the strong
upward root-flow and the tip-flow leads to a slight overall upward defection of the flows in the far-
wake region compared to the Baseline airfoil. The differences between the wake velocity deficit
and the deficit dip location at the far-wake locations, x/c = 1.0, 1.5 and 2.0, gradually disappear
between sawtooth and Baseline cases but it is evident from the results that the root-flow can change
the nature of the wake development and lower flow deflection angle, even at small angles of attack
for highly cambered asymmetric airfoils.
The turbulent kinetic energy (TKE) results for the NACA 65(12)-10 airfoil at low angles of
attack α = 0◦ and 5◦ are presented in Figs. 5b and 6b, respectively. For α = 0◦, at the vicinity of the
airfoil trailing-edge, x/c = 0.2, 0.3 and 0.5, it can be observed that the TKE results of the serration
case is very similar to that of the Baseline in term of magnitude but the TKE peak positions have
moved below that of the Baseline for the tip-flow and above that of the Baseline for the root-flow.
For α = 5◦, in the near-wake region, the TKE of the Baseline airfoil shows a weak double-peak
behaviour, which is due to the different velocity gradients from the boundary layers of the airfoil’s
upper and lower surfaces. The characteristic double-peak behaviour is even more evident for the
flow in the plane of the serration tip, which is due to the increase in the effective chord-length
and mean camber-line of the trailing-edge serration further affecting the velocity gradients. The
minimum point in the TKE between the two TKE peaks corresponds to the position of the highest
velocity deficit. The TKE of the root-flow, however, peaks only in an area in the upper side of
the airfoil, indicating the presence of an upward flow through the serration valleys. For α = 5◦,
the wake results show that the use of serrations can lead to significant changes in the flow’s TKE,
especially in the near-wake region. As observed in Fig. 6b, the root-flow has caused a region of
14 of 28
American Institute of Aeronautics and Astronautics
high TKE above the Baseline peak resulting in an enlarged region of heightened TKE along the
vertical plane. At the far-wake locations, x/c = 1.0, 1.5 and 2.0, no reduction in TKE was observed
for both the presented low angles of attack.
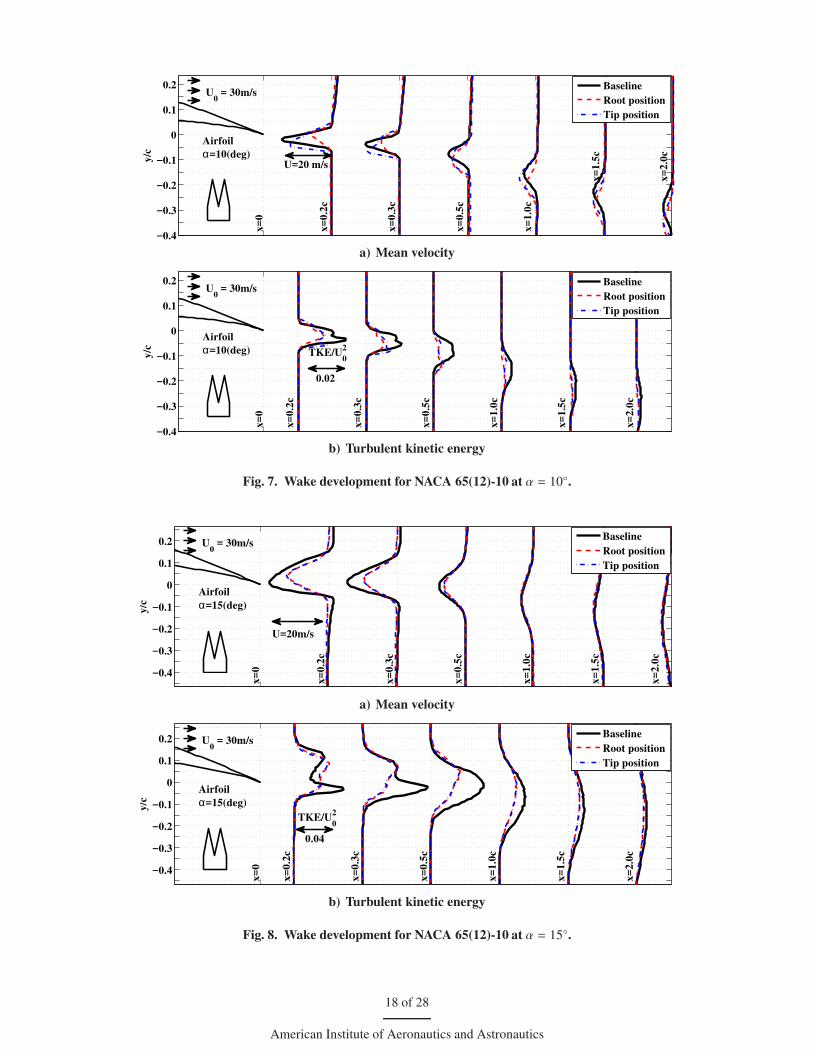
The wake velocity profiles and TKE results for the NACA 65(12)-10 airfoil at high angles of
attack α = 10◦ and 15◦ are presented in Figs. 7 and 8, respectively. From the velocity profiles at α =
10◦ presented in Figs. 7a for the near-wake region, x/c = 0.2, 0.3 and 0.5, it can be observed that
the velocity deficit difference between the tip- and root-flows increases significantly with angle of
attack. Contrary to lower angles of attack, the resultant flow after mixing has an overall downward
deflection compared to that of the Baseline flow. It can also be seen that in the near-wake region,
the root-flow has a lower velocity deficit leading to significant reductions in TKE (see Fig. 7b).
Therefore, it can be concluded from the velocity results that the use of serrations at high angles of
attack (before stall), can significantly change the wake structure by reducing the velocity deficit,
especially in the near-wake region. This is believed to be mainly due to the root-flow and the
planar interaction occurring between the tip- and root-flows in the vicinity of the trailing-edge.
The comparison of the tip- and root-flow results for α = 15◦ at the wake location x/c = 0.2,
in Fig. 8a, shows no flow velocity changes in the spanwise directions. A large wake-width can be
observed for both the Baseline and serration cases, which can be attributed to an early separation on
the suction side of the airfoil. The tip- and root-flow velocity profiles eventually converge to that of
the Baseline after x/c = 1.0. The wake deficit dip location for the serration case is located slightly
above the dip location of the Baseline airfoil, which demonstrates that the root-flow through the
serration valleys still has an effect on wake development at the trailing-edge vicinity even after
early separation on the airfoil’s upper surface. A very prominent and wide double-peak behaviour
can be observed in the TKE for the Baseline case due to the high velocity gradients at the near-
wake location x/c = 0.2 (see Fig. 8b). This double-peak behaviour is absent for the serration case
since the mixing is improved by the root-flow at the trailing-edge location. For the serration case, at
the wake location x/c = 0.2, TKE reduces at the location of the trailing-edge and increases above
the trailing-edge compared to that of the Baseline. This increase can be associated to the airfoil’s
early separation. Results have also shown that a substantial reduction in TKE can be achieved
15 of 28
American Institute of Aeronautics and Astronautics
at the wake locations x/c = 0.3 and x/c = 0.5. At the far-wake locations, x/c = 1.0, 1.5 and
2.0, the magnitude of TKE reduction was lower relative to the near-wake locations. These results
are particularly interesting as the OGVs, compressor blades, contra-rotating blade configurations,
etc., are often operated at high angles of attack and the wake-turbulence interaction is considered a
major component of noise from such systems. Moreover, in the case of contra-rotating propellers,
minimizing the energy content of the flow from the front row blades can significantly reduce the
noise from the interaction of the wake flow with the rear row blades.
16 of 28
American Institute of Aeronautics and Astronautics
−0.3
−0.2
−0.1
0
0.1
0.2
y/c
x=
0
x=
0.2
c
x=
0.3
c
x=
0.5
c
x=
1.0
c
x=
1.5
c
x=
2.0
c
Baseline
Root position
Tip position
Airfoil
α=0(deg)
U=10m/sU0 = 30m/s
a) Mean velocity
−0.3
−0.2
−0.1
0
0.1
0.2
y/c
x=
0
x=
0.2
c
x=
0.3
c
x=
0.5
c
x=
1.0
c
x=
1.5
c
x=
2.0
c
Baseline
Root position
Tip position
TKE/U0
2
0.01
U0 = 30m/s
Airfoil
α=0(deg)
b) Turbulent kinetic energy
Fig. 5. Wake development for NACA 65(12)-10 at α = 0◦.
−0.3
−0.2
−0.1
0
0.1
0.2
y/c
x=
0
x=
0.2
c
x=
0.3
c
x=
0.5
c
x=
1.0
c
x=
1.5
c
x=
2.0
c
Baseline
Root position
Tip position
Airfoil
α=5(deg)
U=10m/sU0 = 30m/s
a) Mean velocity
−0.3
−0.2
−0.1
0
0.1
0.2
y/c
x=
0
x=
0.2
c
x=
0.3
c
x=
0.5
c
x=
1.0
c
x=
1.5
c
x=
2.0
c
Baseline
Root position
Tip position
TKE/U0
2
0.01
U0 = 30m/s
Airfoil
α=5(deg)
b) Turbulent kinetic energy
Fig. 6. Wake development for NACA 65(12)-10 at α = 5◦.
17 of 28
American Institute of Aeronautics and Astronautics
−0.4
−0.3
−0.2
−0.1
0
0.1
0.2
y/c
x=
0
x=
0.2
c
x=
0.3
c
x=
0.5
c
x=
1.0
c
x=
1.5
c
x=
2.0
c
Baseline
Root position
Tip position
U=20 m/s
U0 = 30m/s
Airfoil
α=10(deg)
a) Mean velocity
−0.4
−0.3
−0.2
−0.1
0
0.1
0.2
y/c
x=
0
x=
0.2
c
x=
0.3
c
x=
0.5
c
x=
1.0
c
x=
1.5
c
x=
2.0
c
Baseline
Root position
Tip position
0.02
TKE/U0
2
U0 = 30m/s
Airfoil
α=10(deg)
b) Turbulent kinetic energy
Fig. 7. Wake development for NACA 65(12)-10 at α = 10◦.
−0.4
−0.3
−0.2
−0.1
0
0.1
0.2
y/c
x=
0
x=
0.2
c
x=
0.3
c
x=
0.5
c
x=
1.0
c
x=
1.5
c
x=
2.0
c
Baseline
Root position
Tip position
U=20m/s
Airfoil
α=15(deg)
U0 = 30m/s
a) Mean velocity
−0.4
−0.3
−0.2
−0.1
0
0.1
0.2
y/c
x=
0
x=
0.2
c
x=
0.3
c
x=
0.5
c
x=
1.0
c
x=
1.5
c
x=
2.0
c
Baseline
Root position
Tip position
TKE/U0
2
0.04
U0 = 30m/s
Airfoil
α=15(deg)
b) Turbulent kinetic energy
Fig. 8. Wake development for NACA 65(12)-10 at α = 15◦.
18 of 28
American Institute of Aeronautics and Astronautics
−0.01 0 0.01
−0.4
−0.3
−0.2
−0.1
0
0.1
y/c
-u′v′/U 2
0
−0.01 0 0.01
-u′v′/U 2
0
−0.01 0 0.01
-u′v′/U 2
0
−0.01 0 0.01
-u′v′/U 2
0
Baseline
Root location
Tip location
(d) x = 2.0c(c) x = 1.0c(b) x = 0.5c(a) x = 0.2c
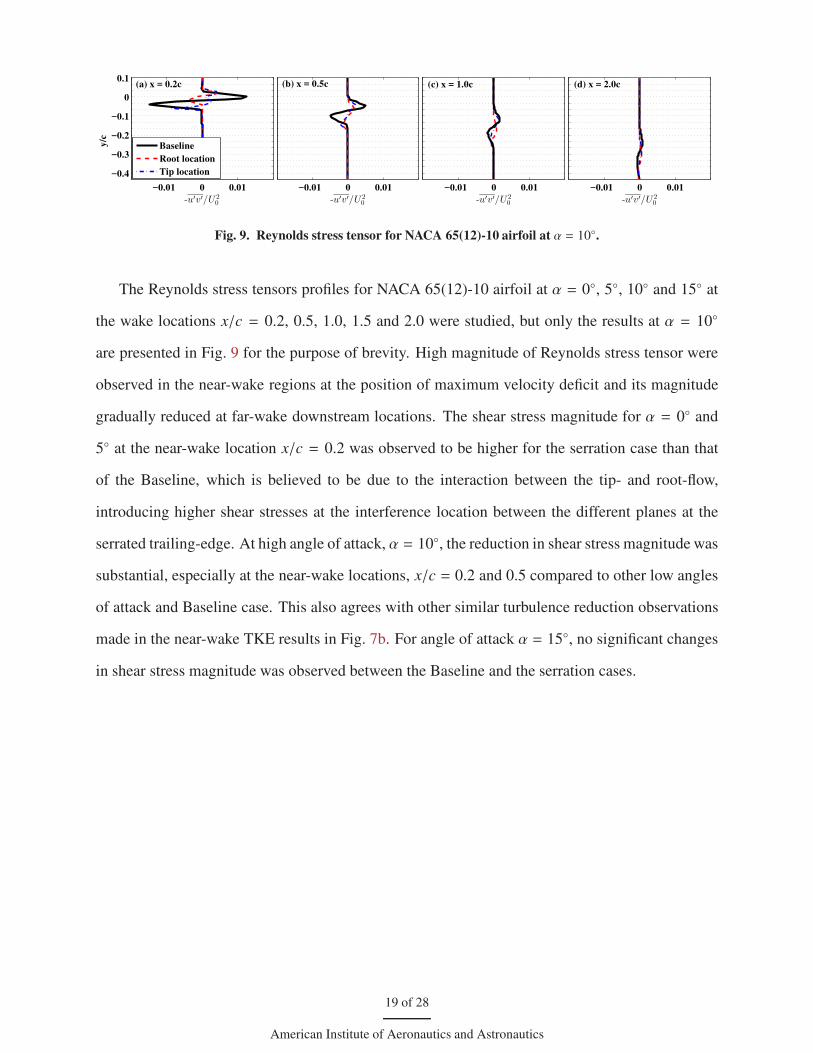
Fig. 9. Reynolds stress tensor for NACA 65(12)-10 airfoil at α = 10◦.
The Reynolds stress tensors profiles for NACA 65(12)-10 airfoil at α = 0◦, 5◦, 10◦ and 15◦ at
the wake locations x/c = 0.2, 0.5, 1.0, 1.5 and 2.0 were studied, but only the results at α = 10◦
are presented in Fig. 9 for the purpose of brevity. High magnitude of Reynolds stress tensor were
observed in the near-wake regions at the position of maximum velocity deficit and its magnitude
gradually reduced at far-wake downstream locations. The shear stress magnitude for α = 0◦ and
5◦ at the near-wake location x/c = 0.2 was observed to be higher for the serration case than that
of the Baseline, which is believed to be due to the interaction between the tip- and root-flow,
introducing higher shear stresses at the interference location between the different planes at the
serrated trailing-edge. At high angle of attack, α = 10◦, the reduction in shear stress magnitude was
substantial, especially at the near-wake locations, x/c = 0.2 and 0.5 compared to other low angles
of attack and Baseline case. This also agrees with other similar turbulence reduction observations
made in the near-wake TKE results in Fig. 7b. For angle of attack α = 15◦, no significant changes
in shear stress magnitude was observed between the Baseline and the serration cases.
19 of 28
American Institute of Aeronautics and Astronautics
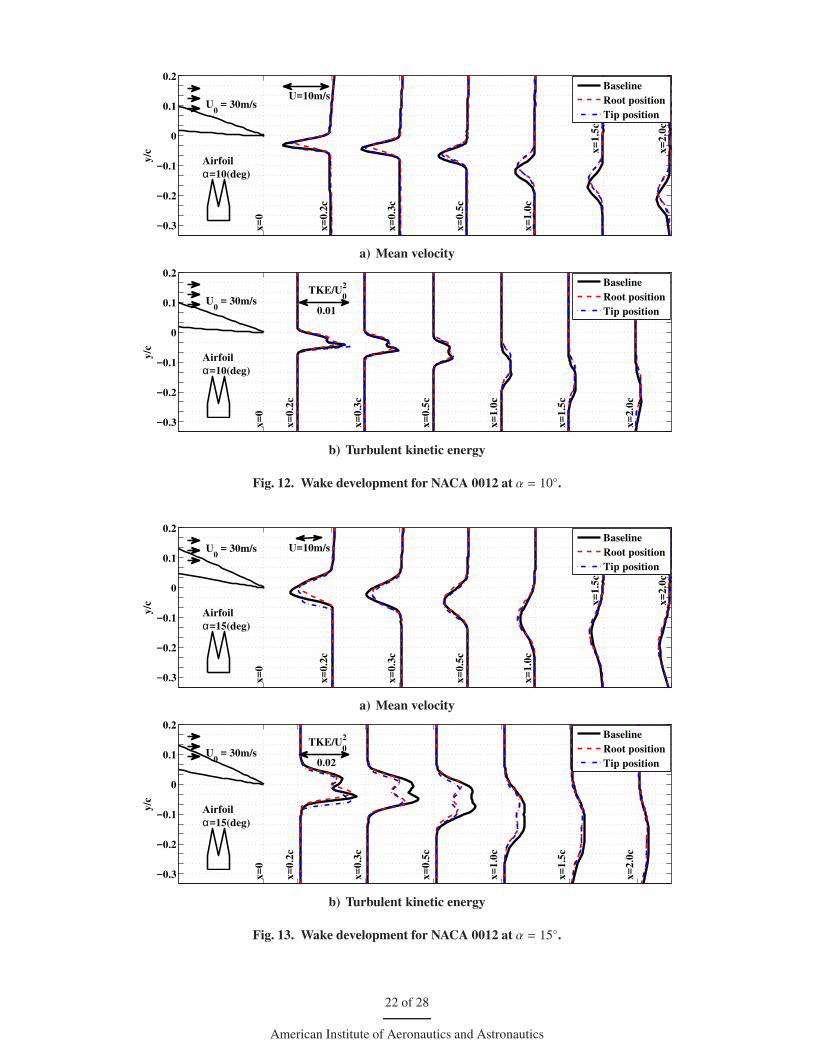
2. NACA 0012 Wake Development
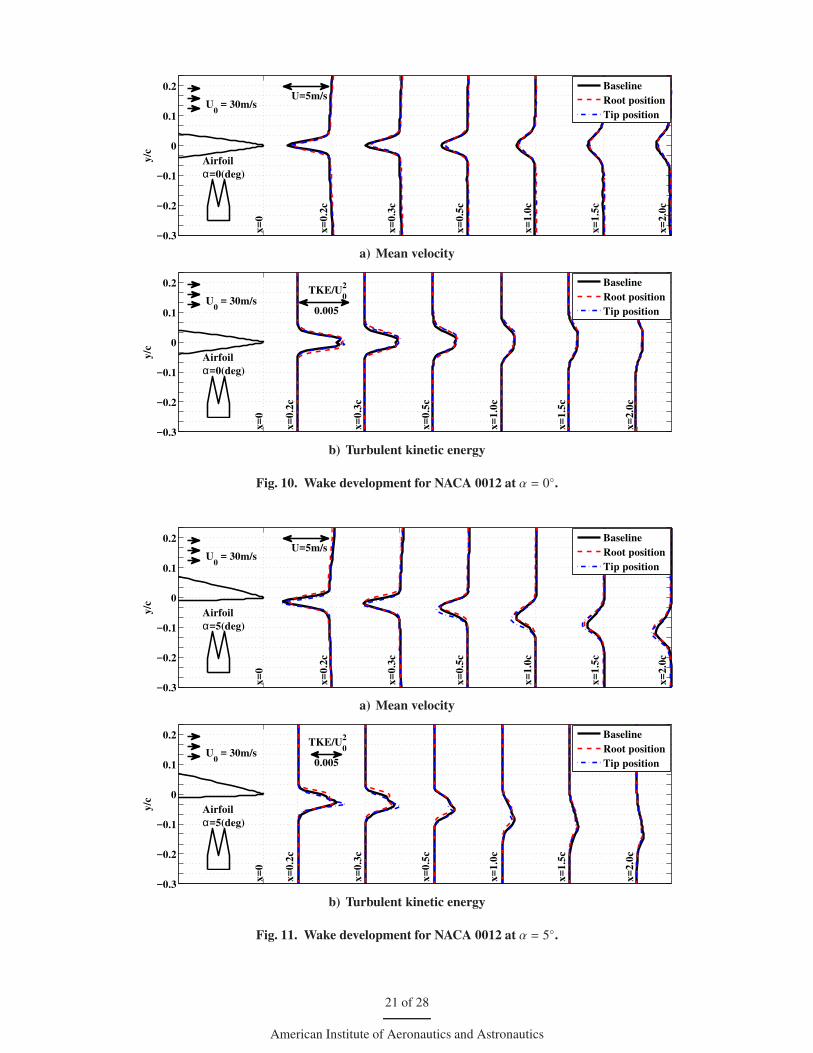
The streamwise wake velocity components and TKE for symmetric NACA 0012 airfoil are pre-
sented for low angles of attack α = 0◦ and 5◦ in Figs. 10 and 11 and high angles of attack α = 10◦
and 15◦ in Figs. 12 and 13, respectively. In the near- and far-wake regions, the wake velocity pro-
files of the serration case follows the same trend as that of the Baseline airfoil, with a predominant
two dimensional wake flow structure. The TKE results for the NACA 0012 airfoil are shown in
Figs. 10b and 11b, which follows the same tendency as that of the Baseline for all the wake loca-
tions showing no reduction in the energy content of the flow structures in the wake. These results
show that the use of serrations on symmetric airfoils has almost no effect on the flow behaviour in
the airfoil wake at the presented low angles of attack. This also concurs with the lift measurements
presented in Fig. 4, i.e. serrations do not particularly change the aerodynamic performance of the
airfoil at low angles of attack.
The velocity profiles for high angles of attack, α = 10◦ in Fig. 12a shows that the serration case
tip-flow in the near-wake (x/c = 0.2, 0.3 and 0.5) follows the same profile as that of the Baseline,
whereas the root-flow has a slightly lower velocity deficit compared to the Baseline and tip-flow. At
the far-wake locations, x/c = 1.0, 1.5 and 2.0, no significant changes in behaviour were observed in
the velocity deficit compared to the Baseline. However, the turning angle for the serration case was
shown to decrease marginally, which affects the lift created due to reduced down-wash. The wake
velocity profiles beyond x/c = 0.2 at α = 15◦ in Fig. 13a show almost no difference in the velocity
deficit between the Baseline and serration cases at the tip and root positions. The TKE results for
α = 10◦ shown in Fig. 12b does not show any peculiar behaviour for discussion. However, the
TKE results for α = 15◦ presented in Figs. 13b shows quite significant reduction in TKE at the
near-wake locations x/c = 0.3 and 0.5, retaining the characteristic double-peak behaviour.
20 of 28
American Institute of Aeronautics and Astronautics
−0.3
−0.2
−0.1
0
0.1
0.2
y/c
x=
0
x=
0.2
c
x=
0.3
c
x=
0.5
c
x=
1.0
c
x=
1.5
c
x=
2.0
c
Baseline
Root position
Tip position
Airfoil
α=0(deg)
U=5m/sU
0 = 30m/s
a) Mean velocity
−0.3
−0.2
−0.1
0
0.1
0.2
y/c
x=
0
x=
0.2
c
x=
0.3
c
x=
0.5
c
x=
1.0
c
x=
1.5
c
x=
2.0
c
Baseline
Root position
Tip position
TKE/U0
2
0.005U
0 = 30m/s
Airfoil
α=0(deg)
b) Turbulent kinetic energy
Fig. 10. Wake development for NACA 0012 at α = 0◦.
−0.3
−0.2
−0.1
0
0.1
0.2
y/c
x=
0
x=
0.2
c
x=
0.3
c
x=
0.5
c
x=
1.0
c
x=
1.5
c
x=
2.0
c
Baseline
Root position
Tip position
Airfoil
α=5(deg)
U=5m/sU
0 = 30m/s
a) Mean velocity
−0.3
−0.2
−0.1
0
0.1
0.2
y/c
x=
0
x=
0.2
c
x=
0.3
c
x=
0.5
c
x=
1.0
c
x=
1.5
c
x=
2.0
c
Baseline
Root position
Tip position
TKE/U0
2
0.005U
0 = 30m/s
Airfoil
α=5(deg)
b) Turbulent kinetic energy
Fig. 11. Wake development for NACA 0012 at α = 5◦.
21 of 28
American Institute of Aeronautics and Astronautics
−0.3
−0.2
−0.1
0
0.1
0.2
y/c
x=
0
x=
0.2
c
x=
0.3
c
x=
0.5
c
x=
1.0
c
x=
1.5
c
x=
2.0
c
Baseline
Root position
Tip position
Airfoil
α=10(deg)
U=10m/sU
0 = 30m/s
a) Mean velocity
−0.3
−0.2
−0.1
0
0.1
0.2
y/c
x=
0
x=
0.2
c
x=
0.3
c
x=
0.5
c
x=
1.0
c
x=
1.5
c
x=
2.0
c
Baseline
Root position
Tip position
TKE/U0
2
0.01U
0 = 30m/s
Airfoil
α=10(deg)
b) Turbulent kinetic energy
Fig. 12. Wake development for NACA 0012 at α = 10◦.
−0.3
−0.2
−0.1
0
0.1
0.2
y/c
x=
0
x=
0.2
c
x=
0.3
c
x=
0.5
c
x=
1.0
c
x=
1.5
c
x=
2.0
c
Baseline
Root position
Tip position
Airfoil
α=15(deg)
U=10m/sU0 = 30m/s
a) Mean velocity
−0.3
−0.2
−0.1
0
0.1
0.2
y/c
x=
0
x=
0.2
c
x=
0.3
c
x=
0.5
c
x=
1.0
c
x=
1.5
c
x=
2.0
c
Baseline
Root position
Tip position
TKE/U0
2
0.02U
0 = 30m/s
Airfoil
α=15(deg)
b) Turbulent kinetic energy
Fig. 13. Wake development for NACA 0012 at α = 15◦.
22 of 28
American Institute of Aeronautics and Astronautics
−6 −4 −2 0 2 4 6
x 10−3
−0.3
−0.2
−0.1
0
0.1
y/c
-u′v′/U 2
0
−6 −4 −2 0 2 4 6
x 10−3-u′v′/U 2
0
−6 −4 −2 0 2 4 6
x 10−3
-u′v′/U 2
0
−6 −4 −2 0 2 4 6
x 10−3-u′v′/U 2
0
Baseline
Root location
Tip location
(d) x = 2.0c(c) x = 1.0c(b) x = 0.5c(a) x = 0.2c
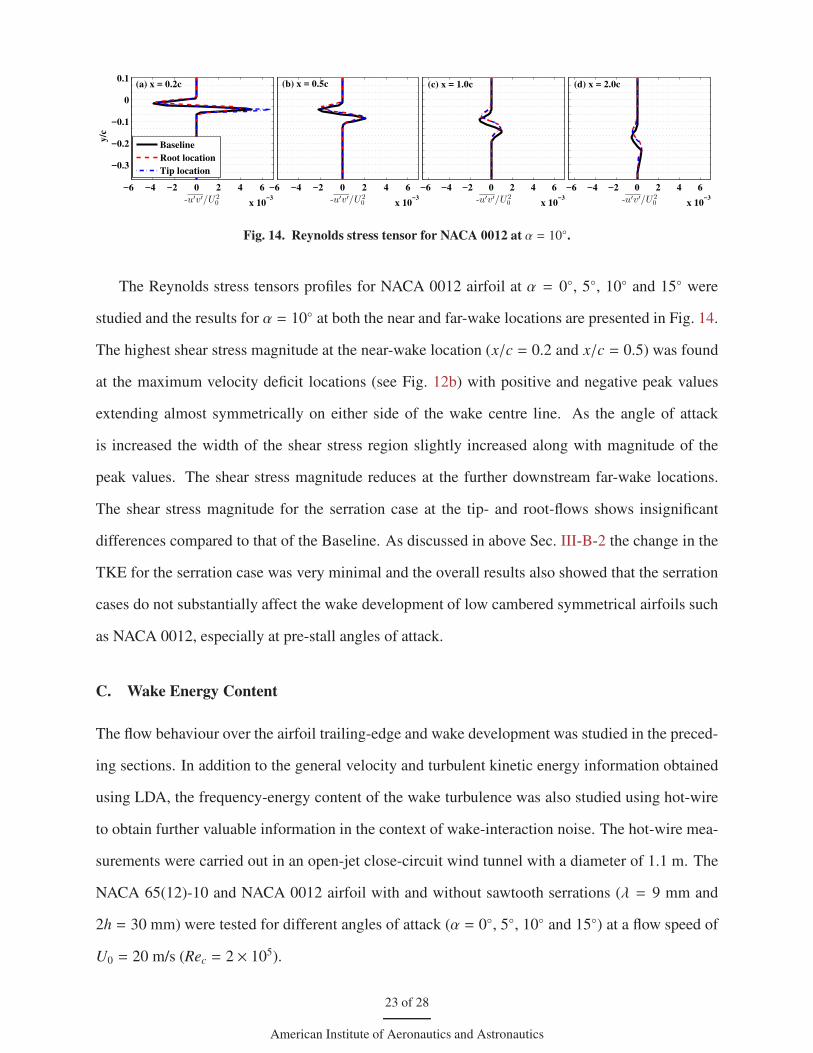
Fig. 14. Reynolds stress tensor for NACA 0012 at α = 10◦.
The Reynolds stress tensors profiles for NACA 0012 airfoil at α = 0◦, 5◦, 10◦ and 15◦ were
studied and the results for α = 10◦ at both the near and far-wake locations are presented in Fig. 14.
The highest shear stress magnitude at the near-wake location (x/c = 0.2 and x/c = 0.5) was found
at the maximum velocity deficit locations (see Fig. 12b) with positive and negative peak values
extending almost symmetrically on either side of the wake centre line. As the angle of attack
is increased the width of the shear stress region slightly increased along with magnitude of the
peak values. The shear stress magnitude reduces at the further downstream far-wake locations.
The shear stress magnitude for the serration case at the tip- and root-flows shows insignificant
differences compared to that of the Baseline. As discussed in above Sec. III-B-2 the change in the
TKE for the serration case was very minimal and the overall results also showed that the serration
cases do not substantially affect the wake development of low cambered symmetrical airfoils such
as NACA 0012, especially at pre-stall angles of attack.
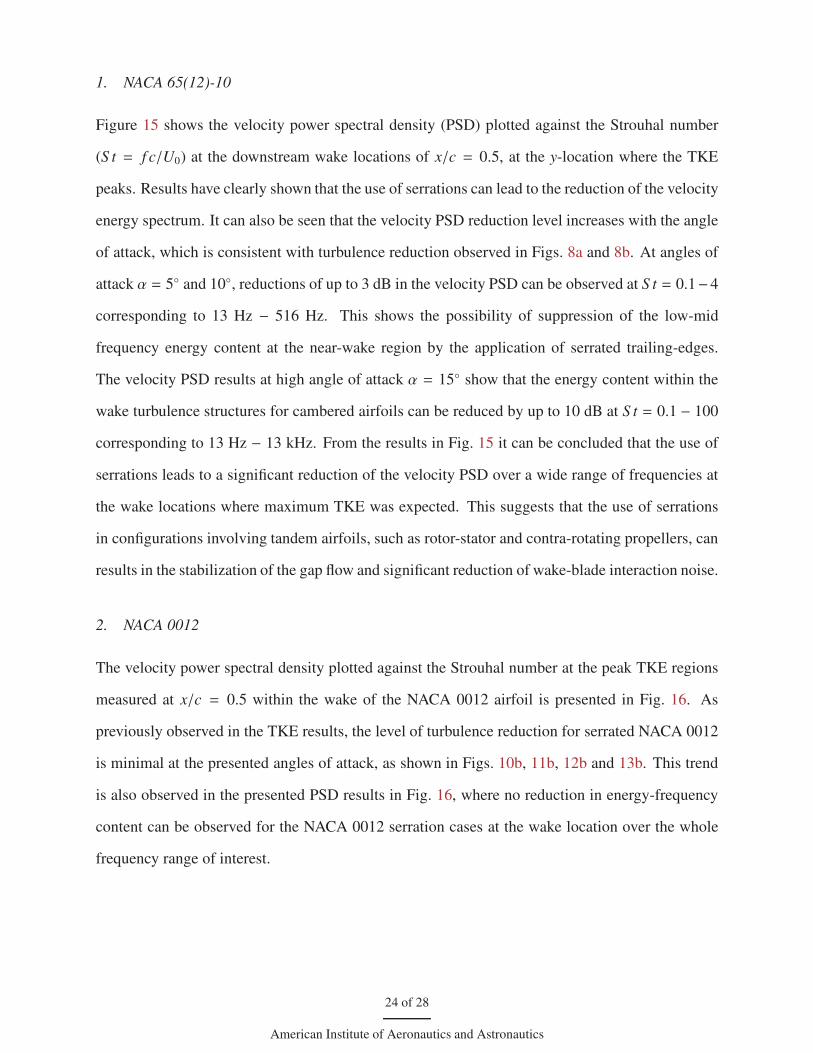
C. Wake Energy Content
The flow behaviour over the airfoil trailing-edge and wake development was studied in the preced-
ing sections. In addition to the general velocity and turbulent kinetic energy information obtained
using LDA, the frequency-energy content of the wake turbulence was also studied using hot-wire
to obtain further valuable information in the context of wake-interaction noise. The hot-wire mea-
surements were carried out in an open-jet close-circuit wind tunnel with a diameter of 1.1 m. The
NACA 65(12)-10 and NACA 0012 airfoil with and without sawtooth serrations (λ = 9 mm and
2h = 30 mm) were tested for different angles of attack (α = 0◦, 5◦, 10◦ and 15◦) at a flow speed of
U0 = 20 m/s (Rec = 2 × 10⁵).
23 of 28
American Institute of Aeronautics and Astronautics
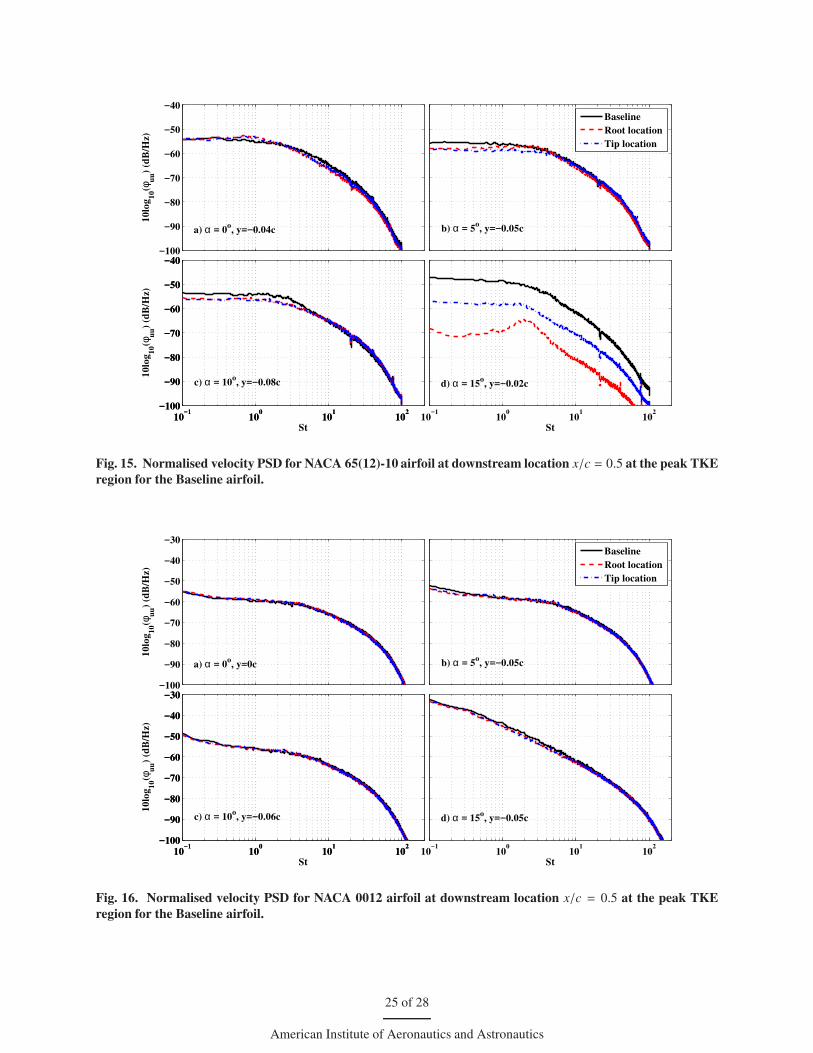
1. NACA 65(12)-10
Figure 15 shows the velocity power spectral density (PSD) plotted against the Strouhal number
(S t = f c/U0) at the downstream wake locations of x/c = 0.5, at the y-location where the TKE
peaks. Results have clearly shown that the use of serrations can lead to the reduction of the velocity
energy spectrum. It can also be seen that the velocity PSD reduction level increases with the angle
of attack, which is consistent with turbulence reduction observed in Figs. 8a and 8b. At angles of
attack α = 5◦ and 10◦, reductions of up to 3 dB in the velocity PSD can be observed at S t = 0.1−4
corresponding to 13 Hz − 516 Hz. This shows the possibility of suppression of the low-mid
frequency energy content at the near-wake region by the application of serrated trailing-edges.
The velocity PSD results at high angle of attack α = 15◦ show that the energy content within the
wake turbulence structures for cambered airfoils can be reduced by up to 10 dB at S t = 0.1 − 100
corresponding to 13 Hz − 13 kHz. From the results in Fig. 15 it can be concluded that the use of
serrations leads to a significant reduction of the velocity PSD over a wide range of frequencies at
the wake locations where maximum TKE was expected. This suggests that the use of serrations
in configurations involving tandem airfoils, such as rotor-stator and contra-rotating propellers, can
results in the stabilization of the gap flow and significant reduction of wake-blade interaction noise.
2. NACA 0012
The velocity power spectral density plotted against the Strouhal number at the peak TKE regions
measured at x/c = 0.5 within the wake of the NACA 0012 airfoil is presented in Fig. 16. As
previously observed in the TKE results, the level of turbulence reduction for serrated NACA 0012
is minimal at the presented angles of attack, as shown in Figs. 10b, 11b, 12b and 13b. This trend
is also observed in the presented PSD results in Fig. 16, where no reduction in energy-frequency
content can be observed for the NACA 0012 serration cases at the wake location over the whole
frequency range of interest.
24 of 28
American Institute of Aeronautics and Astronautics
−100
−90
−80
−70
−60
−50
−40
10
log
10(φ
uu)
(dB
/Hz)
10−1
100
101
102
−100
−90
−80
−70
−60
−50
−40
10
log
10(φ
uu)
(dB
/Hz)
10−1
100
101
102
−100
−90
−80
−70
−60
−50
−40
St10
−110
010
110
2
St
Baseline
Root location
Tip location
a) α = 0o, y=−0.04c b) α = 5
o, y=−0.05c
c) α = 10o, y=−0.08c d) α = 15
o, y=−0.02c
Fig. 15. Normalised velocity PSD for NACA 65(12)-10 airfoil at downstream location x/c = 0.5 at the peak TKE
region for the Baseline airfoil.
−100
−90
−80
−70
−60
−50
−40
−30
10
log
10(φ
uu)
(dB
/Hz)
10−1
100
101
102
−100
−90
−80
−70
−60
−50
−40
−30
10
log
10(φ
uu)
(dB
/Hz)
10−1
100
101
102
−100
−90
−80
−70
−60
−50
−40
−30
St10
−110
010
110
2
St
Baseline
Root location
Tip location
a) α = 0o, y=0c b) α = 5
o, y=−0.05c
c) α = 10o, y=−0.06c d) α = 15
o, y=−0.05c
Fig. 16. Normalised velocity PSD for NACA 0012 airfoil at downstream location x/c = 0.5 at the peak TKE
region for the Baseline airfoil.
25 of 28
American Institute of Aeronautics and Astronautics
IV. Conclusions
A comprehensive experimental study has been carried out for the aerodynamic performance and
wake development of airfoils fitted with trailing-edge serrations. A symmetric NACA 0012 and
cambered NACA 65(12)-10 were used in this study at moderate Reynolds numbers ranging from
Rec = 2 × 10⁵ to 6 × 10⁵. The aerodynamic force results have been provided for a wide range
of angles of attack. Results have revealed the complexity of the flow field around the trailing-
edge serrations and that the aerodynamic performance of the airfoil and its wake behaviour can
severely change, depending on the type of the airfoil and serration used. Even though the CL − α
curve trend is not strongly affected by the serrations, results have shown that the use of serration
changes the lift coefficient and the post stall characteristics of the airfoil, particularly for cambered
airfoils. The flow field results show that the serrations significantly affect the development of the
wake deficit and the peak in the velocity deficit location in the case of cambered airfoils compared
to the Baseline case with straight trailing-edge. The velocity profiles vary notably between the
tip and root profiles, causing significant shear stress between the tip and root flow planes. The
wake deficit dip location shows an upward shift in the wake profiles at the root positions relative
to the baseline case with straight trailing-edge and the tip positions. This indicates that the flow
originating from the airfoil pressure surface passes through the serration valleys moving upward.
The wake energy content results have also shown that the use of serrations can lead to considerable
reduction of the velocity power spectrum in the wake at all angles of attack, particularly at high
angles, where maximum aerodynamic performance is obtained. The possibility of reducing the
turbulence level using serrations is a very interesting observation, particularly in the context of
noise generated by wake-airfoil interaction of configurations involving tandem airfoils, such as
contra-rotating propellers, rotor-stator configuration, etc.
Acknowledgments
The authors would like to acknowledged the financial support to Dr. Azarpeyvand provided by the
Royal Academy of Engineering.
26 of 28
American Institute of Aeronautics and Astronautics
References
[1] Hardin, J. C., “Airframe Self-Nosie: Four Years Research,” NASA-TM-X-73908, 1976.
[2] Wagner, S., Bareib, R., and Guidati, G., Wind Turbine Noise, Springer Berlin Heidelberg, New York,
1996.
[3] Brooks, T., Pope, D., and Marcolini, M., “Airfoil Self-Noise and Prediction,” NASA-RP-1218, 1989.
[4] Powell, A., “On the Aerodynamic Noise of a Rigid Flat Plate Moving at Zero Incidence,” Journal of
the Acoustical Society of America, Vol. 31, No. 12, 1959, pp. 1649–1653.
[5] Williams, J. E. F. and Hall, L. H., “Aerodynamic Sound Generation by Turbulent Flow in the Vicinity
of a Scattering Half Plane,” Journal of Fluid Mechanics, Vol. 40, No. 4, 1970, pp. 657–670.
[6] Liu, X., Azarpeyvand, M., and Theunissen, R., “On the Aerodynamic Performance of Serrated Air-
foils,” 22nd International Congress on Sound and Vibration, Florence, Italy, 2015.
[7] Liu, X., Kamliya Jawahar, H., Azarpeyvand, M., and Theunissen, R., “Aerodynamic and Aeroacoustic
Performance of Serrated Airfoils,” AIAA Paper 2015-2201, 2015.
[8] Liu, X., Kamliya Jawahar, H., Azarpeyvand, M., and Theunissen, R., “Wake Development of Airfoils
with Serrated Trailing Edges,” AIAA Paper 2016-2817, 2016.
[9] Chong, T. P., Joseph, P. F., and Gruber, M., “Airfoil Self Noise Reduction by Non-Flat Plate Type
Trailing Edge Serrations,” Applied Acoustics, Vol. 74, No. 4, 2013, pp. 607–613.
[10] Showkat Ali, S. A., Liu, X., and Azarpeyvand, M., “Bluff Body Flow and Noise Control Using Porous
Media,” AIAA Paper 2016-2754, 2016.
[11] Showkat Ali, S. A., Szoke, M., Azarpeyvand, M., and Ilario, C., “Trailing Edge Bluntness Flow and
Noise Control Using Porous Treatments,” AIAA Paper 2016-2832, 2016.
[12] Herr, M. and Dobrzynski, W., “Experimental Investigations in Low-Noise Trailing-Edge Design,”
AIAA Journal, Vol. 46, No. 6, 2005, pp. 1167–1175.
[13] Finez, A., Jondeau, E., Roger, M., and Jacob, M. C., “Broadband Noise Reduction with Trailing Edge
Brushes,” AIAA Paper 2010-3980, 2010.
[14] Ai, Q., Azarpeyvand, M., Lachenal, X., and Weaver, P. M., “Airoil Noise Reduction Using Morphing
Trailing Edge,” The 21st International Congress on Sound and Vibration, Beijing, China., 2014.
[15] Ai, Q., Azarpeyvand, M., Lachenal, X., and Weaver, P. M., “Aerodynamic and Aeroacoustic Perfor-
mance of Airfoils with Morphing Structures,” Wind Energy, Vol. 19, No. 7, 2016, pp. 1325–1339.
[16] Ai, Q., Kamliya Jawahar, H., and Azarpeyvand, M., “Experimental Investigation of Aerodynamic
Performance of Airfoils Fitted with Morphing Trailing Edges,” AIAA Paper 2016-1563, 2016.
[17] Oerlemans, S., Fisher, M., Maeder, T., and Kogler, K., “Reduction of Wind Turbine Noise Using
Optimized Airfoils and Trailing-Edge Serrations,” AIAA Journal, Vol. 47, No. 6, 2009, pp. 1470–1481.
[18] Howe, M. S., “A Review of the Theory of Trailing Edge Noise,” Journal of Sound and Vibration,
Vol. 61, No. 3, 1978, pp. 437–465.
[19] Howe, M. S., “Noise Produced by a Sawtooth Trailing Edge,” Journal of the Acoustical Society of
America, Vol. 90, No. 1, 1991, pp. 482–487.
27 of 28
American Institute of Aeronautics and Astronautics
[20] Howe, M. S., “Aerodynamic Noise of a Serrated Trailing Edge,” Journal of Fluids and Structures,
Vol. 5, No. 1, 1991, pp. 33–45.
[21] Lyu, B., Azarpeyvand, M., and Sinayoko, S., “Prediction of Noise from Serrated Trailing-Edges,”
Journal of Fluid Mechanics, Vol. 793, 2016, pp. 556–588.
[22] Gruber, M., Azarpeyvand, M., and Joseph, P. F., “Airfoil Trailing Edge Noise Reduction by the In-
troduction of Sawtooth and Slitted Trailing Edge Geometries,” Proceedings of 20th International
Congress on Acoustics, Sydney, Australia, 2010.
[23] Gruber, M., Joseph, P. F., and Chong, T. P., “Experimental Investigation of Airfoil Self Noise and
Turbulent Wake Reduction by the Use of Trailing Edge Serrations,” AIAA Paper 2010-3803, 2010.
[24] Gruber, M., Aerofoil Noise Reduction by Edge Treatments, Doctoral thesis, University of Southampton,
2012.
[25] Gruber, M., Joseph, P. F., and Azarpeyvand, M., “An Experimental Investigation of Novel Trailing
Edge Geometries on Airfoil Trailing Edge Noise Reduction,” AIAA Paper 2013-2011, 2013.
[26] Arce Leon, C., Ragni, D., Probsting, S., Scarano, F., and Madsen, J., “Flow topology and acoustic
emissions of trailing edge serrations at incidence,” Experiments in Fluids, Vol. 57, No. 5, 2016, pp. 91.
[27] Vathylakis, A., Chong, T. P., and Joseph, P. F., “Poro-Serrated Trailing-Edge Devices for Airfoil Self-
Noise Reduction,” AIAA Journal, Vol. 53, No. 11, 2015, pp. 3379–3394.
[28] Chong, T. P. and Joseph, P. F., “An Experimental Study of Airfoil Instability Tonal Noise With Trailing
Edge Serrations,” Journal of Sound and Vibration, Vol. 332, No. 24, 2013, pp. 6335–6358.
[29] Moreau, D. J. and Doolan, C. J., “Noise-Reduction Mechanism of a Flat-Plate Serrated Trailing Edge,”
AIAA Journal, Vol. 51, No. 10, 2013, pp. 2513–2522.
[30] Chong, T. P. and Vathylakis, A., “On the Aeroacoustic and Flow Structures Developed on a Flat Plate
with a Serrated Sawtooth Trailing Edge,” Journal of Sound and Vibration, Vol. 354, 2015, pp. 65–90.
[31] Jones, L. E. and Sandberg, R. D., “Acoustic and Hydrodynamic Analysis of the Flow Around an
Aerofoil with Trailing-Edge Serrations,” Journal of Fluid Mechanics, Vol. 706, 2012, pp. 295–322.
[32] Avallone, F., Probsting, S., and Ragni, D., “Three-Dimensional Flow Field Over a Trailing-Edge Ser-
ration and Implications on Broadband Noise,” Physics of Fluids, Vol. 28, No. 11, 2016, pp. 1–20.
28 of 28
American Institute of Aeronautics and Astronautics