Embed Size (px)
Citation preview
Meccanica dei Materiali e delle Strutture Vol. VI (2016), no.1, pp. 1-8
ISSN: 2035-679X Dipartimento di Ingegneria Civile, Ambientale, Aerospaziale, Dei Materiali
DICAM
Meccanica dei Materiali e delle Strutture | VI (2016), 1, PP. 1-8 1
AERODYNAMIC LOADING AND DYNAMIC RESPONSE OF STRUCTURES IN MIXED WIND CLIMATES
G. Solari* * Department of Civil, Chemical and Environmental Engineering (DICCA)
Polytechnic School, University of Genoa Via Montallegro, 1, 16145 Genoa, Italy
e-mail: [email protected]
Key words: Monitoring Network, Response Spectrum, Thunderstorm, Wind Loading.
Parole chiave: Rete di Monitoraggio, Spettro di Risposta, Temporale, Azioni del Vento.
Abstract. This paper describes the research carried out at the University of Genoa on the thunderstorm loading and response of structures. It starts by describing the wind monitoring network realized for two European projects, “Wind and Ports” and “Wind, Ports and Sea”, and the dataset of wind records that it generated. Then it describes the analysis of thunderstorm records, focusing on their characteristics relevant to the wind loading of structures. Based upon these characteristics, the thunderstorm response of structures is determined by the response spectrum technique, a method introduced for ideal point-like Single-Degree-Of-Freedom systems, then generalized to real Multi-Degree-Of-Freedom systems. Finally, a criterion to deal with wind loading and response of structures in mixed wind climates is described.
Sommario. Questo articolo descrive la ricerca condotta all’Università di Genova sulle azioni e sulla risposta delle strutture ai temporali. Esso inizia descrivendo la rete di monitoraggio del vento realizzata per due progetti europei, “Vento e Porti” e “Vento, Porti e Mare”, e la base dati del vento da essa prodotta. Passa poi a descrivere l’analisi delle registrazioni del vento temporalesco, focalizzandosi sulle proprietà rilevanti per i carichi sulle strutture. Sulla base di queste caratteristiche la risposta delle strutture ai temporali è determinata mediante la tecnica delle spettro di risposta, un metodo dapprima introdotto per i sistemi puntiformi ideali a un grado di libertà, poi generalizzato ai sistemi reali a molti gradi di libertà. Infine è descritto un criterio per trattare i carichi e la risposta strutturale in condizioni climatologiche miste.
1 INTRODUCTION
A climatologic condition in which wind phenomena of different nature coexist - e.g. extra-tropical and tropical cyclones, monsoons, tornadoes, downslope winds and thunderstorms - is referred to as a mixed climate1. The wind climate of Europe and many parts of the world is dominated by extra-tropical cyclones and thunderstorms.
Extra-tropical cyclones2 are synoptic events that develop on a few thousand kilometres, with frequency and duration of a few days. Their velocity field is characterized by a mean profile in equilibrium with an atmospheric boundary layer whose depth is in the order of 3
G.Solari
Meccanica dei Materiali e delle Strutture | VI (2016), 1, PP. 1-8 2
km. Here, within time intervals between 10-min and 1-h, turbulent fluctuations are stationary Gaussian processes. The procedure introduced by Davenport3 in the ‘60s to evaluate wind actions on structures identifies strong winds with extra-tropical cyclones.
Thunderstorms4 are mesoscale events that develop in a few kilometres. They are made up of a set of cells that evolve through three stages in about 30 minutes: the cumulus stage, due to convective unstable phenomena, originates an updraft of warm air; the mature stage causes a downdraft of cold air that impinging over the ground produces intense radial outflows; in the dissipating stage thunderstorm losses force and disappears. The whole of these air motions is called downburst5. Radial outflows are characterized by non-stationary and non-Gaussian velocity fields with a “nose profile” that increases up to 50-100 m height, then decreases above. This discover generated an extraordinary fervour of research in atmospheric sciences, focusing on causes, morphology and life-cycle of thunderstorms6,7.
In parallel wind engineering realized that design wind speed is often due to thunderstorms8 and a striking research arose9, dual to that which took place in atmospheric sciences. Despite such research, however, this matter is still dominated by huge uncertainties and there is not yet a shared model of thunderstorm outflows and their actions on structures like the one formulated by Davenport3 for extra-tropical cyclones. Yet, there is no rational scheme that joins wind actions due to cyclones and thunderstorms. This happens because the complexity of thunderstorms makes to establish physically realistic and simple models difficult. Their short duration and small size make a limited amount of data available. The gap between wind engineering and atmospheric sciences exacerbates reality. Thus, wind actions on structures are still evaluated by Davenport’s model at most considering thunderstorms, if data is available, in the statistical evaluation of the extreme wind speed1,10. This is not enough because extra-tropical cyclones and thunderstorms are different phenomena that need separate assessments9.
This paper describes the research carried out at the University of Genoa on thunderstorm loading and response of structures. Section 2 describes the wind monitoring network realized for two European projects and the dataset that it generated. Section 3 describes the analysis of thunderstorm records focusing on their properties relevant to wind loading. Section 4 introduces the thunderstorm response spectrum related to ideal point-like Single-Degree-Of-Freedom (SDOF) systems. Section 5 shows the application of the Thunderstorm Response Spectrum Technique to Multi-Degree-Of-Freedom (MDOF) systems. Section 6 describes the Independent Wind Loadings Technique, a method to deal with wind loading and response of structures in mixed wind climates. Section 8 summarizes the main conclusions and discuss some prospects.
2 WIND MONITORING NETWORK AND DATASET
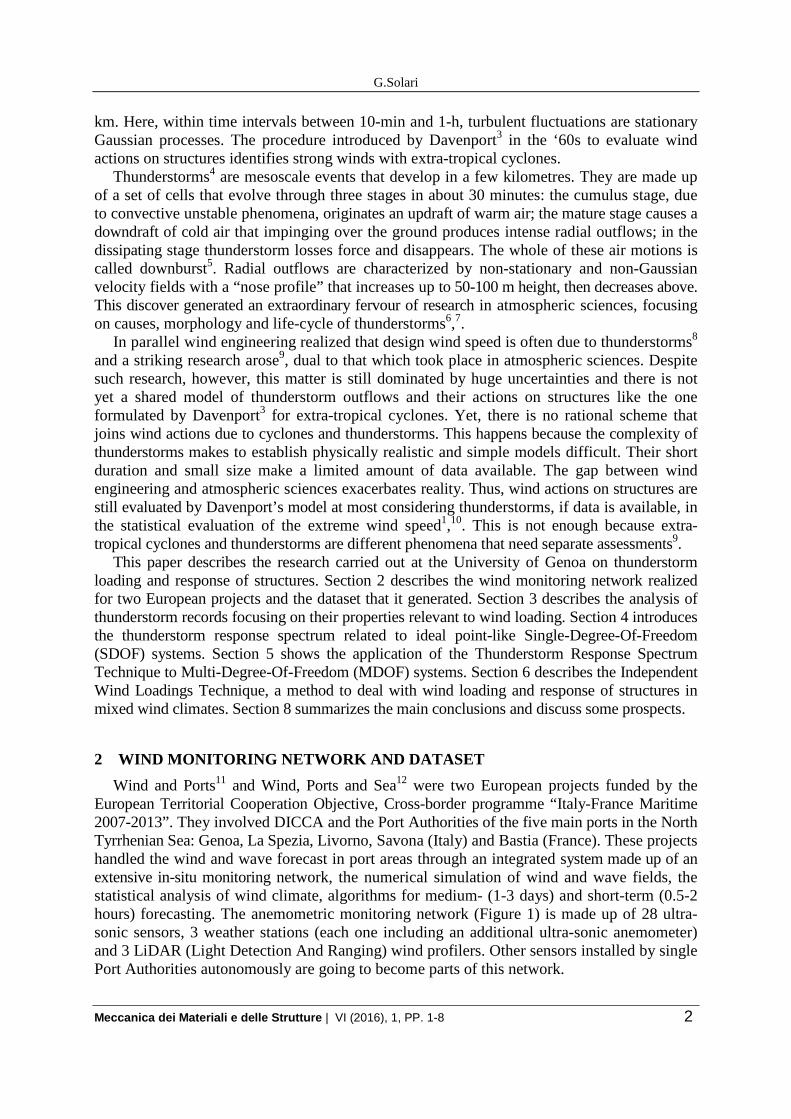
Wind and Ports11 and Wind, Ports and Sea12 were two European projects funded by the European Territorial Cooperation Objective, Cross-border programme “Italy-France Maritime 2007-2013”. They involved DICCA and the Port Authorities of the five main ports in the North Tyrrhenian Sea: Genoa, La Spezia, Livorno, Savona (Italy) and Bastia (France). These projects handled the wind and wave forecast in port areas through an integrated system made up of an extensive in-situ monitoring network, the numerical simulation of wind and wave fields, the statistical analysis of wind climate, algorithms for medium- (1-3 days) and short-term (0.5-2 hours) forecasting. The anemometric monitoring network (Figure 1) is made up of 28 ultra-sonic sensors, 3 weather stations (each one including an additional ultra-sonic anemometer) and 3 LiDAR (Light Detection And Ranging) wind profilers. Other sensors installed by single Port Authorities autonomously are going to become parts of this network.
G.Solari
Meccanica dei Materiali e delle Strutture | VI (2016), 1, PP. 1-8 3
Figure 1: Wind monitoring network.
The position of the anemometers was chosen to cover homogeneously port areas and
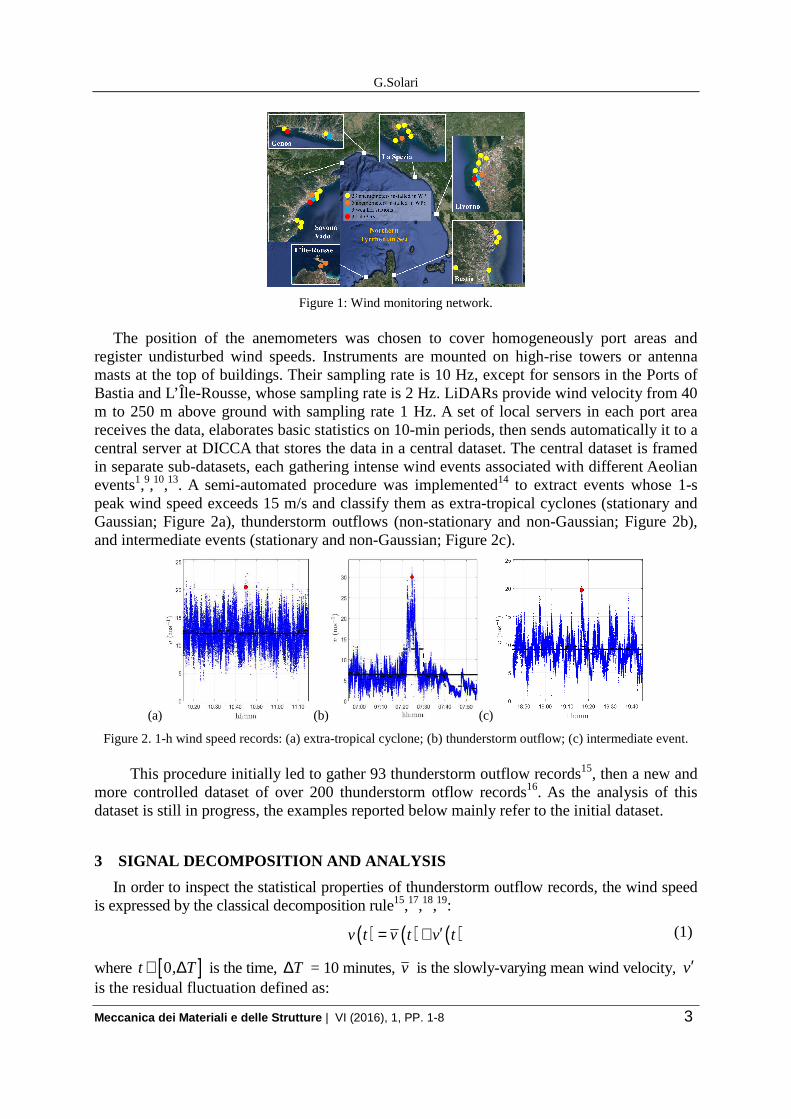
register undisturbed wind speeds. Instruments are mounted on high-rise towers or antenna masts at the top of buildings. Their sampling rate is 10 Hz, except for sensors in the Ports of Bastia and L’Île-Rousse, whose sampling rate is 2 Hz. LiDARs provide wind velocity from 40 m to 250 m above ground with sampling rate 1 Hz. A set of local servers in each port area receives the data, elaborates basic statistics on 10-min periods, then sends automatically it to a central server at DICCA that stores the data in a central dataset. The central dataset is framed in separate sub-datasets, each gathering intense wind events associated with different Aeolian events1,9,10,13. A semi-automated procedure was implemented14 to extract events whose 1-s peak wind speed exceeds 15 m/s and classify them as extra-tropical cyclones (stationary and Gaussian; Figure 2a), thunderstorm outflows (non-stationary and non-Gaussian; Figure 2b), and intermediate events (stationary and non-Gaussian; Figure 2c).
(a) (b) (c)
Figure 2. 1-h wind speed records: (a) extra-tropical cyclone; (b) thunderstorm outflow; (c) intermediate event.
This procedure initially led to gather 93 thunderstorm outflow records15, then a new and more controlled dataset of over 200 thunderstorm otflow records16. As the analysis of this dataset is still in progress, the examples reported below mainly refer to the initial dataset.
3 SIGNAL DECOMPOSITION AND ANALYSIS
In order to inspect the statistical properties of thunderstorm outflow records, the wind speed is expressed by the classical decomposition rule15,17,18,19:
( ) ( ) ( )v t v t v t′= + (1)
where [ ]0t , T∈ ∆ is the time, T∆ = 10 minutes, v is the slowly-varying mean wind velocity, v′ is the residual fluctuation defined as:
G.Solari
Meccanica dei Materiali e delle Strutture | VI (2016), 1, PP. 1-8 4
( ) ( ) ( )vv t t v t′ ′= σ ɶ (2)
vσ being the slowly-varying standard deviation of v′ and v′ɶ the reduced turbulent fluctuation; it may be schematized as a reduced stationary Gaussian process whose harmonic content is examined in 15. ( ) ( ) ( )/v vI t t v t= σ is the slowly-varying turbulence intensity. The extraction of v from v and vσ from v′ is carried out by a moving average filter with period T = 30 s15.
Let us define ( ) ( )maxv t v t= γ and ( ) ( )v vI t I t= µ , where maxv is the maximum value of v in T∆ , γ is a non-dimensional function of t that can be schematised as a non-stationary process,
being 1maxγ = 15; vI is the average value of vI in T∆ , µ is a non-dimensional function of t that can be schematised as a stationary non-Gaussian process, being 1µ = 15,16. Adopting these definitions Eq. (1) may be re-written as:
( ) ( ) ( ) ( )max 1 vv t v t I t v t′ = γ + µ ɶ (3)
Finally, let us introduce three noteworthy wind velocity ratios referred to as, respectively, the peak ratio, the maximum gust factor, and the peak gust factor:
= =max maxv GR ˆv G
; = =maxmax
max
v ˆG RGv
; = = max
max
ˆ GvG
v R
(4)
where vmax and v are the maximum values of the wind speed and the 1-s peak wind speed. The mean values of the turbulence intensity and integral length scale of v′ɶ do not exhibit any
relevant correlation with z/z0, z0 being the roughness length. The same property applies to R, Gmax and G . This does not mean that z0 has negligible importance. Some wind tunnel tests20 point out the crucial role of D/z0, D being the diameter of the impinging jet. Unfortunately no existing monitoring campaign allows to assess the diameter of thunderstorm downdrafts.
4 THUNDERSTORM RESPONSE SPECTRUM – SDOF SYSTEMS
Consider a linear structure subjected to a thunderstorm outflow21. From the dynamic viewpoint it is schematized as a SDOF system with mass m, damping c and stiffness k. From the aerodynamic viewpoint it is schematized as a board with area A orthogonal subjected to the force ( ) ( )2 2Df t v t Ac /=ρ where ρ is the density of air, v is the wind velocity (Eq. 3), cD is the drag coefficient. The displacement x is given by solving the differential equation:
( ) ( ) ( ) ( )ɺɺ ɺ+ + =mx t cx t kx t f t (5)
Let us introduce the peak wind force 2 2Dˆ ˆf v Ac /= ρ and the peak static displacement
ˆx f / k= . Moreover, let us introduce the reduced velocity ( ) ( ) ˆu t v t / v= and the reduced displacement ( ) ( ) ˆd t x t / x= , d being the solution of the differential equation of motion:
( ) ( ) ( ) ( ) ( ) ( ) ( )2 2 20 0 02 2 2d t +2 n d t + n d t = n u tξ π π πɺɺ ɺ (6)
where 0 0 2n /= ω π is the fundamental frequency, 0ω is the fundamental circular frequency, ξ is the damping ratio. The Response Spectrum (RS) is defined as maxdS d= , where dmax is the maximum value of d. So, the RS depends on u and two parameters: n0 and ξ. Thanks to the linearity of structure, the maximum displacement and the equivalent static force result:
G.Solari
Meccanica dei Materiali e delle Strutture | VI (2016), 1, PP. 1-8 5
max dˆx x S= ⋅ ; eq dˆf f S= ⋅ (7)
where xmax is the maximum value of x (Eq. 5); feq is the force that statically applied on the structure causes the displacement xmax. The limit conditions of Sd are discussed in 21.
Differently from Eq. (5), assume that structure is subjected to the mean force ( )f t =
( )2 2Dv t Ac /ρ . As the duration of thunderstorms is usually much greater than the fundamental period of structure15, the slowly-varying mean displacement is ( ) ( )x t f t / k≃ . Introducing the reduced mean speed ( ) ( ) ˆu t v t / v= and the reduced mean displacement ( ) ( ) ˆd t x t / x=
( )2u t= , the Base RS (BRS) is defined as 2 21db max maxˆS d u / G= = = , where maxd and maxu are
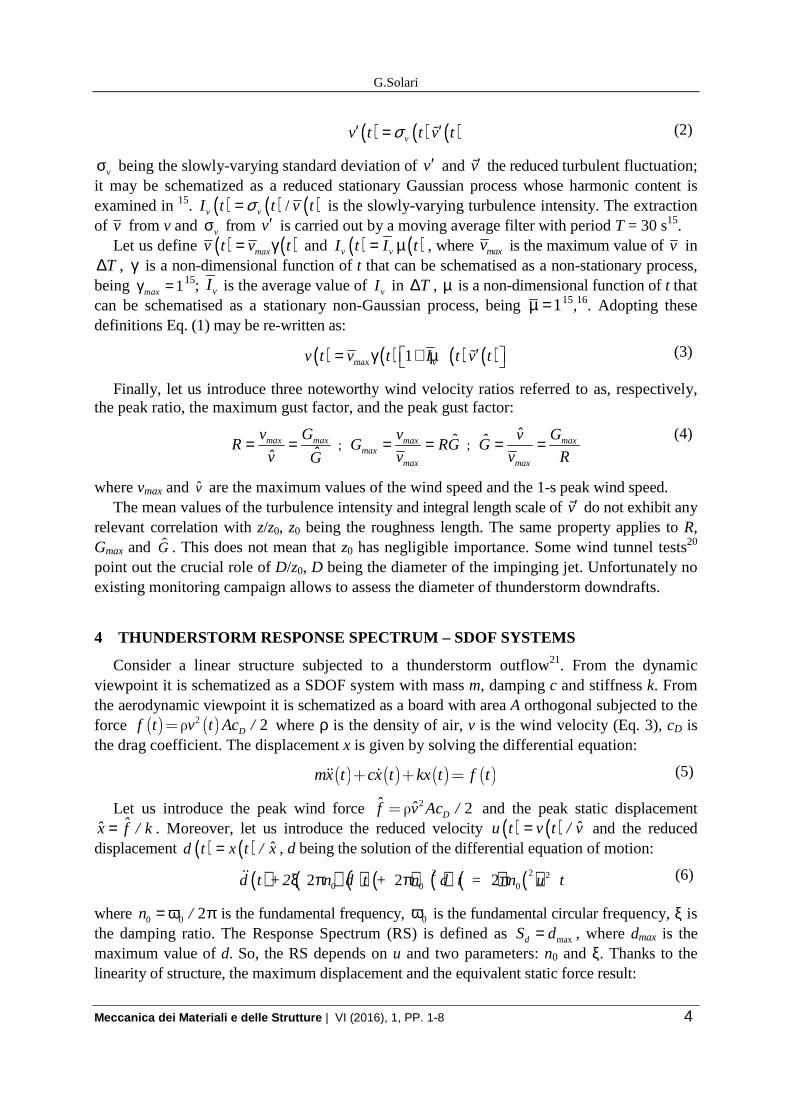
the maximum values of d and u , respectively. So, the BRS depends on the sole u . Figure 3 shows the mean value and the coefficient of variation (cov) of dS as a function of
0 0 maxn n z / v=ɶ . In (a) dash-dotted and dashed lines refer to the mean values of 2R and 21 ˆ/ G , respectively. In (b) they refer to their cov.
(a) (b)
Figure 3. Mean (a) and cov (b) of the RS as a function of 0nɶ and ξ.
5 THUNDERSTORM RESPONSE SPECTRUM TECNIQUE – MDOF SYSTEMS
Consider a MDOF linear system22. For sake of simplicity it is schematized as a slender vertical cantilever beam subjected to the force ( ) ( ) ( ) ( )2 2Df z,t v z,t b z c z /= ρ , where b is the width of the structural surface. Generalising Eq. (6) the wind speed is expressed as:
( ) ( ) ( ) ( ) ( ) ( ) ( ) ( )1max vv z,t v h z t I h z t v z,t′ = α γ + β µ ɶ (8)
where z is a vertical axis, h is the reference height; α and β are non-dimensional functions of z that define the shape of the vertical profile of v 23,24,25 and vI 19; v′ɶ is a random field26.
Assume that the structural response is dominated by the first mode of vibration22 ψ1, namely ( ) ( ) ( )1 1x z,t z p t= ψ , where p1 is the first principal coordinate given by:
( ) ( ) ( ) ( ) ( ) ( )2
1 1 1 1 1 11
12 2 2p t n p t n p t f t
m+ π ξ + π =ɺɺ ɺ
(9)
n1, ξ, m1 and f1 are the first natural frequency, damping ratio, modal mass and modal force. From Eq. (11), the peak wind force and peak static displacement are given by ( )f z = ( ) ( ) ( ) ( )2 2 2Dv h z b z c z /ρ α and ( ) ( ) ( ) ( )22
1 1 1 12 2ˆ ˆx z v h a z / m n= ρ ψ π , being ( ) ( )maxˆv z v z G= .
Generalizing the equivalent wind spectrum technique27,28, let us introduce the reduced equivalent speed ( ) ( ) ( )eq eq
ˆu t, v h,t, / v hδ = δ and the reduced equivalent displacement ( )eqd t ( ) ( )ˆx z,t / x z= , where ( )eqv h,t,δ is the equivalent wind speed, ( )z max eqc H / v zδ = κ is the
G.Solari
Meccanica dei Materiali e delle Strutture | VI (2016), 1, PP. 1-8 6
size factor, κ is the modal shape factor, cz is the exponential decay coefficient, H is the height of structure, and eqz is the equivalent height. By virtue of Eq. (9), deq is given by:
( ) ( ) ( ) ( ) ( ) ( ) ( )2 2 21 1 12 2 2eq eq eq eqd t +2 n d t + n d t = n u t ,ξ π π π δɺɺ ɺ (10)
Paraphrasing the definition of dS for a point-like SDOF system, the Equivalent RS (ERS) for a vertical MDOF system is defined as =d ,eq eq,maxS d , where deq,max is the maximum value of deq. While dS depends on the oncoming wind and two structural parameters, n0 and ξ, ,d eqS depends on one more parameter, δ , that synthesizes the role of aerodynamic admittance.
Thanks to structure linearity, the maximum displacement and equivalent static force result:
( ) ( )max d ,eqˆx z x z S= ⋅ ; ( ) ( )eq d ,eqˆf z f z S= ⋅ (11)
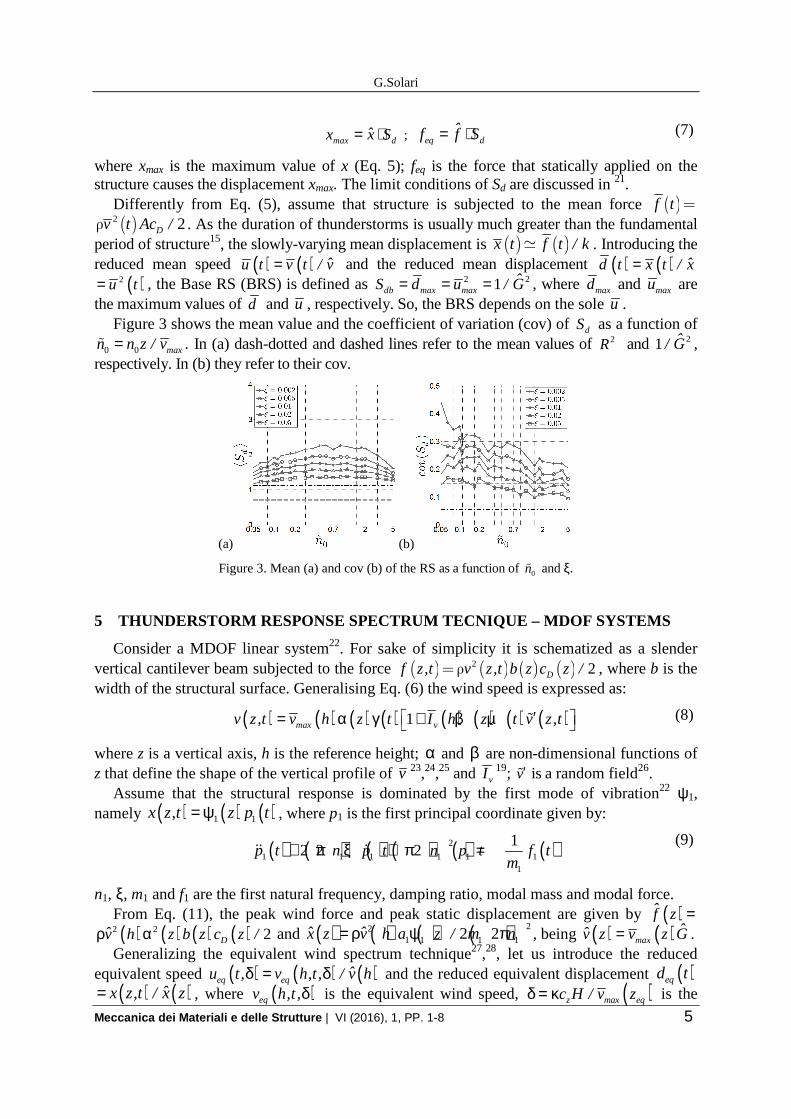
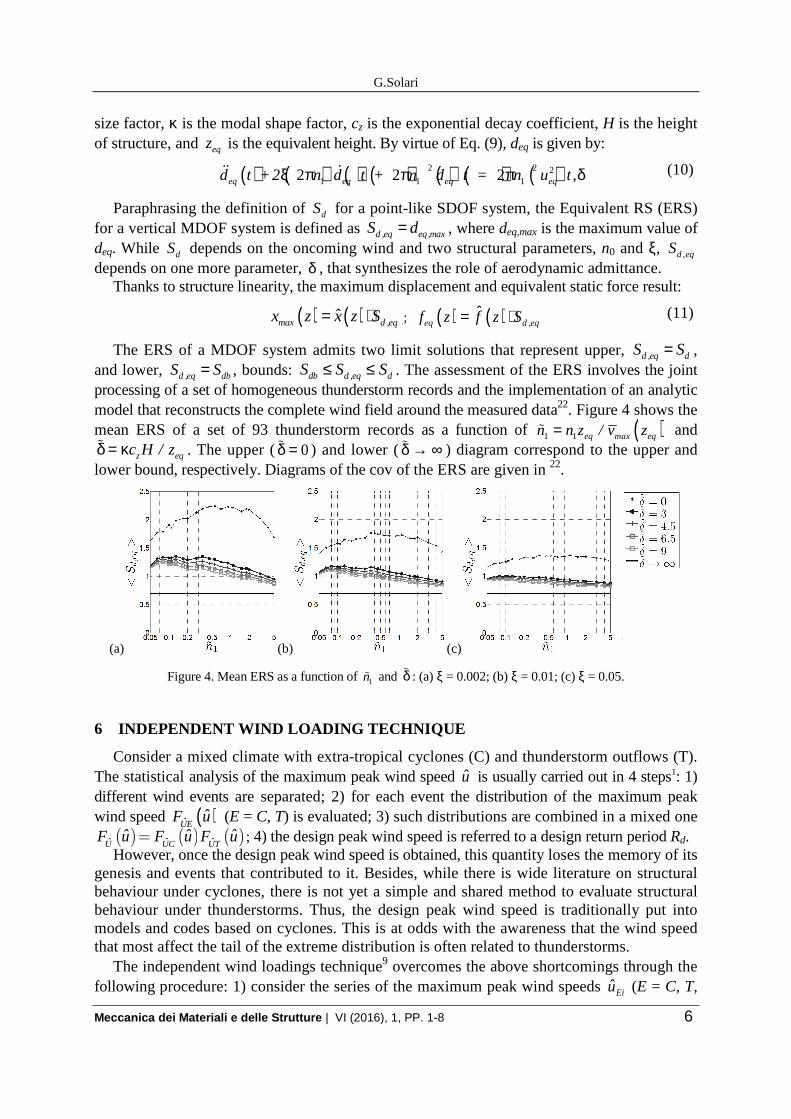
The ERS of a MDOF system admits two limit solutions that represent upper, d ,eq dS S= , and lower, d ,eq dbS S= , bounds: ≤ ≤db d ,eq dS S S. The assessment of the ERS involves the joint processing of a set of homogeneous thunderstorm records and the implementation of an analytic model that reconstructs the complete wind field around the measured data22. Figure 4 shows the mean ERS of a set of 93 thunderstorm records as a function of ( )1 1 eq max eqn n z / v z=ɶ and
z eqc H / zδ = κɶ . The upper ( 0δ =ɶ ) and lower (δ → ∞ɶ ) diagram correspond to the upper and lower bound, respectively. Diagrams of the cov of the ERS are given in 22.
(a) (b) (c)
Figure 4. Mean ERS as a function of 1nɶ and δɶ : (a) ξ = 0.002; (b) ξ = 0.01; (c) ξ = 0.05.
6 INDEPENDENT WIND LOADING TECHNIQUE
Consider a mixed climate with extra-tropical cyclones (C) and thunderstorm outflows (T). The statistical analysis of the maximum peak wind speed u is usually carried out in 4 steps1: 1) different wind events are separated; 2) for each event the distribution of the maximum peak wind speed ( )UE
ˆF u (E = C, T) is evaluated; 3) such distributions are combined in a mixed one ( ) ( ) ( )ˆ ˆ ˆU UC UTˆ ˆ ˆF u F u F u= ; 4) the design peak wind speed is referred to a design return period Rd.
However, once the design peak wind speed is obtained, this quantity loses the memory of its genesis and events that contributed to it. Besides, while there is wide literature on structural behaviour under cyclones, there is not yet a simple and shared method to evaluate structural behaviour under thunderstorms. Thus, the design peak wind speed is traditionally put into models and codes based on cyclones. This is at odds with the awareness that the wind speed that most affect the tail of the extreme distribution is often related to thunderstorms.
The independent wind loadings technique9 overcomes the above shortcomings through the following procedure: 1) consider the series of the maximum peak wind speeds Eiu (E = C, T,
G.Solari
Meccanica dei Materiali e delle Strutture | VI (2016), 1, PP. 1-8 7
…; i = 1, 2, ... nE); 2) determine the distribution of the maximum peak wind speed UE
F ; 3) evaluate the design peak wind speed uEd referred to the design return period REd; 4) determine the equivalent static force for each event E using an appropriate method, for instance the gust factor technique for cyclones3 and the response spectrum technique for thunderstorm22.
In place of the classical unique wind loading, this procedure gives rise to as many independent wind loading conditions as the wind phenomena that characterize the mixed climate. It is supported by the diversity of different phenomena, not only the stationary or non-stationary and Gaussian or non-Gaussian character but also the shape of the profile, the parameterization of the wind field with reference to the roughness length, and the intensity, size, duration and recurrence. In this regard that phenomena with different size, duration and recurrence require different partial safety coefficients and combination factors.
7 CONCLUSIONS
This paper illustrates a wide research program carried out at the University of Genoa first on the monitoring, modelling and simulation of thunderstorm outflows, then on the loading and response of structures to this phenomenon. The wind monitoring network realized for two European projects and the related dataset of wind measurements represent an unprecedented opportunity to gather a large number of high resolution thunderstorm outflow records, process these data in statistical terms, and extract the main features. Based on an extensive set of wind records the response of structures to thunderstorm outflows is evaluated through an evolution of the response spectrum technique widely diffused in the seismic sector. This technique is first developed for SDOF systems subjected to perfectly coherent wind fields, then is extended to MDOF systems subjected to partially coherent wind fields through a generalization of the equivalent wind spectrum technique. The response spectrum technique and the equivalent static actions of thunderstorms are embedded in a new approach, the independent wind loading technique, for evaluating wind loading on structures in mixed climates. In place of the classical unique wind loading, it gives rise to as many independent wind loading conditions as the wind phenomena that characterize the mixed climate.
REFERENCES
[1] L. Gomes and B.J. Vickery, “Extreme wind speeds in mixed climates”, J. Ind. Aerod., 2, 331-344 (1977/1978).
[2] J. Bjerknes and H. Solberg, “Life cycle of cyclones and the polar front theory of atmospheric circulation”, Geofys. Publ., 3, 3-18 (1922).
[3] A.G. Davenport, “The application of statistical concepts to the wind loading of structures”, Proc. Inst. Civ. Eng., 19, 449-472 (1961).
[4] H.R. Byers and R.R. Braham, The thunderstorm: Final report of the Thunderstorm Project, U.S. Government Printing Office, Washington, DC, 1949.
[5] T.T. Fujita, Downburst: microburst and macroburst, University of Chicago Press, Chicago, IL, 1985.
[6] R.G. Goff, “Vertical structure of thunderstorm outflows”, Mon. Weather Rev., 104, 1429-1440 (1976).
[7] M.R. Hjelmfelt, “Structure and life cycle of microburst outflows observed in Colorado”, J. Appl. Meteorol., 27, 900-927 (1988).
G.Solari
Meccanica dei Materiali e delle Strutture | VI (2016), 1, PP. 1-8 8
[8] C.W. Letchford, C. Mans and M.T. Chay, “Thunderstorms – their importance in wind engineering”, J. Wind Eng. Ind. Aerod., 90, 1415-1433 (2002).
[9] G. Solari, “Emerging issues and new frameworks for wind loading on structures in mixed climates”, Wind Struct., 19, 295-320 (2014).
[10] M. Kasperski, “A new wind zone map of Germany”, J. Wind Eng. Ind. Aerod., 90, 1271-1287 (2002).
[11] G. Solari, M.P. Repetto, M. Burlando, P. De Gaetano, M. Pizzo, M. Tizzi and M. Parodi, “The wind forecast for safety and management of port areas”, J. Wind Eng. Ind. Aerod., 104-106, 266-277 (2012).
[12] M.P. Repetto, M. Burlando, G. Solari, P. De Gaetano, M. Pizzo and M. Tizzi, “A GIS-based platform for the risk assessment of structures and infrastructures exposed to wind”, Adv. Eng. Soft., submitted.
[13] F.T. Lombardo, J.A. Main and E. Simiu, “Automated extraction and classification of thunderstorm and non-thunderstorm wind data for extreme-value analysis”, J. Wind Eng. Ind. Aerod., 97, 120-131 (2009).
[14] P. De Gaetano, M.P. Repetto, T. Repetto and G. Solari, “Separation and classification of extreme wind events from anemometric data”, J. Wind Eng. Ind. Aerod., 126, 132-143 (2013).
[15] G. Solari, M. Burlando, P. De Gaetano and M.P. Repetto, “Characteristics of thunderstorms relevant to the wind loading of structures”, Wind Struct., 20, 763-791 (2015).
[16] S. Zhang, M. Burlando, M.P. Repetto and G. Solari, Advances in properties of thunderstorm outflows relevant to the wind loading of structures, Proc. Int. Symp. on Structural Engineering, Beijing, China, 2016.
[17] J.D. Holmes, H.M. Hangan, J.L. Schroeder, C.W. Letchford and K.D. Orwig, “A forensic study of the Lubbock-Reese downdraft of 2002”, Wind Struct., 11, 19-39 (2008).
[18] L. Chen and C.W. Letchford, “A deterministic-stochastic hybrid model of downbursts and its impact on a cantilevered structure”, Eng. Struct., 26, 619-629 (2004).
[19] D.K. Kwon and A. Kareem, “Gust-front factor: New framework for wind load effects on structures”, J. Struct. Eng., ASCE, 135, 717-732 (2009).
[20] Z. Xu Z and H.M Hangan, “Scale, boundary and inlet condition effects on impinging jets”, J. Wind Eng. Ind. Aerod., 96, 2383-2402 (2008).
[21] G. Solari, P. De Gaetano and M.P. Repetto, “Thunderstorm response spectrum: fundamentals and case study”, J. Wind Eng. Ind. Aerod., 143, 62-77 (2015).
[22] G. Solari, “Thunderstorm response spectrum technique: theory and applications”, Eng. Struct., 108, 28-46 (2016).
[23] R.M. Oseguera and R.L. Bowles, A simple analytic 3-dimensional downburst model based on boundary layer stagnation flow, NASA Technical Memorandum 100632, 1988.
[24] D.D. Vicroy, “Assessment of microburst models for downdraft estimation”, J. Aircraft, 29, 1043-1048 (1992).
[25] G.S. Wood and K.C.S. Kwok, An empirically derived estimate for the mean velocity profile of a thunderstorm downburst, Proc. 7th AWES Workshop, Auckland, 1998.
[26] G. Solari and G. Piccardo, “Probabilistic 3-D turbulence modelling for gust buffeting of structures”, Prob. Eng. Mech., 16, 73-86 (2001).
[27] G. Solari, “Equivalent wind spectrum technique: theory and applications”, J. Struct. Eng., ASCE, 114, 1303-1323 (1988).
[28] G. Piccardo and G. Solari, “Generalized equivalent spectrum technique”, Wind Struct., 1, 161-174 (1998).