Embed Size (px)
Citation preview

1
Growth of Aerobic Ripening Bacteria at the Cheese Surface is Limited by the 1
Availability of Iron 2
3
Christophe Monnet1,2*, Alexandre Back1,2, and Françoise Irlinger1,2 4
5
6
7
INRA, UMR782 Génie et Microbiologie des Procédés Alimentaires, 78850 Thiverval-8
Grignon, France,1 and AgroParisTech, UMR782 Génie et Microbiologie des Procédés 9
Alimentaires, 78850 Thiverval-Grignon, France2 10
11
12
Running title: Aerobic Ripening Bacteria 13
14
15
16
17
18
*Corresponding author. Mailing address: 1UMR782 Génie et Microbiologie des Procédés 19
Alimentaires, INRA, AgroParisTech, 78850 Thiverval-Grignon, France. Phone: +33 (0)1 30 20
81 54 91. Fax: +33 (0)1 30 81 55 97. E-mail: [email protected] 21
22
Copyright © 2012, American Society for Microbiology. All Rights Reserved.Appl. Environ. Microbiol. doi:10.1128/AEM.00085-12 AEM Accepts, published online ahead of print on 24 February 2012
on Septem
ber 10, 2018 by guesthttp://aem
.asm.org/
Dow
nloaded from
2
ABSTRACT 23
24
The microflora on the surface of smear-ripened cheeses is composed of various 25
species of bacteria and yeasts that contribute to the production of the desired organoleptic 26
properties. The objective of the present study was to show that iron availability is a limiting 27
factor for the growth of typical aerobic ripening bacteria in cheese. For that purpose, we 28
investigated the effect of iron or siderophore addition in model cheeses that were co-29
inoculated with a yeast and a ripening bacterium. Both iron and the siderophore 30
desferrioxamine B stimulated the growth of ripening bacteria belonging to the genera 31
Arthrobacter, Corynebacterium and Brevibacterium. The extent of stimulation was strain-32
dependent and, generally, the effect of desferrioxamine B was greater than that of iron. 33
Measurements of the expression of genes related to the metabolism of iron by Arthrobacter 34
arilaitensis Re117 by reverse transcription real-time PCR showed that these genes were 35
transcribed during growth in cheese. The addition of desferrioxamine B increased the 36
expression of two genes encoding iron-siderophore ABC transport binding-proteins. The 37
addition of iron decreased the expression of siderophore biosynthesis genes and of part of the 38
genes encoding iron-siderophore ABC transport components. It was concluded that iron 39
availability is a limiting factor for the growth of typical cheese surface bacteria. The selection 40
of strains with efficient iron acquisition systems may be useful for the development of 41
defined-strain surface cultures. Furthermore, the importance of iron metabolism on the 42
microbial ecology of cheeses should be investigated since it may result in positive or negative 43
microbial interactions. 44
45
46
47
48
on Septem
ber 10, 2018 by guesthttp://aem
.asm.org/
Dow
nloaded from

3
INTRODUCTION 49
50
Smear-ripened cheeses such as Livarot, Maroilles, Munster, Limburger and Tilsit are 51
characterized by a complex surface microflora composed of various species of yeasts and 52
bacteria (4, 7, 9, 10). During the first hours of the manufacturing procedure, lactic acid 53
bacteria grow in the milk, resulting in a decrease of pH. This acidification, in combination 54
with the effect of rennet, results in the formation of a coagulum. Fresh curd blocks are then 55
shaped from the curd grains, brined or salted with dry salt, and colonization by acid-tolerant 56
yeasts occurs within a few days. The yeasts increase the pH by assimilating lactate and 57
producing ammonia, thereby favoring the growth of less acid-tolerant ripening bacteria whose 58
concentration may exceed 1010 cfu/g (16). The sources of ripening bacteria are cheese milk, 59
brine baths, ripening room air, wooden shelves on which the cheese rests during ripening, 60
human skin and deliberatively added cultures (18, 25). These bacteria contribute to a large 61
extent to the development of the typical color, flavor and texture of smear-ripened cheeses. 62
Their rapid growth also reduces the risk of contamination with spoilage microorganisms or 63
pathogens such as Listeria monocytogenes (14). A better understanding of the microbial 64
ecology of the surface of smear-ripened cheeses is needed to improve the control of 65
microorganism growth on the surface of smear-ripened cheeses, which could, for example, 66
facilitate the development of appropriate defined-strain surface cultures (6, 8, 18). Noordman 67
et al. (26) reported that Brevibacterium strains of dairy origin produce and/or utilize 68
siderophores, small, high-affinity iron chelating compounds (36) that have been detected in 69
several types of cheeses (27). In co-cultivation experiments, the production of hydroxamate 70
siderophores by a Brevibacterium linens strain strongly stimulated the growth of another 71
Brevibacterium linens strain, which was siderophore-auxotrophic (27). In addition, the study 72
of the genome of two strains that belong to typical species found on the surface of cheeses, 73
on Septem
ber 10, 2018 by guesthttp://aem
.asm.org/
Dow
nloaded from

4
Arthrobacter arilaitensis and Corynebacterium variabile, showed the presence of numerous 74
genes involved in iron acquisition (23, 30). Iron acquisition may thus be instrumental to 75
enable bacteria to grow at the cheese surface. The objective of the present study was to show 76
that iron availability is a limiting factor for the growth of typical surface bacteria in cheese. 77
For that purpose, we investigated the effect of iron and siderophore addition in model cheeses. 78
The present study is also an example of gene expression measurements in cheeses by reverse 79
transcription real-time PCR. Such analyses are increasingly used for a better understanding of 80
the physiology of microorganisms and their expression of beneficial or undesirable properties 81
during cheese production (1, 12, 13, 15, 20, 24, 29, 31, 33, 34). 82
83
84
on Septem
ber 10, 2018 by guesthttp://aem
.asm.org/
Dow
nloaded from

5
MATERIALS AND METHODS 85
86
Strains and growth conditions. The strains used in the present study are listed in 87
Table S1 (supplemental material). All these strains were originally isolated from cheeses. The 88
lactic acid bacteria, Lactococcoccus lactis subsp. lactis S3+, and its protease-negative variant 89
S3-, were routinely grown under static conditions at 30°C in M17 lactose (0.5%) broth (32). 90
The ripening bacteria were grown in 50-ml conical flasks containing 10 ml of brain heart 91
infusion broth (Biokar Diagnostics, Beauvais, France). The yeast, Debaryomyces hansenii 92
304, was grown in 50-ml conical flasks containing 10 ml of potato dextrose broth (Biokar 93
Diagnostics). The ripening bacteria and the yeast strains were incubated for 48 h at 25°C on a 94
rotary shaker at 150 rpm. Two successive cultures inoculated at 1:20 were performed before 95
inoculating the cheese curd. 96
97
Model cheese experiments. Curd production (coagulation, cutting, molding and 98
draining of the curd) was done as previously described (22), except that the commercial 99
starter culture was replaced by a mixture of Lactococcus lactis subsp. lactis S3+ and S3- 100
strains, which were inoculated at a concentration of 2x10⁶ and 4x10⁶ cfu/ml, respectively. 101
These strains were previously grown for 15 h at 30°C in reconstituted skim milk (100 g/l; 102
Difco Laboratories, Detroit, MI, USA) that had been heated for 10 min at 110°C. Fifty-seven 103
ml of a saline solution (92 g/l NaCl) were added to 246 g of curd (pH: ~4.64) under sterile 104
conditions and mixed four times for 10 s at maximum speed using a Waring blender (Fisher 105
Scientific, Elancourt, France). The cultures of the ripening bacteria in brain heart infusion 106
broth were centrifuged for 10 min at 4°C and 3000 x g, and the cell pellets were resuspended 107
in physiological saline and subsequently added to the curd at a final concentration of 108
106 cfu/g. The cheese curd was inoculated with the yeast, Debaryomyces hansenii 304, grown 109
on Septem
ber 10, 2018 by guesthttp://aem
.asm.org/
Dow
nloaded from

6
in potato dextrose broth, but at a final concentration of 104 cfu/g. In some cases, iron (added 110
as a filter-sterilized solution of FeCl3.6H2O), or the siderophore, desferrioxamine B 111
(desferrioxamine mesylate salt; Sigma, St-Quentin-Fallavier, France), were added to the 112
cheese curd at a final concentration of 1 mg of iron or of 50 µmoles of desferrioxamine B per 113
kg of cheese curd. Seventeen grams of inoculated curd were then transferred onto a plastic 114
grid (diameter: 5.3 cm) in sterile crystallizing basins (diameter: 5.6 cm). These model cheeses 115
were incubated for 24 h at 21°C and then at 14°C and 93% relative humidity. Sampling was 116
done at 12 and 16 days, and three separate cheeses were used for each condition. The model 117
cheese system used in the present study is mainly representative of the surface of soft cheeses 118
due to the low thickness of the loaf (approximately 1 cm) 119
120
Microbiological analyses. One g of cheese was mixed with 9 ml of physiological 121
saline (9 g/l NaCl). After dispersion with a mechanical blender (Ultra-Turrax® model T25; 122
Ika Labortechnik, Staufen, Germany) for 1 min at 11,500 rpm, 10-fold serial dilutions were 123
performed in physiological saline and plated in triplicate on agar plates. The ripening bacteria 124
were counted on brain heart infusion agar supplemented with 50 mg/l amphotericin (Biokar 125
Diagnostics), which inhibits the growth of fungi, after three days of incubation at 25°C. The 126
lactic acid bacteria from the starter culture (Lactococcus lactis subsp. lactis S3+ and S3-) 127
were enumerated on deMan-Rogosa-Sharpe agar (MRS, pH 6.5, Biokar Diagnostics) 128
supplemented with 50 mg/l amphotericin after three days of incubation at 30°C under 129
anaerobic conditions. The yeast, Debaryomyces hansenii 304, was counted on yeast extract-130
glucose-chloramphenicol agar (YGCA, Biokar Diagnostics) after three days of incubation at 131
25°C. 132
133
on Septem
ber 10, 2018 by guesthttp://aem
.asm.org/
Dow
nloaded from

7
Extraction of RNA from cheese samples. RNA was extracted from cheeses as 134
previously described (24), except that the amount of cheese processed in each tube was 135
increased to 500 mg, using 7-ml bead-beating tubes that contained 1.6 g of 0.1 mm-diameter 136
zirconium beads (Biospec Products, Bartlesville, OK, USA) and 1.6 g of 0.5 mm-diameter 137
beads. After the addition of 5 ml of TRIzol reagent (Invitrogen, Cergy Pontoise, France), the 138
tubes were vigorously shaken in a bead beater (Precellys®24 Dual, Saint-Quentin-en-139
Yvelines, France) using two 20-s mixing sequences at a speed of 6,500 rpm. The tubes were 140
cooled on ice for 5 min after each mixing. The tubes were then stored at -80°C and the 141
extraction procedure was carried out later. After thawing, the content of the tubes was 142
transferred to 15-ml RNase-free centrifugation tubes, and centrifugation was performed for 10 143
min at 4,000 x g and 4°C. The supernatant (approximately 4,600 µl) was transferred to 15-ml 144
tubes containing a gel that improves separation between the aqueous and organic phases 145
(Phase Lock Gel™ Heavy; Eppendorf, Hamburg, Germany). In some cases, a red layer of 146
approximately 5 mm formed just above the beads. This layer was also transferred. However, 147
the fat layer, which was present at the top the liquid phase, was not transferred. The tubes 148
were incubated for 5 min at room temperature before the addition of 900 µl (20% of the 149
volume of the TRIzol/cheese mixture) of chloroform. They were then shaken for 15 s, 150
incubated for 3 min at room temperature, for 2 min on ice, and centrifuged for 15 min at 3,500 151
x g and 4°C. The aqueous phase (approximately 2,600 µl) was recovered in 15-ml 152
centrifugation tubes, and 2,600 µl (100% of the aqueous phase volume) of 153
phenol/chloroform/isoamyl alcohol (125/24/1; pH 4.7) was added. Tubes were then shaken 154
for 15 s and centrifuged for 10 min at 3,500 x g and 4°C. The aqueous phase (approximately 155
2,000 µl) was recovered in 15-ml RNase-free centrifugation tubes, taking care not to recover 156
any part of the organic phase, and 1,100 µl of absolute ethanol (corresponding to 55% of the 157
volume of the aqueous phase) was added. Seven hundred microliters of the sample was loaded 158
on Septem
ber 10, 2018 by guesthttp://aem
.asm.org/
Dow
nloaded from

8
on RNeasy® spin columns (Qiagen, Courtaboeuf, France), which were then centrifuged for a 159
few seconds at 12,000 x g at room temperature. After elimination of the flowthrough, the 160
remainder of the sample was loaded on the columns and treated in the same way, until the 161
entire sample was used. A total of 350 microliters of RW1 buffer (Qiagen) was loaded on the 162
columns. After 5 min of incubation at room temperature, the tubes were centrifuged for a few 163
seconds at 12,000 x g. The flowthrough was discarded and a second washing step with 350 µl 164
of RW1 buffer was performed. Two washing steps were then performed with 500 µl of RPE 165
buffer (Qiagen) and the tubes were subsequently centrifuged for 1 min in order to eliminate 166
all traces of RPE buffer. The RNA was recovered after the addition of 30 µl of RNase-free 167
water, incubation for 2 min at room temperature, and centrifugation for 1 min. Purified RNA 168
was quantified at 260 nm using a NanoDrop ND-1000 spectrophotometer (NanoDrop 169
Technologies, Wilmington, DE, USA). The quality of the RNA was analyzed with the 2100 170
Bioanalyzer (Agilent, Palo Alto, CA, USA) using RNA 6000 NANO chips according to the 171
manufacturer’s instructions. 172
173
DNase treatment and reverse transcription. The concentration of extracted RNA 174
was adjusted to 125 ng/μl by addition of RNase-free water, and DNase treatment was 175
performed using the TURBO DNA-freeTM kit (Invitrogen) according to the manufacturer’s 176
instructions. Absence of DNA contamination in RNA samples was confirmed with non-177
reverse transcribed samples (minus-RT controls). Reverse transcription was performed using 178
the SuperScript® VILOTM cDNA Synthesis kit (Invitrogen). The reaction mixture contained 179
500 ng of DNase-treated RNA in the final volume of 20 μl. The reverse transcription 180
procedure was performed according to the manufacturer’s recommendations, except that 181
incubation was done for 30 min at 50°C. 182
183
on Septem
ber 10, 2018 by guesthttp://aem
.asm.org/
Dow
nloaded from
9
Real-time PCR. Oligonucleotide primers were designed using LightCycler probe 184
design software (v1.0; Roche Applied Science, Mannheim, Germany) and synthesized by 185
Eurogentec (Seraing, Belgium). The thermocycling program consisted of initial denaturation 186
at 95°C for 8 min, followed by 45 cycles of denaturation (95°C/10 s), annealing (60°C/7 s) 187
and extension (72°C/6 s). Fluorescence acquisition (530 nm) was done at the end of each 188
extension. After real-time PCR, a melting curve analysis was performed by measuring 189
fluorescence during heating from 65 to 95°C at a transition rate of 0.1°C/s. Quantification 190
cycle (Cq) values were determined with LightCycler software (version 3.3), using the second 191
derivative method. Standard curves were generated by plotting Cq values as a function of the 192
log cDNA concentrations. PCR efficiency (E) was calculated for each primer pair from the 193
slopes of the standard curves using the following formula: E=10-1/slope (28). The genes 194
investigated in the present study and the corresponding primer pairs are presented in Table S2 195
(supplemental material). Real-time PCR measurements of each sample were performed using 196
1/10 and 1/20 dilutions of the reverse-transcribed RNA. 197
198
Real-time PCR data analysis. The quantities of RNA targets were normalized to the 199
quantities of internal reference genes. The stability of potential reference genes was evaluated 200
by using the geNorm VBA applet for Microsoft Excel (35). This program calculates the gene 201
expression stability measure (M) for a potential reference gene as the average pairwise 202
variation for that gene with all other tested reference genes. After selection of reference genes, 203
the Cq values for each gene of interest were transformed into relative quantities (Q) with a 204
calibrator (cal) sample and using the gene-specific PCR efficiency (E), calculated as follows: 205
Q = E (calCq – sampleCq). Normalization was then applied by dividing the relative quantities of 206
genes of interest by the geometric mean of the relative quantities of selected reference genes 207
(normalization factor). 208
on Septem
ber 10, 2018 by guesthttp://aem
.asm.org/
Dow
nloaded from

10
RESULTS 209
210
Impact of iron and desferrioxamine B on microorganism growth in a model 211
cheese. Cheese curds were produced using a lactic starter culture and inoculated with 212
Debaryomyces hansenii 304, whose main function is to raise the pH, thereby favoring the 213
growth of acido-sensitive ripening bacteria. The aerobic bacteria that were inoculated belong 214
to the genera Arthrobacter (seven strains), Corynebacterium (five strains) and Brevibacterium 215
(seven strains), and correspond to species frequently found in smear-ripened cheeses. Some 216
cheeses were supplemented with ferric chloride or with the siderophore, desferrioxamine B, 217
which is a bacterial siderophore produced by the actinobacterium Streptomyces pilosus (5). 218
219
The counts of Lactococcus lactis, of Debaryomyces hansenii, and of the ripening 220
bacteria were measured at 12 and 16 days. Addition of iron or desferrioxamine B had no 221
significant effect on the counts of Debaryomyces hansenii (see Table S3 in the supplemental 222
material) and only a limited effect on the counts of Lactococcus lactis (see Table S4 in the 223
supplemental material). In addition, in control cheeses that were not inoculated with ripening 224
bacteria, the addition of iron or desferrioxamine B had no effect on the rate of pH increase 225
(results not shown), which confirmed that these compounds did not stimulate Debaryomyces 226
hansenii. The concentration of ripening bacteria ranged from 8.0x10⁵ to 1.6x10¹⁰ cfu/g at 12 227
days, and from 2.1x10⁷ to 1.9x10¹⁰ cfu/g at 16 days (Table 1). Except for Corynebacterium 228
flavescens Mu128, stimulations resulting from the addition of iron or of desferrioxamine B 229
were observed in counts at 12 or at 16 days. The stimulation was 50-fold for iron at 12 days 230
(Arthrobacter arilaitensis Ep104) and 300-fold for desferrioxamine B at 16 days 231
(Brevibacterium linens ATCC 9172) days (see Table S5 in the supplemental material). 232
on Septem
ber 10, 2018 by guesthttp://aem
.asm.org/
Dow
nloaded from

11
Growth was not monitored after 16 days of ripening because some cheeses became too liquid 233
and passed through the plastic grids. 234
235
Expression of genes related to the metabolism of iron during the growth of 236
Arthrobacter arilaitensis Re117 in cheese. We measured the expression of genes related to 237
the metabolism of iron for Arthrobacter arilaitensis Re117, because its genome sequence is 238
known and stimulation was observed with both iron and desferrioxamine B (10-15-fold) after 239
16 days of ripening. Three separate extractions (technical replicates) of RNA were performed 240
from one control cheese, from one cheese supplemented with iron, and from one cheese 241
supplemented with desferrioxamine B. Capillary electrophoresis analyses showed that most of 242
the RNA was of fungal origin because 16S and 23S RNA peaks were low in comparison to 243
the 18S and 26S peaks (see Fig. S1 in the supplemental material). 244
245
Eight genes involved in different cellular functions (16S rRNA, dnaG, recA, gyrB, 246
ftsZ, rpoA, rpoB and tuf) were evaluated for their potential as good internal standard controls 247
for gene expression experiments. For the nine samples (three repetitions of three conditions), 248
the gene expression stability (M) was measured for the candidate reference genes using the 249
geNorm VBA applet. This method is based on the assumption that two ideal reference genes 250
are expected to have an identical expression ratio in all samples, regardless of the 251
experimental conditions. The genes were ranked according to the M values, with the lowest 252
value indicating the greatest stability. All the genes had M values below 1.5 (between 0.30 253
and 0.61), which is the default limit defined by Vandesompele et al. (35). The combination of 254
the three genes ftsZ, tuf and rpoB was selected since it satisfied the criteria for reliable data 255
normalization, with an average M value of 0.17 (see Fig. S2 in the supplemental material). 256
257
on Septem
ber 10, 2018 by guesthttp://aem
.asm.org/
Dow
nloaded from
12
A remarkable stability of gene expression was observed for most of the housekeeping 258
genes, even for those that were not used as reference genes (Table 2). However, for 16S 259
rRNA, the normalized expression level was higher in the cheeses supplemented with iron 260
(2.57 +/- 0.26) and with desferrioxamine B (4.00 +/- 0.18), compared to the control cheeses. 261
This means that compared to the amount of ribosomes, the basic gene transcription activity of 262
protein-encoding sequences was lower in the samples supplemented with iron or 263
desferrioxamine B. One explanation could be that growth had stopped in these samples, in 264
contrast to the control sample. 265
266
Two clusters of genes involved in the biosynthesis of two different siderophores have 267
been identified in Arthrobacter arilaitensis (23). We chose to measure the expression of the 268
three genes belonging to the first cluster (AARI_09550-09570), which corresponds to a 269
hydroxamate siderophore, and of four of the genes from the second cluster (AARI_32890-270
32920), which corresponds to a catecholate or mixed catecholate-hydroxamate siderophore. 271
The addition of iron repressed the expression of the three genes involved in the biosynthesis 272
of the hydroxamate siderophore (AARI_09550-09570) (Table 2). The normalized expression 273
level was 0.22 for AARI_09570, which means that the abundance of transcripts for this gene 274
was about five times lower in the presence of iron than in the control cheeses. It is likely that 275
this repression occurs via the IdeR (iron-dependent regulator) binding site that is present 276
upstream of AARI_09570. Iron also repressed the four genes (AARI_32890-32920) involved 277
in the biosynthesis of the catecholate siderophore, and the values of the normalized expression 278
level for these genes were similar (from 0.29 to 0.37). This repression probably occurs via the 279
IdeR binding site that is present upstream of AARI_32920. The expression of all of the nine 280
substrate-binding proteins from iron-siderophore ABC transporters identified in the 281
Arthrobacter arilaitensis genome was measured. Iron decreased the expression of four of 282
on Septem
ber 10, 2018 by guesthttp://aem
.asm.org/
Dow
nloaded from

13
theses genes, namely AARI_15020, 26370, 32450 and 32790. Interestingly, an IdeR binding 283
site is present upstream of these genes. The expression of the five other genes possibly 284
involved in the transport of iron that were identified during the genome annotation 285
(AARI_16210, 18090, 26120, 29890 and 30460) was constant. Likewise, iron had no effect 286
on the expression of the IdeR regulator and the ferritin-like protein, AARI_26600. There was 287
thus a good correlation between repression by iron and the presence of IdeR binding sites 288
upstream of the corresponding genes. The mean of the normalized expression level measured 289
for the 11 genes related to iron metabolism and for which an IdeR binding site is present was 290
0.33. The mean value obtained for the 11 other genes related to iron metabolism was 1.17. In 291
summary, iron repressed the expression of the genes involved in siderophore biosynthesis and 292
of some of the iron-siderophore ABC transporters. 293
294
The addition of desferrioxamine B, a hydroxamate siderophore, had no effect on the 295
expression of the four genes (AARI_32890-32920) involved in the biosynthesis of the 296
catecholate siderophore (Table 2) when expression was measured after 16 days of ripening. 297
However, a lower expression level was observed for AARI_09570, which is the first of the 298
three genes involved in the biosynthesis of the hydroxamate siderophore. No major change 299
was observed for the other genes involved in the metabolism of iron, except for the iron-300
siderophore ABC transporter substrate-binding proteins, AARI_03970 and 03980, whose 301
abundance increased about four times. It can therefore be hypothesized that these genes are 302
involved in the transport of the iron-desferrioxamine B complexes. 303
304
The expression of several genes was also measured on the two other biological 305
replicates of cheese samples. These results confirmed that for the genes AARI_32900, 306
AARI_26370 and AARI_32790, which were preceded by IdeR binding sites, the addition of 307
on Septem
ber 10, 2018 by guesthttp://aem
.asm.org/
Dow
nloaded from

14
iron decreased the level of expression (see Table S6 in the supplemental material). A higher 308
expression of AARI_03970 in response to desferrioxamine B addition was also confirmed 309
(see Table S7 in the supplemental material). 310
311
312
313
on Septem
ber 10, 2018 by guesthttp://aem
.asm.org/
Dow
nloaded from
15
DISCUSSION 314
315
In model cheese experiments, the addition of iron or of the siderophore, 316
desferrioxamine B, stimulated the growth of aerobic ripening bacteria belonging to the genera 317
Arthrobacter, Corynebacterium and Brevibacterium. The extent of stimulation was strain-318
dependent and the effect of desferrioxamine B was generally greater than that of iron. We 319
may thus conclude that iron availability is a limiting factor for the growth of typical surface 320
bacteria in cheese. Cheese is a highly iron-restricted medium because bovine milk is low in 321
iron (0.2-0.4 mg/l) (17) and contains lactoferrin, a glycoprotein that has an antibacterial effect, 322
due to its ability to chelate iron (19). In addition, because of the presence of oxygen, iron at 323
the surface of cheese is essentially in the oxidized ferric form, Fe3+, which is extremely 324
insoluble, especially at neutral and basic pH. Diffusional limitations of iron and iron-325
containing compounds may also exist due to the solid cheese matrix. Moreover, available iron 326
may be sequestered by yeast cells (40), the growth of which precedes that of surface bacteria. 327
During the manufacturing of smear-ripened cheeses, several bacterial strains are always 328
present. They originate from cultures that are deliberately added or from other sources. It is 329
likely that the strains that have efficient iron acquisition systems are more competitive than 330
the other strains and may thus become dominant. It is also possible that iron acquisition is at 331
the origin of major interactions between the microorganisms that grow at the surface of 332
cheeses. In fact, siderophores excreted by one strain may be utilized by another strain, whose 333
growth would then be stimulated (26). In contrast, siderophores may also chelate most of the 334
available iron and, as a result, inhibit the growth of strains that are devoid of the 335
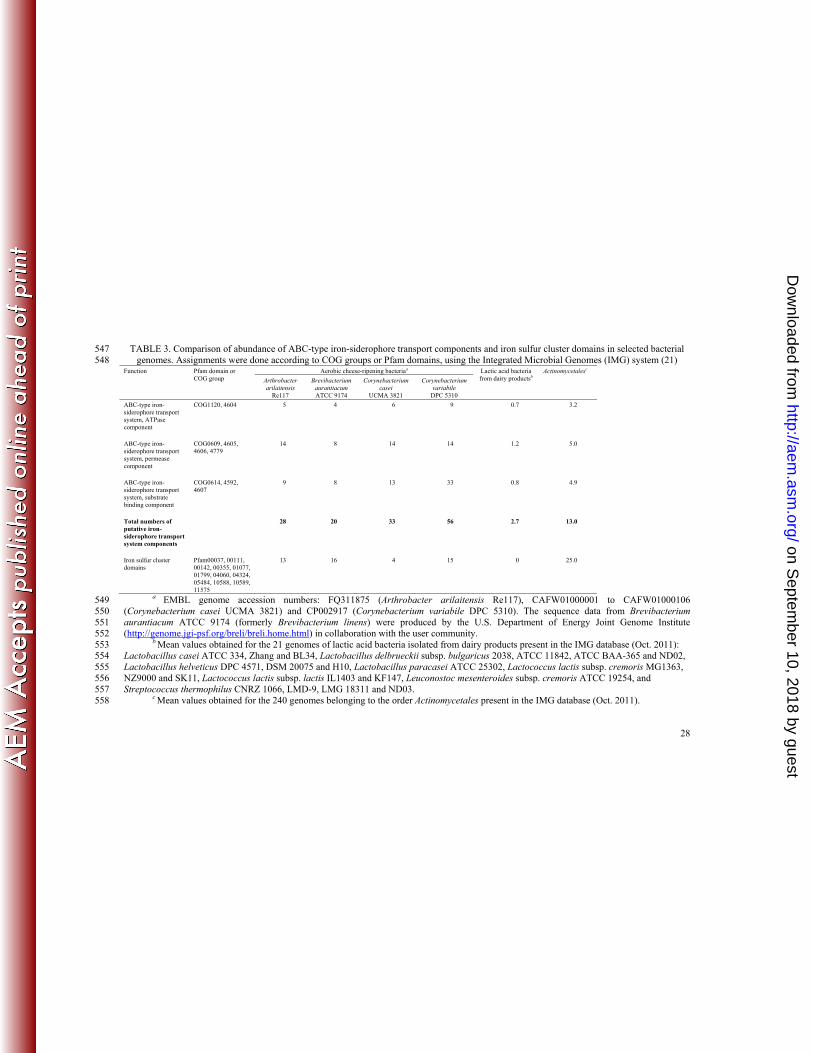
corresponding iron-siderophore transport system (39). The genomes of four aerobic cheese-336
ripening bacteria (including strain Re117), which all belong to the Actinomycetales order, are 337
available in public databases at this time. Interestingly, the number of iron-siderophore 338
on Septem
ber 10, 2018 by guesthttp://aem
.asm.org/
Dow
nloaded from

16
transport system components from the cheese Actinomycetales (from 20 to 56 genes) is 339
greater than the mean number obtained for the other Actinomycetales (Table 3). We suggest 340
that this is due to a strong selective pressure at the cheese surface for strains with efficient 341
iron acquisition systems. Furthermore, the cheese Actinomycetales have fewer proteins with 342
iron-sulfur cluster domains (4-16 vs. 25). One possible explanation is that the low iron 343
availability in cheeses promotes the elimination of proteins requiring iron. In 344
Corynebacterium glutamicum, it has been shown that several genes encoding iron-containing 345
proteins are repressed under iron limitation (38). It is interesting to note that lactic acid 346
bacteria of dairy origin have a small number of iron-siderophore transport system components 347
compared to the cheese Actinomycetales (Table 3). In addition, they seem to be devoid of 348
proteins with iron-sulfur cluster domains. It is well-known that lactic acid bacteria have either 349
no or only limited iron requirements (3, 11), which may explain their ability to grow in iron-350
restricted environments such as milk and the natural gut flora of breast-fed infants (37). 351
However, important energy sources at the surface of cheeses such as lipids, amino acids or 352
lactic acid, which are rarely used by the fermentative lactic acid bacteria, are more effectively 353
catabolized by aerobic microorganisms with iron-requiring respiratory activity. Lactic acid 354
bacteria are thus well-adapted to the inner-cheese environment, whereas there is probably a 355
selective advantage for aerobic strains with efficient iron acquisition systems at the surface. 356
357
The expression of several genes involved in the metabolism of iron by Arthrobacter 358
arilaitensis Re117 was measured by reverse transcription real-time PCR in model cheeses 359
after 16 days of ripening. In the RNA samples recovered from these cheeses, the amount of 360
RNA from Re117 was much lower than that from the yeast, Debaryomyces hansenii 311. In 361
addition, the Re117 counts in the cheeses that were compared (i.e., control cheese and cheeses 362
supplemented with iron or desferrioxamine B) varied up to 15-fold. Despite this, we were able 363
on Septem
ber 10, 2018 by guesthttp://aem
.asm.org/
Dow
nloaded from

17
to find a combination of reference genes that showed remarkable expression stability. This 364
reveals that normalization of reverse transcription real-time PCR data by a combination of 365
housekeeping genes can be appropriate, even for studies in mixed cultures and in complex 366
media such as cheese. Transcripts were detected for all the genes that were investigated, 367
showing that the strain was active at the time of sampling. The addition of iron to the model 368
cheeses decreased the expression of the genes involved in siderophore biosynthesis and of 369
some of the iron-siderophore transport components. IdeR binding sites were present upstream 370
of all the genes that were repressed. This shows that the genes involved in iron acquisition are 371
active during the growth of Arthrobacter arilaitensis Re117 in cheese and that when more 372
iron is available, a regulator, probably IdeR (AARI_05610), decreases the transcription of 373
some of these genes. Repression of siderophore biosynthesis genes when iron is present in 374
excess is well documented in the literature (2). It aims to avoid intracellular accumulation of 375
iron to toxic levels and to limit the consumption of energy needed for the synthesis and 376
transport of siderophores. Except for one gene (AARI_09570), the addition of 377
desferrioxamine B did not decrease the expression of the siderophore biosynthesis genes. 378
However, it increased the expression of the genes encoding two iron-siderophore ABC 379
transporter substrate-binding proteins (AARI_03970 and 03980). It would be interesting to 380
determine if these proteins are involved in the transport of the iron-desferrioxamine B 381
complexes. 382
383
In conclusion, the present study shows that iron availability is a limiting factor for the 384
growth of typical surface bacteria in cheese. The selection of strains with efficient iron 385
acquisition systems may be useful for the development of defined-strain surface cultures. 386
Furthermore, the importance of iron metabolism on the microbial ecology of cheeses should 387
be investigated since it may result in positive or negative microbial interactions. 388
389
on Septem
ber 10, 2018 by guesthttp://aem
.asm.org/
Dow
nloaded from

18
ACKNOWLEDGMENTS 390
391
This work was partly supported by the ExEco (a joint metatranscriptomic and 392
biochemical approach of the cheese ecosystem: for an improved monitoring of the expression 393
of a complex food ecosystem) program (ANR-09-ALIA-012-01), funded by the French 394
National Research Agency (ANR). We thank M.-N. Leclercq-Perlat and F. Lecornué for 395
cheese curd production under aseptic conditions, and M. Renard for her helpful technical 396
assistance. 397
398
399
400
401
on Septem
ber 10, 2018 by guesthttp://aem
.asm.org/
Dow
nloaded from

19
REFERENCES 402
403
1. Ablain, W., S. Hallier Soulier, D. Causeur, M. Gautier, and F. Baron. 2009. A 404
simple and rapid method for the disruption of Staphylococcus aureus, optimized for 405
quantitative reverse transcriptase applications: Application for the examination of 406
Camembert cheese. Dairy Science and Technology 89:69-81. 407
2. Andrews, S. C., A. K. Robinson, and F. Rodriguez-Quinones. 2003. Bacterial iron 408
homeostasis. FEMS Microbiol Rev 27:215-237. 409
3. Archibald, F. 1983. Lactobacillus plantarum, an organism not requiring iron. FEMS 410
Microbiology Letters 19:29-32. 411
4. Beresford, T., and A. Williams. 2004. The microbiology of cheese ripening, p. 287-412
317. In P. F. Fox, P. L. H. McSweeney, T. M. Cogan, and T. P. Guinee (ed.), Cheese: 413
Chemistry, Physics and Microbiology, vol. 1. Elsevier, Amsterdam. 414
5. Bickel, H., R. Bosshardt, E. Gäumann, P. Reusser, E. Vischer, W. Voser, A. 415
Wettstein, and H. Zähner. 1960. Über die isolierung und charakterisierung der 416
ferrioxamine A - F, neuer wuchsstoffe der sideramin-gruppe. Helvetica Chimica Acta 417
43:2118-2128. 418
6. Bockelmann, W. 2002. Development of defined surface starter cultures for the 419
ripening of smear cheeses. International Dairy Journal 12:123-131. 420
7. Bockelmann, W., and W. F. John. 2011. Cheese: smear-ripened cheeses, p. 753-766. 421
In J. W. Fuquay, P. F. Fox, and P. L. H. McSweeney (ed.), Encyclopedia of Dairy 422
Sciences, vol. 1. Academic Press, San Diego. 423
8. Bockelmann, W., K. P. Willems, H. Neve, and K. H. Heller. 2005. Cultures for the 424
ripening of smear cheeses. International Dairy Journal 15:719-732. 425
on Septem
ber 10, 2018 by guesthttp://aem
.asm.org/
Dow
nloaded from

20
9. Brennan, N. M., T. M. Cogan, M. Loessner, and S. Scherer. 2004. Bacterial 426
surface-ripened cheeses, p. 199-225. In P. F. Fox, P. L. H. McSweeney, T. M. Cogan, 427
and T. Guinee (ed.), Cheese: Chemistry, Physics, and Microbiology, vol. 2. Elsevier 428
Academic Press, Amsterdam, the Netherlands. 429
10. Brennan, N. M., A. C. Ward, T. P. Beresford, P. F. Fox, M. Goodfellow, and T. 430
M. Cogan. 2002. Biodiversity of the bacterial flora on the surface of a smear cheese. 431
Applied and Environmental Microbiology 68:820-830. 432
11. Bruyneel, B., M. vande Woestyne, and W. Verstraete. 1989. Lactic acid bacteria: 433
Micro-organisms able to grow in the absence of available iron and copper. 434
Biotechnology Letters 11:401-406. 435
12. Cretenet, M., V. Laroute, V. Ulvé, S. Jeanson, S. Nouaille, S. Even, M. Piot, L. 436
Girbal, Y. Le Loir, P. Loubiere, S. Lortal, and M. Cocaign-Bousquet. 2011. 437
Dynamic analysis of the Lactococcus lactis transcriptome in cheeses made from milk 438
concentrated by ultrafiltration reveals multiple strategies of adaptation to stresses. 439
Appl. Environ. Microbiol. 77:247-257. 440
13. Duquenne, M., I. Fleurot, M. Aigle, C. Darrigo, E. Borezee-Durant, S. Derzelle, 441
M. Bouix, V. Deperrois-Lafarge, and A. Delacroix-Buchet. 2010. Tool for 442
quantification of staphylococcal enterotoxin gene expression in cheese. Appl. Environ. 443
Microbiol. 76:1367-1374. 444
14. Eppert, I., N. Valdès-Stauber, H. Götz, M. Busse, and S. Scherer. 1997. Growth 445
reduction of Listeria spp. caused by undefined industrial red smear cheese cultures and 446
bacteriocin-producing Brevibacterium linens as evaluated in situ on soft cheese. 447
Applied and Environmental Microbiology 63:4812-4817. 448
15. Falentin, H., F. Postollec, S. Parayre, N. Henaff, P. Le Bivic, R. Richoux, A. 449
Thierry, and D. Sohier. 2010. Specific metabolic activity of ripening bacteria 450
on Septem
ber 10, 2018 by guesthttp://aem
.asm.org/
Dow
nloaded from

21
quantified by real-time reverse transcription PCR throughout Emmental cheese 451
manufacture. International Journal of Food Microbiology 144:10-19. 452
16. Feurer, C., F. Irlinger, H. E. Spinnler, P. Glaser, and T. Vallaeys. 2004. 453
Assessment of the rind microbial diversity in a farm house-produced vs a pasteurized 454
industrially produced soft red-smear cheese using both cultivation and rDNA-based 455
methods. Journal of Applied Microbiology 97:546-556. 456
17. Gaucheron, F., Y. Le Graet, K. Raulot, and M. Piot. 1997. Physicochemical 457
characterization of iron-supplemented skim milk. International Dairy Journal 7:141-458
148. 459
18. Hannon, J. A., M. J. Sousa, S. Lillevang, A. Sepulchre, W. Bockelmann, and P. L. 460
H. McSweeney. 2004. Effect of defined-strain surface starters on the ripening of Tilsit 461
cheese. International Dairy Journal 14:871-880. 462
19. Jenssen, H., and R. E. Hancock. 2009. Antimicrobial properties of lactoferrin. 463
Biochimie 91:19-29. 464
20. La Gioia, F., L. Rizzotti, F. Rossi, F. Gardini, G. Tabanelli, and S. Torriani. 2011. 465
Identification of a tyrosine decarboxylase gene (tdcA) in Streptococcus thermophilus 466
1TT45 and analysis of its expression and tyramine production in milk. Appl. Environ. 467
Microbiol. 77:1140-1144. 468
21. Markowitz, V. M., I. M. A. Chen, K. Palaniappan, K. Chu, E. Szeto, Y. Grechkin, 469
A. Ratner, I. Anderson, A. Lykidis, K. Mavromatis, N. N. Ivanova, and N. C. 470
Kyrpides. 2009. The integrated microbial genomes system: an expanding comparative 471
analysis resource. Nucleic Acids Research. 472
22. Monnet, C., A. Bleicher, K. Neuhaus, A.-S. Sarthou, M.-N. Leclercq-Perlat, and 473
F. Irlinger. 2010. Assessment of the anti-listerial activity of microfloras from the 474
surface of smear-ripened cheeses. Food Microbiology 27:302-310. 475
on Septem
ber 10, 2018 by guesthttp://aem
.asm.org/
Dow
nloaded from

22
23. Monnet, C., V. Loux, J.-F. Gibrat, E. Spinnler, V. Barbe, B. Vacherie, F. Gavory, 476
E. Gourbeyre, P. Siguier, M. Chandler, R. Elleuch, F. Irlinger, and T. Vallaeys. 477
2010. The Arthrobacter arilaitensis Re117 genome sequence reveals its genetic 478
adaptation to the surface of cheese. PLoS ONE 5:e15489. 479
24. Monnet, C., V. Ulvé, A.-S. Sarthou, and F. Irlinger. 2008. Extraction of RNA from 480
cheese without prior separation of microbial cells. Applied and Environmental 481
Microbiology 74:5724-5730. 482
25. Mounier, J., S. Goerges, R. Gelsomino, M. Vancanneyt, K. Vandemeulebroecke, 483
B. Hoste, N. M. Brennan, S. Scherer, J. Swings, G. F. Fitzgerald, and T. M. 484
Cogan. 2006. Sources of the adventitious microflora of a smear-ripened cheese. 485
Journal of Applied Microbiology 101:668-681. 486
26. Noordman, W. H., R. Reissbrodt, R. S. Bongers, J. L. W. Rademaker, W. 487
Bockelmann, and G. Smit. 2006. Growth stimulation of Brevibacterium sp. by 488
siderophores. Journal of Applied Microbiology 101:637-646. 489
27. Ong, S. A., and J. B. Neilands. 1979. Siderophores in microbially processed cheese. 490
Journal of Agricultural and Food Chemistry 27:990-995. 491
28. Pfaffl, M. W. 2004. Quantification strategies in real-time PCR, p. 87-112. In S. A. 492
Bustin (ed.), A-Z of quantitative PCR. International University Line, La Jolla. 493
29. Rossi, F., F. Gardini, L. Rizzotti, F. La Gioia, G. Tabanelli, and S. Torriani. 2011. 494
Quantitative analysis of histidine decarboxylase gene (hdcA) transcription and 495
histamine production by Streptococcus thermophilus PRI60 under conditions relevant 496
to cheese making. Appl. Environ. Microbiol. 77:2817-2822. 497
30. Schroeder, J., I. Maus, E. Trost, and A. Tauch. 2011. Complete genome sequence 498
of Corynebacterium variabile DSM 44702 isolated from the surface of smear-ripened 499
on Septem
ber 10, 2018 by guesthttp://aem
.asm.org/
Dow
nloaded from

23
cheeses and insights into cheese ripening and flavor generation. BMC Genomics 500
12:545. 501
31. Taïbi, A., N. Dabour, M. Lamoureux, D. Roy, and G. LaPointe. 2011. 502
Comparative transcriptome analysis of Lactococcus lactis subsp. cremoris strains 503
under conditions simulating Cheddar cheese manufacture. International Journal of 504
Food Microbiology 146:263-275. 505
32. Terzaghi, B. E., and W. E. Sandine. 1975. Improved medium for lactic streptococci 506
and their bacteriophages. Applied Microbiology 29:807-813. 507
33. Trmcic, A., C. Monnet, I. Rogelj, and B. Bogovic Matijasic. 2011. Expression of 508
nisin genes in cheese--A quantitative real-time polymerase chain reaction approach. 509
Journal of Dairy Science 94:77-85. 510
34. Ulvé, V. M., C. Monnet, F. Valence, J. Fauquant, H. Falentin, and S. Lortal. 511
2008. RNA extraction from cheese for analysis of in situ gene expression of 512
Lactococcus lactis. Journal of Applied Microbiology 105:1327-1333. 513
35. Vandesompele, J., K. De Preter, F. Pattyn, B. Poppe, N. Van Roy, A. De Paepe, 514
and F. Speleman. 2002. Accurate normalization of real-time quantitative RT-PCR 515
data by geometric averaging of multiple internal control genes. Genome Biology 516
3:0034.1-0034.11. 517
36. Wandersman, C., and P. Delepelaire. 2004. Bacterial iron sources: from 518
siderophores to hemophores. Annual Review of Microbiology 58:611-647. 519
37. Weinberg, E. D. 1997. The Lactobacillus anomaly: total iron abstinence. Perspect 520
Biol Med 40:578-583. 521
38. Wennerhold, J., A. Krug, and M. Bott. 2005. The AraC-type regulator RipA 522
represses aconitase and other iron proteins from Corynebacterium under iron 523
limitation and is itself repressed by DtxR. J Biol Chem 280:40500-40508. 524
on Septem
ber 10, 2018 by guesthttp://aem
.asm.org/
Dow
nloaded from

24
39. Winkelmann, G. 2004. Ecology of siderophores, p. 437-450. In J. H. Crosa, A. R. 525
Mey, and S. M. Payne (ed.), Iron transport in bacteria. ASM Press, Washington, D. C. 526
40. Winkelmann, G. 2007. Ecology of siderophores with special reference to the fungi. 527
Biometals 20:379-92. 528
529
530
on Septem
ber 10, 2018 by guesthttp://aem
.asm.org/
Dow
nloaded from

25
TABLE 1. Effect of the addition of iron and desferrioxamine B on the counts of ripening bacteria in the model cheeses. The cheese curds were 531 inoculated with a yeast (Debaryomyces hansenii) and different strains of aerobic ripening bacteria. The values are the means of three biological 532 replicates (separate cheeses). Values in bold correspond to significant differences (Student test, P < 0.05) between the cheeses supplemented 533
with iron or desferrioxamine B and the corresponding control cheeses. SD = Standard deviation. 534 535
Aerobic ripening bacteria:
Ripening bacteria at 12 days (cfu/g)
Ripening bacteria at 16 days (cfu/g)
Control
+ Iron
+ Desferrio-
xamine B
Control
+ Iron
+ Desferrio-
xamine B Mean SD Mean SD Mean SD Mean SD Mean SD Mean SD
A. arilaitensis 3M03 1.7E+09 7.8E+08 5.9E+09 1.9E+09 5.9E+09 1.9E+09 8.5E+09 3.6E+09 1.3E+10 3.0E+09 1.5E+10 7.7E+09
A. arilaitensis Mu107 1.0E+08 3.9E+07 1.2E+08 6.8E+07 2.6E+09 9.2E+08 1.1E+09 3.4E+08 7.7E+09 3.0E+09 3.6E+09 1.0E+09
A. arilaitensis Ma107 1.9E+08 8.4E+07 3.8E+09 1.1E+09 3.9E+09 1.7E+09 1.3E+09 4.3E+08 6.4E+09 2.0E+09 5.2E+09 1.6E+09
A. arilaitensis GMPA29 7.1E+07 2.4E+07 5.4E+08 2.1E+08 1.6E+10 6.9E+09 2.2E+09 6.5E+08 8.1E+09 2.3E+09 6.0E+09 1.6E+09
A. arilaitensis 2L34 1.3E+08 4.9E+07 1.2E+09 4.9E+08 2.8E+09 1.2E+09 7.9E+08 2.6E+08 6.3E+09 2.7E+09 9.5E+09 3.1E+09
A. arilaitensis Ep104 2.0E+07 7.2E+06 9.2E+08 1.1E+08 1.6E+09 3.4E+08 4.0E+08 2.4E+08 5.2E+09 1.7E+09 4.0E+09 1.2E+09
A. arilaitensis Re117 7.3E+07 1.0E+07 2.3E+08 6.0E+07 8.8E+08 1.6E+08 3.8E+08 1.0E+08 4.1E+09 1.6E+09 5.6E+09 1.1E+09
C. casei DPC 5298 8.0E+05 3.3E+05 1.1E+07 4.2E+06 4.6E+07 4.1E+06 1.8E+08 1.0E+08 8.8E+08 3.2E+08 5.9E+08 1.5E+08
C. casei UCMA 3821 7.8E+07 5.8E+06 3.5E+08 1.0E+08 8.5E+07 2.5E+07 8.9E+08 3.2E+08 1.3E+09 5.0E+08 2.7E+09 6.2E+08
C. variabile DPC 5310 1.4E+08 2.7E+07 2.8E+08 9.9E+07 1.6E+09 7.4E+08 3.2E+08 6.5E+07 8.5E+08 3.0E+08 4.8E+09 2.2E+09
C. variabile Mu133 2.4E+08 7.8E+07 5.7E+08 3.4E+08 5.9E+09 2.0E+09 4.1E+08 2.4E+08 2.4E+09 9.2E+08 6.1E+09 2.6E+09
C. flavescens Mu128 8.2E+08 4.6E+08 1.3E+09 6.7E+08 1.4E+09 5.9E+08 2.7E+09 7.4E+08 3.2E+09 9.0E+08 2.3E+09 1.3E+09
B. aurantiacum BLE3 4.1E+07 2.3E+07 1.6E+08 5.1E+07 1.2E+09 4.8E+08 3.9E+09 3.3E+09 3.7E+09 2.1E+09 4.7E+09 1.9E+09
B. aurantiacum ATCC 9174 5.7E+07 2.4E+07 2.5E+07 1.3E+07 4.4E+08 1.4E+08 1.8E+09 1.0E+09 7.1E+09 2.1E+09 1.9E+10 5.6E+09
B. aurantiacum ATCC 9175 3.5E+08 1.8E+08 7.9E+08 3.9E+08 2.6E+09 9.9E+08 3.5E+09 2.0E+09 8.2E+09 2.7E+09 7.2E+09 3.2E+09
B. aurantiacum BA171 3.4E+08 1.8E+08 1.2E+09 2.1E+08 1.1E+09 3.4E+08 1.1E+10 5.3E+09 1.1E+10 4.7E+09 1.4E+10 4.7E+09
B. aurantiacum 2M23 5.0E+06 3.0E+06 3.5E+07 4.6E+06 3.7E+08 1.4E+08 5.7E+07 1.9E+07 2.2E+09 5.8E+08 1.2E+10 3.4E+09
B. antiquum 918 1.1E+08 3.2E+07 4.5E+08 2.0E+08 3.4E+09 1.1E+09 2.3E+09 6.8E+08 3.6E+09 1.4E+09 9.3E+09 3.3E+09
B. linens ATCC 9172 7.7E+06 9.9E+05 1.2E+07 5.0E+06 1.5E+09 2.7E+08 2.1E+07 1.2E+07 2.5E+08 7.4E+07 6.1E+09 2.6E+09
536 537
on Septem
ber 10, 2018 by guesthttp://aem
.asm.org/
Dow
nloaded from

26
TABLE 2. Effect of iron or desferrioxamine B (siderophore) addition on the expression of Arthrobacter arilaitensis Re117 genes in model 538 cheeses after 16 days of ripening. Values are the means obtained from three separate RNA extractions (technical replicates) of a control cheese 539
and of a cheese supplemented with 1 mg of iron or with 50 µmoles of desferrioxamine B per kg. 540 541 Gene Product IdeR binding sitea NELb iron NELb desferrioxamine B Mean SD Mean SD ribosomal RNA:
16S rRNA (AARI_36310, 36340, 36380, 36520, 36580 and 36690)
16S ribosomal RNA no 2.57 0.26 4.00 0.18
Housekeeping genes:
dnaG (AARI_09340) DNA primase no 1.51 0.19 2.16 0.13
recA (ARI_11010) RecA bacterial DNA recombination protein no 1.24 0.08 1.35 0.04
gyrB (AARI_20200) putative DNA gyrase subunit B no 1.19 0.20 1.52 0.23
ftsZ (AARI_20710) cell division protein FtsZ no 1.01 0.11 1.12 0.06
rpoA (AARI_23210) DNA-directed RNA polymerase alpha chain no 0.95 0.27 1.33 0.44
rpoB (AARI_23600) DNA-directed RNA polymerase beta chain no 0.94 0.04 0.94 0.01
tuf (AARI_23550) Elongation factor Tu no 1.06 0.07 0.95 0.05
Siderophore biosynthesis genes:
Hydroxamate:
AARI_09550 siderophore biosynthesis protein upstream AARI_09570 0.46 0.10 0.85 0.07
AARI_09560 L-lysine 6-monooxygenase (NADPH), EC 1.14.13.59 upstream AARI_09570 0.29 0.04 0.86 0.19
AARI_09570 pyridoxal-dependent amino acid decarboxylase upstream AARI_09570 0.22 0.04 0.31 0.08
Catecholate:
AARI_32890 non-ribosomal siderophore peptide synthetase component, EC 2.7.7.58 upstream AARI_32920 0.32 0.03 1.44 0.19
AARI_32900 isochorismate synthase, EC 5.4.4.2 upstream AARI_32920 0.31 0.01 1.32 0.07
AARI_32910 2,3-dihydro-2.3-dihydroxybenzoate dehydrogenase, EC 1.3.1.28 upstream AARI_32920 0.29 0.04 1.26 0.09
AARI_32920 isochorismatase, EC 3.3.2.1 upstream AARI_32920 0.37 0.17 1.32 0.15
iron/siderophore binding proteins:
AARI_02870 iron-siderophore ABC transporter, substrate-binding protein no 0.84 0.15 2.10 0.30
AARI_03970 iron-siderophore ABC transporter, substrate-binding protein no 1.49 0.31 3.99 0.46
AARI_03980 iron-siderophore ABC transporter, substrate-binding protein no 1.24 0.21 4.45 0.43
AARI_10870 iron-siderophore ABC transporter, substrate-binding protein no 0.79 0.40 1.22 0.40
AARI_15020 iron-siderophore ABC transporter, substrate-binding protein upstream AARI_15020 0.35 0.03 0.67 0.04
AARI_26370 iron-siderophore ABC transporter, substrate-binding protein upstream AARI_26370 0.28 0.03 0.96 0.02
AARI_30210 iron-siderophore ABC transporter, substrate-binding protein no 1.85 0.04 1.66 0.17
AARI_32450 iron-siderophore ABC transporter, substrate-binding protein upstream AARI_32450 0.34 0.02 0.74 0.08
AARI_32790 iron-siderophore ABC transporter, substrate-binding protein upstream AARI_32790 0.40 0.03 0.90 0.16
Other possible iron transporters:
AARI_16210 putative divalent metal ion transporter no 1.16 0.20 1.57 0.09
on Septem
ber 10, 2018 by guesthttp://aem
.asm.org/
Dow
nloaded from

27
AARI_18090 metal ion transporter no 1.13 0.14 1.08 0.03
AARI_26120 iron/manganese/zinc ABC transporter, substrate-binding protein no 0.85 0.123 1.00 0.15
AARI_29890 and 30460 (duplication) iron/manganese/zinc ABC transporter, substrate-binding protein no 1.00 0.05 0.85 0.05
Other genes related to iron metabolism:
ideR (AARI_05610) iron-dependent repressor IdeR no 1.14 0.07 1.60 0.03
AARI_26600 ferritin-like protein no 1.37 0.48 1.66 0.59 a Iron-dependent regulator binding site. Consensus sequence TTAGGTTAGGCTAACCTAA, up to five mismatches allowed. 542
b Normalized Expression Level: Expression of the considered gene in the cheese supplemented with iron or desferrioxamine B, divided by the expression in the control cheese 543 (calibrator), using ftsZ, tuf and rpoB as reference genes. 544
545 546
on Septem
ber 10, 2018 by guesthttp://aem
.asm.org/
Dow
nloaded from
28
TABLE 3. Comparison of abundance of ABC-type iron-siderophore transport components and iron sulfur cluster domains in selected bacterial 547 genomes. Assignments were done according to COG groups or Pfam domains, using the Integrated Microbial Genomes (IMG) system (21) 548
Function Pfam domain or COG group
Aerobic cheese-ripening bacteriaa Lactic acid bacteria from dairy productsb
Actinomycetalesc
Arthrobacter arilaitensis
Re117
Brevibacterium aurantiacum ATCC 9174
Corynebacterium casei
UCMA 3821
Corynebacterium variabile
DPC 5310
ABC-type iron-siderophore transport system, ATPase component
COG1120, 4604 5 4 6 9 0.7 3.2
ABC-type iron-siderophore transport system, permease component
COG0609, 4605, 4606, 4779
14 8 14 14 1.2 5.0
ABC-type iron-siderophore transport system, substrate binding component
COG0614, 4592, 4607
9 8 13 33 0.8 4.9
Total numbers of putative iron-siderophore transport system components
28 20 33 56 2.7 13.0
Iron sulfur cluster domains
Pfam00037, 00111, 00142, 00355, 01077, 01799, 04060, 04324, 05484, 10588, 10589, 11575
13 16 4 15 0 25.0
a EMBL genome accession numbers: FQ311875 (Arthrobacter arilaitensis Re117), CAFW01000001 to CAFW01000106 549 (Corynebacterium casei UCMA 3821) and CP002917 (Corynebacterium variabile DPC 5310). The sequence data from Brevibacterium 550 aurantiacum ATCC 9174 (formerly Brevibacterium linens) were produced by the U.S. Department of Energy Joint Genome Institute 551 (http://genome.jgi-psf.org/breli/breli.home.html) in collaboration with the user community. 552
b Mean values obtained for the 21 genomes of lactic acid bacteria isolated from dairy products present in the IMG database (Oct. 2011): 553 Lactobacillus casei ATCC 334, Zhang and BL34, Lactobacillus delbrueckii subsp. bulgaricus 2038, ATCC 11842, ATCC BAA-365 and ND02, 554 Lactobacillus helveticus DPC 4571, DSM 20075 and H10, Lactobacillus paracasei ATCC 25302, Lactococcus lactis subsp. cremoris MG1363, 555 NZ9000 and SK11, Lactococcus lactis subsp. lactis IL1403 and KF147, Leuconostoc mesenteroides subsp. cremoris ATCC 19254, and 556 Streptococcus thermophilus CNRZ 1066, LMD-9, LMG 18311 and ND03. 557
c Mean values obtained for the 240 genomes belonging to the order Actinomycetales present in the IMG database (Oct. 2011). 558
on Septem
ber 10, 2018 by guesthttp://aem
.asm.org/
Dow
nloaded from