Embed Size (px)
Citation preview
Economic Impact of the Defence and Security Industry in Canada May, 2012
ADVISORY SERVICES
kpmg.ca

Economic Impact of the Defence and Security Industry in Canada i
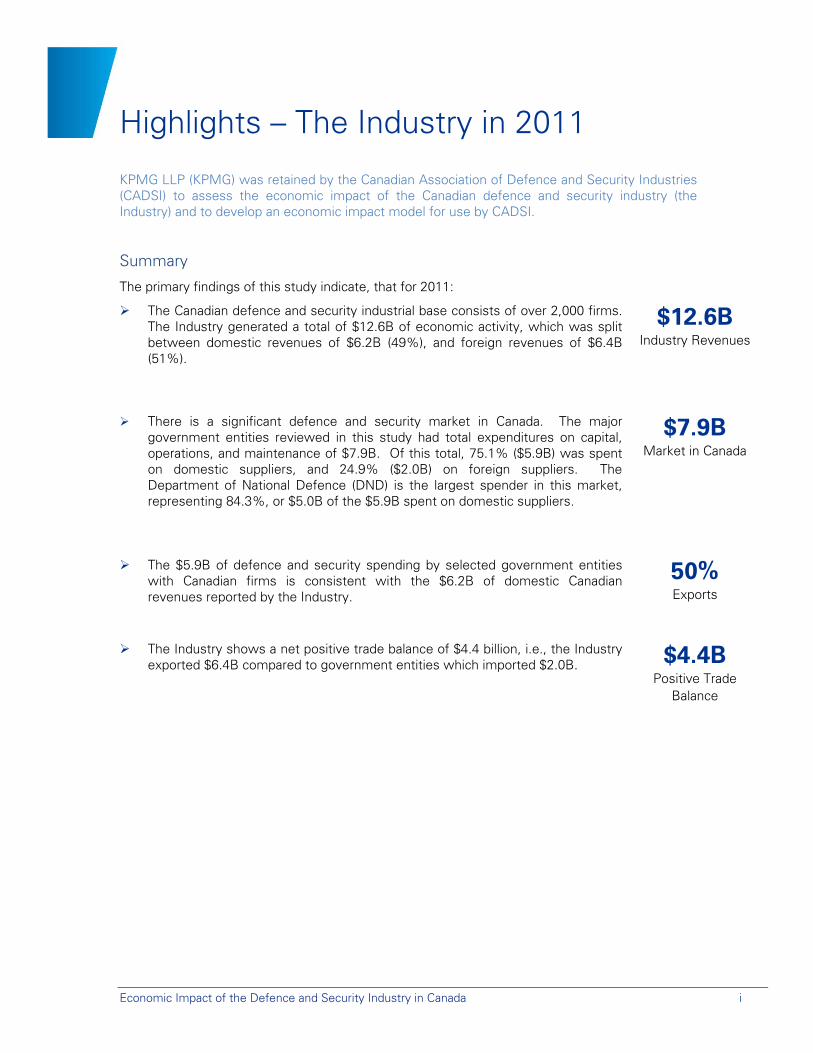
Highlights – The Industry in 2011
KPMG LLP (KPMG) was retained by the Canadian Association of Defence and Security Industries (CADSI) to assess the economic impact of the Canadian defence and security industry (the Industry) and to develop an economic impact model for use by CADSI.
Summary
The primary findings of this study indicate, that for 2011:
The Canadian defence and security industrial base consists of over 2,000 firms. The Industry generated a total of $12.6B of economic activity, which was split between domestic revenues of $6.2B (49%), and foreign revenues of $6.4B (51%).
$12.6B
Industry Revenues
There is a significant defence and security market in Canada. The major government entities reviewed in this study had total expenditures on capital, operations, and maintenance of $7.9B. Of this total, 75.1% ($5.9B) was spent on domestic suppliers, and 24.9% ($2.0B) on foreign suppliers. The Department of National Defence (DND) is the largest spender in this market, representing 84.3%, or $5.0B of the $5.9B spent on domestic suppliers.
$7.9B Market in Canada
The $5.9B of defence and security spending by selected government entities with Canadian firms is consistent with the $6.2B of domestic Canadian revenues reported by the Industry.
50% Exports
The Industry shows a net positive trade balance of $4.4 billion, i.e., the Industry exported $6.4B compared to government entities which imported $2.0B. $4.4B
Positive Trade Balance
Economic Impact of the Defence and Security Industry in Canada ii
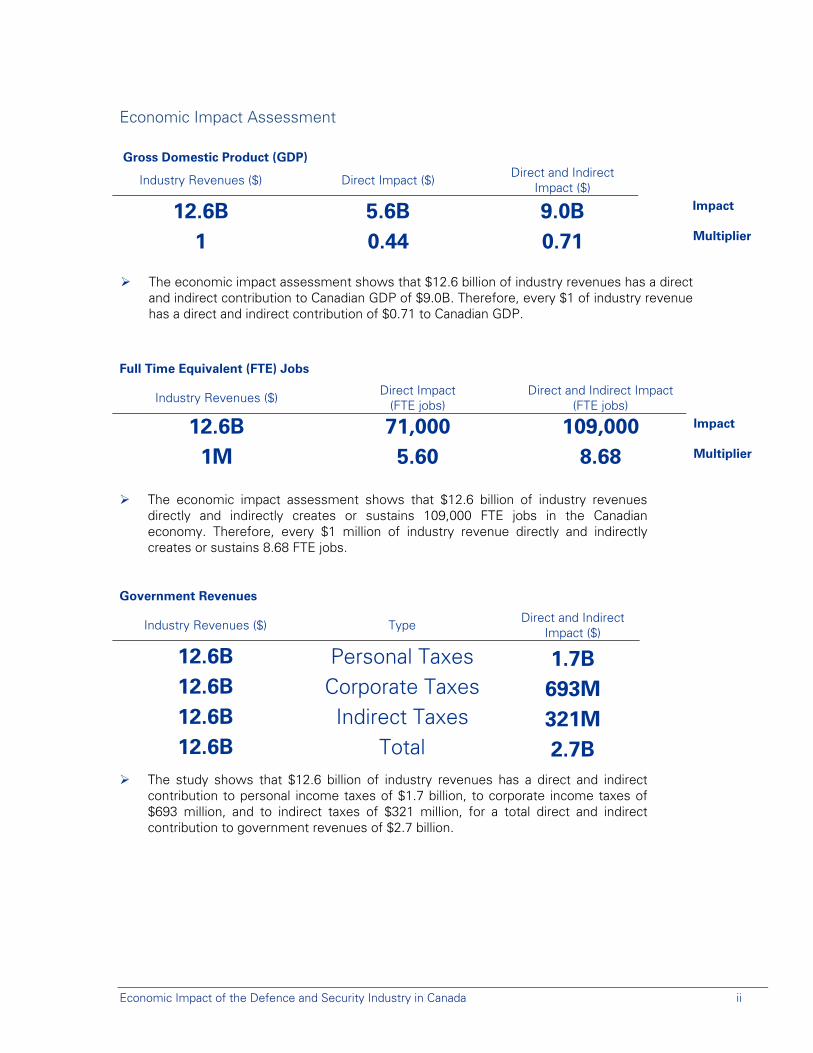
Economic Impact Assessment Gross Domestic Product (GDP)
Industry Revenues ($) Direct Impact ($) Direct and Indirect
Impact ($)
12.6B 5.6B 9.0B Impact
1 0.44 0.71 Multiplier
The economic impact assessment shows that $12.6 billion of industry revenues has a direct
and indirect contribution to Canadian GDP of $9.0B. Therefore, every $1 of industry revenue has a direct and indirect contribution of $0.71 to Canadian GDP.
Full Time Equivalent (FTE) Jobs
Industry Revenues ($) Direct Impact (FTE jobs)
Direct and Indirect Impact (FTE jobs)
12.6B 71,000 109,000 Impact
1M 5.60 8.68 Multiplier
The economic impact assessment shows that $12.6 billion of industry revenues
directly and indirectly creates or sustains 109,000 FTE jobs in the Canadian economy. Therefore, every $1 million of industry revenue directly and indirectly creates or sustains 8.68 FTE jobs.
Government Revenues
Industry Revenues ($) Type Direct and Indirect Impact ($)
12.6B Personal Taxes 1.7B 12.6B Corporate Taxes 693M 12.6B Indirect Taxes 321M 12.6B Total 2.7B
The study shows that $12.6 billion of industry revenues has a direct and indirect contribution to personal income taxes of $1.7 billion, to corporate income taxes of $693 million, and to indirect taxes of $321 million, for a total direct and indirect contribution to government revenues of $2.7 billion.
Economic Impact of the Defence and Security Industry in Canada iii
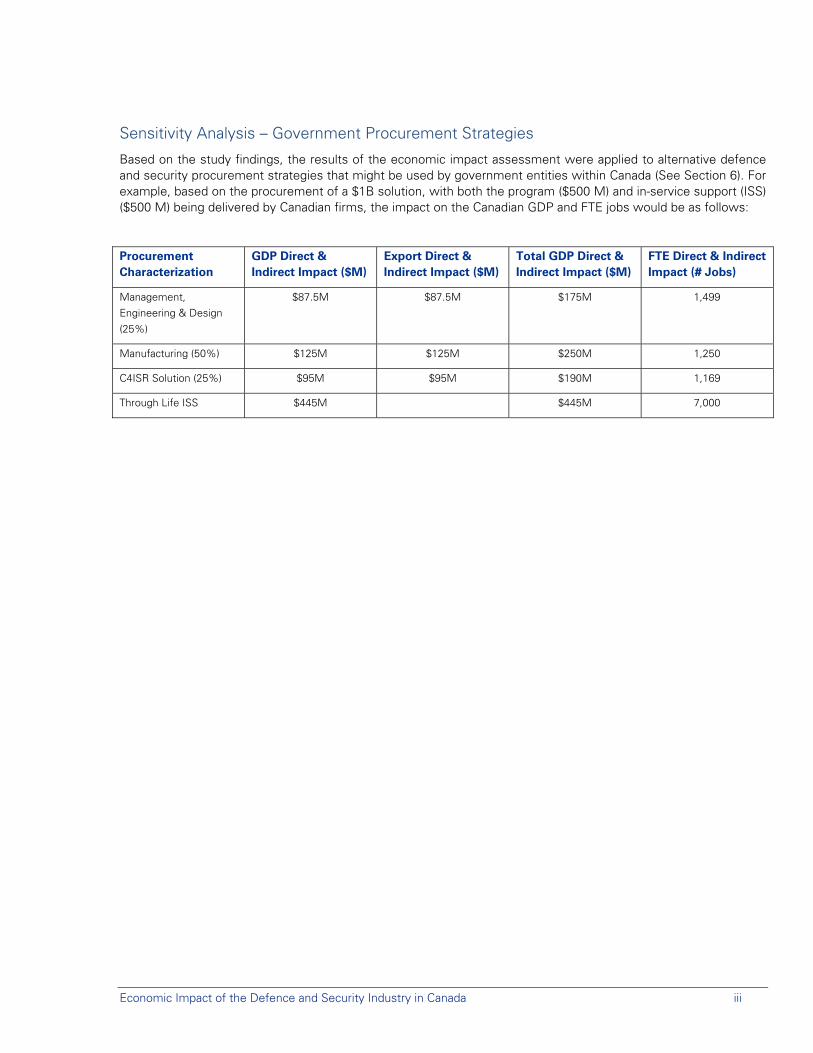
Sensitivity Analysis – Government Procurement Strategies
Based on the study findings, the results of the economic impact assessment were applied to alternative defence and security procurement strategies that might be used by government entities within Canada (See Section 6). For example, based on the procurement of a $1B solution, with both the program ($500 M) and in-service support (ISS) ($500 M) being delivered by Canadian firms, the impact on the Canadian GDP and FTE jobs would be as follows:
Procurement Characterization
GDP Direct & Indirect Impact ($M)
Export Direct & Indirect Impact ($M)
Total GDP Direct & Indirect Impact ($M)
FTE Direct & Indirect Impact (# Jobs)
Management, Engineering & Design (25%)
$87.5M $87.5M $175M 1,499
Manufacturing (50%) $125M $125M $250M 1,250
C4ISR Solution (25%) $95M $95M $190M 1,169
Through Life ISS $445M $445M 7,000
Economic Impact of the Defence and Security Industry in Canada iv
Table of Contents
Highlights – The Industry in 2011 i
Glossary and Definitions v
1. Introduction 1
2. The Canadian Market 2
3. The Canadian Industry 4
4. Economic Impact of the Industry 7
5. Trade Balance 12
6. Sensitivity Analysis - Government Procurement Strategies 13
7. Summary and Conclusion 14
Appendix A – Economic Impact Model 15
Appendix B – Economic Activity Inputs 16
Appendix C - Validation of Input Data 17
Appendix D – Economic Impact Assessment 23
Appendix E – Survey Methodology 30
Appendix F – Survey Questionnaire 35
Economic Impact of the Defence and Security Industry in Canada v
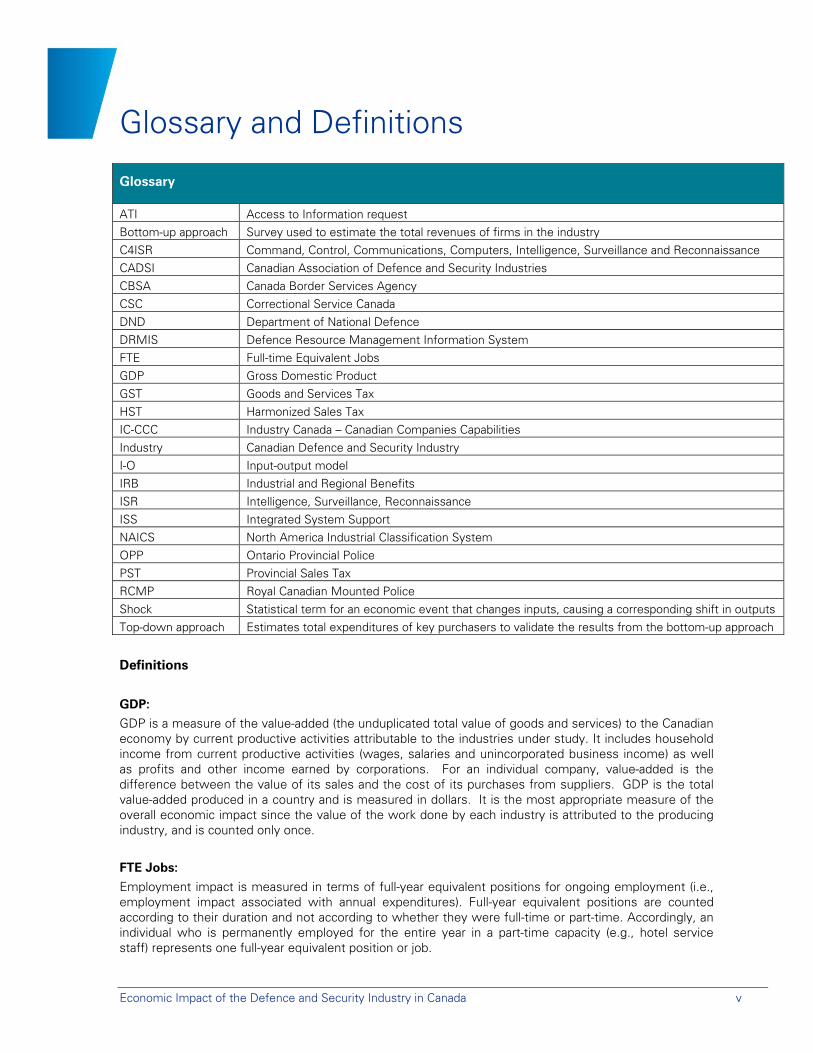
Glossary and Definitions
Glossary
ATI Access to Information request Bottom-up approach Survey used to estimate the total revenues of firms in the industry C4ISR Command, Control, Communications, Computers, Intelligence, Surveillance and Reconnaissance CADSI Canadian Association of Defence and Security Industries CBSA Canada Border Services Agency CSC Correctional Service Canada DND Department of National Defence DRMIS Defence Resource Management Information System FTE Full-time Equivalent Jobs GDP Gross Domestic Product GST Goods and Services Tax HST Harmonized Sales Tax IC-CCC Industry Canada – Canadian Companies Capabilities Industry Canadian Defence and Security Industry I-O Input-output model IRB Industrial and Regional Benefits ISR Intelligence, Surveillance, Reconnaissance ISS Integrated System Support NAICS North America Industrial Classification System OPP Ontario Provincial Police PST Provincial Sales Tax RCMP Royal Canadian Mounted Police Shock Statistical term for an economic event that changes inputs, causing a corresponding shift in outputs Top-down approach Estimates total expenditures of key purchasers to validate the results from the bottom-up approach
Definitions
GDP:
GDP is a measure of the value-added (the unduplicated total value of goods and services) to the Canadian economy by current productive activities attributable to the industries under study. It includes household income from current productive activities (wages, salaries and unincorporated business income) as well as profits and other income earned by corporations. For an individual company, value-added is the difference between the value of its sales and the cost of its purchases from suppliers. GDP is the total value-added produced in a country and is measured in dollars. It is the most appropriate measure of the overall economic impact since the value of the work done by each industry is attributed to the producing industry, and is counted only once.
FTE Jobs:
Employment impact is measured in terms of full-year equivalent positions for ongoing employment (i.e., employment impact associated with annual expenditures). Full-year equivalent positions are counted according to their duration and not according to whether they were full-time or part-time. Accordingly, an individual who is permanently employed for the entire year in a part-time capacity (e.g., hotel service staff) represents one full-year equivalent position or job.
Economic Impact of the Defence and Security Industry in Canada vi
Taxes:
Overall government revenues (at the municipal, provincial and federal levels) consist of direct, indirect and property taxes. Direct taxes comprise federal and provincial personal and corporation income taxes. Indirect taxes comprise PST, GST, HST and other commodity taxes such as gas taxes, liquor and lottery taxes and profits, air transportation taxes, duties and excise taxes.
Multipliers:
Simple multipliers capture the sum of direct and indirect impacts. They are based on the assumption that households are exogenous and that there is no feedback between wages and production. Total multipliers capture the sum of direct, indirect and induced impacts. Households are treated as endogenous and the payments for labour services, i.e. wages, are redirected in the economy through consumer expenditures.
Direct Impacts:
Refer to the employment and value-added directly associated with the industry. They refer to the total value of goods and services used in the production of goods and services within the specific industry being studied.
Indirect Impacts:
Represent the employment and value-added associated with suppliers to the industry. Suppliers both employ their own workers and earn their own business income, and also generate demands for labour and goods and services produced by other industries.
Induced Impacts:
Measure the employment and value-added impacts associated with the re-spending of direct and indirect labour income. As the employees of the direct and indirect industrial firms take home their pay, they will spend within the broader economy creating a further induced impact of the revenues generated by the defence and security industry.
Economic Impact of the Defence and Security Industry in Canada 1
1. Introduction KPMG LLP (KPMG) was retained by the Canadian Association of Defence and Security Industries (CADSI) to assess the economic impact of the Canadian Defence and Security industry (the Industry) and to develop an economic impact model for use by CADSI.
CADSI is a not-for-profit national business association representing the Canadian Defence and Security industries and counting 880 member companies selling to the defence and public security markets. Member companies are of all sizes and offer a wide spectrum of goods and services to its customers, and to business partners in Canada, the United States, and internationally.
CADSI is the voice for the Industry, supporting its member firms through advocacy, business development, networking, and member services. Its mandate is to strengthen the relationship and dialogue between government and industry and to maximize the contribution the members can make to national defence and security. As the primary advocate for the Industry, CADSI represents the interests of industry to governments, politicians, the media, special interest groups, opinion leaders, and the public.
Bottom-up approach
To undertake this economic impact analysis, KPMG primarily used a “bottom up” approach which included a survey to gather economic activity data from members of the Industry. The results of this survey were then used to estimate total industry revenues. This data set was used as the input to Statistics Canada’s Input-Output Model (I-O Model) to measure the direct, indirect and induced economic impacts of the Industry on Gross Domestic Product (GDP), employment, government revenues and international trade.
It should be noted that the private security sector (i.e., companies owning and operating ‘critical infrastructure’ including banks, stock exchanges, transportation hubs and power utilities, which purchase security goods and services) was voluntarily excluded from the scope of study. Certain limitations were encountered in collecting data from the private sector firms engaged in public security activities, which may underestimate the size of the industry, as some members were de facto excluded from the scope of the study.
Top-down validation
KPMG also used a “top down” method to gather economic activity data through an analysis of the total capital, operations, and maintenance expenditures of selected federal, provincial, and municipal defence and security government entities. This data set was used to provide a snapshot of the Canadian defence and security market in 2011, and as control numbers to validate the data obtained through the “bottom up” approach. Certain limitations were encountered in collecting data from the government entities engaged in public security activities, which may underestimate the size of the industry
The completion of both “bottom up” and “top down” analyses, resulting in similar economic activity computations, provides confidence in the inputs imputed into Statistics Canada I-O Model. The use of Statistics Canada’s model to generate the economic impact assessment provides confidence in the results obtained for the year 2011. The resulting economic model framework can be re-used by CADSI on an annual basis using data gathered from their membership as inputs to calculate updated economic impact metrics.
Future updates
It is recommended that the overall model framework, and associated multipliers, be re-assessed through the Statistics Canada I-O Model at least every 3 years (or sooner should there be significant events in the industry), to ensure that any changes to the economic structure of the sub-sectors or regions across Canada are accurately reflected.
Economic Impact of the Defence and Security Industry in Canada 2
2. The Canadian Market
The Canadian Market
The Canadian Defence and Security marketplace is primarily driven by government procurement of defence and security goods and services, which occurs at the federal, provincial, and municipal levels across Canada. As noted, above, the scope of this study is centred on government procurement and specifically excluded the private security sector.The government based defence and security marketplace is comprised of a number of government entities, such as:
Department of National Defence (DND) Royal Canadian Mounted Police (RCMP) Canada Border Services Agency (CBSA) Correctional Services Canada (CSC) Ontario Provincial Police (OPP) Other municipal and provincial police services.
Canadian Market Size
The ‘’Top down’’ approach was used to analyze the spending patterns of these government entities through a review of public accounts, and identified their capital, operating and maintenance expenditures for the year 2011. It should be noted that selected government entities have broader overall expenditures that were not included in the analysis.
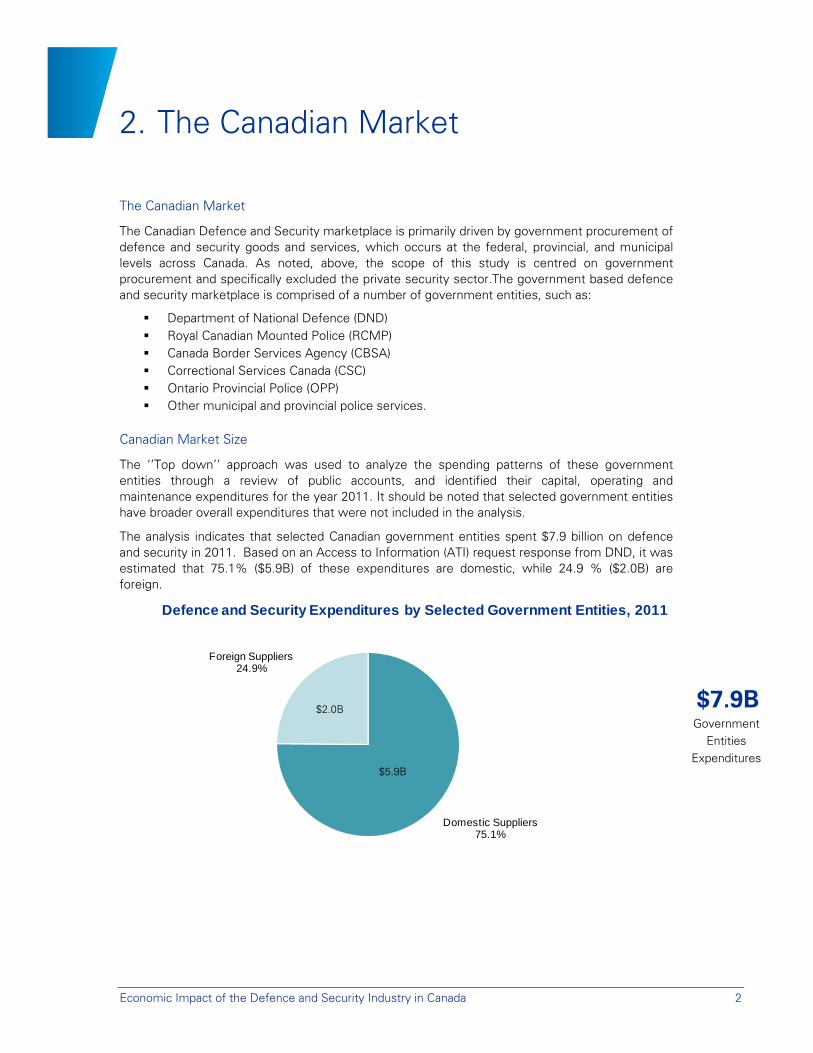
The analysis indicates that selected Canadian government entities spent $7.9 billion on defence and security in 2011. Based on an Access to Information (ATI) request response from DND, it was estimated that 75.1% ($5.9B) of these expenditures are domestic, while 24.9 % ($2.0B) are foreign.
$7.9B
Government Entities
Expenditures
Domestic Suppliers75.1%
Foreign Suppliers24.9%
Defence and Security Expenditures by Selected Government Entities, 2011
$2.0B
$5.9B
Economic Impact of the Defence and Security Industry in Canada 3
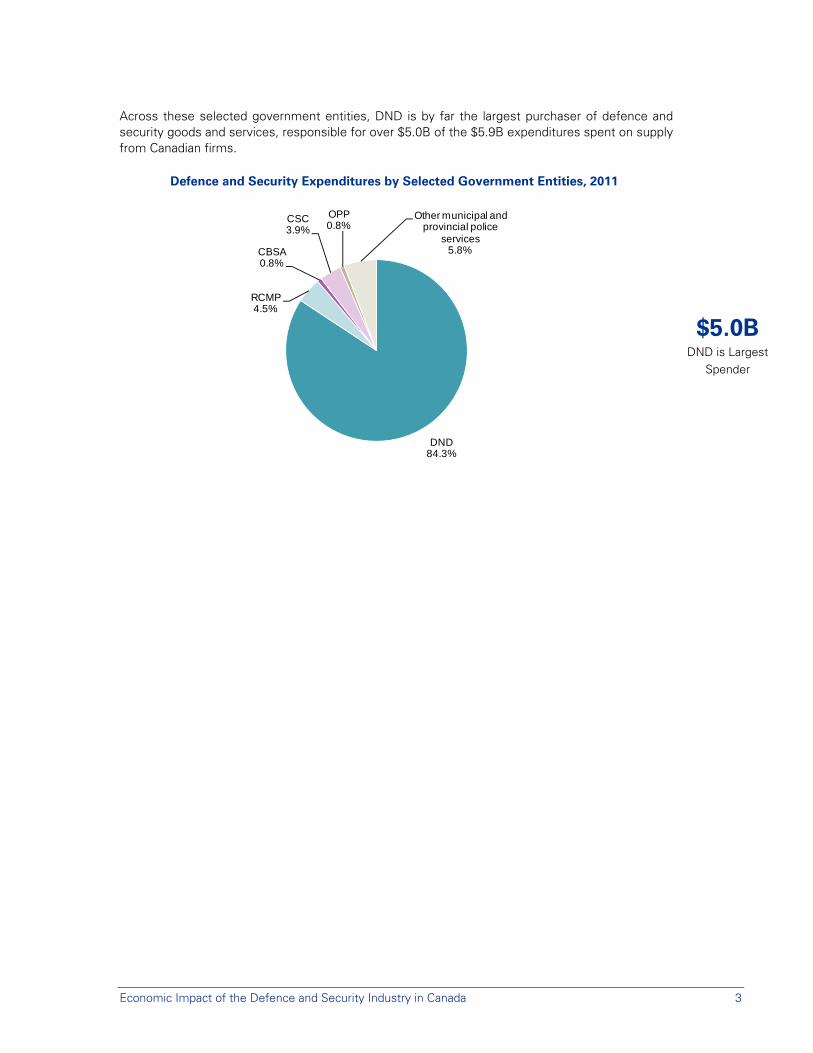
Across these selected government entities, DND is by far the largest purchaser of defence and security goods and services, responsible for over $5.0B of the $5.9B expenditures spent on supply from Canadian firms.
Defence and Security Expenditures by Selected Government Entities, 2011
$5.0B
DND is Largest Spender
DND84.3%
RCMP4.5%
CBSA0.8%
CSC3.9%
OPP0.8%
Other municipal and provincial police
services5.8%
Economic Impact of the Defence and Security Industry in Canada 4
3. The Canadian Industry 3.1 Defence and Security Industry
The defence and security industrial base supplies the broader defence and security market, including federal, provincial, and municipal government entities, as well as private sector purchasers of security goods and services.
The Industry is often referred to as a “managed” market because of the spending patterns of government entities. In fact, the domestic buyer is a large “first buyer” of the goods and services provided by the domestic defence industrial base. That proven capability is then exported to foreign governments. Consequently, there is a link between the level of foreign success by the national Industry, and the level of local procurement by domestic government entities.
The defence component occurs at the federal level (DND), while security is a shared federal, provincial and municipal responsibility. In both cases, the public and private sectors collaborate to enhance national defence and public security to create an environment that contributes to overall economic stability in Canada.
Defence
Canada’s defence industrial base contributes to jobs, innovation and wealth creation in Canada and export opportunities abroad. With the majority of companies in the defence sector also selling to commercial markets and supporting domestic supply chains, their direct and indirect contribution to the Canadian economy is greater than their sales to defence and security customers.
Canada’s defence industrial base includes, but is not limited to, shipbuilding and marine industries, aerospace industry, automotive sector, munitions, electronics, simulation and training, information and communications technologies, textile industry, in-service support and satellite and space technologies. This industrial base produces products, technologies and services across the industrial spectrum that serve to equip, enable, support and protect men and women in Canada’s Armed Forces and security agencies to perform the duties assigned to them by the Federal Government as effectively as possible. Some of the key domestic industrial capabilities with economic value to Canada include the following:
Shipbuilding, due to its contribution to regional shipyard employment and to the engagement of hundreds of companies in the domestic marine industry supply chain and in-service support market.
A strong aerospace industry including avionics, composites, engines and landing gear;
Robotics and unmanned vehicles, given its market growth potential and applicability to Canadian geography;
Command, Control, Communications, Computing, Intelligence, Surveillance, and Reconnaissance (C4ISR), due to its diverse contribution to a strong communications and electronics base, and the resulting capability which provides sovereignty as a Canadian Forces interoperability enabler.
Cross-platform simulation and training;
Armoured land vehicles, due to the military effectiveness of current Canadian capability and its popularity in international markets and to the support it provides to hundreds of companies in the domestic supply chain of Canada’s automotive sector from acquisition through life cycle support; and,
In-service support.
Economic Impact of the Defence and Security Industry in Canada 5
Defence and the economy are critically important to Canada and are inter-dependent, not mutually exclusive – the defence industrial base provides vital support to Canada’s defence and economic interests. Industry is playing a growing role as direct operators in military missions, and a continuing role as suppliers of key products, technologies and services. It plays an increasingly vital role as ‘stewards’ of defence equipment, given the rotational nature of the federal public service and the Canadian Forces and the length of time and use of Canada’s fleets in service.
Key drivers of the competitiveness of Canada’s defence industrial base include government entities as a first buyer, exports and R&D (as a market heavily influenced by technology-based solutions).
Public Security
The public security industry includes many private sector enterprises in Canada, which supply government and related agencies with goods and services to protect people, property, and public institutions from threats such as crime, terrorism, severe accidents, and environmental disasters.
The public security sector includes the following services:
Border and port control (including coast guard);
Law enforcement (national, provincial and municipal police services);
Emergency management (including first responders of all types);
Intelligence and information sharing; and
Justice (including correctional establishments).
While there is a private sector element of the security market involved in protecting critical infrastructure (utilities, banking, transportation, etc.), this sector falls outside the scope of this study.
In summary, the Canadian defence and security industry boasts a broad industrial base, providing a wide range of goods and services to both the public and private sectors.
3.2 Canadian Industry Size
A ‘’Bottom up’’ approach was used to estimate total revenues for Canadian industrial performers. This approach consisted in gathering data through the use of an industry survey. Two sources of information were used to construct the survey sample:
CADSI’s membership database Industry Canada’s list of Canadian Company Capabilities (IC-CCC), which included
identification of Canadian firms involved in defence and security.
These two databases were compared, with duplicates eliminated, resulting in the identification of over 2,000 Canadian firms involved in the Industry.
2,000 Firms
In Canadian Industry
Economic Impact of the Defence and Security Industry in Canada 6
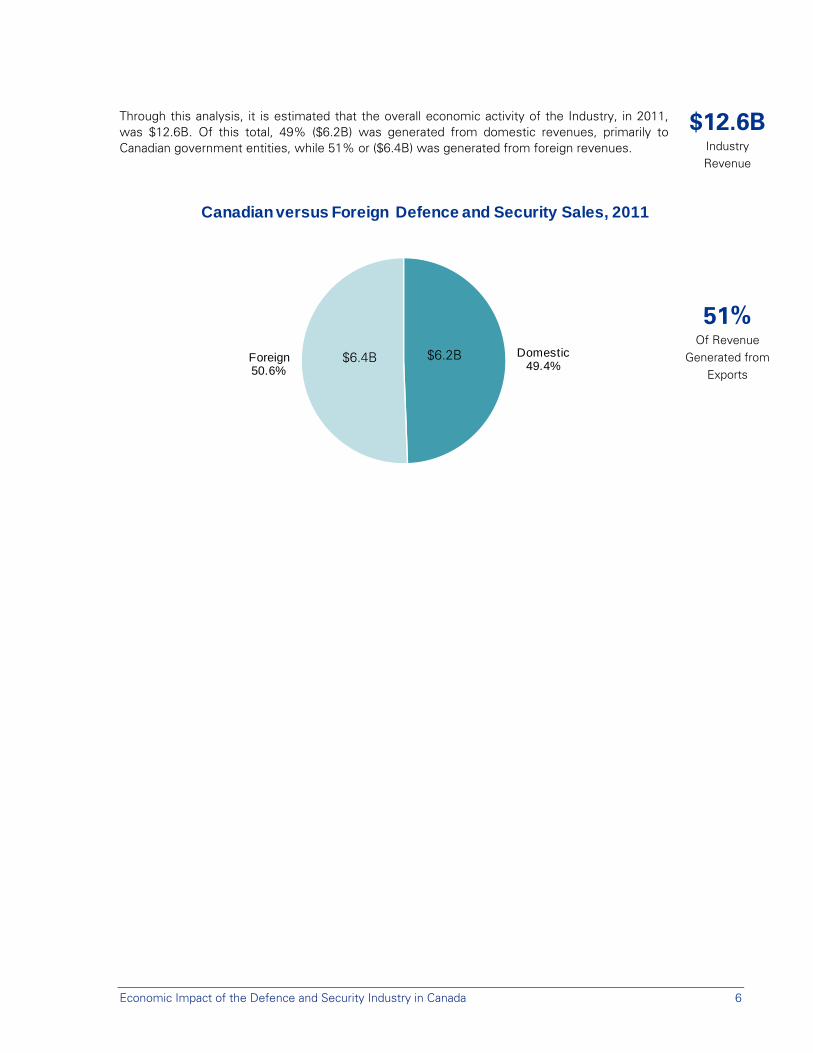
Through this analysis, it is estimated that the overall economic activity of the Industry, in 2011, was $12.6B. Of this total, 49% ($6.2B) was generated from domestic revenues, primarily to Canadian government entities, while 51% or ($6.4B) was generated from foreign revenues.
$12.6B
Industry Revenue
51%
Of Revenue Generated from
Exports
Domestic49.4%
Foreign50.6%
Canadian versus Foreign Defence and Security Sales, 2011
$6.4B $6.2B
Economic Impact of the Defence and Security Industry in Canada 7
4. Economic Impact of the Industry
Contribution to GDP
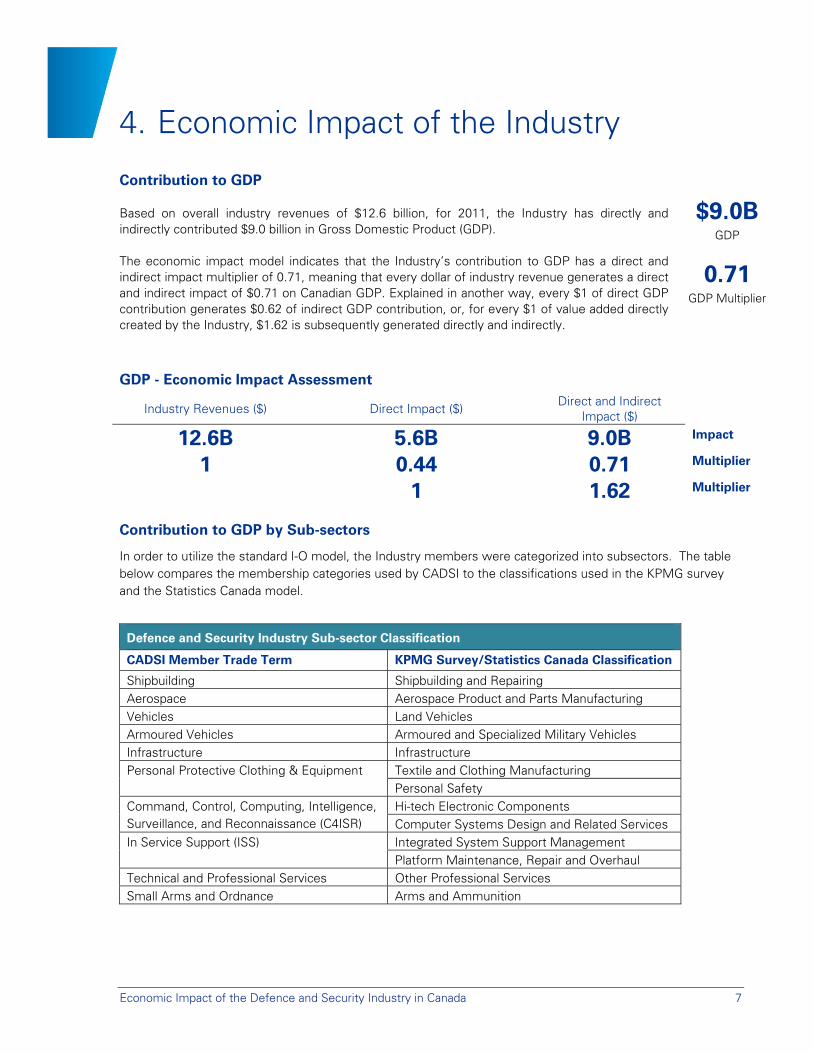
Based on overall industry revenues of $12.6 billion, for 2011, the Industry has directly and indirectly contributed $9.0 billion in Gross Domestic Product (GDP).
The economic impact model indicates that the Industry’s contribution to GDP has a direct and indirect impact multiplier of 0.71, meaning that every dollar of industry revenue generates a direct and indirect impact of $0.71 on Canadian GDP. Explained in another way, every $1 of direct GDP contribution generates $0.62 of indirect GDP contribution, or, for every $1 of value added directly created by the Industry, $1.62 is subsequently generated directly and indirectly.
$9.0B
GDP
0.71
GDP Multiplier
GDP - Economic Impact Assessment
Industry Revenues ($) Direct Impact ($) Direct and Indirect
Impact ($)
12.6B 5.6B 9.0B Impact
1 0.44 0.71 Multiplier
1 1.62 Multiplier
Contribution to GDP by Sub-sectors
In order to utilize the standard I-O model, the Industry members were categorized into subsectors. The table below compares the membership categories used by CADSI to the classifications used in the KPMG survey and the Statistics Canada model.
Defence and Security Industry Sub-sector Classification
CADSI Member Trade Term KPMG Survey/Statistics Canada Classification
Shipbuilding Shipbuilding and Repairing Aerospace Aerospace Product and Parts Manufacturing Vehicles Land Vehicles Armoured Vehicles Armoured and Specialized Military Vehicles Infrastructure Infrastructure Personal Protective Clothing & Equipment Textile and Clothing Manufacturing
Personal Safety Command, Control, Computing, Intelligence, Surveillance, and Reconnaissance (C4ISR)
Hi-tech Electronic Components Computer Systems Design and Related Services
In Service Support (ISS) Integrated System Support Management Platform Maintenance, Repair and Overhaul
Technical and Professional Services Other Professional Services Small Arms and Ordnance Arms and Ammunition
Economic Impact of the Defence and Security Industry in Canada 8
0 500,000 1,000,000 1,500,000 2,000,000 2,500,000
In Service Support
C4ISR
Armoured Vehicles
Small Arms & Ordinance
Aerospace
Technical, and Professional Services
Shipbuilding & Repairing
Personal Protective Clothing and Equipment
Infrastructure
Vehicles
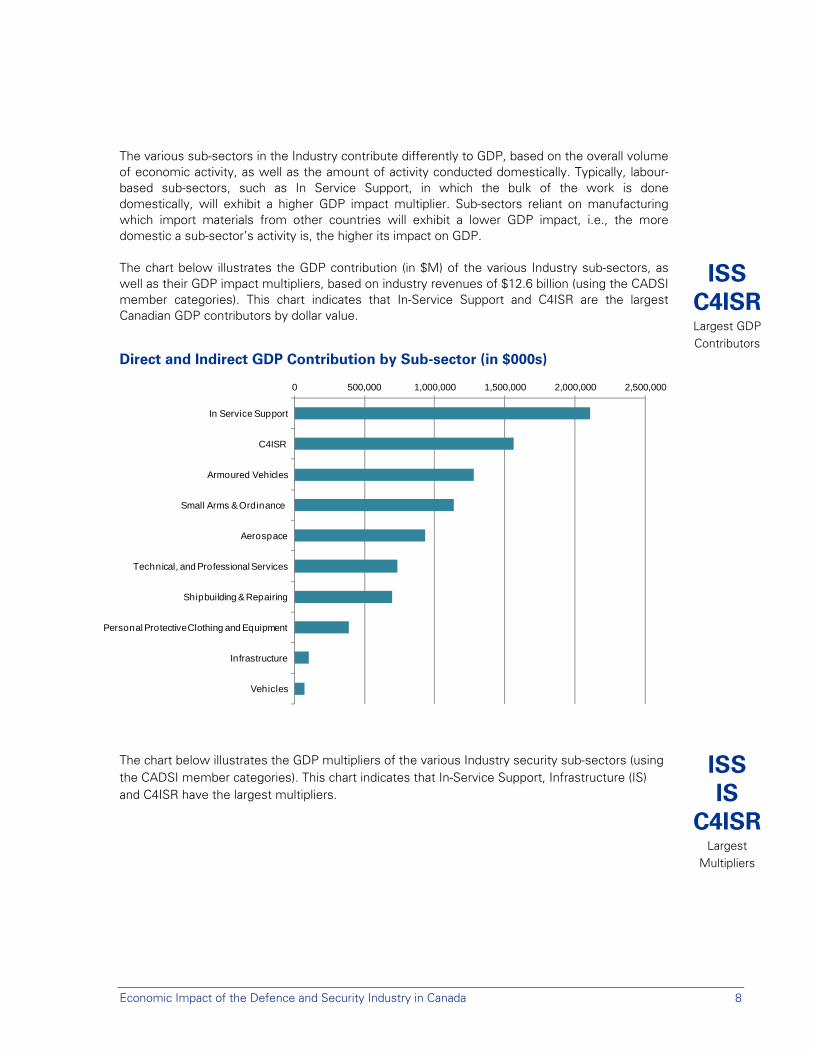
The various sub-sectors in the Industry contribute differently to GDP, based on the overall volume of economic activity, as well as the amount of activity conducted domestically. Typically, labour-based sub-sectors, such as In Service Support, in which the bulk of the work is done domestically, will exhibit a higher GDP impact multiplier. Sub-sectors reliant on manufacturing which import materials from other countries will exhibit a lower GDP impact, i.e., the more domestic a sub-sector’s activity is, the higher its impact on GDP.
The chart below illustrates the GDP contribution (in $M) of the various Industry sub-sectors, as well as their GDP impact multipliers, based on industry revenues of $12.6 billion (using the CADSI member categories). This chart indicates that In-Service Support and C4ISR are the largest Canadian GDP contributors by dollar value.
ISS C4ISR Largest GDP Contributors
Direct and Indirect GDP Contribution by Sub-sector (in $000s)
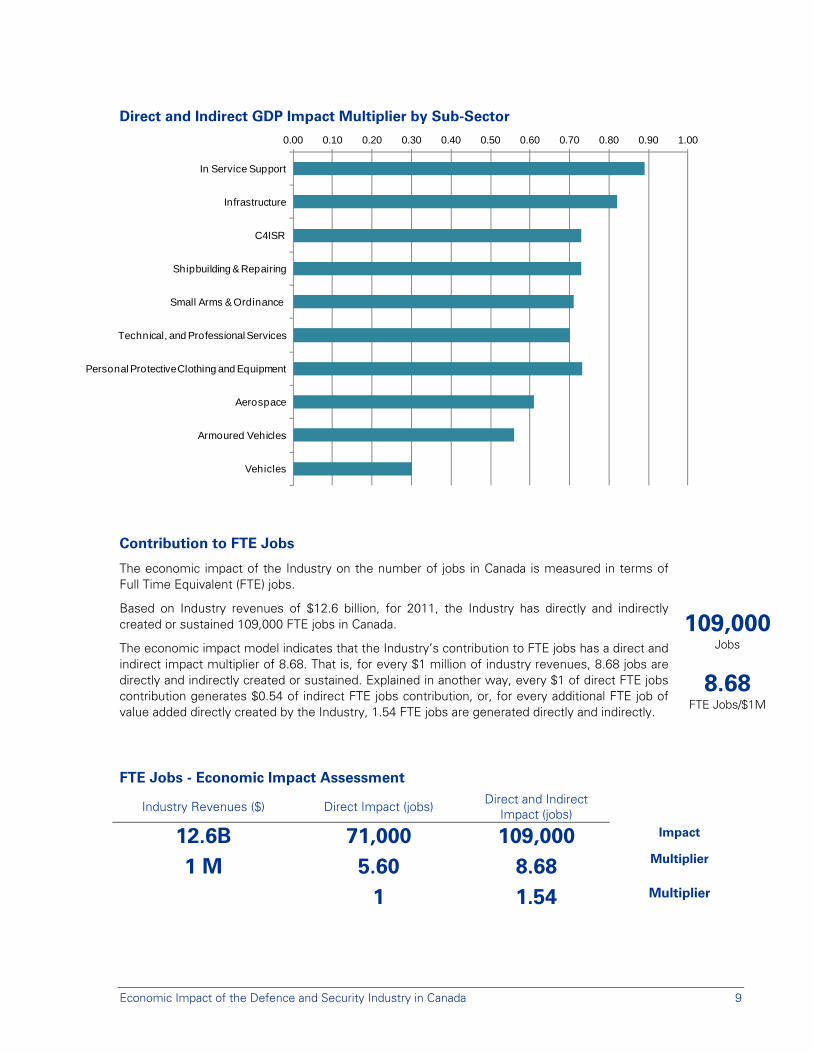
The chart below illustrates the GDP multipliers of the various Industry security sub-sectors (using the CADSI member categories). This chart indicates that In-Service Support, Infrastructure (IS) and C4ISR have the largest multipliers.
ISS IS
C4ISR Largest
Multipliers
Economic Impact of the Defence and Security Industry in Canada 9
Direct and Indirect GDP Impact Multiplier by Sub-Sector
Contribution to FTE Jobs
The economic impact of the Industry on the number of jobs in Canada is measured in terms of Full Time Equivalent (FTE) jobs.
Based on Industry revenues of $12.6 billion, for 2011, the Industry has directly and indirectly created or sustained 109,000 FTE jobs in Canada.
The economic impact model indicates that the Industry’s contribution to FTE jobs has a direct and indirect impact multiplier of 8.68. That is, for every $1 million of industry revenues, 8.68 jobs are directly and indirectly created or sustained. Explained in another way, every $1 of direct FTE jobs contribution generates $0.54 of indirect FTE jobs contribution, or, for every additional FTE job of value added directly created by the Industry, 1.54 FTE jobs are generated directly and indirectly.
109,000
Jobs
8.68 FTE Jobs/$1M
FTE Jobs - Economic Impact Assessment
Industry Revenues ($) Direct Impact (jobs) Direct and Indirect Impact (jobs)
12.6B 71,000 109,000 Impact
1 M 5.60 8.68 Multiplier
1 1.54 Multiplier
0.00 0.10 0.20 0.30 0.40 0.50 0.60 0.70 0.80 0.90 1.00
In Service Support
Infrastructure
C4ISR
Shipbuilding & Repairing
Small Arms & Ordinance
Technical, and Professional Services
Personal Protective Clothing and Equipment
Aerospace
Armoured Vehicles
Vehicles
Economic Impact of the Defence and Security Industry in Canada 10
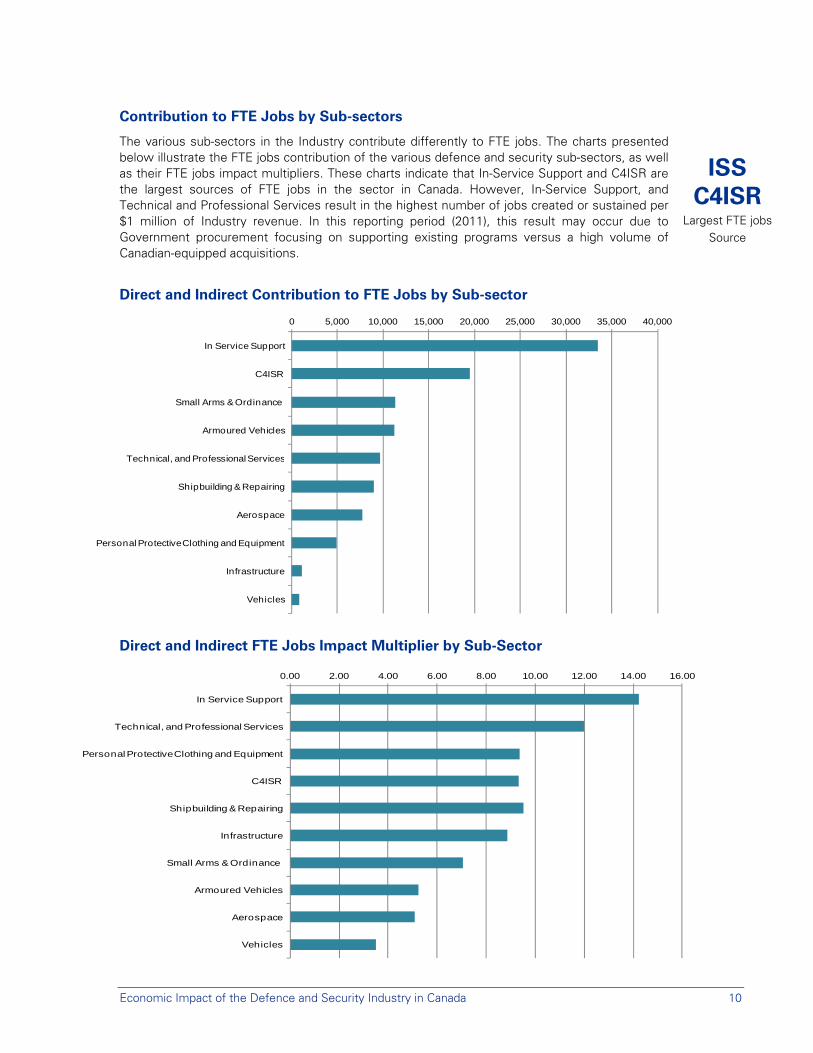
Contribution to FTE Jobs by Sub-sectors
The various sub-sectors in the Industry contribute differently to FTE jobs. The charts presented below illustrate the FTE jobs contribution of the various defence and security sub-sectors, as well as their FTE jobs impact multipliers. These charts indicate that In-Service Support and C4ISR are the largest sources of FTE jobs in the sector in Canada. However, In-Service Support, and Technical and Professional Services result in the highest number of jobs created or sustained per $1 million of Industry revenue. In this reporting period (2011), this result may occur due to Government procurement focusing on supporting existing programs versus a high volume of Canadian-equipped acquisitions.
ISS
C4ISR Largest FTE jobs
Source
Direct and Indirect Contribution to FTE Jobs by Sub-sector
Direct and Indirect FTE Jobs Impact Multiplier by Sub-Sector
Direct and Indirect FTE Jobs Impact Multiplier by Sub-Sector
0 5,000 10,000 15,000 20,000 25,000 30,000 35,000 40,000
In Service Support
C4ISR
Small Arms & Ordinance
Armoured Vehicles
Technical, and Professional Services
Shipbuilding & Repairing
Aerospace
Personal Protective Clothing and Equipment
Infrastructure
Vehicles
0.00 2.00 4.00 6.00 8.00 10.00 12.00 14.00 16.00
In Service Support
Technical, and Professional Services
Personal Protective Clothing and Equipment
C4ISR
Shipbuilding & Repairing
Infrastructure
Small Arms & Ordinance
Armoured Vehicles
Aerospace
Vehicles
Economic Impact of the Defence and Security Industry in Canada 11
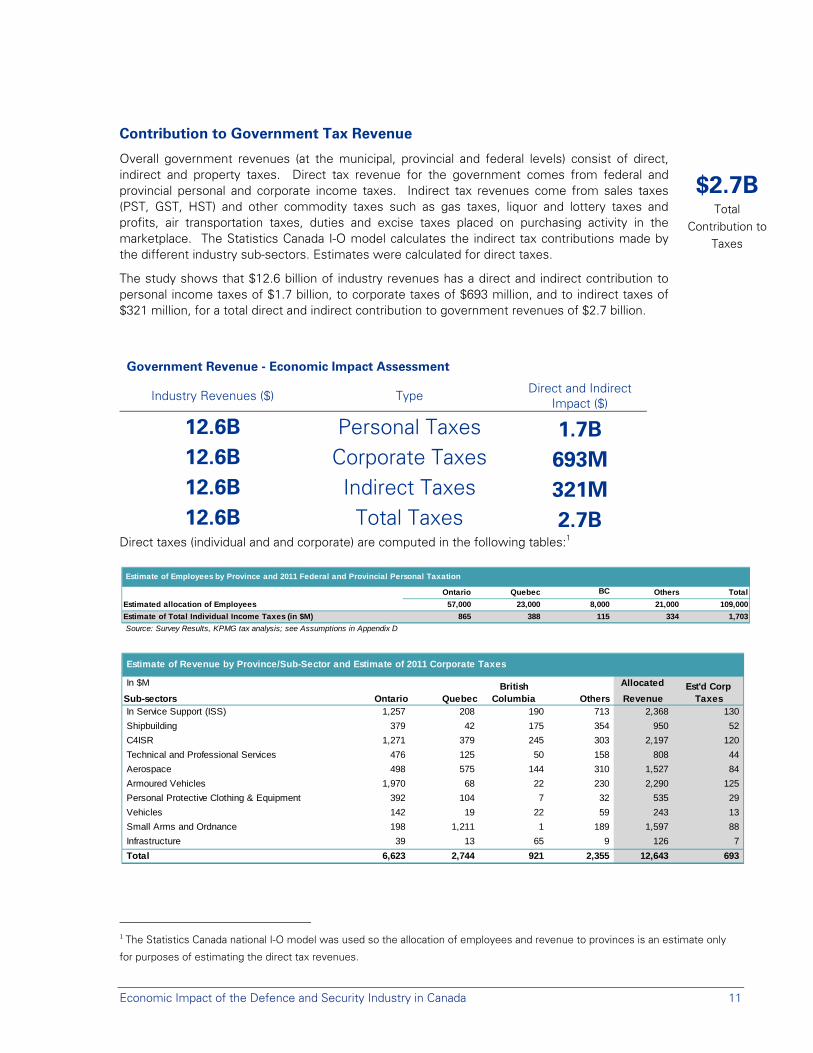
Contribution to Government Tax Revenue
Overall government revenues (at the municipal, provincial and federal levels) consist of direct, indirect and property taxes. Direct tax revenue for the government comes from federal and provincial personal and corporate income taxes. Indirect tax revenues come from sales taxes (PST, GST, HST) and other commodity taxes such as gas taxes, liquor and lottery taxes and profits, air transportation taxes, duties and excise taxes placed on purchasing activity in the marketplace. The Statistics Canada I-O model calculates the indirect tax contributions made by the different industry sub-sectors. Estimates were calculated for direct taxes.
The study shows that $12.6 billion of industry revenues has a direct and indirect contribution to personal income taxes of $1.7 billion, to corporate taxes of $693 million, and to indirect taxes of $321 million, for a total direct and indirect contribution to government revenues of $2.7 billion.
$2.7B
Total Contribution to
Taxes
Government Revenue - Economic Impact Assessment
Industry Revenues ($) Type Direct and Indirect Impact ($)
12.6B Personal Taxes 1.7B 12.6B Corporate Taxes 693M 12.6B Indirect Taxes 321M 12.6B Total Taxes 2.7B
Direct taxes (individual and and corporate) are computed in the following tables:1
1 The Statistics Canada national I-O model was used so the allocation of employees and revenue to provinces is an estimate only
for purposes of estimating the direct tax revenues.
Estimate of Employees by Province and 2011 Federal and Provincial Personal Taxation
Ontario Quebec BC Others Total
Estimated allocation of Employees 57,000 23,000 8,000 21,000 109,000
Estimate of Total Individual Income Taxes (in $M) 865 388 115 334 1,703
Source: Survey Results, KPMG tax analysis; see Assumptions in Appendix D
Estimate of Revenue by Province/Sub-Sector and Estimate of 2011 Corporate Taxes
In $M Allocated
Sub-sectors Ontario Quebec Others RevenueIn Service Support (ISS) 1,257 208 190 713 2,368 130
Shipbuilding 379 42 175 354 950 52
C4ISR 1,271 379 245 303 2,197 120
Technical and Professional Services 476 125 50 158 808 44
Aerospace 498 575 144 310 1,527 84
Armoured Vehicles 1,970 68 22 230 2,290 125
Personal Protective Clothing & Equipment 392 104 7 32 535 29
Vehicles 142 19 22 59 243 13
Small Arms and Ordnance 198 1,211 1 189 1,597 88
Infrastructure 39 13 65 9 126 7
Total 6,623 2,744 921 2,355 12,643 693
Est'd Corp Taxes
British Columbia
Economic Impact of the Defence and Security Industry in Canada 12
-400,000 -200,000 0 200,000 400,000 600,000 800,000 1,000,000 1,200,000 1,400,000 1,600,000 1,800,000
Armoured Vehicles
In Service Support
C4ISR
Small Arms & Ordinance
Shipbuilding & Repairing
Personal Protective Clothing and Equipment
Vehicles
Infrastructure
Technical, and Professional Services
Aerospace
0.0
1.0
2.0
3.0
4.0
5.0
6.0
7.0
Exports Imports
Industry Trade Balance
5. Trade Balance
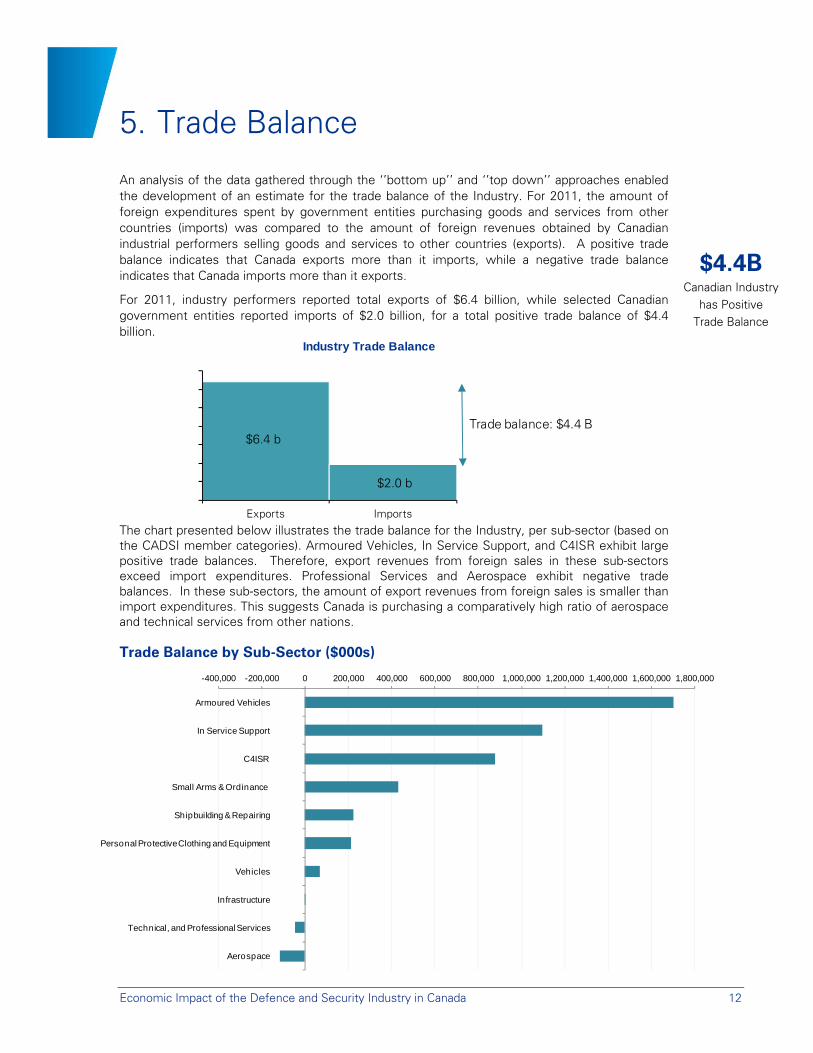
An analysis of the data gathered through the ‘’bottom up’’ and ‘’top down’’ approaches enabled the development of an estimate for the trade balance of the Industry. For 2011, the amount of foreign expenditures spent by government entities purchasing goods and services from other countries (imports) was compared to the amount of foreign revenues obtained by Canadian industrial performers selling goods and services to other countries (exports). A positive trade balance indicates that Canada exports more than it imports, while a negative trade balance indicates that Canada imports more than it exports.
For 2011, industry performers reported total exports of $6.4 billion, while selected Canadian government entities reported imports of $2.0 billion, for a total positive trade balance of $4.4 billion.
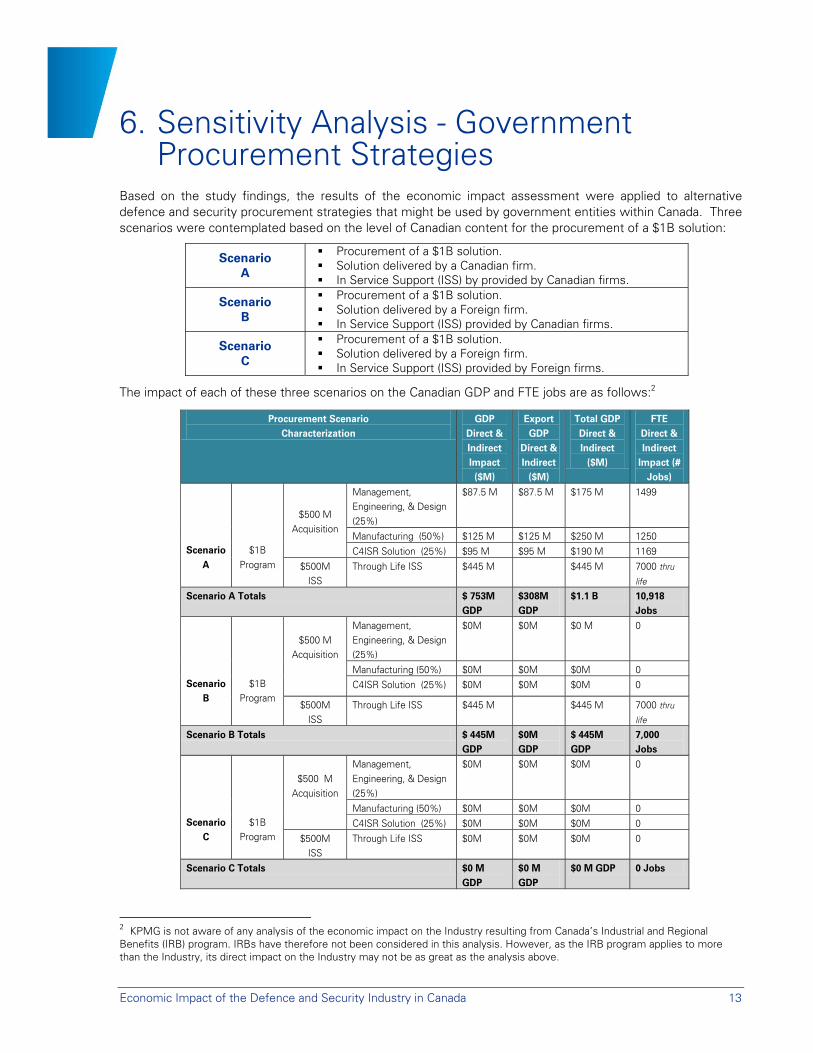
The chart presented below illustrates the trade balance for the Industry, per sub-sector (based on the CADSI member categories). Armoured Vehicles, In Service Support, and C4ISR exhibit large positive trade balances. Therefore, export revenues from foreign sales in these sub-sectors exceed import expenditures. Professional Services and Aerospace exhibit negative trade balances. In these sub-sectors, the amount of export revenues from foreign sales is smaller than import expenditures. This suggests Canada is purchasing a comparatively high ratio of aerospace and technical services from other nations.
$4.4B Canadian Industry
has Positive Trade Balance
Trade Balance by Sub-Sector ($000s)
Trade balance: $4.4 B$6.4 b
$2.0 b
Economic Impact of the Defence and Security Industry in Canada 13
6. Sensitivity Analysis - Government Procurement Strategies
Based on the study findings, the results of the economic impact assessment were applied to alternative defence and security procurement strategies that might be used by government entities within Canada. Three scenarios were contemplated based on the level of Canadian content for the procurement of a $1B solution:
Scenario A
Procurement of a $1B solution. Solution delivered by a Canadian firm. In Service Support (ISS) by provided by Canadian firms.
Scenario B
Procurement of a $1B solution. Solution delivered by a Foreign firm. In Service Support (ISS) provided by Canadian firms.
Scenario C
Procurement of a $1B solution. Solution delivered by a Foreign firm. In Service Support (ISS) provided by Foreign firms.
The impact of each of these three scenarios on the Canadian GDP and FTE jobs are as follows:2
2 KPMG is not aware of any analysis of the economic impact on the Industry resulting from Canada’s Industrial and Regional Benefits (IRB) program. IRBs have therefore not been considered in this analysis. However, as the IRB program applies to more than the Industry, its direct impact on the Industry may not be as great as the analysis above.
Procurement Scenario Characterization
GDP Direct & Indirect Impact ($M)
Export GDP
Direct & Indirect
($M)
Total GDP Direct & Indirect
($M)
FTE Direct & Indirect
Impact (# Jobs)
Scenario
A
$1B Program
$500 M Acquisition
Management, Engineering, & Design (25%)
$87.5 M $87.5 M $175 M 1499
Manufacturing (50%) $125 M $125 M $250 M 1250 C4ISR Solution (25%) $95 M $95 M $190 M 1169
$500M ISS
Through Life ISS $445 M $445 M 7000 thru
life Scenario A Totals $ 753M
GDP $308M GDP
$1.1 B 10,918 Jobs
Scenario
B
$1B Program
$500 M
Acquisition
Management, Engineering, & Design (25%)
$0M $0M $0 M 0
Manufacturing (50%) $0M $0M $0M 0 C4ISR Solution (25%) $0M $0M $0M 0
$500M ISS
Through Life ISS $445 M $445 M 7000 thru
life Scenario B Totals $ 445M
GDP $0M GDP
$ 445M GDP
7,000 Jobs
Scenario
C
$1B Program
$500 M
Acquisition
Management, Engineering, & Design (25%)
$0M $0M $0M 0
Manufacturing (50%) $0M $0M $0M 0 C4ISR Solution (25%) $0M $0M $0M 0
$500M ISS
Through Life ISS $0M $0M $0M 0
Scenario C Totals $0 M GDP
$0 M GDP
$0 M GDP 0 Jobs
Economic Impact of the Defence and Security Industry in Canada 14
7. Summary and Conclusion
The Industry manufactures products, develops technologies and provides services across the industrial spectrum. These products and services safely and effectively equip, support and protect Canada’s Armed Forces and various security agencies to perform the duties assigned to them by the Federal Government and other agencies.
The Industry consists of over 2,000 firms and in 2011 is estimated to have generated a total of $12.6B of economic activity, which was split approximately equally between domestic and foreign revenues.
There is a significant defence and security market created by government entities in Canada. The major government entities reviewed in this study had total expenditures on capital, operations, and maintenance of $7.9B. Of this total, approximately 75% was spent on domestic suppliers, and 25% on foreign suppliers. DND is the largest spender in this market, representing 85% of the amount spent on domestic defence suppliers.
The study shows that the industry had a total direct and indirect contribution to government tax revenues of $2.7 billion. As well, the Industry shows a net positive trade balance of $4.4 billion comprised of exports of $6.4B, net of imports by government entities of $2.0B.
The economic impact assessment shows that $12.6 billion of industry revenues has a direct and indirect contribution to Canadian GDP of $9.0B. Therefore, every $1 of industry revenue has a direct and indirect contribution of $0.71 to Canadian GDP. When compared to other industry sectors, a multiplier of 0.71 is higher than pure manufacturing (due to greater imported materials in that sector) but lower than sectors such as health care and education (which are more locally and labour-based). This reflects the mix of manufacturing and higher value-add technical services provided by the Industry in Canada.
The economic impact assessment indicates that $12.6 billion of industry revenues directly and indirectly creates or sustains 109,000 FTE jobs in the Canadian economy. Therefore, every $1 million of industry revenue directly and indirectly creates or sustains 8.68 FTE jobs.
In summary, the Defence and Security industry has a significant impact on Canada’s economy in terms of revenue, taxation, trade balance, GDP and employment. As it is one of the few sectors of the Canadian economy competing in a globally managed market, the policies and actions of governments both in Canada and abroad have a direct impact on the industry’s success. As this analysis was based on 2011 data, with this sector facing continuous market pressures, program and spending changes, it is anticipated that the results will vary over time.
* * * * * Please refer to the Appendices which follow for a detailed analysis of the economic impact model used, economic inputs (bottom up), validation of results (top down), and survey approach, results and questionnaire.
Economic Impact of the Defence and Security Industry in Canada 15
Appendix A – Economic Impact Model
Statistics Canada Input-output Model Used for this Study
Input-output models (I-O models) are used to simulate the economic impact of an expenditure on a given basket of goods and services or the output of one of several industries. Input-output analysis is based on statistical information about the flow of goods and services among various sectors of the economy.
An I-O model divides the economy into a matrix of industries and commodities. Relationships within the model map the production of commodities onto industries, and identify the primary or intermediate commodities that are used in the production of each final commodity used by consumers or sold as an export. The model can then aggregate all of the employment and value-added impacts generated in the supply chain as commodities are produced. I-O models also consider the role of imports, which tie the supply chain to the global economy.
These data are combined into a single model of the economy which can be solved to determine how much additional production is generated by a change in the demand for one or more commodities or by a change in the output of an industry. The simulation results from a "shock" to an I-O model will show the direct and indirect impacts, which industries benefit the most, the number of jobs created, estimates of indirect taxes and subsidies generated, etc.3
This information, presented in the form of tables, provides a comprehensive and detailed representation of the economy for a given year. An input-output model is essentially a database showing the relationship between commodity usage and industry output.
In Canada, the most authoritative and comprehensive I-O model is the Statistics Canada Interprovincial Input-Output Model maintained by Statistics Canada, and this is the model that has been used by KPMG for this analysis. As outlined in the Statistics Canada Guide to using the Input-Output Model, the “model has the greatest potential of all major economic models for capturing the flows of goods and services between industries and consumers at relatively detailed levels.” The I-O model used in this analysis is the most recent version produced by Statistics Canada and is calibrated to the 2008 Canadian economy. The Statistics Canada I-O model is independent to KPMG and is recognized by many as the benchmark by which economic modeling is undertaken in Canada.
3 Statistics Canada
Economic Impact of the Defence and Security Industry in Canada 16
Appendix B – Economic Activity Inputs
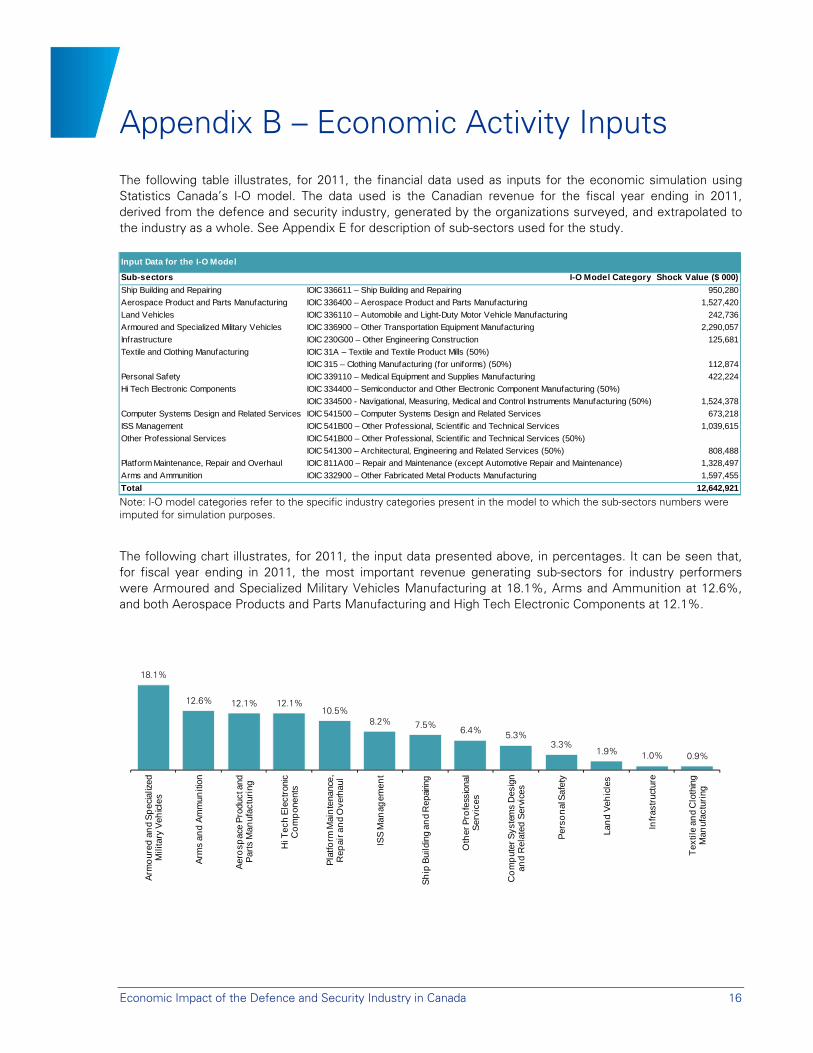
The following table illustrates, for 2011, the financial data used as inputs for the economic simulation using Statistics Canada’s I-O model. The data used is the Canadian revenue for the fiscal year ending in 2011, derived from the defence and security industry, generated by the organizations surveyed, and extrapolated to the industry as a whole. See Appendix E for description of sub-sectors used for the study.
Note: I-O model categories refer to the specific industry categories present in the model to which the sub-sectors numbers were imputed for simulation purposes.
The following chart illustrates, for 2011, the input data presented above, in percentages. It can be seen that, for fiscal year ending in 2011, the most important revenue generating sub-sectors for industry performers were Armoured and Specialized Military Vehicles Manufacturing at 18.1%, Arms and Ammunition at 12.6%, and both Aerospace Products and Parts Manufacturing and High Tech Electronic Components at 12.1%.
18.1%
12.6% 12.1% 12.1%10.5%
8.2% 7.5% 6.4% 5.3%3.3%
1.9% 1.0% 0.9%
Arm
our
ed a
nd
Sp
ecia
lized
M
ilita
ry V
ehic
les
Arm
s an
d A
mm
uniti
on
Aer
osp
ace
Pro
duct
and
P
arts
Man
ufac
turi
ng
Hi T
ech
Ele
ctro
nic
Co
mp
onen
ts
Pla
tform
Mai
nte
nanc
e,
Rep
air a
nd
Ove
rhau
l
ISS
Man
agem
ent
Sh
ip B
uild
ing
and
Rep
airin
g
Oth
er P
rofe
ssio
nal
Ser
vice
s
Co
mp
uter
Sys
tem
s D
esig
n an
d R
elat
ed S
ervi
ces
Per
son
al S
afet
y
Lan
d V
ehic
les
Infr
astr
uctu
re
Tex
tile
and
Clo
thin
g M
anuf
actu
ring
Input Data for the I-O Model
Sub-sectors I-O Model Category Shock Value ($ 000)
Ship Building and Repairing IOIC 336611 – Ship Building and Repairing 950,280
Aerospace Product and Parts Manufacturing IOIC 336400 – Aerospace Product and Parts Manufacturing 1,527,420
Land Vehicles IOIC 336110 – Automobile and Light-Duty Motor Vehicle Manufacturing 242,736
Armoured and Specialized Military Vehicles IOIC 336900 – Other Transportation Equipment Manufacturing 2,290,057
Infrastructure IOIC 230G00 – Other Engineering Construction 125,681
Textile and Clothing Manufacturing IOIC 31A – Textile and Textile Product Mills (50%)
IOIC 315 – Clothing Manufacturing (for uniforms) (50%) 112,874
Personal Safety IOIC 339110 – Medical Equipment and Supplies Manufacturing 422,224
Hi Tech Electronic Components IOIC 334400 – Semiconductor and Other Electronic Component Manufacturing (50%)
IOIC 334500 - Navigational, Measuring, Medical and Control Instruments Manufacturing (50%) 1,524,378
Computer Systems Design and Related Services IOIC 541500 – Computer Systems Design and Related Services 673,218
ISS Management IOIC 541B00 – Other Professional, Scientif ic and Technical Services 1,039,615
Other Professional Services IOIC 541B00 – Other Professional, Scientif ic and Technical Services (50%)
IOIC 541300 – Architectural, Engineering and Related Services (50%) 808,488
Platform Maintenance, Repair and Overhaul IOIC 811A00 – Repair and Maintenance (except Automotive Repair and Maintenance) 1,328,497
Arms and Ammunition IOIC 332900 – Other Fabricated Metal Products Manufacturing 1,597,455
Total 12,642,921
Economic Impact of the Defence and Security Industry in Canada 17
Appendix C - Validation of Input Data
C.1 Top-down Validation Approach using Selected Government Entities
The objective of the top-down approach was to validate the input data derived from the bottom-up (survey) approach.
KPMG’s top-down approach consisted of identifying the key defence and security government entities in Canada, estimating their relevant capital, operations and maintenance expenditures for the year 2011 using Public Accounts, and comparing this data with the figures estimated through the bottom-up approach. Organizations selected as the key government entities purchasing from the Industry are the following:
Defence government entities:
Department of National Defence (DND)
Security government entities:
Royal Canadian Mounted Police (RCMP)
Canada Border Services Agency (CBSA)
Correctional Services Canada (CSC)
Ontario Provincial Police (OPP)
Other municipal and provincial police services.
DND is the most important government entity purchasing from the defence and security sector in Canada. As such, it was reviewed in greater detail. To that end, KPMG directly contacted DND and filed an Access to Information (ATI) request to obtain the specific capital, infrastructure and professional and other service expenditures, to have them allocated to the sub-sectors, and to obtain the percentage of imports related to those expenditures.
Other Selected Government Entities include the RCMP, CBSA, CSC, OPP, and Other municipal and provincial police services. Expenditures for other municipal and provincial police services (excluding OPP and RCMP) were estimated using the number of police officers in Canada in 2011and expenditures from OPP and RCMP.
KPMG used Public Accounts of Canada and Ontario for 2010-2011, based on expenditures for acquisition of machinery and equipment, acquisition of land, buildings and works, as well as professional and special services, to estimate RCMP, CBSA, CSC, and OPP’s total capital expenditures.
KPMG estimated expenditures for other municipal and provincial police services (excluding OPP and RCMP) using the number of police officers in Canada as per Police Resources in Canada, Statistics Canada, 2011 and capital expenditures from OPP and RCMP.
Economic Impact of the Defence and Security Industry in Canada 18
C.2 Other Selected Government Entities: RCMP, CBSA, CSC, OPP, Other Municipal and Provincial Police Services
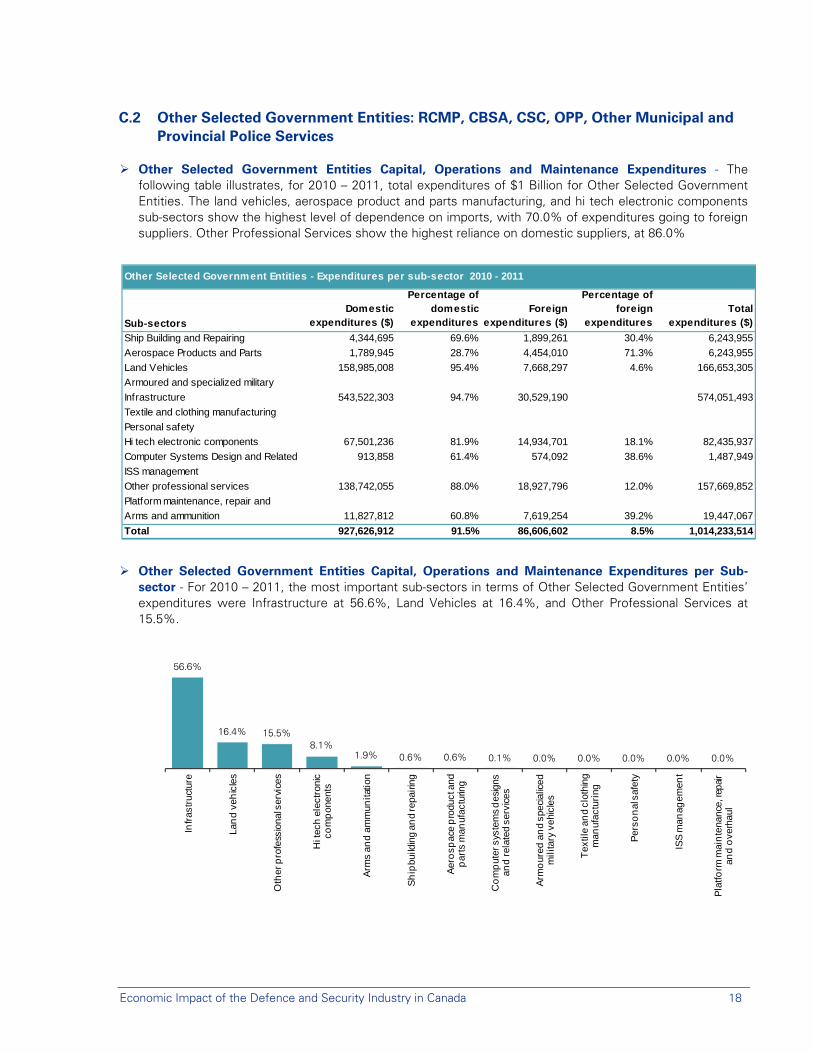
Other Selected Government Entities Capital, Operations and Maintenance Expenditures - The following table illustrates, for 2010 – 2011, total expenditures of $1 Billion for Other Selected Government Entities. The land vehicles, aerospace product and parts manufacturing, and hi tech electronic components sub-sectors show the highest level of dependence on imports, with 70.0% of expenditures going to foreign suppliers. Other Professional Services show the highest reliance on domestic suppliers, at 86.0%
Other Selected Government Entities Capital, Operations and Maintenance Expenditures per Sub-sector - For 2010 – 2011, the most important sub-sectors in terms of Other Selected Government Entities’ expenditures were Infrastructure at 56.6%, Land Vehicles at 16.4%, and Other Professional Services at 15.5%.
Other Selected Government Entities - Expenditures per sub-sector 2010 - 2011
Sub-sectors
Domestic expenditures ($)
Percentage of domestic
expendituresForeign
expenditures ($)
Percentage of foreign
expendituresTotal
expenditures ($)
Ship Building and Repairing 4,344,695 69.6% 1,899,261 30.4% 6,243,955
Aerospace Products and Parts 1,789,945 28.7% 4,454,010 71.3% 6,243,955
Land Vehicles 158,985,008 95.4% 7,668,297 4.6% 166,653,305
Armoured and specialized military
Infrastructure 543,522,303 94.7% 30,529,190 574,051,493
Textile and clothing manufacturing
Personal safety
Hi tech electronic components 67,501,236 81.9% 14,934,701 18.1% 82,435,937
Computer Systems Design and Related 913,858 61.4% 574,092 38.6% 1,487,949
ISS management
Other professional services 138,742,055 88.0% 18,927,796 12.0% 157,669,852
Platform maintenance, repair and
Arms and ammunition 11,827,812 60.8% 7,619,254 39.2% 19,447,067
Total 927,626,912 91.5% 86,606,602 8.5% 1,014,233,514
56.6%
16.4% 15.5%8.1%
1.9% 0.6% 0.6% 0.1% 0.0% 0.0% 0.0% 0.0% 0.0%
Infr
astr
uctu
re
Lan
d v
ehic
les
Oth
er p
rofe
ssio
nal s
ervi
ces
Hi t
ech
ele
ctro
nic
com
pon
ents
Arm
s an
d a
mm
unita
tion
Sh
ipbu
ildin
g an
d re
pairi
ng
Aer
osp
ace
pro
duct
and
p
arts
man
ufac
turin
g
Co
mp
uter
sys
tem
s d
esig
ns
and
rela
ted
serv
ices
Arm
our
ed a
nd
spec
ialic
ed
mili
tary
veh
icle
s
Tex
tile
and
clot
hing
m
anuf
actu
ring
Per
son
al s
afet
y
ISS
man
agem
ent
Pla
tform
mai
nte
nanc
e, re
pair
and
ove
rhau
l
Economic Impact of the Defence and Security Industry in Canada 19
C.3 Total Government Entities Expenditures (DND and others)
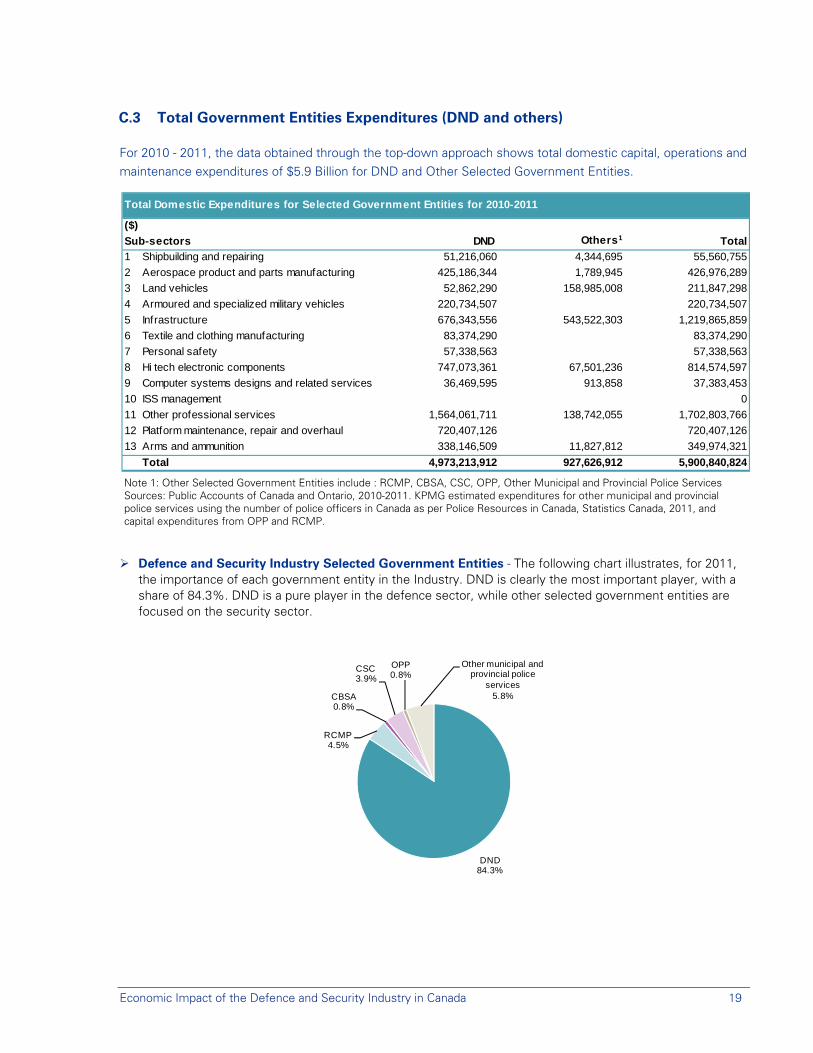
For 2010 - 2011, the data obtained through the top-down approach shows total domestic capital, operations and maintenance expenditures of $5.9 Billion for DND and Other Selected Government Entities.
Note 1: Other Selected Government Entities include : RCMP, CBSA, CSC, OPP, Other Municipal and Provincial Police Services Sources: Public Accounts of Canada and Ontario, 2010-2011. KPMG estimated expenditures for other municipal and provincial police services using the number of police officers in Canada as per Police Resources in Canada, Statistics Canada, 2011, and capital expenditures from OPP and RCMP.
Defence and Security Industry Selected Government Entities - The following chart illustrates, for 2011, the importance of each government entity in the Industry. DND is clearly the most important player, with a share of 84.3%. DND is a pure player in the defence sector, while other selected government entities are focused on the security sector.
Total Domestic Expenditures for Selected Government Entities for 2010-2011
($)
Sub-sectors DND Others1 Total
1 Shipbuilding and repairing 51,216,060 4,344,695 55,560,755
2 Aerospace product and parts manufacturing 425,186,344 1,789,945 426,976,289
3 Land vehicles 52,862,290 158,985,008 211,847,298
4 Armoured and specialized military vehicles 220,734,507 220,734,507
5 Infrastructure 676,343,556 543,522,303 1,219,865,859
6 Textile and clothing manufacturing 83,374,290 83,374,290
7 Personal safety 57,338,563 57,338,563
8 Hi tech electronic components 747,073,361 67,501,236 814,574,597
9 Computer systems designs and related services 36,469,595 913,858 37,383,453
10 ISS management 0
11 Other professional services 1,564,061,711 138,742,055 1,702,803,766
12 Platform maintenance, repair and overhaul 720,407,126 720,407,126
13 Arms and ammunition 338,146,509 11,827,812 349,974,321
Total 4,973,213,912 927,626,912 5,900,840,824
DND84.3%
RCMP4.5%
CBSA0.8%
CSC3.9%
OPP0.8%
Other municipal and provincial police
services5.8%
Economic Impact of the Defence and Security Industry in Canada 20
C.4 Total Revenues using Bottom-up Approach (Domestic and Foreign)
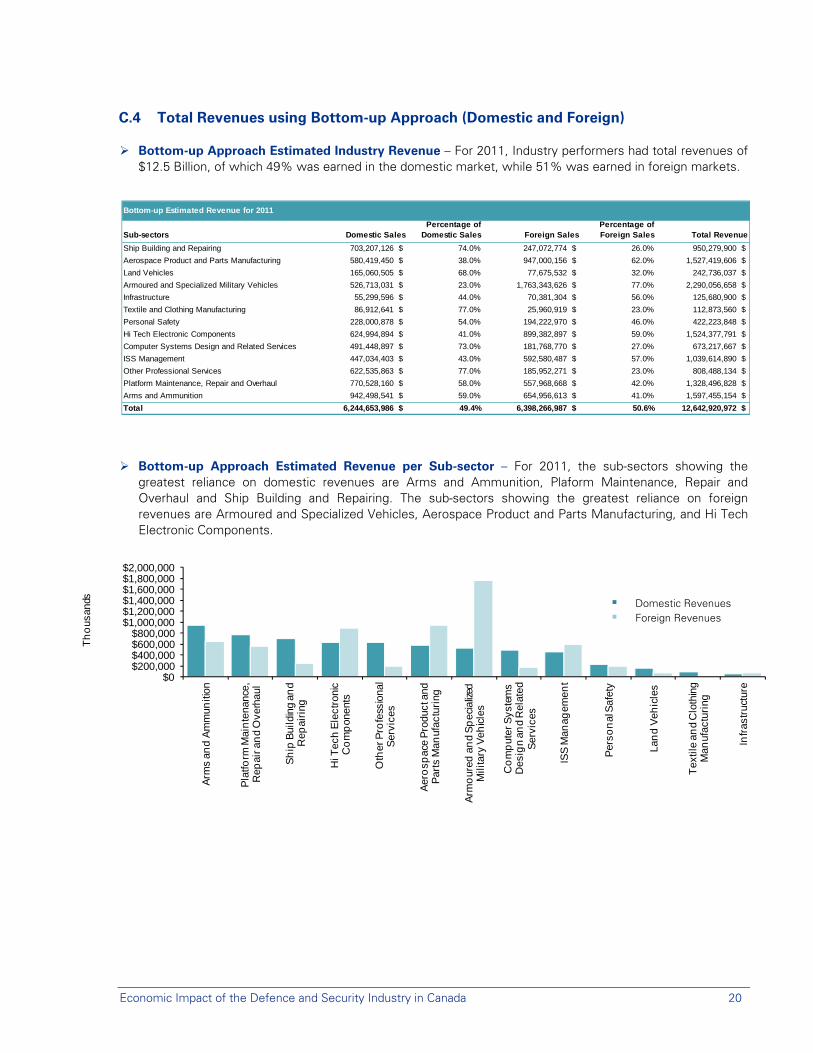
Bottom-up Approach Estimated Industry Revenue – For 2011, Industry performers had total revenues of $12.5 Billion, of which 49% was earned in the domestic market, while 51% was earned in foreign markets.
Bottom-up Approach Estimated Revenue per Sub-sector – For 2011, the sub-sectors showing the greatest reliance on domestic revenues are Arms and Ammunition, Plaform Maintenance, Repair and Overhaul and Ship Building and Repairing. The sub-sectors showing the greatest reliance on foreign revenues are Armoured and Specialized Vehicles, Aerospace Product and Parts Manufacturing, and Hi Tech Electronic Components.
Bottom-up Estimated Revenue for 2011
Sub-sectors Domestic SalesPercentage of
Domestic Sales Foreign SalesPercentage of Foreign Sales Total Revenue
Ship Building and Repairing 703,207,126 $ 74.0% 247,072,774 $ 26.0% 950,279,900 $
Aerospace Product and Parts Manufacturing 580,419,450 $ 38.0% 947,000,156 $ 62.0% 1,527,419,606 $
Land Vehicles 165,060,505 $ 68.0% 77,675,532 $ 32.0% 242,736,037 $
Armoured and Specialized Military Vehicles 526,713,031 $ 23.0% 1,763,343,626 $ 77.0% 2,290,056,658 $
Infrastructure 55,299,596 $ 44.0% 70,381,304 $ 56.0% 125,680,900 $
Textile and Clothing Manufacturing 86,912,641 $ 77.0% 25,960,919 $ 23.0% 112,873,560 $
Personal Safety 228,000,878 $ 54.0% 194,222,970 $ 46.0% 422,223,848 $
Hi Tech Electronic Components 624,994,894 $ 41.0% 899,382,897 $ 59.0% 1,524,377,791 $
Computer Systems Design and Related Services 491,448,897 $ 73.0% 181,768,770 $ 27.0% 673,217,667 $
ISS Management 447,034,403 $ 43.0% 592,580,487 $ 57.0% 1,039,614,890 $
Other Professional Services 622,535,863 $ 77.0% 185,952,271 $ 23.0% 808,488,134 $
Platform Maintenance, Repair and Overhaul 770,528,160 $ 58.0% 557,968,668 $ 42.0% 1,328,496,828 $
Arms and Ammunition 942,498,541 $ 59.0% 654,956,613 $ 41.0% 1,597,455,154 $
Total 6,244,653,986 $ 49.4% 6,398,266,987 $ 50.6% 12,642,920,972 $
$0$200,000$400,000$600,000$800,000
$1,000,000$1,200,000$1,400,000$1,600,000$1,800,000$2,000,000
Arm
s an
d A
mm
uniti
on
Pla
tform
Mai
nte
nanc
e,
Rep
air a
nd
Ove
rhau
l
Sh
ip B
uild
ing
and
Rep
airi
ng
Hi T
ech
Ele
ctro
nic
Co
mp
onen
ts
Oth
er P
rofe
ssio
nal
Ser
vice
s
Aer
osp
ace
Pro
duct
and
P
arts
Man
ufac
turi
ng
Arm
our
ed a
nd
Sp
ecia
lized
M
ilita
ry V
ehic
les
Co
mp
uter
Sys
tem
s D
esig
n an
d R
elat
ed
Ser
vice
s
ISS
Man
agem
ent
Per
son
al S
afet
y
Lan
d V
ehic
les
Tex
tile
and
Clo
thin
g M
anuf
actu
ring
Infr
astr
uctu
re
Th
ous
ands Domestic Revenues
Foreign Revenues
Economic Impact of the Defence and Security Industry in Canada 21
C.5 Total Expenditures using Top-down Approach (Domestic and Foreign)
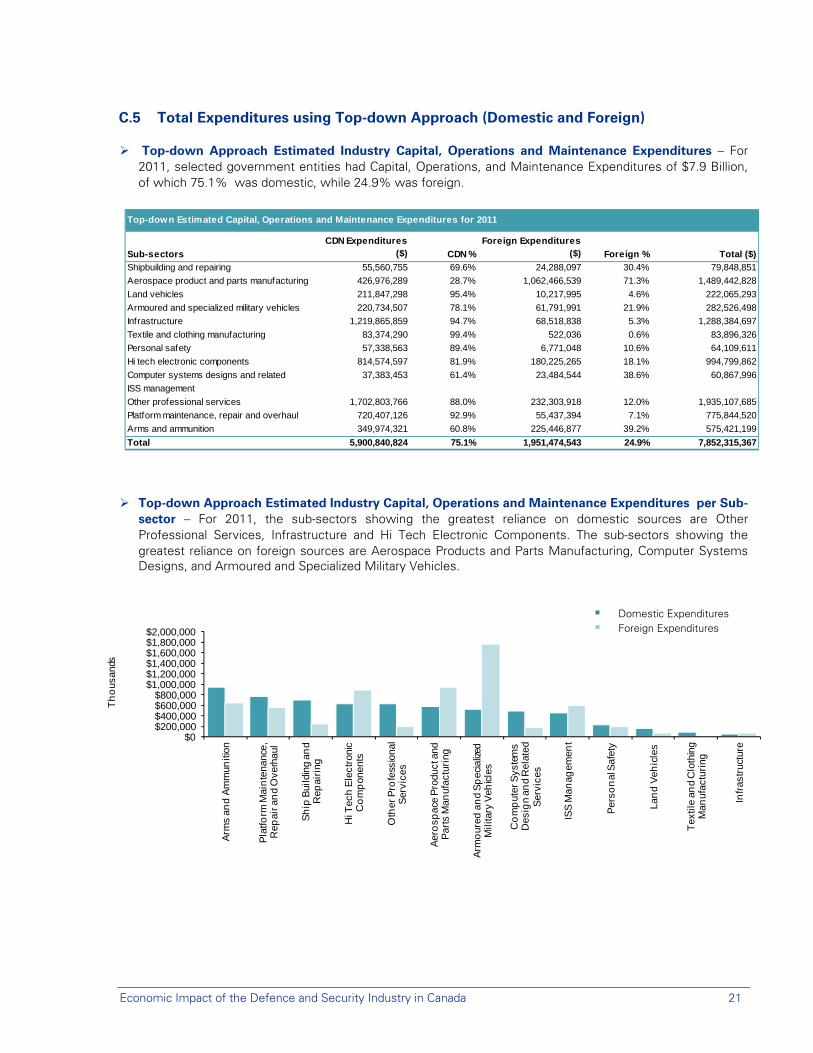
Top-down Approach Estimated Industry Capital, Operations and Maintenance Expenditures – For 2011, selected government entities had Capital, Operations, and Maintenance Expenditures of $7.9 Billion, of which 75.1% was domestic, while 24.9% was foreign.
Top-down Approach Estimated Industry Capital, Operations and Maintenance Expenditures per Sub-sector – For 2011, the sub-sectors showing the greatest reliance on domestic sources are Other Professional Services, Infrastructure and Hi Tech Electronic Components. The sub-sectors showing the greatest reliance on foreign sources are Aerospace Products and Parts Manufacturing, Computer Systems Designs, and Armoured and Specialized Military Vehicles.
$0$200,000$400,000$600,000$800,000
$1,000,000$1,200,000$1,400,000$1,600,000$1,800,000$2,000,000
Arm
s an
d A
mm
uniti
on
Pla
tform
Mai
nte
nanc
e,
Rep
air a
nd
Ove
rhau
l
Sh
ip B
uild
ing
and
Rep
airi
ng
Hi T
ech
Ele
ctro
nic
Co
mp
onen
ts
Oth
er P
rofe
ssio
nal
Ser
vice
s
Aer
osp
ace
Pro
duct
and
P
arts
Man
ufac
turi
ng
Arm
our
ed a
nd
Sp
ecia
lized
M
ilita
ry V
ehic
les
Co
mp
uter
Sys
tem
s D
esig
n an
d R
elat
ed
Ser
vice
s
ISS
Man
agem
ent
Per
son
al S
afet
y
Lan
d V
ehic
les
Tex
tile
and
Clo
thin
g M
anuf
actu
ring
Infr
astr
uctu
re
Th
ous
ands
Domestic Expenditures Foreign Expenditures
Top-down Estimated Capital, Operations and Maintenance Expenditures for 2011
Sub-sectors
CDN Expenditures ($) CDN %
Foreign Expenditures ($) Foreign % Total ($)
Shipbuilding and repairing 55,560,755 69.6% 24,288,097 30.4% 79,848,851
Aerospace product and parts manufacturing 426,976,289 28.7% 1,062,466,539 71.3% 1,489,442,828
Land vehicles 211,847,298 95.4% 10,217,995 4.6% 222,065,293
Armoured and specialized military vehicles 220,734,507 78.1% 61,791,991 21.9% 282,526,498
Infrastructure 1,219,865,859 94.7% 68,518,838 5.3% 1,288,384,697
Textile and clothing manufacturing 83,374,290 99.4% 522,036 0.6% 83,896,326
Personal safety 57,338,563 89.4% 6,771,048 10.6% 64,109,611
Hi tech electronic components 814,574,597 81.9% 180,225,265 18.1% 994,799,862
Computer systems designs and related 37,383,453 61.4% 23,484,544 38.6% 60,867,996
ISS management
Other professional services 1,702,803,766 88.0% 232,303,918 12.0% 1,935,107,685
Platform maintenance, repair and overhaul 720,407,126 92.9% 55,437,394 7.1% 775,844,520
Arms and ammunition 349,974,321 60.8% 225,446,877 39.2% 575,421,199
Total 5,900,840,824 75.1% 1,951,474,543 24.9% 7,852,315,367
Economic Impact of the Defence and Security Industry in Canada 22
C.6 Comparative Analysis
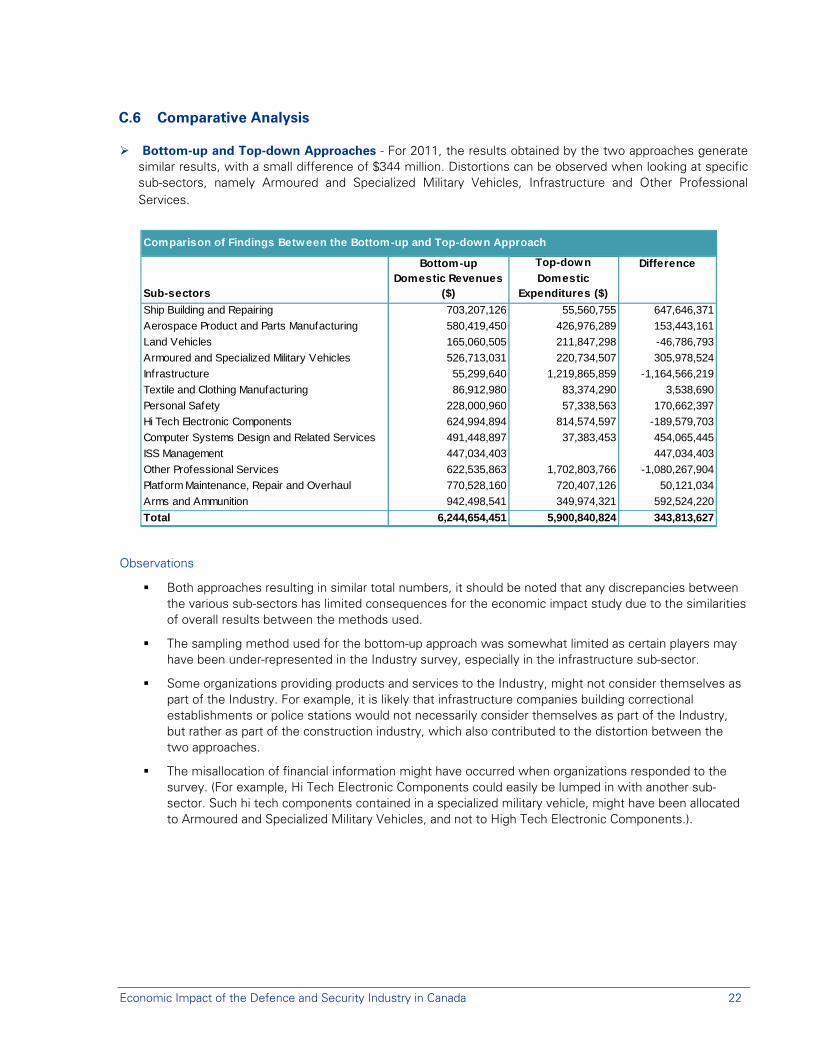
Bottom-up and Top-down Approaches - For 2011, the results obtained by the two approaches generate similar results, with a small difference of $344 million. Distortions can be observed when looking at specific sub-sectors, namely Armoured and Specialized Military Vehicles, Infrastructure and Other Professional Services.
Observations
Both approaches resulting in similar total numbers, it should be noted that any discrepancies between the various sub-sectors has limited consequences for the economic impact study due to the similarities of overall results between the methods used.
The sampling method used for the bottom-up approach was somewhat limited as certain players may have been under-represented in the Industry survey, especially in the infrastructure sub-sector.
Some organizations providing products and services to the Industry, might not consider themselves as part of the Industry. For example, it is likely that infrastructure companies building correctional establishments or police stations would not necessarily consider themselves as part of the Industry, but rather as part of the construction industry, which also contributed to the distortion between the two approaches.
The misallocation of financial information might have occurred when organizations responded to the survey. (For example, Hi Tech Electronic Components could easily be lumped in with another sub-sector. Such hi tech components contained in a specialized military vehicle, might have been allocated to Armoured and Specialized Military Vehicles, and not to High Tech Electronic Components.).
Top-down Difference
Sub-sectorsDomestic Revenues
($)Domestic
Expenditures ($)
Ship Building and Repairing 703,207,126 55,560,755 647,646,371
Aerospace Product and Parts Manufacturing 580,419,450 426,976,289 153,443,161
Land Vehicles 165,060,505 211,847,298 -46,786,793
Armoured and Specialized Military Vehicles 526,713,031 220,734,507 305,978,524
Infrastructure 55,299,640 1,219,865,859 -1,164,566,219
Textile and Clothing Manufacturing 86,912,980 83,374,290 3,538,690
Personal Safety 228,000,960 57,338,563 170,662,397
Hi Tech Electronic Components 624,994,894 814,574,597 -189,579,703
Computer Systems Design and Related Services 491,448,897 37,383,453 454,065,445
ISS Management 447,034,403 447,034,403
Other Professional Services 622,535,863 1,702,803,766 -1,080,267,904
Platform Maintenance, Repair and Overhaul 770,528,160 720,407,126 50,121,034
Arms and Ammunition 942,498,541 349,974,321 592,524,220
Total 6,244,654,451 5,900,840,824 343,813,627
Bottom-up
Comparison of Findings Between the Bottom-up and Top-down Approach
Economic Impact of the Defence and Security Industry in Canada 23
Appendix D – Economic Impact Assessment
D.1 Contribution to GDP
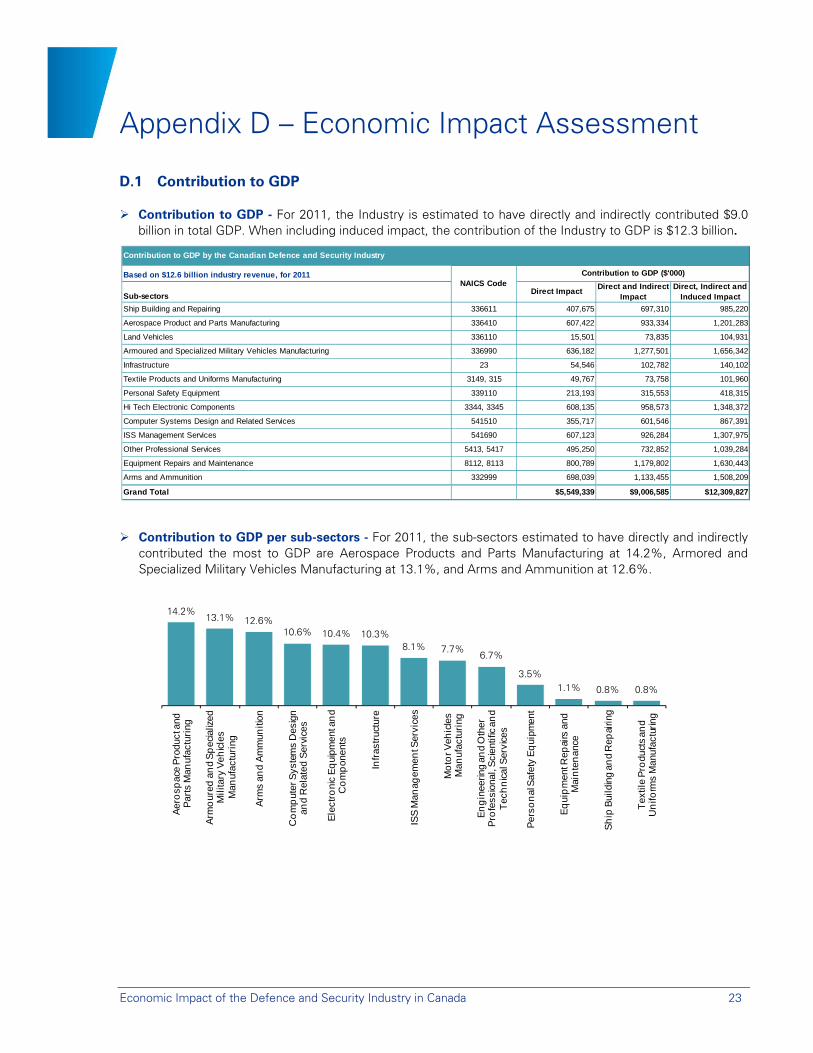
Contribution to GDP - For 2011, the Industry is estimated to have directly and indirectly contributed $9.0 billion in total GDP. When including induced impact, the contribution of the Industry to GDP is $12.3 billion.
Contribution to GDP per sub-sectors - For 2011, the sub-sectors estimated to have directly and indirectly contributed the most to GDP are Aerospace Products and Parts Manufacturing at 14.2%, Armored and Specialized Military Vehicles Manufacturing at 13.1%, and Arms and Ammunition at 12.6%.
Contribution to GDP by the Canadian Defence and Security Industry
Based on $12.6 billion industry revenue, for 2011
Sub-sectorsDirect Impact
Direct and Indirect Impact
Direct, Indirect and Induced Impact
Ship Building and Repairing 336611 407,675 697,310 985,220
Aerospace Product and Parts Manufacturing 336410 607,422 933,334 1,201,283
Land Vehicles 336110 15,501 73,835 104,931
Armoured and Specialized Military Vehicles Manufacturing 336990 636,182 1,277,501 1,656,342
Infrastructure 23 54,546 102,782 140,102
Textile Products and Uniforms Manufacturing 3149, 315 49,767 73,758 101,960
Personal Safety Equipment 339110 213,193 315,553 418,315
Hi Tech Electronic Components 3344, 3345 608,135 958,573 1,348,372
Computer Systems Design and Related Services 541510 355,717 601,546 867,391
ISS Management Services 541690 607,123 926,284 1,307,975
Other Professional Services 5413, 5417 495,250 732,852 1,039,284
Equipment Repairs and Maintenance 8112, 8113 800,789 1,179,802 1,630,443
Arms and Ammunition 332999 698,039 1,133,455 1,508,209
Grand Total $5,549,339 $9,006,585 $12,309,827
NAICS CodeContribution to GDP ($'000)
14.2%13.1% 12.6%
10.6% 10.4% 10.3%8.1% 7.7%
6.7%
3.5%1.1% 0.8% 0.8%
Aer
osp
ace
Pro
duct
and
P
arts
Man
ufac
turi
ng
Arm
our
ed a
nd
Sp
ecia
lized
M
ilita
ry V
ehic
les
Man
ufac
turi
ng
Arm
s an
d A
mm
uniti
on
Co
mp
uter
Sys
tem
s D
esig
n an
d R
elat
ed S
ervi
ces
Ele
ctro
nic
Eq
uipm
ent a
nd
Co
mp
onen
ts
Infr
astr
uctu
re
ISS
Man
agem
ent S
ervi
ces
Mo
tor V
ehic
les
Man
ufac
turi
ng
En
gin
eerin
g an
d O
ther
P
rofe
ssio
nal,
Sci
entif
ic a
nd
Tec
hn
ical
Ser
vice
s
Per
son
al S
afet
y E
qui
pmen
t
Eq
uip
men
t Rep
airs
and
M
ain
ten
ance
Sh
ip B
uild
ing
and
Rep
airin
g
Tex
tile
Pro
duct
s an
d U
nifo
rms
Man
ufac
turin
g
Economic Impact of the Defence and Security Industry in Canada 24
D.2 Contribution to FTE Jobs
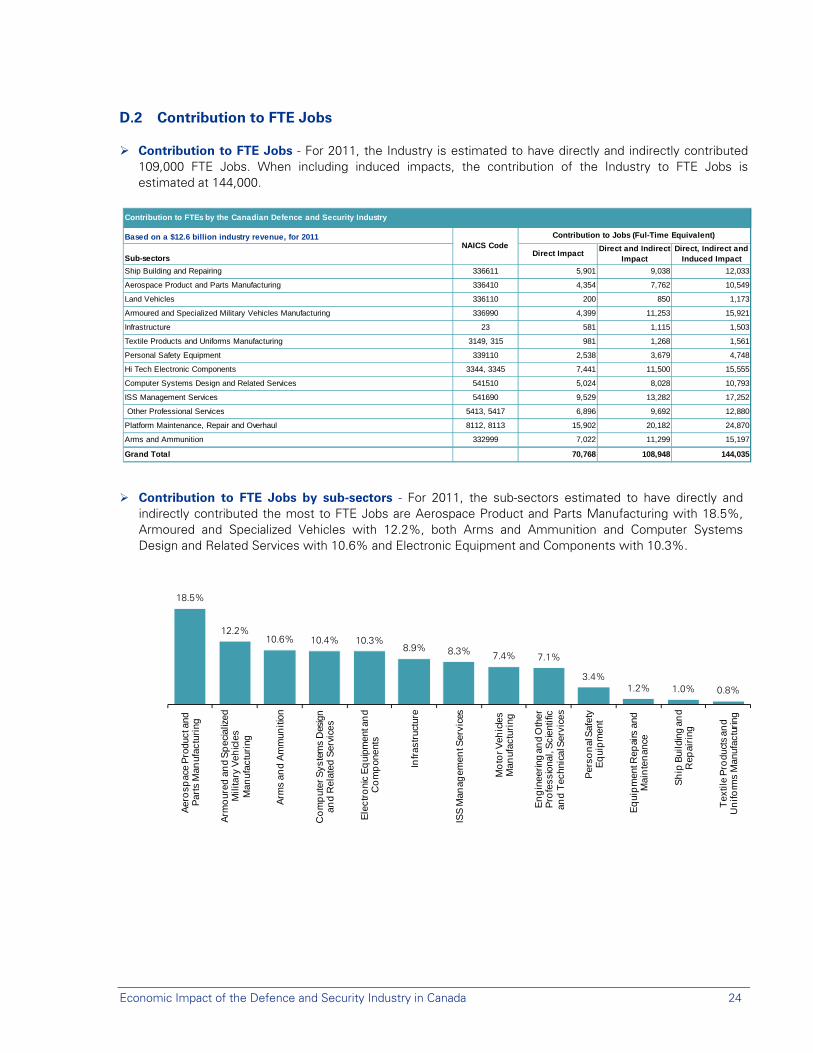
Contribution to FTE Jobs - For 2011, the Industry is estimated to have directly and indirectly contributed 109,000 FTE Jobs. When including induced impacts, the contribution of the Industry to FTE Jobs is estimated at 144,000.
Contribution to FTE Jobs by sub-sectors - For 2011, the sub-sectors estimated to have directly and indirectly contributed the most to FTE Jobs are Aerospace Product and Parts Manufacturing with 18.5%, Armoured and Specialized Vehicles with 12.2%, both Arms and Ammunition and Computer Systems Design and Related Services with 10.6% and Electronic Equipment and Components with 10.3%.
18.5%
12.2%10.6% 10.4% 10.3%
8.9% 8.3% 7.4% 7.1%
3.4%1.2% 1.0% 0.8%
Aer
osp
ace
Pro
duct
and
P
arts
Man
ufac
turi
ng
Arm
our
ed a
nd
Sp
ecia
lized
M
ilita
ry V
ehic
les
Man
ufac
turi
ng
Arm
s an
d A
mm
uniti
on
Co
mp
uter
Sys
tem
s D
esig
n an
d R
elat
ed S
ervi
ces
Ele
ctro
nic
Eq
uipm
ent a
nd
Co
mp
onen
ts
Infr
astr
uctu
re
ISS
Man
agem
ent S
ervi
ces
Mo
tor V
ehic
les
Man
ufac
turi
ng
En
gin
eerin
g an
d O
ther
P
rofe
ssio
nal,
Sci
entif
ic
and
Tec
hnic
al S
ervi
ces
Per
son
al S
afet
y E
qui
pm
ent
Eq
uip
men
t Rep
airs
and
M
ain
ten
ance
Sh
ip B
uild
ing
and
Rep
airi
ng
Tex
tile
Pro
duct
s an
d U
nifo
rms
Man
ufac
turin
g
Contribution to FTEs by the Canadian Defence and Security Industry
Based on a $12.6 billion industry revenue, for 2011
Sub-sectorsDirect Impact
Direct and Indirect Impact
Direct, Indirect and Induced Impact
Ship Building and Repairing 336611 5,901 9,038 12,033
Aerospace Product and Parts Manufacturing 336410 4,354 7,762 10,549
Land Vehicles 336110 200 850 1,173
Armoured and Specialized Military Vehicles Manufacturing 336990 4,399 11,253 15,921
Infrastructure 23 581 1,115 1,503
Textile Products and Uniforms Manufacturing 3149, 315 981 1,268 1,561
Personal Safety Equipment 339110 2,538 3,679 4,748
Hi Tech Electronic Components 3344, 3345 7,441 11,500 15,555
Computer Systems Design and Related Services 541510 5,024 8,028 10,793
ISS Management Services 541690 9,529 13,282 17,252
Other Professional Services 5413, 5417 6,896 9,692 12,880
Platform Maintenance, Repair and Overhaul 8112, 8113 15,902 20,182 24,870
Arms and Ammunition 332999 7,022 11,299 15,197
Grand Total 70,768 108,948 144,035
NAICS CodeContribution to Jobs (Ful-Time Equivalent)
Economic Impact of the Defence and Security Industry in Canada 25
D.3 Contribution to Taxes
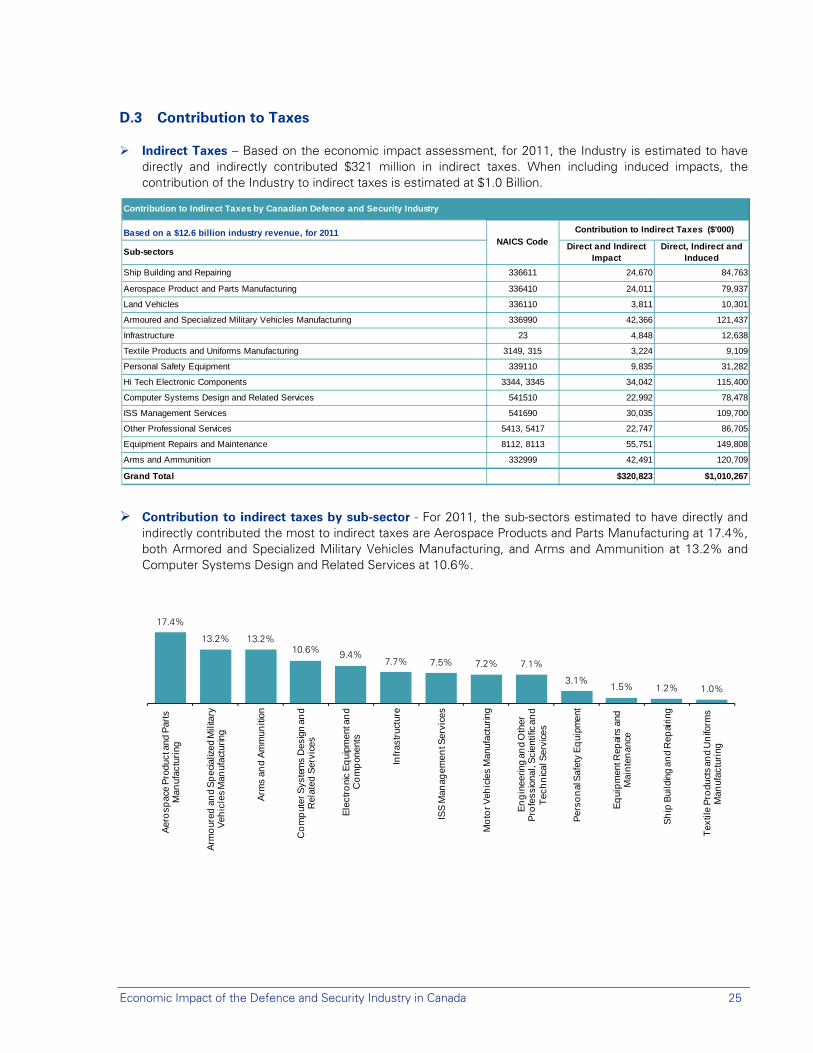
Indirect Taxes – Based on the economic impact assessment, for 2011, the Industry is estimated to have directly and indirectly contributed $321 million in indirect taxes. When including induced impacts, the contribution of the Industry to indirect taxes is estimated at $1.0 Billion.
Contribution to indirect taxes by sub-sector - For 2011, the sub-sectors estimated to have directly and indirectly contributed the most to indirect taxes are Aerospace Products and Parts Manufacturing at 17.4%, both Armored and Specialized Military Vehicles Manufacturing, and Arms and Ammunition at 13.2% and Computer Systems Design and Related Services at 10.6%.
Contribution to Indirect Taxes by Canadian Defence and Security Industry
Based on a $12.6 billion industry revenue, for 2011
Sub-sectorsDirect and Indirect
ImpactDirect, Indirect and
Induced
Ship Building and Repairing 336611 24,670 84,763
Aerospace Product and Parts Manufacturing 336410 24,011 79,937
Land Vehicles 336110 3,811 10,301
Armoured and Specialized Military Vehicles Manufacturing 336990 42,366 121,437
Infrastructure 23 4,848 12,638
Textile Products and Uniforms Manufacturing 3149, 315 3,224 9,109
Personal Safety Equipment 339110 9,835 31,282
Hi Tech Electronic Components 3344, 3345 34,042 115,400
Computer Systems Design and Related Services 541510 22,992 78,478
ISS Management Services 541690 30,035 109,700
Other Professional Services 5413, 5417 22,747 86,705
Equipment Repairs and Maintenance 8112, 8113 55,751 149,808
Arms and Ammunition 332999 42,491 120,709
Grand Total $320,823 $1,010,267
NAICS CodeContribution to Indirect Taxes ($'000)
17.4%
13.2% 13.2%10.6% 9.4%
7.7% 7.5% 7.2% 7.1%
3.1%1.5% 1.2% 1.0%
Aer
osp
ace
Pro
duct
and
Par
ts
Man
ufac
turi
ng
Arm
our
ed a
nd
Sp
ecia
lized
Mili
tary
V
ehic
les
Man
ufac
turin
g
Arm
s an
d A
mm
uniti
on
Co
mp
uter
Sys
tem
s D
esig
n an
d R
elat
ed S
ervi
ces
Ele
ctro
nic
Eq
uipm
ent a
nd
Co
mp
onen
ts
Infr
astr
uctu
re
ISS
Man
agem
ent S
ervi
ces
Mo
tor V
ehic
les
Man
ufac
turin
g
En
gin
eerin
g an
d O
ther
P
rofe
ssio
nal,
Sci
entif
ic a
nd
Tec
hn
ical
Ser
vice
s
Per
son
al S
afet
y E
qui
pmen
t
Eq
uip
men
t Rep
airs
and
M
ain
ten
ance
Sh
ip B
uild
ing
and
Rep
airin
g
Tex
tile
Pro
duct
s an
d U
nifo
rms
Man
ufac
turi
ng
Economic Impact of the Defence and Security Industry in Canada 26
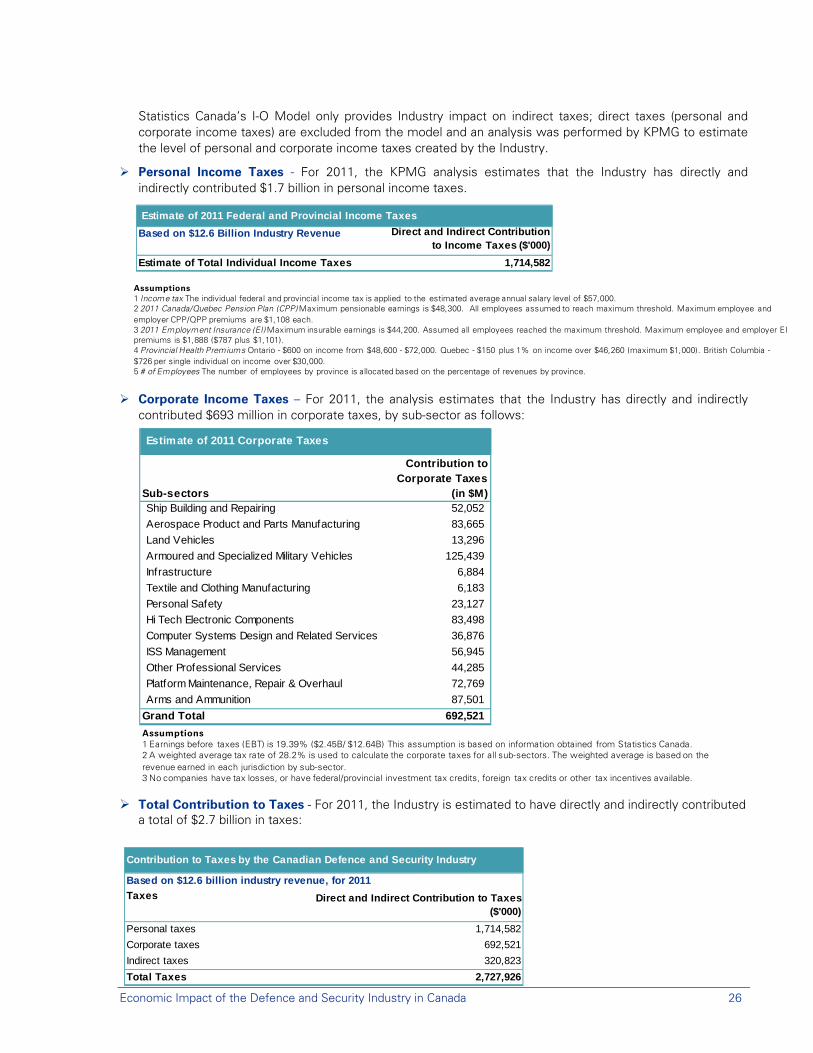
Statistics Canada’s I-O Model only provides Industry impact on indirect taxes; direct taxes (personal and corporate income taxes) are excluded from the model and an analysis was performed by KPMG to estimate the level of personal and corporate income taxes created by the Industry.
Personal Income Taxes - For 2011, the KPMG analysis estimates that the Industry has directly and indirectly contributed $1.7 billion in personal income taxes.
Corporate Income Taxes – For 2011, the analysis estimates that the Industry has directly and indirectly contributed $693 million in corporate taxes, by sub-sector as follows:
Total Contribution to Taxes - For 2011, the Industry is estimated to have directly and indirectly contributed a total of $2.7 billion in taxes:
Estimate of 2011 Corporate Taxes
Sub-sectorsShip Building and Repairing 52,052
Aerospace Product and Parts Manufacturing 83,665
Land Vehicles 13,296
Armoured and Specialized Military Vehicles 125,439
Infrastructure 6,884
Textile and Clothing Manufacturing 6,183
Personal Safety 23,127
Hi Tech Electronic Components 83,498
Computer Systems Design and Related Services 36,876
ISS Management 56,945
Other Professional Services 44,285
Platform Maintenance, Repair & Overhaul 72,769
Arms and Ammunition 87,501
Grand Total 692,521
Contribution to Corporate Taxes
(in $M)
Assumptions1 Income tax The individual federal and provincial income tax is applied to the estimated average annual salary level of $57,000.2 2011 Canada/Quebec Pension Plan (CPP) Maximum pensionable earnings is $48,300. All employees assumed to reach maximum threshold. Maximum employee and employer CPP/QPP premiums are $1,108 each.3 2011 Employment Insurance (EI) Maximum insurable earnings is $44,200. Assumed all employees reached the maximum threshold. Maximum employee and employer EI premiums is $1,888 ($787 plus $1,101).4 Provincial Health Premiums Ontario - $600 on income from $48,600 - $72,000. Quebec - $150 plus 1% on income over $46,260 (maximum $1,000). British Columbia -$726 per single individual on income over $30,000.5 # of Employees The number of employees by province is allocated based on the percentage of revenues by province.
Assumptions1 Earnings before taxes (EBT) is 19.39% ($2.45B/ $12.64B) This assumption is based on information obtained from Statistics Canada.2 A weighted average tax rate of 28.2% is used to calculate the corporate taxes for all sub-sectors. The weighted average is based on the revenue earned in each jurisdiction by sub-sector.3 No companies have tax losses, or have federal/provincial investment tax credits, foreign tax credits or other tax incentives available.
Estimate of 2011 Federal and Provincial Income Taxes
Based on $12.6 Billion Industry Revenue Direct and Indirect Contribution to Income Taxes ($'000)
Estimate of Total Individual Income Taxes 1,714,582
Contribution to Taxes by the Canadian Defence and Security Industry
Based on $12.6 billion industry revenue, for 2011
Taxes Direct and Indirect Contribution to Taxes ($'000)
Personal taxes 1,714,582
Corporate taxes 692,521
Indirect taxes 320,823
Total Taxes 2,727,926
Economic Impact of the Defence and Security Industry in Canada 27
D.1 Economic Impact Multipliers of GDP and FTE Jobs
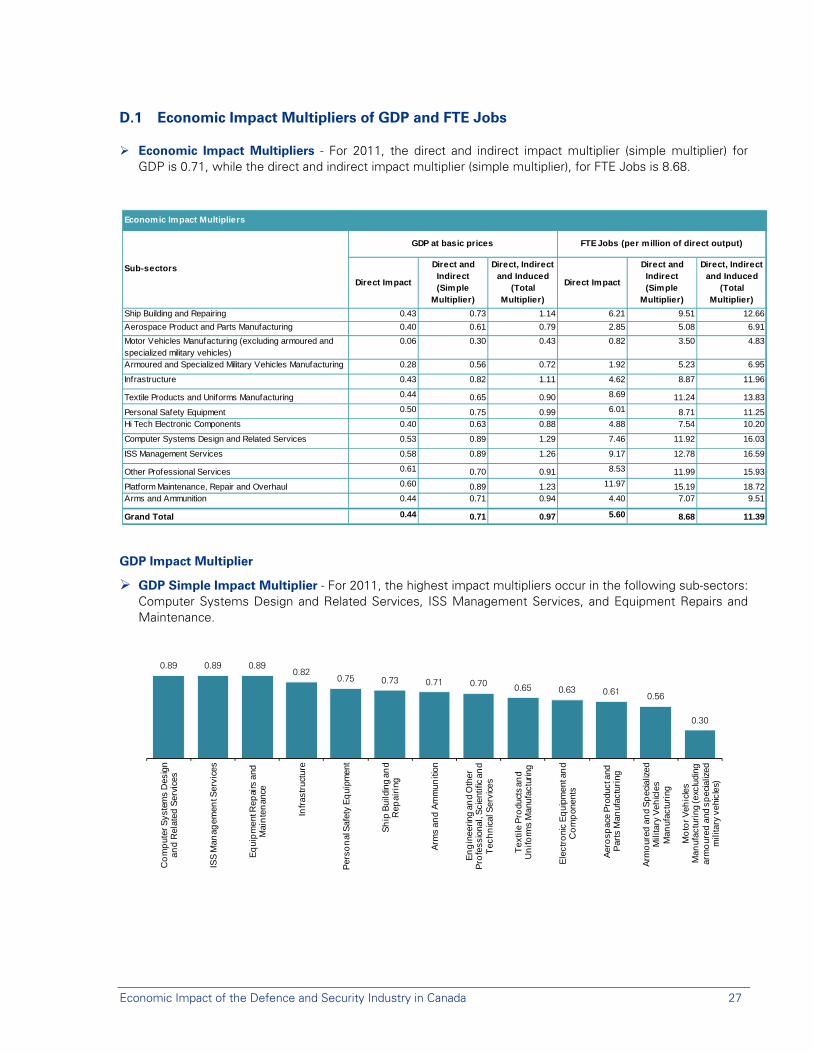
Economic Impact Multipliers - For 2011, the direct and indirect impact multiplier (simple multiplier) for GDP is 0.71, while the direct and indirect impact multiplier (simple multiplier), for FTE Jobs is 8.68.
GDP Impact Multiplier
GDP Simple Impact Multiplier - For 2011, the highest impact multipliers occur in the following sub-sectors: Computer Systems Design and Related Services, ISS Management Services, and Equipment Repairs and Maintenance.
Economic Impact Multipliers
Direct Impact
Direct and Indirect (Simple
Multiplier)
Direct, Indirect and Induced
(Total Multiplier)
Direct Impact
Direct and Indirect (Simple
Multiplier)
Direct, Indirect and Induced
(Total Multiplier)
Ship Building and Repairing 0.43 0.73 1.14 6.21 9.51 12.66
Aerospace Product and Parts Manufacturing 0.40 0.61 0.79 2.85 5.08 6.91
Motor Vehicles Manufacturing (excluding armoured and specialized military vehicles)
0.06 0.30 0.43 0.82 3.50 4.83
Armoured and Specialized Military Vehicles Manufacturing 0.28 0.56 0.72 1.92 5.23 6.95
Infrastructure 0.43 0.82 1.11 4.62 8.87 11.96
Textile Products and Uniforms Manufacturing 0.44 0.65 0.90 8.69 11.24 13.83
Personal Safety Equipment 0.50 0.75 0.99 6.01 8.71 11.25Hi Tech Electronic Components 0.40 0.63 0.88 4.88 7.54 10.20
Computer Systems Design and Related Services 0.53 0.89 1.29 7.46 11.92 16.03
ISS Management Services 0.58 0.89 1.26 9.17 12.78 16.59
Other Professional Services 0.61 0.70 0.91 8.53 11.99 15.93
Platform Maintenance, Repair and Overhaul 0.60 0.89 1.23 11.97 15.19 18.72Arms and Ammunition 0.44 0.71 0.94 4.40 7.07 9.51
Grand Total 0.44 0.71 0.97 5.60 8.68 11.39
Sub-sectors
GDP at basic prices FTE Jobs (per million of direct output)
0.89 0.89 0.890.82
0.75 0.73 0.71 0.70 0.65 0.63 0.61 0.56
0.30
Co
mp
uter
Sys
tem
s D
esig
n an
d R
elat
ed S
ervi
ces
ISS
Man
agem
ent S
ervi
ces
Eq
uip
men
t Rep
airs
and
M
ain
ten
ance
Infr
astr
uctu
re
Per
son
al S
afet
y E
qui
pmen
t
Sh
ip B
uild
ing
and
Rep
airi
ng
Arm
s an
d A
mm
uniti
on
En
gin
eerin
g an
d O
ther
P
rofe
ssio
nal,
Sci
entif
ic a
nd
Tec
hn
ical
Ser
vice
s
Tex
tile
Pro
duct
s an
d U
nifo
rms
Man
ufac
turin
g
Ele
ctro
nic
Eq
uipm
ent a
nd
Co
mp
onen
ts
Aer
osp
ace
Pro
duct
and
P
arts
Man
ufac
turi
ng
Arm
our
ed a
nd
Sp
ecia
lized
M
ilita
ry V
ehic
les
Man
ufac
turi
ng
Mo
tor V
ehic
les
Man
ufac
turi
ng (e
xclu
ding
ar
mo
ured
and
sp
ecia
lized
m
ilita
ry v
ehic
les)
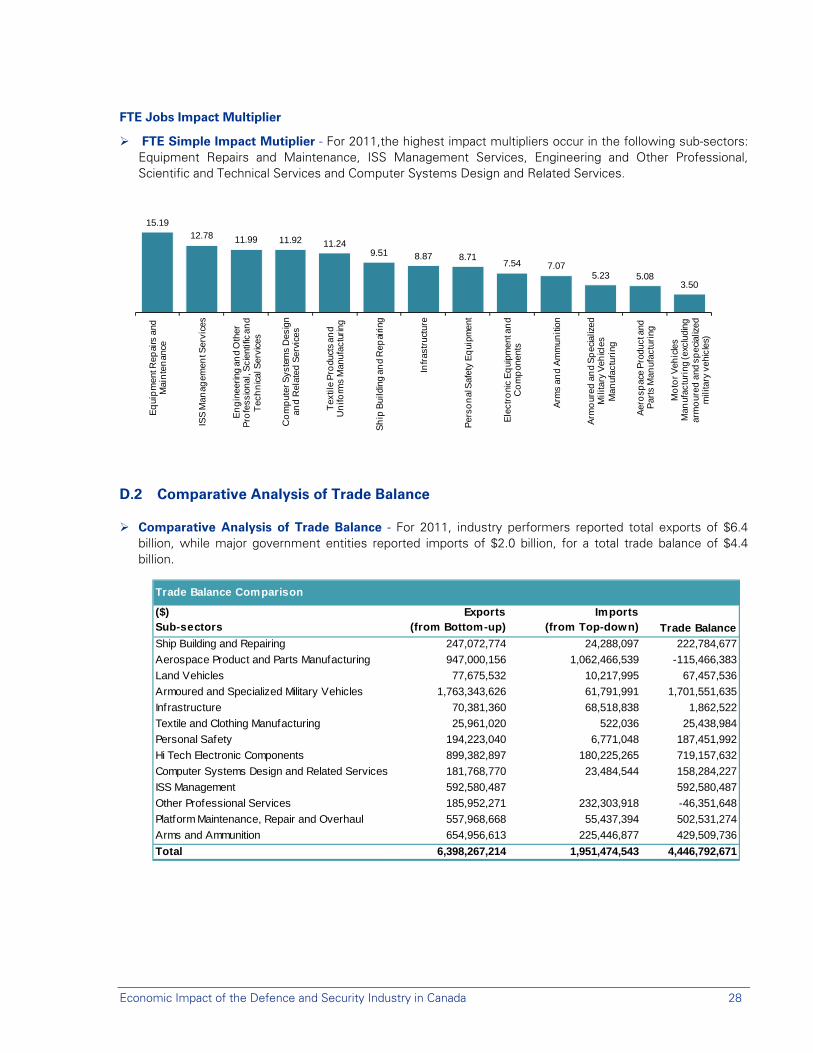
Economic Impact of the Defence and Security Industry in Canada 28
FTE Jobs Impact Multiplier
FTE Simple Impact Mutiplier - For 2011,the highest impact multipliers occur in the following sub-sectors: Equipment Repairs and Maintenance, ISS Management Services, Engineering and Other Professional, Scientific and Technical Services and Computer Systems Design and Related Services.
D.2 Comparative Analysis of Trade Balance
Comparative Analysis of Trade Balance - For 2011, industry performers reported total exports of $6.4 billion, while major government entities reported imports of $2.0 billion, for a total trade balance of $4.4 billion.
15.1912.78 11.99 11.92 11.24
9.51 8.87 8.717.54 7.07
5.23 5.083.50
Eq
uip
men
t Rep
airs
and
M
ain
ten
ance
ISS
Man
agem
ent S
ervi
ces
En
gin
eerin
g an
d O
ther
P
rofe
ssio
nal,
Sci
entif
ic a
nd
Tec
hn
ical
Ser
vice
s
Co
mp
uter
Sys
tem
s D
esig
n an
d R
elat
ed S
ervi
ces
Tex
tile
Pro
duct
s an
d U
nifo
rms
Man
ufac
turin
g
Sh
ip B
uild
ing
and
Rep
airin
g
Infr
astr
uctu
re
Per
son
al S
afet
y E
qui
pmen
t
Ele
ctro
nic
Eq
uipm
ent a
nd
Co
mp
onen
ts
Arm
s an
d A
mm
uniti
on
Arm
our
ed a
nd
Sp
ecia
lized
M
ilita
ry V
ehic
les
Man
ufac
turi
ng
Aer
osp
ace
Pro
duct
and
P
arts
Man
ufac
turi
ng
Mo
tor V
ehic
les
Man
ufac
turi
ng (e
xclu
ding
ar
mo
ured
and
sp
ecia
lized
m
ilita
ry v
ehic
les)
Trade Balance Comparison
($)Sub-sectors
Exports (from Bottom-up)
Imports(from Top-down) Trade Balance
Ship Building and Repairing 247,072,774 24,288,097 222,784,677
Aerospace Product and Parts Manufacturing 947,000,156 1,062,466,539 -115,466,383
Land Vehicles 77,675,532 10,217,995 67,457,536
Armoured and Specialized Military Vehicles 1,763,343,626 61,791,991 1,701,551,635
Infrastructure 70,381,360 68,518,838 1,862,522
Textile and Clothing Manufacturing 25,961,020 522,036 25,438,984
Personal Safety 194,223,040 6,771,048 187,451,992
Hi Tech Electronic Components 899,382,897 180,225,265 719,157,632
Computer Systems Design and Related Services 181,768,770 23,484,544 158,284,227
ISS Management 592,580,487 592,580,487
Other Professional Services 185,952,271 232,303,918 -46,351,648
Platform Maintenance, Repair and Overhaul 557,968,668 55,437,394 502,531,274
Arms and Ammunition 654,956,613 225,446,877 429,509,736
Total 6,398,267,214 1,951,474,543 4,446,792,671
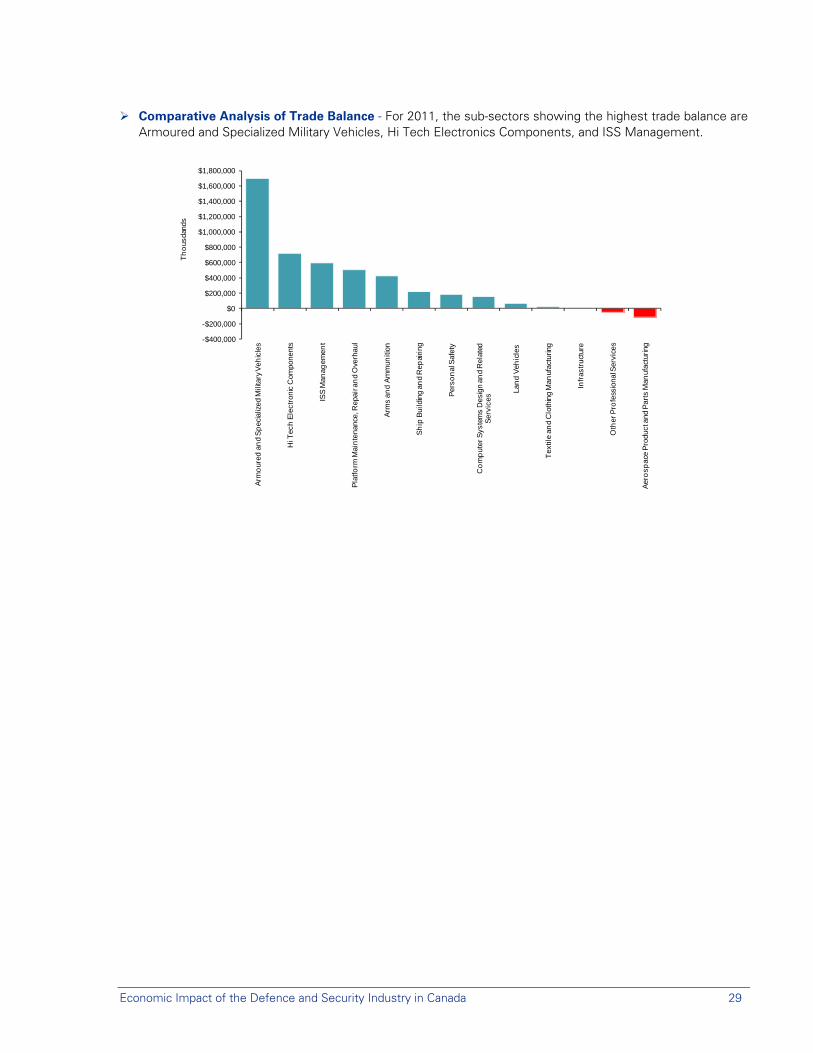
Economic Impact of the Defence and Security Industry in Canada 29
Comparative Analysis of Trade Balance - For 2011, the sub-sectors showing the highest trade balance are Armoured and Specialized Military Vehicles, Hi Tech Electronics Components, and ISS Management.
-$400,000
-$200,000
$0
$200,000
$400,000
$600,000
$800,000
$1,000,000
$1,200,000
$1,400,000
$1,600,000
$1,800,000
Arm
our
ed a
nd
Sp
ecia
lized
Mili
tary
Veh
icle
s
Hi T
ech
Ele
ctro
nic
Com
pone
nts
ISS
Man
agem
ent
Pla
tform
Mai
nte
nanc
e, R
epai
r an
d O
verh
aul
Arm
s an
d A
mm
uniti
on
Sh
ip B
uild
ing
and
Rep
airin
g
Per
son
al S
afet
y
Co
mp
uter
Sys
tem
s D
esig
n an
d R
elat
ed
Ser
vice
s
Lan
d V
ehic
les
Tex
tile
and
Clo
thin
g M
anuf
actu
ring
Infr
astr
uctu
re
Oth
er P
rofe
ssio
nal S
ervi
ces
Aer
osp
ace
Pro
duct
and
Par
ts M
anuf
actu
ring
Th
ous
dand
s
Economic Impact of the Defence and Security Industry in Canada 30
Appendix E – Survey Methodology
E.1 Scope
This study targets the defence and security industry at the national level. For survey purposes (bottom up), the Industry was divided into thirteen sub-sectors, as follows:
shipbuilding and repairing
aerospace product and parts manufacturing
land vehicles
armoured and specialized military vehicles
infrastructure
textile and clothing manufacturing
personal safety
hi-tech electronic components
computer systems design and related services
integrated system support management
other professional services
platform maintenance, repair and overhaul
arms and ammunition
For validation purposes (top down), an analysis of expenditures by major Canadian government entities was performed. The objective was to capture the main government entities involved in the Industry. For this top-down approach, only the federal level was included in the scope. Municipal and provincial players, such as provincial correctional services and public security, were excluded, with the exception of municipal and provincial police services, which were included. The primary government entities included in the top-down approach are: Department of National Defence, Royal Canadian Mounted Police, Canada Border Services Agency, Correctional Services Canada, Ontario Provincial Police, and other municipal and provincial police forces. Private security solutions providers were excluded from the scope of this study.
KPMG and CADSI together reviewed the relevance and usefulness of industry sub-categories identified and ensured that there was a common understanding with regard to what each industry sub-category should contain. The following considerations were taken into account when identifying the categories for which a standalone simulation would be performed based on the desire for CADSI to:
Discuss each sub-category separately when discussing economic benefits;
Vary revenue in future years to reflect the industries’ evolution; and,
Perform various sensitivity scenarios on that particular sub-category.
The tables below lists the sub-sectors of the defence and security industry used for this study. As shown, three columns of descriptors were used to identify industry subsectors:
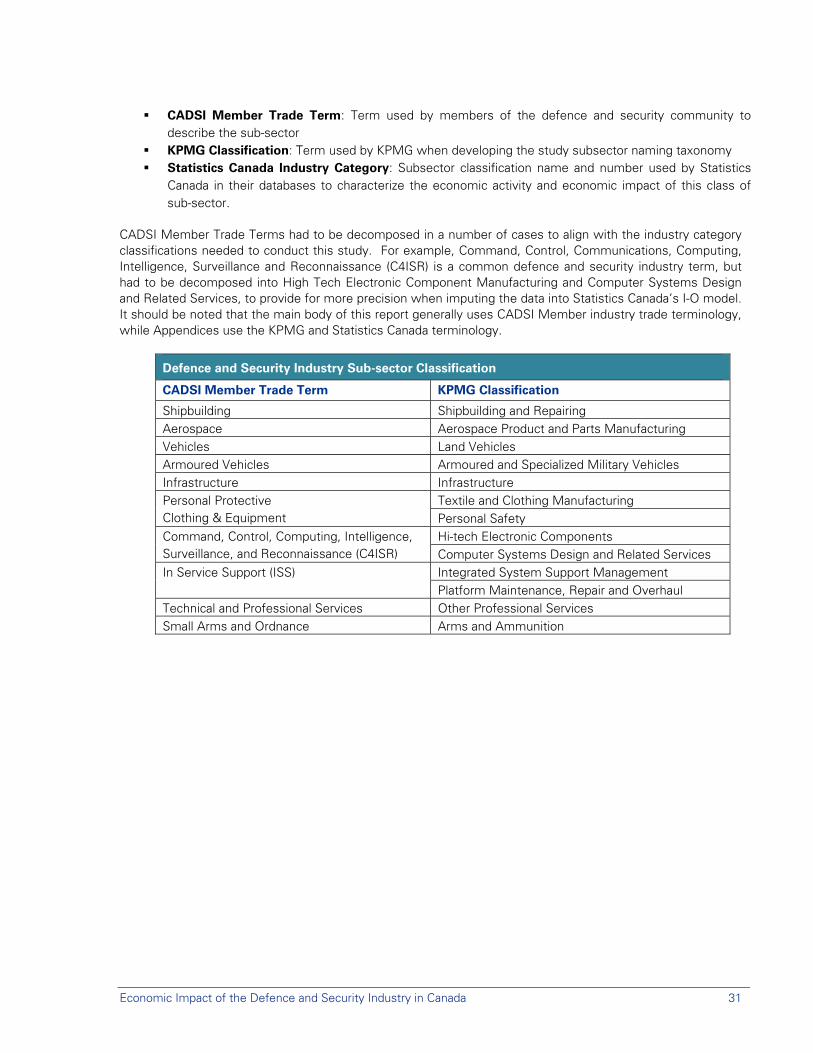
Economic Impact of the Defence and Security Industry in Canada 31
CADSI Member Trade Term: Term used by members of the defence and security community to describe the sub-sector
KPMG Classification: Term used by KPMG when developing the study subsector naming taxonomy Statistics Canada Industry Category: Subsector classification name and number used by Statistics
Canada in their databases to characterize the economic activity and economic impact of this class of sub-sector.
CADSI Member Trade Terms had to be decomposed in a number of cases to align with the industry category classifications needed to conduct this study. For example, Command, Control, Communications, Computing, Intelligence, Surveillance and Reconnaissance (C4ISR) is a common defence and security industry term, but had to be decomposed into High Tech Electronic Component Manufacturing and Computer Systems Design and Related Services, to provide for more precision when imputing the data into Statistics Canada’s I-O model. It should be noted that the main body of this report generally uses CADSI Member industry trade terminology, while Appendices use the KPMG and Statistics Canada terminology.
Defence and Security Industry Sub-sector Classification
CADSI Member Trade Term KPMG Classification
Shipbuilding Shipbuilding and Repairing Aerospace Aerospace Product and Parts Manufacturing Vehicles Land Vehicles Armoured Vehicles Armoured and Specialized Military Vehicles Infrastructure Infrastructure Personal Protective Clothing & Equipment
Textile and Clothing Manufacturing Personal Safety
Command, Control, Computing, Intelligence, Surveillance, and Reconnaissance (C4ISR)
Hi-tech Electronic Components Computer Systems Design and Related Services
In Service Support (ISS) Integrated System Support Management Platform Maintenance, Repair and Overhaul
Technical and Professional Services Other Professional Services Small Arms and Ordnance Arms and Ammunition
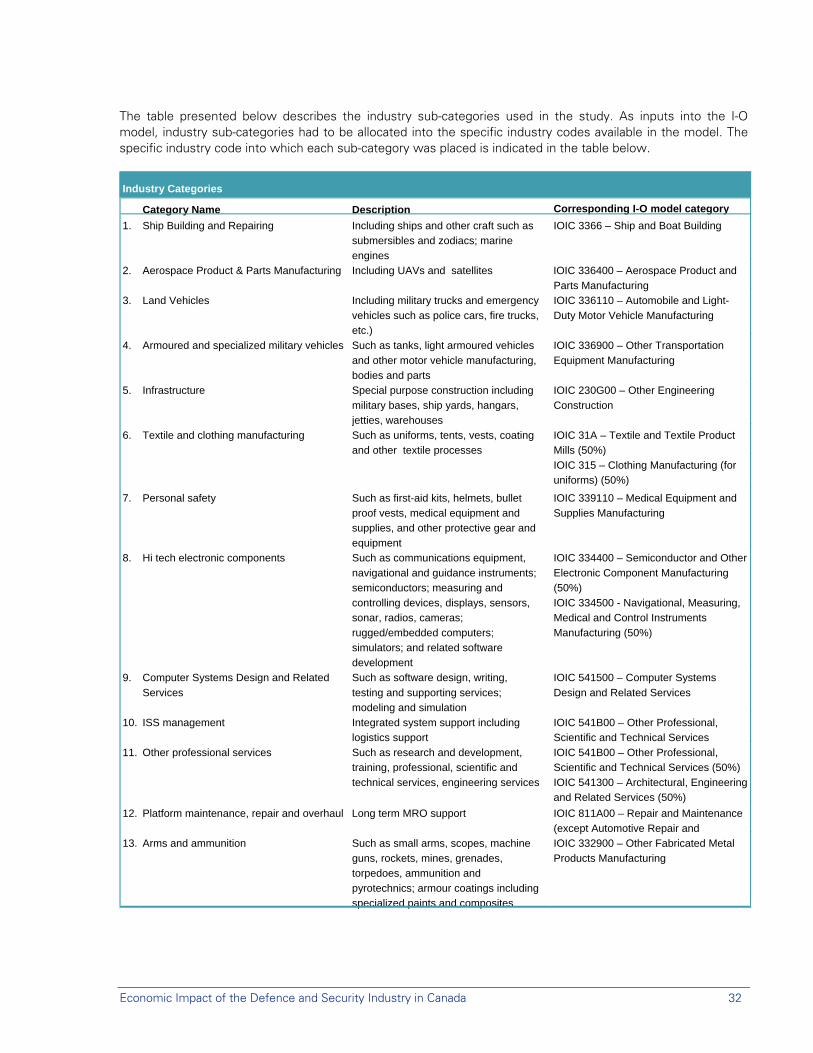
Economic Impact of the Defence and Security Industry in Canada 32
The table presented below describes the industry sub-categories used in the study. As inputs into the I-O model, industry sub-categories had to be allocated into the specific industry codes available in the model. The specific industry code into which each sub-category was placed is indicated in the table below.
Industry Categories
Category Name Description Corresponding I-O model category
1. Ship Building and Repairing Including ships and other craft such as
submersibles and zodiacs; marine
engines
IOIC 3366 – Ship and Boat Building
2. Aerospace Product & Parts Manufacturing Including UAVs and satellites IOIC 336400 – Aerospace Product and
Parts Manufacturing
3. Land Vehicles Including military trucks and emergency
vehicles such as police cars, fire trucks,
etc.)
IOIC 336110 – Automobile and Light-
Duty Motor Vehicle Manufacturing
4. Armoured and specialized military vehicles Such as tanks, light armoured vehicles
and other motor vehicle manufacturing,
bodies and parts
IOIC 336900 – Other Transportation
Equipment Manufacturing
5. Infrastructure Special purpose construction including
military bases, ship yards, hangars,
jetties, warehouses
IOIC 230G00 – Other Engineering
Construction
6. Textile and clothing manufacturing Such as uniforms, tents, vests, coating
and other textile processes
IOIC 31A – Textile and Textile Product
Mills (50%) IOIC 315 – Clothing Manufacturing (for
uniforms) (50%) 7. Personal safety Such as first-aid kits, helmets, bullet
proof vests, medical equipment and
supplies, and other protective gear and
equipment
IOIC 339110 – Medical Equipment and
Supplies Manufacturing
8. Hi tech electronic components Such as communications equipment,
navigational and guidance instruments;
semiconductors; measuring and
controlling devices, displays, sensors,
sonar, radios, cameras;
rugged/embedded computers;
simulators; and related software
development
IOIC 334400 – Semiconductor and Other
Electronic Component Manufacturing
(50%)
IOIC 334500 - Navigational, Measuring,
Medical and Control Instruments
Manufacturing (50%)
9. Computer Systems Design and Related
Services
Such as software design, writing,
testing and supporting services;
modeling and simulation
IOIC 541500 – Computer Systems
Design and Related Services
10. ISS management Integrated system support including
logistics support
IOIC 541B00 – Other Professional,
Scientific and Technical Services
11. Other professional services Such as research and development,
training, professional, scientific and
technical services, engineering services
IOIC 541B00 – Other Professional,
Scientific and Technical Services (50%)
IOIC 541300 – Architectural, Engineering
and Related Services (50%)
12. Platform maintenance, repair and overhaul Long term MRO support IOIC 811A00 – Repair and Maintenance
(except Automotive Repair and
13. Arms and ammunition Such as small arms, scopes, machine
guns, rockets, mines, grenades,
torpedoes, ammunition and
pyrotechnics; armour coatings including
specialized paints and composites
IOIC 332900 – Other Fabricated Metal
Products Manufacturing
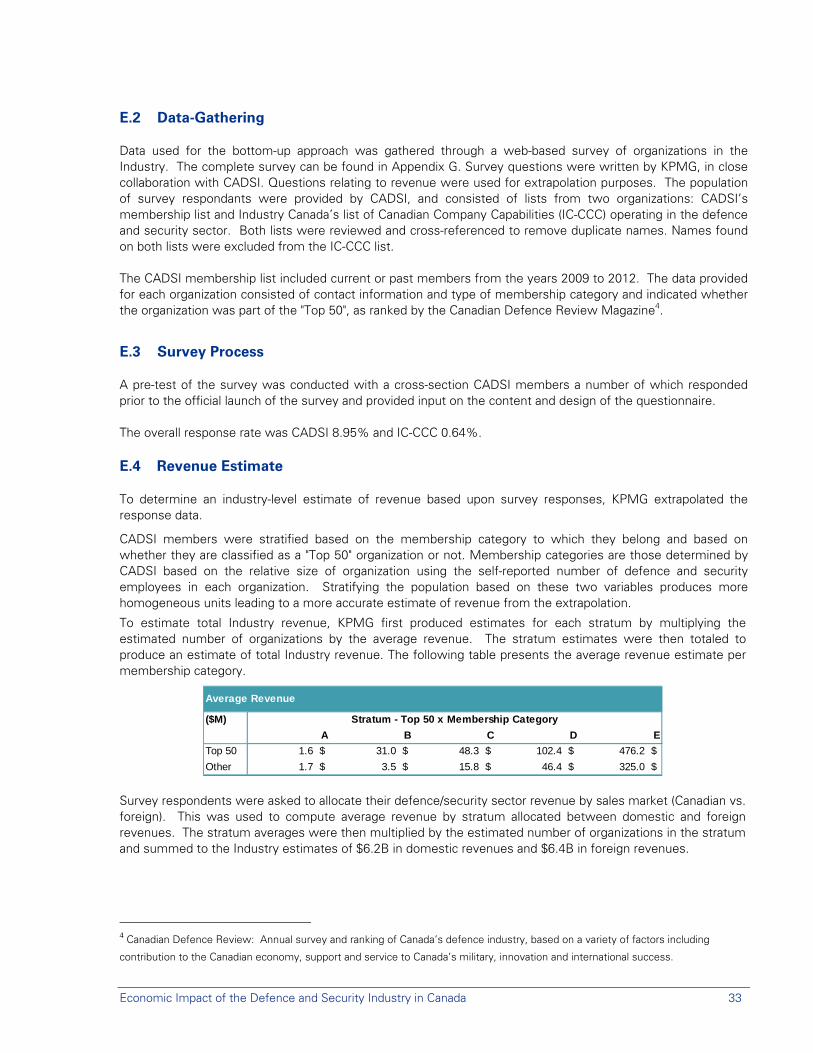
Economic Impact of the Defence and Security Industry in Canada 33
E.2 Data-Gathering
Data used for the bottom-up approach was gathered through a web-based survey of organizations in the Industry. The complete survey can be found in Appendix G. Survey questions were written by KPMG, in close collaboration with CADSI. Questions relating to revenue were used for extrapolation purposes. The population of survey respondants were provided by CADSI, and consisted of lists from two organizations: CADSI’s membership list and Industry Canada’s list of Canadian Company Capabilities (IC-CCC) operating in the defence and security sector. Both lists were reviewed and cross-referenced to remove duplicate names. Names found on both lists were excluded from the IC-CCC list.
The CADSI membership list included current or past members from the years 2009 to 2012. The data provided for each organization consisted of contact information and type of membership category and indicated whether the organization was part of the "Top 50", as ranked by the Canadian Defence Review Magazine4.
E.3 Survey Process
A pre-test of the survey was conducted with a cross-section CADSI members a number of which responded prior to the official launch of the survey and provided input on the content and design of the questionnaire.
The overall response rate was CADSI 8.95% and IC-CCC 0.64%.
E.4 Revenue Estimate
To determine an industry-level estimate of revenue based upon survey responses, KPMG extrapolated the response data.
CADSI members were stratified based on the membership category to which they belong and based on whether they are classified as a "Top 50" organization or not. Membership categories are those determined by CADSI based on the relative size of organization using the self-reported number of defence and security employees in each organization. Stratifying the population based on these two variables produces more homogeneous units leading to a more accurate estimate of revenue from the extrapolation.
To estimate total Industry revenue, KPMG first produced estimates for each stratum by multiplying the estimated number of organizations by the average revenue. The stratum estimates were then totaled to produce an estimate of total Industry revenue. The following table presents the average revenue estimate per membership category.
Survey respondents were asked to allocate their defence/security sector revenue by sales market (Canadian vs. foreign). This was used to compute average revenue by stratum allocated between domestic and foreign revenues. The stratum averages were then multiplied by the estimated number of organizations in the stratum and summed to the Industry estimates of $6.2B in domestic revenues and $6.4B in foreign revenues.
4 Canadian Defence Review: Annual survey and ranking of Canada’s defence industry, based on a variety of factors including
contribution to the Canadian economy, support and service to Canada’s military, innovation and international success.
Average Revenue
($M)
A B C D E
Top 50 1.6 $ 31.0 $ 48.3 $ 102.4 $ 476.2 $
Other 1.7 $ 3.5 $ 15.8 $ 46.4 $ 325.0 $
Stratum - Top 50 x Membership Category
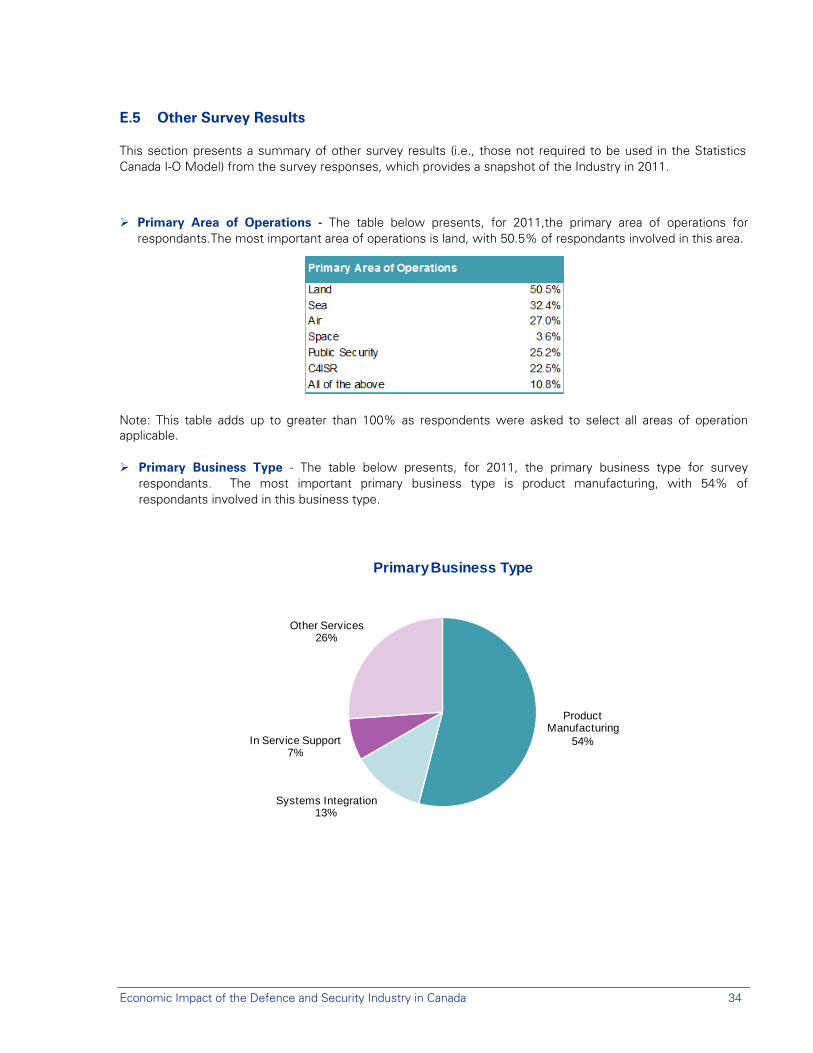
Economic Impact of the Defence and Security Industry in Canada 34
E.5 Other Survey Results
This section presents a summary of other survey results (i.e., those not required to be used in the Statistics Canada I-O Model) from the survey responses, which provides a snapshot of the Industry in 2011.
Primary Area of Operations - The table below presents, for 2011,the primary area of operations for respondants.The most important area of operations is land, with 50.5% of respondants involved in this area.
Note: This table adds up to greater than 100% as respondents were asked to select all areas of operation applicable.
Primary Business Type - The table below presents, for 2011, the primary business type for survey respondants. The most important primary business type is product manufacturing, with 54% of respondants involved in this business type.
Product Manufacturing
54%
Systems Integration13%
In Service Support7%
Other Services26%
Primary Business Type
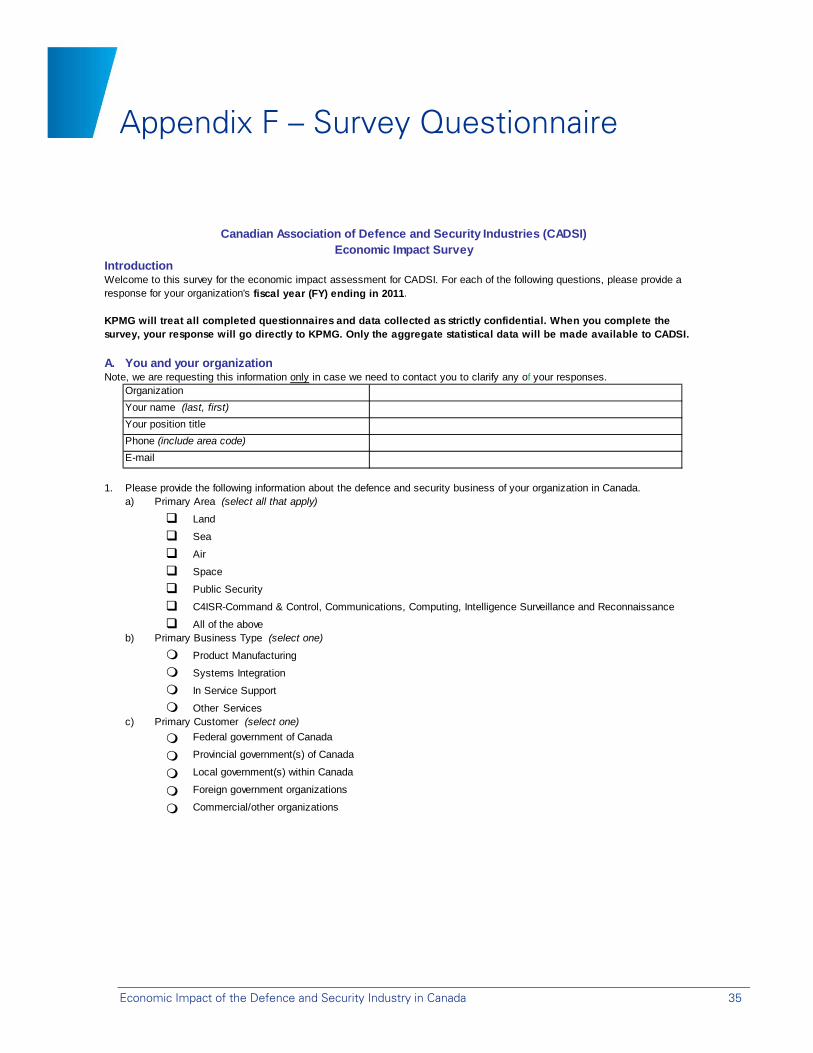
Economic Impact of the Defence and Security Industry in Canada 35
Appendix F – Survey Questionnaire
Canadian Association of Defence and Security Industries (CADSI)Economic Impact Survey
IntroductionWelcome to this survey for the economic impact assessment for CADSI. For each of the following questions, please provide aresponse for your organization's fiscal year (FY) ending in 2011.
KPMG will treat all completed questionnaires and data collected as strictly confidential. When you complete thesurvey, your response will go directly to KPMG. Only the aggregate statistical data will be made available to CADSI.
A. You and your organization Note, we are requesting this information only in case we need to contact you to clarify any of your responses.
Your name (last, first)
Your position title
Phone (include area code)
1. Please provide the following information about the defence and security business of your organization in Canada.a) Primary Area (select all that apply)
Land
Sea
Air
Space
Public Security
C4ISR-Command & Control, Communications, Computing, Intelligence Surveillance and Reconnaissance
All of the aboveb) Primary Business Type (select one)
Product Manufacturing
Systems Integration
In Service Support
Other Servicesc) Primary Customer (select one)
Federal government of Canada
Provincial government(s) of Canada
Local government(s) within Canada
Foreign government organizations
Commercial/other organizations
Organization
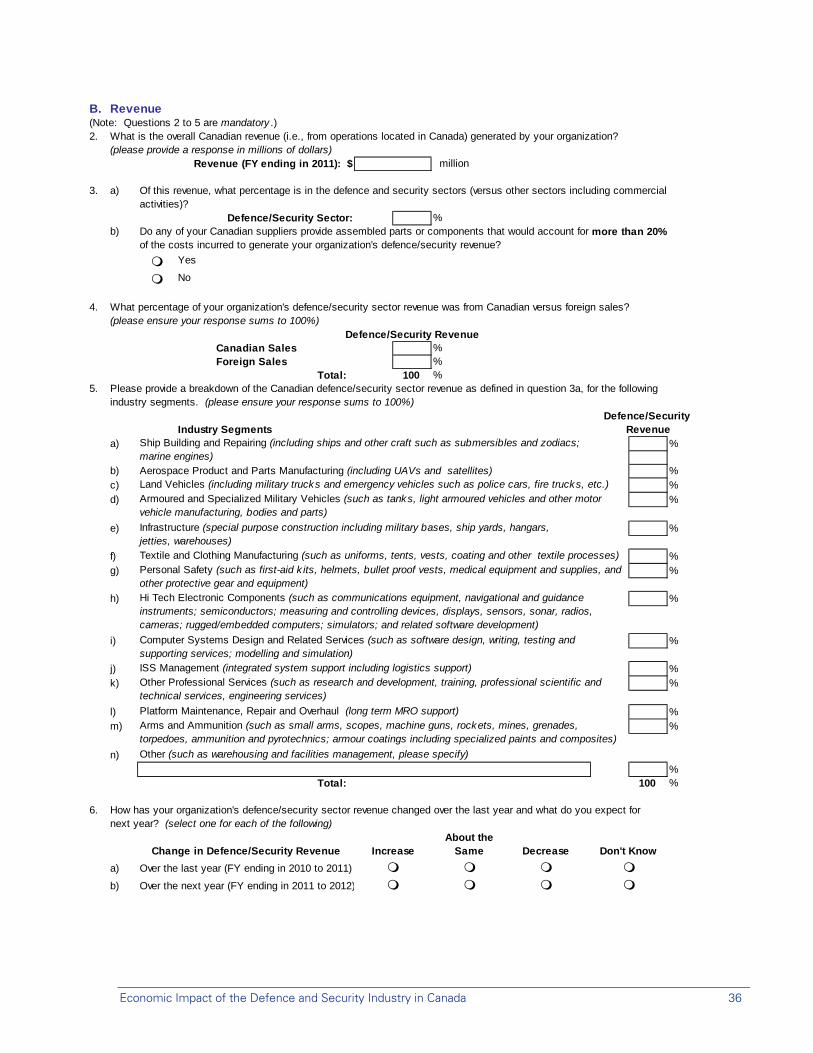
Economic Impact of the Defence and Security Industry in Canada 36
B. Revenue(Note: Questions 2 to 5 are mandatory .)2. What is the overall Canadian revenue (i.e., from operations located in Canada) generated by your organization?
(please provide a response in millions of dollars)Revenue (FY ending in 2011): $ million
3. a) Of this revenue, what percentage is in the defence and security sectors (versus other sectors including commercialactivities)?
Defence/Security Sector: %b) Do any of your Canadian suppliers provide assembled parts or components that would account for more than 20%
of the costs incurred to generate your organization's defence/security revenue?
Yes
No
4. What percentage of your organization's defence/security sector revenue was from Canadian versus foreign sales?(please ensure your response sums to 100%)
Defence/Security RevenueCanadian Sales %Foreign Sales %
Total: 100 %5. Please provide a breakdown of the Canadian defence/security sector revenue as defined in question 3a, for the following
industry segments. (please ensure your response sums to 100%)Defence/Security
Industry Segments Revenuea) %
b) Aerospace Product and Parts Manufacturing (including UAVs and satellites) %c) Land Vehicles (including military trucks and emergency vehicles such as police cars, fire trucks, etc.) %d) %
e) %
f) Textile and Clothing Manufacturing (such as uniforms, tents, vests, coating and other textile processes) %g) %
h) %
i) %
j) ISS Management (integrated system support including logistics support) %k) %
l) Platform Maintenance, Repair and Overhaul (long term MRO support) %m) %
n) Other (such as warehousing and facilities management, please specify)
%Total: 100 %
6. How has your organization's defence/security sector revenue changed over the last year and what do you expect fornext year? (select one for each of the following)
Change in Defence/Security Revenue IncreaseAbout the
Same Decrease Don't Know
a) Over the last year (FY ending in 2010 to 2011) b) Over the next year (FY ending in 2011 to 2012)
Personal Safety (such as first-aid k its, helmets, bullet proof vests, medical equipment and supplies, and other protective gear and equipment)
Infrastructure (special purpose construction including military bases, ship yards, hangars, jetties, warehouses)
Armoured and Specialized Military Vehicles (such as tanks, light armoured vehicles and other motor vehicle manufacturing, bodies and parts)
Ship Building and Repairing (including ships and other craft such as submersibles and zodiacs; marine engines)
Arms and Ammunition (such as small arms, scopes, machine guns, rockets, mines, grenades, torpedoes, ammunition and pyrotechnics; armour coatings including specialized paints and composites)
Other Professional Services (such as research and development, training, professional scientific and technical services, engineering services)
Computer Systems Design and Related Services (such as software design, writing, testing and supporting services; modelling and simulation)
Hi Tech Electronic Components (such as communications equipment, navigational and guidance instruments; semiconductors; measuring and controlling devices, displays, sensors, sonar, radios, cameras; rugged/embedded computers; simulators; and related software development)
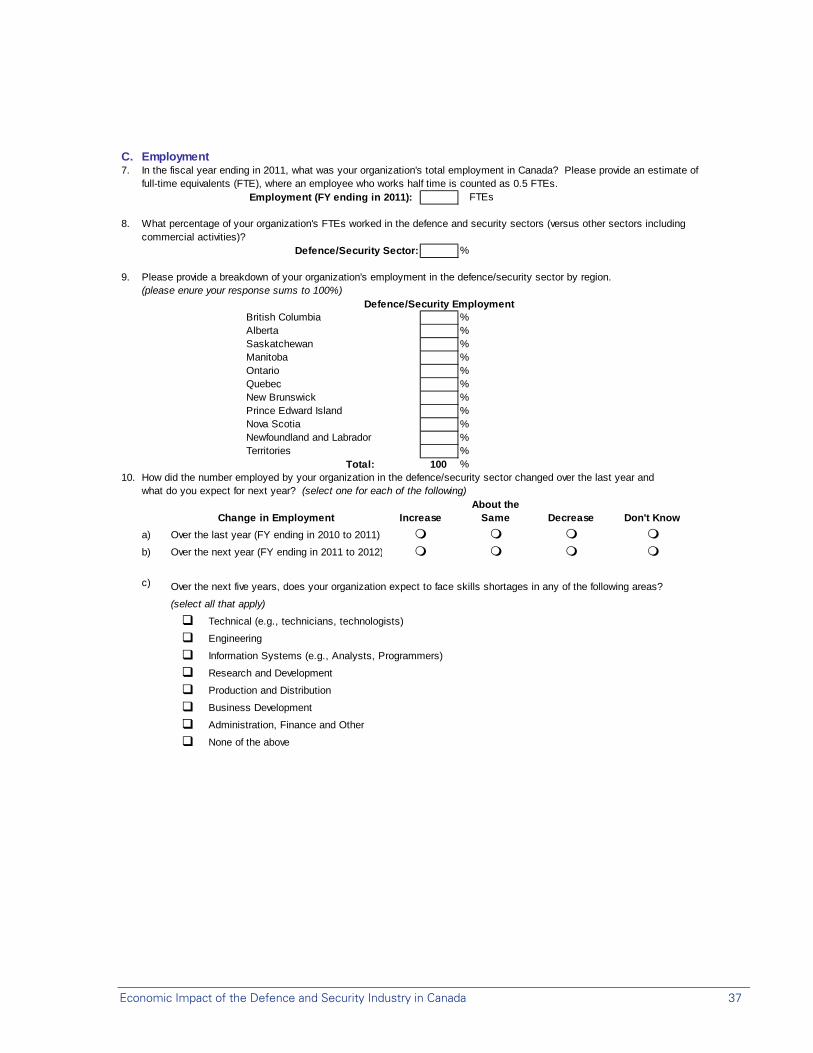
Economic Impact of the Defence and Security Industry in Canada 37
C. Employment7. In the fiscal year ending in 2011, what was your organization's total employment in Canada? Please provide an estimate of
full-time equivalents (FTE), where an employee who works half time is counted as 0.5 FTEs.Employment (FY ending in 2011): FTEs
8. What percentage of your organization's FTEs worked in the defence and security sectors (versus other sectors includingcommercial activities)?
Defence/Security Sector: %
9. Please provide a breakdown of your organization's employment in the defence/security sector by region.(please enure your response sums to 100%)
Defence/Security EmploymentBritish Columbia %Alberta %Saskatchewan %Manitoba %Ontario %Quebec %New Brunswick %Prince Edward Island %Nova Scotia %Newfoundland and Labrador %Territories %
Total: 100 %10. How did the number employed by your organization in the defence/security sector changed over the last year and
what do you expect for next year? (select one for each of the following)
Change in Employment IncreaseAbout the
Same Decrease Don't Know
a) Over the last year (FY ending in 2010 to 2011) b) Over the next year (FY ending in 2011 to 2012)
c) Over the next five years, does your organization expect to face skills shortages in any of the following areas?
(select all that apply)
Technical (e.g., technicians, technologists)
Engineering
Information Systems (e.g., Analysts, Programmers)
Research and Development
Production and Distribution
Business Development
Administration, Finance and Other
None of the above
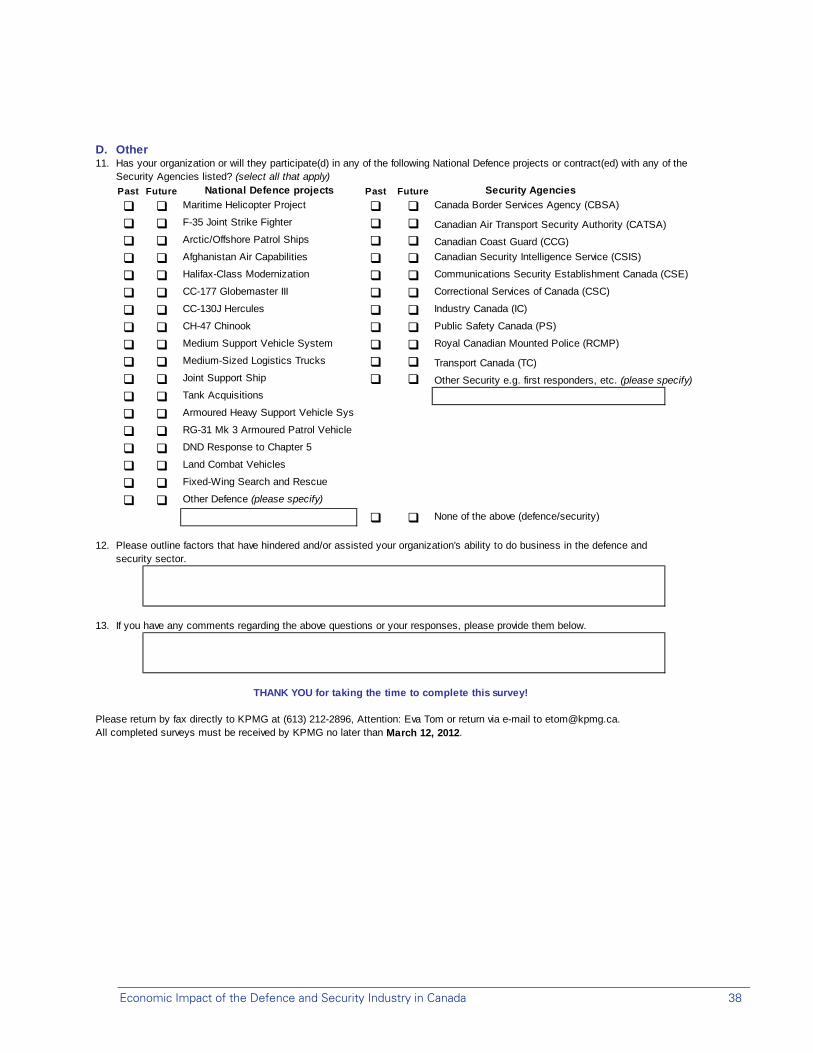
Economic Impact of the Defence and Security Industry in Canada 38
D. Other11. Has your organization or will they participate(d) in any of the following National Defence projects or contract(ed) with any of the
Security Agencies listed? (select all that apply)
Past Future National Defence projects Past Future Security Agencies
Maritime Helicopter Project Canada Border Services Agency (CBSA)
F-35 Joint Strike Fighter Canadian Air Transport Security Authority (CATSA)
Arctic/Offshore Patrol Ships Canadian Coast Guard (CCG)
Afghanistan Air Capabilities Canadian Security Intelligence Service (CSIS)
Halifax-Class Modernization Communications Security Establishment Canada (CSE)
CC-177 Globemaster III Correctional Services of Canada (CSC)
CC-130J Hercules Industry Canada (IC)
CH-47 Chinook Public Safety Canada (PS)
Medium Support Vehicle System Royal Canadian Mounted Police (RCMP)
Medium-Sized Logistics Trucks Transport Canada (TC)
Joint Support Ship Other Security e.g. first responders, etc. (please specify)
Tank Acquisitions
Armoured Heavy Support Vehicle Sys
RG-31 Mk 3 Armoured Patrol Vehicle
DND Response to Chapter 5
Land Combat Vehicles
Fixed-Wing Search and Rescue
Other Defence (please specify)
None of the above (defence/security)
12. Please outline factors that have hindered and/or assisted your organization's ability to do business in the defence andsecurity sector.
13. If you have any comments regarding the above questions or your responses, please provide them below.
THANK YOU for taking the time to complete this survey!
Please return by fax directly to KPMG at (613) 212-2896, Attention: Eva Tom or return via e-mail to [email protected] completed surveys must be received by KPMG no later than March 12, 2012.