Embed Size (px)
Citation preview

Advisory Board Presentation
December 5th, 2011 AIM XXXIII

Presentation Agenda
AIM XXXIII 2
Personal Introductions
Presentation Topics I. Objectives and Guidelines
II. Economic Environment
III. Security Analysis
IV. Portfolio Performance Evaluation
V. General Information
Concluding Remarks
AIM Analyst Bios
AIM XXXIII 3
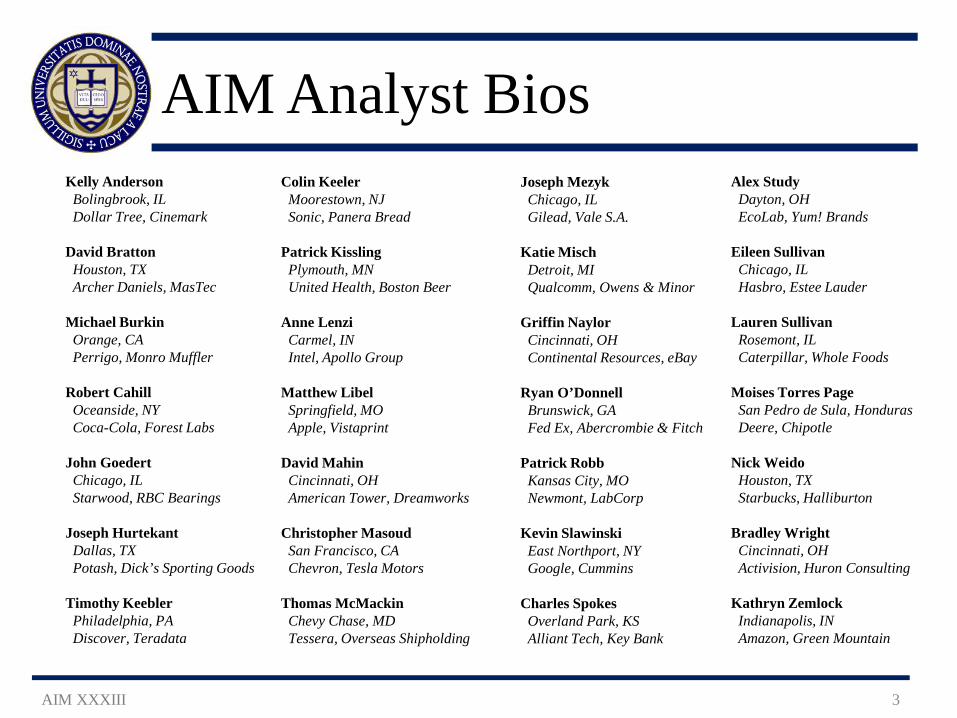
Kelly Anderson Bolingbrook, IL Dollar Tree, Cinemark David Bratton Houston, TX Archer Daniels, MasTec Michael Burkin Orange, CA Perrigo, Monro Muffler Robert Cahill Oceanside, NY Coca-Cola, Forest Labs John Goedert Chicago, IL Starwood, RBC Bearings Joseph Hurtekant Dallas, TX Potash, Dick’s Sporting Goods Timothy Keebler Philadelphia, PA Discover, Teradata
Colin Keeler Moorestown, NJ Sonic, Panera Bread Patrick Kissling Plymouth, MN United Health, Boston Beer Anne Lenzi Carmel, IN Intel, Apollo Group Matthew Libel Springfield, MO Apple, Vistaprint David Mahin Cincinnati, OH American Tower, Dreamworks Christopher Masoud San Francisco, CA Chevron, Tesla Motors Thomas McMackin Chevy Chase, MD Tessera, Overseas Shipholding
Joseph Mezyk Chicago, IL Gilead, Vale S.A. Katie Misch Detroit, MI Qualcomm, Owens & Minor Griffin Naylor Cincinnati, OH Continental Resources, eBay Ryan O’Donnell Brunswick, GA Fed Ex, Abercrombie & Fitch Patrick Robb Kansas City, MO Newmont, LabCorp Kevin Slawinski East Northport, NY Google, Cummins Charles Spokes Overland Park, KS Alliant Tech, Key Bank
Alex Study Dayton, OH EcoLab, Yum! Brands Eileen Sullivan Chicago, IL Hasbro, Estee Lauder Lauren Sullivan Rosemont, IL Caterpillar, Whole Foods Moises Torres Page San Pedro de Sula, Honduras Deere, Chipotle Nick Weido Houston, TX Starbucks, Halliburton Bradley Wright Cincinnati, OH Activision, Huron Consulting Kathryn Zemlock Indianapolis, IN Amazon, Green Mountain

I. Objectives and Guidelines
AIM XXXIII 4

Overview
AIM XXXIII 5
Analyst Selection ‒ Potential analysts submit both an application and resume ‒ Analyst class selected based on academic record and
professional experience
Course Objectives ‒ Blend traditional academic objectives with practical
experience of hands-on investment management ‒ Provide analysts with thorough grounding in process of
portfolio management
Analyst Responsibilities
AIM XXXIII 6
Stock Selection ‒ 1st Stock: Inherited position from previous AIM analysts and updated
intrinsic value ‒ 2nd Stock: Selected new security and valued by current analyst
Equity Valuation ‒ Company Background ‒ Industry Analysis ‒ Fundamental Analysis ‒ Earnings Forecast ‒ Intrinsic Valuation ‒ Technical Analysis
Group Responsibilities
AIM XXXIII 7
Economic Analysis ‒ Important economic indicators ‒ Current economic events ‒ Assess impact on portfolio
Portfolio Performance Analysis ‒ Relative performance to benchmarks ‒ Sector weighting ‒ Risk-adjusted performance metrics
Trade Execution Class Log Newsletter compilation Webmasters
Portfolio Decision Process
AIM XXXIII 8
Hold/sell or buy/no buy recommendations given by analysts based on intrinsic valuations
Full discussion of key assumptions and drivers of analyst presentations
Final portfolio decisions decided by majority vote of all analysts
Hedge positions recommended, discussed and voted upon by analysts
Investment Philosophy
AIM XXXIII 9
Investment Objective ‒ Outperform our primary (S&P 500) and secondary
benchmarks (Russell 2000, Russell 1000 and the Hank Blended Index) over a long term time horizon (3-5 years)
Risk Tolerance ‒ Not a factor that will be actively managed since portfolio
diversification will naturally limit risk ‒ Asset allocation to small, mid and large capitalization stocks
determines our risk tolerance
Investment Policies
AIM XXXIII 10
Only equities traded on major U.S. exchanges ‒ No bonds, ADRs, money market or derivative instruments ‒ No margin purchases or short selling
Portfolio Target Allocation
‒ 35% in Small (<$500M) and Mid-Cap ($500M-$5B) Stocks ‒ 65% in Large Cap (>$5B) Stocks ‒ +/- 10% Boundary ‒ 0% long-term target for cash holdings
No individual position should exceed 10% of the portfolio’s
market value

Ethical Policies
AIM XXXIII 11
AIM will not invest in any company whose values are not consistent with those of the University of Notre Dame
This includes but is not limited to companies that are involved in:
‒ Abortifacients ‒ Birth Control ‒ Tobacco
Market Capitalization
AIM XXXIII 12
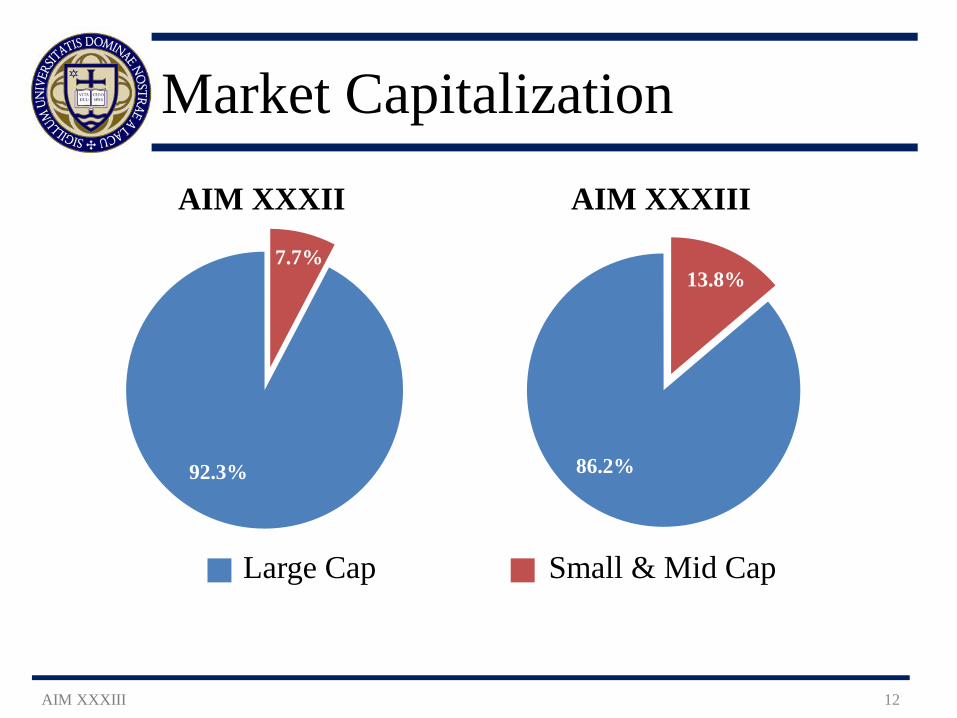
• Large Cap • Small & Mid Cap
7.7%
92.3%
AIM XXXII
13.8%
86.2%
AIM XXXIII

II. Economic Environment
AIM XXXIII 13
Economic Summary
AIM XXXIII 14
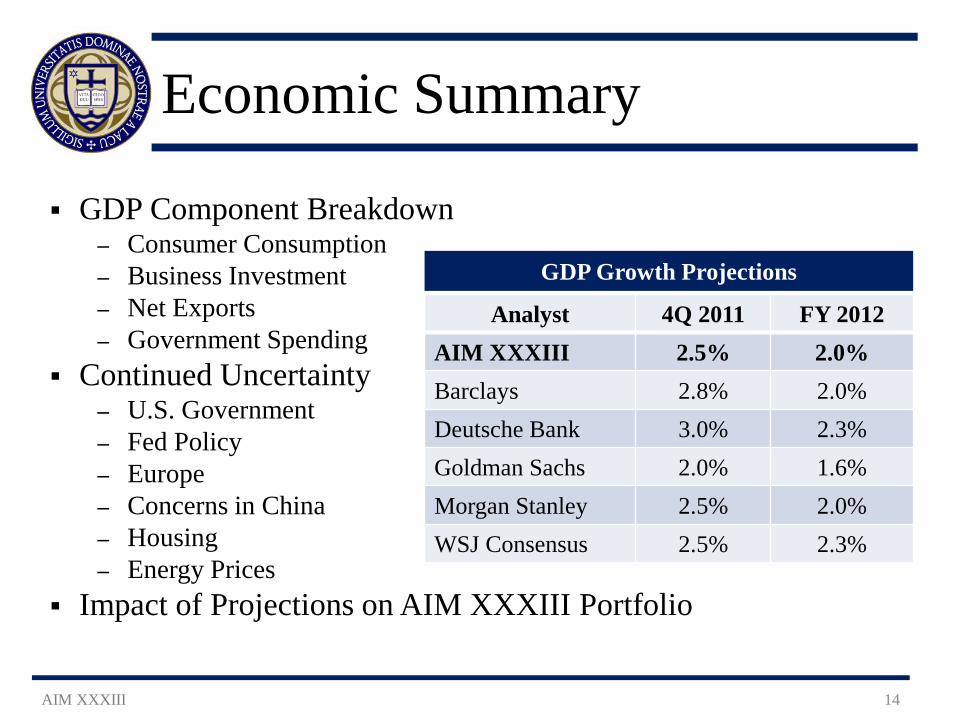
GDP Component Breakdown ‒ Consumer Consumption ‒ Business Investment ‒ Net Exports ‒ Government Spending
Continued Uncertainty ‒ U.S. Government ‒ Fed Policy ‒ Europe ‒ Concerns in China ‒ Housing ‒ Energy Prices
Impact of Projections on AIM XXXIII Portfolio
GDP Growth Projections
Analyst 4Q 2011 FY 2012 AIM XXXIII 2.5% 2.0% Barclays 2.8% 2.0% Deutsche Bank 3.0% 2.3% Goldman Sachs 2.0% 1.6% Morgan Stanley 2.5% 2.0% WSJ Consensus 2.5% 2.3%
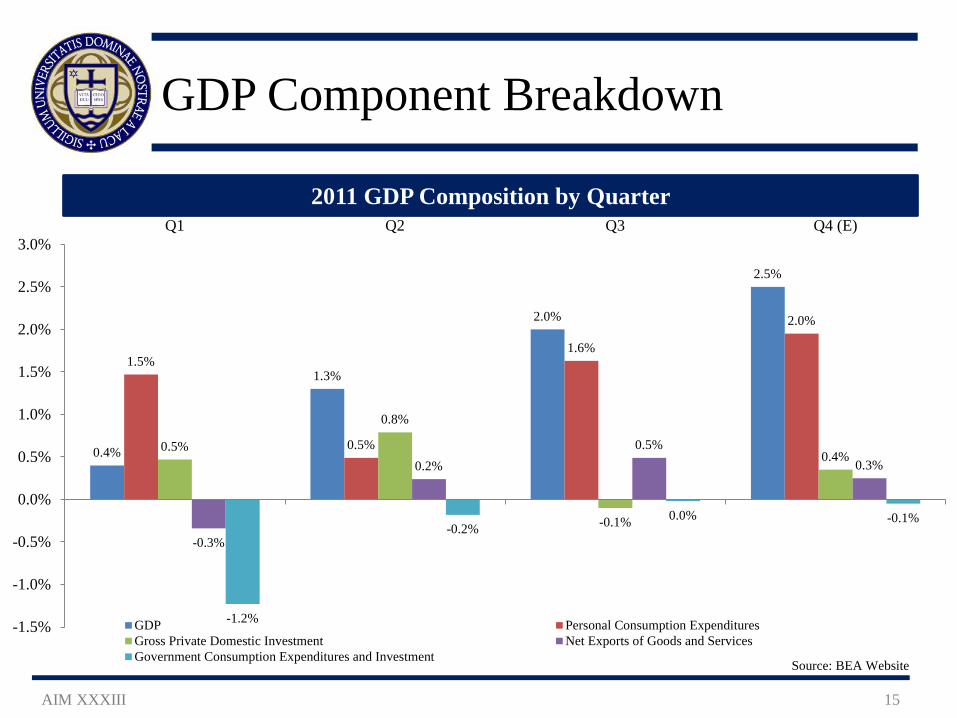
GDP Component Breakdown
AIM XXXIII 15
Source: BEA Website
2011 GDP Composition by Quarter
0.4%
1.3%
2.0%
2.5%
1.5%
0.5%
1.6%
2.0%
0.5%
0.8%
-0.1%
0.4%
-0.3%
0.2% 0.5%
0.3%
-1.2%
-0.2% 0.0% -0.1%
-1.5%
-1.0%
-0.5%
0.0%
0.5%
1.0%
1.5%
2.0%
2.5%
3.0%Q1 Q2 Q3 Q4 (E)
GDP Personal Consumption ExpendituresGross Private Domestic Investment Net Exports of Goods and ServicesGovernment Consumption Expenditures and Investment
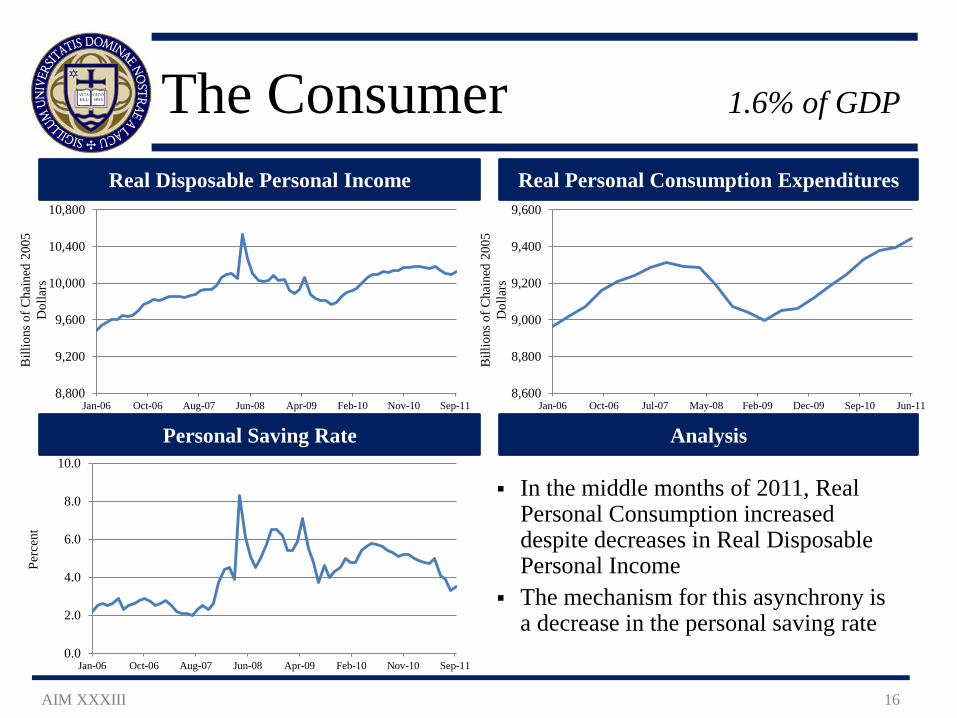
The Consumer 1.6% of GDP
AIM XXXIII 16
In the middle months of 2011, Real Personal Consumption increased despite decreases in Real Disposable Personal Income
The mechanism for this asynchrony is a decrease in the personal saving rate
Real Disposable Personal Income Real Personal Consumption Expenditures
Personal Saving Rate Analysis
8,800
9,200
9,600
10,000
10,400
10,800
Jan-06 Oct-06 Aug-07 Jun-08 Apr-09 Feb-10 Nov-10 Sep-118,600
8,800
9,000
9,200
9,400
9,600
Jan-06 Oct-06 Jul-07 May-08 Feb-09 Dec-09 Sep-10 Jun-11
0.0
2.0
4.0
6.0
8.0
10.0
Jan-06 Oct-06 Aug-07 Jun-08 Apr-09 Feb-10 Nov-10 Sep-11
Bill
ions
of C
hain
ed 2
005
Dol
lars
Pe
rcen
t
Bill
ions
of C
hain
ed 2
005
Dol
lars
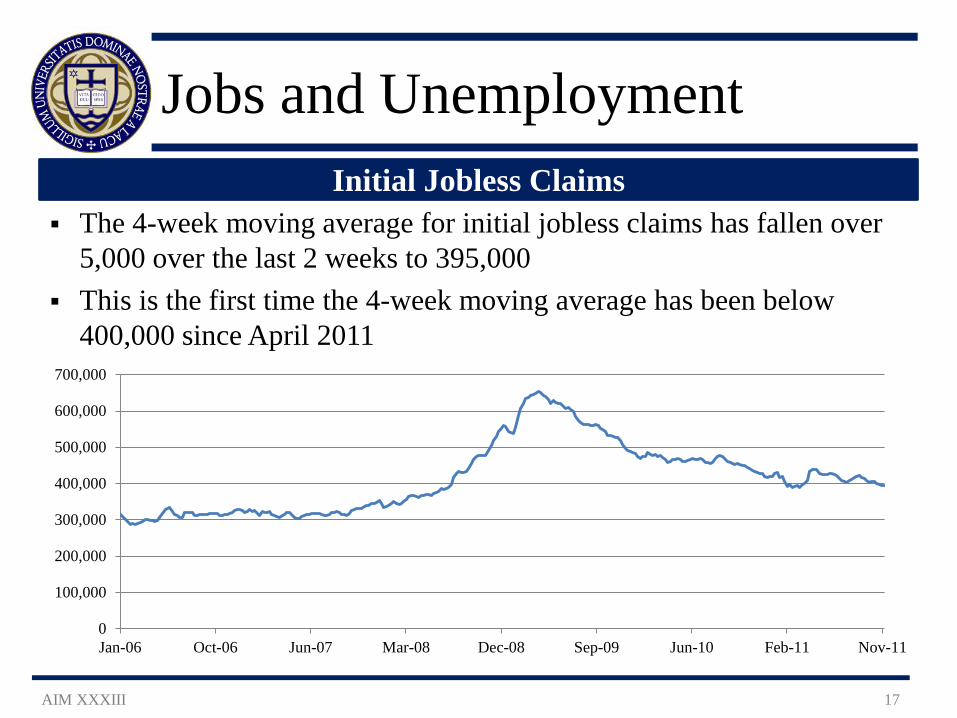
Jobs and Unemployment
AIM XXXIII 17
The 4-week moving average for initial jobless claims has fallen over 5,000 over the last 2 weeks to 395,000
This is the first time the 4-week moving average has been below 400,000 since April 2011
Initial Jobless Claims
0
100,000
200,000
300,000
400,000
500,000
600,000
700,000
Jan-06 Oct-06 Jun-07 Mar-08 Dec-08 Sep-09 Jun-10 Feb-11 Nov-11
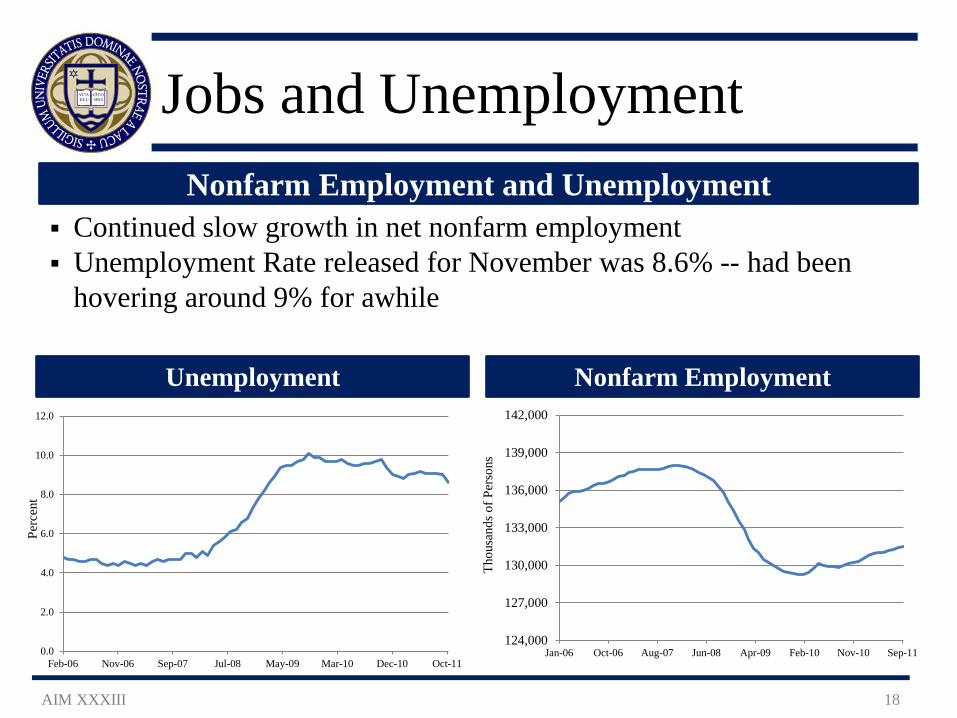
Jobs and Unemployment
AIM XXXIII 18
Unemployment
Nonfarm Employment and Unemployment Continued slow growth in net nonfarm employment Unemployment Rate released for November was 8.6% -- had been
hovering around 9% for awhile
124,000
127,000
130,000
133,000
136,000
139,000
142,000
Jan-06 Oct-06 Aug-07 Jun-08 Apr-09 Feb-10 Nov-10 Sep-11
Thou
sand
s of P
erso
ns
Perc
ent
0.0
2.0
4.0
6.0
8.0
10.0
12.0
Feb-06 Nov-06 Sep-07 Jul-08 May-09 Mar-10 Dec-10 Oct-11
Nonfarm Employment
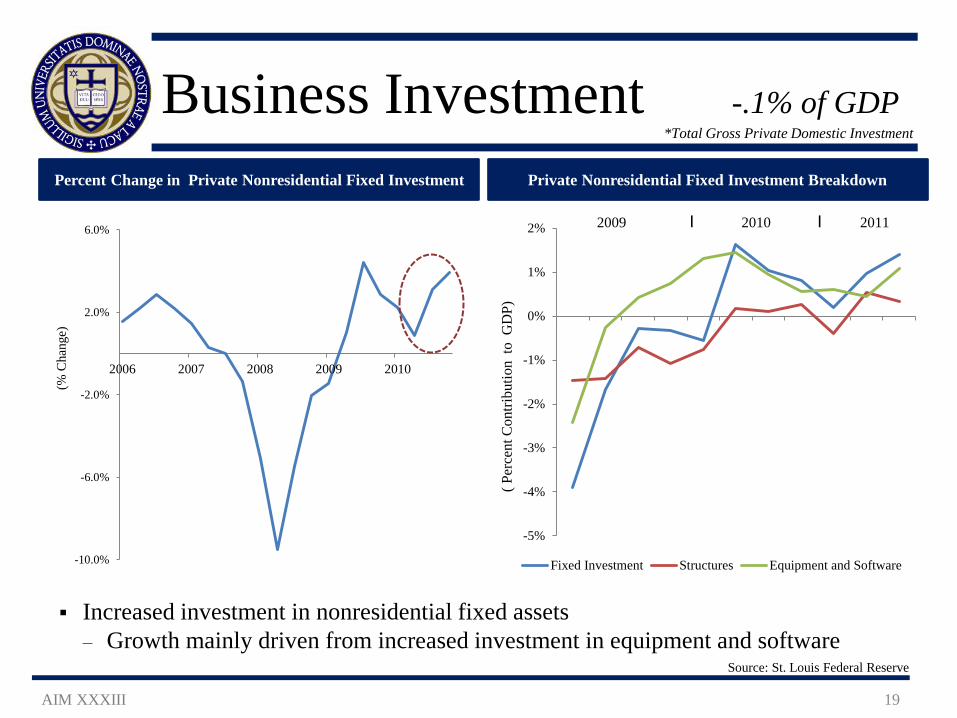
Business Investment -.1% of GDP
AIM XXXIII 19
Percent Change in Private Nonresidential Fixed Investment Private Nonresidential Fixed Investment Breakdown
Source: St. Louis Federal Reserve
-10.0%
-6.0%
-2.0%
2.0%
6.0%
2006 2007 2008 2009 2010
(% C
hang
e)
Increased investment in nonresidential fixed assets ‒ Growth mainly driven from increased investment in equipment and software
-5%
-4%
-3%
-2%
-1%
0%
1%
2%
( Per
cent
Con
tribu
tion
to G
DP)
Fixed Investment Structures Equipment and Software
2009 I 2010 I 2011
*Total Gross Private Domestic Investment
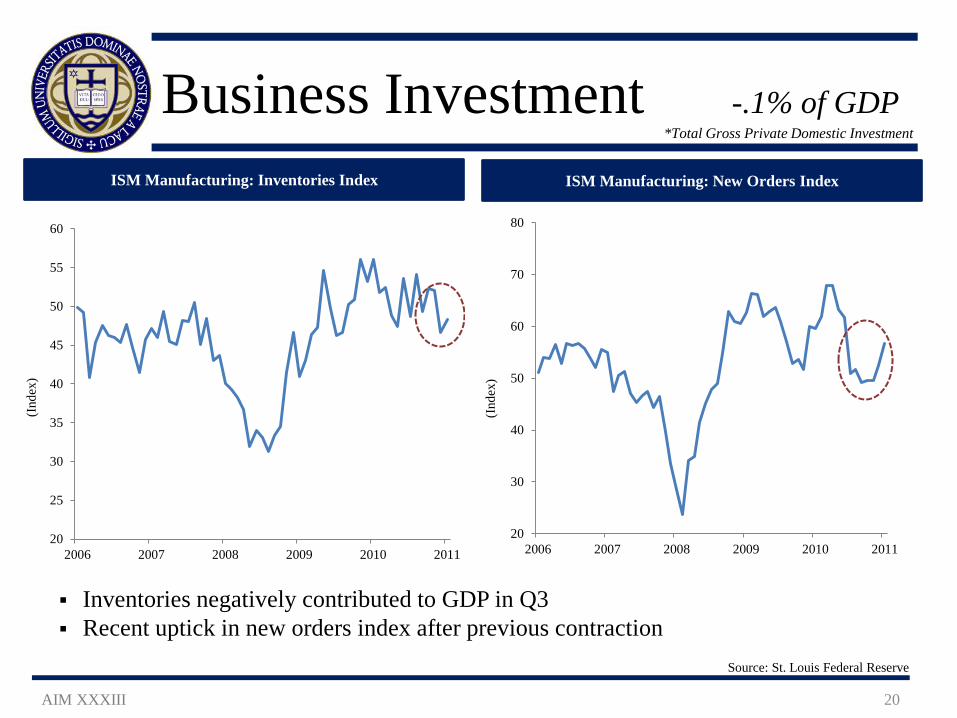
Business Investment -.1% of GDP
AIM XXXIII 20
ISM Manufacturing: Inventories Index ISM Manufacturing: New Orders Index
Source: St. Louis Federal Reserve
Inventories negatively contributed to GDP in Q3 Recent uptick in new orders index after previous contraction
20
25
30
35
40
45
50
55
60
2006 2007 2008 2009 2010 2011
(Ind
ex)
20
30
40
50
60
70
80
2006 2007 2008 2009 2010 2011
(Ind
ex)
*Total Gross Private Domestic Investment
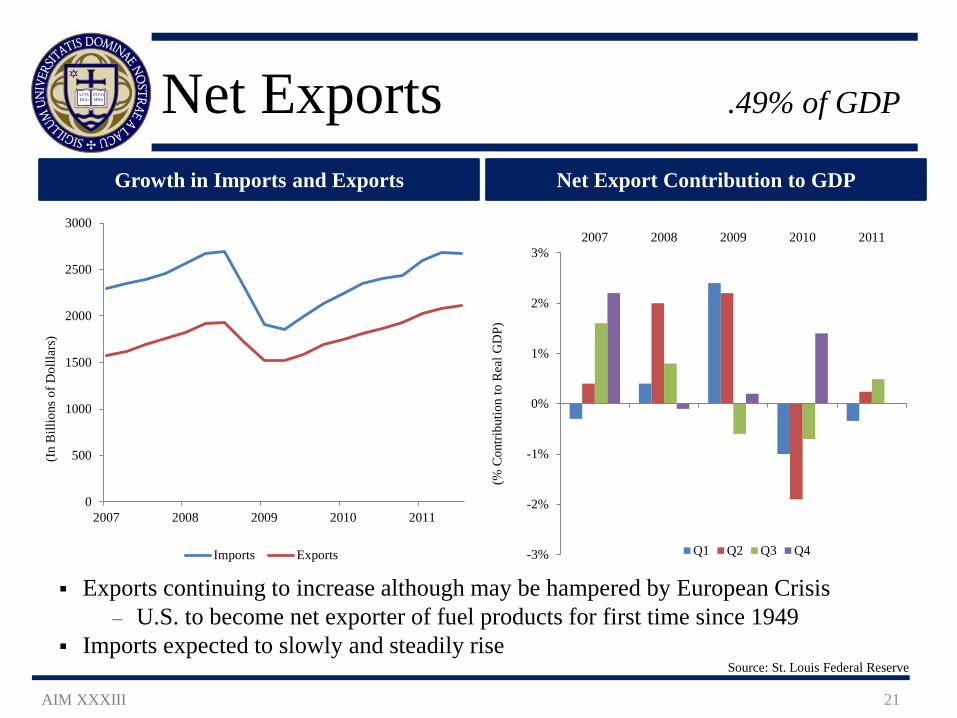
Net Exports .49% of GDP
AIM XXXIII 21
Growth in Imports and Exports Net Export Contribution to GDP
Source: St. Louis Federal Reserve
Exports continuing to increase although may be hampered by European Crisis ‒ U.S. to become net exporter of fuel products for first time since 1949
Imports expected to slowly and steadily rise
-3%
-2%
-1%
0%
1%
2%
3%2007 2008 2009 2010 2011
(% C
ontri
butio
n to
Rea
l GD
P)
Q1 Q2 Q3 Q4
0
500
1000
1500
2000
2500
3000
2007 2008 2009 2010 2011
(In
Bill
ions
of D
ollla
rs)
Imports Exports
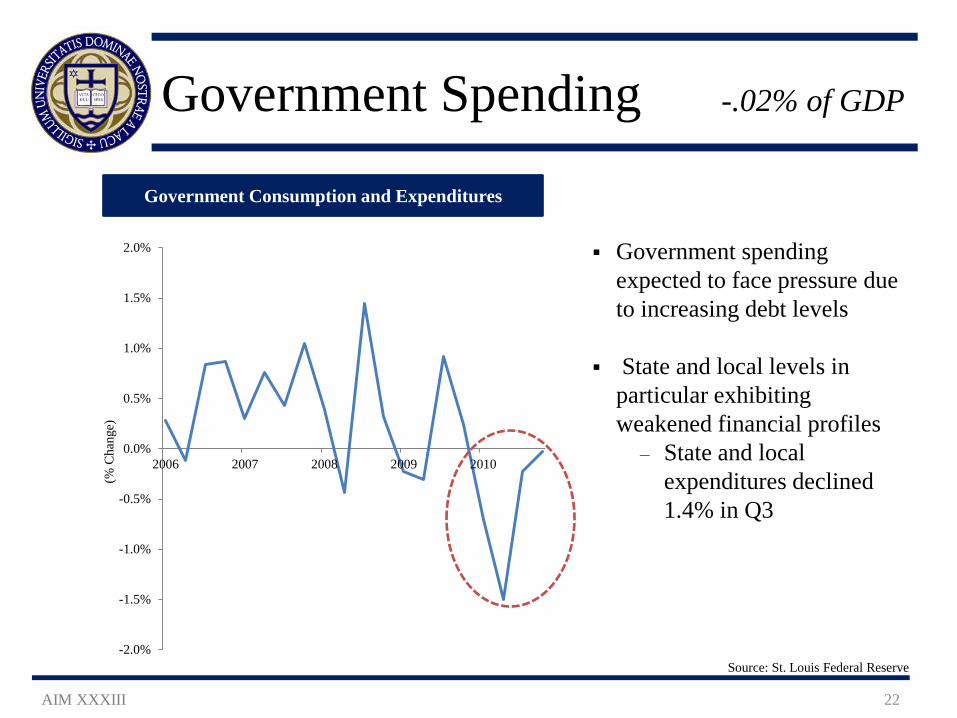
Government Spending -.02% of GDP
AIM XXXIII 22
Government spending expected to face pressure due to increasing debt levels
State and local levels in
particular exhibiting weakened financial profiles
‒ State and local expenditures declined 1.4% in Q3
Government Consumption and Expenditures
Source: St. Louis Federal Reserve -2.0%
-1.5%
-1.0%
-0.5%
0.0%
0.5%
1.0%
1.5%
2.0%
2006 2007 2008 2009 2010
(% C
hang
e)
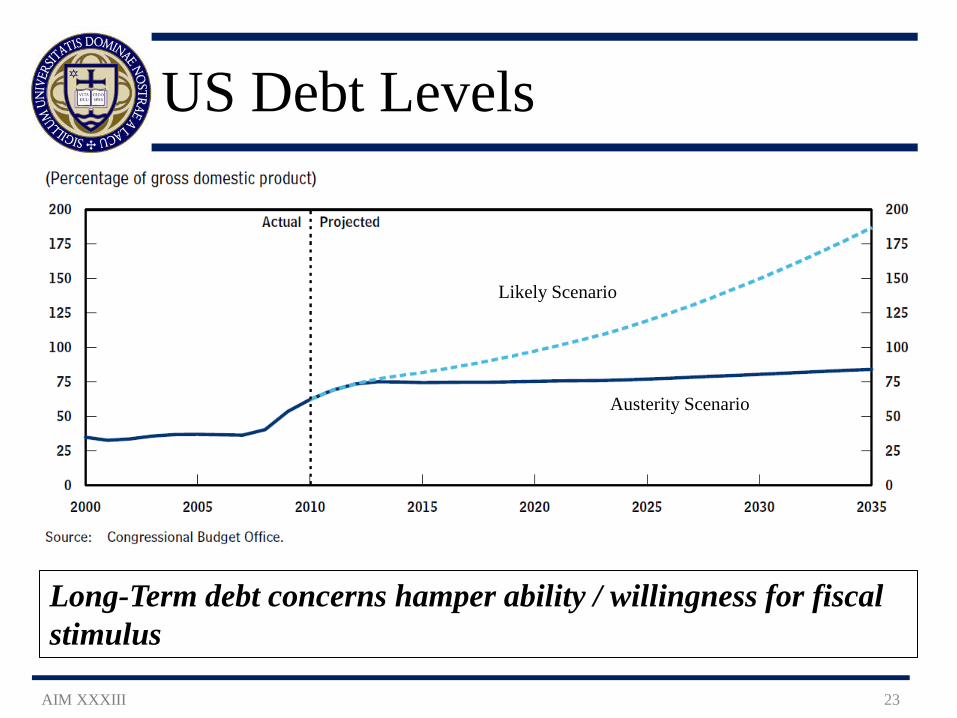
US Debt Levels
AIM XXXIII 23
Likely Scenario
Austerity Scenario
Long-Term debt concerns hamper ability / willingness for fiscal stimulus
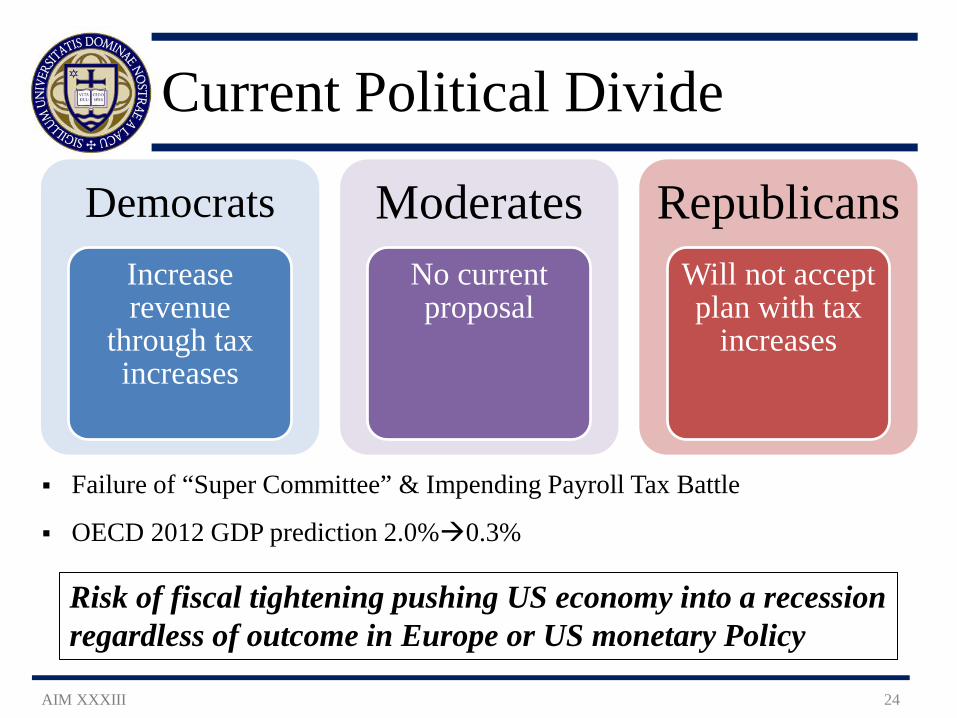
Current Political Divide
AIM XXXIII 24
Democrats Increase revenue
through tax increases
Moderates No current proposal
Republicans Will not accept plan with tax
increases
Failure of “Super Committee” & Impending Payroll Tax Battle
OECD 2012 GDP prediction 2.0%0.3%
Risk of fiscal tightening pushing US economy into a recession regardless of outcome in Europe or US monetary Policy
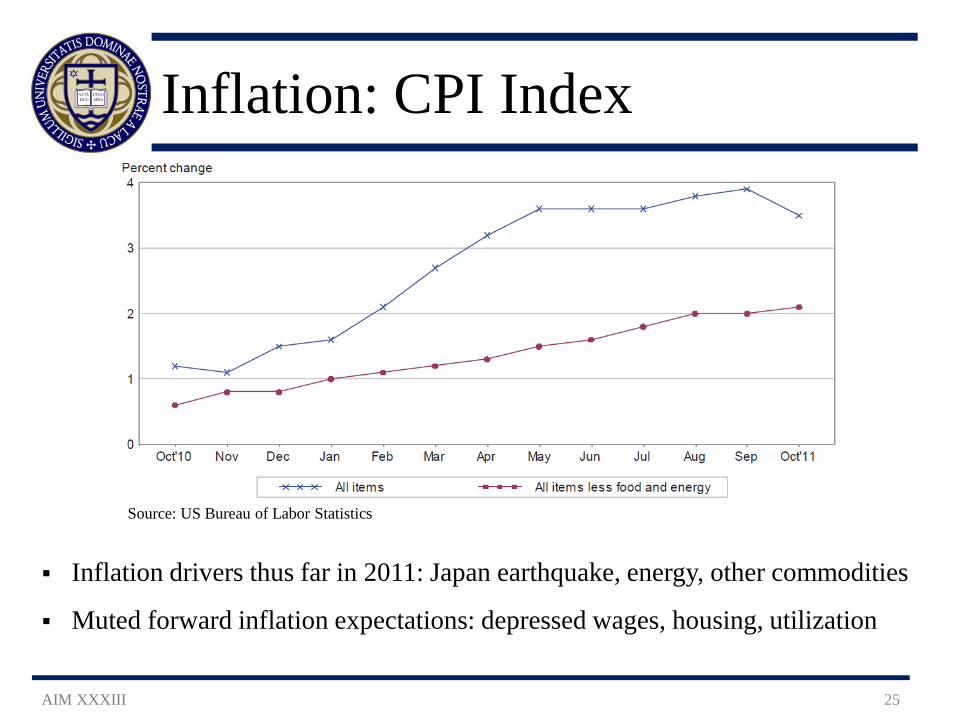
Inflation: CPI Index
AIM XXXIII 25
Inflation drivers thus far in 2011: Japan earthquake, energy, other commodities
Muted forward inflation expectations: depressed wages, housing, utilization
Source: US Bureau of Labor Statistics
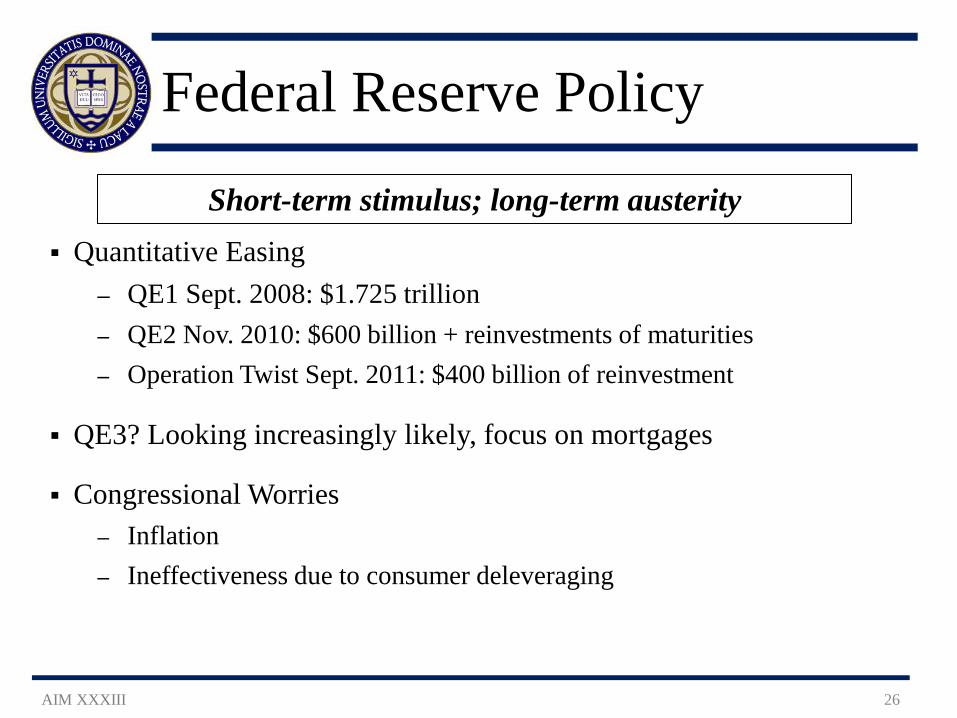
Federal Reserve Policy
AIM XXXIII 26
Short-term stimulus; long-term austerity Quantitative Easing
– QE1 Sept. 2008: $1.725 trillion – QE2 Nov. 2010: $600 billion + reinvestments of maturities – Operation Twist Sept. 2011: $400 billion of reinvestment
QE3? Looking increasingly likely, focus on mortgages
Congressional Worries – Inflation – Ineffectiveness due to consumer deleveraging
Federal Reserve Policy
AIM XXXIII 27
0.00%
1.00%
2.00%
3.00%
4.00%
5.00%
6.00%
1 mo 3 mo 6 mo 1 yr 2 yr 3 yr 5 yr 7 yr 10 yr 20 yr 30 yr
Yie
ld
Time to Maturity
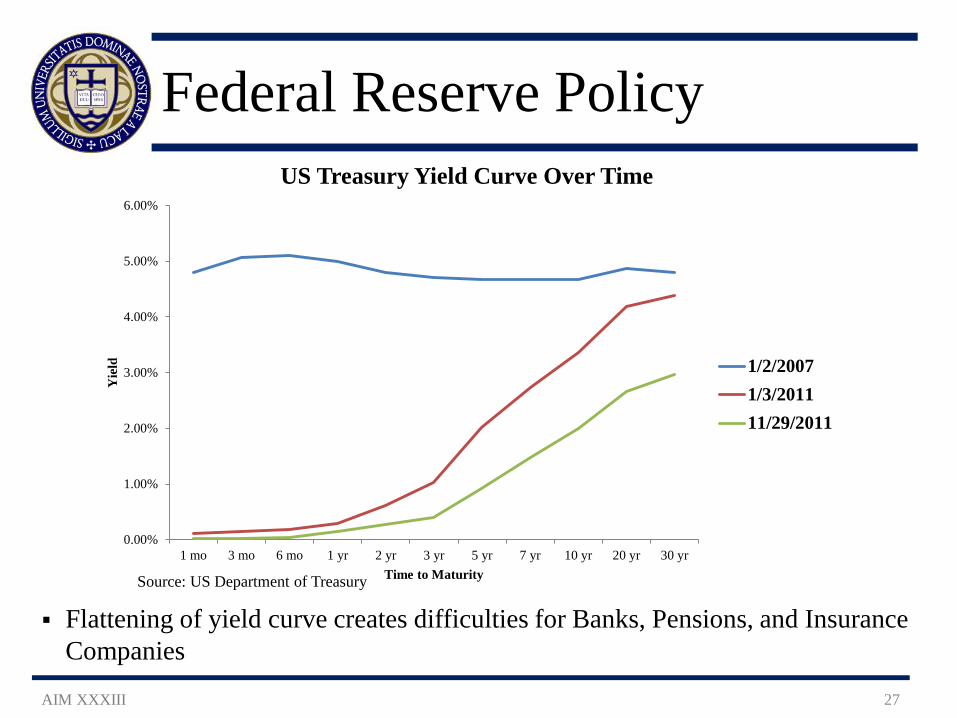
US Treasury Yield Curve Over Time
1/2/20071/3/201111/29/2011
Flattening of yield curve creates difficulties for Banks, Pensions, and Insurance Companies
Source: US Department of Treasury
Federal Reserve Policy
AIM XXXIII 28
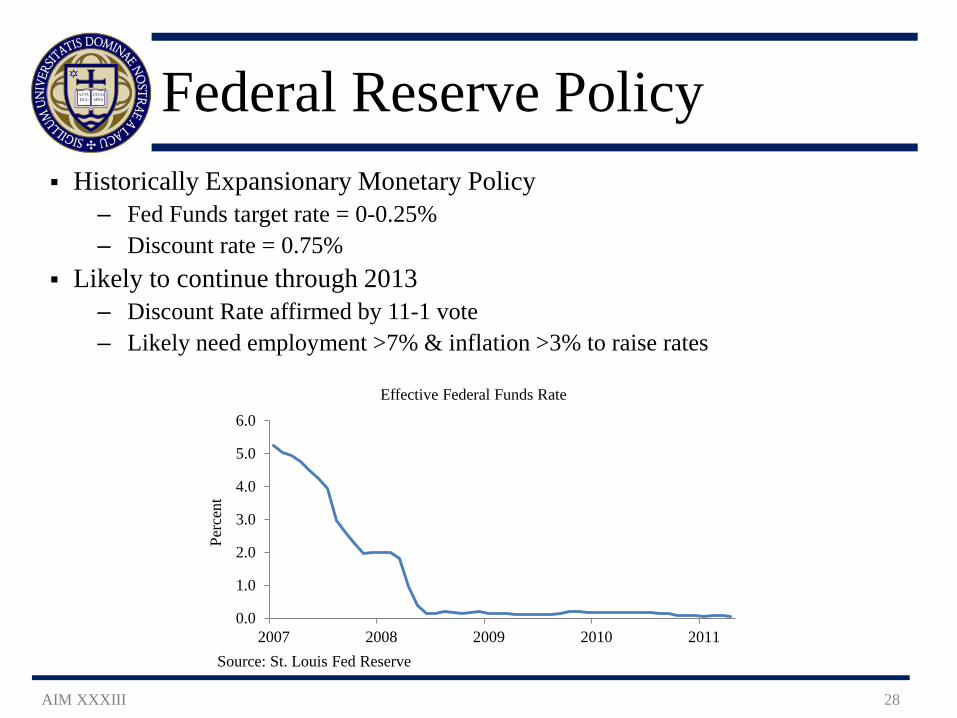
Historically Expansionary Monetary Policy – Fed Funds target rate = 0-0.25% – Discount rate = 0.75%
Likely to continue through 2013 – Discount Rate affirmed by 11-1 vote – Likely need employment >7% & inflation >3% to raise rates
Source: St. Louis Fed Reserve
0.0
1.0
2.0
3.0
4.0
5.0
6.0
2007 2008 2009 2010 2011
Perc
ent
Effective Federal Funds Rate
European Debt Crisis
AIM XXXIII 29
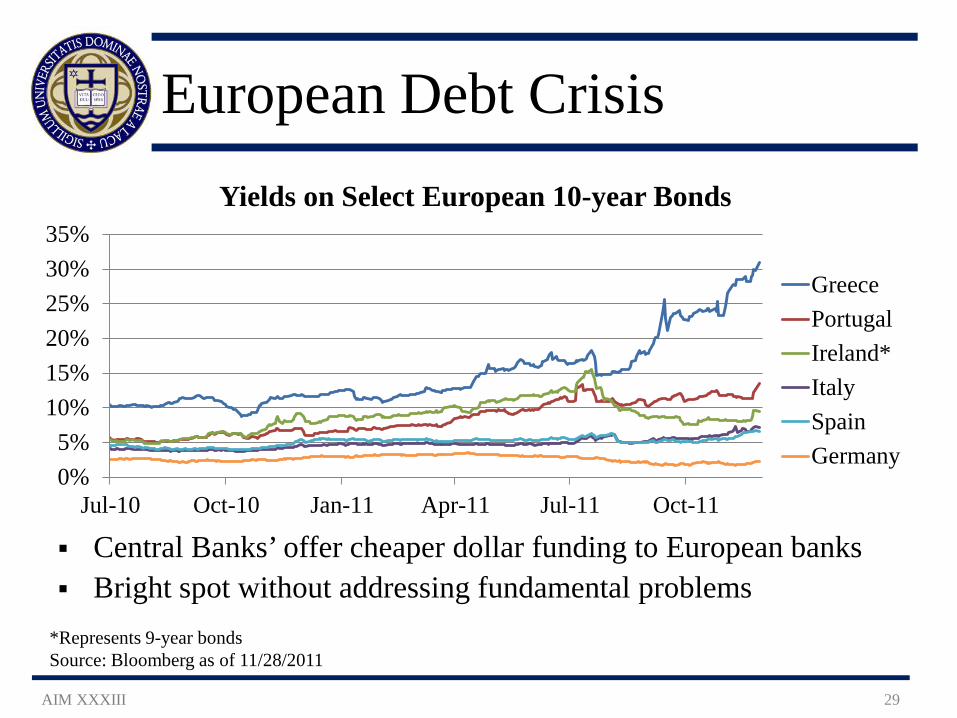
*Represents 9-year bonds Source: Bloomberg as of 11/28/2011
Central Banks’ offer cheaper dollar funding to European banks Bright spot without addressing fundamental problems
0%5%
10%15%20%25%30%35%
Jul-10 Oct-10 Jan-11 Apr-11 Jul-11 Oct-11
Yields on Select European 10-year Bonds
GreecePortugalIreland*ItalySpainGermany
European Debt Crisis
AIM XXXIII 30
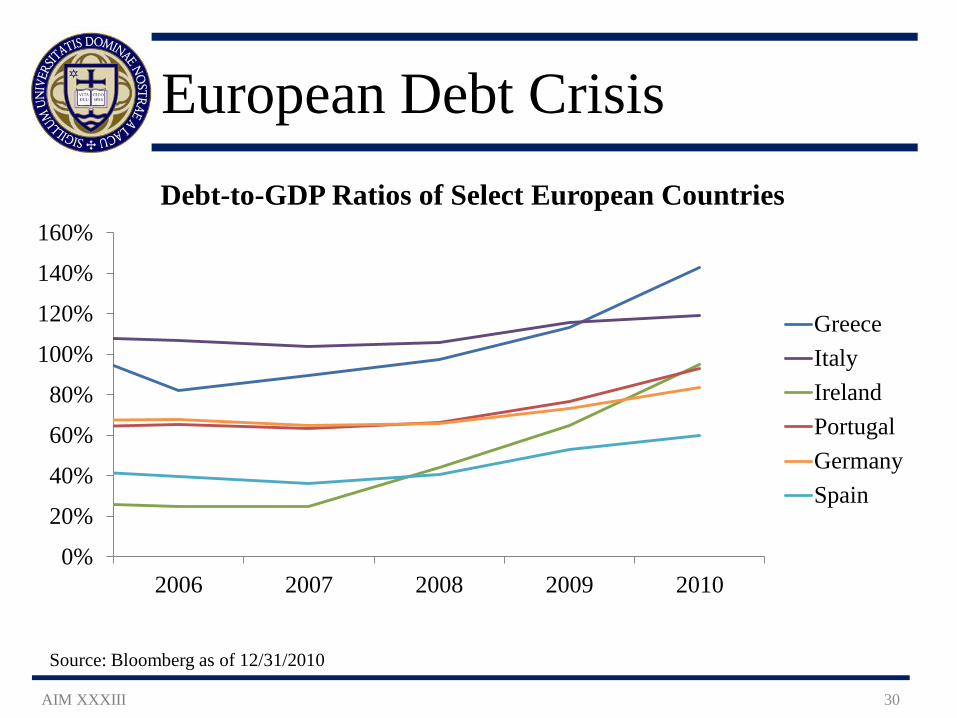
Source: Bloomberg as of 12/31/2010
0%
20%
40%
60%
80%
100%
120%
140%
160%
2006 2007 2008 2009 2010
Debt-to-GDP Ratios of Select European Countries
GreeceItalyIrelandPortugalGermanySpain
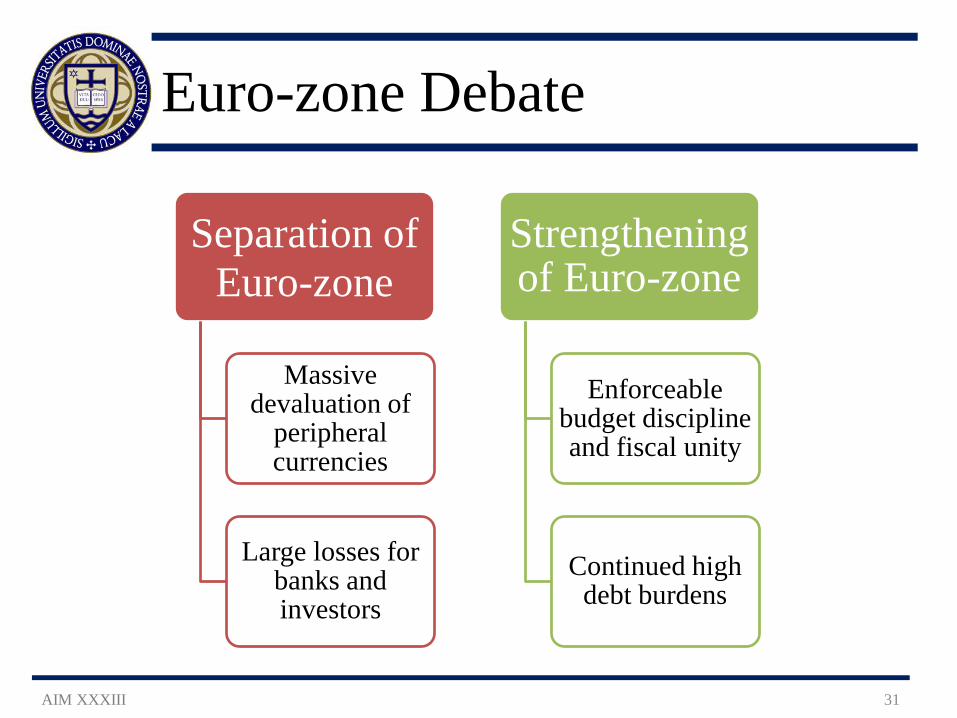
Euro-zone Debate
AIM XXXIII 31
Separation of Euro-zone
Massive devaluation of
peripheral currencies
Large losses for banks and investors
Strengthening of Euro-zone
Enforceable budget discipline and fiscal unity
Continued high debt burdens
0%
4%
8%
12%
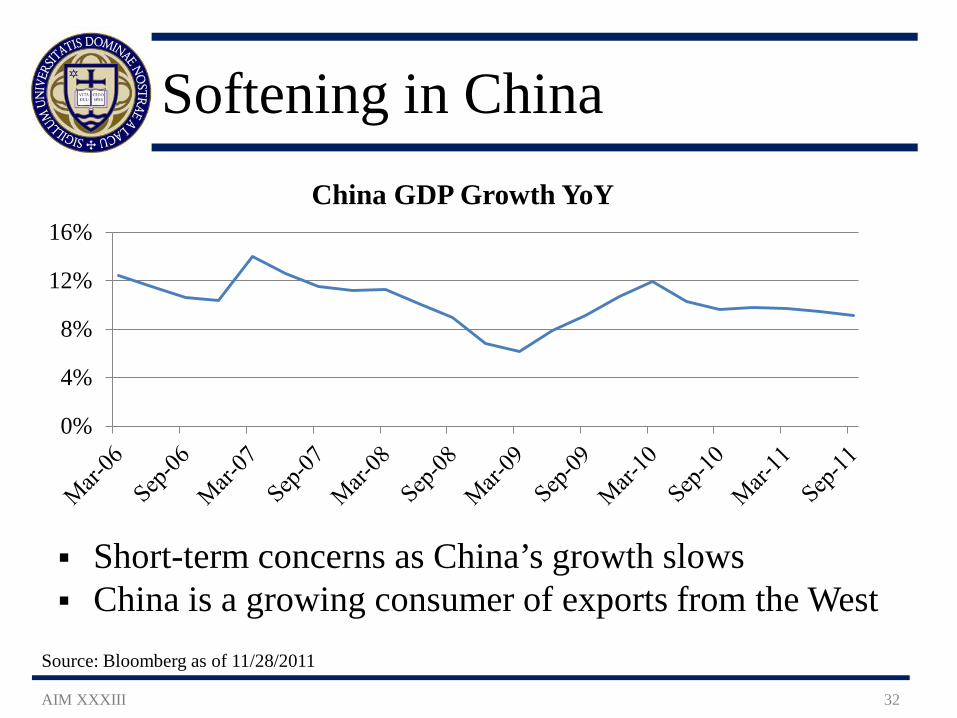
16%China GDP Growth YoY
Softening in China
AIM XXXIII 32
Source: Bloomberg as of 11/28/2011
Short-term concerns as China’s growth slows China is a growing consumer of exports from the West
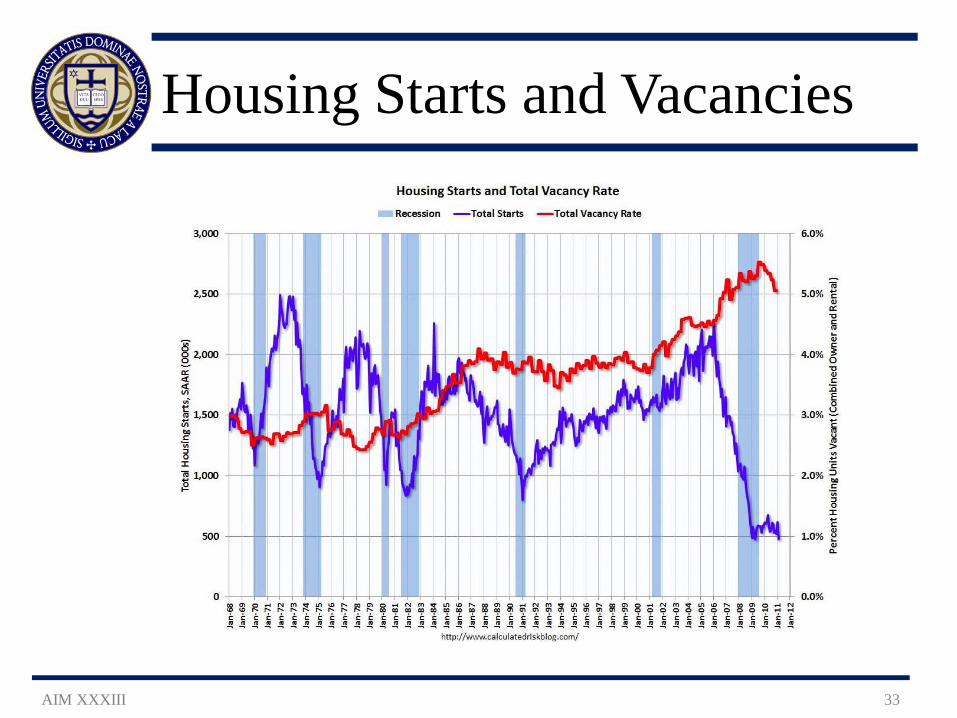
Housing Starts and Vacancies
AIM XXXIII 33
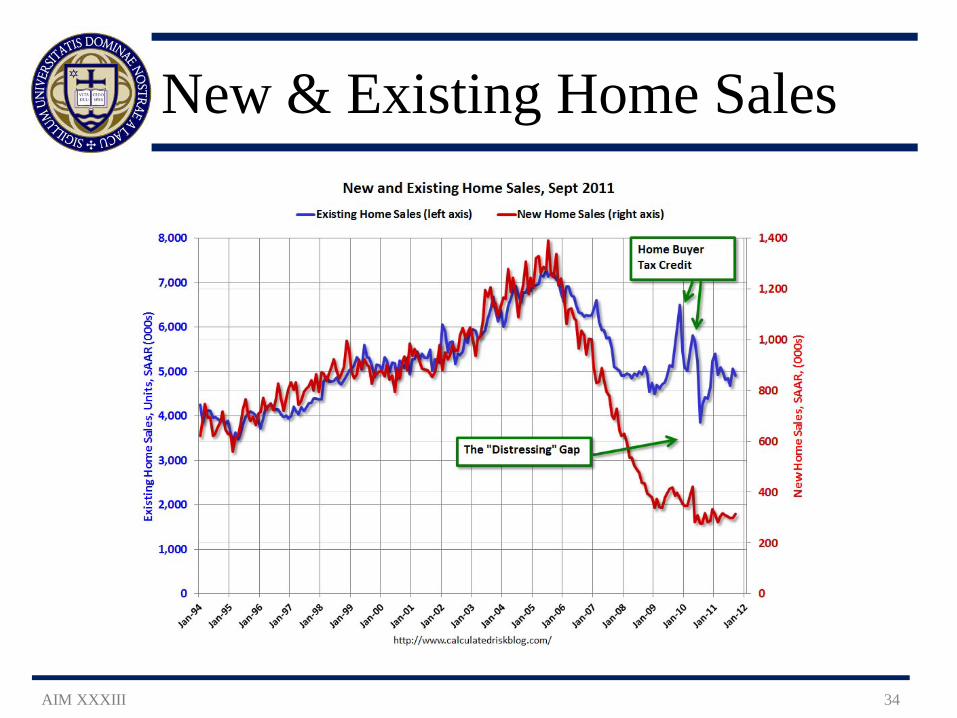
New & Existing Home Sales
AIM XXXIII 34
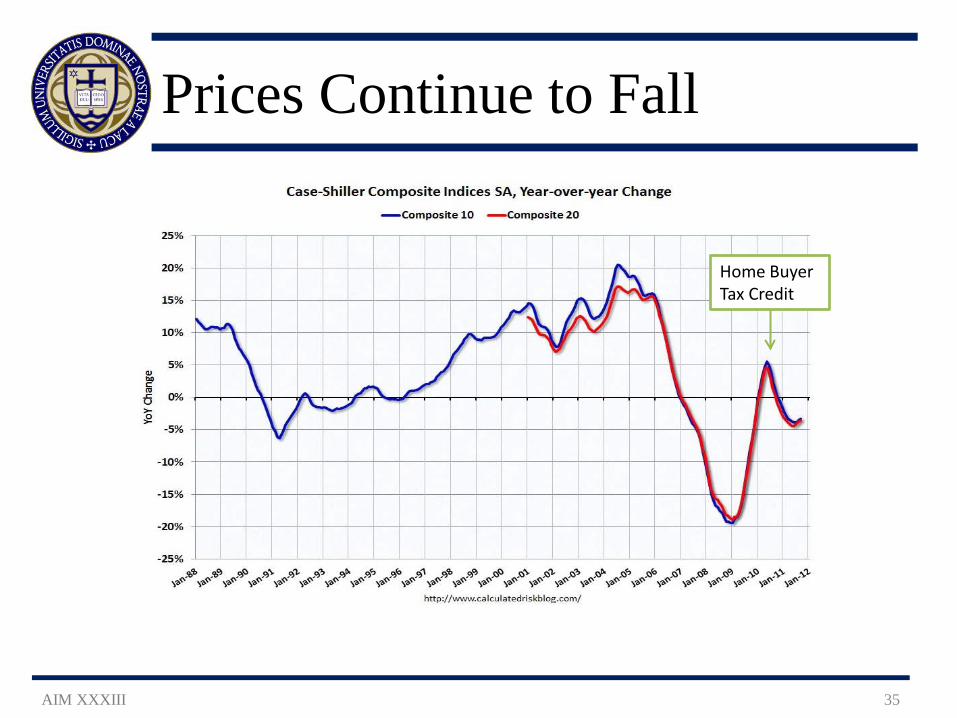
Prices Continue to Fall
AIM XXXIII 35
Home Buyer Tax Credit
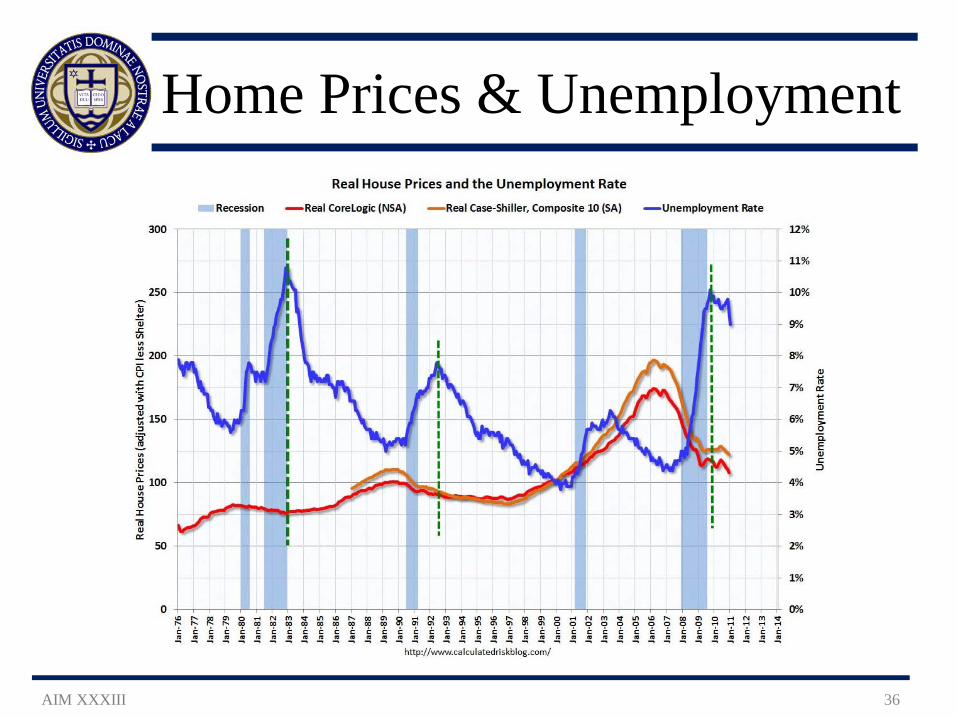
Home Prices & Unemployment
AIM XXXIII 36
Oil Uncertainty
AIM XXXIII 37
Oil hits $100 per barrel Tuesday 11/29/2011
‒ Violence in Iran
‒ Increased Consumer Confidence
However, oil rally likely to ebb
‒ Increase in U.S. stockpiles
‒ Production in Libya
Economic Outlook
AIM XXXIII 38
2.5% Growth in Q4 2011 (vs. 2.5% WSJ consensus) – Consumer Spending benefits from strong holiday demand – Business Investment increases slightly to replenish
inventories Investment in capital, not labor, as uncertainty persists
2.0% Growth in FY 2012 (vs. 2.3% WSJ consensus) – Consumer Spending growth slows as change in income is
flat to negative and high unemployment persists Build up of existing home inventory remains a problem
– Business Investment grows at decreasing rate Macroeconomic conditions too uncertain to support major
improvements in employment
Portfolio Impact
AIM XXXIII 39
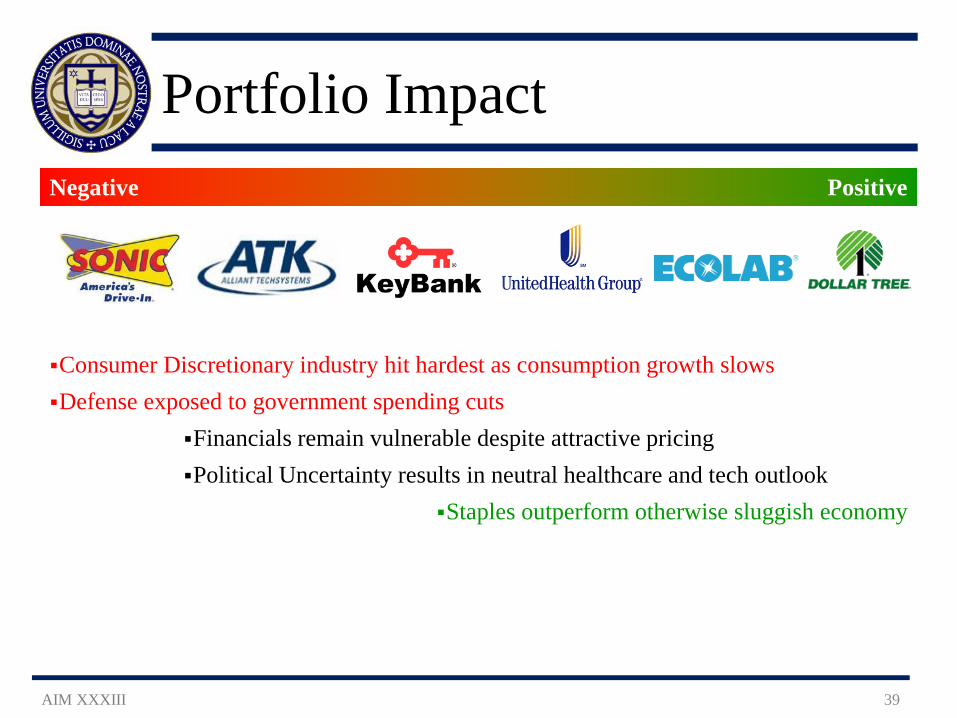
Consumer Discretionary industry hit hardest as consumption growth slows Defense exposed to government spending cuts
Financials remain vulnerable despite attractive pricing Political Uncertainty results in neutral healthcare and tech outlook
Staples outperform otherwise sluggish economy
Negative Positive Positive

III. Security Analysis
AIM XXXIII 40
Security Selection Process
AIM XXXIII 41
Bottom-up approach to security selection Six reports:
‒ Company background – Breakdown of segments, revenue SWOT analysis
‒ Industry analysis – Overview of competitive environment Industry demand and cost factors
‒ Fundamental analysis – Business and financial risk profile DuPont analysis
‒ Earnings forecast – EPS projections through 2012 Heuristic and financial model estimates
‒ Final valuation and recommendation – Intrinsic value of the stock Discounted cash flow, multiples method, dividend discount model Discovery
‒ Technical analysis – Short-term momentum Moving averages, relative strength, support/resistance levels
1 minute “elevator speech” then discussion of each stock while all options are laid
out on spreadsheet
Analyst Agenda
AIM XXXIII 42
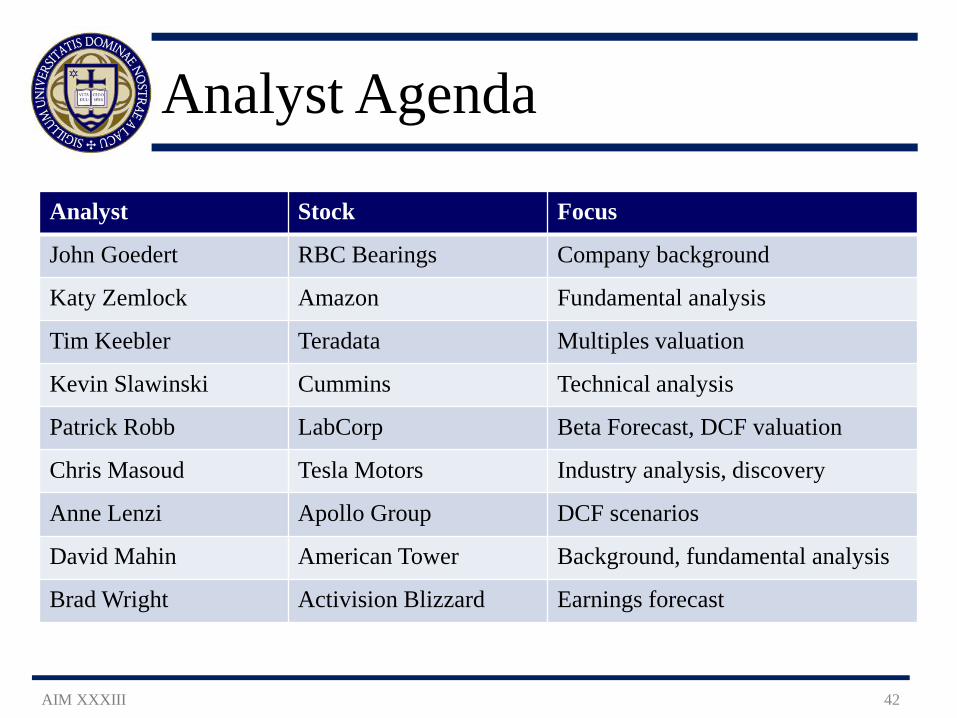
Analyst Stock Focus
John Goedert RBC Bearings Company background
Katy Zemlock Amazon Fundamental analysis
Tim Keebler Teradata Multiples valuation
Kevin Slawinski Cummins Technical analysis
Patrick Robb LabCorp Beta Forecast, DCF valuation
Chris Masoud Tesla Motors Industry analysis, discovery
Anne Lenzi Apollo Group DCF scenarios
David Mahin American Tower Background, fundamental analysis
Brad Wright Activision Blizzard Earnings forecast
RBC Bearings (ROLL)
AIM XXXIII 43
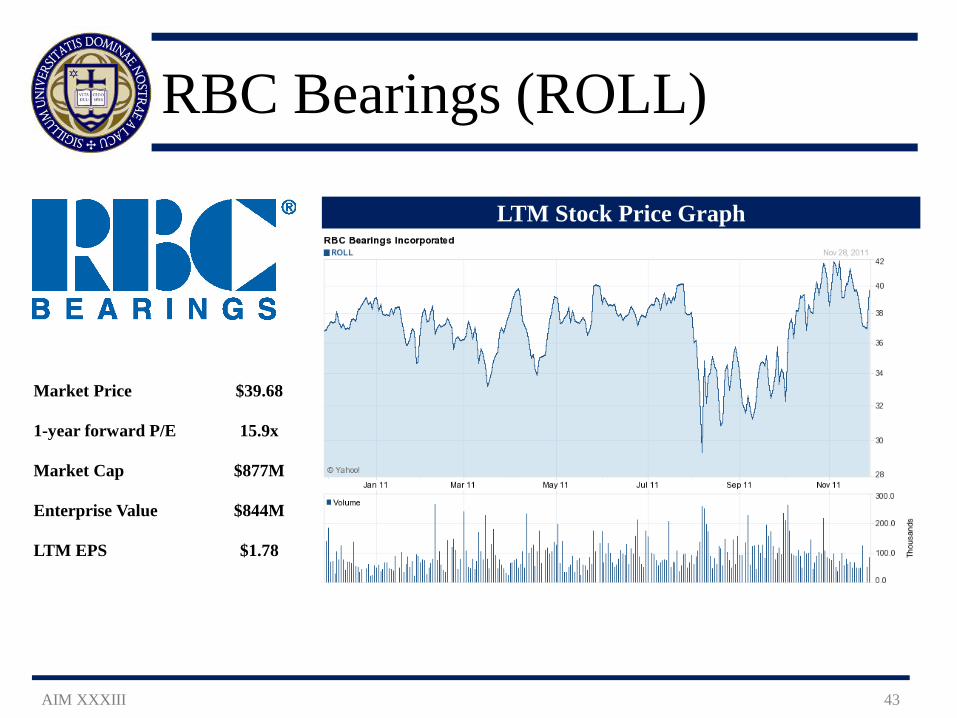
Market Price $39.68
1-year forward P/E 15.9x
Market Cap $877M
Enterprise Value $844M
LTM EPS $1.78
LTM Stock Price Graph
Company Background
AIM XXXIII 44
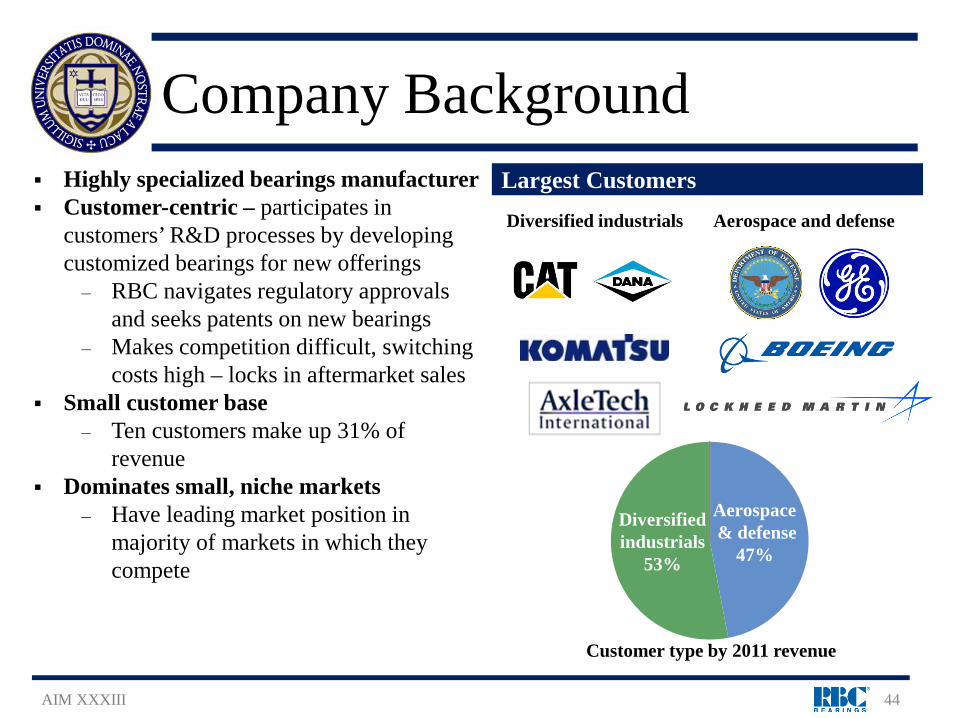
Diversified industrials Aerospace and defense
Aerospace & defense
47%
Diversified industrials
53%
Customer type by 2011 revenue
Largest Customers Highly specialized bearings manufacturer Customer-centric – participates in
customers’ R&D processes by developing customized bearings for new offerings ‒ RBC navigates regulatory approvals
and seeks patents on new bearings ‒ Makes competition difficult, switching
costs high – locks in aftermarket sales Small customer base
‒ Ten customers make up 31% of revenue
Dominates small, niche markets ‒ Have leading market position in
majority of markets in which they compete
Company SWOT
AIM XXXIII 45
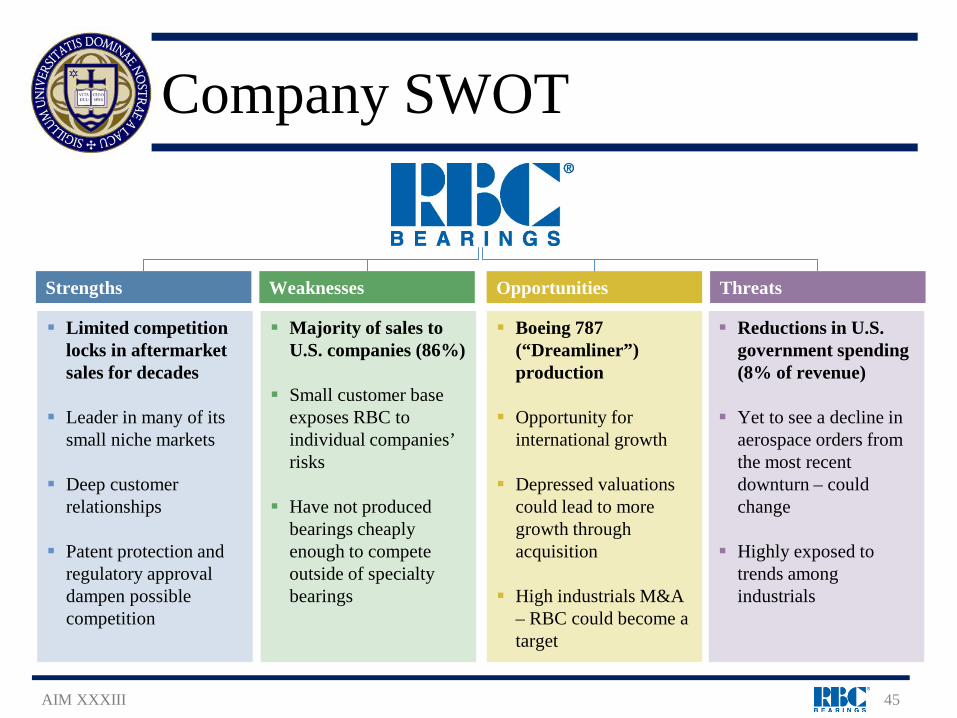
Strengths Weaknesses Opportunities Threats
Limited competition locks in aftermarket sales for decades
Leader in many of its small niche markets
Deep customer relationships
Patent protection and regulatory approval dampen possible competition
Majority of sales to U.S. companies (86%)
Small customer base exposes RBC to individual companies’ risks
Have not produced bearings cheaply enough to compete outside of specialty bearings
Boeing 787 (“Dreamliner”) production
Opportunity for international growth
Depressed valuations could lead to more growth through acquisition
High industrials M&A – RBC could become a target
Reductions in U.S. government spending (8% of revenue)
Yet to see a decline in aerospace orders from the most recent downturn – could change
Highly exposed to trends among industrials
Company Background and Fundamentals
AIM XXXIII 46
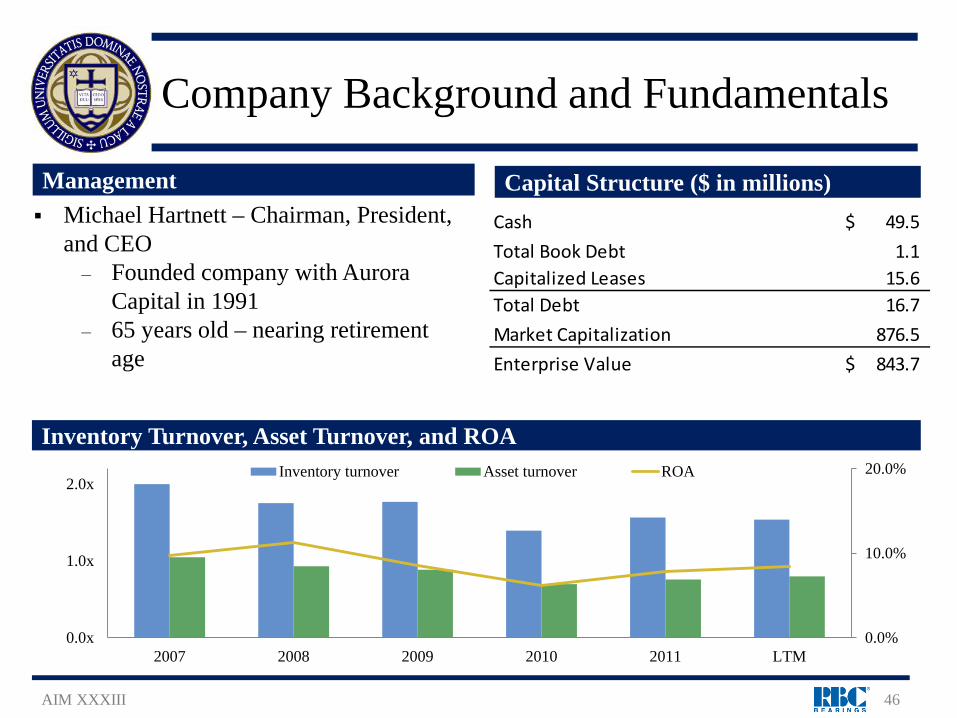
Management Capital Structure ($ in millions) Cash 49.5$ Total Book Debt 1.1 Capitalized Leases 15.6 Total Debt 16.7 Market Capitalization 876.5 Enterprise Value 843.7$
Inventory Turnover, Asset Turnover, and ROA
Michael Hartnett – Chairman, President, and CEO ‒ Founded company with Aurora
Capital in 1991 ‒ 65 years old – nearing retirement
age
0.0%
10.0%
20.0%
0.0x
1.0x
2.0x
2007 2008 2009 2010 2011 LTM
Inventory turnover Asset turnover ROA
ROLL Recommendation – Buy
AIM XXXIII 47
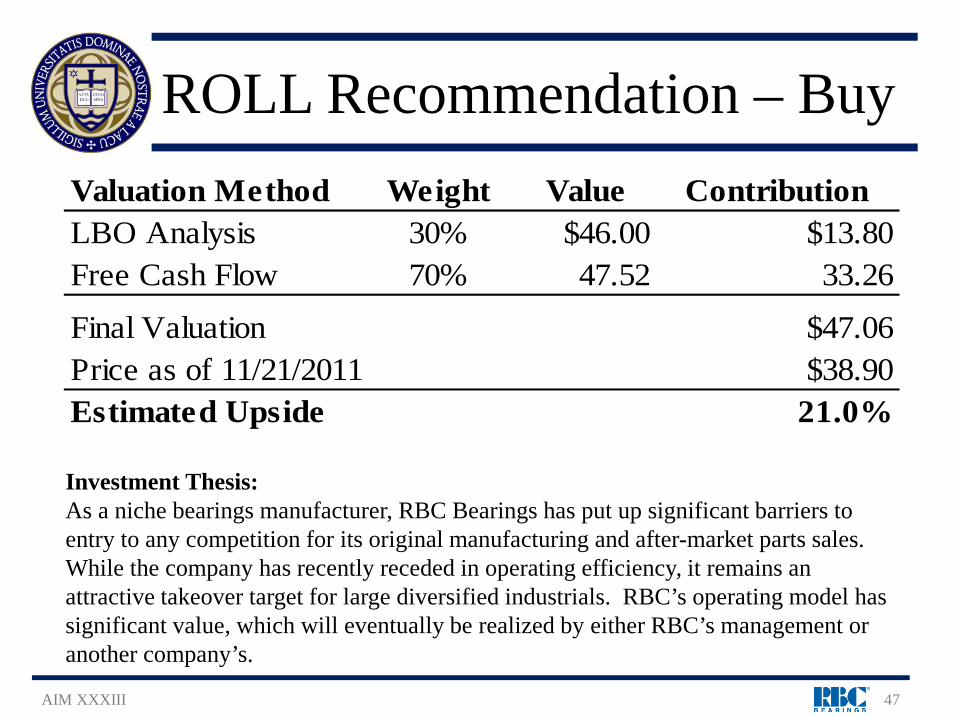
Investment Thesis: As a niche bearings manufacturer, RBC Bearings has put up significant barriers to entry to any competition for its original manufacturing and after-market parts sales. While the company has recently receded in operating efficiency, it remains an attractive takeover target for large diversified industrials. RBC’s operating model has significant value, which will eventually be realized by either RBC’s management or another company’s.
Valuation Method Weight Value ContributionLBO Analysis 30% $46.00 $13.80Free Cash Flow 70% 47.52 33.26
Final Valuation $47.06Price as of 11/21/2011 $38.90Estimated Upside 21.0%
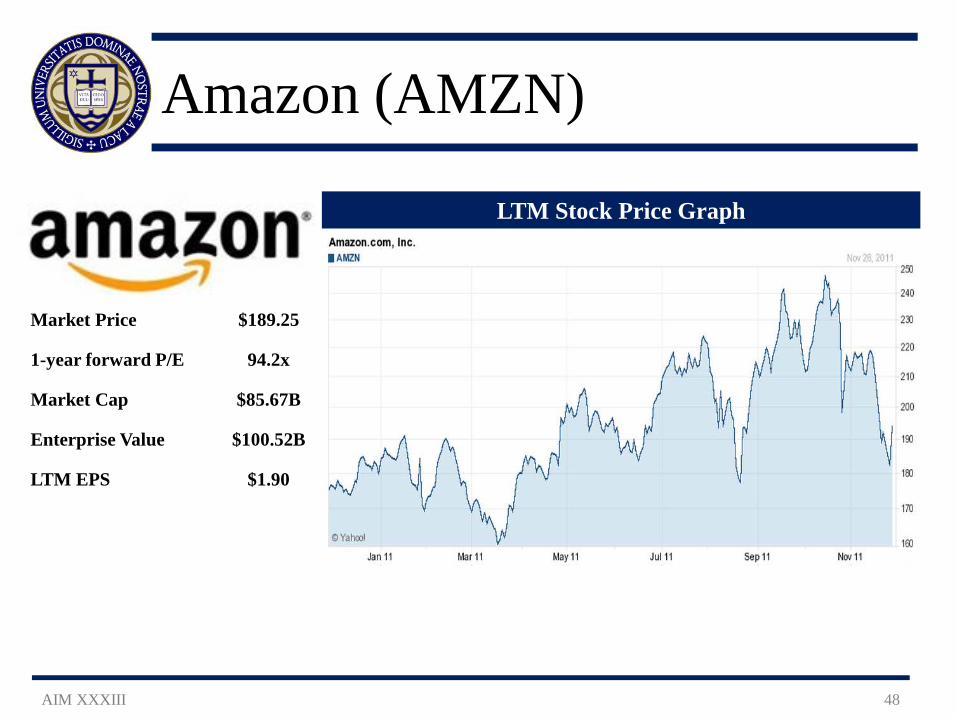
Amazon (AMZN)
AIM XXXIII 48
Market Price $189.25
1-year forward P/E 94.2x
Market Cap $85.67B
Enterprise Value $100.52B
LTM EPS $1.90
LTM Stock Price Graph
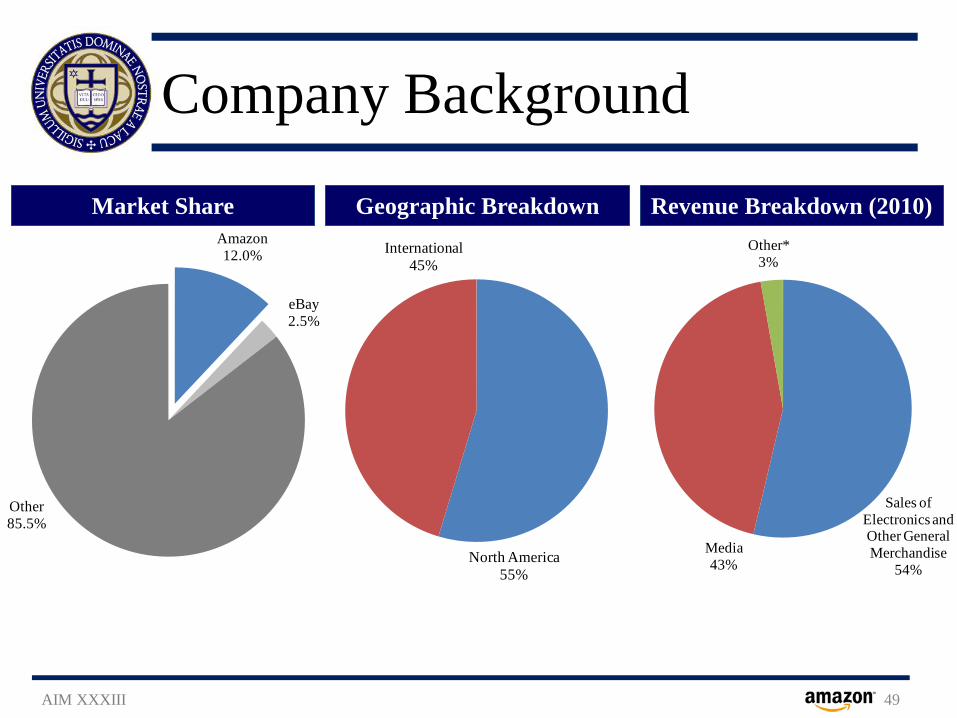
Amazon12.0%
eBay2.5%
Other85.5%
Company Background
AIM XXXIII 49
Market Share Geographic Breakdown Revenue Breakdown (2010)
North America55%
International45%
Sales of Electronics and Other General Merchandise
54%Media43%
Other*3%
2,000.0
7,000.0
12,000.0
17,000.0
22,000.0
27,000.0
32,000.0
Sales Linear Constant Growth
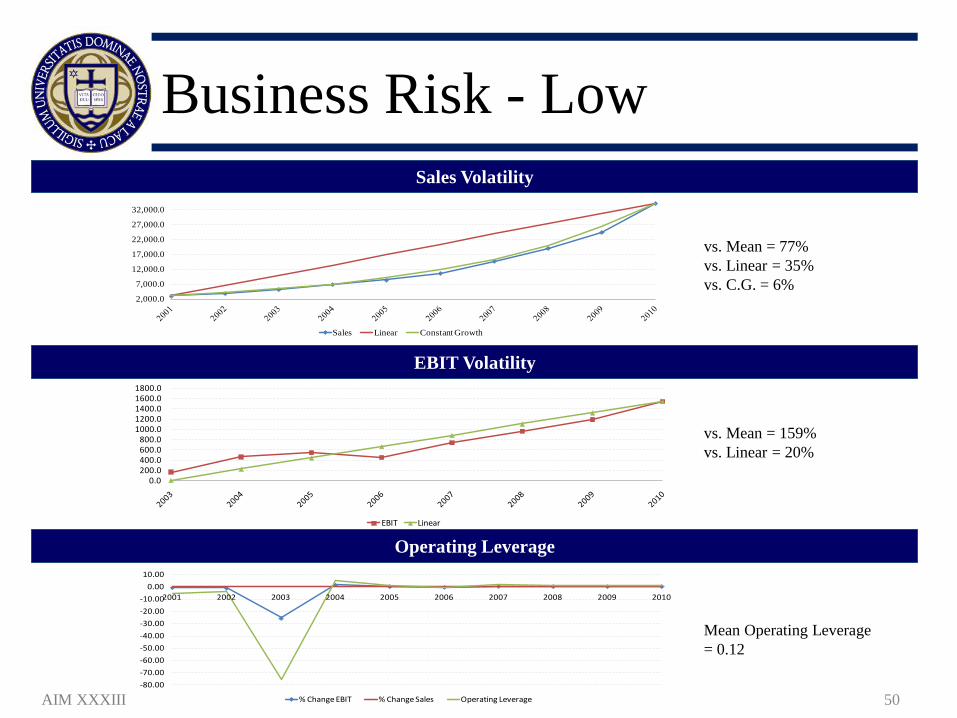
Business Risk - Low
0.0 200.0 400.0 600.0 800.0
1000.0 1200.0 1400.0 1600.0 1800.0
EBIT Linear
Sales Volatility
vs. Mean = 77% vs. Linear = 35% vs. C.G. = 6%
EBIT Volatility
vs. Mean = 159% vs. Linear = 20%
Operating Leverage
-80.00-70.00-60.00-50.00-40.00-30.00-20.00-10.00
0.0010.00
2001 2002 2003 2004 2005 2006 2007 2008 2009 2010
% Change EBIT % Change Sales Operating Leverage
Mean Operating Leverage = 0.12
AIM XXXIII 50
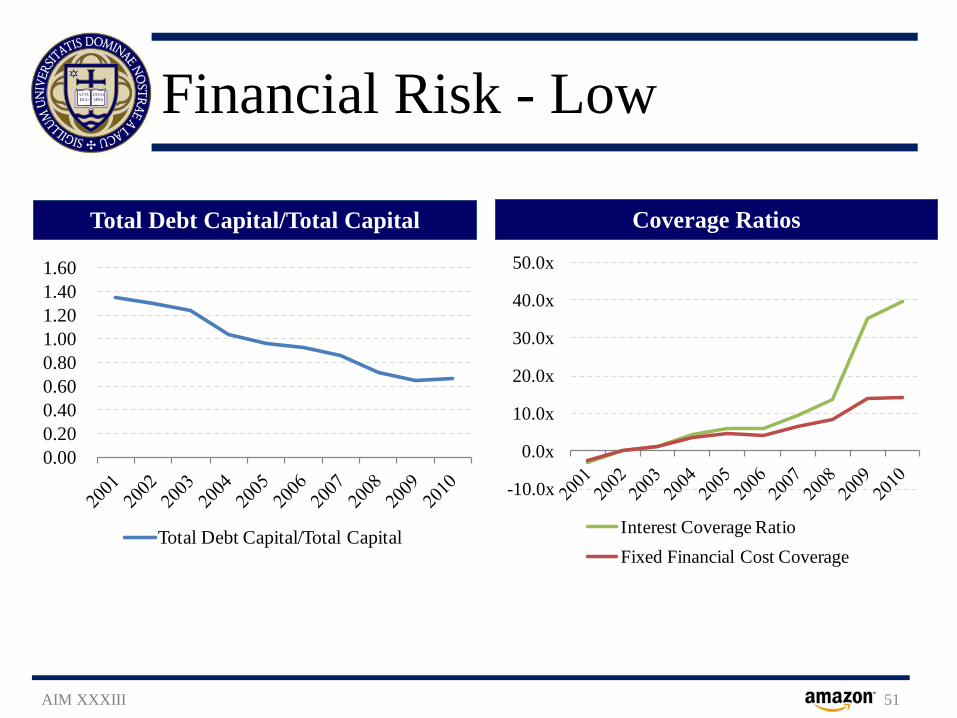
Financial Risk - Low
AIM XXXIII 51
Total Debt Capital/Total Capital Coverage Ratios
0.00 0.20 0.40 0.60 0.80 1.00 1.20 1.40 1.60
Total Debt Capital/Total Capital
-10.0x
0.0x
10.0x
20.0x
30.0x
40.0x
50.0x
Interest Coverage RatioFixed Financial Cost Coverage
-300.0%-250.0%-200.0%-150.0%-100.0%
-50.0%0.0%
50.0%100.0%150.0%200.0%
(20.00)
(15.00)
(10.00)
(5.00)
-
5.00
10.00
15.00
20.00
0.00
0.50
1.00
1.50
2.00
2.50
-20.0%
-15.0%
-10.0%
-5.0%
0.0%
5.0%
10.0%
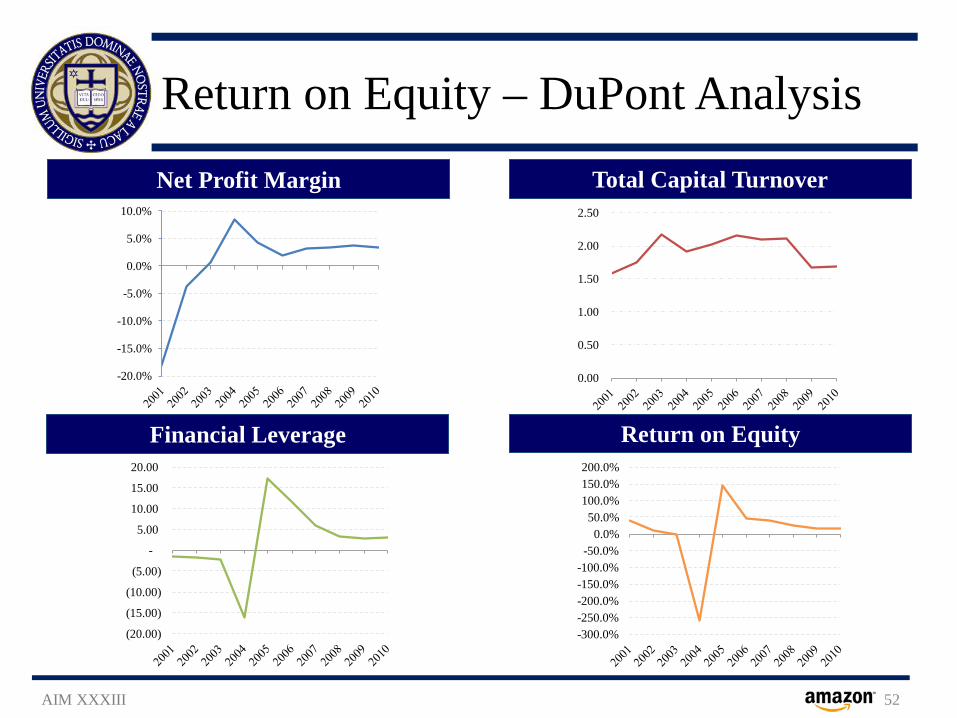
Return on Equity – DuPont Analysis
AIM XXXIII 52
Net Profit Margin Total Capital Turnover
Financial Leverage Return on Equity
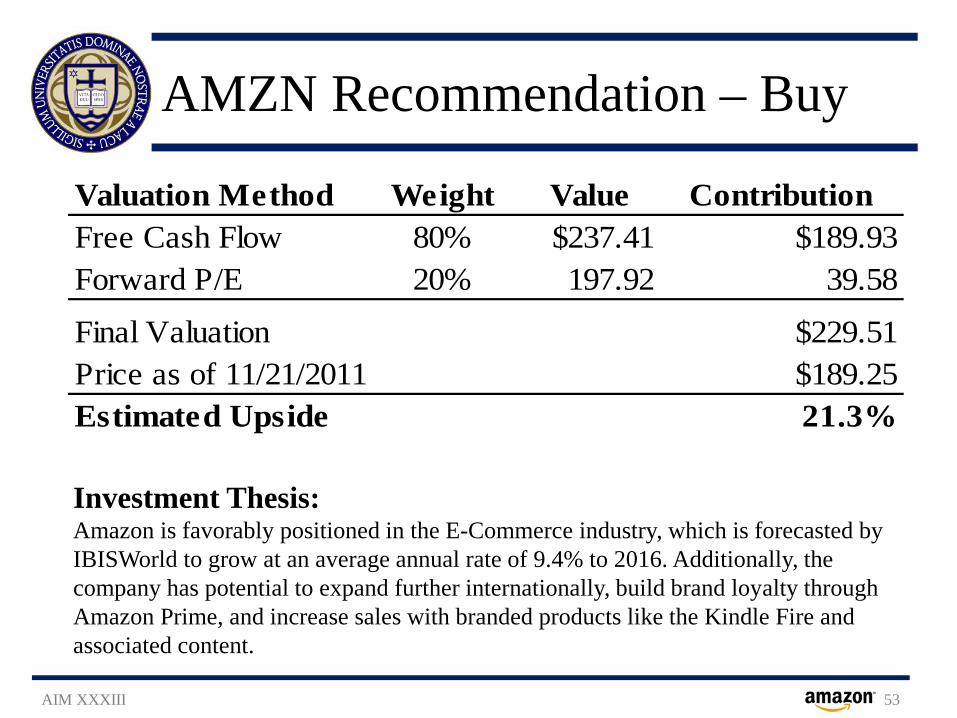
AMZN Recommendation – Buy
AIM XXXIII 53
Investment Thesis: Amazon is favorably positioned in the E-Commerce industry, which is forecasted by IBISWorld to grow at an average annual rate of 9.4% to 2016. Additionally, the company has potential to expand further internationally, build brand loyalty through Amazon Prime, and increase sales with branded products like the Kindle Fire and associated content.
Valuation Method Weight Value ContributionFree Cash Flow 80% $237.41 $189.93Forward P/E 20% 197.92 39.58
Final Valuation $229.51Price as of 11/21/2011 $189.25Estimated Upside 21.3%
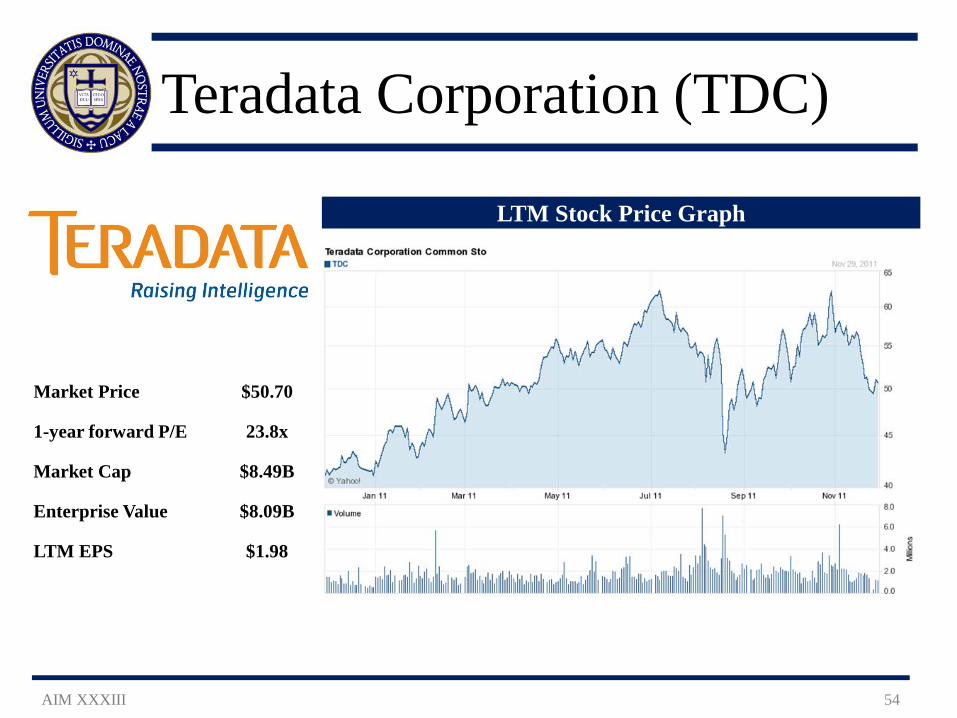
Teradata Corporation (TDC)
AIM XXXIII 54
Market Price $50.70
1-year forward P/E 23.8x
Market Cap $8.49B
Enterprise Value $8.09B
LTM EPS $1.98
LTM Stock Price Graph
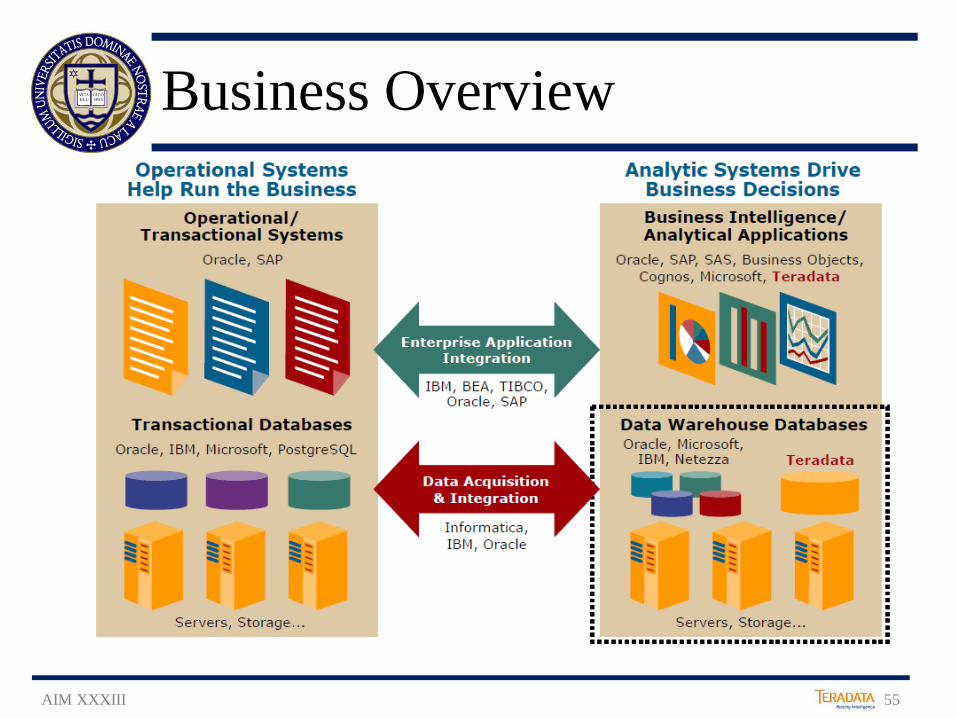
Business Overview
AIM XXXIII 55
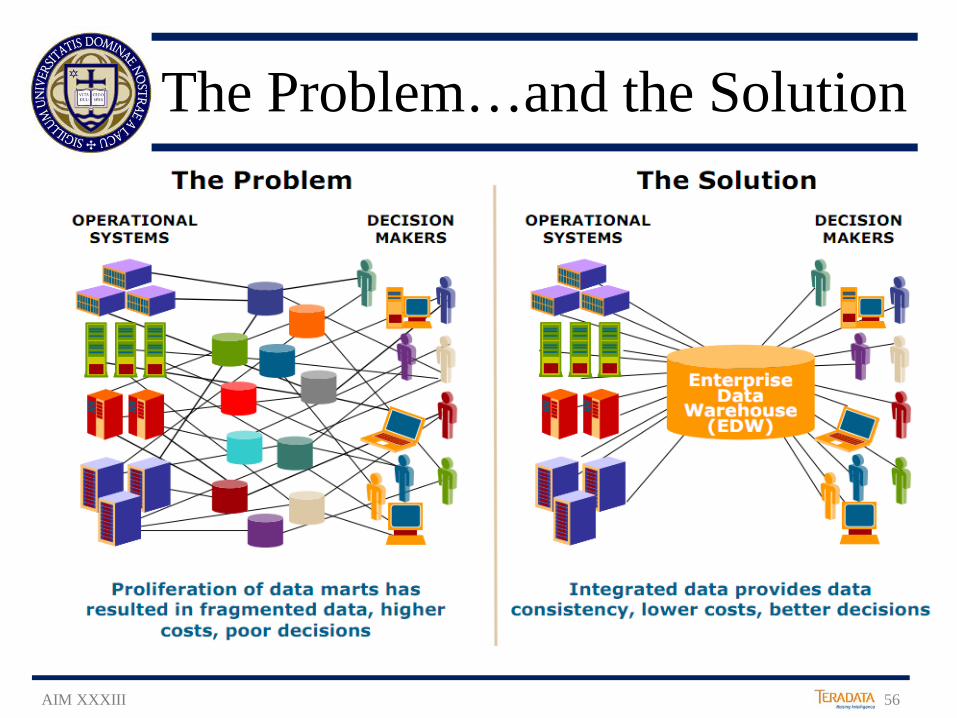
The Problem…and the Solution
AIM XXXIII 56
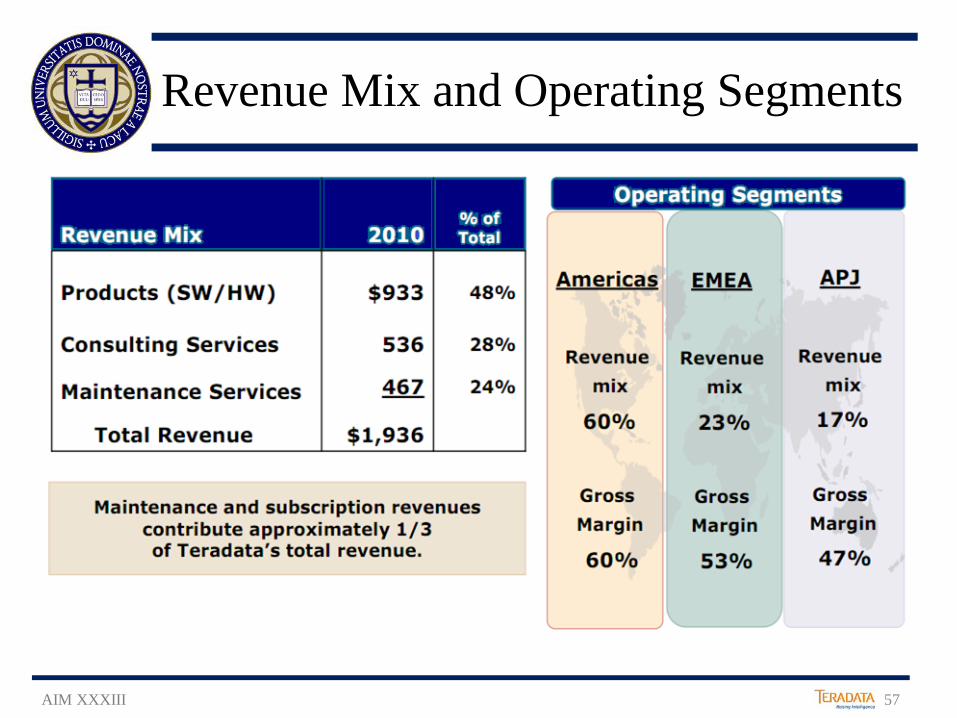
Revenue Mix and Operating Segments
AIM XXXIII 57
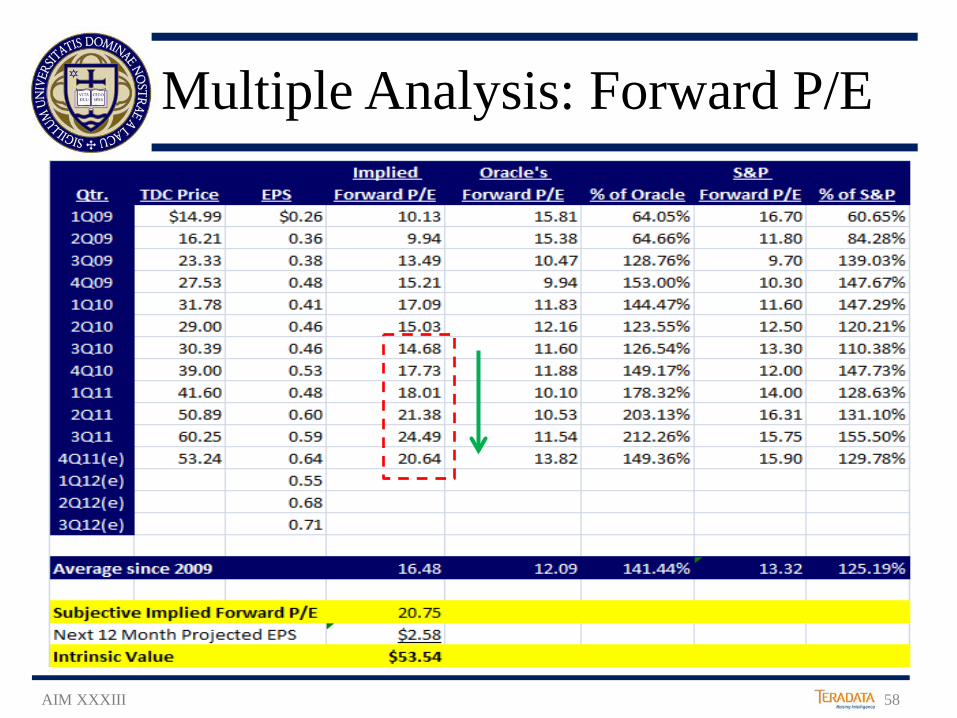
Multiple Analysis: Forward P/E
AIM XXXIII 58
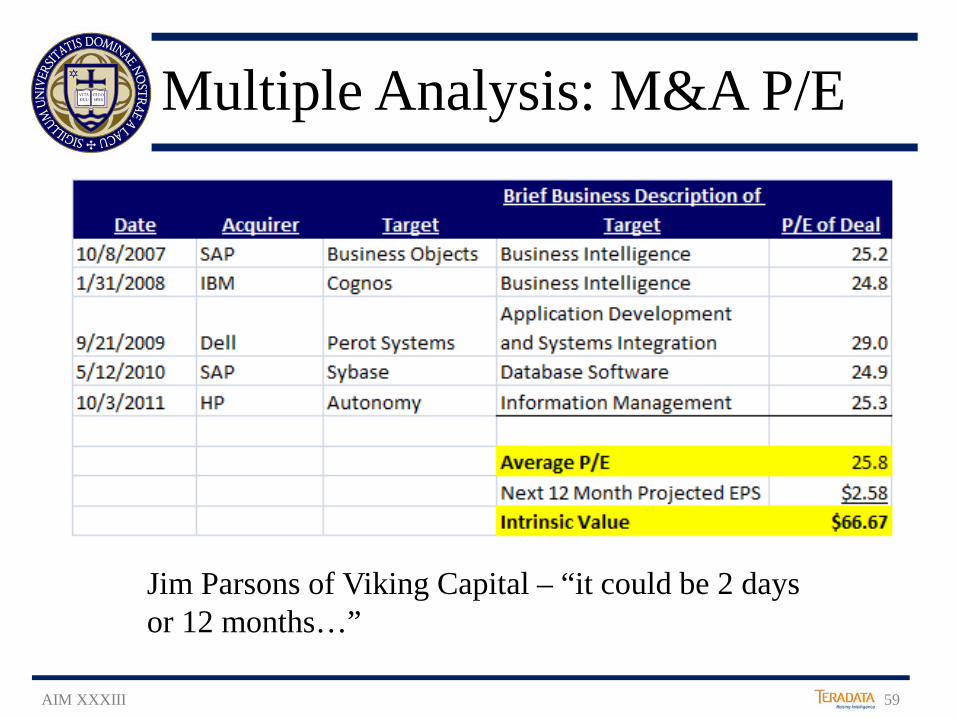
Multiple Analysis: M&A P/E
Jim Parsons of Viking Capital – “it could be 2 days or 12 months…”
AIM XXXIII 59
TDC Recommendation – Buy
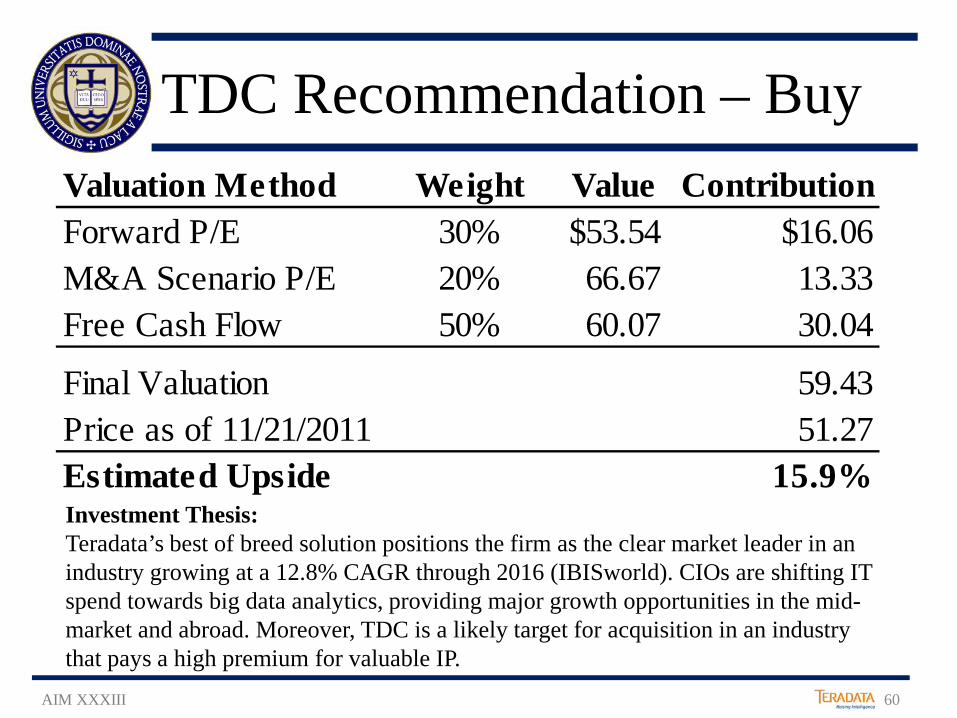
Investment Thesis: Teradata’s best of breed solution positions the firm as the clear market leader in an industry growing at a 12.8% CAGR through 2016 (IBISworld). CIOs are shifting IT spend towards big data analytics, providing major growth opportunities in the mid-market and abroad. Moreover, TDC is a likely target for acquisition in an industry that pays a high premium for valuable IP.
Valuation Method Weight Value ContributionForward P/E 30% $53.54 $16.06M&A Scenario P/E 20% 66.67 13.33Free Cash Flow 50% 60.07 30.04
Final Valuation 59.43Price as of 11/21/2011 51.27Estimated Upside 15.9%
AIM XXXIII 60
Cummins (CMI)
AIM XXXIII 61
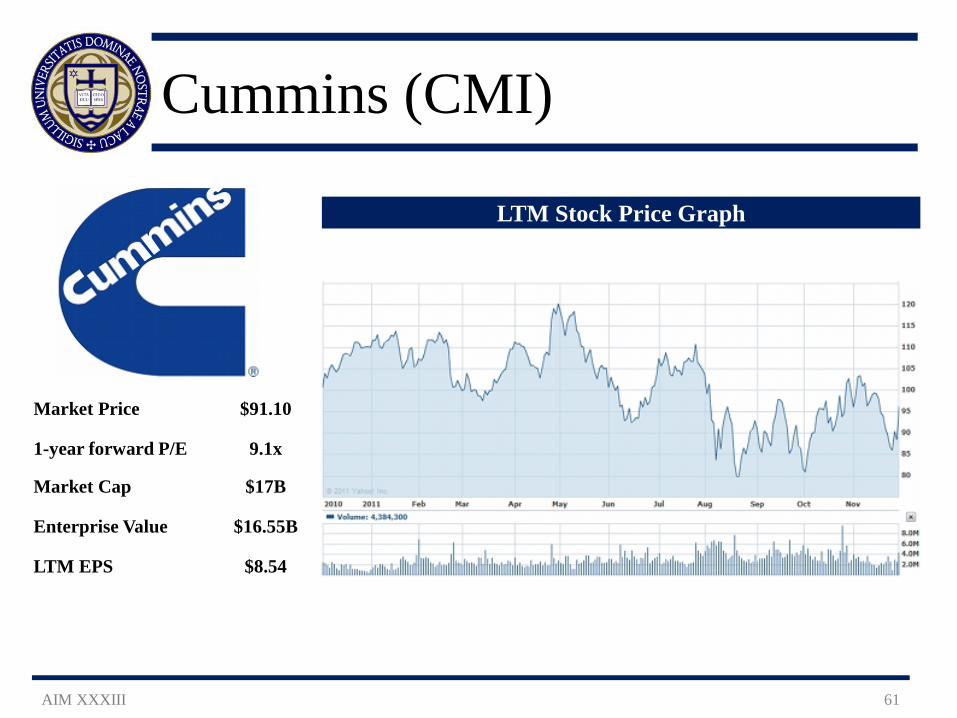
Market Price $91.10
1-year forward P/E 9.1x
Market Cap $17B
Enterprise Value $16.55B
LTM EPS $8.54
LTM Stock Price Graph
Company Background
AIM XXXIII 62
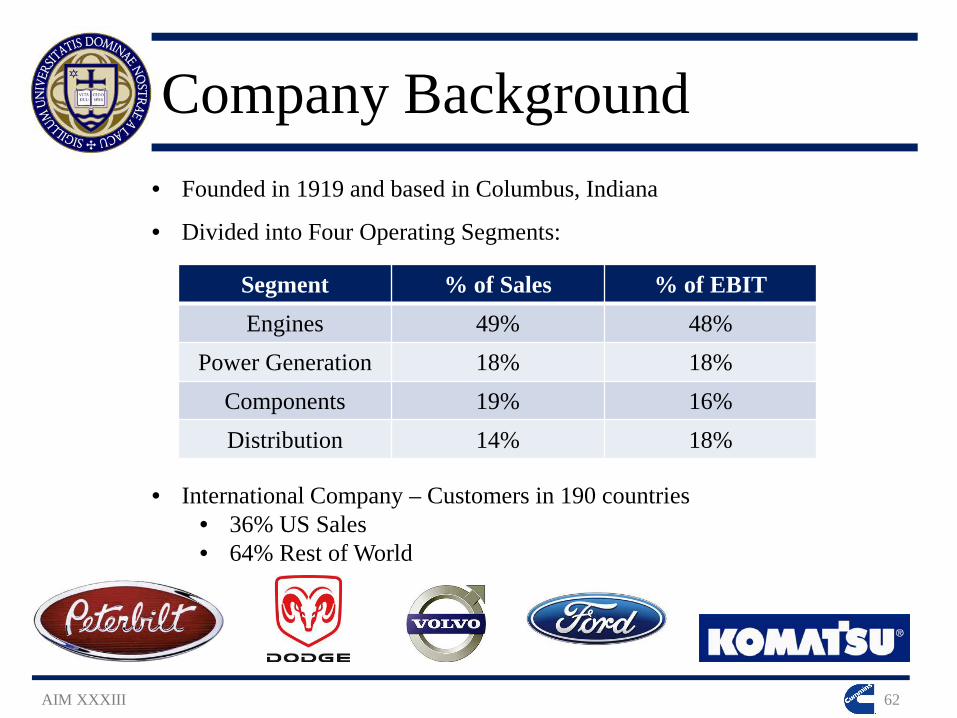
• Founded in 1919 and based in Columbus, Indiana
• Divided into Four Operating Segments:
• International Company – Customers in 190 countries • 36% US Sales • 64% Rest of World
Segment % of Sales % of EBIT Engines 49% 48%
Power Generation 18% 18% Components 19% 16% Distribution 14% 18%
CMI – Moving Averages
AIM XXXIII 63
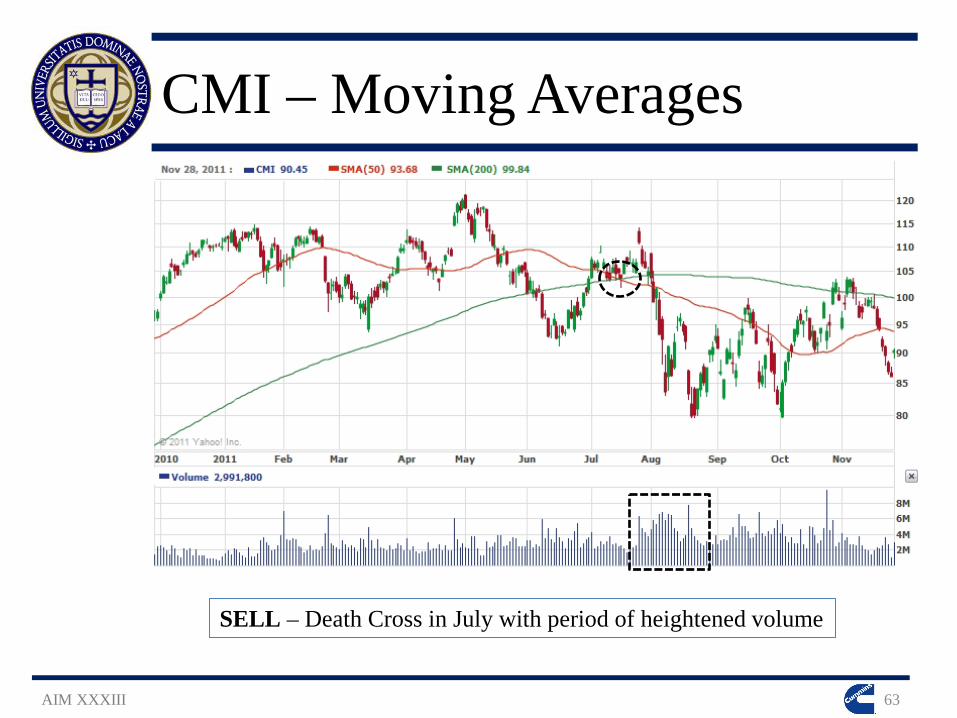
SELL – Death Cross in July with period of heightened volume
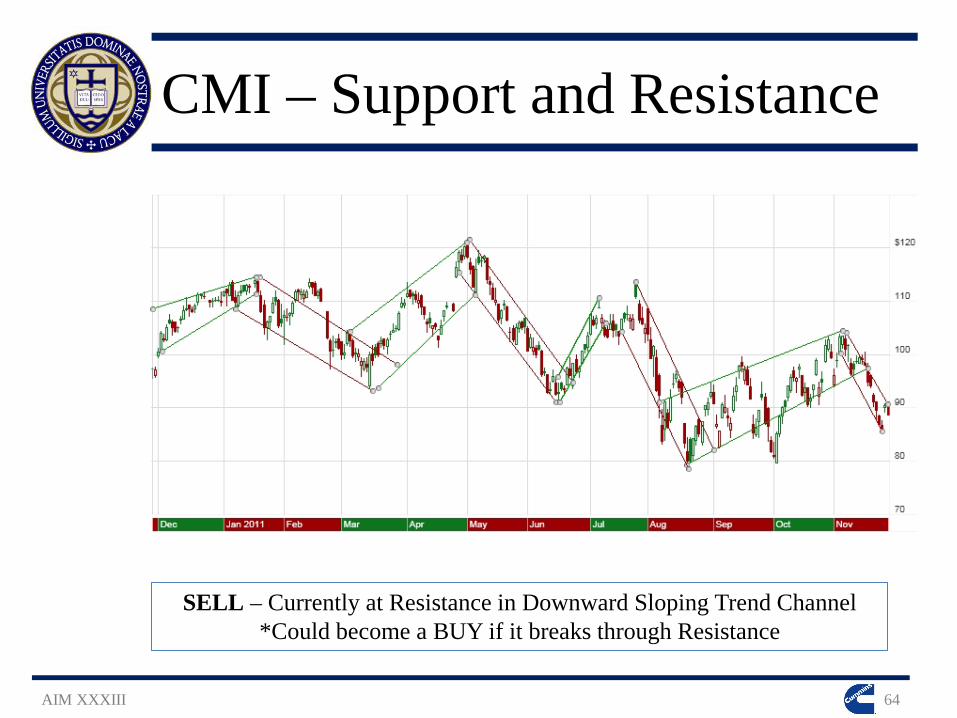
CMI – Support and Resistance
AIM XXXIII 64
SELL – Currently at Resistance in Downward Sloping Trend Channel *Could become a BUY if it breaks through Resistance
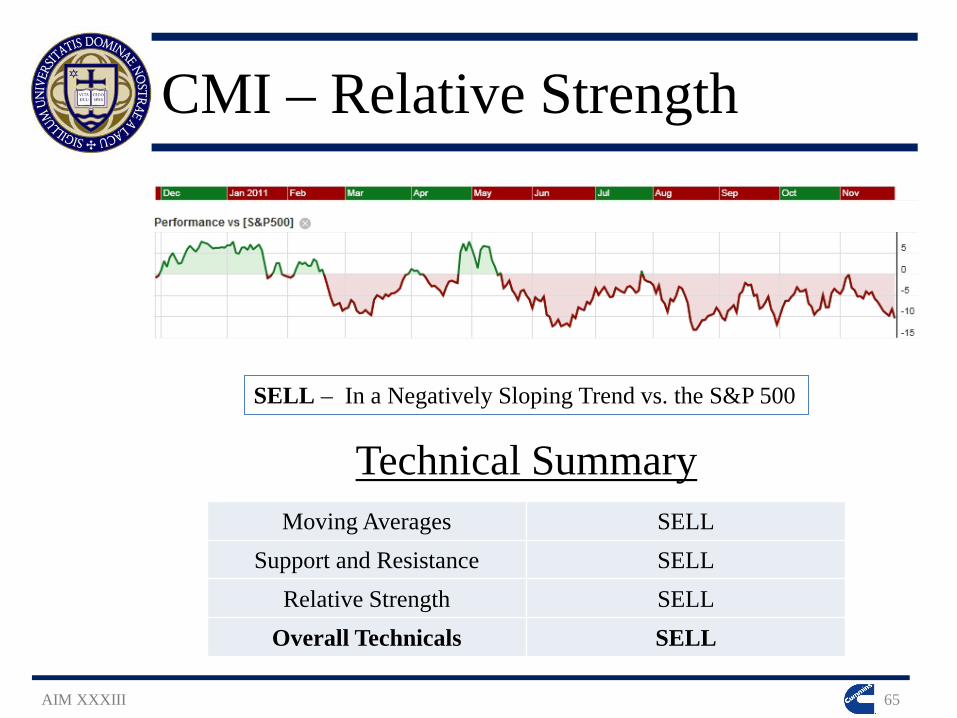
CMI – Relative Strength
AIM XXXIII 65
SELL – In a Negatively Sloping Trend vs. the S&P 500
Moving Averages SELL Support and Resistance SELL
Relative Strength SELL Overall Technicals SELL
Technical Summary
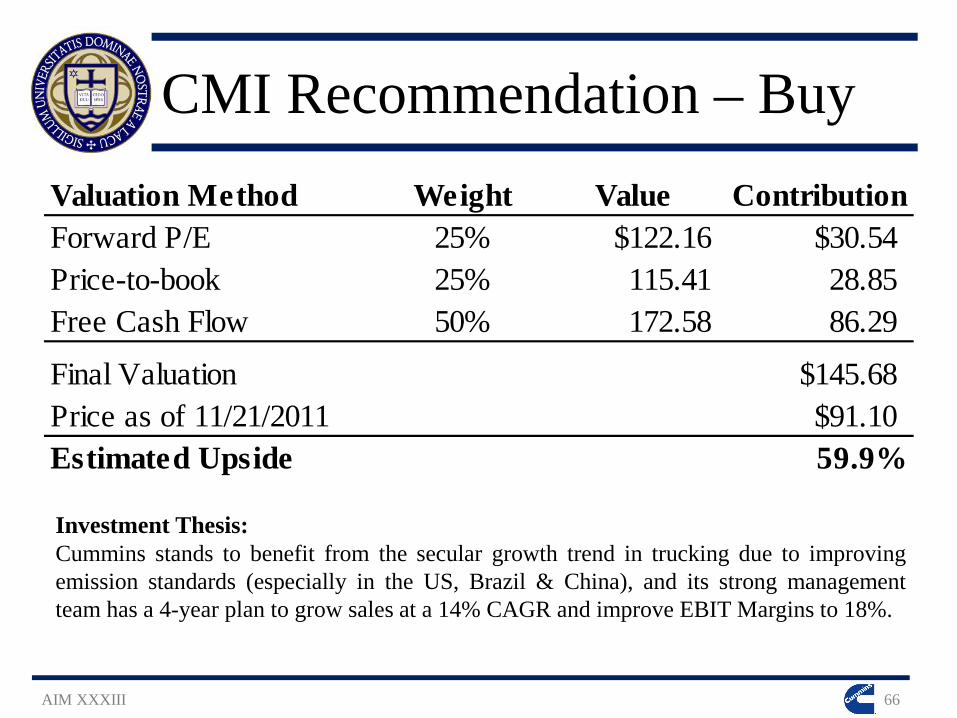
CMI Recommendation – Buy
AIM XXXIII 66
Investment Thesis: Cummins stands to benefit from the secular growth trend in trucking due to improving emission standards (especially in the US, Brazil & China), and its strong management team has a 4-year plan to grow sales at a 14% CAGR and improve EBIT Margins to 18%.
Valuation Method Weight Value ContributionForward P/E 25% $122.16 $30.54Price-to-book 25% 115.41 28.85 Free Cash Flow 50% 172.58 86.29
Final Valuation $145.68Price as of 11/21/2011 $91.10Estimated Upside 59.9%
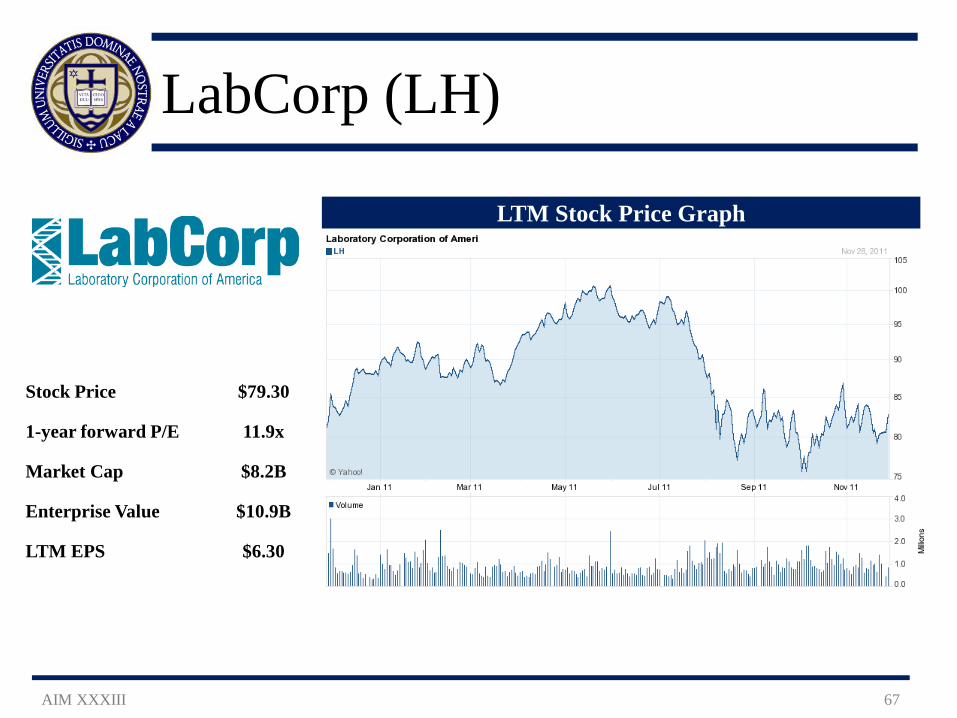
Stock Price $79.30
1-year forward P/E 11.9x
Market Cap $8.2B
Enterprise Value $10.9B
LTM EPS $6.30
LabCorp (LH)
AIM XXXIII 67
LTM Stock Price Graph
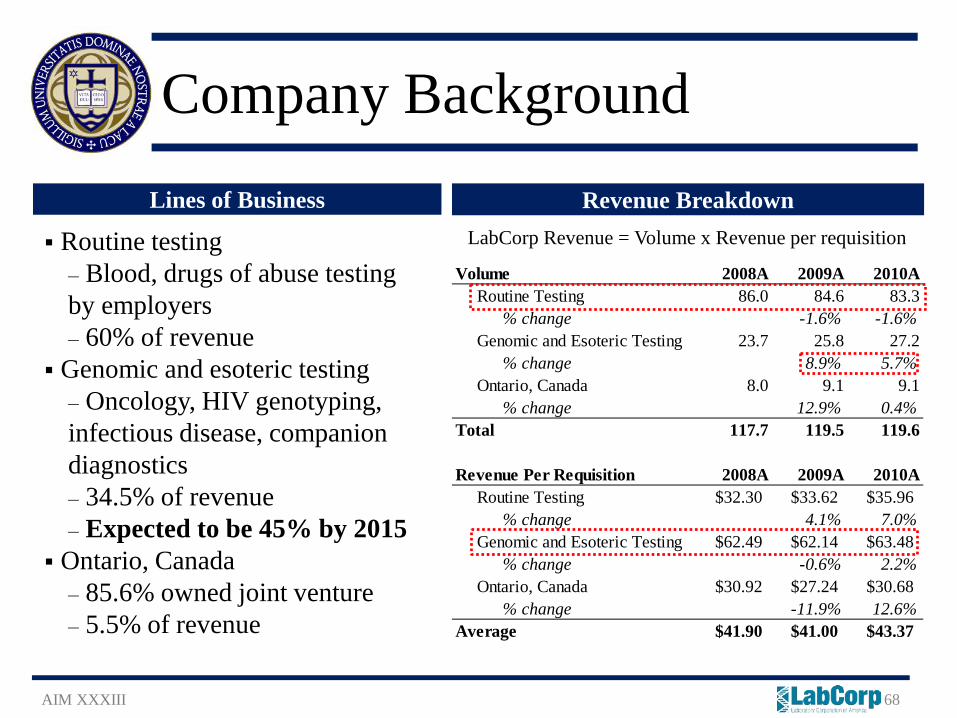
Volume 2008A 2009A 2010A Routine Testing 86.0 84.6 83.3 % change -1.6% -1.6% Genomic and Esoteric Testing 23.7 25.8 27.2 % change 8.9% 5.7% Ontario, Canada 8.0 9.1 9.1 % change 12.9% 0.4%Total 117.7 119.5 119.6
Revenue Per Requisition 2008A 2009A 2010A Routine Testing $32.30 $33.62 $35.96 % change 4.1% 7.0% Genomic and Esoteric Testing $62.49 $62.14 $63.48 % change -0.6% 2.2% Ontario, Canada $30.92 $27.24 $30.68 % change -11.9% 12.6%Average $41.90 $41.00 $43.37
Company Background
AIM XXXIII 68
Revenue Breakdown
Routine testing ‒ Blood, drugs of abuse testing by employers ‒ 60% of revenue
Genomic and esoteric testing ‒ Oncology, HIV genotyping, infectious disease, companion diagnostics ‒ 34.5% of revenue ‒ Expected to be 45% by 2015
Ontario, Canada ‒ 85.6% owned joint venture ‒ 5.5% of revenue
Lines of Business LabCorp Revenue = Volume x Revenue per requisition
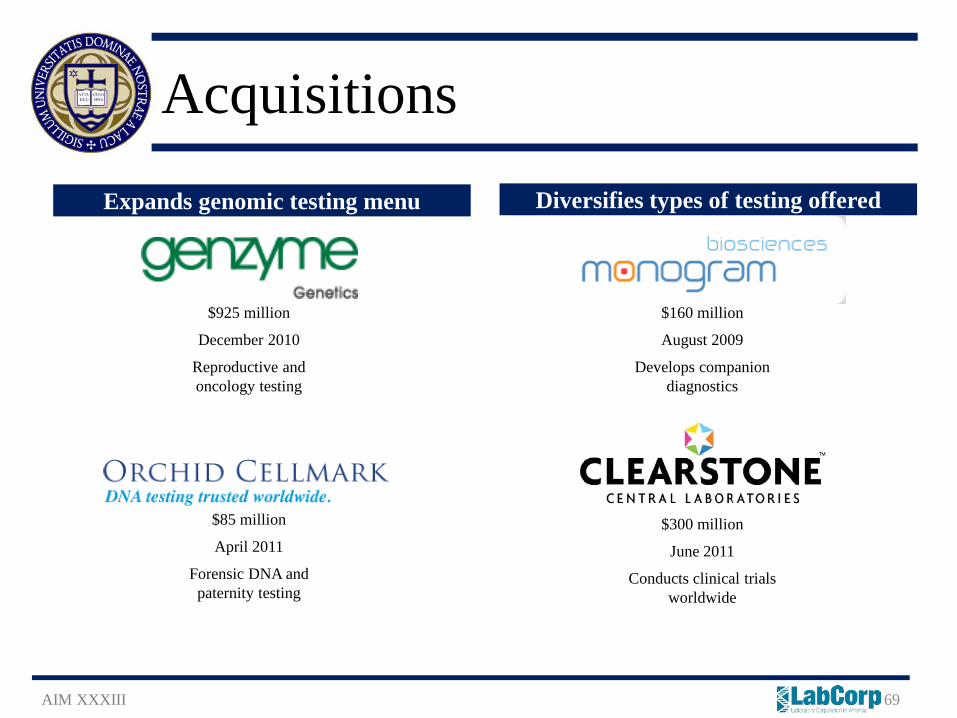
Acquisitions
AIM XXXIII 69
Diversifies types of testing offered Expands genomic testing menu
$925 million
December 2010
Reproductive and oncology testing
$160 million
August 2009
Develops companion diagnostics
$300 million
June 2011
Conducts clinical trials worldwide
$85 million
April 2011
Forensic DNA and paternity testing
Beta and WACC Calculation
AIM XXXIII 70
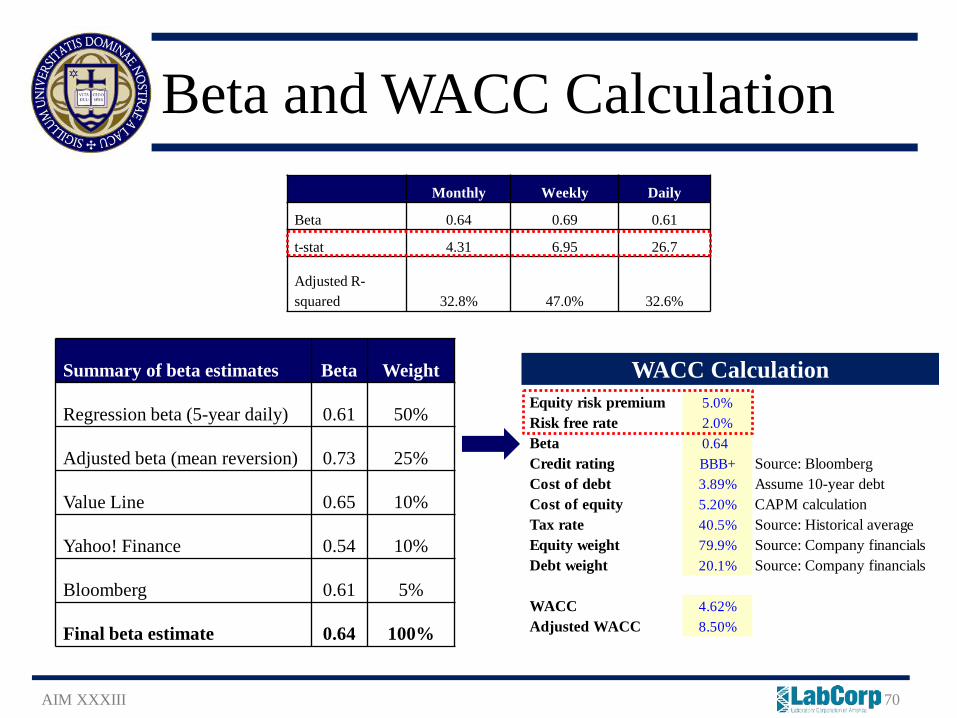
Monthly Weekly Daily
Beta 0.64 0.69 0.61
t-stat 4.31 6.95 26.7
Adjusted R-squared 32.8% 47.0% 32.6%
Summary of beta estimates Beta Weight
Regression beta (5-year daily) 0.61 50%
Adjusted beta (mean reversion) 0.73 25%
Value Line 0.65 10%
Yahoo! Finance 0.54 10%
Bloomberg 0.61 5%
Final beta estimate 0.64 100%
Equity risk premium 5.0%Risk free rate 2.0%Beta 0.64Credit rating BBB+ Source: BloombergCost of debt 3.89% Assume 10-year debtCost of equity 5.20% CAPM calculationTax rate 40.5% Source: Historical averageEquity weight 79.9% Source: Company financialsDebt weight 20.1% Source: Company financials
WACC 4.62%Adjusted WACC 8.50%
WACC Calculation
DCF Assumptions
AIM XXXIII 71
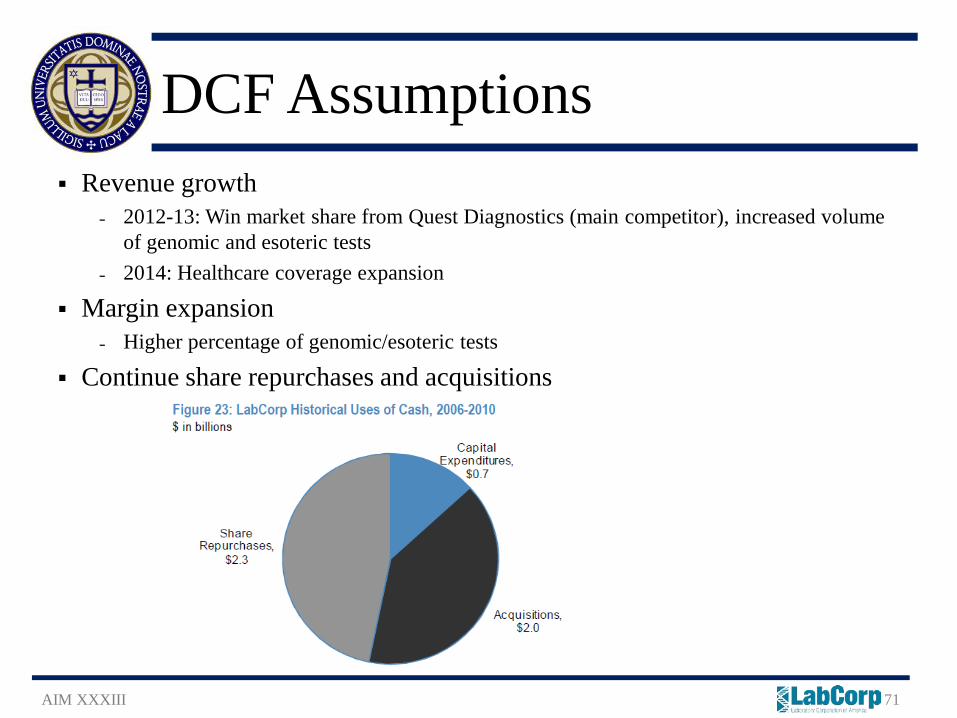
Revenue growth ˗ 2012-13: Win market share from Quest Diagnostics (main competitor), increased volume
of genomic and esoteric tests ˗ 2014: Healthcare coverage expansion
Margin expansion ˗ Higher percentage of genomic/esoteric tests
Continue share repurchases and acquisitions
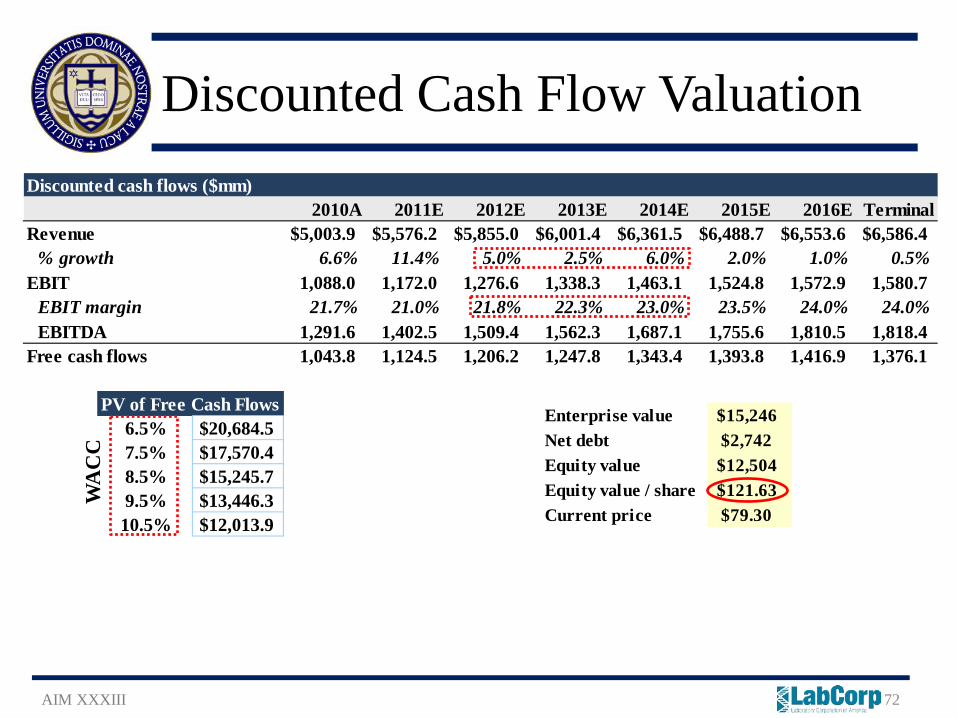
Discounted cash flows ($mm)2010A 2011E 2012E 2013E 2014E 2015E 2016E Terminal
Revenue $5,003.9 $5,576.2 $5,855.0 $6,001.4 $6,361.5 $6,488.7 $6,553.6 $6,586.4% growth 6.6% 11.4% 5.0% 2.5% 6.0% 2.0% 1.0% 0.5%
EBIT 1,088.0 1,172.0 1,276.6 1,338.3 1,463.1 1,524.8 1,572.9 1,580.7EBIT margin 21.7% 21.0% 21.8% 22.3% 23.0% 23.5% 24.0% 24.0%EBITDA 1,291.6 1,402.5 1,509.4 1,562.3 1,687.1 1,755.6 1,810.5 1,818.4
Free cash flows 1,043.8 1,124.5 1,206.2 1,247.8 1,343.4 1,393.8 1,416.9 1,376.1
PV of Free Cash Flows6.5% $20,684.57.5% $17,570.48.5% $15,245.79.5% $13,446.310.5% $12,013.9
Enterprise value $15,246Net debt $2,742Equity value $12,504Equity value / share $121.63Current price $79.30
Discounted Cash Flow Valuation
AIM XXXIII 72
WA
CC
LH Recommendation – Buy
AIM XXXIII 73
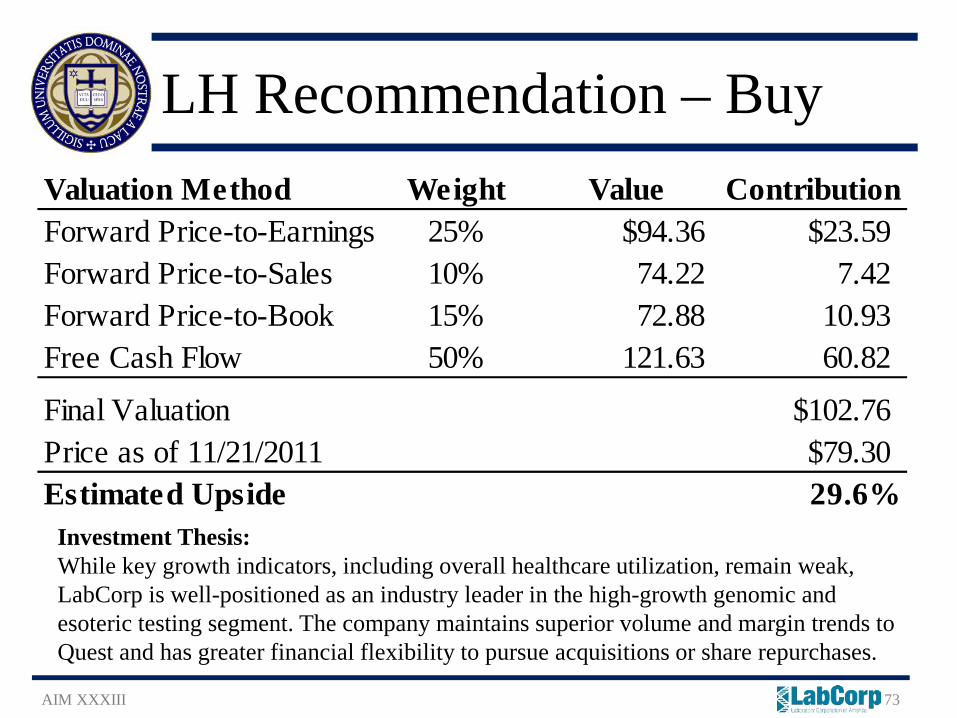
Valuation Method Weight Value ContributionForward Price-to-Earnings 25% $94.36 $23.59Forward Price-to-Sales 10% 74.22 7.42 Forward Price-to-Book 15% 72.88 10.93 Free Cash Flow 50% 121.63 60.82
Final Valuation $102.76Price as of 11/21/2011 $79.30Estimated Upside 29.6%
Investment Thesis: While key growth indicators, including overall healthcare utilization, remain weak, LabCorp is well-positioned as an industry leader in the high-growth genomic and esoteric testing segment. The company maintains superior volume and margin trends to Quest and has greater financial flexibility to pursue acquisitions or share repurchases.
Tesla Motors (TSLA)
AIM XXXIII 74
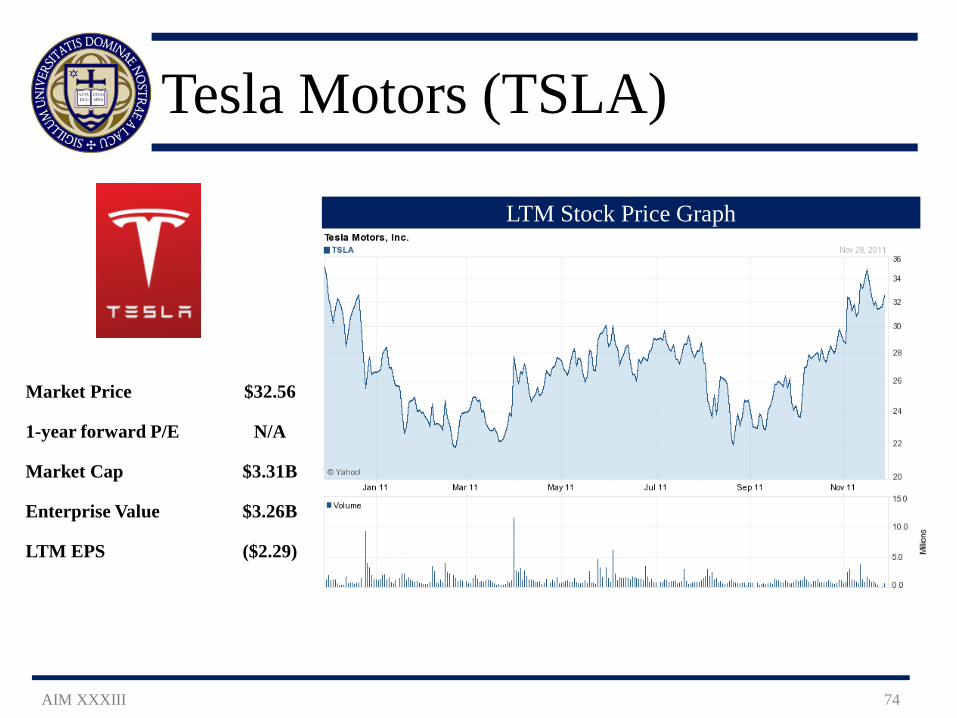
Market Price $32.56
1-year forward P/E N/A
Market Cap $3.31B
Enterprise Value $3.26B
LTM EPS ($2.29)
LTM Stock Price Graph
Company Overview
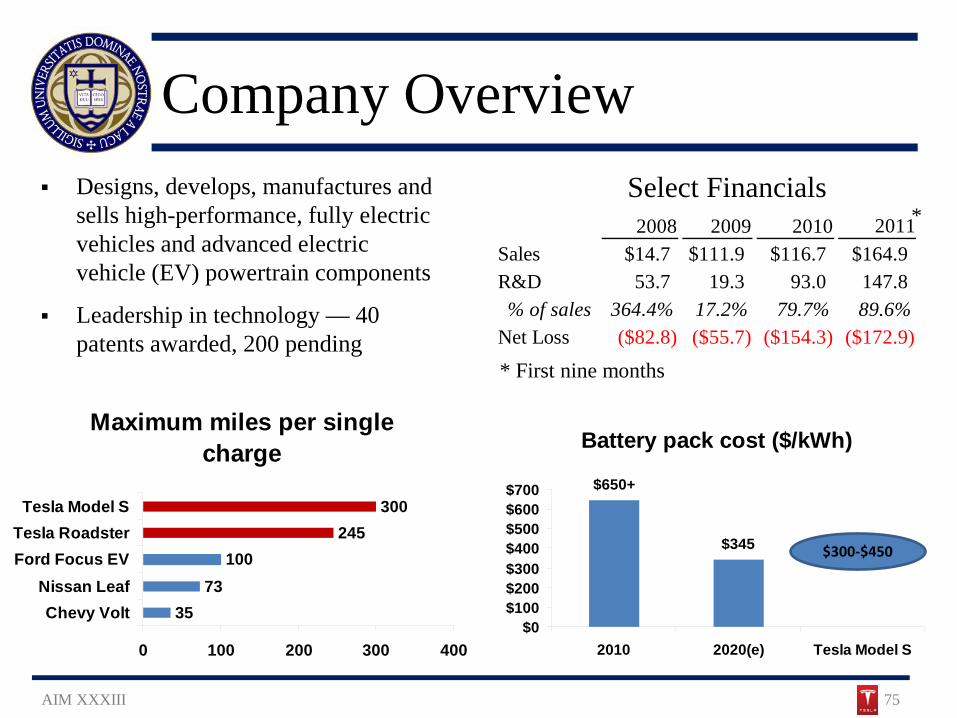
AIM XXXIII 75
Designs, develops, manufactures and sells high-performance, fully electric vehicles and advanced electric vehicle (EV) powertrain components
Leadership in technology — 40 patents awarded, 200 pending
Maximum miles per single charge
3573
100245
300
0 100 200 300 400
Chevy VoltNissan Leaf
Ford Focus EVTesla Roadster
Tesla Model S
Battery pack cost ($/kWh)
$650+
$345
$0$100$200$300$400$500$600$700
2010 2020(e) Tesla Model S
$300-$450
Select Financials *
* First nine months
2008 2009 2010 2011Sales $14.7 $111.9 $116.7 $164.9R&D 53.7 19.3 93.0 147.8% of sales 364.4% 17.2% 79.7% 89.6%
Net Loss ($82.8) ($55.7) ($154.3) ($172.9)
Electric Vehicle Industry
AIM XXXIII 76
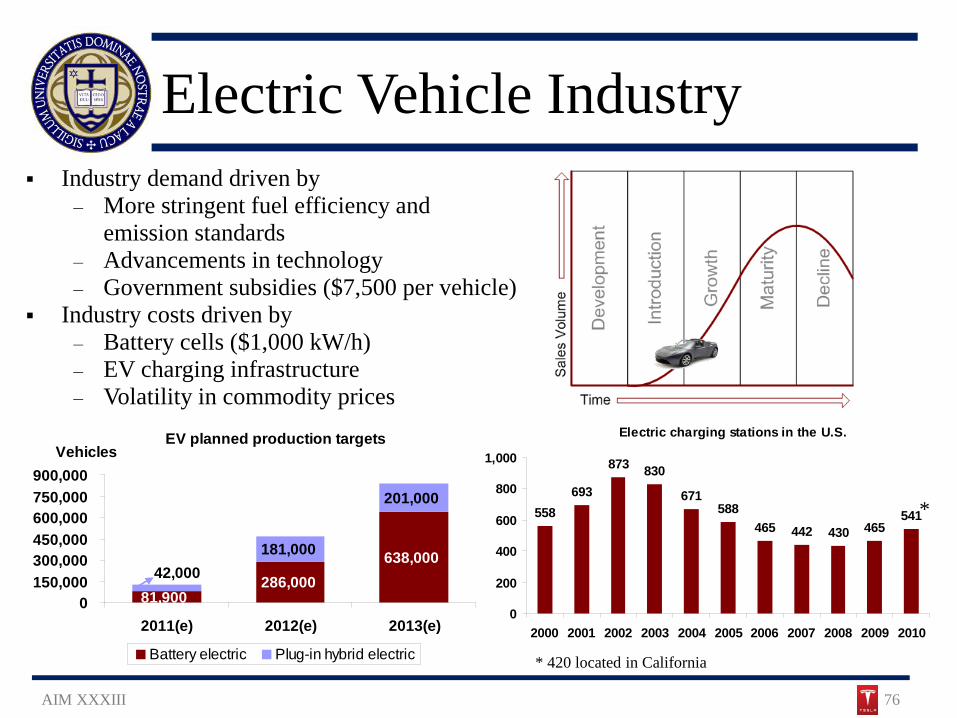
Industry demand driven by ‒ More stringent fuel efficiency and
emission standards ‒ Advancements in technology ‒ Government subsidies ($7,500 per vehicle)
Industry costs driven by ‒ Battery cells ($1,000 kW/h) ‒ EV charging infrastructure ‒ Volatility in commodity prices
Electric charging stations in the U.S.
558693
873 830
671588
465 442 430 465541
0
200
400
600
800
1,000
2000 2001 2002 2003 2004 2005 2006 2007 2008 2009 2010
*
* 420 located in California
EV planned production targets
81,900286,000
638,000181,000
201,000
42,000
0150,000300,000450,000600,000750,000900,000
2011(e) 2012(e) 2013(e)
Vehicles
Battery electric Plug-in hybrid electric
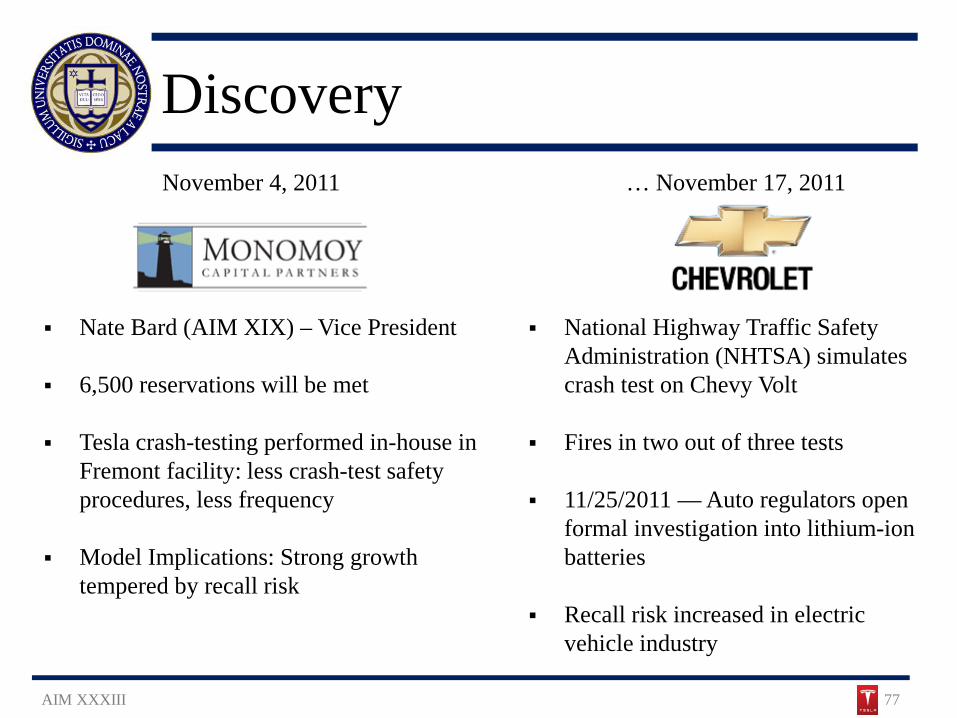
Discovery
AIM XXXIII 77
Nate Bard (AIM XIX) – Vice President
6,500 reservations will be met
Tesla crash-testing performed in-house in Fremont facility: less crash-test safety procedures, less frequency
Model Implications: Strong growth tempered by recall risk
November 4, 2011 … November 17, 2011
National Highway Traffic Safety Administration (NHTSA) simulates crash test on Chevy Volt
Fires in two out of three tests
11/25/2011 — Auto regulators open formal investigation into lithium-ion batteries
Recall risk increased in electric vehicle industry
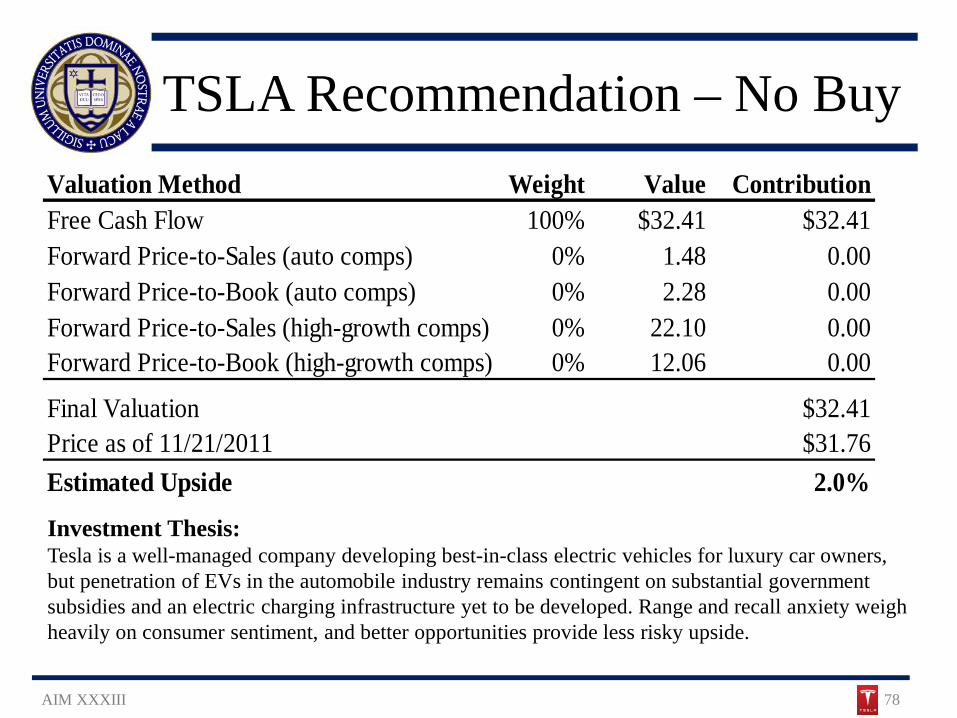
TSLA Recommendation – No Buy
AIM XXXIII 78
Investment Thesis: Tesla is a well-managed company developing best-in-class electric vehicles for luxury car owners, but penetration of EVs in the automobile industry remains contingent on substantial government subsidies and an electric charging infrastructure yet to be developed. Range and recall anxiety weigh heavily on consumer sentiment, and better opportunities provide less risky upside.
Valuation Method Weight Value ContributionFree Cash Flow 100% $32.41 $32.41Forward Price-to-Sales (auto comps) 0% 1.48 0.00Forward Price-to-Book (auto comps) 0% 2.28 0.00Forward Price-to-Sales (high-growth comps) 0% 22.10 0.00Forward Price-to-Book (high-growth comps) 0% 12.06 0.00
Final Valuation $32.41Price as of 11/21/2011 $31.76Estimated Upside 2.0%
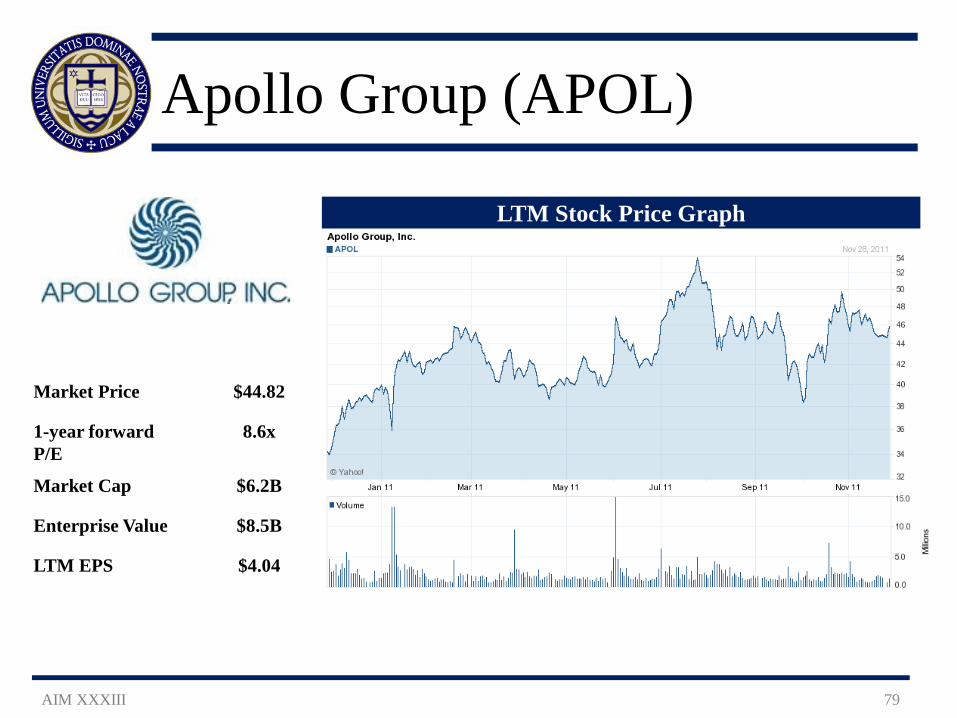
Apollo Group (APOL)
AIM XXXIII 79
Market Price $44.82
1-year forward P/E
8.6x
Market Cap $6.2B
Enterprise Value $8.5B
LTM EPS $4.04
LTM Stock Price Graph
Company Overview
AIM XXXIII 80
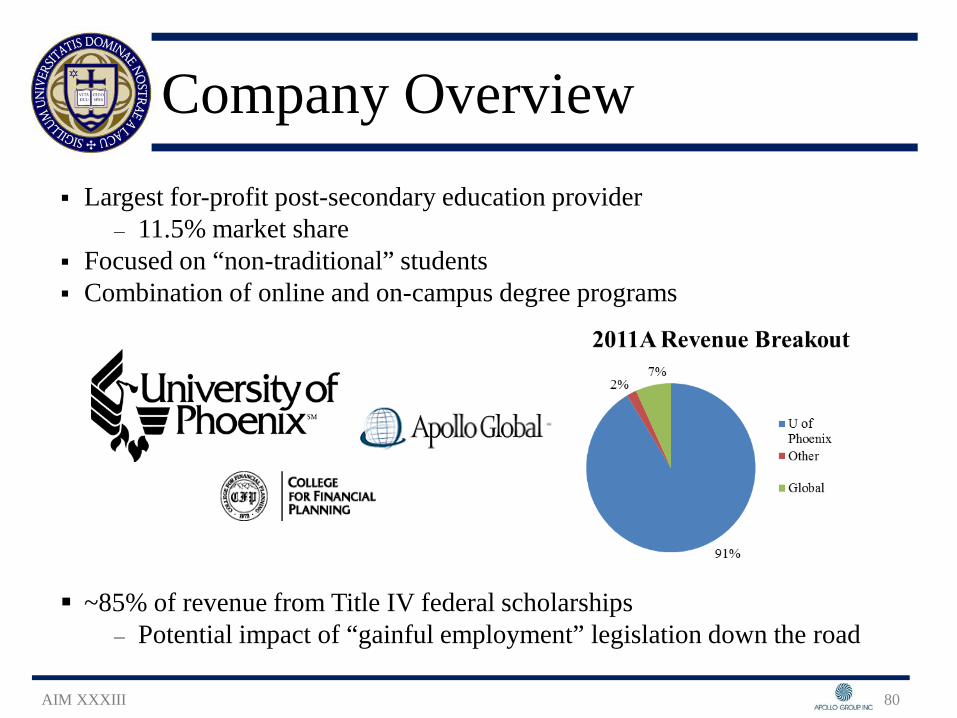
Largest for-profit post-secondary education provider ‒ 11.5% market share
Focused on “non-traditional” students Combination of online and on-campus degree programs
~85% of revenue from Title IV federal scholarships ‒ Potential impact of “gainful employment” legislation down the road
DCF Scenarios: Growth
AIM XXXIII 81
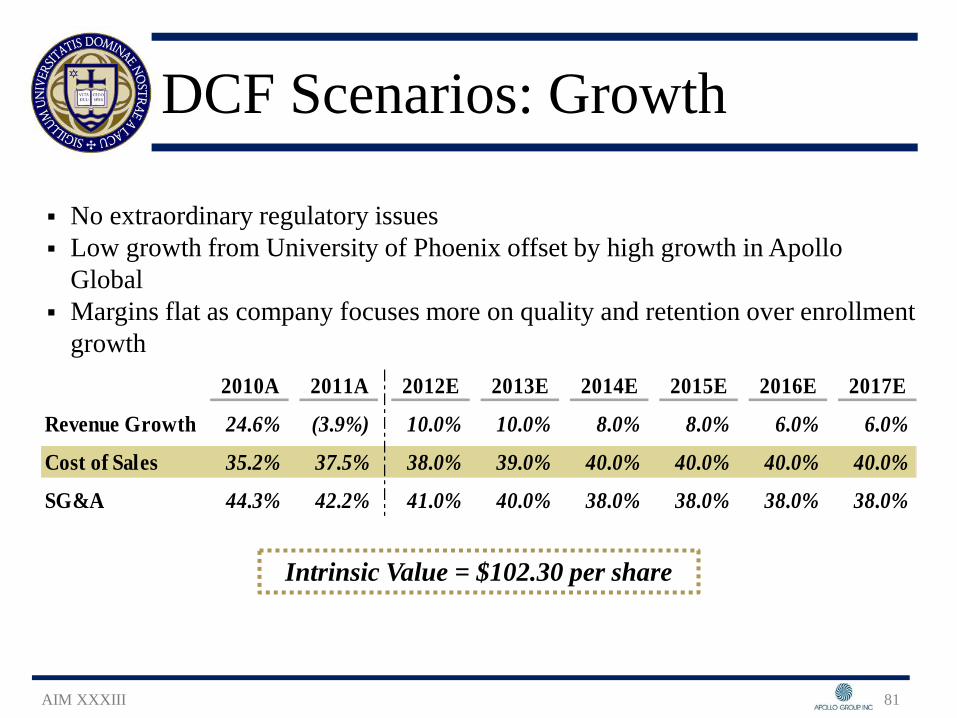
No extraordinary regulatory issues Low growth from University of Phoenix offset by high growth in Apollo
Global Margins flat as company focuses more on quality and retention over enrollment
growth 2010A 2011A 2012E 2013E 2014E 2015E 2016E 2017E
Revenue Growth 24.6% (3.9%) 10.0% 10.0% 8.0% 8.0% 6.0% 6.0%
Cost of Sales 35.2% 37.5% 38.0% 39.0% 40.0% 40.0% 40.0% 40.0%
SG&A 44.3% 42.2% 41.0% 40.0% 38.0% 38.0% 38.0% 38.0%
Intrinsic Value = $102.30 per share
DCF Scenarios: Disruptive
AIM XXXIII 82
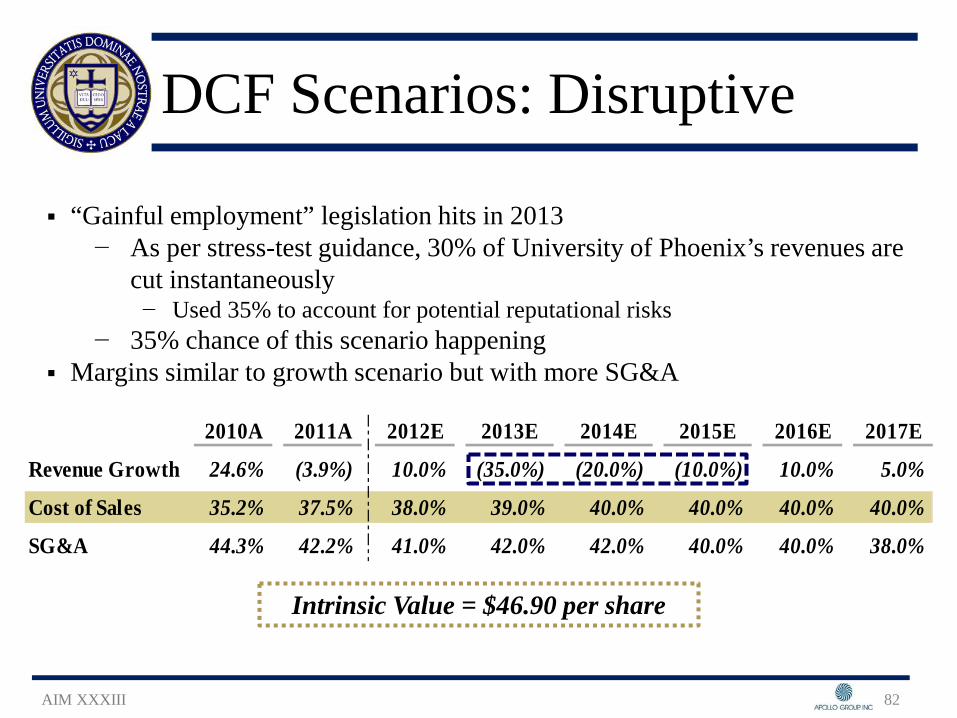
“Gainful employment” legislation hits in 2013 − As per stress-test guidance, 30% of University of Phoenix’s revenues are
cut instantaneously − Used 35% to account for potential reputational risks
− 35% chance of this scenario happening Margins similar to growth scenario but with more SG&A
2010A 2011A 2012E 2013E 2014E 2015E 2016E 2017E
Revenue Growth 24.6% (3.9%) 10.0% (35.0%) (20.0%) (10.0%) 10.0% 5.0%
Cost of Sales 35.2% 37.5% 38.0% 39.0% 40.0% 40.0% 40.0% 40.0%
SG&A 44.3% 42.2% 41.0% 42.0% 42.0% 40.0% 40.0% 38.0%
Intrinsic Value = $46.90 per share
APOL Recommendation – Buy
AIM XXXIII 83
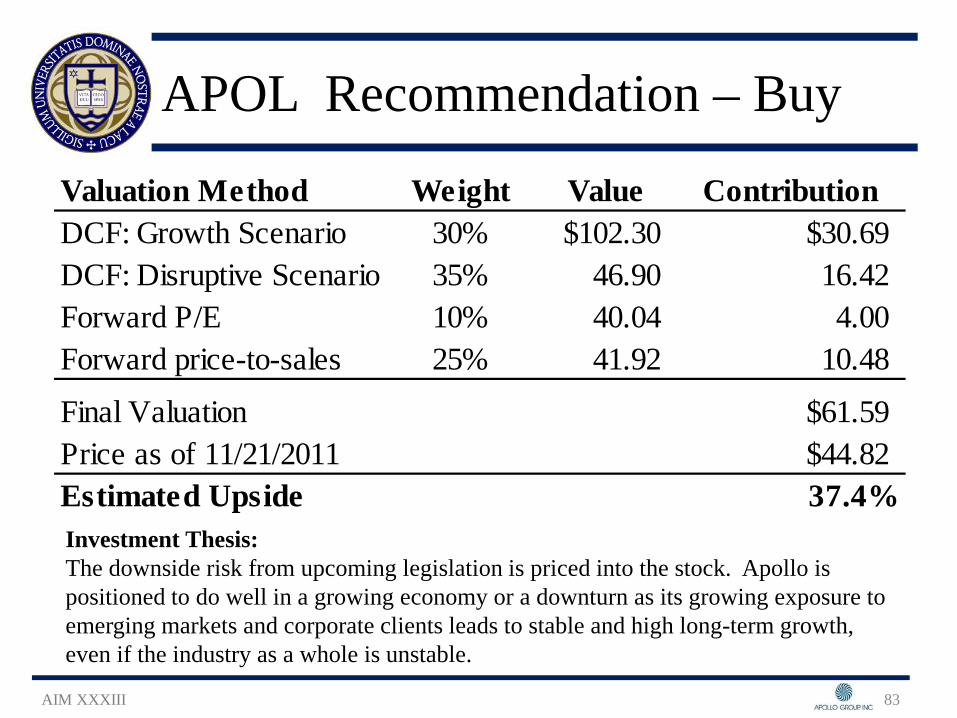
Investment Thesis: The downside risk from upcoming legislation is priced into the stock. Apollo is positioned to do well in a growing economy or a downturn as its growing exposure to emerging markets and corporate clients leads to stable and high long-term growth, even if the industry as a whole is unstable.
Valuation Method Weight Value ContributionDCF: Growth Scenario 30% $102.30 $30.69DCF: Disruptive Scenario 35% 46.90 16.42Forward P/E 10% 40.04 4.00Forward price-to-sales 25% 41.92 10.48
Final Valuation $61.59Price as of 11/21/2011 $44.82Estimated Upside 37.4%
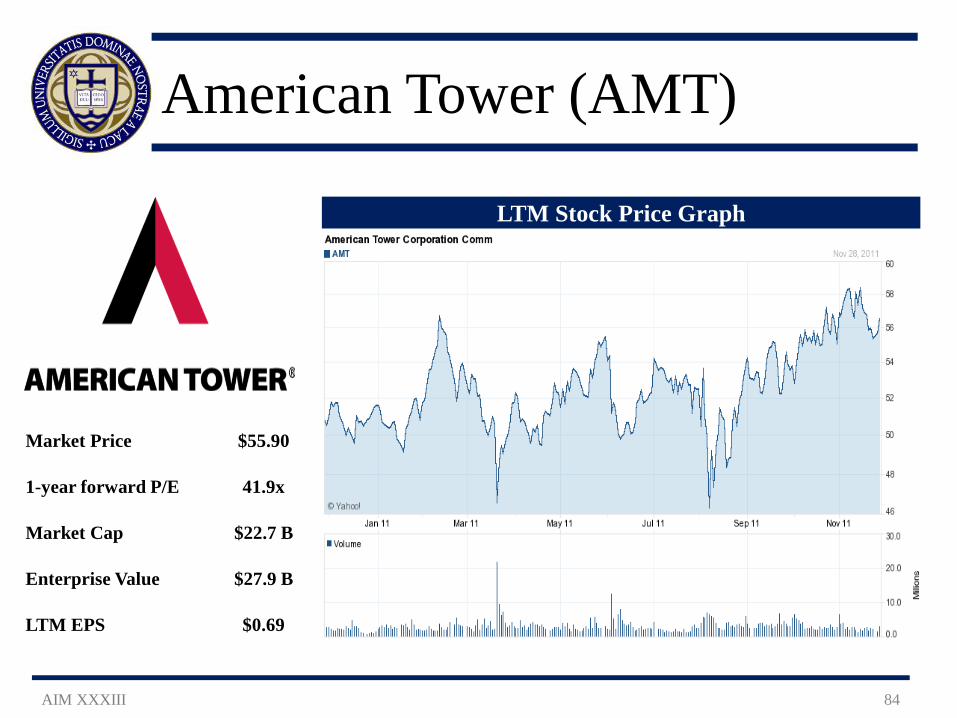
American Tower (AMT)
AIM XXXIII 84
Market Price $55.90
1-year forward P/E 41.9x
Market Cap $22.7 B
Enterprise Value $27.9 B
LTM EPS $0.69
LTM Stock Price Graph
Company Background
AIM XXXIII 85
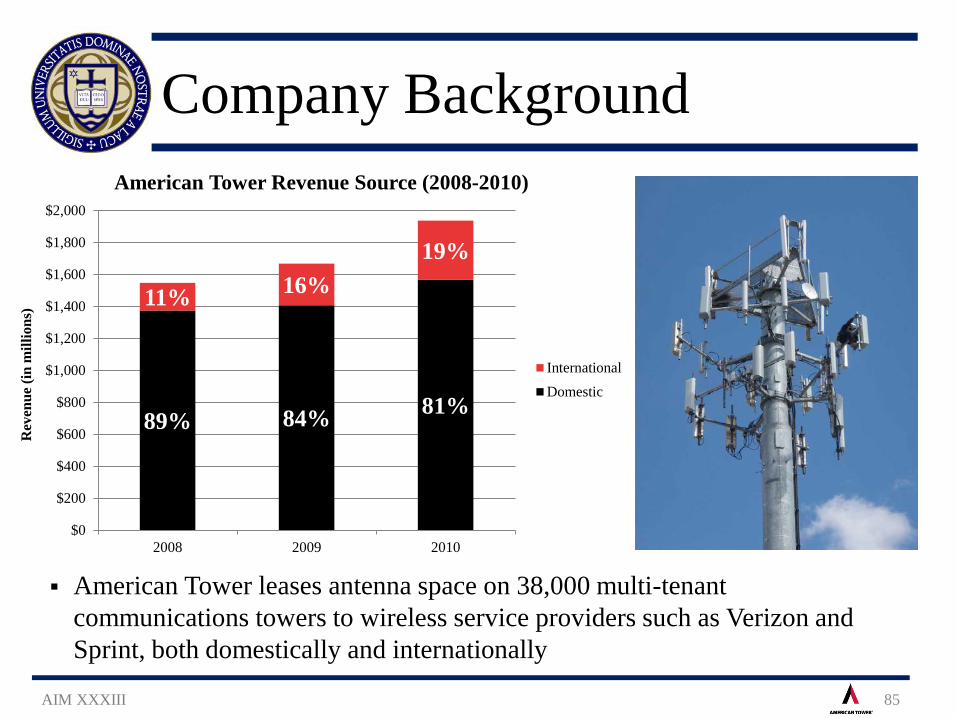
American Tower leases antenna space on 38,000 multi-tenant communications towers to wireless service providers such as Verizon and Sprint, both domestically and internationally
89% 84% 81%
11% 16% 19%
$0
$200
$400
$600
$800
$1,000
$1,200
$1,400
$1,600
$1,800
$2,000
2008 2009 2010
Rev
enue
(in
mill
ions
)
American Tower Revenue Source (2008-2010)
InternationalDomestic
Company Background
AIM XXXIII 86
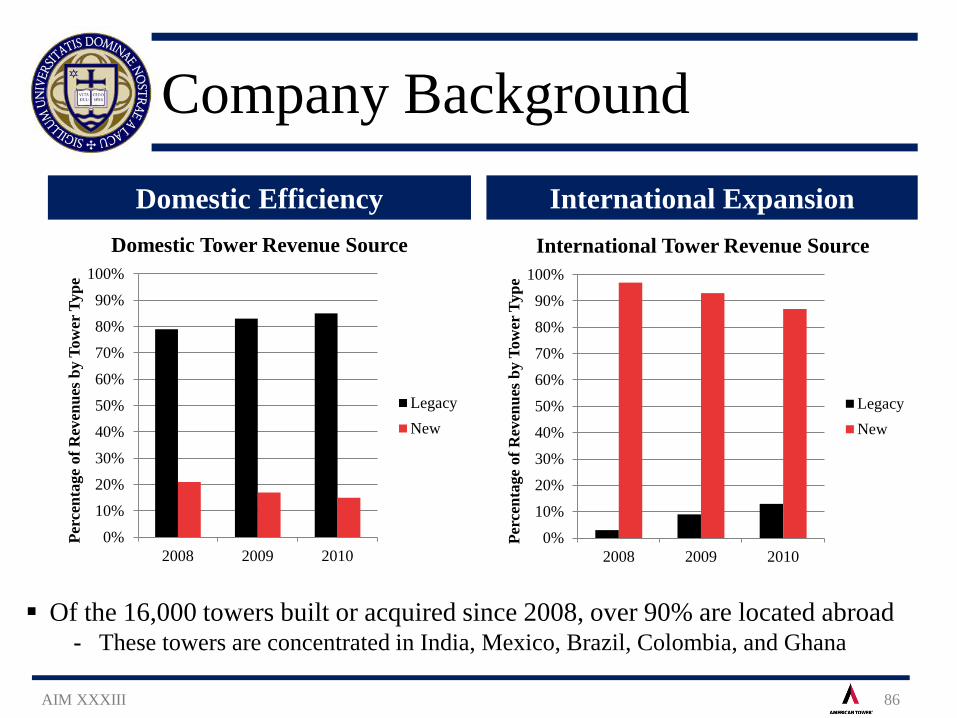
Domestic Efficiency International Expansion
Of the 16,000 towers built or acquired since 2008, over 90% are located abroad - These towers are concentrated in India, Mexico, Brazil, Colombia, and Ghana
0%
10%
20%
30%
40%
50%
60%
70%
80%
90%
100%
2008 2009 2010
Perc
enta
ge o
f Rev
enue
s by
Tow
er T
ype
Domestic Tower Revenue Source
LegacyNew
0%
10%
20%
30%
40%
50%
60%
70%
80%
90%
100%
2008 2009 2010
Perc
enta
ge o
f Rev
enue
s by
Tow
er T
ype
International Tower Revenue Source
LegacyNew
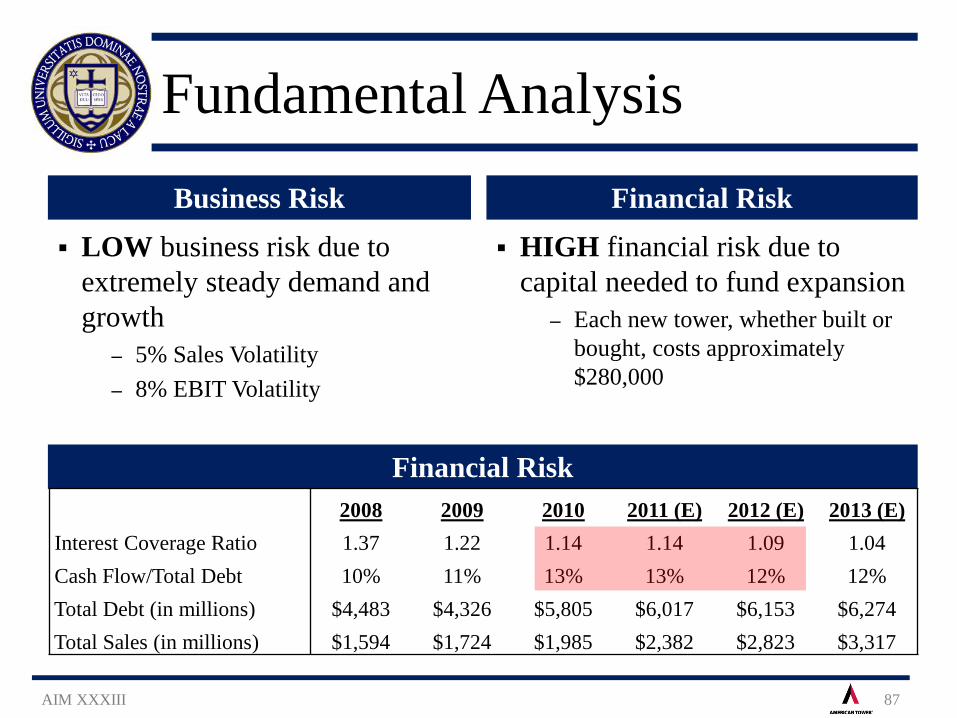
Fundamental Analysis Business Risk
LOW business risk due to extremely steady demand and growth
‒ 5% Sales Volatility ‒ 8% EBIT Volatility
Financial Risk
HIGH financial risk due to capital needed to fund expansion
‒ Each new tower, whether built or bought, costs approximately $280,000
87 AIM XXXIII
Financial Risk 2008 2009 2010 2011 (E) 2012 (E) 2013 (E)
Interest Coverage Ratio 1.37 1.22 1.14 1.14 1.09 1.04 Cash Flow/Total Debt 10% 11% 13% 13% 12% 12% Total Debt (in millions) $4,483 $4,326 $5,805 $6,017 $6,153 $6,274 Total Sales (in millions) $1,594 $1,724 $1,985 $2,382 $2,823 $3,317
AMT Recommendation – Sell
AIM XXXIII 88
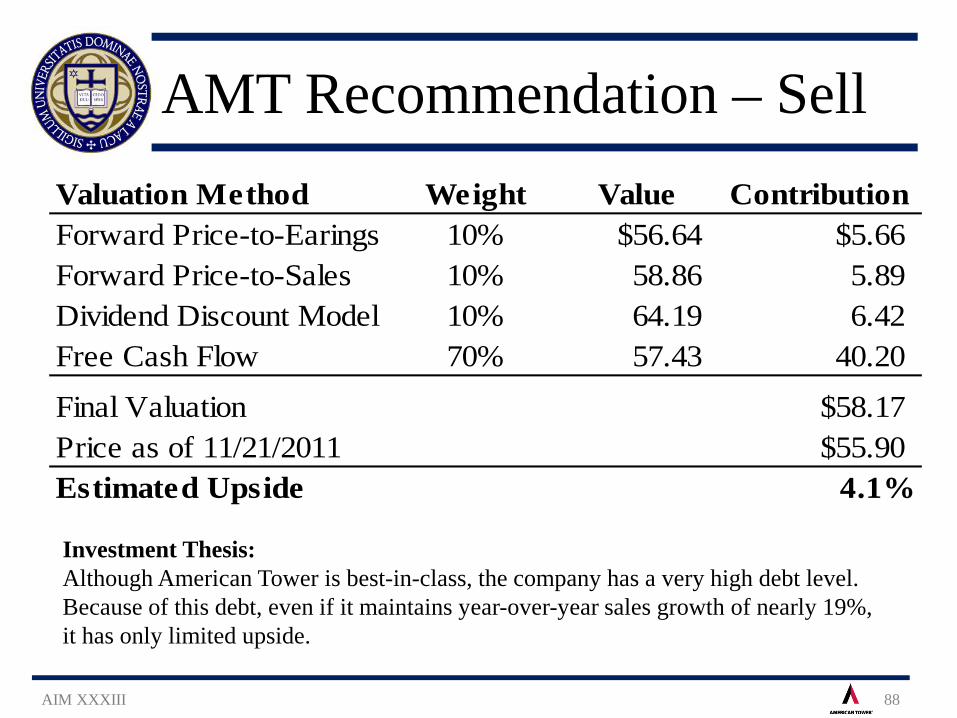
Valuation Method Weight Value ContributionForward Price-to-Earings 10% $56.64 $5.66Forward Price-to-Sales 10% 58.86 5.89Dividend Discount Model 10% 64.19 6.42Free Cash Flow 70% 57.43 40.20
Final Valuation $58.17Price as of 11/21/2011 $55.90Estimated Upside 4.1%
Investment Thesis: Although American Tower is best-in-class, the company has a very high debt level. Because of this debt, even if it maintains year-over-year sales growth of nearly 19%, it has only limited upside.
Activision Blizzard (ATVI)
AIM XXXIII 89
LTM Stock Price Graph
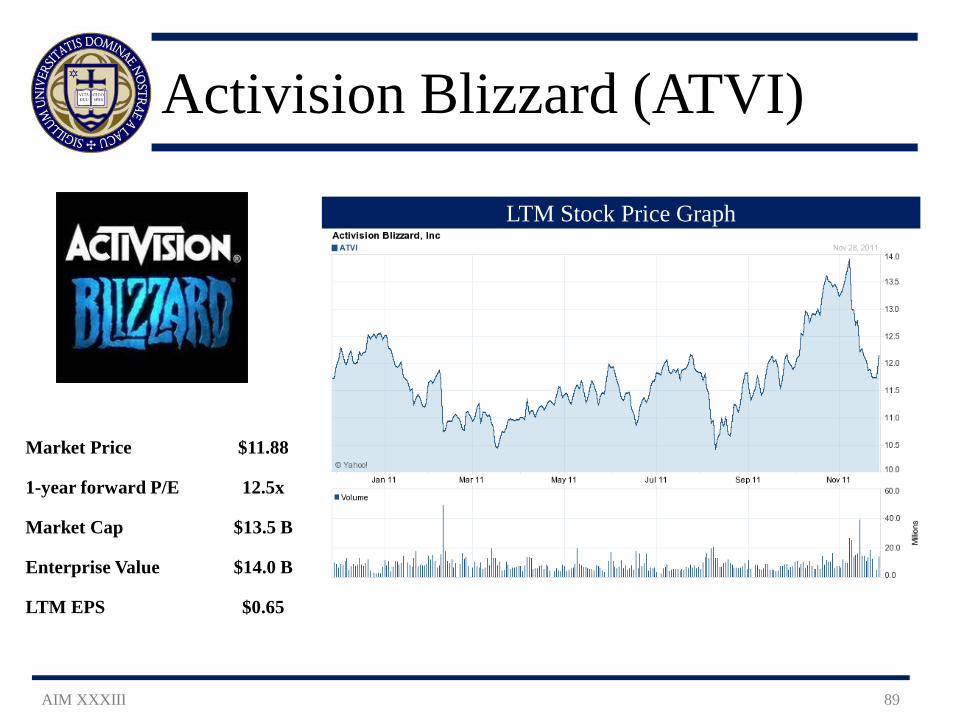
Market Price $11.88
1-year forward P/E 12.5x
Market Cap $13.5 B
Enterprise Value $14.0 B
LTM EPS $0.65
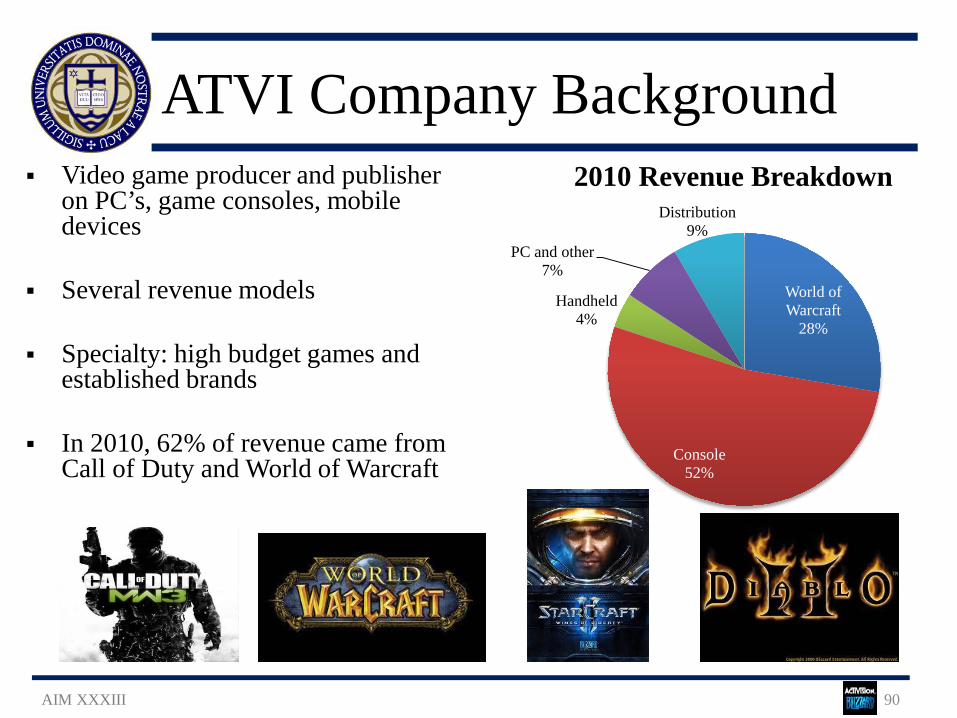
ATVI Company Background Video game producer and publisher
on PC’s, game consoles, mobile devices
Several revenue models
Specialty: high budget games and established brands
In 2010, 62% of revenue came from Call of Duty and World of Warcraft
World of Warcraft
28%
Console 52%
Handheld 4%
PC and other 7%
Distribution 9%
2010 Revenue Breakdown
AIM XXXIII 90
Revenue Assumptions for EPS Forecast
AIM XXXIII 91
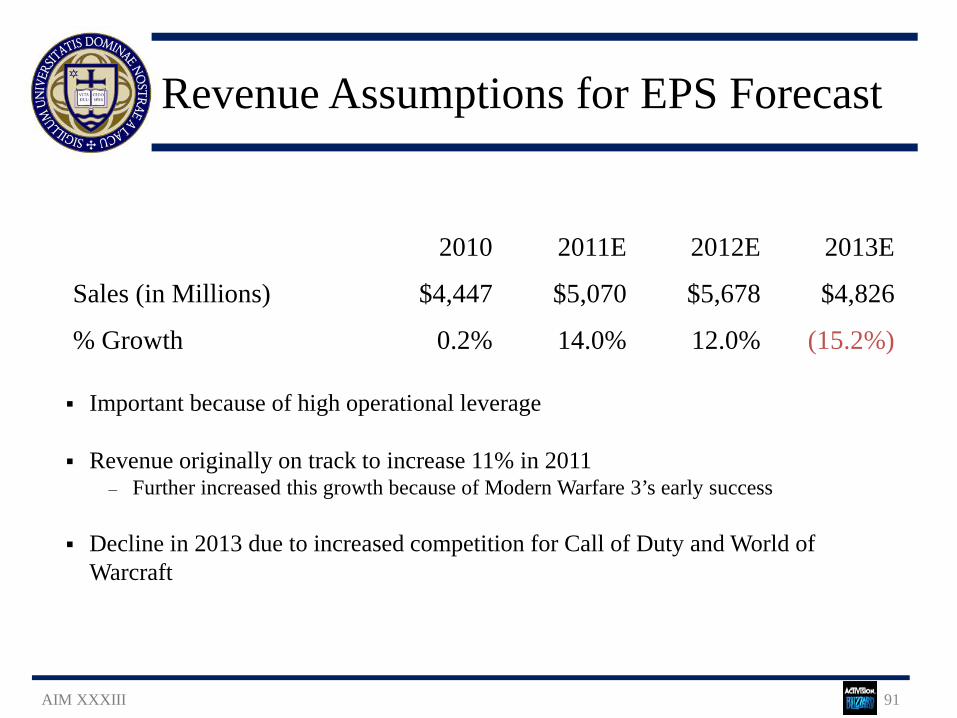
Important because of high operational leverage
Revenue originally on track to increase 11% in 2011 ‒ Further increased this growth because of Modern Warfare 3’s early success
Decline in 2013 due to increased competition for Call of Duty and World of
Warcraft
2010 2011E 2012E 2013E
Sales (in Millions) $4,447 $5,070 $5,678 $4,826
% Growth 0.2% 14.0% 12.0% (15.2%)
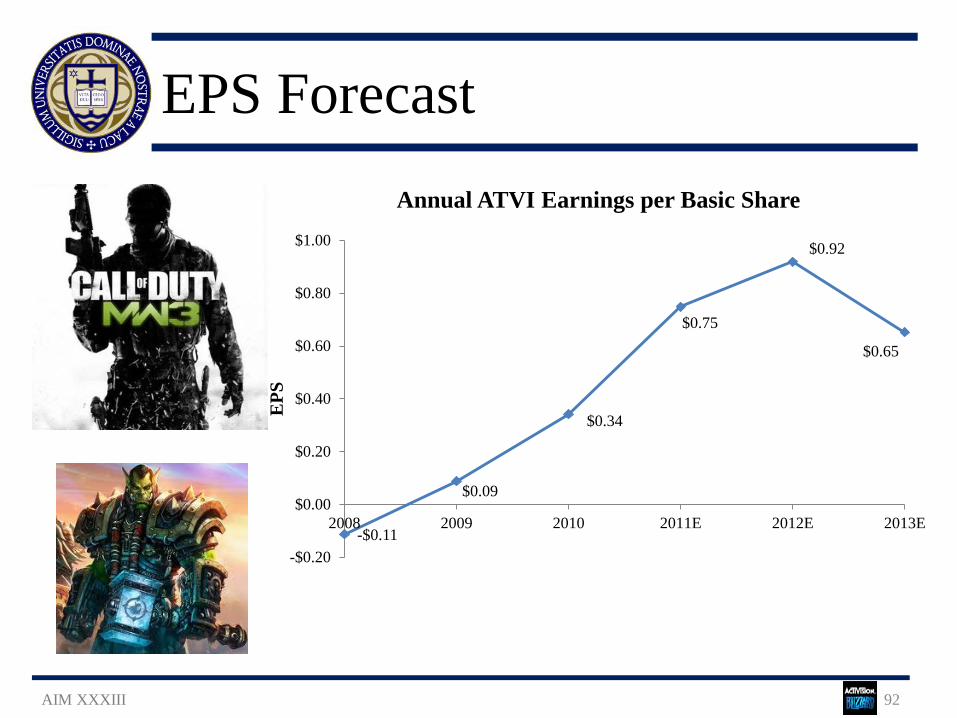
EPS Forecast
AIM XXXIII 92
-$0.11
$0.09
$0.34
$0.75
$0.92
$0.65
-$0.20
$0.00
$0.20
$0.40
$0.60
$0.80
$1.00
2008 2009 2010 2011E 2012E 2013E
EPS
Annual ATVI Earnings per Basic Share
ATVI Recommendation – Sell
AIM XXXIII 93
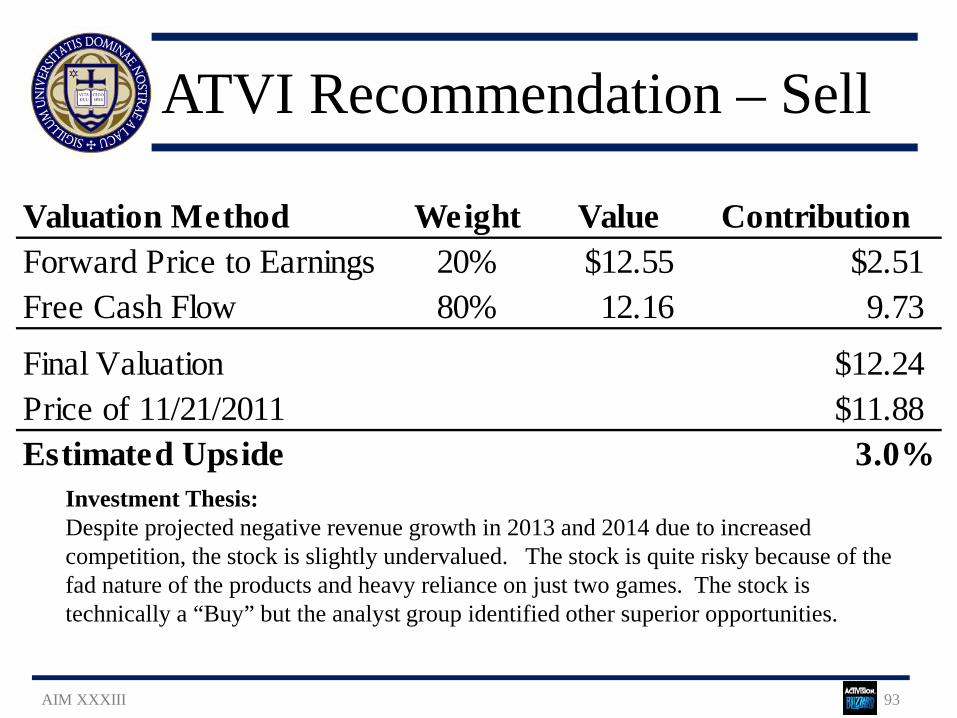
Investment Thesis: Despite projected negative revenue growth in 2013 and 2014 due to increased competition, the stock is slightly undervalued. The stock is quite risky because of the fad nature of the products and heavy reliance on just two games. The stock is technically a “Buy” but the analyst group identified other superior opportunities.
Valuation Method Weight Value ContributionForward Price to Earnings 20% $12.55 $2.51Free Cash Flow 80% 12.16 9.73
Final Valuation $12.24Price of 11/21/2011 $11.88Estimated Upside 3.0%

IV. Portfolio Performance
AIM XXXIII 94
Portfolio Performance Agenda
AIM XXXIII 95
Historical Returns
Performance Measures
Attribution Analysis
Top & Bottom 5 Performers
Portfolio Transactions
Final Portfolio Discussion
$0
$50
$100
$150
$200
$250
$300
$350
$400
$450
$500
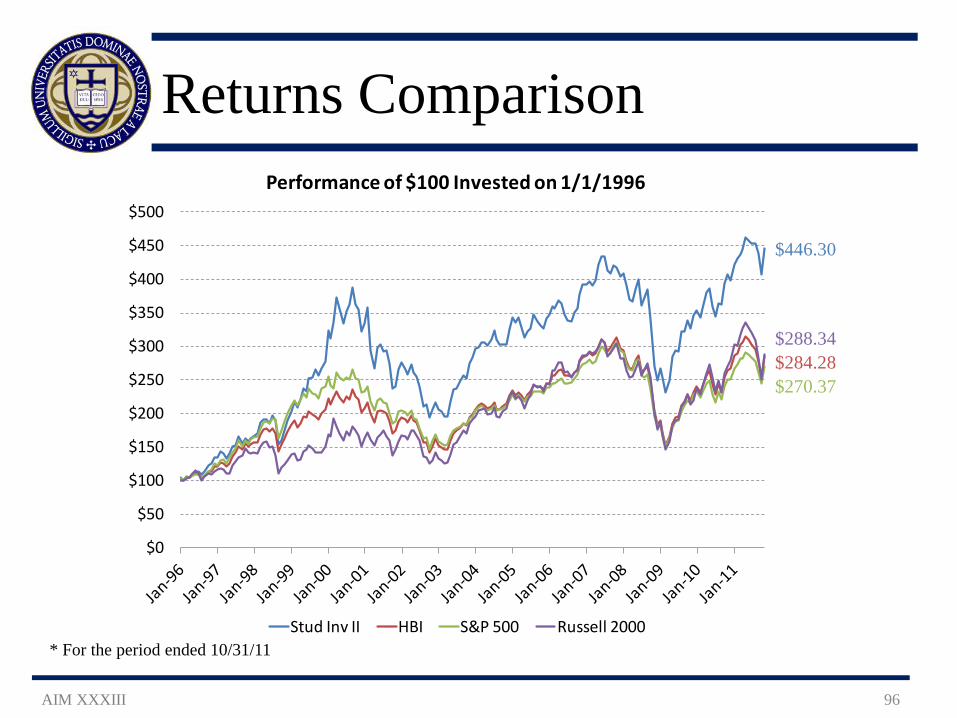
Performance of $100 Invested on 1/1/1996
Stud Inv II HBI S&P 500 Russell 2000
Returns Comparison
$446.30
$288.34 $284.28 $270.37
* For the period ended 10/31/11
AIM XXXIII 96
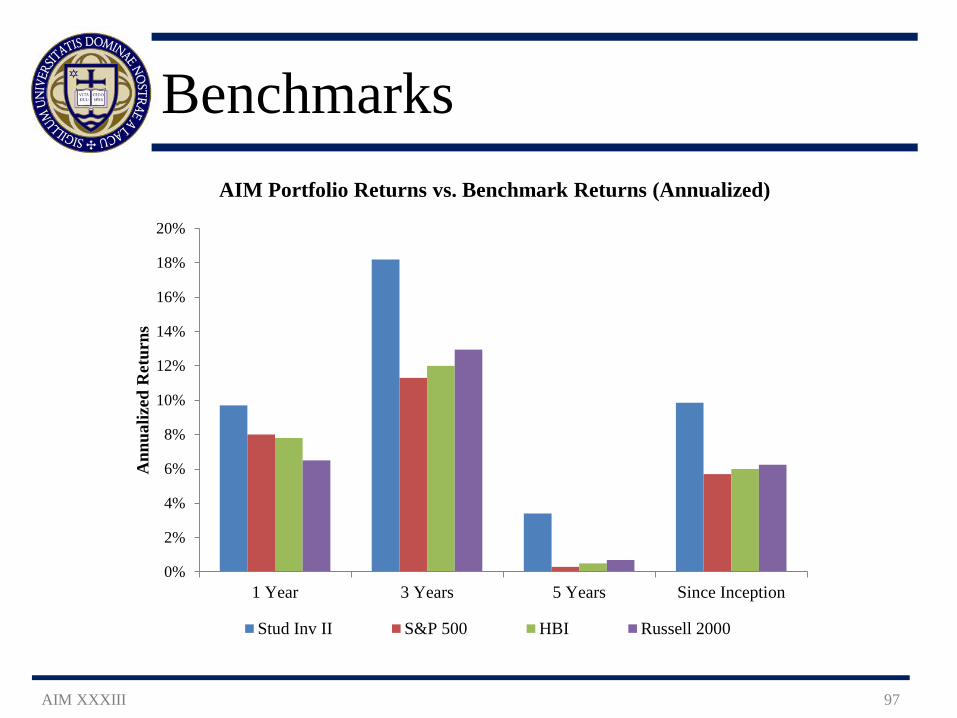
Benchmarks
AIM XXXIII 97
0%
2%
4%
6%
8%
10%
12%
14%
16%
18%
20%
1 Year 3 Years 5 Years Since Inception
Ann
ualiz
ed R
etur
ns
AIM Portfolio Returns vs. Benchmark Returns (Annualized)
Stud Inv II S&P 500 HBI Russell 2000
Sector Allocations (as of 10/31/11)
AIM XXXIII 98
0%
5%
10%
15%
20%
25%
30%
Financials Healthcare ConsumerDisc.
ConsumerStaples
Energy Info. Tech. Materials Telecom &Utilities
Industrials
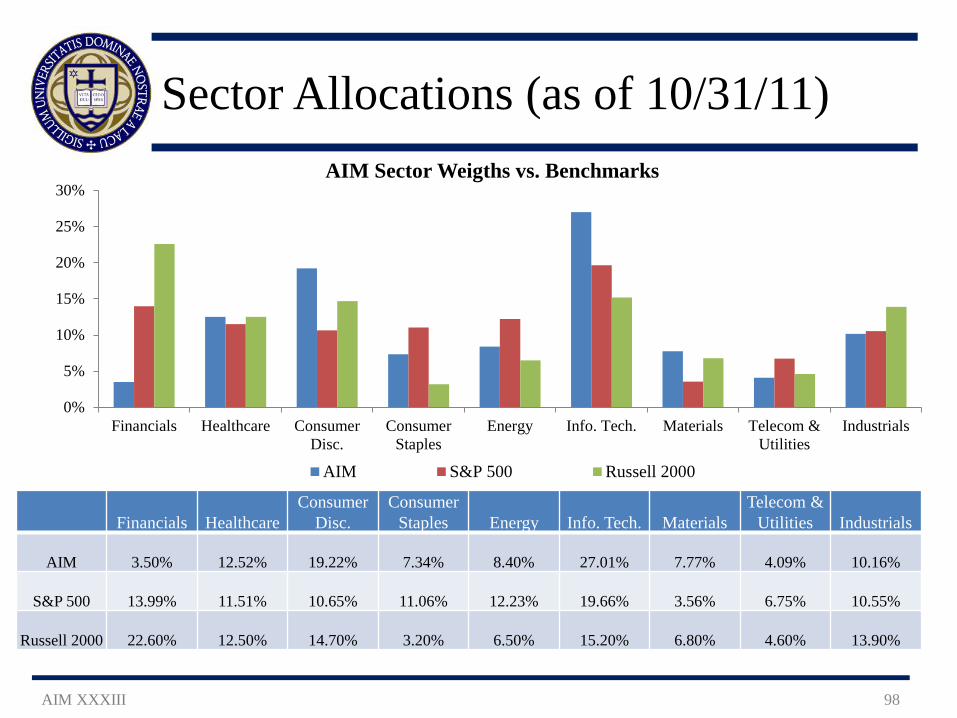
AIM Sector Weigths vs. Benchmarks
AIM S&P 500 Russell 2000
Financials Healthcare Consumer
Disc. Consumer
Staples Energy Info. Tech. Materials Telecom &
Utilities Industrials
AIM 3.50% 12.52% 19.22% 7.34% 8.40% 27.01% 7.77% 4.09% 10.16%
S&P 500 13.99% 11.51% 10.65% 11.06% 12.23% 19.66% 3.56% 6.75% 10.55%
Russell 2000 22.60% 12.50% 14.70% 3.20% 6.50% 15.20% 6.80% 4.60% 13.90%
Sharpe Ratio
AIM XXXIII 99
Used to determine whether returns generated by management decisions or additional risk Measured by excess portfolio returns (Rp – rf) per
unit of risk (σp) Greater management efficacy with higher ratio Formula:
Portfolio Return – Risk Free Rate Portfolio Standard Deviation
Sharpe Ratio (as of 10/31/2011)
AIM XXXIII 100
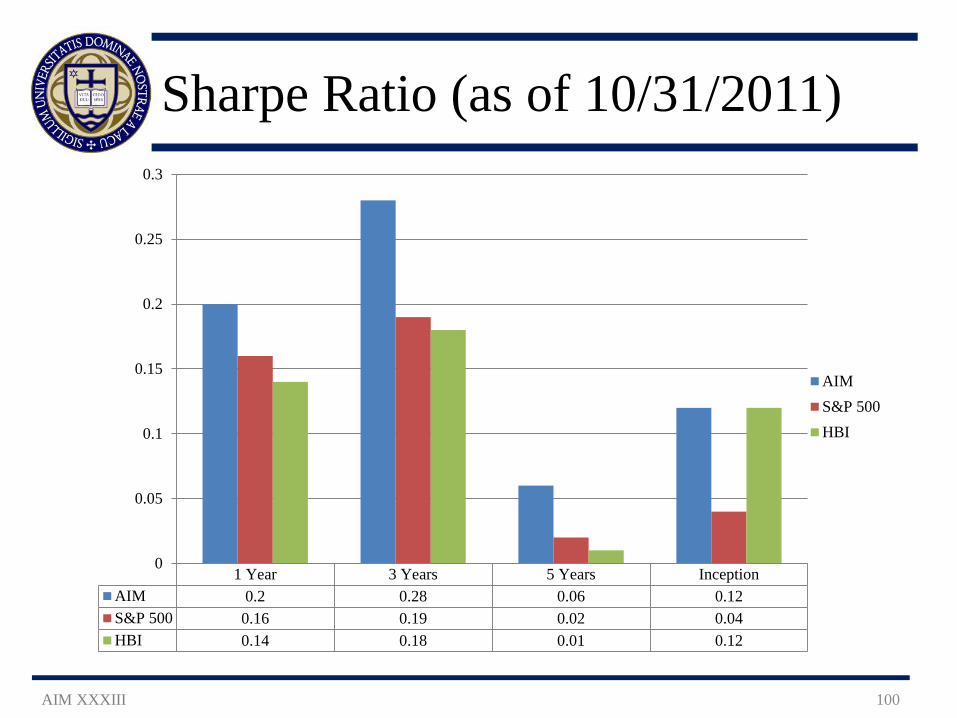
1 Year 3 Years 5 Years InceptionAIM 0.2 0.28 0.06 0.12S&P 500 0.16 0.19 0.02 0.04HBI 0.14 0.18 0.01 0.12
0
0.05
0.1
0.15
0.2
0.25
0.3
AIMS&P 500HBI
Jensen’s Alpha
AIM XXXIII 101
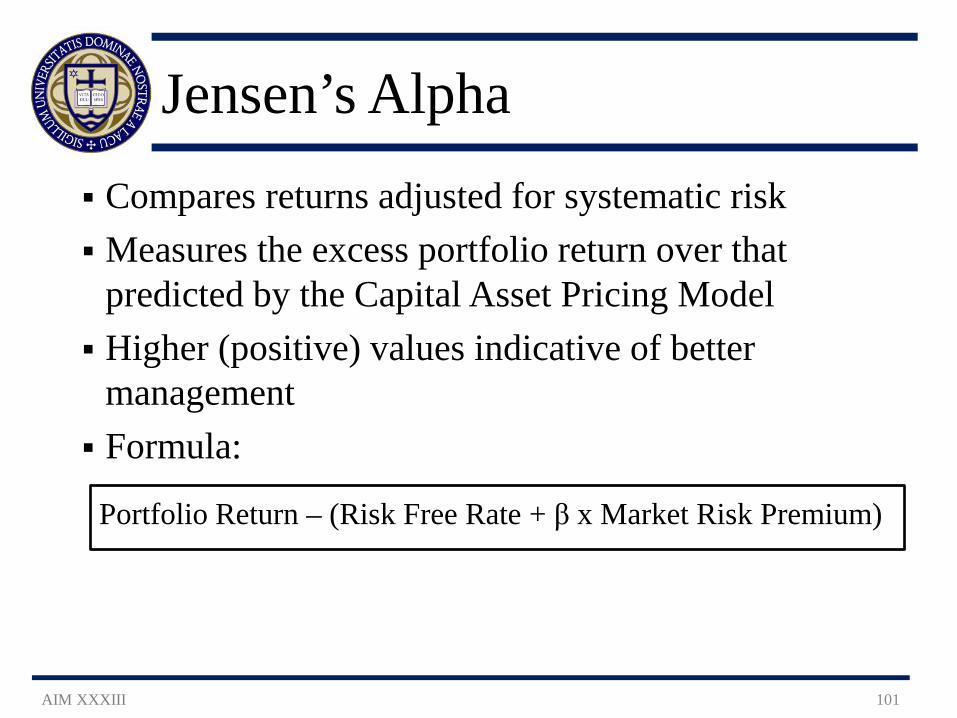
Compares returns adjusted for systematic risk Measures the excess portfolio return over that
predicted by the Capital Asset Pricing Model Higher (positive) values indicative of better
management Formula:
Portfolio Return – (Risk Free Rate + β x Market Risk Premium)
Jensen’s Alpha (as of 10/31/2011)
AIM XXXIII 102
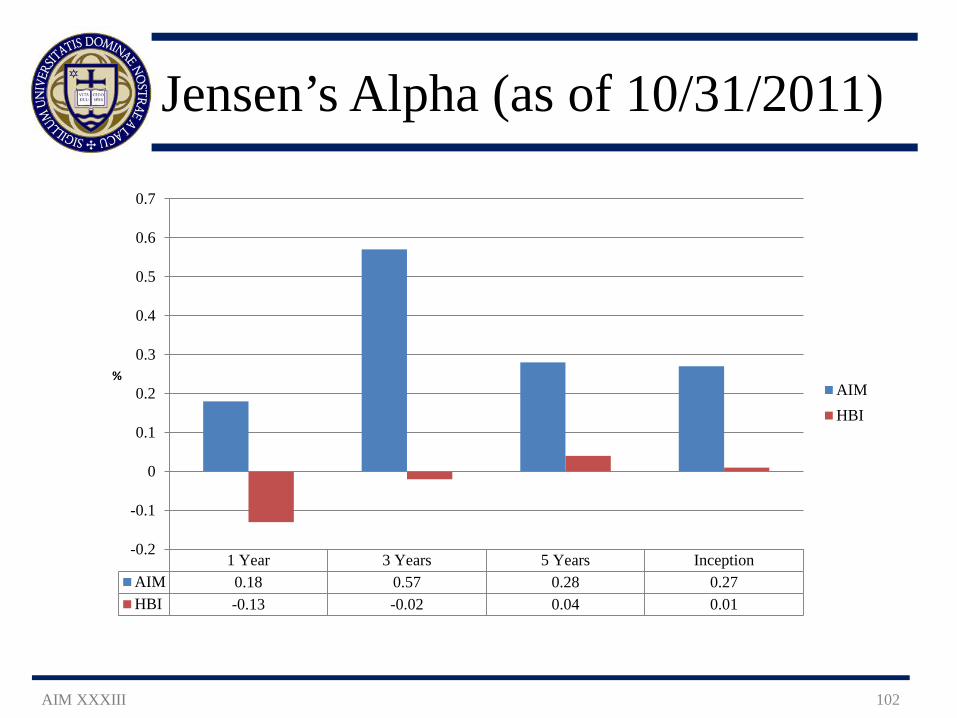
1 Year 3 Years 5 Years InceptionAIM 0.18 0.57 0.28 0.27HBI -0.13 -0.02 0.04 0.01
-0.2
-0.1
0
0.1
0.2
0.3
0.4
0.5
0.6
0.7
% AIM
HBI
Attribution Analysis
AIM XXXIII 103
Attribution Analysis %
Ove
r per
form
ance
AIM XXXIII
104
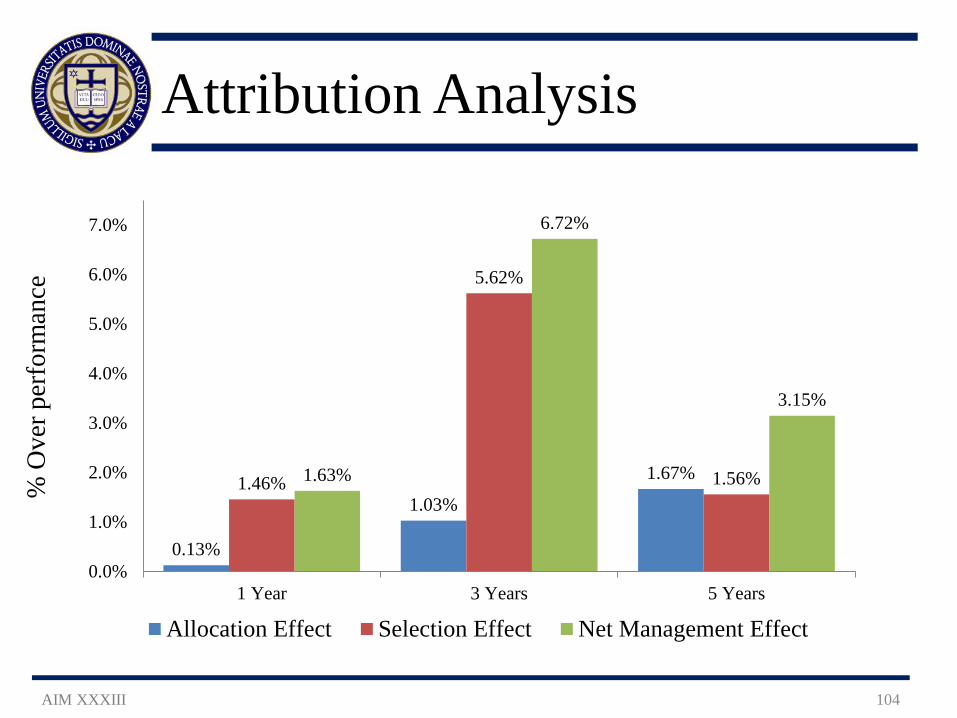
0.13%
1.03%
1.67% 1.46%
5.62%
1.56% 1.63%
6.72%
3.15%
0.0%
1.0%
2.0%
3.0%
4.0%
5.0%
6.0%
7.0%
1 Year 3 Years 5 Years
Allocation Effect Selection Effect Net Management Effect
Attribution Analysis
AIM XXXIII
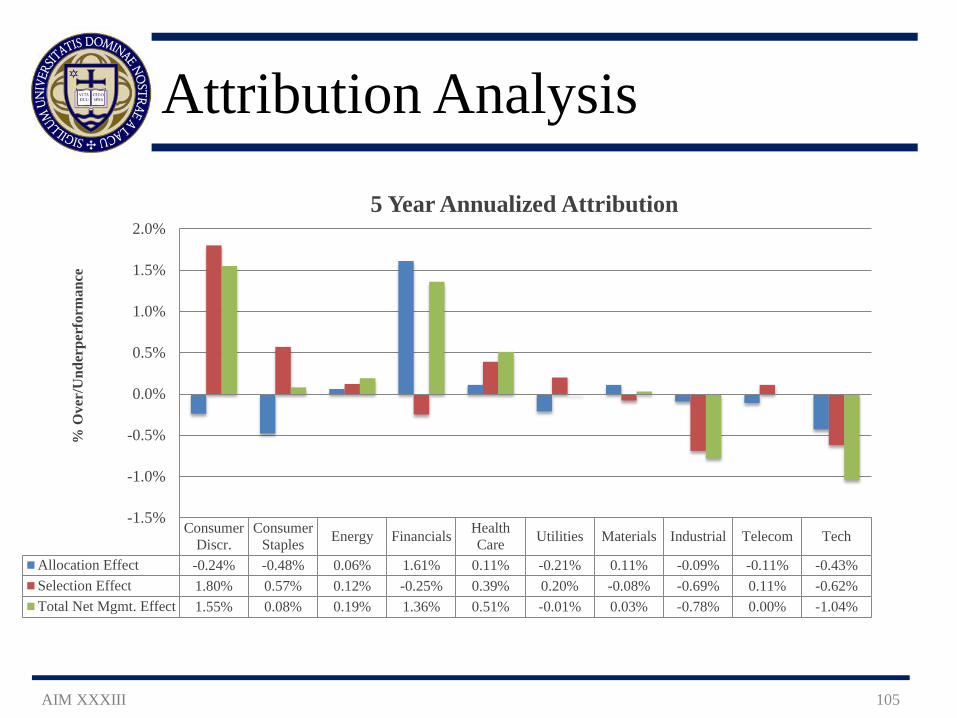
105
ConsumerDiscr.
ConsumerStaples Energy Financials Health
Care Utilities Materials Industrial Telecom Tech
Allocation Effect -0.24% -0.48% 0.06% 1.61% 0.11% -0.21% 0.11% -0.09% -0.11% -0.43%Selection Effect 1.80% 0.57% 0.12% -0.25% 0.39% 0.20% -0.08% -0.69% 0.11% -0.62%Total Net Mgmt. Effect 1.55% 0.08% 0.19% 1.36% 0.51% -0.01% 0.03% -0.78% 0.00% -1.04%
-1.5%
-1.0%
-0.5%
0.0%
0.5%
1.0%
1.5%
2.0%
% O
ver/
Und
erpe
rfor
man
ce
5 Year Annualized Attribution
Attribution Analysis
AIM XXXIII
106
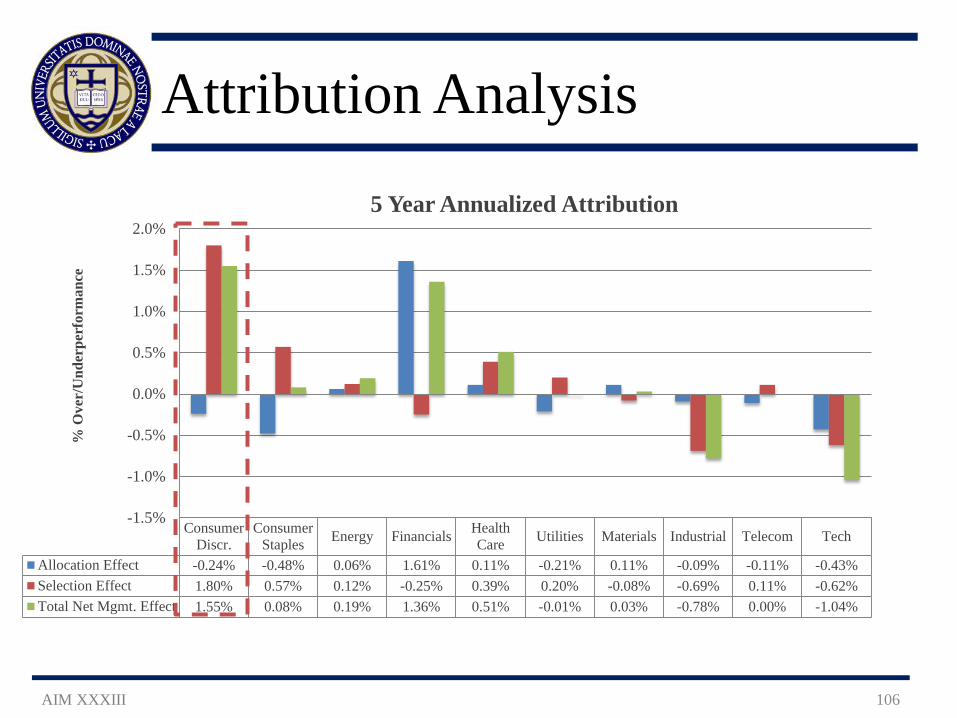
ConsumerDiscr.
ConsumerStaples Energy Financials Health
Care Utilities Materials Industrial Telecom Tech
Allocation Effect -0.24% -0.48% 0.06% 1.61% 0.11% -0.21% 0.11% -0.09% -0.11% -0.43%Selection Effect 1.80% 0.57% 0.12% -0.25% 0.39% 0.20% -0.08% -0.69% 0.11% -0.62%Total Net Mgmt. Effect 1.55% 0.08% 0.19% 1.36% 0.51% -0.01% 0.03% -0.78% 0.00% -1.04%
-1.5%
-1.0%
-0.5%
0.0%
0.5%
1.0%
1.5%
2.0%
% O
ver/
Und
erpe
rfor
man
ce
5 Year Annualized Attribution
Attribution Analysis
AIM XXXIII
107
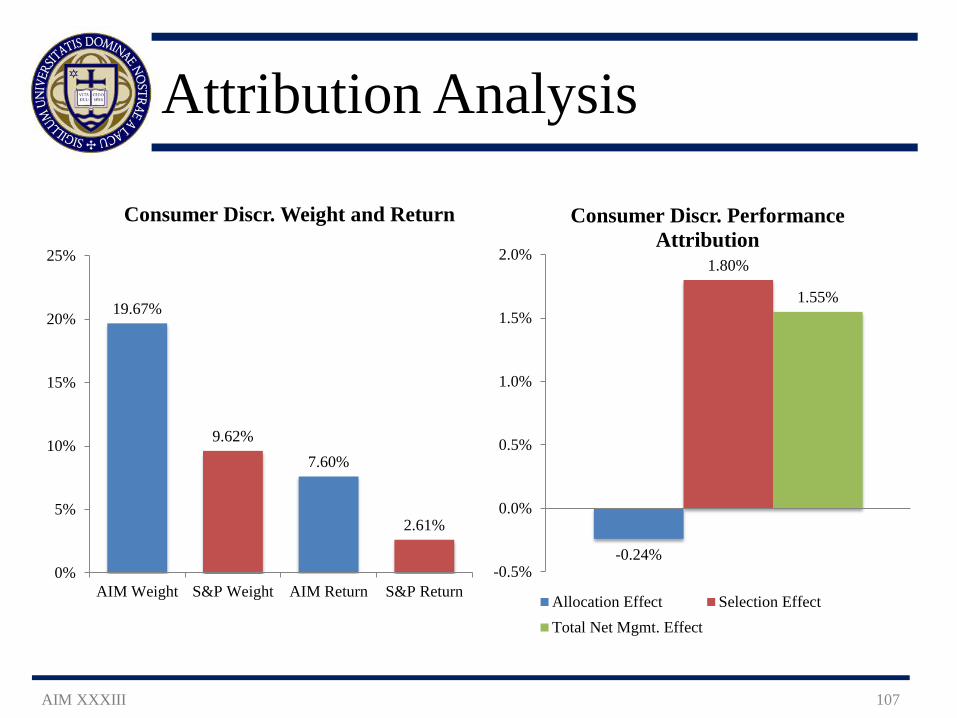
19.67%
9.62% 7.60%
2.61%
0%
5%
10%
15%
20%
25%
AIM Weight S&P Weight AIM Return S&P Return
Consumer Discr. Weight and Return
-0.24%
1.80%
1.55%
-0.5%
0.0%
0.5%
1.0%
1.5%
2.0%
Consumer Discr. Performance Attribution
Allocation Effect Selection EffectTotal Net Mgmt. Effect
Attribution Analysis
AIM XXXIII
108
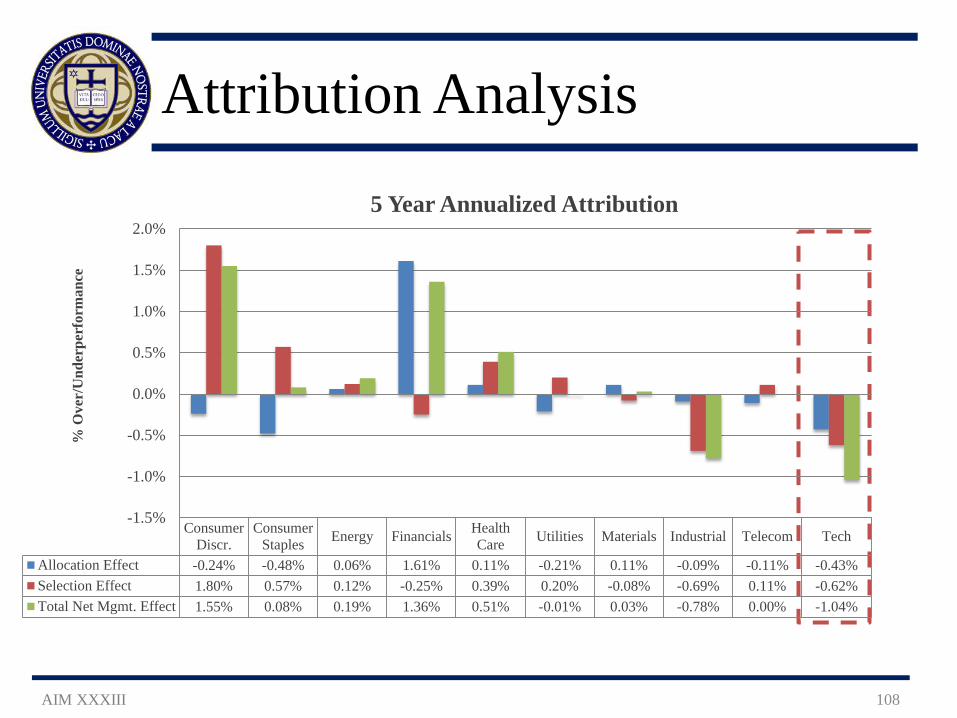
ConsumerDiscr.
ConsumerStaples Energy Financials Health
Care Utilities Materials Industrial Telecom Tech
Allocation Effect -0.24% -0.48% 0.06% 1.61% 0.11% -0.21% 0.11% -0.09% -0.11% -0.43%Selection Effect 1.80% 0.57% 0.12% -0.25% 0.39% 0.20% -0.08% -0.69% 0.11% -0.62%Total Net Mgmt. Effect 1.55% 0.08% 0.19% 1.36% 0.51% -0.01% 0.03% -0.78% 0.00% -1.04%
-1.5%
-1.0%
-0.5%
0.0%
0.5%
1.0%
1.5%
2.0%
% O
ver/
Und
erpe
rfor
man
ce
5 Year Annualized Attribution
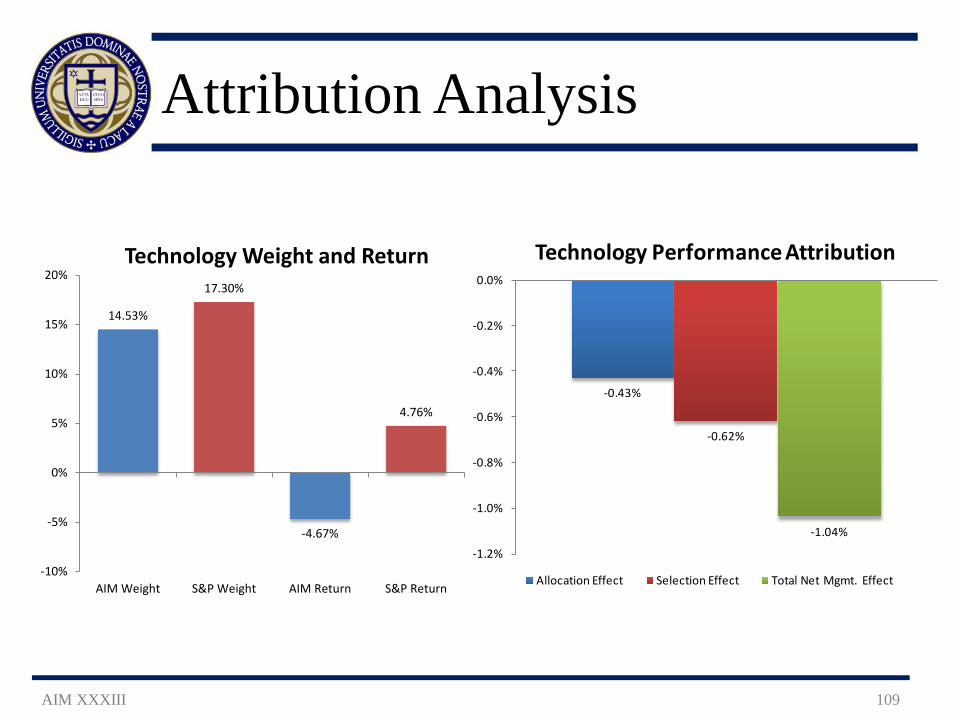
Attribution Analysis
AIM XXXIII
109
14.53%
17.30%
-4.67%
4.76%
-10%
-5%
0%
5%
10%
15%
20%
AIM Weight S&P Weight AIM Return S&P Return
Technology Weight and Return
-0.43%
-0.62%
-1.04%
-1.2%
-1.0%
-0.8%
-0.6%
-0.4%
-0.2%
0.0%
Technology Performance Attribution
Allocation Effect Selection Effect Total Net Mgmt. Effect
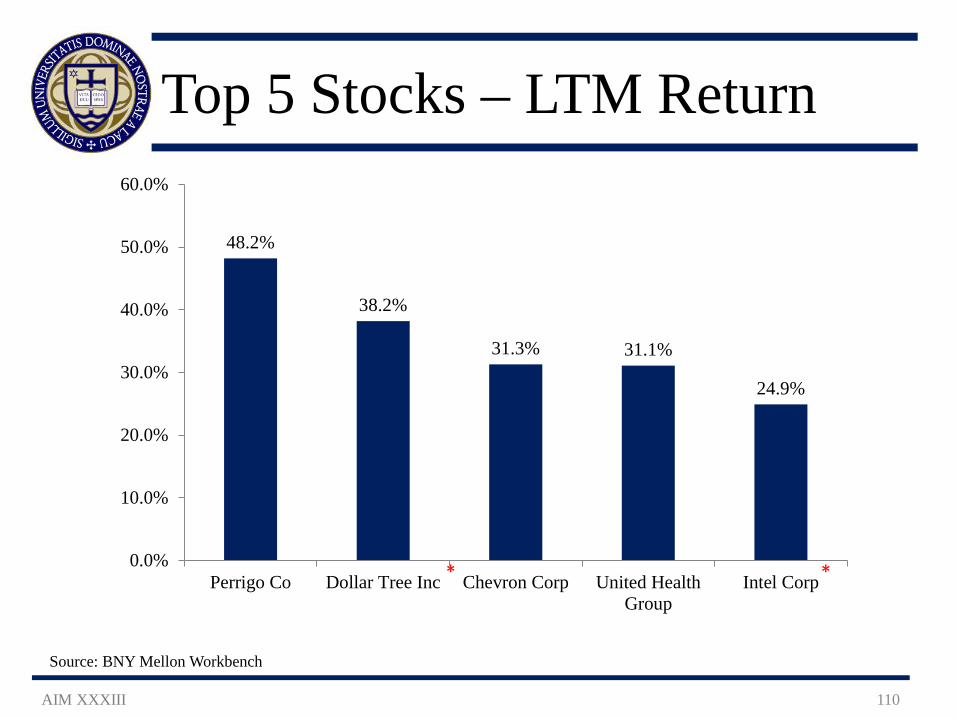
Top 5 Stocks – LTM Return
AIM XXXIII 110
Source: BNY Mellon Workbench
48.2%
38.2%
31.3% 31.1%
24.9%
0.0%
10.0%
20.0%
30.0%
40.0%
50.0%
60.0%
Perrigo Co Dollar Tree Inc Chevron Corp United HealthGroup
Intel Corp* *
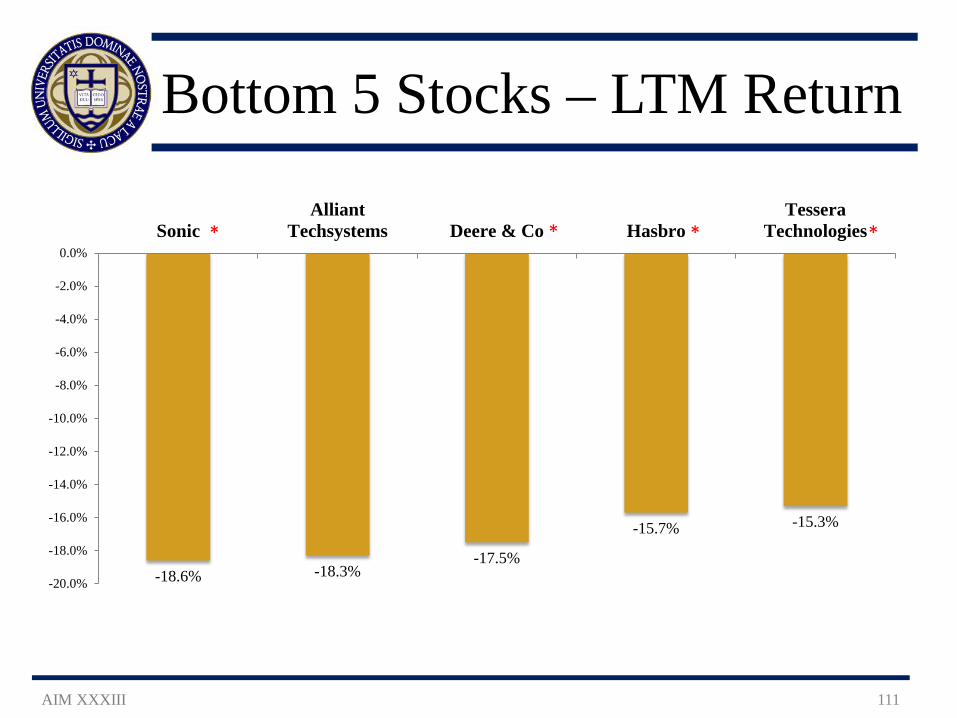
Bottom 5 Stocks – LTM Return
AIM XXXIII 111
-18.6% -18.3% -17.5%
-15.7% -15.3%
-20.0%
-18.0%
-16.0%
-14.0%
-12.0%
-10.0%
-8.0%
-6.0%
-4.0%
-2.0%
0.0%Sonic
AlliantTechsystems Deere & Co Hasbro
TesseraTechnologies* * * *
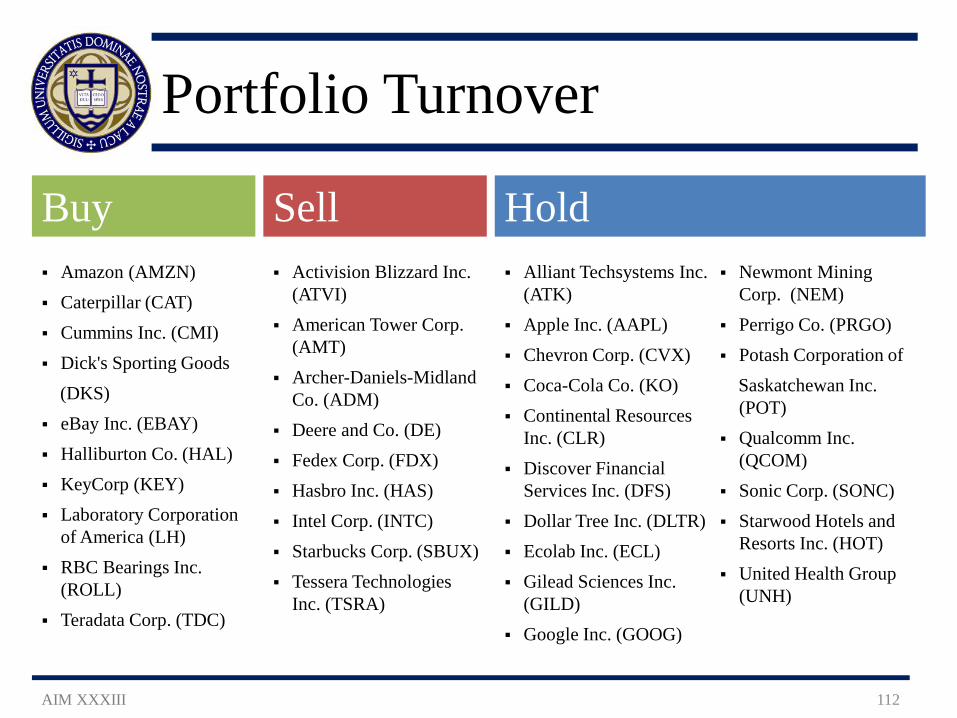
Portfolio Turnover
AIM XXXIII 112
Buy Sell Hold Amazon (AMZN) Caterpillar (CAT) Cummins Inc. (CMI) Dick's Sporting Goods (DKS) eBay Inc. (EBAY) Halliburton Co. (HAL) KeyCorp (KEY) Laboratory Corporation
of America (LH) RBC Bearings Inc.
(ROLL) Teradata Corp. (TDC)
Activision Blizzard Inc. (ATVI)
American Tower Corp. (AMT)
Archer-Daniels-Midland Co. (ADM)
Deere and Co. (DE) Fedex Corp. (FDX) Hasbro Inc. (HAS) Intel Corp. (INTC) Starbucks Corp. (SBUX) Tessera Technologies
Inc. (TSRA)
Alliant Techsystems Inc. (ATK)
Apple Inc. (AAPL) Chevron Corp. (CVX) Coca-Cola Co. (KO) Continental Resources
Inc. (CLR) Discover Financial
Services Inc. (DFS) Dollar Tree Inc. (DLTR) Ecolab Inc. (ECL) Gilead Sciences Inc.
(GILD) Google Inc. (GOOG)
Newmont Mining Corp. (NEM)
Perrigo Co. (PRGO) Potash Corporation of Saskatchewan Inc.
(POT) Qualcomm Inc.
(QCOM) Sonic Corp. (SONC) Starwood Hotels and
Resorts Inc. (HOT) United Health Group
(UNH)
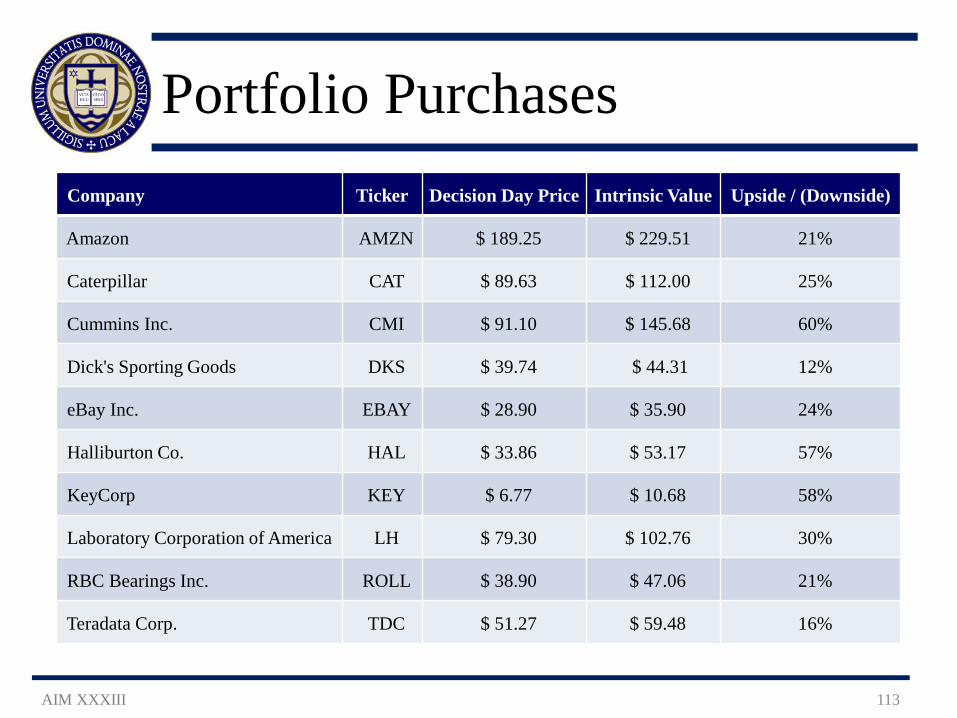
Portfolio Purchases Company Ticker Decision Day Price Intrinsic Value Upside / (Downside)
Amazon AMZN $ 189.25 $ 229.51 21%
Caterpillar CAT $ 89.63 $ 112.00 25%
Cummins Inc. CMI $ 91.10 $ 145.68 60%
Dick's Sporting Goods DKS $ 39.74 $ 44.31 12%
eBay Inc. EBAY $ 28.90 $ 35.90 24%
Halliburton Co. HAL $ 33.86 $ 53.17 57%
KeyCorp KEY $ 6.77 $ 10.68 58%
Laboratory Corporation of America LH $ 79.30 $ 102.76 30%
RBC Bearings Inc. ROLL $ 38.90 $ 47.06 21%
Teradata Corp. TDC $ 51.27 $ 59.48 16%
AIM XXXIII 113
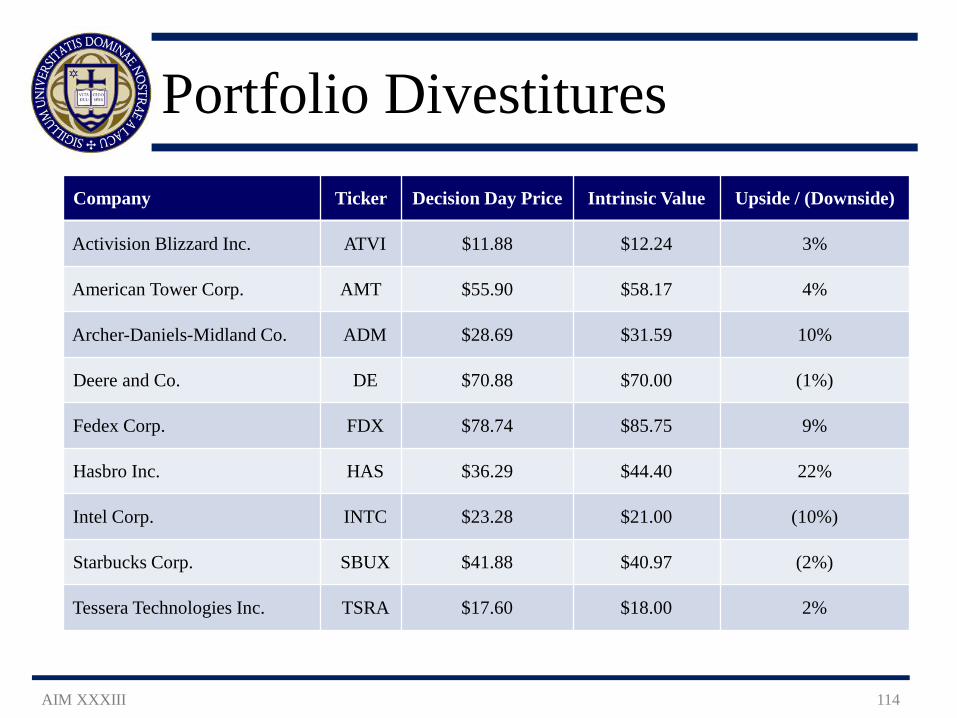
Portfolio Divestitures
AIM XXXIII 114
Company Ticker Decision Day Price Intrinsic Value Upside / (Downside)
Activision Blizzard Inc. ATVI $11.88 $12.24 3%
American Tower Corp. AMT $55.90 $58.17 4%
Archer-Daniels-Midland Co. ADM $28.69 $31.59 10%
Deere and Co. DE $70.88 $70.00 (1%)
Fedex Corp. FDX $78.74 $85.75 9%
Hasbro Inc. HAS $36.29 $44.40 22%
Intel Corp. INTC $23.28 $21.00 (10%)
Starbucks Corp. SBUX $41.88 $40.97 (2%)
Tessera Technologies Inc. TSRA $17.60 $18.00 2%
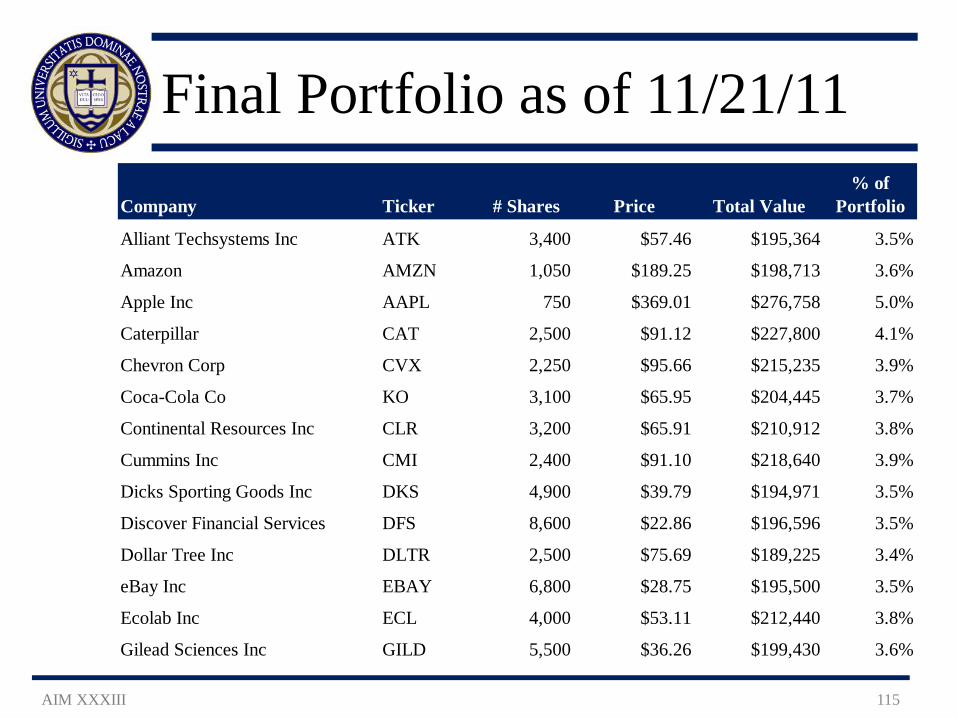
Final Portfolio as of 11/21/11
AIM XXXIII 115
Company Ticker # Shares Price Total Value% of
Portfolio
Alliant Techsystems Inc ATK 3,400 $57.46 $195,364 3.5%
Amazon AMZN 1,050 $189.25 $198,713 3.6%
Apple Inc AAPL 750 $369.01 $276,758 5.0%
Caterpillar CAT 2,500 $91.12 $227,800 4.1%
Chevron Corp CVX 2,250 $95.66 $215,235 3.9%
Coca-Cola Co KO 3,100 $65.95 $204,445 3.7%
Continental Resources Inc CLR 3,200 $65.91 $210,912 3.8%
Cummins Inc CMI 2,400 $91.10 $218,640 3.9%
Dicks Sporting Goods Inc DKS 4,900 $39.79 $194,971 3.5%
Discover Financial Services DFS 8,600 $22.86 $196,596 3.5%
Dollar Tree Inc DLTR 2,500 $75.69 $189,225 3.4%
eBay Inc EBAY 6,800 $28.75 $195,500 3.5%
Ecolab Inc ECL 4,000 $53.11 $212,440 3.8%
Gilead Sciences Inc GILD 5,500 $36.26 $199,430 3.6%
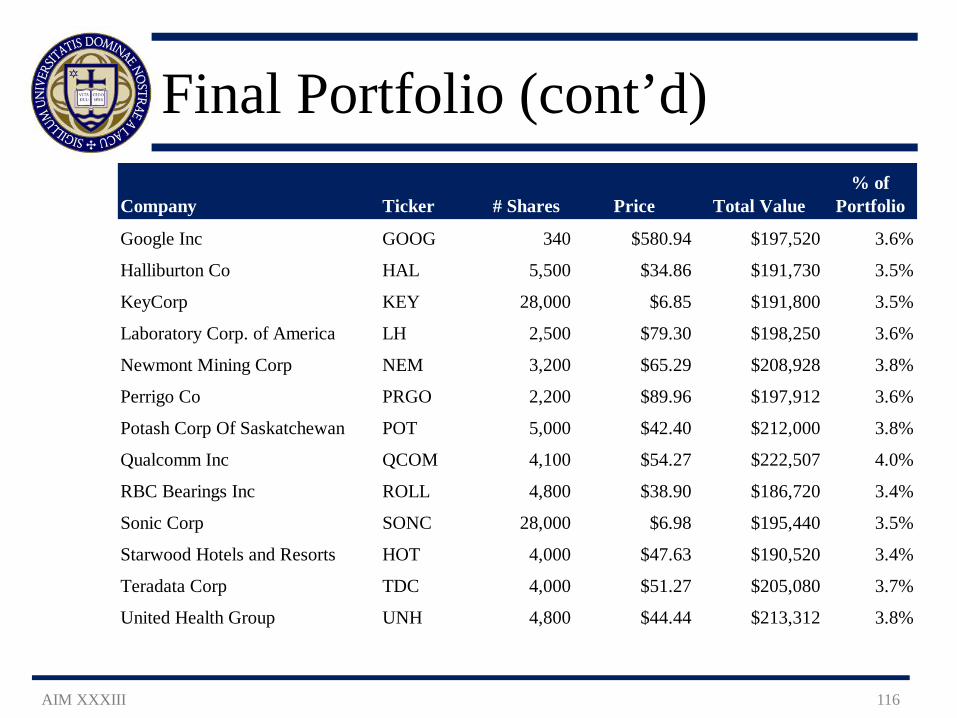
Final Portfolio (cont’d)
AIM XXXIII 116
Company Ticker # Shares Price Total Value% of
Portfolio
Google Inc GOOG 340 $580.94 $197,520 3.6%
Halliburton Co HAL 5,500 $34.86 $191,730 3.5%
KeyCorp KEY 28,000 $6.85 $191,800 3.5%
Laboratory Corp. of America LH 2,500 $79.30 $198,250 3.6%
Newmont Mining Corp NEM 3,200 $65.29 $208,928 3.8%
Perrigo Co PRGO 2,200 $89.96 $197,912 3.6%
Potash Corp Of Saskatchewan POT 5,000 $42.40 $212,000 3.8%
Qualcomm Inc QCOM 4,100 $54.27 $222,507 4.0%
RBC Bearings Inc ROLL 4,800 $38.90 $186,720 3.4%
Sonic Corp SONC 28,000 $6.98 $195,440 3.5%
Starwood Hotels and Resorts HOT 4,000 $47.63 $190,520 3.4%
Teradata Corp TDC 4,000 $51.27 $205,080 3.7%
United Health Group UNH 4,800 $44.44 $213,312 3.8%

Final Portfolio
AIM XXXIII 117
Stock Ticker Weight Market Value Stock Ticker Weight Market ValueAmazon AMZN 3.6% $198,713 Alliant Tech ATK 3.5% $195,364Dick's Sporting Goods DKS 3.5% $194,971 Caterpillar CAT 4.1% $227,800Dollar Tree DLTR 3.4% $189,225 Cummins CMI 3.9% $218,640Sonic Corp SONC 3.5% $195,440 RBC Bearings ROLL 3.4% $186,720Starwood Hotels HOT 3.4% $190,520 Industrials 14.9% $828,524 Consumer Discretionary 17.4% $968,869 (AIM XXXII 10.2%)
(AIM XXXII 19.2%)EcoLab ECL 3.8% $212,440
Coca-Cola KO 3.7% $204,445 Newmont Mining NEM 3.8% $208,928 Consumer Staples 3.7% $204,445 Potash Corp POT 3.8% $212,000
(AIM XXXII 7.3%) Materials 11.4% $633,368(AIM XXXII 10.9%)
Chevron CVX 3.9% $215,235Continental Resources CLR 3.8% $210,912 Apple AAPL 5.0% $276,758Halliburton HAL 3.4% $191,730 eBay EBAY 3.5% $195,500 Energy 11.1% $617,877 Google GOOG 3.5% $197,520
(AIM XXXII 8.4%) Qualcomm QCOM 4.0% $222,507Teradata Corp TDC 3.7% $205,080
Discover DFS 3.5% $196,596 Technology 19.7% $1,097,364KeyCorp KEY 3.4% $191,800 (AIM XXXII 27.0%) Financials 7.0% $388,396
(AIM XXXII 3.5%) Cash and Hedge $20,410Total $5,568,157
Gilead Sciences GILD 3.6% $199,430LabCorp LH 3.6% $198,250Perrigo PRGO 3.6% $197,912United Health Group UNH 3.8% $213,312 Healthcare 14.5% $808,904
(AIM XXXII 12.5%)

V. General Information
AIM XXXIII 118

General Information
Chicago Trip New York City Trip In Class Speakers Newsletter AIM Website
AIM XXXIII 119
Chicago Trip CME
‒ Met with David Lerman, Director of Equity Products ‒ Received a tour of the trading floor
Madison Dearborn Partners ‒ Met with Patrick Eilers, Managing Director (ND Alum ‘89) ‒ Went through an example of an LBO in the wind energy space
UBS ‒ Met with John Leonard, Global Head of Equities, and Laura Lawson, Asset
Allocation Strategist ‒ Had an asset allocation presentation and discussed our stocks with Mr. Leonard
Equity International ‒ Met with Ira Chaplik, Chief Operating Officer, and Chris Fiegen, Chief Portfolio
Officer ‒ Learned about emerging market private equity real estate investing and met Sam
Zell
AIM XXXIII 120
NYC Trip- Business Meetings S-Squared Technology
‒ Hosted by Sy Goldblatt & Kenneth Goldblatt ‒ Topic: Technology equity hedge fund strategy
D.E. Shaw ‒ Hosted by Chris Zaback (ND Alum ‘90) ‒ Topic: Global Asset Management and D.E. Shaw’s
unique approach The Blackstone Group
‒ Hosted by Sean Klimczak (ND Alum ’98) ‒ Topic: Private Equity
BlackRock ‒ Hosted by Jim Keenan (ND Alum ’98) ‒ Topic: Current financial markets
Tegean Capital Management ‒ Hosted by Tom Maheras (ND Alum ’84) ‒ Topic: Value-based hedge fund strategy
AIM XXXIII 121

NYC Trip- Social Events
Dinner & Reception at Hilton New York ‒ Attended by over 50 AIM alumni in the NY area ‒ Discussed careers and AIM experiences
Mass at St. Patrick’s Cathedral Class Dinner at Smith & Wollensky
AIM XXXIII 122

In Class Speakers
Scott Malpass (ND Alum ‘84) – Discussed endowment investing and the strategies of
the Notre Dame Endowment Rick Hans, Vice President of Investor Relations and
Finance, Walgreens Co. (ND Alum ‘87) – Received analyst presentation and discussed Walgreen’s
battle with Express Scripts Jim Parsons, Portfolio Manager, Viking Global
Investors (ND Alum ‘92) – Discussed careers in the hedge fund industry and Mr.
Parson’s views on technology stocks
AIM XXXIII 123

Newsletter
Objective – Alumni News – Portfolio Performance – Economic Outlook
aim.nd.edu
AIM XXXIII 124
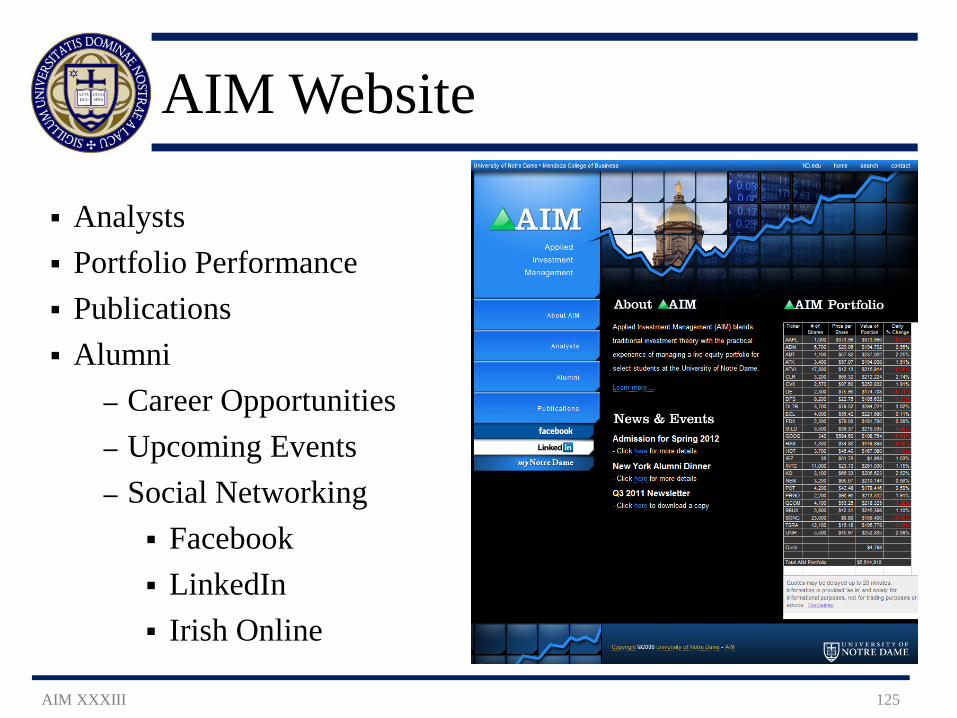
AIM Website
Analysts Portfolio Performance Publications Alumni
– Career Opportunities – Upcoming Events – Social Networking Facebook LinkedIn Irish Online
AIM XXXIII 125
Thank You
We would like to extend a special thank you to: – Professors Langley, Reilly and Trubac for their guidance and
knowledge – Scott Malpass, the Notre Dame Investment Office and the
AIM Advisory Board for the opportunity to participate in such a unique and valuable course
– Rachel Karnafel for administrative support Post – Presentation Agenda
– Food & refreshments – Questions from the AIM analysts for the advisory board
AIM XXXIII 126
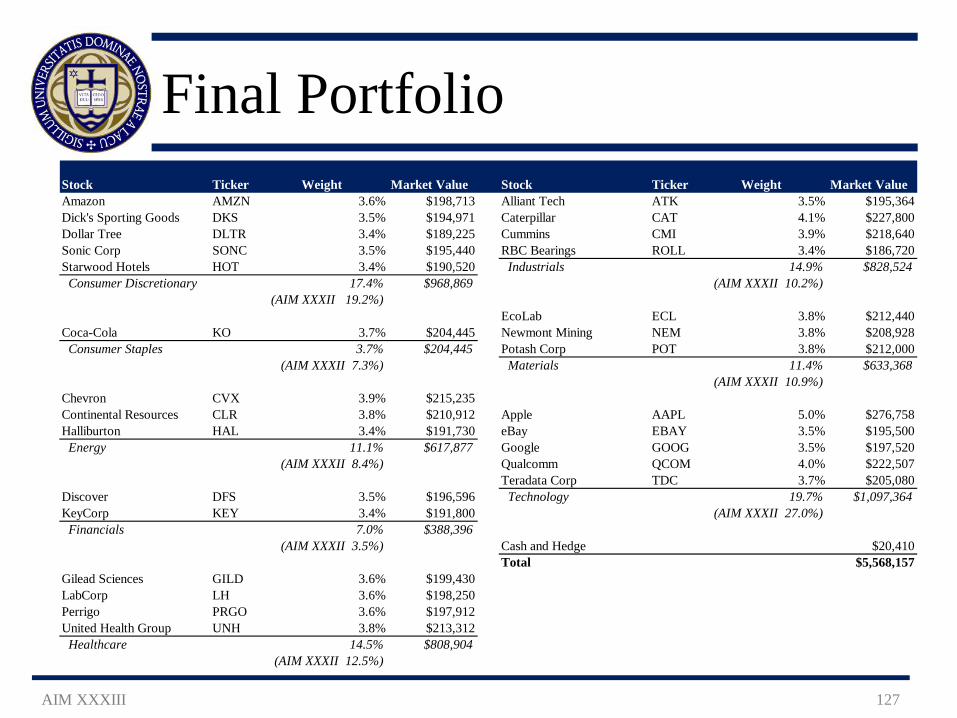
Final Portfolio
AIM XXXIII 127
Stock Ticker Weight Market Value Stock Ticker Weight Market ValueAmazon AMZN 3.6% $198,713 Alliant Tech ATK 3.5% $195,364Dick's Sporting Goods DKS 3.5% $194,971 Caterpillar CAT 4.1% $227,800Dollar Tree DLTR 3.4% $189,225 Cummins CMI 3.9% $218,640Sonic Corp SONC 3.5% $195,440 RBC Bearings ROLL 3.4% $186,720Starwood Hotels HOT 3.4% $190,520 Industrials 14.9% $828,524 Consumer Discretionary 17.4% $968,869 (AIM XXXII 10.2%)
(AIM XXXII 19.2%)EcoLab ECL 3.8% $212,440
Coca-Cola KO 3.7% $204,445 Newmont Mining NEM 3.8% $208,928 Consumer Staples 3.7% $204,445 Potash Corp POT 3.8% $212,000
(AIM XXXII 7.3%) Materials 11.4% $633,368(AIM XXXII 10.9%)
Chevron CVX 3.9% $215,235Continental Resources CLR 3.8% $210,912 Apple AAPL 5.0% $276,758Halliburton HAL 3.4% $191,730 eBay EBAY 3.5% $195,500 Energy 11.1% $617,877 Google GOOG 3.5% $197,520
(AIM XXXII 8.4%) Qualcomm QCOM 4.0% $222,507Teradata Corp TDC 3.7% $205,080
Discover DFS 3.5% $196,596 Technology 19.7% $1,097,364KeyCorp KEY 3.4% $191,800 (AIM XXXII 27.0%) Financials 7.0% $388,396
(AIM XXXII 3.5%) Cash and Hedge $20,410Total $5,568,157
Gilead Sciences GILD 3.6% $199,430LabCorp LH 3.6% $198,250Perrigo PRGO 3.6% $197,912United Health Group UNH 3.8% $213,312 Healthcare 14.5% $808,904
(AIM XXXII 12.5%)