Embed Size (px)
Citation preview
Adverse Selection or Moral Hazard,
An Empirical Study∗
Xiang Hui
Olin Business School,
Washington University in St. Louis
Maryam Saeedi
Tepper School of Business,
Carnegie Mellon University
Neel Sundaresan†
Microsoft Corp.
April 30, 2018
Abstract
Markets prone to asymmetric information employ reputation mechanisms to ad-
dress adverse selection and moral hazard. In this paper, we use a change in such a
reputation mechanism to examine its effect on improving adverse selection and moral
hazard. In May 2008, eBay changed its reputation mechanism to prevent sellers from
giving negative feedback to buyers. This change was intended to prevent sellers from
retaliating against buyers who gave them negative feedback. We observe an improve-
ment in the overall quality of the marketplace as a result of this change. We attribute
∗This paper is based on the second chapter of Maryam Saeedi’s thesis, Saeedi [2012]. An earlier versionof this paper has been circulated under the name “From Lemon Markets to Managed Markets: An Analysisof Reputation System Evolution”, coauthored with Zeqian Shen. We are grateful to Professor AlessandroGavazza and two anonymous referees for very helpful feedback and suggestions. We have also benefited fromvaluable feedback from David Blau, Brian Burke, Luis Cabral, Thomas Holmes, Hugo Hopenhayn, KaramKang, Petra Moser, Chris Nosko, Amil Petrin, Ali Shourideh, Steve Tadelis, Robert Town, Joel Waldfogel,and seminar participants at IIOC 2013, Midwest Economics, Applied Economics Meeting, Applied MicroWorkshop at Minnesota, eBay Economist seminar series, and CEPR European Summer Symposium inEconomic Theory.†[email protected]; [email protected]; [email protected]
1

49%–77% of this improvement to reduced adverse selection as low-quality sellers exit
the market or their market share drops, and the rest to a reduction in moral hazard
as sellers improve the quality of their service.
Keyword: E-Commerce, Reputation Mechanism, Moral Hazard, Adverse Selection
1 Introduction
The recent rise of e-commerce has highlighted the importance of asymmetric information for
large decentralized platforms. Examples of such platforms include eBay, Amazon Market-
place, Alibaba, and Taobao in retail; Airbnb and VRBO in room and house sharing; Uber
and Lyft in transportation; Care.com in child care; Rover in pet care; and Upwork (former
oDesk) in the freelance and labor market.1 In most of such markets, reputation mechanisms
play a crucial role in addressing the inefficiencies arising from asymmetric information. His-
torically, designing a well-functioning reputation mechanism has not been a straightforward
task, and many of these marketplaces have changed their reputation mechanisms multiple
times to address concerns such as retaliation and feedback manipulation.2 In this paper, we
study a change in eBay’s feedback policy and examine its effect on various dimensions of the
asymmetric information problem.
When implementing reputation mechanisms, online markets are concerned with various
effects of their reputation mechanisms: their effect on the pool of sellers involved in the
marketplace (what we refer to as adverse selection) and their effect on the behavior of sellers
in the marketplace (what we refer to as moral hazard). As an example, eBay wants sellers to
provide high-quality services (good customer service, effective communication, prompt ship-
ping of items, etc.), aiming to reduce moral hazard, and to encourage entry of sellers that can
provide these services, aiming to reduce adverse selection. It is, thus, crucial to understand
how a reputation mechanism impacts these two properties of an online marketplace.
1Examples of papers that study asymmetric information in such platforms are: Cai et al. [2013], Fanet al. [2016], Zervas et al. [2015], and Filippas et al. [2017].
2Uber changed its feedback mechanism from one-sided to two-sided, where both the driver and therider rate one another (http://nyti.ms/1DnMXdW). Airbnb changed its feedback mechanism to remove thepossibility of retaliation. Now a host and a guest cannot see the other party’s feedback before leavingfeedback or after the deadline for leaving feedback has passed (Fradkin et al. [2015]).
2

In this paper, we use a unique policy experiment to answer this question. In particular,
we examine the impact of a change to the reputation mechanism (from here on referred to
as “policy change”) introduced by eBay in May 2008, whereby sellers can no longer leave
negative feedback for buyers. This policy was introduced to remedy retaliation from sellers to
buyers. First, we establish the extent to which this change in policy increases sellers’ quality
as measured by the number of negative feedback ratings, low detailed sellers ratings (DSRs),
number of disputes, and so forth. Second, we show that following the change in policy, the
market share of low-quality sellers declines, mainly due to them exiting the market. Finally,
we provide a simple methodology to disentangle the effects of the policy change on adverse
selection and moral hazard. We show that about 49-77% of the improvement is due to
adverse selection and the remaining is due to moral hazard.
We start by presenting evidence of the existence of retaliation before the policy change.3
We observe that in more than a third of transactions where a seller received negative feedback
from a buyer, the seller would retaliate by giving the buyer negative feedback. Additionally,
the percentage of negative feedback ratings from sellers increases by almost tenfold when
the buyer is the first to leave feedback. After the policy change, we observe a decrease in
the percentage of negative feedback ratings (-50%), low detailed seller ratings (-19%), and
number of disputes from buyers (-17%). These indicate a large reduction in negative buyer
experience. This observation is intriguing, especially in the case of negative feedback ratings,
because the policy change was intended to make it easier for buyers to leave honest feedback,
as well as reducing the cost of leaving negative ratings; however, we observe a reduction in
the number and share of negative feedback ratings from buyers.4
We examine two main channels through which this reduction in negative buyer experience
has occurred. First, by losing the power to retaliate, sellers are forced to exert more effort in
providing better service and higher-quality items, causing a reduction in moral hazard. We
observe that almost all seller groups, when divided based on reputation or size, improved
3Bolton et al. [2013], Dellarocas and Wood [2008], Masclet and Penard [2008], Dellarocas [2002], Kleinet al. [2006], and Resnick and Zeckhauser [2002] have also noted the possibility of retaliation. We show thateven after eBay introduced the detailed sellers rating mechanism that is explained in the data section thepractice of retaliation persisted.
4Nosko and Tadelis [2015] argue that leaving negative feedback is still associated with a negative cost dueto the possible harassment from the seller. The arguments in the paper will still be valid as long as this costhas been reduced.
3

their feedback ratings.
Second, the lowest-quality sellers on the market, who cannot sustain themselves without
the power to retaliate, had to exit the market, causing a reduction in adverse selection.
We observe that sellers’ size, that is, the number of items sold by sellers in a given month,
decreased if sellers retaliated in the past, and after the policy change, the low-quality sellers’
size further decreased.5
Finally, we provide a simple methodology to decompose the effects of this policy change
to moral hazard and adverse selection. While in general it is difficult to do this decomposition
without a structural model, we provide a conceptual framework that motivates our simple
calculations. To this end, consider an economy where sellers have different innate qualities
(in providing service, due diligence, etc.) and must additionally exert effort to provide these
services, with cost of effort being negatively correlated with their innate quality. Absent
a transparent reputation mechanism, when services are not rewarded, sellers will exert no
effort to provide high-quality services. Upon the introduction of a transparent reputation
mechanism, high-quality sellers exert effort, resulting in a higher overall quality of their
service. On the other hand, if the cost of improving quality for low-quality sellers is too
high, given that they face lower price, their market share goes down and in some cases they
might have to exit the market. One can thus regard the change in high-quality sellers’ overall
quality as improvement in moral hazard, and the change in low-quality sellers’ quantity sold
as improvement in adverse selection.
Inspired by this example, we perform a back-of-the-envelope calculation to decompose
the total effect of the policy change to moral hazard and adverse selection. We assume that
sellers’ quality and quantity remain the same right after the policy change as before it. We
use various measures for quality, such as negative feedback ratings, low DSRs, and number of
complaints. We then use each seller’s quantity, quality, lagged quantity, and lagged quality
to compute the change in overall quality, change in adverse selection, and change in moral
hazard. In particular, we refer to the difference between the lagged total negative experience
of buyers and the negative experience right after the policy change as the total impact of the
5This effect on the exit rate confirms the result in Cabral and Hortacsu [2010], in which sellers withnegative feedback exit the market at a higher rate. The negative effect of retaliation on sellers’ size does notchange after controlling for the number of negative ratings received.
4
policy change.
As argued by the model, we attribute the change in buyers’ experience due to a change
in sellers’ quality to a reduction in moral hazard. This is measured by the difference between
the current and lagged quality measure, multiplied by the quantity. Next, we attribute the
change in buyers’ experience due to a change in sellers’ market share to a reduction in adverse
selection. This is measured by the difference between the current and lagged quantity, multi-
plied by the quality measure. Our calculations show that 49%–77% of the total improvement
is due to a reduction in adverse selection as low-quality sellers exit the market or have a
smaller market share. We attribute the rest to an improvement in moral hazard as remaining
sellers improve the quality of their service. This is a notable result, because it shows eBay
can impact adverse selection more effectively by changing its reputation mechanism rather
than incentivizing sellers to exert more effort in providing better service.6 Finally, we show
that our calculations are robust to allowing for trends in sellers’ quantities and qualities, by
using a simulation approach.
Related Literature: An extensive literature has examined reputation mechanisms and
their ability to overcome adverse selection and moral hazard (e.g., Milgrom et al. [1990],
Holmstrom [1999], Mailath and Samuelson [2001], Board and Meyer-ter Vehn [2010], and
Board and Meyer-ter Vehn [2011]). This theoretical literature is accompanied by a large
literature that measures the value of reputation in online markets (Resnick and Zeckhauser
[2002], Resnick et al. [2006], Brown and Morgan [2006], Lucking-Reiley et al. [2007], and
Saeedi [2011]. Bajari and Hortacsu [2004] have an excellent survey of early work regarding
reputation and eBay.
The paper closest to our work is Klein et al. [2016], who explore the effect of the same
policy change. They investigate possible forces behind the increase in average DSRs. The
authors track a set of sellers over time and get monthly information about some sellers’
characteristics such as their feedback ratings and their average DSRs. They argue that the
observed difference in the average quality in the marketplace is entirely due to improvements
in moral hazard. However, this is at odds with our conclusion, as we attribute the majority
6In another paper, Hui et al. [2018] show a similar pattern for another change in eBay’s policy: wheneBay makes the certification mechanism harder to get, Hui et al. [2018].
5

of the total improvement to a reduction in adverse selection.
In order to assert that there is no adverse selection impact, Klein et al. [2016] explore
the exit rate of sellers, and they do not find any significant increase in it. This approach
has two main drawbacks: First, their sample of eBay sellers is potentially biased, as the
authors started tracking these sellers more than a year before the policy change, and it is
not clear if they started with a representative sample of sellers. Sellers who survive and are
active on eBay for more than a year are considered seasoned sellers, and their probability
of exiting the marketplace is significantly lower than average. This biased sample set leads
to a wrong conclusion on the effect of the policy change on the exit rate of sellers. Second,
even a reduction in size of low-quality sellers can be considered a source of change in adverse
selection, which is especially relevant for a marketplace such as eBay. Many sellers who
quit selling professionally on eBay return to the marketplace to sell their personal items (for
example, their used phones). Our analysis shows that accounting for such changes is crucial.
We apply our method to their dataset and find that the effect of adverse selection in their
dataset is less than what we find for our data set at – 48%-58%, compared to 49%-77% in
our dataset – but still we find a significant effect due to a reduction in adverse selection.
Horton and Golden [2015] document a similar concern in feedback ratings in online labor
marketplace oDesk.7 They show an increase in the feedback rating which cannot be explained
by improvement in the quality of contractors. They argue that this is due to the relatively
high cost of leaving negative feedback. Fradkin et al. [2015] explore online room and house
rental marketplace Airbnb. They also show positive bias in the ratings. Similar to Nosko
and Tadelis [2015], they run experiments to show that non-reviewers tend to have a worse
experience on average. They also show that retaliation has caused a bias in feedback ratings.
The rest of the paper is organized as follows: Section 2 gives an overview of the market
structure on eBay and its feedback system. It also explains the policy change studied in
this paper and the data used for this purpose. Section 3 shows evidence of retaliation
existing before the policy change. Section 4 sets up a theoretical framework modeling adverse
selection and moral hazard. Section 5 explores the impact of the policy change on market
outcomes. Section 6 reports the effects of the policy change on timing and frequency of
7oDesk has changed its name to Upwork since the study.
6

feedback ratings. Section 7 shows that the findings in the previous section are robust.
Finally, Section 8 concludes the discussion.
2 Background and Data
eBay is one of the oldest and largest shopping websites. Buyers and sellers can use the
website to buy and sell a wide variety of items. eBay also has one of the first online reputa-
tion mechanisms; the feedback system was the first tool introduced on eBay as a signaling
mechanism for marketplace participants. After each transaction on eBay, sellers and buyers
can choose to leave negative, neutral, or positive feedback or not to leave any feedback for
the other party. Each seller’s feedback summary is available on his or her listing page. This
addition has been counted as one of the main reasons eBay has overcome the asymmetric
information problem that exists among sellers and buyers.
The feedback system helps keep the very worst participants out of the market: Sellers
with very low feedback ratings are forced out of the market, as they cannot compete in
the marketplace.8 However, some low-quality sellers find ways to prevent receiving nega-
tive feedback ratings. In a two-way feedback system, a retaliatory approach may be used,
where low-quality sellers wait for buyers to leave their feedback first before leaving feedback
for buyers. Subsequently, if sellers receive negative feedback, they retaliate with negative
feedback, as noted by Dellarocas and Wood [2008], Masclet and Penard [2008], Dellarocas
[2002], Resnick and Zeckhauser [2002], and Klein et al. [2006]. The retaliation lowers the
effectiveness and value of the reputation system.
To alleviate this problem, eBay introduced detailed seller ratings (DSRs) in May 2007.
DSRs are one-to-five ratings that buyers can leave for sellers in four categories: item as
described, communication, shipping speed, and shipping charges. Unlike feedback ratings,
DSRs are anonymous to sellers, and they can only see their average DSRs in the past 12
months. A picture of buyers’ review prompt is shown in Figure 1.9 This mechanism change
8Cabral and Hortacsu [2010] show that the probability of a seller exiting eBay increases significantly afterreceiving his or her first negative feedback.
9Note that in this example, the buyer cannot leave feedback on shipping charges because shipping is freein this listing.
7

Figure 1: Buyers’ Review Prompt for Sellers
has been studied in depth by Bolton and Ockenfels [2008].
However, even after this addition, the retaliation concern remained, as we show in section
3. To overcome the retaliation problem and to improve the effectiveness of the reputation
system, in May 2008, eBay removed the ability of sellers to leave negative or neutral feedback
for buyers. This policy change was announced in January 2008 on the Spring Seller Update
homepage.10 Sellers and buyers on eBay received an email notification about this update, and
they could also see it on the Announcements page on the eBay Community website. Given
that this was one of the major changes to the eBay feedback system, it was widely contested
by large eBay sellers and as a result publicized in media.11 The new policy was implemented
in May 2008, and it changed the reputation mechanism to practically a one-sided system
where only sellers receive meaningful ratings.12 The review process did not fundamentally
change for buyers or sellers on eBay; however, when sellers choose to rate buyers, they can
only leave positive feedback or postpone leaving feedback, as shown in Figure 2.
eBay has various markets (e.g., Collectibles, Stamps, Electronics, Motors, and Toys),
each of which may have a distinct pool of participants; therefore, each represents a different
level of participation in the reputation mechanism, and also in the adoption of different sales
formats.13 To ascertain whether the discovered effects of the policy change are universal
and able to expand to other markets, we consider three categories: Electronics, Stamps,
10The complete announcement can be found at https://goo.gl/k6ZY4m (accessed April 2017).11Both The New York Times (https://goo.gl/rgJsN8, accessed April 2017) and The Guardian
(https://goo.gl/zXaP85, accessed April 2017) reported on the issue.12Note that the other participants cannot determine if a buyer has not received a feedback rating or has
had few transactions, since the list of past transactions of participants is not public.13For a complete discussion, refer to Shen and Sundaresan [2011].
8

Figure 2: Sellers’ Review Prompt for Buyers
and Collectibles. Electronics is a category with high growth in the sales volume on eBay
in recent years. On the other hand, Stamps and Collectibles are two categories that have
existed on eBay for a long time. These two categories have many sellers and buyers that
interact with one another repeatedly. Therefore, a change in the reputation mechanism could
affect these markets differently. We report the main results related to these two categories
in the appendix.
2.1 Data
The policy change was announced in January 2008, and it was implemented starting May
2008. We analyzed all transactions in Electronics from July 2007 to July 2009. For each
transaction, we have the following information: the date and type of feedback from sellers
and buyers (if any), DSRs (if any), and disputes from buyers.14 Note that our data do
not have any truncation bias; we have the outcome of each transaction and the feedback
ratings even if the feedback was left after July 2009 for a transaction that happened in the
time frame we analyze.15 Furthermore, we collected information on the past transactions of
buyers and sellers, which enabled us to investigate buyers and sellers with different levels of
experience, as well as their exit rate. Throughout the main body of the paper, we discuss
the results related to the Electronics category, and in the appendix, we show the results for
the Stamps and Collectibles categories.
14If a buyer is not satisfied with a transaction and if he or she cannot resolve the issue directly by contactingthe seller, the buyer can escalate the case to eBay; this is called a dispute.
15Buyers and sellers used to have 90 days to leave feedback, but another change in the same period reducedthis time frame to 60 days after the transaction.
9

Table 1: Sellers’ Feedback, Electronics
Feedback Left by SellersPositive Negative or Neutral No Feedback
A. Seller Moves FirstAll 98.83% 1.17% –Positive 99.95% 0.05% –Negative or Neutral 91.94% 8.06% –No Feedback 96.70% 3.30% –B. Buyer Moves FirstPositive 88.47% 0.04% 10.49%Negative or Neutral 5% 37% 58%
Notes: This table shows the percentage of time that sellers leave positive, negative or neutral, or no feedback.The data is divided into two segments. The first segment is when the seller is the first to leave feedback. Inthis segment, we also divide the data conditionally on the buyer’s response after the seller’s feedback. Thesecond segment is when the buyer is the first to leave feedback. The seller’s response is reported conditionallyon the buyer’s action.
3 Existence of Retaliation
We first show that before the policy change, buyers and sellers engaged in retaliatory strate-
gies: After leaving negative feedback for sellers, buyers were much more likely to receive
negative feedback from sellers. The existence of retaliation is discussed in other papers, but
they mostly focus on older data before DSRs were implemented. Our analysis shows that
retaliation was still a problem after the implementation of DSRs. As shown in Table 1,
after a seller receives negative feedback from a buyer, the seller will respond with negative
feedback in 37% of transactions; however, if a buyer leaves positive feedback for a seller, the
seller will respond with negative feedback in only 0.04% of transactions. Moreover, if the
seller is the first party to leave feedback, the seller will leave negative feedback only in 1.17%
of transactions.
Other evidence of sellers’ strategic behavior as the result of negative feedback is illustrated
in Figure 3(a). This figure represents the share of positive feedback from all feedback left
by sellers for buyers. The x-axis shows the number of days between the dates that buyers
and sellers leave each other feedback; positive numbers correspond to transactions in which
the seller is the first to leave feedback, and negative numbers correspond to transactions in
which the buyer has left feedback first. The 0.5 on the x-axis corresponds to the transactions
10

Figure 3: Share of Positive Feedback for Buyers, Electronics
Note: The left panel shows the proportion of positive feedback ratings left by a seller to the number of daysbetween buyer’s and seller’s feedback ratings. The right panel shows the same thing conditional on buyers’feedback.X-axis: The number of days the seller has left feedback before the buyerY-axis: Share of positive feedback from the total feedback left the same day
in which sellers is the first to leave feedback and then buyers leave feedback on the same
day; the -0.5 on the x-axis corresponds to the transactions in which buyers is the first to
leave feedback and then sellers leave feedback on the same day. When sellers move first, they
rarely leave negative feedback for buyers; however, when sellers move after buyers, the share
of negative feedback they leave for buyers increases by about tenfold. This timing indicates
that sellers do not show their disappointment in the quality of the transaction until buyers
leave them feedback. Moreover, note that there is a drop toward the left end of Figure 3(a);
this is consistent with the finding in Klein et al. [2006] that sellers tend to leave negative
feedback more often toward the end of the time window in which they are allowed to leave
feedback.
Figure 3(b) shows additional evidence for the existence of retaliation. In this figure, the
share of positive feedback for buyers is shown as conditional on buyers’ feedback ratings:
positive, negative, and neutral. When the seller leaves feedback first, most of the feedback
ratings are positive even if the buyer leaves negative or neutral feedback for the seller after-
wards. However, if the buyer is the first to leave feedback, the seller’s feedback is strongly
correlated with the buyer’s feedback rating.
11

These figures show that the data in Table 1 are not only a result of correlated satisfaction
with the outcome of the transactions between buyers and sellers. There are many transac-
tions in which sellers leave positive feedback for buyers, but then buyers leave negative or
neutral feedback for sellers. The probability that sellers will leave negative feedback after
buyers leave feedback for them increases sharply only if buyers’ feedback is negative or neu-
tral. Also note that buyers, as well as sellers, care about their feedback percentage for a few
reasons. First, buyers might sell items on eBay as well, and on the main listing page, eBay
does not separate feedback ratings that users received as a seller or as a buyer on the main
listing page.16 Second, if a buyer has a very low feedback percentage, sellers are potentially
unable to sell to them. Third, in case of a dispute, eBay will not be in favor of a user who
has a very high percentage of negative feedback ratings. Therefore, buyers may restrain from
leaving honest feedback in fear of retaliation.
4 A Theoretical Framework
In this section, we present a simple stylized model of moral hazard and adverse selection,
based on Hopenhayn and Saeedi [2017]. Our model allows us to compare market outcomes
under two policy scenarios – the policies are related to the policy change studied in this
paper. This stylized model allows us to decompose the total change in market outcome
into a moral hazard effect and an adverse selection effect. We use the insights from this
decomposition to perform a similar one for our data in Section 5.3.
Consider a static economy with a unit continuum of sellers, each of which can be of two
types: a high-quality seller and a low-quality seller. The value of the base product sold by
the high-quality and low-quality sellers is H and L, respectively, with H > L ≥ 0. Moreover,
a high-quality seller can exert effort e to increase the quality of the item by e to H + e. We
assume that effort is costly and that its cost to the seller is given by f(e). The function
f(e) is a differentiable, increasing, and convex function satisfying f(0) = 0, f ′(0) = 0. We
16One might argue that participants can separate the two types of feedback by visiting the seller’s page.We studied the data on buyers’ browsing behavior, and only about 0.1% of buyers landed on a listing pagewill visit that particular seller’s page. On the listing page, only the average feedback rating number andpercentage is shown, which pools all the past information of that user from being a seller or a buyer on eBay.
12
assume that the fraction of sellers with high quality is given by µH , while µL = 1 − µH is
the fraction of low-quality sellers. The sellers compete in a perfectly competitive market,
with a strictly convex cost function c(q) which results in an increasing supply function S(p).
Buyers are on the long side of the market with unit demand, and they are competing in a
Bertrand competition with each other, so they are willing to pay their expected value for
the item sold.17
To model the change in policy, we compare the outcome of the model under two informa-
tion policies: (1) a policy under which buyers are completely uninformed about the quality
of a particular seller or product, (2) a policy under which buyers are fully informed about the
quality of a particular seller or product. While this is a stark assumption, it is informative
about the effect of providing better information about each product which is a feature of the
policy change that we study.18
First, consider the first policy under which buyers cannot observe the type of seller.
When buyers are completely uninformed about a seller, they do not directly reward the
seller’s effort. Moreover, since there is a continuum of sellers, no seller is able to affect the
equilibrium price by exerting effort. Hence, the only equilibrium outcome is for high-quality
sellers not to exert effort. As a result, the expected value of the item or equilibrium price
for the buyers is given by
µLL+ µHH = p∗.
In this case, since both types of sellers face the same price, they produce the same number
of items. In other words, production is given by S(p∗).
Next, consider the second policy under which buyers perfectly observe the quality of the
items sold in each transaction. In this case, the price received by low- and high-quality
sellers will differ and depends on their quality. In particular, the price of an item sold by
a high-quality seller is H + e, where e is the effort by a high-quality seller in equilibrium,
17We have intentionally assumed a very stark cost structure for effort to highlight the interplay betweenmoral hazard and adverse selection. It is possible to extend this to a more general setup. The key assumptionis that high-quality sellers have a lower cost of exerting effort.
18These are quite strong assumptions. We can better model the policy change as one where the informationbecomes more precise and more correlated with the quality of the items sold. We believe that the mainintuition holds in this setup as well.
13

while the price of an item for a low-quality seller is given by L. The dependence of the price
on the effort level gives an incentive to high-quality sellers to exert effort. If a high-quality
seller sells qH units in equilibrium, the optimal effort choice is given by f ′(e∗) = qH . The
quantity qH is simply marginal benefit of increasing effort, while f ′(e) is the marginal cost.
Note that compared to the first policy, the price faced by a low-quality seller declines –
from p∗ = µLL+ µHH to p∗L = L. At the same time, the price faced by a high-quality seller
increases – from p∗ to p∗H = H + e∗. As a result, low-quality sellers’ quantity reduces to
qL = S(p∗L), and high-quality sellers’ quantity increases to qH = S(p∗H).19
Given the above comparison of market outcomes, we can compare the difference in average
quality under the two policies. The average quality of an item in the market has increased
from µLL + µHH under the first policy to µLqLL+µHqH(H+e∗)µLqL+µHqH
. The difference between these
two numbers represents the total impact of the policy change on the market. In essence,
providing better information about a seller does two things: First, it differentiates high- and
low-quality sellers, which increases the price faced by high-quality sellers and decreases the
price faced by lower-quality sellers. Consequently, this will result in higher market share
for high-quality sellers and lower market share for low-quality sellers. This is what we refer
to as a reduction in adverse selection. This improvement happens even if the high-quality
sellers do not exert any effort. Second, it incentivizes the high-quality sellers to exert effort
by benchmarking their quality to the price. This is what we refer to as a reduction in moral
hazard.20
We can use this framework to decompose the total impact of the policy change into
reduction in moral hazard and adverse selection. In particular, one way to do this is to fix
qualities of the sellers to the levels associated with the first policy scenario and calculate the
change in average quality resulting only from the change in market share of the sellers. This
would be a measure of the change in quality due to adverse selection. In other words, we
19In an extreme case where L ≤ c(0), low-quality sellers will completely exit the market and their quantitygoes to zero.
20Note that there is an interaction between the two effects whereby an increase in effort increases themarket share of the high-quality seller, hence reducing adverse selection further. We will address this issuein our empirical decomposition by controlling for sellers’ past quality in our simulation exercise.
14

can write
µLqLL+ µHqH(H + e∗)
µLqL + µHqH− (µLL+ µHH) =
µLqLL+ µHqHH
µLqL + µHqH− (µLL+ µHH) +
µLqLL+ µHqH(H + e∗)
µLqL + µHqH− µLqLL+ µHqHH
µLqL + µHqH.
In the above equation, the left hand side is the total change in average quality while the first
line in the right hand side is the reduction in adverse selection - the qualities are held fixed
at H and L while market shares have changed to their new levels. We can, then, associate
the second line to the reduction in moral hazard.
Alternatively, we can fix market shares of the sellers to the levels associated with the
first policy scenario and calculate the change in average quality resulting from the change
in qualities of the sellers. In this alternative decomposition, the reduction in moral hazard
is given by µLL + µH(H + e∗) − (µLL + µHH) = µHe∗ while the rest can be associated
with reduction in adverse selection. We use this intuition in section 5.3 to provide a back-
of-the-envelope decomposition of the total impact of the policy change. Later, we use a
simulation-based approach to control for trends in sellers qualities and market shares.
5 Effects on Market Outcomes
We observe changes in buyers’ and sellers’ actions after the removal of the possibility of
retaliation from sellers. Overall, we observe fewer negative experiences for buyers if we look
at the percentage of negative feedback ratings, even though buyers can now leave negative
feedback with less consequences. After the policy change, sellers are unable to leave negative
feedback; therefore, sellers lose the retaliation tool that helps low-quality sellers to stay in the
market. We show that low-quality sellers are forced to either exert more effort in providing
better service and higher-quality items, and remain in the market, or exit the market. We
first present evidences which point to a reduction in moral hazard as sellers improved their
quality. Then, we present evidences which point to a reduction in adverse selection as the
market share of low-quality sellers has decreased. Next, we attempt to decompose the effect
of each of these forces in the observed improvements in outcomes. Lastly, we present indirect
15

evidence on quality improvements in buyers’ experience through the observed reduction in
buyers’ exit rate.
A shortcoming of our analysis is that we cannot rule out other changes on the macro level
or within eBay that could have caused some of the changes in the marketplace. We control
for as many observables as possible, and we include time trends to reduce the endogeneity
problems. Additionally, we run various robustness checks in section 7. Finally, in the
appendix we check the effect of the policy change on various seller and buyer groups to make
sure that these effects are not driven by changes in the composition of sellers and buyers and
their sizes.
5.1 Reduction in Moral Hazard
In this section, we present evidence of an improvement in sellers’ overall quality after the
policy change. Sellers are performing better, as measured by various metrics, including the
ones directly impacted by the change (such as the number of negative feedback ratings) and
the ones indirectly impacted by the change (such as the number of low DSRs and number
of disputes), as shown in Table 2. In this table, we generate a seller-month index of these
parameters and run the regression with and without a time trend, and with and without
sellers’ fixed effect.
DSRs were introduced in May 2007, a year before the studied policy change. DSRs
are similar to feedback ratings, as buyers can rate sellers from 1 to 5 in four categories
(refer to the explanation in Section 2 of this paper). However, unlike feedback ratings,
DSRs are anonymous, and sellers can only observe 12-month moving average ratings. DSRs
are not directly affected by the policy change, but they could be affected indirectly by
a change in sellers’ performance. In Panel A of Table 2, we regress the number of low
DSRs (1 or 2 ratings) a seller has received in each month, controlling for the total number
of observations. The coefficient on policy dummy is negative and significant, indicating a
reduction in low DSRs due to the policy change. Panel A shows that after controlling for
linear monthly trends, the decrease in the number of transactions with low DSRs is 11.4%
and 3.2%, respectively, without and with controls for seller fixed effects. Standard errors are
clustered at the seller level.
16

Table 2: Evidence for Reduced Moral Hazard
Panel A. Dependent Variable: Number of Transactions with Low DSRsPolicy -0.015*** -0.105*** -0.114*** -0.032***
(0.002) (0.006) (0.002) (0.004)No. Transaction 0.023*** 0.023*** 0.023*** 0.023***
(1.1E-05) (0.002) (1.1E-05) (0.002)Seller FE X XTime Trend X XR2 0.584 0.582 0.584 0.582
Panel B. Dependent Variable: Number of ComplaintsPolicy -0.021*** -0.125*** -0.136*** -0.039***
(0.002) (0.007) (0.003) (0.005)No. Transaction 0.027*** 0.027*** 0.027*** 0.027***
(1.2E-05) (0.002) (1.2E-05) (0.002)Seller FE X XTime Trend X XR2 0.593 0.591 0.593 0.591
Panel C. Dependent Variable: Number of Negative FeedbackPolicy -0.002** -0.042*** -0.046*** -0.014***
(0.001) (0.003) (0.001) (0.002)No. Transaction 0.011*** 0.011*** 0.011*** 0.011***
(5.6E-06) (0.001) (5.6E-06) (0.001)Seller FE X XTime Trend X XR2 0.500 0.498 0.500 0.498
Notes: In this table, we estimate the change in sellers’ performance before and after the policy change,according to various measures. Complaints refer to the cases in which buyers leave negative feedback or lowDSRs, or file a claim. Standard errors are clustered at the seller level.
17

Panel B shows a similar trend of the number of complaints. We define the number of
complaints as the number of transactions in which buyers file a dispute about the transaction
to eBay. Finally, in Panel C we study the impact of the policy change on the number of
negative or neutral feedback ratings received by sellers. Note that after the policy change,
buyers can be more honest when leaving feedback (as the retaliation possibility from sellers
has been eliminated), and one would expect to see an increased number of negative or neutral
feedback ratings buyers leave for sellers. However, these regressions show fewer negative
feedback ratings for sellers.
Table 2 indicates a reduction in moral hazard due to the policy change, as sellers have
improved their quality, as measured by various indicators. However, this equation does not
show whether there is reduced adverse selection, as the estimate without controlling for fixed
effects is smaller in magnitude than the estimate with fixed effects’ controls; therefore, we
study the change in sellers’ size in the next section.
5.2 Reduction in Adverse Selection
In this section, we present evidence of a reduction in adverse selection due to eBay’s policy
change. First, we show that the size of low-quality sellers shrinks after the policy change is
implemented. Note that on eBay many professional sellers may stop being active; however,
they might occasionally sell a few personal items. Therefore, we study change in size rather
considering exit as a binary variable. Then, we show evidence that the threshold for sellers
who exit the market has increased, meaning that a seller who was previously able to sustain
in the market could not anymore and must exit the market.
We study the change in sellers’ size in Table 3. In Panel A of this table, we consider three
different periods, each including a six-month time frame, two before and one after the policy
change. The dependent variable for each data point in the regression is the size of a seller,
defined as the number of completed transactions in each time period. “Policy” is a dummy
variable equal to one if the period is after the policy change and zero otherwise. To predict
the size of a seller, we use various lagged variables: seller’s size, number of retaliations, as
well as number of negative feedback ratings, low DSRs, and complaints received. We assume
that retaliation has happened if the seller has left a negative feedback rating after receiving
18

Table 3: Evidence of Reduced Adverse Selection
Panel A. Change in Seller Sizes Before and After the Reputation Mechanism ChangeDependent Variable: Size
(1) (2) (3) (4) (5) (6)Lagged Size 1.003*** 0.338*** 1.149*** 0.571*** 0.980*** 0.425***
(0.001) (0.005) (0.003) (0.007) (0.002) (0.005)Lagged # Retaliation -18.072*** -0.664
(0.239) (0.611)Lagged #Retal*Policy -54.972*** -64.645***
(0.461) (0.619)Lagged #Low DSR -4.782*** -5.221***
(0.071) (0.145)Lagged #Low DSR*Policy -6.183*** -6.651***
(0.115) (0.142)Lagged # Claims -26.784*** -106.464***
(0.999) (1.991)Lagged # Claims*Policy -30.577*** -4.207***
(1.334) (2.119)Lagged Size*Policy 0.066*** 0.002 0.136*** 0.036*** 0.043*** -0.163***
(0.002) (0.002) (0.004) (0.005) (0.002) (0.003)Seller FE X X X
R2 0.784 0.953 0.773 0.948 0.765 0.950
Panel B. Change in Exit Rate and in Quality of Exiters and Incumbents(1) (2) (3) (4) (5) (6)
Dependent Variable Exit Rate Share of Neg Fdbk Share of Claims6-Month 3-Month Exiter Incumbent Exiter Incumbent
Policy 0.165*** 0.016*** -0.002** -0.002*** -0.004*** -0.006***0.002 (0.002) (0.001) (0.001) (0.002) (0.002)
Time Trend -0.043*** -0.003*** 0.001*** 0.001*** 0.002*** 0.002***(2.1E-4) (2.1E-4) (1.6E-4)) (9.6E-5) (4.7E-5) (4.2E-5)
Intercept 4.809*** 0.910*** -0.046*** -0.162***(0.021) (0.021) (0.016) (0.005)
Seller FE X XR2 0.032 1.5E-4 9.6E-5 0.65 0.003 0.714
Notes: This table shows the result of regressing the size of sellers (i.e., the number of items they sell) asa function of their lagged size, number of retaliations they have made, number of low DSRs, and numberof claims that they have received in the previous period. Each period is six months, one before and oneafter the eBay policy change. “Policy” is a dummy variable equal to one if the period is after the policychange. “Retaliation” is the number of transactions with retaliation from the seller. Retaliation is definedas a transaction in which the seller leaves a negative feedback rating after receiving a negative feedbackrating from a buyer. In Panel B, we do an event study of how sellers’ exit rate and exit quality thresholdhave changed. Exit is defined as either six or three months of seller inactivity. *** Indicates results that arestatistically significant at the 1% level.
19
a negative feedback rating.
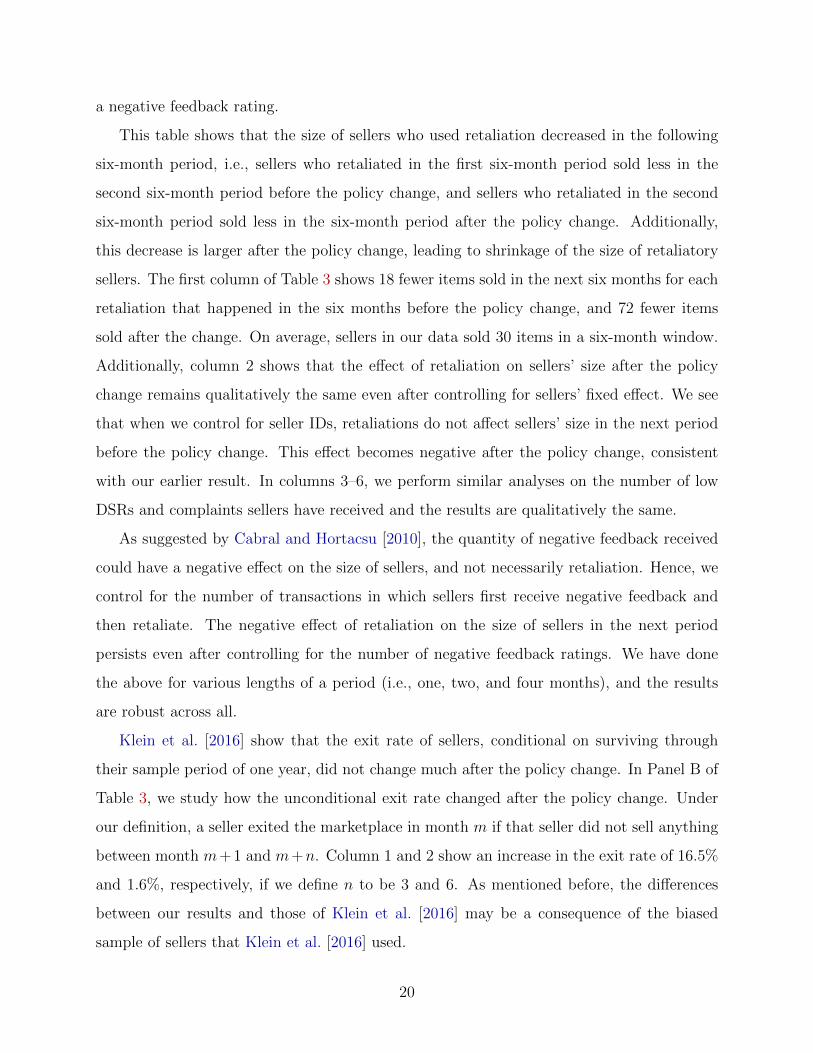
This table shows that the size of sellers who used retaliation decreased in the following
six-month period, i.e., sellers who retaliated in the first six-month period sold less in the
second six-month period before the policy change, and sellers who retaliated in the second
six-month period sold less in the six-month period after the policy change. Additionally,
this decrease is larger after the policy change, leading to shrinkage of the size of retaliatory
sellers. The first column of Table 3 shows 18 fewer items sold in the next six months for each
retaliation that happened in the six months before the policy change, and 72 fewer items
sold after the change. On average, sellers in our data sold 30 items in a six-month window.
Additionally, column 2 shows that the effect of retaliation on sellers’ size after the policy
change remains qualitatively the same even after controlling for sellers’ fixed effect. We see
that when we control for seller IDs, retaliations do not affect sellers’ size in the next period
before the policy change. This effect becomes negative after the policy change, consistent
with our earlier result. In columns 3–6, we perform similar analyses on the number of low
DSRs and complaints sellers have received and the results are qualitatively the same.
As suggested by Cabral and Hortacsu [2010], the quantity of negative feedback received
could have a negative effect on the size of sellers, and not necessarily retaliation. Hence, we
control for the number of transactions in which sellers first receive negative feedback and
then retaliate. The negative effect of retaliation on the size of sellers in the next period
persists even after controlling for the number of negative feedback ratings. We have done
the above for various lengths of a period (i.e., one, two, and four months), and the results
are robust across all.
Klein et al. [2016] show that the exit rate of sellers, conditional on surviving through
their sample period of one year, did not change much after the policy change. In Panel B of
Table 3, we study how the unconditional exit rate changed after the policy change. Under
our definition, a seller exited the marketplace in month m if that seller did not sell anything
between month m+ 1 and m+n. Column 1 and 2 show an increase in the exit rate of 16.5%
and 1.6%, respectively, if we define n to be 3 and 6. As mentioned before, the differences
between our results and those of Klein et al. [2016] may be a consequence of the biased
sample of sellers that Klein et al. [2016] used.
20

Additionally, we observe that the exiting quality threshold has increased (i.e., the average
quality of sellers who exit has improved over time). We see in columns 3 and 6 that exiters
have higher quality than before: 0.2% fewer negative feedback ratings and 0.4% fewer claims
from buyers. For a benchmark comparison, incumbents have 0.2% fewer negative feedback
ratings and 0.6% fewer claims from buyers. We put these changes into perspective in Table
3. We interpret this result as a change in minimum quality required to be active in the
market.
In summary, the above results are consistent with there being two main reasons for the
decline in negative or neutral feedback ratings despite the elimination of retaliation. First,
the very worst sellers in the market either shrink in size or exit the market; this is equivalent
to a reduction in adverse selection. Second, all seller groups increase their effort to offer a
better service on eBay; this is equivalent to a reduction in moral hazard.
5.3 Decomposing Adverse Selection and Moral Hazard
We have provided evidence that the eBay marketplace improved after the policy change
both through reduced moral hazard and reduced adverse selection. In this section, we use
the insights from the simple model in section 4 and decompose the total effect of the policy
change into the two mechanisms. Recall that our decomposition associates the change in
quality of individual sellers to a change in moral hazard – while holding market shares fixed.
Moreover, it associates a change in market shares, especially the reduction in low-quality
sellers’ market share, to a change in adverse selection – while holding qualities fixed.
Formally, we let the quality of each seller to be inversely proportional to the share of the
seller’s unsatisfactory transactions, as measured by various indexes (e.g., share of transactions
with low DSRs, negative feedback ratings, or complaints). We denote this by θj for seller
j before the policy change. Let Θ be the vector of θj’s for all sellers. Equivalently, let qj
represent the market share of seller j (number of items sold by j divided by number of items
sold by all sellers in the market), and let Q be the vector representing the market shares of
all sellers before the policy change. Moreover, let Θ′ and Q′ represent the vectors of qualities
and market shares after the policy change. Thus the inverse average quality in the market
before and after the policy change is given by ΘQ and Θ′Q′, respectively. The total impact
21

of the policy change can be found by calculating Θ′Q′−ΘQ. This total impact can then be
decomposed into a change in the market share holding quality constant (adverse selection)
and a change in quality holding market share constant (moral hazard). Note that this can be
done in two ways. For example, one estimate of reduction in moral hazard would be to hold
market shares equal to their values before the policy change and change the quality. The
remainder would be a reduction in adverse selection – this is done in 1. Additionally, one
estimate of moral hazard would be to hold market shares equal to their value after the policy
change and change the quality. The remainder would be a reduction in adverse selection –
this is done in 2. In other words, we can write
Θ′Q′ − ΘQ =(ΘQ′ − ΘQ) + (Θ′Q′ − ΘQ′), (1)
Θ′Q′ − ΘQ =(Θ′Q′ − Θ′Q) + (Θ′Q− ΘQ). (2)
In 1, ΘQ′ − ΘQ is the change in the number of unsatisfactory transactions if only the
market shares of sellers change, due to a reduction in adverse selection. The remainder
Θ′Q′−ΘQ′ captures the reduction in moral hazard. Similarly, in 2, Θ′Q−ΘQ is the change
in the number of unsatisfactory transactions if only the quality of sellers changes, due to a
reduction in moral hazard. The remainder Θ′Q′−Θ′Q is the reduction in adverse selection.
We illustrate this decomposition using an example.
Example. Consider a market with only two active sellers and suppose that before the
policy change, their inverse quality and market shares are equal to (0.1, 0.4) and (0.05, 0.6),
respectively. Suppose that after the policy change, their inverse quality measure and market
share change to (0.1, 0.2) and (0.01, 0.8), respectively. That is, seller 1 represents a low-
quality seller whose market share declines after the policy, while seller 2 is a high-quality
seller whose market share and quality increase. Note that a value of 0.1 for inverse quality
means that in 10% of the times seller 1 has a bad outcome (complaint, low DSR, etc.). Before
the policy change the share of bad outcomes as a fraction of total number of transaction is
given by 0.1 ∗ 0.4 + 0.05 ∗ 0.6 = 0.07. After the policy change, the share of bad outcomes
22

Table 4: Decomposing Adverse Selection and Moral Hazard
Panel A. Change in Number of Low DSRs using Lagged DataAdverse Selection 1 Moral Hazard 1 Adverse Selection 2 Moral Hazard 2
Θ′Q′ − Θ′Q Θ′Q− ΘQ ΘQ′ − ΘQ Θ′Q′ − ΘQ′
75% 25% 77% 23%
Panel B. Change in Number of Neg/Neut Feedback using Lagged DataAdverse Selection 1 Moral Hazard 1 Adverse Selection 2 Moral Hazard 2
Θ′Q′ − Θ′Q Θ′Q− ΘQ ΘQ′ − ΘQ Θ′Q′ − ΘQ′
60% 40% 49% 51%
Panel C. Change in Number of Complaints using Lagged DataAdverse Selection 1 Moral Hazard 1 Adverse Selection 2 Moral Hazard 2
Θ′Q′ − Θ′Q Θ′Q− ΘQ ΘQ′ − ΘQ Θ′Q′ − ΘQ′
70% 30% 60% 40%
Notes: Quality Θ and market share Q are measured using data from the three months before the policychange.
is given by 0.1 ∗ 0.2 + 0.01 ∗ 0.8 = 0.028. If we keep the market shares fixed and the same
as those before the policy change, changing the inverse qualities to the new levels will result
in 0.1 ∗ 0.4 + 0.01 ∗ 0.6 = 0.046 bad outcomes. This represents a decline of 0.07 − 0.046
in the share of bad outcomes. We then compare this to the actual change in the share of
bad outcomes and claim that (0.046 − 0.07)/(0.028 − 0.07)% = 57% of the change in bad
outcomes is due to a reduction in moral hazard. The contribution of adverse selection would
be 43%. This is the decomposition implied by 1. Similarly, we can use 2 by fixing the inverse
qualities to their values before the policy change and changing market shares. Under this
measure the share of bad outcomes will be 0.1 ∗ 0.2 + 0.05 ∗ 0.8 = 0.06, which then implies a
reduction by (0.7−0.06). We relate this improvement, (0.06−0.07)/(0.028−0.07)% = 24%,
to an improvement due to a reduction in adverse selection.
As the above example illustrates, we assume that in the absence of the policy change the
sellers will maintain the same level of quality or market share as before the policy change.
This simple method can highlight the importance of each of the two effects. In Table 4, we
use data from the three months before and three months after the policy change to compute
these changes. Panel A suggests that around 75% of the reduction in low DSRs comes from
alleviated adverse section. If we use an alternative quality measure based on the number of
23

negative or neutral feedback ratings (Panel A2), we obtain a qualitatively similar result, that
is, around 49%–60% of quality improvement comes from reduced adverse selection. Finally,
if we use the number of complaints from buyers as a quality measure, we attribute 60%–70%
of the quality change to a reduction in adverse selection. Overall, this simple back-of-the-
envelope calculation suggests that the reduction in adverse selection is a robust result of
the policy change. In section 7.4, we extend this analysis by undertaking a simulation-based
approach to account for trends in Θ and Q. As we show, the results are qualitatively similar.
Note that in the above, we have interpreted a change in market share as a change in
adverse selection. This is in contrast with only associating exit to a change in adverse
selection. Note that in our dataset, we observe many sellers reducing their market share
yet not exiting the market. Many sellers even after quitting selling professionally on eBay
may return to the marketplace to sell occasionally, such as selling their used phone. Our
comprehensive data on eBay allows us to measure such reductions in market share and
measure their contribution to adverse selection.
5.4 Effect on Buyers’ Exit Rates
In this section we explore the effect of the policy change on buyers’ exit rate. This is
indirect evidence on the change of buyers’ experience on eBay. As discussed by Nosko and
Tadelis [2015], buyers’ return to the marketplace is highly correlated with the quality of their
experience. Furthermore, this measure can be used as a proxy for buyers’ experience even
when they leave no feedback or submit a formal complaint against a seller. If a buyer who
has purchased an item in our data set in a given month returns to the marketplace within
six months and purchases an item, we assign 0 as the outcome variable to that buyer for
that month; otherwise, we assign 1. As shown in column 1 in Table 5, buyers’ exit rate has
dropped by 5% after the policy change. Controlling for buyer fixed effects in column 2 leads
to a further reduction of the exit rate to 10%.
In columns (3)–(5), we further control for three dummy variables: Experienced, Negative,
and No Complaint, and their interactions with the policy dummy. The Experience dummy
is 1 if a buyer spent more than $450 in the previous year; the Negative dummy is 1 if a
buyer left negative or neutral feedback; the No Complaint dummy is 1 if a buyer did not
24

Table 5: Buyers’ Exit Rates, Electronics
Dependent Variable: Exit in the Following 6 MonthsPolicy -0.05*** -0.105*** -0.06*** -0.048*** -0.049***
(0.001) (0.001) (0.001) (0.001) (0.001)Experienced -0.255*** -0.243*** -0.243***
(4.5E-04) (4.5E-04) (4.5E-04)Experienced*Policy 0.066*** 0.06*** 0.06***
(0.001) (0.001) (0.001)Negative -0.078*** -0.046***
(0.001) (0.001)Negative*Policy 0.009*** -0.002
(0.002) (0.002)No Complaint 0.129*** 0.128***
(3.9E-04) (3.9E-04)No Complaint*Policy -0.031*** -0.031***
(0.001) (0.001)Time Trend -0.01*** 0.016*** -0.01*** -0.01*** -0.01***
(4.8E-05) (6.7E-05) (4.8E-05) (4.7E-05) (4.7E-05)Intercept 1.499*** 1.582*** 1.532*** 1.536***
(0.005) (0.005) (0.005) (0.005)Buyer FE XR2 0.02 0.641 0.051 0.061 0.061
Notes: This table shows the probability that a buyer does not buy any item in the following six months of apurchase in each category. Buyers are divided into two experience groups: (1) experienced buyers, or buyerswho spent more than $450 in the previous year; and (2) new buyers, or buyers who spent less than $450.The Negative dummy equals 1 if a buyer left negative or neutral feedback. A transaction is considered tohave a complaint if one of the following exists: negative or neutral feedback from buyer, low detailed sellerratings, or a dispute from buyer.
file a dispute to eBay. The estimates in the three columns show that buyers’ exit rates are
the highest for buyers who do not leave any feedback ratings or dispute any transaction,
consistent with results in Nosko and Tadelis [2015]. One drawback of the new mechanism
is that the share of transactions without feedback from buyers will go down, as discussed
in the next section, therefore increasing the share of transactions in this subgroup: buyers
without any complaints to eBay or any feedback for sellers. This change might be because
sellers are not as persistent in trying to obtain feedback from buyers as they were before the
policy change.
25

6 Timing and Frequency of Feedback
In addition to addressing the retaliation problem, the policy change had other interesting
and noteworthy effects on the probability and timing of buyers’ and sellers’ feedback. First,
sellers leave feedback for buyers more often, as shown in Figure 4(a). Specifically, the
data in Electronics show that following the policy change, the likelihood of sellers leaving
feedback increased from 70% to 78%. Second, buyers are leaving feedback less often, down
from 68% to 62%. Additionally, the timing of feedback has changed as well. In 51% of
current transactions, sellers leave feedback before buyers, up from 29% before the change.
Additionally, as shown in Figure 4(b), both buyers and sellers leave feedback sooner due
to the policy change. The number of days a seller will wait to leave feedback for a buyer
has significantly decreased, from 13 days on average before the change to 7 days after the
change. The effect on buyers is similar, though less substantial; the waiting time has gone
down by about 2 days.
One can interpret these results by changes to buyers’ and sellers’ incentives for leaving
feedback. Before the policy change, only 29% of the times were sellers the first party to leave
feedback. One reason that sellers waited for buyers to leave feedback first was to ensure that
buyers will not leave negative feedback for them because of the fear of retaliation. After the
policy change, however, this incentive does not exist anymore, thus giving sellers incentive
to leave feedback for buyers even if they have not done so yet.21
The sharp decrease in the share of transactions with feedback from buyers can be ex-
plained as a response to sellers’ actions. Sellers used to strongly encourage buyers to leave
them positive feedback and would reciprocate it. First, the policy change has given many
sellers the option to leave feedback first, and this lowered buyers’ incentive to generate reci-
procity by leaving feedback. Second, given that buyers can only receive positive feedback,
the value of buyers’ feedback has gone down, which can lower buyers’ incentives to leave
feedback. In a related work, Fradkin et al. [2015] document the reciprocity incentives for
21 eBay lets its most active sellers leave automatic feedback ratings for buyers either after the paymentclears or after sellers receive positive feedback from buyers. The pattern in Figure 13(a), in the appendix,suggests that a large portion of these sellers change their setting to automatically leave positive feedback tobuyers right after the payment clears, while before the policy change, sellers left positive feedback only afterreceiving positive feedback from buyers.
26

Figure 4: Probability and Timing of Feedback, Electronics
Note: This figure shows the share of transactions with feedback left by sellers and buyers over time.X-axis: Time period. The eBay reputation mechanism change happened in May 2008.Y-axis: Share of transactions with feedback from sellers and buyers
guests and hosts on Airbnb.
One important issue to note is that impacts start right after eBay’s announcement of the
policy change even if it was not in effect yet. The new policy was implemented in May 2008,
but it also applied to transactions that took place before if the seller had not left feedback
yet.
On average, buyers wait longer than sellers to leave feedback (Figure 4(b)). This obser-
vation may seem to contradict the fact that buyers leave feedback first most of the times,
but it can be explained. The first reason is the greater variance in the number of days buyers
will wait to leave feedback for sellers. Second, sellers who wait for buyers to leave feedback
first tend to leave feedback in response immediately after receiving feedback, often in the
same day.
7 Robustness Analysis
In this section, we perform various robustness analyses on our previous results to ensure that
they are robust to various alternative scenarios or additional definitions for quality index of
sellers.
27

7.1 Change in Timing
We first consider whether a change in the timing of leaving feedback might be the cause of
the observed reduction of negative feedback ratings. At the same time that the new policy
was implemented, eBay also changed the time frame for leaving feedback, from 90 days to 60
days. Additionally, for certain sellers, buyers could not leave negative feedback in the first
three days after the transaction. We consider two different time windows: first, the number
of days between the end of a transaction and the day feedback was left by the buyer; and
second, the number of days between the dates feedback was left by the seller and by the
buyer. Figure 5 shows a consistent decline in the share of negative or neutral feedback ratings
received from buyers throughout the time span they might leave feedback to sellers. This
graph shows the average share of negative or neutral feedback ratings among all feedback
left for sellers as a function of the number of days between the end of the transaction and the
day buyers leave feedback for sellers. It can be seen that buyers are leaving fewer negative
or neutral feedback ratings throughout time, and the change is not a result of a possible
change in timing.
As mentioned in section 6, since the policy change, many sellers leave feedback sooner
and are usually the first party to act. To explore the possible effects of this change in timing,
we consider Figure 6. This figure shows the share of positive feedback among all feedback
left for sellers as a function of the number of days between the time sellers and buyers leave
feedback. Buyers are consistently leaving a higher share of positive feedback after the policy
change than before it; therefore, the change in order of feedback cannot explain the decline
in negative feedback left to sellers.22
The fact that sellers can only leave positive feedback for buyers after the policy change
can affect buyers’ overall utility from a transaction, which might lead them to leave more
positive feedback ratings. However, this hypothetical story cannot explain the fact that
buyers leave more positive feedback ratings for sellers even when sellers leave feedback first
(i.e., the negative values for x in Figure 6). Additionally, the fact that buyers’ actions change
independently of sellers’ actions, according to the figure, can also show that a reduction in
22Note that the drop at the right end of Figure 6 shows that buyers who leave feedback at the last minutetend to leave more negative feedback ratings, which is consistent with Figure 5.
28

buyers’ retaliation cannot fully explain the decrease in negative feedback ratings from them.
7.2 Removing the Transition Period
The second robustness analysis we perform is to remove the transition period (January–April
2008) and redo the analyses (Table 2). The policy change was implemented in May 2008 but
was announced in January 2008; additionally, after May 2008, sellers could no longer leave
negative feedback for a transaction that happened in March 2008. Therefore, we remove
this period to avoid any potential opportunistic behavior from sellers. 23 In Table 6, we see
that sellers’ quality using various measures went up after the policy change in all the three
panels. In fact, the increase in quality is larger when the transition period is removed than
when it is not. One exception is column 1 in Panel C, in which we do not find any significant
change in the share of months with low DSRs at the 5% level, but it becomes significantly
negative once we control for seller fixed effects.
Next, we analyze the impact of the policy change on sellers’ size after they retaliate,
or receive low DSRs or claims. We use a different outcome variable compared to Table 3,
namely the growth rate of sellers. In Panel A of Table 7, we see that most of the interaction
terms are still negative and significant when we control for seller fixed effects.
Subsequently, we remove the transition period in this exercise as well and report the
estimates in Panel B of Table 7. Again, our findings show that sellers who retaliated,
received more low DSRs, and received more claims are more likely to shrink in size after the
policy change. The estimated impacts of the policy change are larger when we exclude the
transition period than when we include it. Note that since we removed data from January to
April 2008, our two periods before the policy change are each four-month long (May–August
2007 and September–December 2007), and the period after the policy change is also four-
month long (May–August 2008). In comparison, each of the three periods is six-month long
when we consider the transition period.
Lastly, in the regressions we control for the number of negative feedback a seller received.
This is because Cabral and Hortacsu [2010] suggest that the quantity of negative feedback
23For example, in January 2008, a seller might have decided to exit eBay in the following months andtherefore provided low-quality services and products through May 2008.
29

received could have a negative effect on the size of sellers, and not necessarily retaliation.
The results in Table 8 show that the size of low-quality sellers shrinks after the policy change,
even after we control for the number of negative feedback ratings.
7.3 Alternative Definition for Buyers’ Exit
We also redo the analysis on buyers’ exit rate using a different definition of exit. In particular,
we now consider that a buyer exits the eBay marketplace if that buyer does not make another
purchase in the three months after a given purchase, as opposed to six months that we
previously used. Table 9 shows that the magnitude of the impact of the policy change on
buyer retention is smaller, but it is still significantly positive. Subsequently, we remove
the transition period in this exercise and perform the analyses again in Table 10, using the
two definitions of exit rate (six-month buyer inactivity in Panel A and three-month buyer
inactivity in Panel B). The results are mainly robust.
7.4 Alternative Decomposition Method
In this section, we decompose the impact of the policy change from reduced adverse selection
and reduced moral hazard using data from the month before and after the policy change.
We use lagged data as proxies for quality and quantity in Panels A1–A3. The results suggest
that at least 42% of the change in quality comes from the adverse selection channel.
In the second method of decomposition, we want to control for trends in Θ and Q. To do
so, we simulate Θ and Q for each seller j in the month after the policy change. In particular,
we use data from 12 months before the policy change to estimate the following linear models:
Yjt = αj + β1 ∗Qjt−1 + β2 ∗Qjt−2 + β3 ∗Qjt−3 + β4 ∗ Θjt−1 + γ1 ∗ t+ γ2 ∗ t2 + γ3 ∗ t3 + εjt.
Here Yjt can be either Qjt or Θjt. The estimated models of this form give R2 above 0.80
for most sellers. We then use these estimated models to predict sellers’ quantity and quality
in the first month after the policy change. Then we use the simulated quantity to compute
the market share (a measure for Q) and quality (a measure for Θ) in the month after the
policy change to compute the changes in the total number of bad experiences, and changes
30

due to adverse selection and moral hazard, respectively, using the two ways of decomposition.
The advantage of this simulation approach, compared to simply using lagged data for Q and
Θ, is that we control for the time trends in quantity and quality.
In Panel B1 of Table 11, we see that 90%–94% of the quality improvement comes from a
reduction in adverse selection. In Panels B2 and B3, we use the number of negative or neutral
feedback and the number of complaints as the quality measure, and the simulation shows
that more than 61% of the improvement in quality comes from reduced adverse selection.
Lastly, in Panels C1–C3, we apply the same simulation approach as for the three-month
period data, and find that at least 65% of the quality improvement comes from reduced
adverse section.
Note that the estimates on the prominence of adverse selection are generally higher when
we consider the month after the policy change than when we consider the three-month period
after the policy change. This difference suggests that the change in market share is demand
driven and happens immediately, whereas it could take longer for sellers to improve their
quality.
8 Conclusion
Online platforms and applications increasingly rely on user-generated content and are prone
to adverse selection. Typically, a reputation mechanism is used to sustain the market and
avoid its deterioration. eBay is one of the earliest e-commerce platforms. With its adoption
of a simple feedback mechanism, eBay has thrived and expanded over the years. Yet we
do not have a good understanding of the motivation behind the participation of buyers and
sellers in the reputation mechanism on eBay. In this paper, we sought to shed light on this
matter by studying a change in the eBay reputation mechanism: Since May 2008, buyers
can no longer receive negative feedback from sellers.
This change removed sellers’ ability to retaliate. We showed that the reputation mecha-
nism change can cause buyers and sellers to significantly modify their behavior when leaving
feedback. Surprisingly, since this change was implemented, buyers leave positive feedback
ratings for sellers more often. We discussed two possible explanations for this: First, sellers,
31

losing their ability to retaliate, increased their effort to provide better service to buyers,
resulting in a reduction of moral hazard and a better experience for buyers. Second, the
very worst sellers, who could only survive in the market using retaliation, left the market at
a high rate, resulting in a reduction of adverse selection. The eBay reputation mechanism
change has also affected the rate and timing of feedback: Sellers leave feedback more often,
while buyers leave feedback less often, and sellers leave feedback sooner after a transaction.
This further shows that the participants in the market take into account feedback ratings,
and they will actively react to changes in rules.
References
P. Bajari and A. Hortacsu. Economic Insights from Internet Auctions. Journal of Economic
Literature, 42:457–486, 2004. 1
S. Board and M. Meyer-ter Vehn. A reputational theory of firm dynamics. 2010. 1
S. Board and M. Meyer-ter Vehn. Reputation for quality. UCLA Working Paper, 2011. 1
Gary Bolton, Ben Greiner, and Axel Ockenfels. Engineering trust: reciprocity in the pro-
duction of reputation information. Management Science, 59(2):265–285, 2013. 3
G.E. Bolton and A. Ockenfels. The Limits of Trust in Economic Transactions-Investigations
of Perfect Reputation Systems. CESifo, Center for Economic Studies & Ifo Institute for
economic research, 2008. 2
J. Brown and J. Morgan. Reputation in online auctions: The market for trust. California
Management Review, 49(1):61–82, 2006. 1
Luis Cabral and Ali Hortacsu. The dynamics of seller reputation: Evidence from ebay*. The
Journal of Industrial Economics, 58(1):54–78, 2010. 5, 8, 5.2, 7.2
Hongbin Cai, Ginger Z Jin, Chong Liu, and Li-An Zhou. More trusting, less trust? an
investigation of early e-commerce in china. Technical report, National Bureau of Economic
Research, 2013. 1
32

C. Dellarocas. Goodwill hunting: An economically efficient online feedback mechanism for
environments with variable product quality. Agent-Mediated Electronic Commerce IV.
Designing Mechanisms and Systems, pages 93–112, 2002. 3, 2
C. Dellarocas and C.A. Wood. The sound of silence in online feedback: Estimating trading
risks in the presence of reporting bias. Management Science, 54(3):460–476, 2008. ISSN
0025-1909. 3, 2
Ying Fan, Jiandong Ju, and Mo Xiao. Reputation premium and reputation management:
Evidence from the largest e-commerce platform in china. International Journal of Indus-
trial Organization, 46:63–76, 2016. 1
Apostolos Filippas, John Horton, and Joseph M Golden. Reputation in the long-run. Tech-
nical report, CESifo Working Paper, 2017. 1
Andrey Fradkin, Elena Grewal, Dave Holtz, and Matthew Pearson. Bias and reciprocity in
online reviews: Evidence from field experiments on airbnb. In Proceedings of the Sixteenth
ACM Conference on Economics and Computation, pages 641–641. ACM, 2015. 2, 1, 6
B. Holmstrom. Managerial incentive problems: A dynamic perspective. The Review of
Economic Studies, 66(1):169, 1999. 1
Hugo Hopenhayn and Maryam Saeedi. Reputation signals and market outcomes. Technical
report, 2017. 4
John Horton and Joseph Golden. Reputation inflation: Evidence from an online labor
market. Work. Pap., NYU, 2015. 1
Xiang Hui, Maryam Saeedi, Giancarlo Spagnolo, and Steve Tadelis. Certification, reputation
and entry: An empirical analysis. Unpublished Manuscript, 2018. 6
Tobias J Klein, Christian Lambertz, Giancarlo Spagnolo, and Konrad O Stahl. Last minute
feedback. 2006. 3, 2, 3
Tobias J Klein, Christian Lambertz, and Konrad O Stahl. Market transparency, adverse
selection, and moral hazard. Journal of Political Economy, 124(6):1677–1713, 2016. 1, 5.2
33

D. Lucking-Reiley, D. Bryan, N. Prasad, and D. Reeves. Pennies from ebay: The determi-
nants of price in online auctions. The Journal of Industrial Economics, 55(2):223–233,
2007. 1
G.J. Mailath and L. Samuelson. Who wants a good reputation? Review of Economic Studies,
68(2):415–441, 2001. 1
D. Masclet and T. Penard. Is the eBay feedback system really efficient? An experimental
study. Economics Working Paper Archive (University of Rennes 1 & University of Caen),
2008. 3, 2
Paul R Milgrom, Douglass C North, and Barry R Weingast. The role of institutions in the
revival of trade: The law merchant, private judges, and the champagne fairs. Economics
& Politics, 2(1):1–23, 1990. 1
Chris Nosko and Steven Tadelis. The limits of reputation in platform markets: An empirical
analysis and field experiment. Technical report, National Bureau of Economic Research,
2015. 4, 1, 5.4, 24
P. Resnick and R. Zeckhauser. Trust among strangers in Internet transactions: Empirical
analysis of eBay’s reputation system. Advances in Applied Microeconomics: A Research
Annual, 11:127–157, 2002. 3, 1, 2
P. Resnick, R. Zeckhauser, J. Swanson, and K. Lockwood. The value of reputation on eBay:
A controlled experiment. Experimental Economics, 9(2):79–101, 2006. ISSN 1386-4157. 1
M. Saeedi. Reputation and Adverse Selection, Theory and Evidence from eBay, 2011. Work-
ing Paper. 1, 25
Maryam Saeedi. Essays on reputation. PhD thesis, UNIVERSITY OF MINNESOTA, 2012.
∗
Z. Shen and N. Sundaresan. ebay: an e-commerce marketplace as a complex network. In
Proceedings of the fourth ACM international conference on Web search and data mining,
pages 655–664. ACM, 2011. 13
34

Georgios Zervas, Davide Proserpio, and John Byers. A first look at online reputation on
airbnb, where every stay is above average. 2015. 1
35

Figure 5: Share of Non-Positive Feedback from Buyers, Electronics
Note: This figure shows the share of non-positive feedback that sellers receive as a function of the numberof days after the end of a transaction before and after the eBay reputation mechanism change.X-axis: The number of days buyers have waited from the end of a transaction to leave feedbackY-axis: Share of non-positive feedback from total feedback left the same day by buyers for sellers
36

Table 6: Robustness: Evidence on Reduced Moral Hazard, No Transition Period
Panel A. Dependent Variable: Number of Transactions with Low DSRsPolicy -0.014*** -0.122*** -0.136*** -0.057***
(0.002) (0.008) (0.003) (0.008)No. Transaction 0.023*** 0.023*** 0.023*** 0.023***
(1.2E-05) (0.002) (1.2E-05) (0.002)Seller FE X XTime Trend X XR2 0.568 0.566 0.568 0.566
Panel B. Dependent Variable: Number of ComplaintsPolicy -0.019*** -0.146*** -0.163*** -0.077***
(0.002) (0.009) (0.003) (0.009)No. Transaction 0.027*** 0.027*** 0.027*** 0.027***
(1.3E-05) (0.002) (1.3E-05) (0.002)Seller FE X XTime Trend X XR2 0.576 0.574 0.576 0.574
Panel C. Dependent Variable: Number of Negative FeedbackPolicy 0.002* -0.050*** -0.057*** -0.029***
(0.001) (0.004) (0.001) (0.004)No. Transaction 0.010*** 0.010*** 0.010*** 0.010***
(6.3E-06) (0.001) (6.3E-06) (0.001)Seller FE X XTime Trend X XR2 0.487 0.485 0.488 0.485
Notes: This table estimates the change in sellers’ performance before and after the eBay reputation mecha-nism change, according to various measures. Complaints are cases in which buyers leave negative feedbackor low DSRs, or file a claim. Standard errors are clustered at the seller level.
37

Table 7: Robustness: Sellers’ Size, Different Dependent Variables
Panel A. Dependent Variable: Growth Rate of Sellers’ SizeLagged # Retaliation -0.014 -0.405***
(0.013) (0.034)Lagged #Retal*Policy 3.2E-04 -0.118***
(0.029) (0.039)Lagged #Low DSR -0.002 -0.142***
(0.002) (0.005)Lagged #Low DSR*Policy 0.001 -0.015*
(0.006) (0.008)Lagged # Claims -0.054*** -0.630***
(0.011) (0.017)Lagged # Claims*Policy -0.004 -0.083***
(0.022) (0.019)Lagged Size*Policy -1.3E-04 -0.002*** -9.4E-05 -0.002*** -2.2E-04 -0.004***
(8.5E-05) (1.2E-04) (1.9E-04) (2.6E-04) (4.8E-04) (4.4E-04)Seller FE X X X
R2 1.4E-05 0.804 1.5E-05 0.806 1.3E-04 0.926
Panel B. Dependent Variable: Sellers’ Size, No Transition PeriodLagged Size 0.906*** 0.384*** 0.923*** 0.418*** 1.016*** 0.381***
(0.001) (0.002) (0.003) (0.004) (0.002) (0.003)Lagged # Retaliation 14.742*** -4.807
(1.176) (0.291)Lagged #Retal*Policy -121.966*** -132.388***
(2.360) (0.851)Lagged #Low DSR 3.181*** -1.169***
(0.314) (0.088)Lagged #Low DSR*Policy -10.244*** -14.392***
(0.745) (0.283)Lagged # Claims -71.415*** -7.643***
(3.304) (1.401)Lagged # Claims*Policy -114.920*** -7.610***
(7.280) (3.252)Lagged Size*Policy 1.504*** 2.228*** 1.513*** 2.406*** 1.140*** 1.854***
(0.019) (0.005) (0.034) (0.012) (0.016) (0.006)Seller FE X X X
R2 0.831 0.630 0.813 0.593 0.858 0.577
Notes: *** Indicates results that are statistically significant at the 1% level.
38

Table 8: Robustness: Sellers’ Size, Controlling for Number of Negative Feedback Ratings
Lagged Size 1.111*** 0.568*** 1.131*** 0.585*** 1.015*** 0.427***(0.003) (0.007) (0.003) (0.008) (0.002) (0.006)
Lagged # Retaliation -10.518*** 16.070***(0.294) (0.738)
Lagged #Retal*Policy -77.260*** -77.615***(0.605) (0.820)
Lagged #Low DSR 0.707*** -0.551**(0.160) (0.286)
Lagged #Low DSR*Policy -16.078*** -9.864***(0.241) (0.307)
Lagged # Claims -22.371*** -107.676***(1.226) (2.329)
Lagged # Claims*Policy -60.265*** -4.613*(1.933) (2.473)
Lagged Size*Policy -0.137*** -0.213*** 0.162*** 0.044*** -0.011*** -0.163***(0.004) (0.004) (0.004) (0.005) (0.003) (0.003)
Lagged # Neg Feedback -7.223*** -14.520*** -11.929*** -11.323*** 0.500*** -3.265(0.165) (0.372) (0.312) (0.614) (0.154) (2.821)
Lagged # Neg Feedback*Policy 16.563*** 14.540*** 21.580*** 6.949*** -0.014 0.368(0.279) (0.325) (0.464) (0.579) (0.205) (0.317)
Seller FE X X X
R2 0.787 0.955 0.775 0.949 0.740 0.950
Notes: This table shows the result of regressing the size of sellers (i.e., the number of items they sell) asa function of their lagged size, lagged percentage, and number of retaliations they have made, and laggedpercentage and number of negative feedback ratings they have received in the previous period. Each periodis six months, one before and one after the eBay policy change. “Policy” is a dummy variable equal to one ifthe period is after the eBay policy change. “Negative” is the number of negative or neutral feedback ratings,and “Retaliation” is the number of transactions with retaliation from the seller. Retaliation is defined as atransaction in which the seller leaves a negative feedback rating after receiving a negative feedback ratingfrom a buyer. *** Indicates results that are statistically significant at the 1% level.
39

Table 9: Robustness: Buyers’ Exit Rates, Exit Defined as Three-Month Inactivity
Dependent Variable: Exit in the Following 3 MonthsPolicy -0.026*** -0.091*** -0.025*** -0.018*** -0.018***
(5.0E-04) (0.001) (0.001) (0.001) (0.001)Experienced -0.232*** -0.222*** -0.222***
(4.3E-04) (4.3E-04) (4.3E-04)Experienced*Policy -0.001 -0.005*** -0.004***
(0.001) (0.001) (0.001)Negative -0.091*** -0.063***
(0.001) (0.001)Negative*Policy -0.02*** -0.027***
(0.002) (0.002)No Complaint 0.113*** 0.111***
(3.7E-04) (3.7E-04)No Complaint*Policy -0.013*** -0.013***
(0.001) (0.001)Time Trend 0.002*** 0.016*** 0.002*** 0.002*** 0.002***
(4.6E-04) (7.1E-04) (4.5E-04) (4.5E-04) (4.5E-04)Intercept 0.452*** 0.533*** 0.486*** 0.492***
(0.004) (0.004) (0.004) (0.004)Buyer FE XR2 2.2E-04 0.539 0.035 0.044 0.044
Notes: This table shows the probability that a buyer does not make another purchase in the following threemonths of a purchase in each category. Buyers are divided into two groups: (1) experienced buyers, or buyerswho spent more than $450 in the previous year; and (2) new buyers, or buyers who spent less than $450.A transaction is considered to have a complaint if one of the following exists: negative or neutral feedbackfrom buyer, low detailed seller ratings, or a dispute from buyer.
40

Table 10: Robustness: Buyers’ Exit Rates, No Transition Period
Panel A: Dependent Variable: Exit in the Following 6 MonthsPolicy 0.145*** -0.440*** 0.139*** 0.148*** 0.148***
(0.001) (0.001) (0.001) (0.001) (0.001)Experienced -0.258*** -0.245*** -0.246***
(0.001) (0.001) (0.001)Experienced*Policy 0.067*** 0.061*** 0.061***
(0.001) (0.001) (0.001)Negative -0.070*** -0.038***
(0.001) (0.001)Negative*Policy 1.3E-04 -0.012***
(0.002) (0.002)No Complaint 0.132*** 0.131***
(4.8E-04) (4.8E-04)No Complaint*Policy -0.035*** -0.035***
(0.001) (0.001)Time Trend -0.026*** 0.036*** -0.026*** -0.026***
(7.7E-05) (1.1E-04) (7.5E-05) (7.5E-05)Intercept 2.983*** 3.104*** 3.027*** 3.030***
(0.007) (0.007) (0.007) (0.007)Buyer FE XR2 0.029 0.720 0.059 0.068 0.068
Panel B: Dependent Variable: Exit in the Following 3 MonthsPolicy -0.030*** -0.489*** -0.024*** -0.020*** -0.020***
(0.001) (0.001) (0.001) (0.001) (0.001)Experienced -0.234*** -0.223*** -0.223***
(0.001) (0.001) (0.001)Experienced*Policy 0.001 -0.004*** -0.003***
(0.001) (0.001) (0.001)Negative -0.084*** -0.055***
(0.001) (0.001)Negative*Policy -0.027*** -0.035***
(0.002) (0.002)No Complaint 0.117*** 0.115***
(4.6E-04) (4.6E-04)No Complaint*Policy -0.017*** -0.017***
(0.001) (0.001)Time Trend 0.003*** 0.046*** 0.002*** 0.002***
(7.3E-05) (1.2E-04) (7.2E-05) (7.2E-05)Intercept 0.420*** 0.540*** 0.467*** 0.472***
(0.007) (0.007) (0.007) (0.007)Buyer FE XR2 1.3E-04 0.610 0.035 0.044 0.044
Notes: This table shows the probability that a buyer does not make another purchase in the following six orthree months of a purchase in each category. Buyers are divided into two groups: (1) experienced buyers,or buyers who spent more than $450 in the previous year; and (2) new buyers, or buyers who spent lessthan $450. A transaction is considered to have a complaint if one of the following exists: negative or neutralfeedback from buyer, low detailed seller ratings, or a dispute from buyer.41

Table 11: Robustness: Decomposing Adverse Selection and Moral Hazard
Panel A1. Change in Number of Low DSRs using Lagged Data, 1 monthAdverse Selection 1 Moral Hazard 1 Adverse Selection 2 Moral Hazard 2
Θ′Q′ − Θ′Q Θ′Q− ΘQ ΘQ′ − ΘQ Θ′Q′ − ΘQ′
77% 23% 56% 44%
Panel A2. Change in Number of Neg/Neut Feedback using Lagged Data, 1 monthAdverse Selection 1 Moral Hazard 1 Adverse Selection 2 Moral Hazard 2
Θ′Q′ − Θ′Q Θ′Q− ΘQ ΘQ′ − ΘQ Θ′Q′ − ΘQ′
79% 21% 93% 7%
Panel A3. Change in Number of Complaints using Lagged Data, 1 monthAdverse Selection 1 Moral Hazard 1 Adverse Selection 2 Moral Hazard 2
Θ′Q′ − Θ′Q Θ′Q− ΘQ ΘQ′ − ΘQ Θ′Q′ − ΘQ′
54% 46% 42% 58%
Panel B1. Simulated Change in Number of Low DSRs, 1 monthAdverse Selection 1 Moral Hazard 1 Adverse Selection 2 Moral Hazard 2
Θ′Q′ − Θ′Q Θ′Q− ΘQ ΘQ′ − ΘQ Θ′Q′ − ΘQ′
90% 10% 94% 6%
Panel B2. Simulated Change in Number of Neg/Neut Feedback, 1 monthAdverse Selection 1 Moral Hazard 1 Adverse Selection 2 Moral Hazard 2
Θ′Q′ − Θ′Q Θ′Q− ΘQ ΘQ′ − ΘQ Θ′Q′ − ΘQ′
86% 14% 97% 3%
Panel B3. Simulated Change in Number of Complaints, 1 monthAdverse Selection 1 Moral Hazard 1 Adverse Selection 2 Moral Hazard 2
Θ′Q′ − Θ′Q Θ′Q− ΘQ ΘQ′ − ΘQ Θ′Q′ − ΘQ′
61% 39% 78% 22%Panel C1. Simulated Change in Number of Low DSRs, 3 monthsAdverse Selection 1 Moral Hazard 1 Adverse Selection 2 Moral Hazard 2
Θ′Q′ − Θ′Q Θ′Q− ΘQ ΘQ′ − ΘQ Θ′Q′ − ΘQ′
65% 35% 81% 19%
Panel C2. Simulated Change in Number of Neg/Neut Feedback, 3 monthsAdverse Selection 1 Moral Hazard 1 Adverse Selection 2 Moral Hazard 2
Θ′Q′ − Θ′Q Θ′Q− ΘQ ΘQ′ − ΘQ Θ′Q′ − ΘQ′
66% 34% 72% 28%
Panel C3. Simulated Change in Number of Complaints, 3 monthsAdverse Selection 1 Moral Hazard 1 Adverse Selection 2 Moral Hazard 2
Θ′Q′ − Θ′Q Θ′Q− ΘQ ΘQ′ − ΘQ Θ′Q′ − ΘQ′
66% 34% 85% 15%
Notes: In Panels A1–A3, quality Θ and market share Q are measured using data from the month before thepolicy change. In Panels B1–B3 and C1–C3, these are measured based on the simulation approach.42

Figure 6: Share of Positive Feedback from Buyers, Electronics
Note: This figure shows the share of positive feedback ratings among all feedback ratings left by buyers as afunction of the number of days between buyers’ and sellers’ feedback ratings, before and after implementingthe eBay reputation mechanism change.X-axis: The number of days buyers leave feedback after sellersY-axis: Share of positive feedback from the total feedback left the same day by buyers for sellers
Appendix
Additional Robustness Checks: Change in Buyer and
Seller Composition
In this section, we show that changes in buyers’ or sellers’ composition did not cause the
increase in the share of positive feedback ratings left for sellers. To examine the impact from
a change in buyers’ composition, we divide buyers into four groups based on the total value
of the items they purchased on eBay in the past, with group I being the most active and
group IV being the least active; the thresholds for groups I–IV are $10,000, $2,500, $450,
and $0 total purchases in the 12 months prior to the transaction, respectively. As shown in
Figure 7, buyers in all groups leave more positive feedback ratings for sellers after the policy
change; therefore, the change in buyers’ composition cannot explain the change in the share
43

Figure 7: Share of Positive Feedback for Sellers, Different Buyer Groups
Note: This figure shows the share of positive feedback ratings left by buyers to the number of days betweenbuyers’ and sellers’ feedback ratings, before and after the eBay reputation mechanism change was imple-mented. We divided buyers into four groups (I–IV), from most active to least active. These graphs showthat the change in buyers’ actions overall is not due to their belonging to a specific buyer group.X-axis: The number of days the buyer has left feedback after the sellerY-axis: Share of positive feedback from the total feedback left the same day by buyers for sellers
of positive feedback ratings within each group. We can also follow buyers over time, but as
they become experienced, their actions may change; therefore, the above cross-section study
is more fitted to our study than a panel study.
Another interesting observation from Figure 7 is that before the policy change, group
I and II buyers left positive feedback for sellers more often than group III and IV buyers.
Assuming the share of positive feedback is positively correlated with having a good experience
on eBay, this observation suggests that more experienced buyers can better distinguish high-
quality sellers from low-quality ones, and on average they have a better experience on eBay.
After the policy change, the share of positive feedback ratings from group IV buyers has
increased dramatically, suggesting that these buyers encounter the largest positive change in
sellers’ quality. New buyers on eBay tend to be deal seekers; they may not understand the
value of reputation on eBay and may end up buying from low-quality sellers. As it is argued
in section 5.2, sellers with lowest-quality levels and who participated in retaliation before
44

Figure 8: Share of Positive Feedback for Powersellers and Non-Powersellers, Electronics
Note: This figure shows the share of positive feedback ratings left by buyers to the number of days betweenbuyers’ and sellers’ feedback ratings, before and after the eBay reputation mechanism change was imple-mented. Figure 8a includes only Powersellers, and Figure 8b includes only non-Powersellers.X-axis: The number of days buyers leave feedback after sellersY-axis: Share of positive feedback from the total feedback left the same day by buyers for sellers
the policy change had to exit the market. This leads to average higher-quality sellers, due
to a major reduction in the population of low-quality sellers; therefore, the quality of sellers
that new buyers on eBay interact with has significantly improved. Consequently, new buyers
have an improved perception of sellers’ quality, and buyers’ exit rate decreases significantly,
as shown in section 5.4.24
Subsequently, we show that changes in sellers’ composition did not lead to the increase
in positive feedback ratings for sellers. Additionally, we show that this change in feedback
ratings can be observed for almost all seller groups that we consider here, which suggests
that after the policy change, all different types of sellers have improved their quality. We
classify sellers based on their reputation status, size, and experience on eBay.
Reputable and larger sellers on eBay receive the Powerseller badge. These sellers tend to
perform better than non-Powersellers.25 We consider sellers with and without the Powerseller
badge, and changes in the share of positive feedback before and after the policy change.
24Nosko and Tadelis [2015] ran an experiment on eBay in which they improved the average quality ofsellers that new buyers interact with, and they found a consistent reduction in exit rates for these buyers.
25Saeedi [2011] explores the effect of this reputation badge in detail. To become a Powerseller, sellers mustsell at least 100 items or $1,000 per month, for the past three months; have a 98% or higher feedback rating;and have low dispute rates.
45

Figure 9: Share of Positive Feedback for Powersellers and Non-Powersellers Over Time
Note: This figure shows the share of positive feedback ratings left by buyers over time for Powersellers andnon-Powersellers.X-axis: Time period. The eBay reputation mechanism change happened in May 2008.Y-axis: Share of transactions with positive feedback for Powersellers and non-Powersellers
Figure 8(a) shows the share of positive feedback for Powersellers in the market as a function
of the number of days between the day buyers receive feedback from sellers and the day buyers
leave feedback. Comparing Figure 8(a) and Figure 8(b) demonstrate that Powersellers tend
to receive fewer negative or neutral feedback ratings, but the pattern does not differ from
non-Powersellers’ feedback, and the policy change does not affect the relative difference.
Powersellers still get a higher share of positive feedback after the policy change. We can
also explore the share of positive feedback ratings the two groups receive over time (Figure
9); both groups of sellers perform better on average after the policy change. In addition,
in Figure 10(b) we show that the share of feedback left for both groups of sellers is similar.
These two observations confirm the main finding in section 5.1: All seller groups improve
their quality after the policy change.
To further explore the differences in the composition of sellers, we divide them into
different groups (I–IV) based on their volume of sales; sellers in group I had the highest
46

Figure 10: Feedback Adoption Rate, Electronics
Note: This figure shows the share of transactions with feedback for different seller groups. Sellers are dividedinto two groups, namely Powersellers and non-Powersellers. Figure 10a shows the feedback ratings left bysellers, and Figure 10b shows the feedback ratings left by buyers.X-axis: Time period. The eBay reputation mechanism change happened in May 2008.Y-axis: Share of transactions with feedback, Powersellers vs. non-Powersellers
number of transactions in 2008, while sellers in group IV had the fewest.26 First, we consider
the analogue of Figure 6 for different groups of sellers in Figure 11. Similar to the Powerseller
case, the trend does not vary: All groups of sellers receive fewer negative feedback ratings
after the policy change, confirming the finding in section 5.1. However, the trend over time
is different across different groups. Figure 12 shows that starting May 2008, groups I–III
received more positive feedback ratings; however, group IV, the smallest sellers, received
more negative feedback ratings for the first few months after the policy change, and after
about six months they started recovering. Figure 13(b) shows that this is not a result of
a change in the overall share of feedback left for sellers of different groups. This might be
because of the exit of low-quality small sellers and subsequent entry of new high-quality
small sellers, confirming the finding in section 5.2.
26The definitions of the four groups are as follows:Group I: At least 125,001 salesGroup II: 250–125,000 salesGroup III: 12–249 salesGroup IV: Less than 12 sales in the past year
47

Figure 11: Share of Positive Feedback for Sellers, Different Seller Groups
Note: This figure shows the share of positive feedback ratings left by buyers to the number of days betweenbuyers’ and sellers’ feedback ratings, before and after the eBay reputation mechanism change was imple-mented. We divided sellers into four groups (I–IV), from most to least active. This classification shows thatthe variation in buyers’ actions is not due to a variation in a specific seller group.X-axis: The number of days buyers leave feedback after sellersY-axis: Share of positive feedback from the total feedback left the same day by buyers for sellers
48

Figure 12: Share of Positive Feedback for Different Seller Groups
Note: This figure shows the share of positive feedback ratings left by buyers over time for different sellergroups. Sellers are divided based on activity into four groups (I–IV), from most to least active.X-axis: Time period. The eBay reputation mechanism change happened in May 2008.Y-axis: Share of transactions with positive feedback for different seller segments
Figure 13: Feedback Adoption Rate, Different Seller Segments, Electronics
Note: This figure shows the share of transactions with feedback for different seller groups. Sellers are dividedinto four groups (I–IV) as a function of their size, from the least active (I) to most active (IV). Figure 13ashows the feedback ratings left by sellers, and Figure 13b shows the feedback ratings left by buyers.X-axis: Time period. The eBay reputation mechanism change happened in May 2008.Y-axis: Share of transactions with feedback from different buyer segments
49
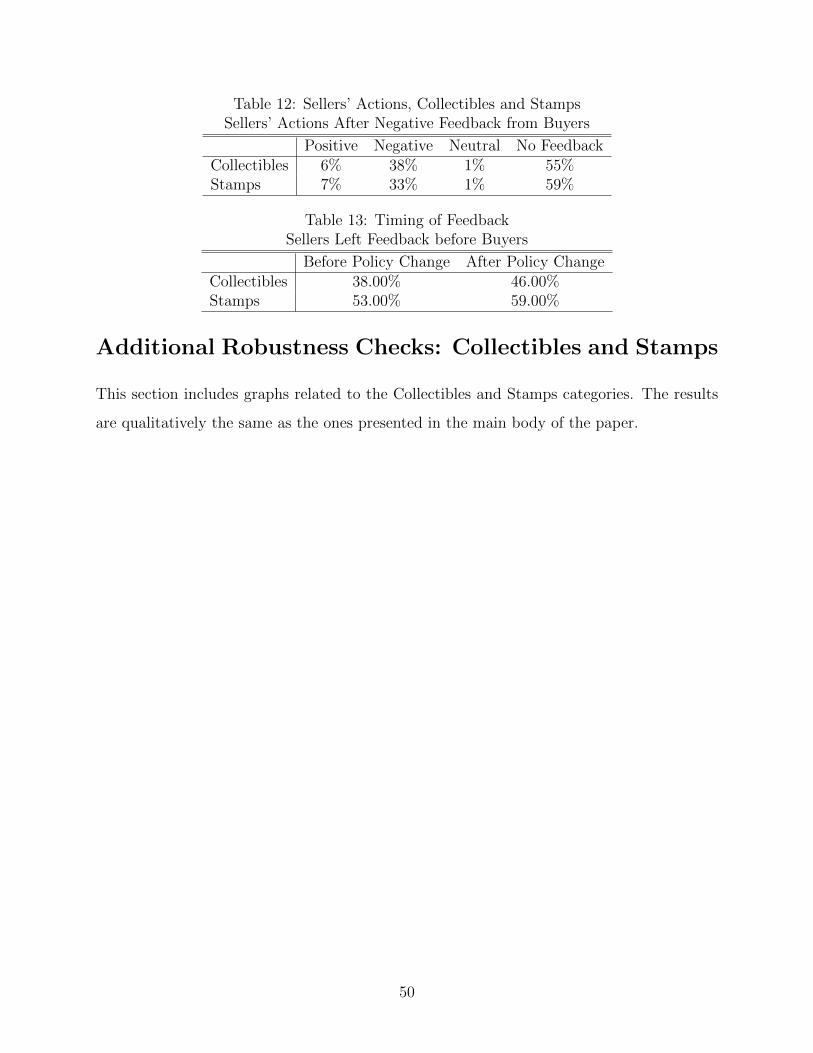
Table 12: Sellers’ Actions, Collectibles and StampsSellers’ Actions After Negative Feedback from Buyers
Positive Negative Neutral No FeedbackCollectibles 6% 38% 1% 55%Stamps 7% 33% 1% 59%
Table 13: Timing of FeedbackSellers Left Feedback before Buyers
Before Policy Change After Policy ChangeCollectibles 38.00% 46.00%Stamps 53.00% 59.00%
Additional Robustness Checks: Collectibles and Stamps
This section includes graphs related to the Collectibles and Stamps categories. The results
are qualitatively the same as the ones presented in the main body of the paper.
50
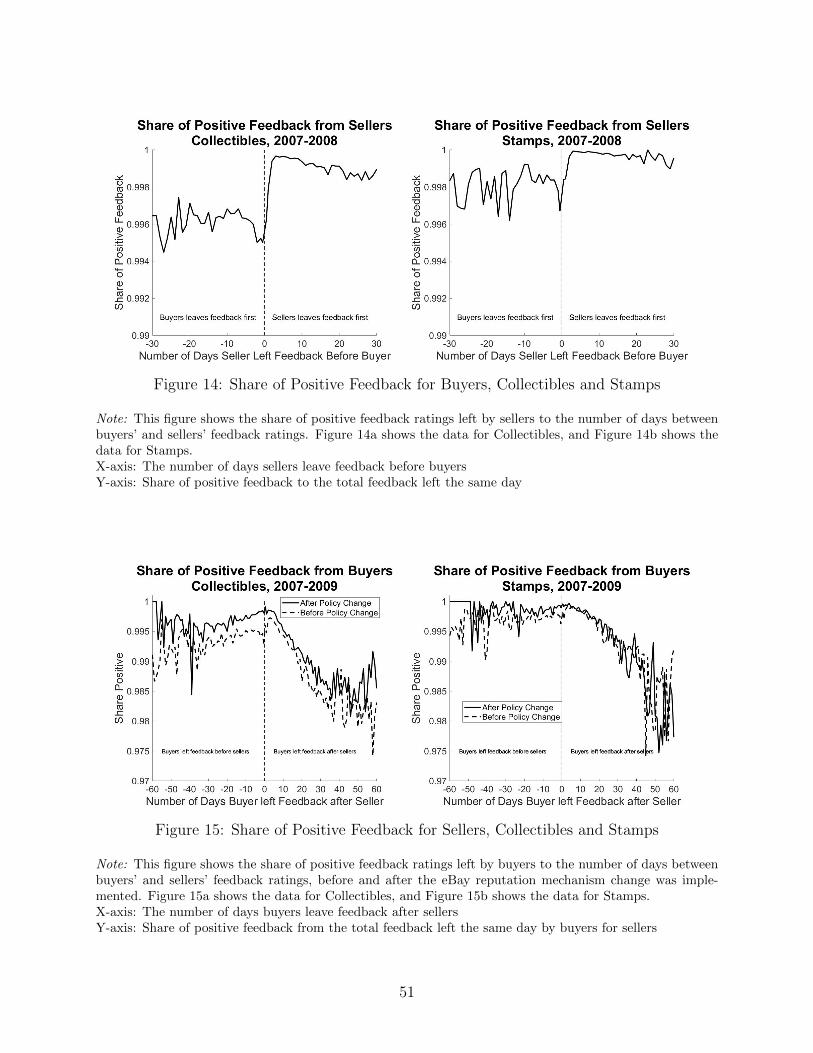
Figure 14: Share of Positive Feedback for Buyers, Collectibles and Stamps
Note: This figure shows the share of positive feedback ratings left by sellers to the number of days betweenbuyers’ and sellers’ feedback ratings. Figure 14a shows the data for Collectibles, and Figure 14b shows thedata for Stamps.X-axis: The number of days sellers leave feedback before buyersY-axis: Share of positive feedback to the total feedback left the same day
Figure 15: Share of Positive Feedback for Sellers, Collectibles and Stamps
Note: This figure shows the share of positive feedback ratings left by buyers to the number of days betweenbuyers’ and sellers’ feedback ratings, before and after the eBay reputation mechanism change was imple-mented. Figure 15a shows the data for Collectibles, and Figure 15b shows the data for Stamps.X-axis: The number of days buyers leave feedback after sellersY-axis: Share of positive feedback from the total feedback left the same day by buyers for sellers
51

Figure 16: Share of Non-Positive Feedback for Sellers vs. Timing of Feedback
Note: This figure shows the share of positive feedback ratings left by buyers to the number of days betweenbuyers’ and sellers’ feedback ratings, before and after the eBay reputation mechanism change was imple-mented. Figure 16a shows the data for Collectibles, and Figure 16b shows the data for Stamps.X-axis: The number of days buyers leave feedback after the end of the transactionY-axis: Share of non-positive feedback from the total feedback left the same day by buyers
Figure 17: Adoption Rate for Feedback, Collectibles and Stamps
Note: This figure shows the share of transactions with feedback left by sellers and buyers over time. Figure17a shows the data for Collectibles, and Figure 17b shows the data for Stamps.X-axis: Time period. The eBay reputation mechanism change happened in May 2008.Y-axis: Share of transactions with feedback from sellers and buyers
52
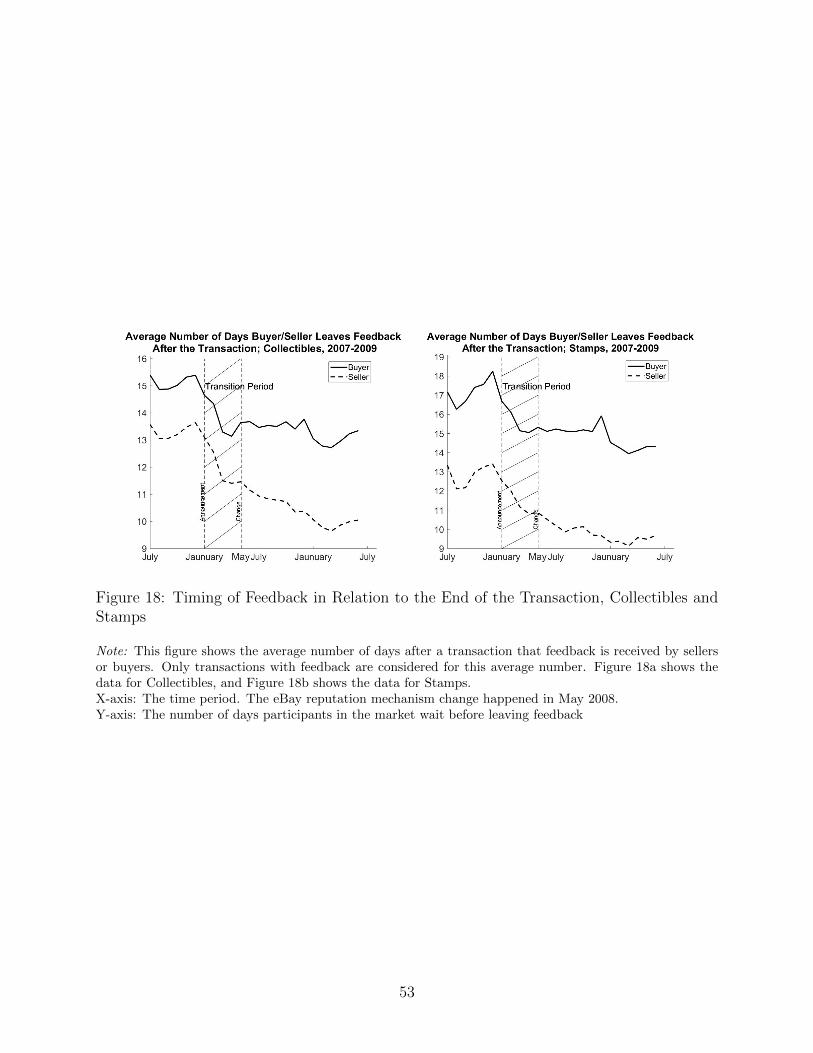
Figure 18: Timing of Feedback in Relation to the End of the Transaction, Collectibles andStamps
Note: This figure shows the average number of days after a transaction that feedback is received by sellersor buyers. Only transactions with feedback are considered for this average number. Figure 18a shows thedata for Collectibles, and Figure 18b shows the data for Stamps.X-axis: The time period. The eBay reputation mechanism change happened in May 2008.Y-axis: The number of days participants in the market wait before leaving feedback
53