Embed Size (px)
Citation preview
ADVERSE EFFECT OF ANTHROPOGENIC ACTIVITIES ON WATER QUALITY
OF THE PEKAN RIVER
IZZATULHANIS BINTI ROSLI
Report submitted in fulfillment of the requirements for the award of the degree of
Bachelor of Engineering (Hons) in Civil Engineering
Faculty of civil Engineering and Earth Resources
UNIVERSITI MALAYSIA PAHANG
JUNE 2015
v
ABSTRACT
A study on anthropogenic activities and water quality was carried out in the Pekan river,
taking into account the location of the river which is at the centre of the Pekan city. The
objectives of the study were to evaluate the water quality based on National Water
Quality Standard (NWQS) and Water Quality Index (WQI) Malaysia of surface water
quality in the Pekan river, and to identify the sources of pollution for sustainable
management in the Pekan river. Three stations have been chosen to be tested its surface
water condition. Station 1 was at the upper stream, and Station 3 on the downstream.
Data of six in-situ parameters were collected; dissolved oxygen (DO), temperature, pH,
electrical conductivity (EC), turbidity and salinity. The other parameters such as total
suspended solids (TSS), Biochemical Oxygen Demand (BOD), Chemical Oxygen
Demand (COD), Ammoniacal Nitrogen (AN), Sulphate, Phosphate and Heavy metals
were test in laboratory. The results showed that BOD value was higher on Station 1
(11.02 mg/l) compared to other stations. The BOD value of the Pekan river was higher
than the NWQS threshold level. The highest TSS value was at Station 3 (77.75 mg/l).
Turbidity on Station 3 was higher (272.5 NTU). Overall, Pekan river was categorized as
Class III based on WQI Malaysia, meaning the water cannot be used without proper
treatment. The authorities should take action in controlling the condition of the river
and establish the awareness of importance of river water among the community
vi
ABSTRAK
Satu kajian mengenai aktiviti antropogenik dan kualiti air telah dijalankan di sungai
Pekan, dengan mengambil kira lokasi sungai yang berada di tengah bandar Pekan.
Objektif kajian ini adalah untuk menilai kualiti air berdasarkan Standard Kualiti Air
Kebangsaan (NWQS) dan Indeks Kualiti Air (WQI) kualiti air di permukaan Sungai
Pekan, dan untuk mengenal pasti punca pencemaran untuk pengurusan mampan di
Sungai Pekan . Sungai Pekan telah dipilih kerana ia terletak bersebelahan dengan
pembandaran di bandar Pekan. Aktiviti antropogenik telah menukar kualiti sungai
Pekan. 3 stesyen telah dipilih untuk diuji keadaan air permukaannya. Stesen 1 adalah
pada aliran yang paling atas, dan Stesen 3 berada di aliran paling remdah. 6 parameter
telah ujian di tapak; Oksigen Terlarut (DO), suhu, pH, kekonduksian elektrik (EC),
kekeruhan air dan tahap kandungan garam di dalam sungai. Parameter lain seperti
Jumlah Pepejal Terampai (TSS), Permintaan Oksigen Biokimia (BOD), Permintaan
Oksigen Kimia (COD), Ammoniakal Nitrogen (AN), Sulphate, Fosfat dan logam berat
telah dijalanlan di Makmal Persekitaran. Hasilnya menunjukkan bahawa nilai BOD
adalah paling tinggi di Stesen 1 dengan 11.02 mg / l berbanding stesen lain. Hasil BOD
sungai Pekan telah dikelaskan dalam Kelas IV jika dibandingkan dengan NWQS. Nilai
TSS paling tinggi adalah pada Stesen 3 (77,75 mg / l). Serta hasil untuk kekeruhan,
Stesen 3 mempunyai bacaan tertinggi (272.5 NTU). Secara keseluruhan, Pekan sungai
dikategorikan dalam Kelas III yang bermaksud air telah dicemari dan memerlukan
rawatan jika mahu digunakan sebagai bekalan air minuman. Pihak berkuasa perlu
mengambil tindakan dalam mengawal keadaan sungai dan mewujudkan kesedaran
mengenai kepentingan air sungai di kalangan masyarakat
vii
TABLE OF CONTENT
Page
SUPERVISOR’S DECLARATION ii
STUDENT’S DECLARATION iii
DEDICATIONS iv
ACKNOWLEDGEMENTS v
ABSTRACT vi
ABSTRAK vii
TABLE OF CONTENTS viii
LIST OF TABLES xii
LIST OF FIGURES xiii
LIST OF ABBREVIATION xiv
CHAPTER 1 INTRODUCTION
1.1 Introduction 1
1.2 Problem statement 2
1.3 Objectives of study 3
1.4 Scopes of study 3
1.5 Significant of study 4
CHAPTER 2 LITERATURE REVIEW
2.1 Introduction 5
2.2 Anthropogenic activities and pollution 6
2.3 River water pollution 6
2.3.1 Sources of water pollution 7
2.3.2 Point sources 7
2.3.3 Non point sources 7
2.4 Water Quality Classification 8
viii
2.5 Parameter 9
2.5.1 pH value 9
2.5.2 Dissolved Oxygen 10
2.5.3 Biochemical Oxygen Demand (BOD) 11
2.5.4 Chemical Oxygen Demand (COD) 11
2.5.5 Total Suspended Solid (TSS) 12
2.5.6 Water Temperature 12
2.5.7 Ammonia Nitrate 13
2.5.7.1 Sources of Ammonia in river 13
2.5.8 Turbidity 13
2.5.9 Heavy Metals 14
2.5.10 Electrical conductivity 15
CHAPTER 3 METHODOLOGY
3.1 Introduction 16
3.2 Study area 17
3.3 Sampling area 19
3.4 Water Quality Index 19
3.5 Parameter test 19
3.5.1 Dissolved Oxygen 19
3.5.1.1 Procedures 20
3.5.2 Biochemical Oxygen Demand (BOD) 20
3.5.2.1 Procedures 20
3.5.2.2 Calculation of BOD 21
3.5.3 Chemical Oxygen Demand (COD) 21
3.5.3.1 Procedures 21
3.5.3.2 Calculation of COD 22
3.5.4 Total Suspended Solid (TSS) 22
3.5.4.1 Procedures 22
3.5.4.2 Calculation of TSS 23
3.5.5 Ammonia Nitrate (AN) 23
3.5.6 Turbidity 23
ix
3.5.6.1 Procedures 24
3.5.7 pH and Temperature 24
3.5.8 Heavy metals 24
CHAPTER 4 RESULTS
4.1 Introduction 25
4.2 Sampling Process 26
4.3 In Situ Parameters 26
4.3.1 Temperature 26
4.3.2 pH 28
4.3.3 Electrical Conductivity 29
4.3.4 Turbidity 30
5.3.5 Dissolved Oxygen 31
4.4 Ex Situ Parameters 32
4.4.1 Total Suspended Solids 32
4.4.2 Biochemical Oxygen Demand 33
4.4.3 Chemical Oxygen Demand 34
4.4.4. Ammoniacal Nitrogen 35
4.4.5 Sulphate 36
4.4.6 Phosphate 37
4.4.7 Heavy Metals 38
CHAPTER 5 CONCLUSION AND RECOMMENDATIONS
5.1 Conclusion 40
5.2 Recommendations 41
REFERENCES 43
APPENDICES
A Map of Pahang River 44
x
B Map of Pekan River 45
C Overview Of Site 46
D Site Sampling 47
E In-Situ Tests 49
F Ex-Situ Tests 50
G DOE WQI Class 53
H Sub Index DOE-WQI Calculation 54
I Sub Index WQI Value 55
J Water Quality Index Classes 56

xi
LIST OF TABLES
Table No. Title Page
4.4.7.1 Heavy Metals Result 38
4.5.1 Sub-Index Value of WQI 38

xii
LIST OF FIGURES
Fig. No. Title Page
2.3.1 Point sources and Non-point sources 9
3.2.1 Flowchart of work sequences 18
4.3.1 Pekan River’s Temperature 27
4.3.2 Comparison of pH value 28
4.3.3 Electrical Conductivity Result 29
4.3.4 Turbidity Result 30
4.3.5 Dissolved Oxygen Result 31
4.4.1 Total Suspended Solids Result 32
4.4.2 Biochemical Oxygen Demand Result 33
4.4.3 Chemical Oxygen Demand Result 34
4.4.4 Ammoniacal Nitrogen Result 35
4.4.5 Sulphate Result 36
xiii
LIST OF ABBREVIATION
AN Ammoniacal Nitrogen
BOD Biochemical Oxygen Demand
COD Chemical Oxygen Demand
DO Dissolved Oxygen
DOE Department of Environment
EC Electrical Conductivity
NWQS National Water Quality Standard
TSS Total Suspended Solids
WQI Water Quality Index
1
CHAPTER 1
INTRODUCTION
1.1 INTRODUCTION
Water is a well known essential element to human, animals, and many living
things on Earth. Water plays important roles in living things and most abundant
molecules on Earth’s surface that need to be study because of its speciality. One
molecule of water contained two hydrogen atoms that covalently bonded to one oxygen
atom that produce chemical formula of H2O. It has many sources of water in the Earth.
There are: surface water; water that came from rain or hail that usually collected in
catchment, river or lakes; that usually be a community water supplies, springs; water
that collected in the bottom of a hills or sloping. Water covers 71% of Earth’s surface
and most friction of water percentage came from seas and oceans water. Only about
0.3% of water on Earth came from river and lakes.
However this small percentage of water sources may not be neglected their roles
in human and living things life. Rivers also play important roles towards living things
activities such as use as roads, recreational parks, some rivers produce electric power
and also can be used as source of drinking water. One third of the drinking water is
come from rivers, lakes and canals.
There is more than 150 rivers system in Malaysia that contributed to 97% of raw
water supply source. Even there is a large amount of water, but it is still not enough to
2
ensure sufficient water supply for Malaysians. This is due to non-uniform temporal and
spatial distribution of rainfall. Pollution is the biggest risk to our river. The river water
quality obviously has the decline in the environmental health of a river basin. The
sources of pollution come from residential, industrial sewerage and effluents from
livestock farms, road construction and heavy metals from nearby factories. According to
the Environmental Quality Report 2009, 46% river water of Malaysia was polluted
which was higher than previous couple of years.
Pekan’s river is one of the most important rivers in Pahang state. Along this
river, there is lot of human kind’s activities such as residential and industrial parks.
Along the Pekan river, there are so many human activities that directly and indirectly
affect the quality of the Pekan river.
This research is prepared to study on water pollution due to industrial activities
and Water Quality Index (WQI) especially in Pekan river, Pahang. Water Quality Index
(WQI) is a water pollution indicator that used to determine the physic-chemical
parameters of surface water.
1.2 PROBLEM STATEMENT
The quality of rivers water is depending on many factors such as its topography,
land use, climate, geology and the biological process. However, there is also another
possible factor such as human activities. Many factories built near the rivers to get the
river water and used as machinery power or to cool down the machinery. However,
there are so many rivers polluted due to industrial activities. The industrial may not
properly manage their industrial liquid wastage and drained the wastage into the nearest
river. This cause pollution to the rivers and effect their water quality index.
Pekan’s river has been chosen as study area in this research due to its fast
development around the Pekan area. Many people live around this river and this cause
impairment of water quality in this river. People involve directly and indirectly to this
river. Hence, this river is very important to the nearest community.
3
The industrial accidentally discharged the chemical waste product into the
Pekan’s river. Usually, chemical waste product contained high pollutant substances
such as mercury, copper, lead, zinc and cadmium that would cause pollution to the
Pekan river water and may affect the living things around the ecology. These
substances will increase the water temperature and decreasing the dissolved oxygen
level in the Pekan’s river. Heavy metals will pose health effect to human beings and
aquatic life. The underwater life that exposed to heavy metals pollutants will affect its
reproduction rates and life spans.
Therefore, it is important to determine the pollution level and find the sources of
pollution in order to recommend the solutions to this problem. The recommend
solutions may be useful for river quality in future.
1.3 OBJECTIVES OF THE STUDY
The objectives of the study are as follow:
To classify the water quality on the Sungai Pekan based on National Water
Quality standard (NWQS) and Water Quality Index (WQI) Malaysia.
To identify the sources of pollution for sustainable management in the Pekan
river.
1.4 SCOPE OF STUDY
The scope of study area is Pekan river that is located in south of Kuantan,
Pahang. Pekan’s river was chose due to fast development along the river by human kind
activities. Pekan’s river has rapidly urban development and there is lot of sources of
river pollution such as surface runoff, industrial activities, municipal waste and
agricultural. The purpose of this study is to identify the sources of pollution for
sustainable management in the Pekan river. Besides, this research also to classify the
water quality based on Malaysian National Quality standard and Water Quality Index
(WQI). The study parameters are Biochemical Oxygen Demand (BOD), Chemical
Oxygen Demand (COD), Dissolved Oxygen (DO), Ammonia Nitrate, Sulphate ,
4
Phosphate, Suspended Solid (SS), turbidity, heavy metals, temperature, electrical
conductivity and pH value. River classification will follow the DOE-WQI. The samples
will be examined at field and laboratory. Six parameters that will be tested in-situ are
Dissolved oxygen (DO), turbidity, temperature, pH value and electrical conductivity
and salinity. The other parameters such as BOD, COD, Ammonia Nitrate, heavy metals,
and SS will be tested in laboratory. In order to doing all this testing, Environmental
Laboratory on CERRM Lab will be use.
1.5 SIGNIFICANT OF STUDY
The significant of this study are:
i. To analysis the pollution level at the Pekan River, hence determine the
source of the pollution itself.
ii. To know the current condition of the water quality of the Pekan River
and prepared the precaution steps for any possible adverse.
iii. To establish the awareness in community about the importance of river
water's quality in their daily life.
5
CHAPTER 2
LITERATURE REVIEW
2.1 INTRODUCTION
Water is a crucial element in the living things life. A human can live without
foods, however cannot survive without water. Water consists of chemical substances
with chemical formula H2O. The speciality about water is it can be found in three
different states; solid, liquid and gas. Hydrologic cycle explains the connections
between water in atmosphere, hydrosphere and lithosphere (Myles. R, 2002).
Hydrologic cycle explains the movement of water on earth. The constant water is
evaporating into the surrounding such as from rivers, ocean, or streams. When the
surrounding or atmosphere cannot longer bear with the moisture in the clouds, it will
come out in form of rain, snow hail or sleet. However, some water will trap in the ice
form. Water melts during the spring and produce run off, that absorbed into the
groundwater, or flow into the sea again.
However, nowadays there are too many pollutions that happen on our country
especially water pollution and industrial pollution. This pollution is damaging the Earth
and living things activities. According to Seeboonruang,U (2012), all this pollutions is
due to the increasing of growth population that happen worldwide. The increasing of
population also increased the needed in goods supply. Logically, industrial activities
also increase hence the water pollution become worst.
6
2.2 ANTHROPOGENIC ACTIVITIES AND POLLUTION
Anthropogenic activities defined as process, objects, or materials that came from
human activities or behaviour that harm the natural environments. These anthropogenic
sources may come from industrial, mining activities, construction, habitations or
agriculture. Industrial pollution is one of the main causes of pollution in the world.
Because of its scope and needed among the worldwide, this worse the situation
especially in nation which are rapidly industrializing such as Malaysia. According to
Hossain M.A et al. (2013), the anthropogenic activities led to the main caused of water
pollution
Nowadays, the demand is exceeding the supply. Hence, industries have to
increase their consumption and meet people’s need. The increasing of products
consumption led to increasing of wastage. The problems arise when this wastage is not
managed properly. The quality of surface water is threatening by the various wastewater
that release to the land use ( Seeboonruang,U, 2012). However, according to Earnhart
(2013) the industrial wastewater discharges has been decreasing since early 1970s in
develop country but still not cost-effectively due to monitoring and controlling of
effluent limits.
.
2.3 RIVER WATER POLLUTION
Since decade ago, water pollution is one of the most critical conflicts that
happen in many develop country. Many of the main rivers in developing countries face
the degradation of the water quality (Schaffnera et all, 2009, Sartor et all, 1974). This is
due to their urbanization and fast development. Precisely, the water pollution can
happen because of urban runoff. Urban runoff may lead to a variety of conflicts,
including pollution when receiving water directly, overloading the treatment facilities,
improperly management of waste, and various pollutants contained in the runoff itself.
In urban area, rainfall runoff is defined as storm water is one of the major pollution
because this type of runoff usually polluted with car oil, dust and faeces of animals,
while for industrial areas it contained chemicals and toxic.
7
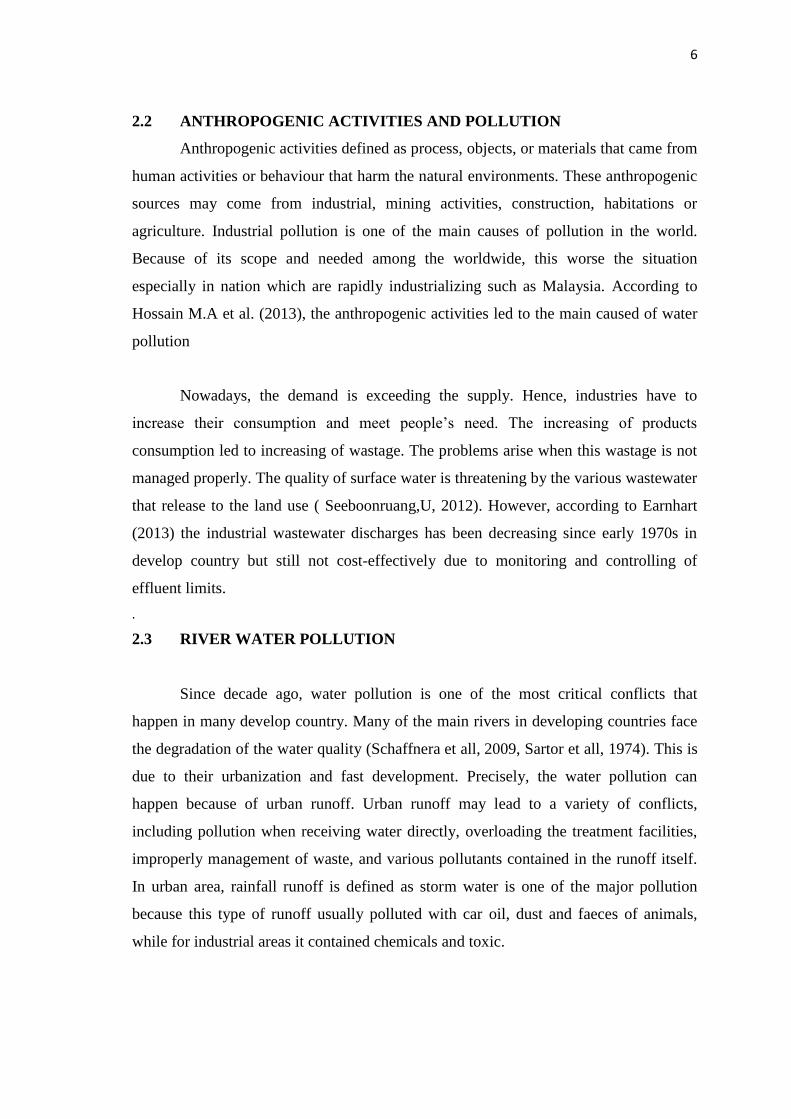
2.3.1 Sources Of Water Pollution
Water pollution can be categorized as point source and non point source. Point
source is defined as single and identifiable sources of pollution. Pollution that happen
because of municipal waste discharges and industrial wastages. Usually this type of
pollution can be measured, identifiable of the locations and enter the transport routes at
discrete. While non point sources is difficult to measured, has multiple discharge points
and unidentified. It occurs when rainfall or irrigation is drainage to the water resources.
This type of sources usually associated with land and soil. ((Darradi et al, 2012, Hao et
al 2004).
2.3.2 Point Sources
Here are the examples of point sources of pollutions:
Effluent from a factory that contained chemicals pollutants and directly released
into the water or air.
Chemicals that directly drained into the water without proper treatment.
Waste oil from car workshop that dumped into the ground and contaminates the
soil.
Agricultural wastes that come from fertilizers.
2.3.3 Non Point Sources
No- point sources came from rainfall runoff that moving into the ground. As the runoff
moving, it also carries the natural and unnatural pollutants and brings them into the river
or lakes. Here are the examples of non-point sources of pollutions:
Vehicles engines that produce variety of chemicals product such as oxides of
nitrogen.
Fuel burning with high sulphur dioxide content.
Acid rain that harmful to aquatic life.
Urban runoff pollutions.
8
Construction site that has poorly management
Fig 2.3.1: Point sources and Non- Point sources
2.4 WATER QUALITY CLASSIFICATION
Water Quality Index has been used by Department of Environment (DOE) to
evaluate the quality level of river water. WQI is one of the effective’s tools to gain the
feedback about water quality (M.A Hossain et all, 2013). According to DOE, in 2006
there is 1064 of water quality monitoring station has been located within 146 of river
basins. 619 stations (58%) of them were found to be clean, 359 (34%) is slightly
polluted and the rest which is 86 (8%) polluted. In this research, they found that stations
on upstream is much clean than downstream.
There are five (5) classes on WQI and Interim National Water Quality Standards
for Malaysia (INQWS). In our country, WQI is computed by using six parameters
which are DO, BOD, COD, SS, AN, and pH. The class of water quality is separated by
Class I, II, III, IV or V. Their scale is from 0 to 100 and the highest represent cleaner
water (ASMA,2004).
9
2.5 PARAMETER
In this research, there are few parameters that will be tested to determine the
water quality of the Pekan’s river. There are pH, Dissolved Oxygen (DO), Biochemical
Oxygen Demand (BOD), Chemical Oxygen Demand (COD), Total Suspended Solid
(TSS) Ammonia Nitrate (NH3), sulphate, phosphate, temperature, turbidity, electrical
conductivity and heavy metals.
2.5.1 pH Value
A pH test is to determine the alkalinity and acidity of the water. A neutral pH
value is 7, below 7 is acidic and above 7 is alkaline. For most neutral water will have
pH value from 5.0 to 8.5. pH of water samples usually can be determined on site or
determined in laboratory. Aquatics lives are depend on certain pH value of water to get
their optimal life. Some aquatic life will die if the pH value of water is change, even
slightly.
A pH on stream will vary depend on a few factors. One of the factors is the
bedrock and soil composition where water moves, which are on bed and its
groundwater. Some of rock types will have effect on pH value. For example, limestone
can neutralize the acids, while granite has no effect on pH value.
The other factors is the amount of organic and plant growth in the water. The
quantity of this growth has effect on pH value. When this material is decomposed, they
will release carbon dioxide. This carbon dioxide will mix with water and form carbonic
acid. Even the carbonic acid is a weak acid, however the large amounts of it will also
affect the pH by lowering it.
Next factors are the removal of the chemicals wastages into the water. Every
product has its own chemical composition and when this chemical is throwing into the
water, the pH value will change along with other chemical parameters of water. Many
of industries process need water with exact pH value and add the chemicals to change
10
the pH to achieve their needs. Then they will discharged this altered pH water as an
effluent and this polluted the water.
Another factor that effect the pH is the quantity of acid precipitation that falls
into the water. Acid rain is caused by nitrogen oxides (NOx) and sulphur dioxide (SO2)
that combined with water vapour in the air. When this rain is fall into the water, they
will combine with chemical parameters in the water and change the pH value.
2.5.2 Dissolved Oxygen (DO)
Source of oxygen come from many ways, however the biggest source is oxygen
that absorbed from the atmosphere. Second largest source is by aquatic plants, which
are from algae and photosynthesis of plant. The dissolved oxygen test is to determine
the amount of oxygen that dissolved in the water. Oxygen is needed in living things;
human, plants and animals. Oxygen is measured as dissolved form as Dissolved Oxygen
(DO). If more oxygen is needed than produced, DO levels will decrease and it can be
harmful to the fish and other aquatics life. In other word, if there is high level of oxygen
in water, it can decrease the aquatic life. Total concentration of dissolved gas in water
must not exceed 110% because if the concentration higher than this number, it can be
dangerous to the aquatic life.
The deficiency of DO shows unhealthy rivers. There are so many factors that
affect Do levels. Waves of water can mix the atmospheric oxygen with river water.
Besides, rooted aquatic plants and algae can produces oxygen by photosynthesis
process.
Cold water has more oxygen than warm water. Water with high salt
concentration will have lower DO concentration even at same temperature with fresh
water. Low DO concentration is caused by too much algae production. The algae
growth is effected by phosphorus. Dissolved oxygen amount usually determines the
number and types of aquatic life that living in the water.
11
DO concentration is affect by this factors :
Atmospheric pressure – higher atmospheric pressure on water will make higher
DO concentration.
Plant growth – growth of population will increase the photosynthesis. Higher
photosynthesis will have higher DO concentration.
Temperature – DO level decrease if temperature increased.
Turbulence – increased turbulence of water will increased the DO
concentration.
2.5.3 Biochemical Oxygen Demand (BOD)
Biochemical Oxygen Demand test used to measure the quantity of oxygen need
by microorganism to decompose the organic materials. It is also includes the oxygen
needed for oxidation process of various chemical in water.BOD only measures the
amount of oxygen consumed by ecosystem oxidation and most used in rich organic
matter water. BOD test is measured by taking the value of dissolved oxygen (DO) of the
latest sample and compared to the previous sample taken a few days before. The
difference of the oxygen reading will be recorded in units of mg/L.
Urban runoff carry several of wastes from street, nutrients from fertilizers, dead
leaves, human kind activities will increase the oxygen demand. BOD affected the DO
level in the water. the higher the BOD, more fast oxygen is run down in the stream. In
other words, less oxygen is available to higher forms of aquatic life. If BOD is too much
higher, the aquatic life will die.
2.5.4 Chemical Oxygen Demand (COD)
Chemical Oxygen Demand (COD) test is usually used to measure the amount of
organic compounds in water. In other words, the value of COD indicates the amount of
oxygen needed for the organic substances to oxidize in the water. Usually COD used to
gain the amount of organic pollutants in surface water. This makes the COD an
important element in determination of water quality.
12
The procedure of COD test based on decomposition of chemical of organic and
inorganic contaminants either suspended or dissolved in water. The result of this test
indicates the water-dissolved oxygen amount which is expresses as parts per million
that consumed by contaminants. The higher the COD shows that higher polluted the
water.
2.5.5 Total Suspended Solid (TSS)
Total suspended solid is a particle that bigger than 2 microns that found in the
water. Most of suspended solids are made up from inorganic materials. Bacteria and
algae may also contribute to total solids concentration. Total suspended solid used to
measure the turbidity of the water. This is because, suspended solids may turned the
water to be milky or muddy looking due to scattering of light from small particles. pH
and other qualities of water measurement cannot be seen, however this Suspended Solid
can be observed directly. Polluted water will have higher turbidity level compared to
clean water because contained unsettled fine suspended mineral. Due to Ali Hannouche
et al. (2011) the suspended solid has strong linear relationship with turbidity, however it
is varies on the weather and condition of the river itself; dry or wet
2.5.6 Water Temperature
The water temperature is important because it will be create the maximum
oxygen holding capacity of water, besides it also has direct influence on rates of
biochemical reaction. Temperature will affect both, chemical and biological
characteristics. Aquatic organisms are depends on certain temperature for their optimal
health. For each organism, there is a thermal death point. If the temperature is exceeding
their thermal point, the organisms will die.
All below are the effect of temperature on few elements :
Dissolved Oxygen - increasing of water temperature will decrease the DO
concentration
13
Process of chemical - increasing of water temperature will increase the chemical
reactions due to solubility of the chemicals.
Process of biological - metabolism, growth and reproduction also increase when
the temperature increase.
Aquatic ecosystem - aquatic life cannot survive on higher temperature because
each aquatic life have their own optimal temperature.
2.5.7 Ammoniacal Nitrogen (AN)
Ammoniacal nitrogen is a determination of the ammonia amount, which is a
toxic pollutant that usually found in the landfill leachate, or in the waste product. AN
also is a measurement of water quality in natural bodies such as lakes, manmade
reservoirs, and rivers. This element commonly used in waste water treatment and
system of purification. However, this ammonia can be poison to human and change the
equilibrium of water system.
While nitrogen is an essential nutrient for all types of life as a building block for
proteins of plant and animal. However, if the nutrient is too much, it will be toxic to the
living organisms. The excess present of the nitrogen might cause serious distortions to
the natural nutrient cycle among the atmosphere, water and soil. Excessive NH3 can
cause the taste and odour problem to the water system.
Ammonia nitrate is soluble in the water, and produce ammonium hydroxide
which is a temporary constituent in water because it is part of nitrogen cycle which
affected by biological activities.
2.5.7.1 Source of Ammonia in Rivers
Released of ammoniacal-rich fertilizer
Uncontrolled landfill leachate
Untreated sewerage from farm, factories, septic tanks
Wastewater effluents from domestic, commercial
Surface runoff and rainfall
14
Municipal sewage
2.5.8 Turbidity
Turbidity is the measurement of water clearness or clarity on how much suspended
materials in the water that decreased the passage of light into the water. It is not
measure the amount of suspended solids, it only measures the amount of light that is
scattered by the suspended solids. Turbidity is cause by suspended solids in the water,
either from industrial wastes, clays, silt, sewage or plankton. The particles absorb heat
from the sun, thus increasing the temperature. When the temperature is high, dissolved
oxygen will decrease because warm water holds less oxygen. Turbidity also reduces the
penetrating of light amount into the water, which means the photosynthesis process
cannot occur and DO decreases.
Below are the sources of turbidity:
High iron concentration (that makes the water become rust-red looks)
Runoff from watershed
Soil erosion from the bottom
Product of algae and plant production breakdown
Water discharges (from industries, municipals or sewage)
2.5.9 Heavy Metals
Due to industrial wastes from the nearest river, there is potential that the water
contains heavy metals pollution in the aquatic system. In some environment conditions,
heavy metals may cause toxic concentration and destroy the ecology (John G. Dean et
all,1992). Some of them such as Manganese (Mg), Iron (Fe) Cobalt (Co), Copper (Cu),
Chromium (Cr), and Zinc (Zn) are helping in daily life, while the others such as
Mercury (Hg), Arsenic (As) and lead (Pb) are dangerous to the others.
Due to Hamidi A.Aziz et al (2007), heavy metals such as Cd, Pb, Zn, Ni, Cu and
Cr has been used extensively in industrial, either in mining activities or chemical
industries. Because of this parameter, it has brought the increasing of the water


![IWGGMS ‐14, 8 –10 May 2018, Toronto Sentinel-5 Precursor ... · EGU General Assembly 2018 (EGU2018-12216) [4] Sentinel-5 Precursor: Early in-flight operation & results, H. Nett](https://img.pdfslide.us/doc/110x75/5f706eb1cd40be6c2e5bfd15/iwggms-a14-8-a10-may-2018-toronto-sentinel-5-precursor-egu-general-assembly.jpg)