Embed Size (px)
Citation preview
Page 1/19
High Anemia Prevalence in Korean Older Adults, anAdvent Healthcare Problem: 2007-2016 KNHANESHee won Chueh
Dong-A University College of Medicine https://orcid.org/0000-0002-3824-2334Hye Lim Jung
Sungkyunkwan University School of MedicineYe Jee Shim
Keimyung University School of MedicineHyoung Soo Choi
Seoul National University Bundang HospitalJin Yeong Han ( [email protected] )
Dong-A University College of Medicine https://orcid.org/0000-0003-0280-2739
Research article
Keywords: anemia, older adult, KNHANES, comorbidity
Posted Date: September 18th, 2020
DOI: https://doi.org/10.21203/rs.3.rs-34749/v2
License: This work is licensed under a Creative Commons Attribution 4.0 International License. Read Full License
Version of Record: A version of this preprint was published on November 26th, 2020. See the publishedversion at https://doi.org/10.1186/s12877-020-01918-9.
Page 2/19
AbstractBACKGROUND: Anemia is associated with high morbidity and mortality in older people. However, anemiain older individuals is not fully understood, and national data on the prevalence and characteristics ofanemia in Korean older people are lacking. This study aimed to evaluate the prevalence andcharacteristics of anemia in older adults using data from the Korea National Health and NutritionExamination Survey (KNHANES), which is the nation-wide cross-sectional epidemiological studyconducted by Korean Ministry of Health and Welfare.
Methods: Data from the total of 62,825 participants of the 2007-2016 KNHANES were merged andanalyzed to investigate differences in participant characteristics and potential risk factors for anemia.Differences in participant characteristics were compared across subgroups using the chi-squared test forcategorical variables and independent t-test for continuous variables. Univariate and multivariateanalyses using logistic regression were performed to identify related clinical factors.
RESULTS: The prevalence of anemia was higher in the population aged ≥65 years than in the youngerpopulation. Anemia was also more prevalent among females than among males, but the difference wasnot statistically signi�cant in people aged >85 years. Being underweight, receiving a social allowance,living alone, and having comorbidities such as hypertension, rheumatoid arthritis, diabetes mellitus (DM),cancer, and chronic renal failure (CRF) were more prevalent in older adults with anemia than in the groupwithout anemia. In the univariate and multivariate analyses, older age, female sex, underweight, andcomorbidities including rheumatoid arthritis, DM, cancer, and CRF were associated with an increased riskof anemia.
CONCLUSIONS: This study revealed that age, female sex, underweight, and the presence of comorbiditiessuch as rheumatoid arthritis, DM, cancer, and CRF were associated with an increased risk of anemia inKorean older adults. Further study on causal relationships between anemia and other variables in theolder population is necessary.
BackgroundThe prevalence of anemia is known to increase with age. A previous epidemiological study in the U.S.showed that anemia was prevalent in >10% of people aged ≥65 years (older adults) and in >20% of thoseaged ≥85 years[1]. According to the 2018 National Health Statistics for Korea, the prevalence of anemiain men and women aged 60-69 years was 5.3% and 8.0%, respectively, and in those aged >70 years, theprevalence was higher, at 16.4% and 18.3%, respectively[2]. Anemia in older people has been reported tobe more prevalent in individuals who are staying in nursing homes and who are hospitalized[3-6].
Anemia in the older population has been reported to be related to various medical burdens, includingincreased morbidity and mortality[7]. In particular, anemia has been reported to be related to highercardiovascular events[8, 9], frailty[3, 10, 11], fractures[12], prolonged hospital stay and unfavorableoutcomes[13-15]. Robins et al., showed that anemia in older population possess potential morbidity and
Page 3/19
mortality by affecting tissue oxygen delivery, accompany to aging process, and eventually lead multiplemajor and minor organ dysfunctioning, which include physical and mental function[16]. Increasingprevalence of anemia in older population will potentially increase the medical cost and burden of thesociety.
However, anemia in older people is not fully understood. Anemia in older adults is reported to be mainlydue to nutritional de�ciency following chronic kidney disease, blood cell disorders, malignancy and otherdiseases[5, 17, 18]. However, the etiology of anemia is unclear in a certain percentage of individuals,despite various tests being conducted in this group, including bone marrow aspiration and biopsy[1, 19,20].
The population of older people in many developing and developed countries, including South Korea, isincreasing. In South Korea, the average life expectancy is increasing, while the birth rate per woman isdecreasing. According to Statistics Korea, the proportion of population aged 65 years and older in SouthKorea was 14.3% in 2018 and is predicted to rise to 46.5% in 2067[21]. Despite these �ndings, the socialand health policies and provisions for older people in Korea are inadequate. However, there are fewstudies deal with the anemia in older adults in Korea. These reports are limited to single center or smallcommunity cross-sectional study, and not represent the current status of Korean population. In thisregard, this study aimed to evaluate the actual prevalence of anemia in older adults in South Korea andelucidate the burden of health problems related to anemia, using data from a large nationwide survey.
MethodsStudy Population and Characteristics
This study used data from the Korea National Health and Nutrition Examination Survey (KNHANES). TheKNHANES is a nationwide health and nutrition survey designed by Korea Centers for Disease Control &Prevention, and conducted annually by the South Korean government according to the Article 16 ofNational Health Promotion Act. The survey was �rst conducted in 1998, and its structure and format havesubstantially evolved since 2007. The survey includes questionnaire items and details of laboratory tests,which have been regularly revised every 3 years. However, there were great changes since 2007 in majorformats of survey. The sampling method has changed from short-term cross-sectional sampling tocircular sampling continuous method. Central laboratory centers, several methodologic formats of bloodtests and data-input formats also has been changed. Therefore, for reasons of data homogeneity, thisstudy merged and analyzed data from the KNHANES conducted from 2007 to 2016.
The participants of the KNHANES include community-dwelling Koreans carefully selected by statisticalmethods that use multivariable strati�cation and cluster sampling to represent the entire Koreanpopulation. The survey excludes individuals from military troops, prisons, hospitals, and nursery or socialhomes. Participants are selected and enrolled as family units to gather complete data on all familymembers. Written informed consent is obtained from the participants at the start of each surveyexamination. Personal data and results of the survey are de-identi�ed before they are made publicly
Page 4/19
available. As annually conducted cross-sectional study, any individual or family not allowed to participateKNHANES repeatedly.
KNHANES survey examination study was approved by the Korean Centers for Disease Control &Prevention Research Ethics Review Committee, and gaining renewal annually. Ethical approval of thisstudy was obtained through the Institutional Review Board of Dong-A University Hospital.
De�nition of Terms
Anemia was de�ned as a hemoglobin level of <13.0 g/dL for men and <12.0 g/dL for women, based onthe World Health Organization criteria for anemia. Underweight was de�ned as a body mass index of <18.Social allowance was de�ned as one or one’s family is having bene�ciary of social allowance, which isrun as single system by government in Korea. Household income was initially classi�ed into fourcategories in KNHANES, and the lowest household income was de�ned as “low household income.”Under the item “food insecurity,” “insecurity” was de�ned as having the following answer: “have troubleoften or frequently in having adequate amount and quality of daily food for economic reason.” BecauseKNHANES enrolled the participants as family unit, “live alone” de�ned as family consist of single familymember. Comorbid conditions were de�ned as those diagnosed by a doctor, as reported by theparticipant. Hypertension referred to a resting systolic blood pressure of >140 mmHg or a diastolic bloodpressure of >90 mmHg at examination. Having antihypertensive medication also included tohypertension group though their blood pressure were within normal limit. According to the KNHANES, toreduce the variation, they adopted certi�cation in measuring blood pressure, and educated the personnelto measure the blood pressure in uniformed method. Diabetes mellitus (DM) was de�ned as having beendiagnosed with DM or treated for DM or having a fasting blood glucose level of >126 mg/dL.Osteoarthritis, rheumatoid arthritis, asthma, hepatitis C, hepatitis C, liver cirrhosis were de�ned as havediagnosed by doctor or still suffering from the disease or been treated. Pulmonary tuberculosis de�ned ashaving been diagnosed with tuberculosis, or suffering from it, or having anti-tuberculosis medication,including subclinical tuberculosis. Cancer de�ned as currently in diagnosis and treatment of any type ofcancer. Chronic renal failure (CRF) was de�ned as an estimated glomerular �ltration rate of <60 mL/minusing the Modi�cation of Diet in Renal Disease Study equation.
Statistical Analysis
The KNHANES has speci�c guidelines for statistical analysis, including cluster sampling andstrati�cation, to ensure accuracy of data[22]. To represent the entire Korean population, the samplingweights assigned to the participants were applied to all analyses and were generated taking into accountthe complex sample design, nonresponse rate of the target population, and post-strati�cation.Differences in participant characteristics were compared across subgroups using the chi-squared test forcategorical variables and independent t-test for continuous variables, as appropriate. Trend analysis wasperformed for complex survey design using logistic regression analysis. Univariate and multivariateanalyses using logistic regression were performed to identify prognostic factors that were independentlyrelated to anemia in older adults. As hemoglobin itself can be used to show signi�cant differences
Page 5/19
between participants with and without anemia, this variable was removed during the multivariateanalysis. The prevalence of anemia was plotted by age and sex for data visualization. All statisticalanalyses were carried out using IBM SPSS® Statistics version 24.0 (IBM, Armonk, NY). A two-sided P-value of <0.05 was considered statistically signi�cant.
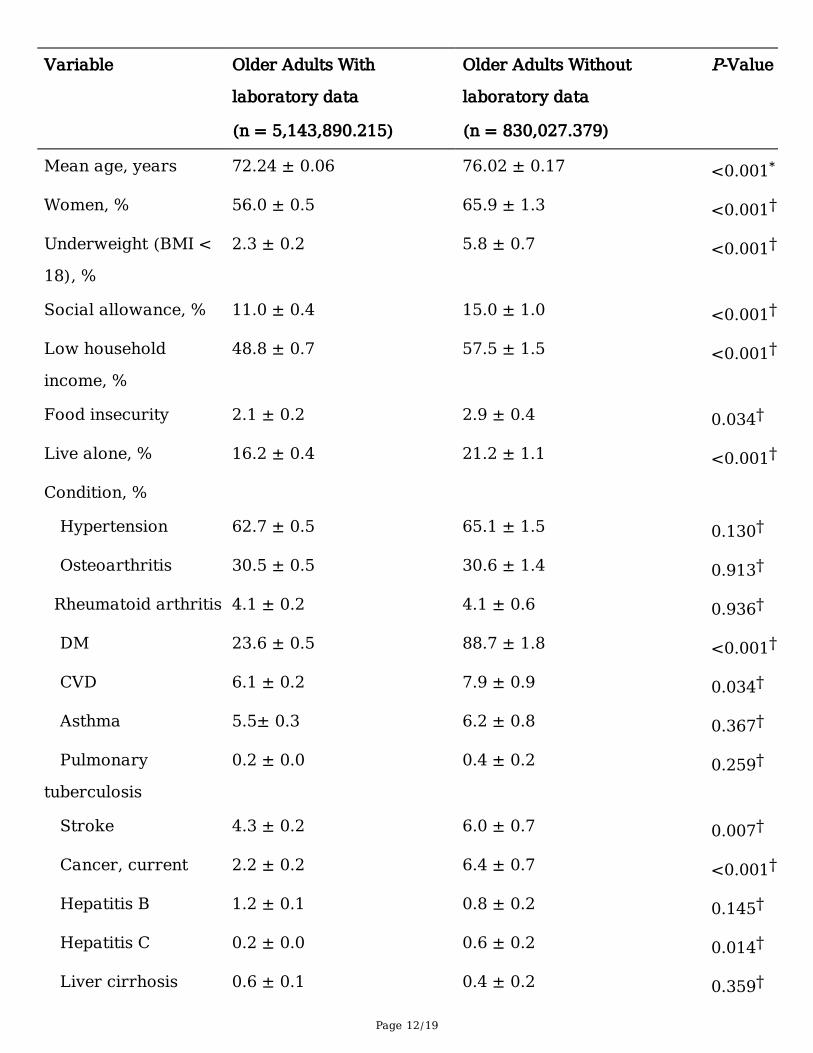
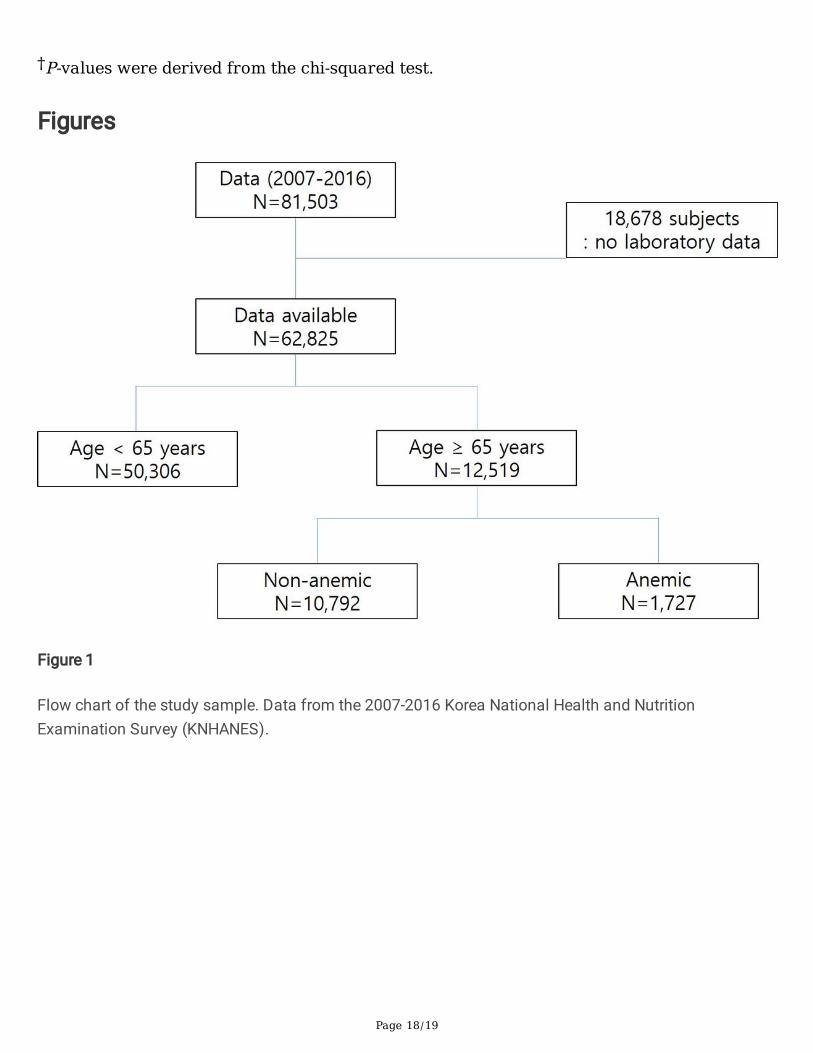
ResultsThe data of 81,503 participants in the 2007-2016 KNHANES were retrieved. Among the participants,18,678 were excluded from this study because of missing laboratory data. Thus, a total of 62,825participants were included in the analysis, of whom 12,519 were aged ≥65 years (Figure 1). Comparisonof basic characteristics between group with laboratory data and group without laboratory data in thepopulation aged 65 year and older are displayed in Table 1. Most of the variables of basic characteristicsshowed signi�cant differences between two groups. The age distribution was analyzed according to thesurvey periods. A trend of increase in the proportion of older adults was observed but was not statisticallysigni�cant (Figure 2).
Prevalence of Anemia and Its Trend
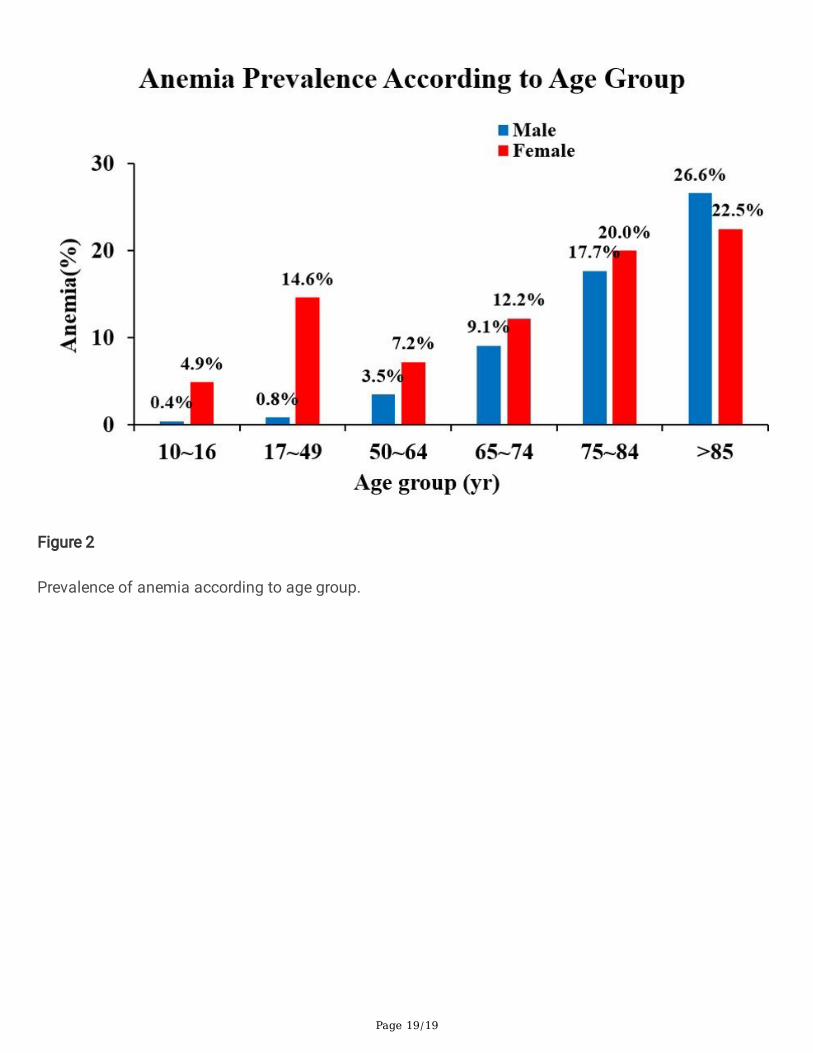
Of the 62,825 participants, 5,315 had anemia, including 1,024 males and 4,291 females. The overallprevalence of anemia in the population aged ≥10 years was 7.3% (95% con�dence interval [CI],7.1%-7.5%). The prevalence of anemia in the population aged ≥65 years was 14.0% (95% CI,13.3%-14.7%), whereas that in the population aged <65 years was 6.4% (95% CI, 6.2%-6.6%). Theprevalence of anemia was higher in females (12.2%; 95% CI, 11.8%-12.6%) than in males (2.5%; 95% CI,2.3%-2.7%). However, in the population aged >85 years, the prevalence of anemia between men andwomen did not show any signi�cant difference (26.6% vs. 22.5%, P = 0.577; Figure 3).
Trend of anemia was analyzed through logistic regression. A signi�cance increased was found for overall(P < 0.001), male (P <0.001), and female (P <0.001).
Difference in Characteristics Between Older Adults With and Without Anemia
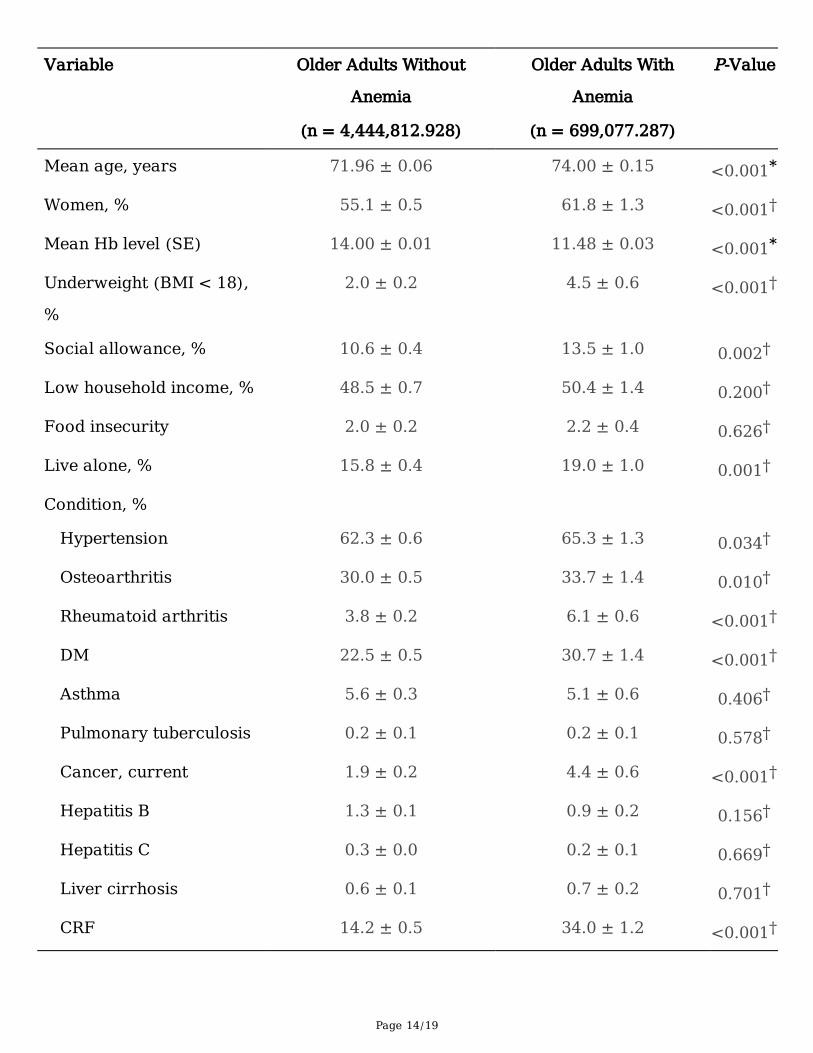
The baseline characteristics of older adults with and without anemia are shown in Table 2. Known riskfactors for anemia were included as variables in the analysis. The population with anemia had higherproportion older age and of women. The group with anemia also showed a higher proportion ofparticipants who were underweight, were bene�ciaries of social allowance, and who were living alonethan the group without anemia. No statistical differences in household income or food insecurity wereobserved. Moreover, the population with anemia tended to have a higher prevalence of hypertension,osteoarthritis, rheumatoid arthritis, DM, cancer, and CRF (Table 2).
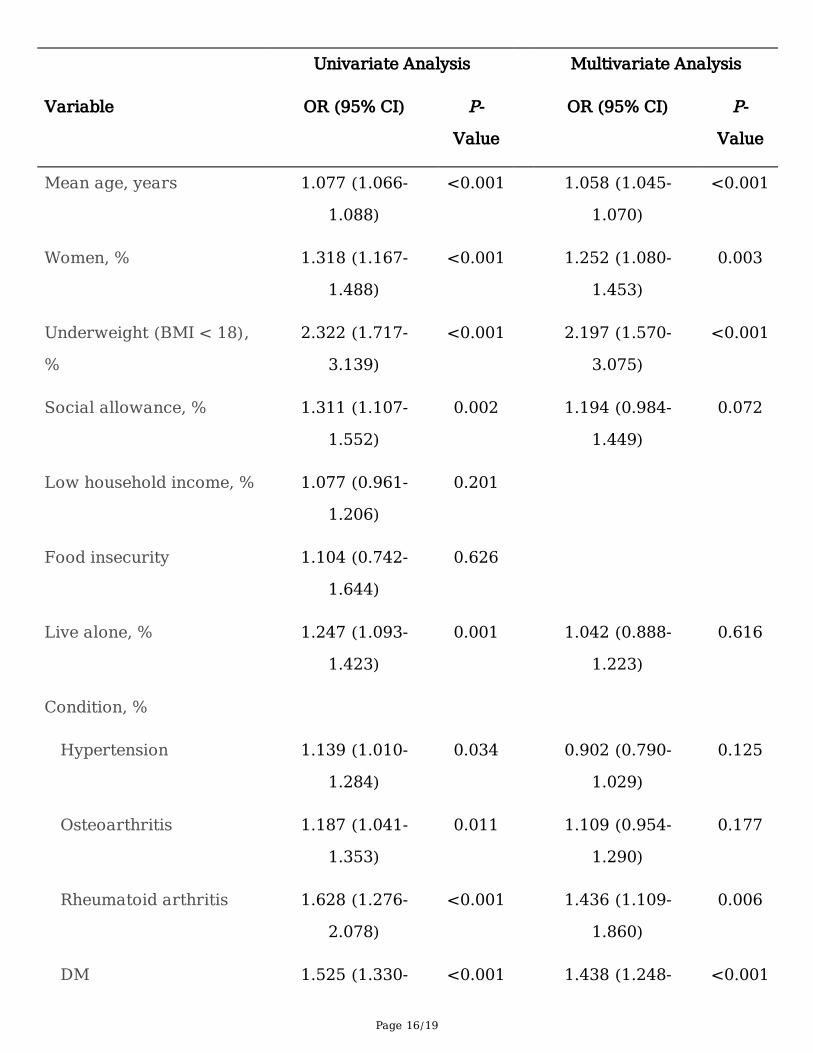
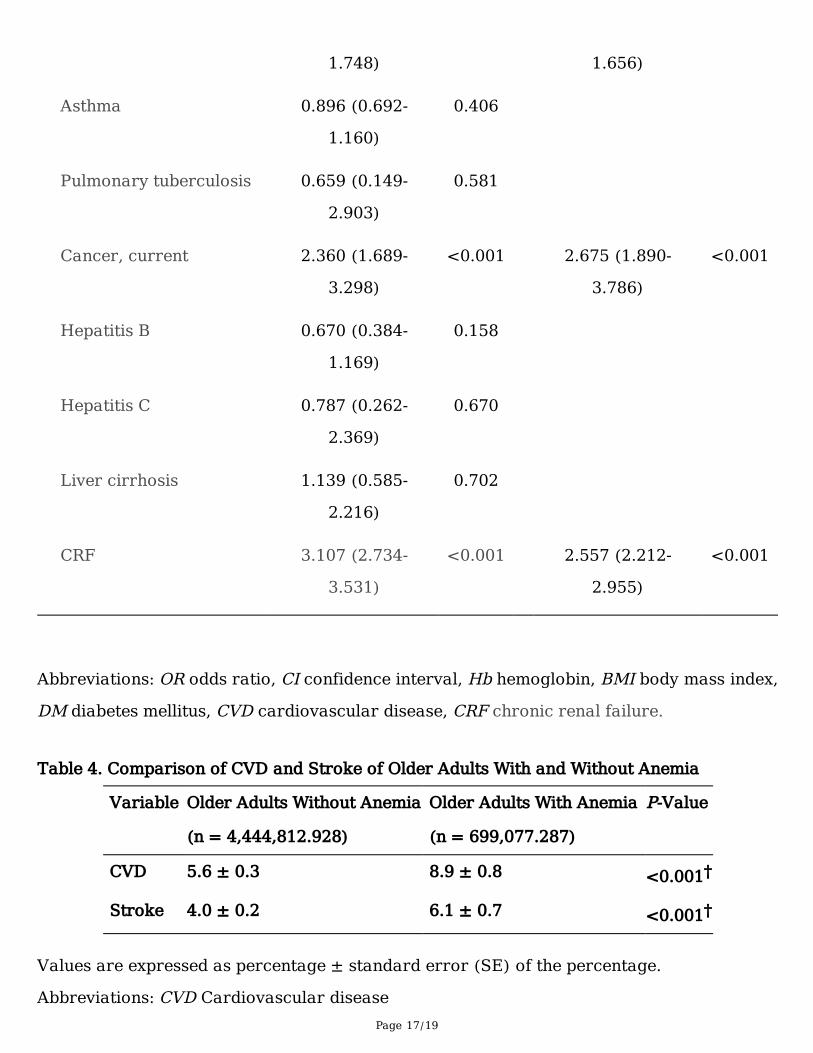
Relationships between independent and dependent variables were analyzed using univariate andmultivariate logistic regression. The analysis of risk factors for anemia in older adults is shown in Table3. The mean hemoglobin levels were not included in further analysis due to the de�nite differences in
Page 6/19
hemoglobin levels between participants with and without anemia. Based on the results, the risk ofanemia increased with older age (odds ratio [OR], 1.058; 95% CI, 1.045-1.070; P < 0.001) and with femalesex (OR, 1.252; 95% CI, 1.080-1.453; P = 0.001). Underweight (OR, 2.197; 95% CI, 1.570-3.075; P < 0.001),rheumatoid arthritis (OR, 1.436; 95% CI, 1.109-1.860; P = 0.006), DM (OR, 1.438; 95% CI, 1.248-1.656; P <0.001), cancer (OR, 2.675; 95% CI, 1.890-3.786; P < 0.001), and CRF (OR, 2.557; 95% CI, 2.212-2.955; P <0.001) were also associated with an increased risk of anemia.
Among comorbid conditions, cardiovascular disease and stroke were analyzed to �nd out the relationshipwith anemia. Both conditions were signi�cantly related to anemia in older population.
DiscussionThis study showed high prevalence of anemia in population aged 65 year and older, regardless of gender.Its prevalence increase signi�cantly with age, and the trend of prevalence also showed considerableincrease. Comorbid conditions including underweight, DM, rheumatoid arthritis, cancer, and CRF wereshown as signi�cant risk factors.
There are few reports on anemia in older population in Korea. Kim et al[23]., showed that the incidence ofanemia in population aged over 60 years in Korea was 7.2%, and most of them were anemia of chronicdisease. Han et al[8]., analyzed healthy individuals who underwent routine medical checkup in singlecenter and showed that mild anemia, de�ned as hemoglobin level between 10.0 g/dL and 12.9 g/dL inmen and 10.0 g/dL and 11.9 g/dL in women, is a risk factor for cancer and cardiovascular death inelderly population. Jeong et al[24]., also showed the high incidence of anemia in population aged 80years and more, and most of them were anemia of unknown reason, which was closely related tomalignancy by analyzing routine medical checkup laboratory data. These studies are small community-based cross-sectional study with selected population, and have limitation to re�ect general Koreanpopulation. This study analyzed the KNHANES data, which was elaborately designed and conducted asgovernment-lead nation-wide survey with carefully sampled participant. Therefore, result of this studysurely represent the current status of older population in Korea.
However, result in this study have di�culty in generalizations since populations with laboratory datashowed signi�cant different characteristics compared to populations without laboratory data. Whether ornot to do laboratory test was left entirely to the participants and the decision was made by family unit inKNHANES, so missing laboratory data group was not randomly distributed. This seems to contribute tothe differences.
The occurrence of anemia in older people is not fully understood. Hemoglobin levels in the olderpopulation are reportedly lower than the reference values for other population groups. Some reportsconcluded that this decrease in hemoglobin levels might be one of the consequences of the normal agingprocess; hence, the criteria for anemia should be different in this population[13, 24-27]. However, manyreports also showed that anemia in older persons is related to the presence of underlying healthconditions and is therefore associated with high mortality and morbidity. Furthermore, most people with
Page 7/19
anemia have been shown to have nutritional de�ciency, but the etiology is unknown in one-third ofanemia cases[17, 28]. This unexplained category of anemia includes aging-related clonal hematopoiesis(ARCH), idiopathic cytopenia of undetermined signi�cance (ICUS), and pre-myelodysplastic syndrome(MDS); these conditions are associated with a low but potential risk of hematologic malignancy[19, 20,29]. Therefore, older people with anemia are recommended to undergo evaluations for etiologyanalysis[20]. However, there is no guideline or consensus for the range and frequency of the evaluationand management of this population.
Reports on prevalence of anemia differs according to the studies, and these differences might beattributed to the diversity of the subjects and cohorts of previous studies[4, 17, 23, 24, 27]. Studiesconducted in nursing home- and hospital-based populations have shown signi�cantly higher prevalenceof anemia and morbidity[3, 10]. Most of these studies seem to show similar �ndings with regard to theprevalence of anemia in older adults—that is, the prevalence of anemia tends to increase with age, andthere is no sex difference, with some studies even showing a higher prevalence of anemia among males.In particular, a study in the U.S. showed that in people aged >85 years, the prevalence of anemia washigher among males[17].
In this study, the prevalence of anemia in the population aged ≥65 years was 14.0%, which is higher thanprevious reports, for example, 10.6% in U.S.[17] and 8.33% of Bang et al[30]. Since study settings andparticipants enrolled are different, it is not reasonable to compare directly. However, this �nding is quitestriking because this study was based on populations who were relatively healthy and lived in a secureenvironment. Besides, it is expected that the prevalence of anemia would be much higher in those wholive in a less secure environment, are admitted in hospitals or social facilities, and experience malnutritiondue to �nancial reasons. Studies in admitted patients and people with diseases have shown that anemiais associated with a high risk of complications and poor outcomes.
This study showed that older adults with anemia were tends to be underweight, which might be related tomalnutrition. However, this �nding is inconsistent with those of previous studies showing that being abene�ciary of social allowance or having a low household income is not a risk factor for anemia.Malnutrition-related anemia in elderly has been reported to be 34 ~62% of anemia of known etiology[17,23, 30, 31]. Most of malnutrition-related anemia consist of iron, folate, and vitamin B12 de�ciency[28].Among them, iron de�ciency is the most common, and is usually accompany with other co-morbidities,i.e., GI bleeding, chronic in�ammation, and so on. Malnutrition also can be induced by chronic disease-related, i.e., chronic renal failure, or psychologic- related, i.e., depression, anorexia[28]. Moreover,malnutrition also correlates to the economic status or household �nancial burden[28, 31]. Thisnationwide survey did not include any other speci�c data for malnutrition aside from body weight. Furtherstudy is thus required to clarify the relationship between anemia and malnutrition.
This study is limited in that the KHNANES data cannot be used to show a causal relationship betweenvariables. To determine the cause-and-effect relationship between these variables, large well-designedprospective cohort studies are necessary. Another limitation is that the questionnaire items of the
Page 8/19
KHNANES are being revised every 3 years for economic reasons, making it impossible for researchers toinvestigate the possible etiologies of anemia in the study population. As the etiologies of anemia seem tobe more complicated in older adults than in the younger population, anemia may pose a heavy medicalburden on older people in countries such as South Korea.
ConclusionsIn conclusion, this study revealed that age, female sex, underweight, rheumatoid arthritis, DM, cancer, andCRF were associated with an increased risk of anemia among older adults in South Korea. Our �ndingswill be very relevant to developing interventions and programs aimed at healthy aging at the individualand societal levels.
AbbreviationsKNHANES Korea National Health and Nutrition Examination Survey, DM diabetes mellitus, CVDcardiovascular disease, stroke, cancer, and CRF chronic renal failure
DeclarationConsent for Publication
This work has based from KNHANES, which performed with informed consent by government, and itsdata has been provided without personal information.
Trial registration: KNHANES was approved by the KCDC Research Ethics Review Committee annuallysince 2007(2007-02CON-04-P, 2008-05EXP-01-C, 2009-01CON-03-2C, 2010-02CON-21-C, 2011-02CON-06-C, 2012-01EXP-01-2C, 2013-07CON-03-4C, 2013-12EXP-03-5C, 2015-01-02-6C). Ethical approval of thisstudy was obtained through the Institutional Review Board of Dong-A University Hospital(DAUHIRB-EXP-20-035).
Availablity of Data and Material
The datasets generated and/or analyzed during the current study are available in the KHNANESrepository, https://knhanes.cdc.go.kr/knhanes/eng/index.do
Competing Interests
The authors declare no con�icts of interest.
Funding
This study was supported by Red Blood Cell Disorder Working Party of The Korean Society ofHematology. However, Red Blood Cell Disorder Working Party or Korean Society of Hematology had no
Page 9/19
role in the study design, methods, subject recruitment, data collection, analysis, and preparation of thepaper.
Author’s Contributions
HW Chueh and JY Han designed the study. HW Chueh performed the statistical analysis. HW Chueh andJY Han wrote the manuscript, and HL Jung, YJ Shim, and HS Choi reviewed the �nal draft. All authorsread and approved the �nal manuscript.
ACKNOWLEDGMENTS
The authors would like to thank Jimin Choi, PhD, adjunct professor of Dong-A University, for the statisticalanalysis and advice, and Editage (www.editage.co.kr) for English language editing. This research wassupported by the Red Blood Cell Disorder Working Party of The Korean Society of Hematology, Republicof Korea.
Authors’ Information
Corresponding author Jin Yeong Han is laboratory hematologist who have contributed to improvement oflaboratory medicine in Korea, especially in hematologic division in laboratory medicine. She is veryinterested in congenital and acquired red blood cell disorders, and has served as the chair of the RedBlood Cell Working Party in Korean Society of Hematology. Recently she is having interest in laboratoryproblems in elderly populations. First author, Hee Won Chueh is the pediatric hematologist, and havereported many works in general hematology based on big data. She is interested in anemia and othercommon red blood cell disorders, and actively participate in the Red Blood Cell Working Party in KoreanSociety of Hematology. Other authors, Hye Lim Jung and Hyoung Soo Choi, Ye Jee Shim are pediatrichematologist who actively participating the Red Blood Cell Working Party in Korean Society ofHematology. Especially, Hye Lim Jung and Hyoung Soo Choi also served as chairman of Red Blood CellWorking Party, and reported many works on anemia and blood cell disorderes.
References1. Gómez Ramírez S, Remacha Sevilla ÁF, Muñoz Gómez M: Anaemia in the elderly. Med Clin (Barc)
2017, 149(11):496-503.
2. Statistics Korea: Trend of prevalence of anemia. Available at http://kosis.kr/statHtml/statHtml.do?orgId=117&tblId=DT_11702_N110&conn_path=I2. [Assessed on 06 April 2020].
3. Zul�qar AA, Sui Seng X, Gillibert A, Kadri N, Doucet J: Anemia and frailty in the elderly hospitalized inan acute unit: Preliminary results. European Journal of Internal Medicine 2017, 38:e8-e9.
Page 10/19
4. Patel KV, Guralnik JM: Epidemiology of anemia in older adults. Blood Disorders in the Elderly 2007,45(4):11-20.
5. Stauder R, Bach V, Schruckmayr G, Sam I, Kemmler G: Prevalence and possible causes of anemia inthe elderly: a cross-sectional analysis of a large European university hospital cohort. ClinicalInterventions in Aging 2014:1187-1187.
�. Ferreira YD, Faria LdFC, Gorzoni ML, Gonçalves TAdS, Filho JWCF, Lima THdA: Anemia in elderlyresidents of a long-term care institution. Hematology, Transfusion and Cell Therapy 2018, 40(2):156-159.
7. Tyan P, Taher A, Carey E, Amdur R, Messersmith C, Robinson HN, Gu A, Vargas MV, Moawad GN:Effect of Perioperative Transfusion on Postoperative Morbidity Following Minimally InvasiveHysterectomy for Benign Indications. Journal of Minimally Invasive Gynecology 2019.
�. Han SV, Park M, Kwon Y-M, Yoon H-J, Chang Y, Kim H, Lim Y-H, Kim SG, Ko A: Mild Anemia and Riskfor All-Cause, Cardiovascular and Cancer Deaths in Apparently Healthy Elderly Koreans. KoreanJournal of Family Medicine 2019, 40(3):151-158.
9. Rineau E, Gaillard T, Gueguen N, Procaccio V, Henrion D, Prunier F, Lasocki S: Iron de�ciency withoutanemia is responsible for decreased left ventricular function and reduced mitochondrial complex Iactivity in a mouse model. International Journal of Cardiology 2018, 266:206-212.
10. Röhrig G: Anemia in the frail, elderly patient. Clinical Interventions in Aging 2016, 11:319-326.
11. Pires Corona L, Drumond Andrade FC, de Oliveira Duarte YA, Lebrao ML: The relationship betweenanemia, hemoglobin concentration and frailty in Brazilian older adults. Journal of Nutrition, Healthand Aging 2015, 19(9):935-940.
12. Lee EA, Shin DW, Yoo JH, Ko HY, Jeong SM: Anemia and Risk of Fractures in Older Korean Adults: ANationwide Population-Based Study. Journal of Bone and Mineral Research 2019.
13. Michalak SS, Rupa-Matysek J, Gil L: Comorbidities, repeated hospitalizations, and age ≥ 80 years asindicators of anemia development in the older population. Annals of Hematology 2018, 97(8):1337-1347.
14. Simon GI, Craswell A, Thom O, Chew MS, Anstey CM, Fung YL: Impacts of Aging on AnemiaTolerance, Transfusion Thresholds, and Patient Blood Management. Transfusion Medicine Reviews2019, 33(3):154-161.
15. Migone De Amicis M, Poggiali E, Motta I, Minonzio F, Fabio G, Hu C, Cappellini MD: Anemia in elderlyhospitalized patients: prevalence and clinical impact. Internal and Emergency Medicine 2015, 10(5).
1�. Robinson B: Cost of Anemia in the Elderly. J Am Geriatr Soc 2003, 51(3S):S14-S17.
17. Guralnik JM, Eisenstaedt RS, Ferrucci L, Klein HG, Woodman RC, Dc W: Prevalence of anemia inpersons 65 years and older in the United States : evidence for a high rate of unexplained anemiaPrevalence of anemia in persons 65 years and older in the United States : evidence for a high rate ofunexplained anemia. Blood 2013, 104(8):2263-2268.
1�. Lanier JB, Park JJ, Callahan RC: Anemia in older adults. American Family Physician 2018, 98(7):437-442.
Page 11/19
19. Steensma DP: New challenges in evaluating anemia in older persons in the era of molecular testing.Hematology 2016, 2016(1):67-73.
20. Stauder R, Valent P, Theurl I: Anemia at older age: etiologies, clinical implications, and management.Blood 2018, 131(5):505-514.
21. Korean Statistical Information Service. Population projection according to major age cluster. In:KOSIS: National Statistics, Health and Welfare, 2018. Available at:http://kosis.kr/statHtml/statHtml.do?orgId=101&tblId=DT_1BPA003&conn_path=I2. Accessed April6, 2020.
22. KNHANES. KNHANES statistical information. Available at http://knhanes.cdc.go.kr/. [Assessed on 06April 2020]
23. Choi CW, Lee J, Park KH, Choi IK, Kim SJ, Seo JH, Kim BS, Shin SW, Kim YH, Kim JS: Incidence ofanemia in older Koreans: community-based cohort study. Arch Gerontol Geriatr 2005, 41(3):303-309.
24. Jeong YJ, Cha JK, Lee HJ, Chae SL, Huh HJ, Chung J-W, Kim DY: Anemia in Individuals over Age 80:Unattended Issue in Clinical Practice. The Ewha Medical Journal 2016, 39(3):69-75.
25. Halawi R, Moukhadder H, Taher A: Anemia in the elderly: a consequence of aging? Expert RevHematol 2017, 10(4):327-335.
2�. Andrès E, Serraj K, Federici L, Vogel T, Kaltenbach G: Anemia in elderly patients: New insight into anold disorder. Geriatrics and Gerontology International 2013, 13(3):519-527.
27. Tettamanti M, Lucca U, Gandini F, Recchia A, Mosconi P, Apolone G, Nobili A, Tallone MV, Detoma P,Giacomin A et al: Prevalence, incidence and types of mild anemia in the elderly: The "Health andAnemia" population-based study. Haematologica 2010, 95(11):1849-1856.
2�. Bianchi VE: Role of nutrition on anemia in elderly. Clinical Nutrition ESPEN 2016, 11:e1-e11.
29. Goodnough LT, Schrier SL: Evaluation and management of anemia in the elderly. Am J Hematol2014, 89(1):88-96.
30. Bang SM, Lee JO, Kim YJ, Lee KW, Lim S, Kim JH, Park YJ, Chin HJ, Kim KW, Jang HC et al: Anemiaand activities of daily living in the Korean urban elderly population: results from the KoreanLongitudinal Study on Health and Aging (KLoSHA). Ann Hematol 2013, 92(1):59-65.
31. Andrès E, Federici L, Serraj K, Kaltenbach G: Update of nutrient-de�ciency anemia in elderly patients.European Journal of Internal Medicine 2008, 19(7):488-493.
Tables
Table 1. Comparison of Baseline Characteristics of patients With and Without lab data
Page 12/19
Variable Older Adults With
laboratory data
Older Adults Without
laboratory data
P-Value
(n = 5,143,890.215) (n = 830,027.379)
Mean age, years 72.24 ± 0.06 76.02 ± 0.17 <0.001*
Women, % 56.0 ± 0.5 65.9 ± 1.3 <0.001†
Underweight (BMI <
18), %
2.3 ± 0.2 5.8 ± 0.7 <0.001†
Social allowance, % 11.0 ± 0.4 15.0 ± 1.0 <0.001†
Low household
income, %
48.8 ± 0.7 57.5 ± 1.5 <0.001†
Food insecurity 2.1 ± 0.2 2.9 ± 0.4 0.034†
Live alone, % 16.2 ± 0.4 21.2 ± 1.1 <0.001†
Condition, %
Hypertension 62.7 ± 0.5 65.1 ± 1.5 0.130†
Osteoarthritis 30.5 ± 0.5 30.6 ± 1.4 0.913†
Rheumatoid arthritis 4.1 ± 0.2 4.1 ± 0.6 0.936†
DM 23.6 ± 0.5 88.7 ± 1.8 <0.001†
CVD 6.1 ± 0.2 7.9 ± 0.9 0.034†
Asthma 5.5± 0.3 6.2 ± 0.8 0.367†
Pulmonary
tuberculosis
0.2 ± 0.0 0.4 ± 0.2 0.259†
Stroke 4.3 ± 0.2 6.0 ± 0.7 0.007†
Cancer, current 2.2 ± 0.2 6.4 ± 0.7 <0.001†
Hepatitis B 1.2 ± 0.1 0.8 ± 0.2 0.145†
Hepatitis C 0.2 ± 0.0 0.6 ± 0.2 0.014†
Liver cirrhosis 0.6 ± 0.1 0.4 ± 0.2 0.359†
Page 13/19
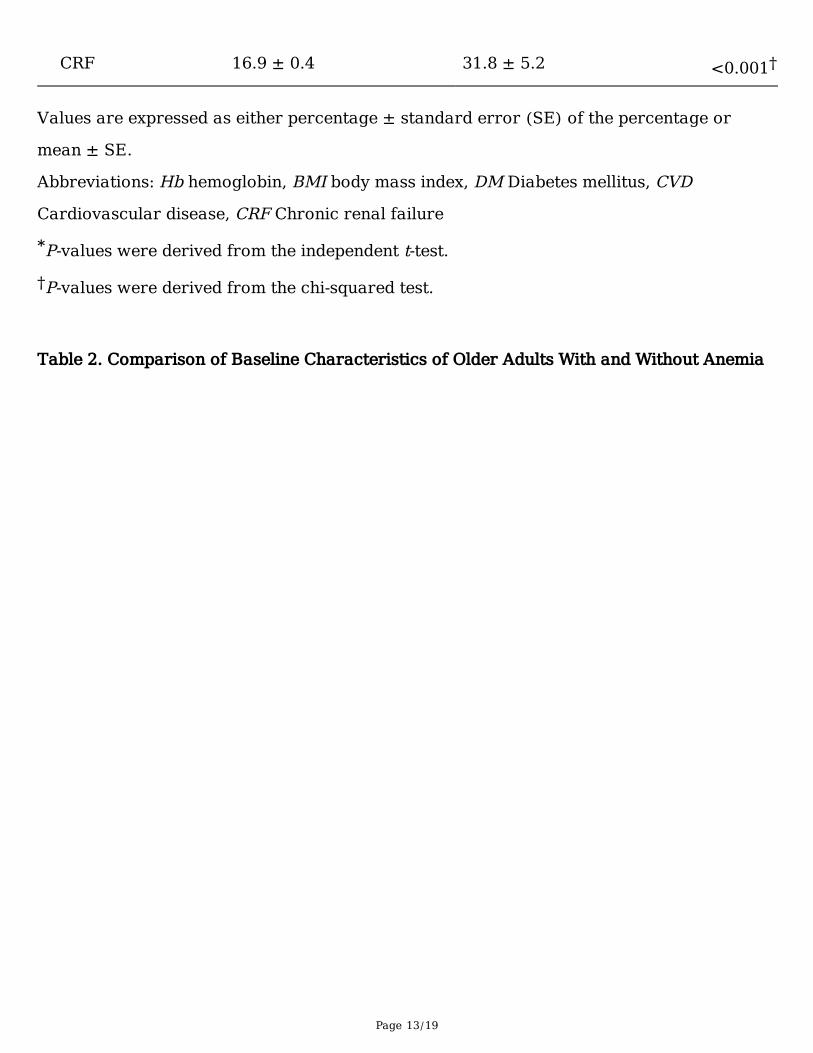
CRF 16.9 ± 0.4 31.8 ± 5.2 <0.001†
Values are expressed as either percentage ± standard error (SE) of the percentage or
mean ± SE.
Abbreviations: Hb hemoglobin, BMI body mass index, DM Diabetes mellitus, CVD
Cardiovascular disease, CRF Chronic renal failure
*P-values were derived from the independent t-test.
†P-values were derived from the chi-squared test.
Table 2. Comparison of Baseline Characteristics of Older Adults With and Without Anemia
Page 14/19
Variable Older Adults Without
Anemia
Older Adults With
Anemia
P-Value
(n = 4,444,812.928) (n = 699,077.287)
Mean age, years 71.96 ± 0.06 74.00 ± 0.15 <0.001*
Women, % 55.1 ± 0.5 61.8 ± 1.3 <0.001†
Mean Hb level (SE) 14.00 ± 0.01 11.48 ± 0.03 <0.001*
Underweight (BMI < 18),
%
2.0 ± 0.2 4.5 ± 0.6 <0.001†
Social allowance, % 10.6 ± 0.4 13.5 ± 1.0 0.002†
Low household income, % 48.5 ± 0.7 50.4 ± 1.4 0.200†
Food insecurity 2.0 ± 0.2 2.2 ± 0.4 0.626†
Live alone, % 15.8 ± 0.4 19.0 ± 1.0 0.001†
Condition, %
Hypertension 62.3 ± 0.6 65.3 ± 1.3 0.034†
Osteoarthritis 30.0 ± 0.5 33.7 ± 1.4 0.010†
Rheumatoid arthritis 3.8 ± 0.2 6.1 ± 0.6 <0.001†
DM 22.5 ± 0.5 30.7 ± 1.4 <0.001†
Asthma 5.6 ± 0.3 5.1 ± 0.6 0.406†
Pulmonary tuberculosis 0.2 ± 0.1 0.2 ± 0.1 0.578†
Cancer, current 1.9 ± 0.2 4.4 ± 0.6 <0.001†
Hepatitis B 1.3 ± 0.1 0.9 ± 0.2 0.156†
Hepatitis C 0.3 ± 0.0 0.2 ± 0.1 0.669†
Liver cirrhosis 0.6 ± 0.1 0.7 ± 0.2 0.701†
CRF 14.2 ± 0.5 34.0 ± 1.2 <0.001†
Page 15/19
Values are expressed as either percentage ± standard error (SE) of the percentage or
mean ± SE.
Abbreviations: Hb hemoglobin, BMI body mass index, DM Diabetes mellitus, CRF Chronic
renal failure
*P-values were derived from the independent t-test.
†P-values were derived from the chi-squared test.
Table 3. Analysis of Risk Factors for Anemia in Older Adults
Page 16/19
Univariate Analysis Multivariate Analysis
Variable OR (95% CI) P-
Value
OR (95% CI) P-
Value
Mean age, years 1.077 (1.066-
1.088)
<0.001 1.058 (1.045-
1.070)
<0.001
Women, % 1.318 (1.167-
1.488)
<0.001 1.252 (1.080-
1.453)
0.003
Underweight (BMI < 18),
%
2.322 (1.717-
3.139)
<0.001 2.197 (1.570-
3.075)
<0.001
Social allowance, % 1.311 (1.107-
1.552)
0.002 1.194 (0.984-
1.449)
0.072
Low household income, % 1.077 (0.961-
1.206)
0.201
Food insecurity 1.104 (0.742-
1.644)
0.626
Live alone, % 1.247 (1.093-
1.423)
0.001 1.042 (0.888-
1.223)
0.616
Condition, %
Hypertension 1.139 (1.010-
1.284)
0.034 0.902 (0.790-
1.029)
0.125
Osteoarthritis 1.187 (1.041-
1.353)
0.011 1.109 (0.954-
1.290)
0.177
Rheumatoid arthritis 1.628 (1.276-
2.078)
<0.001 1.436 (1.109-
1.860)
0.006
DM 1.525 (1.330- <0.001 1.438 (1.248- <0.001
Page 17/19
1.748) 1.656)
Asthma 0.896 (0.692-
1.160)
0.406
Pulmonary tuberculosis 0.659 (0.149-
2.903)
0.581
Cancer, current 2.360 (1.689-
3.298)
<0.001 2.675 (1.890-
3.786)
<0.001
Hepatitis B 0.670 (0.384-
1.169)
0.158
Hepatitis C 0.787 (0.262-
2.369)
0.670
Liver cirrhosis 1.139 (0.585-
2.216)
0.702
CRF 3.107 (2.734-
3.531)
<0.001 2.557 (2.212-
2.955)
<0.001
Abbreviations: OR odds ratio, CI confidence interval, Hb hemoglobin, BMI body mass index,
DM diabetes mellitus, CVD cardiovascular disease, CRF chronic renal failure.
Table 4. Comparison of CVD and Stroke of Older Adults With and Without Anemia
Variable Older Adults Without Anemia Older Adults With Anemia P-Value
(n = 4,444,812.928) (n = 699,077.287)
CVD 5.6 ± 0.3 8.9 ± 0.8 <0.001†
Stroke 4.0 ± 0.2 6.1 ± 0.7 <0.001†
Values are expressed as percentage ± standard error (SE) of the percentage.
Abbreviations: CVD Cardiovascular disease
Page 18/19
†P-values were derived from the chi-squared test.
Figures
Figure 1
Flow chart of the study sample. Data from the 2007-2016 Korea National Health and NutritionExamination Survey (KNHANES).
Page 19/19
Figure 2
Prevalence of anemia according to age group.