Embed Size (px)
Citation preview

O&M
For Service Providers of
Residential AdvanTex® Treatment Systems
and for Homeowner Reference Another Carefully EngineeredTreatment System by:
AdvanTex® Treatment Systems
O P E R A T I O N & M A I N T E N A N C E M A N U A L

O M&A D V A N T E X ® M A N U A L
As the operator and service provider of an onsitewastewater treatment system, you play a crucialrole. Property owners, neighbors, regulators, deal-ers, manufacturers ... all rely on your efficientand effective work.
All onsite systems require servicing, from the sim-plest of standard stone-trench systems to the mostcomplex tertiary treatment systems. Regular serv-icing optimizes the treatment process and ensuresthat onsite systems are a sustainable technology.
To make servicing easier, Orenco has configuredthe AdvanTex® Treatment System and its compo-nents to be one of the most trouble-free and serv-ice-friendly residential treatment systems on themarket. We’ve also provided this O&M Manual.In it, you’ll find valuable information about . . .
• The AdvanTex System’s configuration andtreatment process
• Performance expectations (norms) at each stagein the treatment process
• System components
• Routine cleaning and maintenance proceduresand frequencies
• Routine cleaning and maintenance checklist
• Testing procedures
• Troubleshooting tips
• Sample documentation
• Equipment and tools checklist
Operation and maintenance of an onsite treat-ment system requires an understanding of all theabove information. So please read through thisentire manual first, before providing any service.Then write in the Record of System Facts, on the back page. Reading the manual first andmaintaining up-to-date records will save everyonetime and money in the long run.
Also, at start-up and periodically thereafter, werecommend that you get together with the sys-tem user to review the Homeowner’s Manual thatcomes with the system, especially the “Do’s andDon’ts.” This will educate the user on preventivemaintenance and on the operating and mainte-nance responsibilities of system users and author-ized personnel, as well as service-related obliga-tions of the manufacturer. Meeting periodicallywith the user will also allow you to track any sig-nificant changes in the household (e.g., numberof occupants, changes in water use, use of deter-gents, disposal of cleaning compounds, etc.).
We’re very proud of the AdvanTex TreatmentSystem. Like all our products, it has gone throughextensive research, development, and field-testing.Then each component is built to written specifi-cations and subjected to quality review, beforeshipping. In addition, our AXN models meet therequirements of ANSI-NSF Standard 40 for Class I Systems. If any component of this Systemdoes not meet your expectations, please call yourauthorized AdvanTex Dealer.
Your Expertise Matters
Introduction

O M&A D V A N T E X ® M A N U A L 3
AdvanTex® Treatment Systems
Table of Contents
Typical System Configuration 4
Treatment Process and Performance Expectations 6• Processing Tank• AdvanTex® Textile Filter
Typical Materials List 8
Tools, Equipment, and Spare Parts List 9
Routine Cleaning and Maintenance Procedures 10• Control Panel/Pumps/Alarms• Pumping System• Processing Tank• Textile Filter• Miscellaneous• Documentation• Maintenance Checklist
Effluent Testing Procedures 16• Protocol for Sampling, Testing, and Analysis• Routine Tests, Frequencies, and Typical Values • Supplemental Testing and Typical Values
Troubleshooting Tips for Operators: Process Treatment 18• Troubleshooting Effluent Quality• Troubleshooting Odor• Troubleshooting Effluent Filter Clogging• Troubleshooting Oily Film• Troubleshooting Foam
O&M for Nitrogen Reduction 20• The Process• Signs of Effective Nitrogen Reduction• Troubleshooting Nitrogen Reduction
Maintenance Checklist and Field Report Forms 23
Appendix 1: The Nitrogen Reduction Process and Key Indicators 28
Appendix 2: Abbreviations and Definitions 30
Appendix 3: Timer Settings 31
Notes 31
Record of System Facts Back Page
Copyright Orenco Systems®, Inc. Property of Orenco Systems®, Inc.
Do not reproduce or distribute without written authorization from Orenco: 800-348-9843.
O M&A D V A N T E X ® M A N U A L
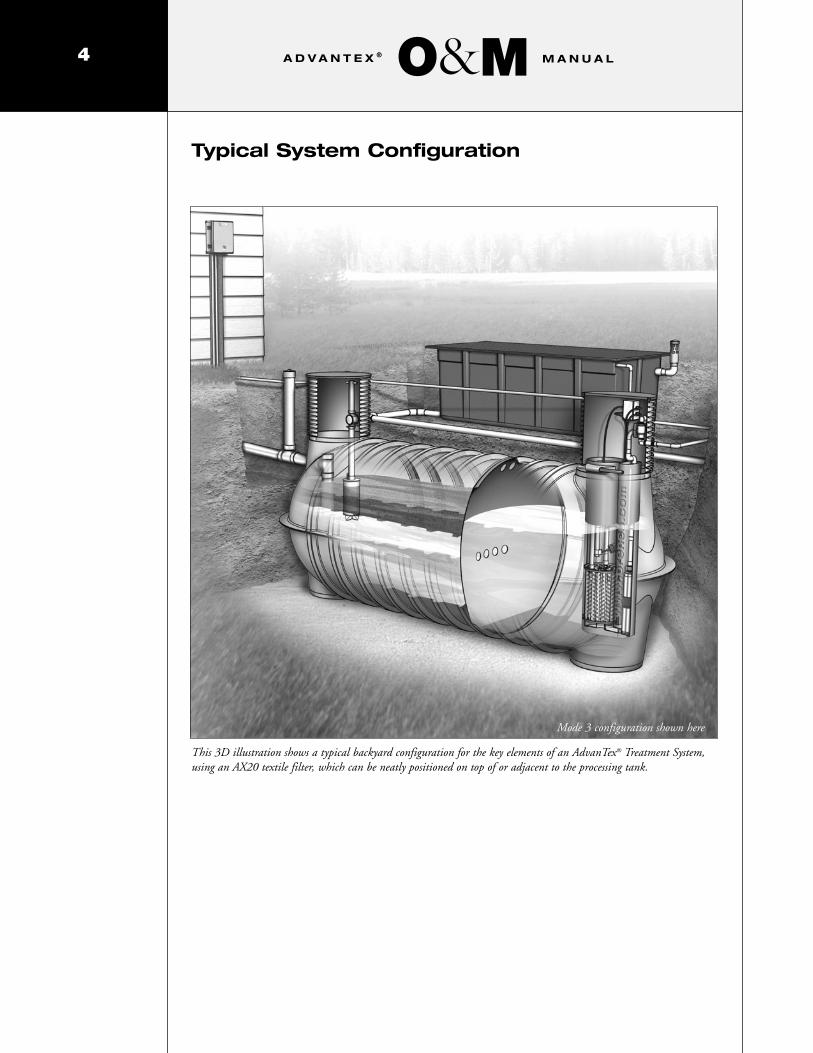
Typical System Configuration
This 3D illustration shows a typical backyard configuration for the key elements of an AdvanTex® Treatment System,using an AX20 textile filter, which can be neatly positioned on top of or adjacent to the processing tank.
4
Mode 3 configuration shown here

O M&A D V A N T E X ® M A N U A L
House/Building
5
4. Final dispersal (shallow gravelless drainfield,STEP collection, drip system,shrub irrigation, water reuse,lagoon, wetland, etc.)
2. Watertight processing tankProvides primary treatment.Removes a majority of contaminants.
1. Wastewater
3. AdvanTex® textile filterProvides advanced secondarytreatment.
Typical System Configuration: Plan View

O M&A D V A N T E X ® M A N U A L6
54-1/2"±
157"±
12.5"
12"±
HWA/TO
RO
26.25"±
Mixing BlendedZone
28"
43.5"±
Surge Capacity 8"±
Normal Liquid Level5.5"±
AX20
Top View
Side View
PrimaryChamberEffluent
Recirc-BlendEffluent
Raw Influent
AX/AXN Filtrate
RSV
11"
Processing Tank
The processing tank provides primary wastewatertreatment. The tank is an enclosed, watertightreceptacle designed to collect wastewater; segre-gate settleable and floatable solids (sludge andscum); accumulate, consolidate, and store solids;digest organic matter; and discharge treated effluent. BOD (biochemical oxygen demand)removals of greater than 65% and TSS (total suspended solids) removals of greater than 70%are easily accomplished.
The tank operates as a plug-flow type of reactor(fluid and particles enter and exit the tank in pro-gressive sequence). Wastewater separates into threedistinct layers: a floating scum layer, a bottomsludge layer, and a clear zone in between, which isrelatively free of large solids. A pump vault witheffluent filter located at the outlet end of the tankdraws liquid effluent from the clear zone, and thefiltered effluent is dosed to the next step in thetreatment process . . . the AdvanTex Textile Filter.
Because the AdvanTex Treatment System operatesin the recirculating mode, the filtrate from theTextile Filter returns to the processing tank inone of two ways: to the back (outlet end) of thetank in Mode 1 and to the front (inlet end) ofthe tank in Mode 3. This plumbing configura-tion affects effluent quality. Effluent quality isalso contingent upon a number of other condi-tions inside the tank:
• strength and characteristics of incoming waste(see “Raw Influent,” page 7)
• average flows within design range (typically 40-60 gallons per person per day)
• adequate long-term solids retention for thorough digestion
• watertightness of tank (for proper stratificationof incoming waste to prevent treatment shortcircuiting and hydraulic overloading)
• proper size of tank (for minimum 24-hourhydraulic retention time through the tank’sclear zone, at average flow rates and whensludge and scum are developed fully)
If the above conditions are met, you can expecttreatment performance per the table on page 7.
Treatment Process/Performance Expectations

O M&A D V A N T E X ® M A N U A L
AdvanTex Textile Filter
The AdvanTex textile filter provides secondarywastewater treatment. The filter is a sturdy,watertight fiberglass basin filled with an engi-neered textile material. This lightweight, highlyabsorbent textile material treats a tremendousamount of wastewater in a small space.
The AdvanTex filter operates in the recirculatingmode, just like a recirculating sand or gravel fil-ter, but loading rates are typically 5-20 timeshigher, for a number of reasons. For one thing,the textile media has a very large surface area—about 5 times greater than that of an equivalentvolume of sand. Textile also has a greater voidvolume (for free flow of oxygen) and greaterwater-holding capacity.
Wastewater percolates both through and betweenthe textile media. A visible biological film nor-mally develops on the filter medium within a fewdays. BOD5 and TSS reductions occur almostimmediately.
Within the filter, aerobic conditions exist that are ideal for microbes that convert ammonia tonitrate (nitrification). Other conditions exist, too,that result in further nitrogen reduction withinthe media. Some AdvanTex filters are configured(Mode 3) so that the filtrate recirculates back tothe high-carbon, low-oxygen environment at theinlet end of the processing tank, which is idealfor microbes that reduce nitrates to nitrogen gas(denitrification). Harmless nitrogen gas is thenreleased freely back into the atmosphere. The
acclimation period for nitrification may rangefrom four to eight weeks, or longer in colder climates.
AdvanTex filtrate effluent quality is dependentupon proper management of the recirc/blendeffluent flowing into the filter (which, in turn, is dependent on the conditions described on theprevious page). If proper conditions are met, andwith typical average daily flows of 40-60 gallonsper capita per day, you can expect the followingtreatment performance:
Performance Expectations
BOD5 TSS TKNmg/L mg/L mg/L
Raw Influent1 450 500 70
Primary ChamberEffluent 150 40 65
Processing Tank Recirc/Blend Effluent2 15-40 10-20 —4
AXN Filtrate3 5 5 —4
1 Source: Crites & Tchobanoglous. Small andDecentralized Wastewater Management Systems, p. 180, 183, 1998. McGraw-Hill. Based on 50 gpcd.
2 Will vary with recirc ratios and mode configuration.The numbers here represent a recirc ratio between 2:1 and 4:1 and are derived from Orenco and third-party testing in Mode 1.
3 Actual performance results, based on a six-monthaccumulative average from NSF (NationalSanitation Foundation) testing on the AX20N at500 gpd, using composite sampling. See page 17 foradditional information on treatment performance.
Performance and servicing frequencies will tend tovary relative to the mass load being treated.Procedures for treating excessively high loads willrequire engineering review. For more information,please review AdvanTex Design Criteria.
4 Dependent on treatment system configuration andrecirc ratios.
7
Treatment Process/Performance Expectations(continued)

O M&A D V A N T E X ® M A N U A L
Orenco’s AdvanTex Treatment Systems come inmultiple models and configurations. Following is atypical materials list (excluding the processing tank)for an AdvanTex AX20 system that requires a pumpbasin (some do not).
Processing Tank AccessEquipment
Two Access Risers necessary:
One 24" dia., w/Lid
One 30" dia., w/Lid & necessary Grommets
Treatment System Equipment
PVC Splice Box
Universal Biotube® Pump Vault
Discharge Assembly
Float Switch Assembly
Orenco Pump, 115V
MVP or VCOM AdvanTex AXB Panel, 115V
Recirculating Splitter Valve Assembly
AdvanTex AX20 Filter (7.5' x 3' x 2.5')
w/Vent Assembly
Anti-Flotation Flanges
Pump Basin Equipment
PVC Pump Basin, 24" dia., w/Lid
PVC Splice Box
Discharge Assembly
Float Switch Assembly
Orenco Pump, 115V
8
Top View
PrimaryChamberEffluent
Recirc-BlendEffluent
Raw Influent
AX/AXN Filtrate
Top View
Min. 23" Dia.Tank Opening(with cover removed)
DischargePump Basin
AdvanTex Filter
PrimaryChamberEffluent
Typical Materials List
Module AX20, 1B shown.Actual configuration may varyslightly to fit site.

O M&A D V A N T E X ® M A N U A L 9
Tools, Equipment, and Spare Parts List
Many of the recommended maintenance andtroubleshooting procedures require specializedtools, equipment, and spare parts. At a mini-mum, we recommend you keep the followingitems on hand:
Tools and Equipmentanemometer (call for information)
beakers or bottles
camera (preferably digital)
calculator
channel lock pliers—6" and 12"
crimping tool—10 to 22 AWG
drill (cordless, with spare batteries, charger)
drill bit set—1/16" to 1/2"
electrical tester (voltage and amperage)
extension cord
flashlight with spare batteries/bulb
funnel
hacksaw with spare blades
hammer
heat gun (torch)
hole saw (vari-bits: 3/4" and 1-3/8")
hose with nozzle and backflow prevention device
pencil
Mirror on a Stick (available from Prototek)
pressure gauge (0 to 100 psi, 0 to 200 psi)
backpack pressure washer (portable)
screwdriver set (straight blade and Phillips)
shovel
SMUG device
snake (building sewer)
squirt-height gauge
stir sticks
tape measure
watch or stopwatch
wire strippers
wrench (24" pipe wrench)
wrench (lid bolt)
30 gal. garbage can
30 gal. garbage bags
Spare Parts control panel parts:
— breakers
— contactors
fuses
epoxy
floats
heat shrink tubing
insulated butt connectors
king connectors
lid bolts
PVC fittings (3/4" to 2")
PVC glue/primer
PVC pipe (3/4" to 2")
Hygiene and Clean-Upbleach/water solution
hand cleanser
paper towels
protective clothing
eye protection
rubber gloves
towels and rags
MiscellaneousPatience and good humor!
O M&A D V A N T E X ® M A N U A L
Orenco Systems requires regular inspection andmaintenance of AdvanTex Treatment Systems as a condition of purchase. All activities are to be performed three-to-six months after systemstart-up; and an annual field-service inspection,including sampling, is to be scheduled in latespring or in early summer. For AXN systems,there is to be a minimum of four inspectionsduring the first two years, and then annualinspections thereafter.
Following is a list of the routine cleaning andmaintenance procedures we recommend orrequire. Failure to provide required maintenancewill void the AdvanTex Treatment System warranty.
Copies of inspection and maintenance reports,along with any additional documentation, mustbe forwarded to and retained by the AuthorizedAdvanTex Treatment System Dealer who sold thesystem. If there is no Dealer, then the documen-tation must be forwarded to Orenco Systems,Inc., 814 Airway Avenue, Sutherlin, OR 97479, ATTN: Systems Engineering.
Control Panel/Pumps/Alarms
WARNING: Only qualified/certified electri-cians or service providers should perform maintenance on electrical equipment.
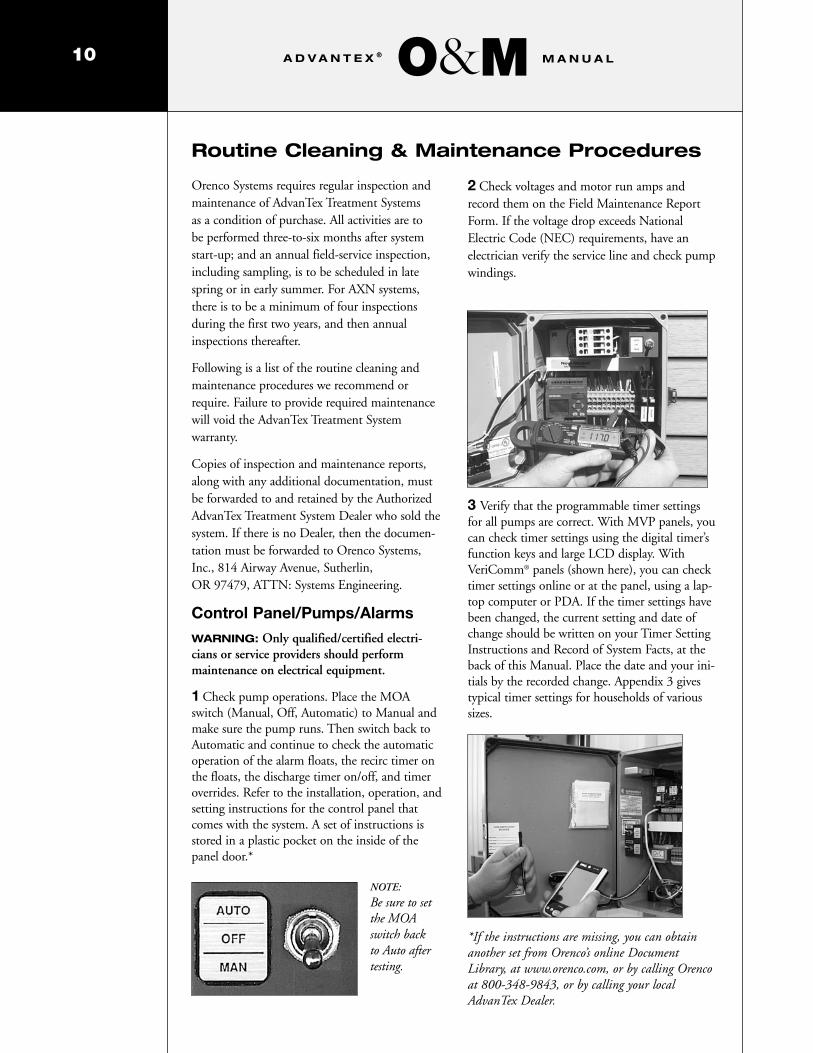
1 Check pump operations. Place the MOAswitch (Manual, Off, Automatic) to Manual andmake sure the pump runs. Then switch back toAutomatic and continue to check the automaticoperation of the alarm floats, the recirc timer onthe floats, the discharge timer on/off, and timeroverrides. Refer to the installation, operation, andsetting instructions for the control panel thatcomes with the system. A set of instructions isstored in a plastic pocket on the inside of thepanel door.*
2 Check voltages and motor run amps andrecord them on the Field Maintenance ReportForm. If the voltage drop exceeds NationalElectric Code (NEC) requirements, have an electrician verify the service line and check pumpwindings.
3 Verify that the programmable timer settingsfor all pumps are correct. With MVP panels, youcan check timer settings using the digital timer’sfunction keys and large LCD display. WithVeriComm® panels (shown here), you can checktimer settings online or at the panel, using a lap-top computer or PDA. If the timer settings havebeen changed, the current setting and date ofchange should be written on your Timer SettingInstructions and Record of System Facts, at theback of this Manual. Place the date and your ini-tials by the recorded change. Appendix 3 givestypical timer settings for households of varioussizes.
*If the instructions are missing, you can obtainanother set from Orenco’s online DocumentLibrary, at www.orenco.com, or by calling Orencoat 800-348-9843, or by calling your localAdvanTex Dealer.
10
Routine Cleaning & Maintenance Procedures
NOTE:
Be sure to setthe MOAswitch back to Auto aftertesting.

O M&A D V A N T E X ® M A N U A L
4 Read and record the elapsed time meter(ETM) and cycle counter (CT) values (from thepanel’s logic controller or from the Web-basedtelemetry software) on the Field MaintenanceReport Form.
ETMs and CTs are valuable troubleshootingtools if problems occur with the system. ETMand CT data signal high water usage, low waterusage or tank leakage, and excessive pumping,among other operating situations.
5 Confirm operation of audible and visualalarms per the installation, operation, and settinginstructions for the control panel that comes withthe system.
Pumping System
Pump systems should be inspected annually toensure that they are operating properly. Unscrewthe stainless steel bolts that fasten the fiberglasslid over the pumping equipment. Remove thefiberglass lid for an inspection that includes thesesteps:
1 Verify that there are no obvious holes or leaksin the riser or around the perimeter of the riserconnection to the tank. Wetness or water marksmay be an indication of weeping.
2 Inspect splice box to ensure lid and connec-tions are secure.
3 Verify that floats are in good condition andproperly secured to the float tree. Verify that floatcords are neatly wrapped inside the riser so thatthey cannot interfere with the operation of thefloats.
4 Verify float operation. With MOA switch inAutomatic, simulate system operation by liftingthe floats in the same order that the liquid wouldlift them (bottom first, top last).
5 Determine whether the Biotube effluent filter needs cleaning by testing the change in thetank’s liquid level when the pump is on. Turn therecirc pump on by flipping the MOA switch inthe control panel to Manual. Watch the liquidlevel inside the screened vault as the pumpis running for about 30 seconds to deter-mine if there is any noticeable liquid leveldifferential between it and the tank liquidlevel. Return the MOA switch to Auto. Whenthe liquid level difference between the inside andoutside of the vault is about two inches or more,or if the low-level alarm is activated, the Biotubecartridge may need to be cleaned.
11

O M&A D V A N T E X ® M A N U A L
If the Biotube needs cleaning, do the following:
• Turn circuit breaker off at service panel
• Switch MOA and circuit breakers in controlpanel to “Off”
• Slide Biotube cartridge out of vault
• If necessary, the RSV valve may be removed toallow room in the riser for cleaning theBiotube
— Pull RSV out of its Quick Disconnect hol-ster (see photo next page) and place it in aplastic trash can
— Hose off the trash can into the tank afterreplacing the RSV
NOTE: Refer to RSV installation instructionsfor details on how an RSV works.
• Hold Biotube cartridge over open inlet of tankor primary compartment
• Carefully spray build-up into tank
• If there are significant solids in vault, removeand clean it too
6 Pull the pump and place it on a cleanable surface, like the riser lid, or in a plastic trashcan. Check the intake screen; wash off particlesas necessary. Record the kinds of particles (cigarette butts, hair, lint, gum, kitty litter, cloth wipes, grease build-up, etc.) on the FieldMaintenance Report form. Report findings to user (for education).
7 Visually inspect the Recirculating Splitter Valve and verify that the liquid level in the tankis within the normal range. If low, the ball mech-anism could be jammed in the seated position.Remove, disassemble, and inspect. If high, theRSV may require cleaning because it is not mak-ing a tight seal when seated. Remove, disassem-ble, and inspect.
NOTE: The figure below shows the RSV adja-cent to the inlet of the processing tank, which istypical for Mode 3 systems (Mode 1 systemshave the RSV in the second compartment of thetank — the Recirc Chamber). To read dimen-sional specifications, see full-sized drawing inInstallation Guide, Appendix 2.
Processing Tank
1 If possible, verify no inlet flow when all house-hold appliances are turned off. Access the inletinspection port for visual verification of lack offlow. If the inlet inspection port is not readilyaccessible, then listen for trickling water at theaccess port. This could indicate faulty fixtures orleaky plumbing. Check building sewer cleanoutfor flow. If faulty plumbing isn’t the problem, the
12

O M&A D V A N T E X ® M A N U A L
sound of trickling water could indicate I & I(infiltration and inflow) from ground or surfacewater. In that case, further investigation is necessary.
2 Inspect the processing tank for the following:
• Liquid depth (should be about 60-70% of thetotal inside depth of the tank)
• Odor (should be musty, not pungent)
• Color/consistency of scum (should be darkbrown with a consistency that varies fromdense and crusty to soft and amorphous)
• Effluent characteristics (should be no oilysheen or foam)
• Sludge and scum thickness (records shouldindicate typical growth accumulation of 1" of scum and 2" of sludge per year for 3-4 occupants)
Measurements of solids accumulation help todetermine when the septic tank needs pumping.A recommendation for pumping should be madewhen the bottom of the scum layer is within 3" of the flow-through port of the baffle or whenthere is an accumulation of sludge to a depthwithin 6" below the flow-through port. After thefirst year’s measurement of septic tank sludge andscum thickness, measurements need to be takenonly about every three years, until the thicknessesapproach their maximum depths.
Textile Filter
1 Inspect for ponding.* The filter should not besaturated. Effluent should move freely throughthe media.
2 While manifold is pressurized, check for prop-er positioning of orifice shields over each orifice.(See photo, step 3, page 14.)
* If there is ponding in the textile filter because of a build-up of oil and grease, scrape a sample of the biomat andhave it analyzed by an environmental lab to determine itscharacteristic. If there is ponding of indeterminate cause,coupled with a pungent odor, it may be necessary to cleanthe textile media. (Excessive cleaning will retard nitrifica-tion. Only clean as often as necessary.) The textile mediahangs in individual sheets, and these sheets can be pulledout for cleaning (if necessary). First, remove theRecirculating Splitter Valve.
Use a hose with spray nozzle or “low-pressure” pressure-washer, connected to the nearest spigot. Wash the biomatinto the underdrain and it will flow back to the tank, aslong as the Recirculating Splitter Valve has been removed.When done, replace RSV.
AccessRiser
AccessRiser
Inlet
Normal L.L.
Top of scum at alarm
Scum
Sludge
A = 3"±
B = 6"±3"
13
Remember: clean filter only if ponding and odor occur.

O M&A D V A N T E X ® M A N U A L
3 Verify that there is equal spray on and underall orifice shields. (Each orifice shield shouldshow signs of organic biomat build-up on andunderneath it. In this case, a clean orifice shieldtop is not better!)
4 Check for clogged orifices (orifice shields with-out spray or biomat build-up underneath). Youshould be able to observe uniform water dropletsdancing around orifice shields while dosing.
5 Assess the character and color of the biomat. Ifit seems appropriate, take a photo and commenton the growth and characteristics of the biologi-cal mat under and around the orifice shields.Biomats are natural and normally appear light-brown to dark-brown and gelatinous in texture.If the mat appears too light (yellowish with thetexture of lard, wax, or margarine), the grease and oil concentrations should be checked.
If routine DO measurements show a decrease inDO, the biomat may be retarding oxygen trans-fer. Make sure there is no ponding or ventilationproblem, then clean the sheets if necessary.
6 Check the odor emitting from the filter. If astrong or offensive odor (e.g., smell of rotteneggs, rotten cabbage, etc.) is emitted, measure theDO level in the filtrate and recirculation cham-ber and adjust the recirc time, if necessary.(Normally, systems will smell musty, earthy, ormoldy but not pungent).
7 Check squirt height and compare residual pres-sure against the start-up value. This may takelonger than just cleaning and flushing the mani-fold, but will help establish frequency of cleaning.
If the squirt height is 40-50% higher than thestart-up value, clean and flush the manifold. (A 50% increase in squirt height signals approxi-mately 18% orifice blockage.) To flush lateralsyou can run the pump or use a bottle brush or
pressure washer. Brushing or pressure washing isbest. (When you flush the laterals, biosolidsslough into the bottom of the filter, flushing theunderdrain at the same time, then return to the tank.) Verify again that all orifices are clear.Re-check squirt height.
8 Regardless of squirt height, be sure to open theflush valves and run the pump for two-to-threeminutes to flush solids and biomass from thepod’s underdrain back into the tank. This onlytakes a couple of minutes and can be done whileaccomplishing other tasks.
9 Verify passive ventilation and air flow. Use ananemometer (available through Orenco) tomeasure the air flowing through the system. 1-3 cubic feet per minute (cfm) is typical. Thefollowing chart shows how much airflow isneeded* to handle the indicated strength ofBOD5 and ammonia:
14
Flushing with pump
Flushing with pressurewasher or bottle brush

O M&A D V A N T E X ® M A N U A L
Unit Flow BOD5 Ammonia Req. Air Flow(gpd) (mg/L) (mg/L) (cfm)
AX20 500 150 65 0.8
*Ultimately, treatment is accomplished and final effluentquality provides the effective measure of treatment per-formance and capacity. Typical dissolved oxygen levels inthe filtrate effluent will range from 3.5 to 5 mg/L DO.
In the above photo, the measurement on the meter showsair velocity of 124 feet/minute, which, after mathemati-cal conversion, means that 2.7 cfm (cubic feet/minute) isbeing drawn through the vent line. Slight atmosphericconditions are more than sufficient to cause two or moreair changes to occur every hour.
Record inlet air flow and outlet air flow, whereapplicable, to ensure there isn’t a large differencebetween them. A large difference means thatleaking or bypassing is occurring. Clean ventpipe as necessary.
Miscellaneous
1 Exercise all mechanical valves. Fully open andclose valves to ensure they have not failed orbecome stuck in one position.
2 Before leaving the site ...
a) Review the Maintenance Checklist to ensureall activities have been performed.
b)Be particularly careful to ensure the following:
— Valves are back in their recommendedpositions
— Control panel has been set back to automatic and circuit breakers have all been switched back on
— Household water lines have been turnedback on (if they were turned off earlier inthe visit for I & I evaluation)
— Lids and lid bolts are properly in placeand tightened
Documentation
1 Complete all documentation and submit any required reports to the appropriate parties/agencies. Be sure to send a copy to the AdvanTexDealer.
CAUTION! While providing O&M services, be sure to use proper personal protection equip-ment, such as rubber gloves and eye protection,as well as protective clothing, to cover parts ofthe body that will be exposed to wastewater oreffluent. When finished, use proper personalhygiene.
15

O M&A D V A N T E X ® M A N U A L16
Effluent Testing Procedures
Orenco Systems recommends regular testing ofeffluent from AdvanTex Treatment Systems aspart of system maintenance. Copies of test resultsand additional comments/documentation mustbe forwarded to and retained by the AuthorizedAdvanTex Treatment System Dealer who sold thesystem. If no Dealer was involved in the sale,then documentation must be forwarded toOrenco Systems, Inc., 814 Airway Avenue,Sutherlin, OR 97479, ATTN: SystemsEngineering.
Protocol for Sampling, Testing,and Analysis
Sampling Locations — For residential systems,sample the discharge filtrate at the filtrate splittervalve. This location is illustrated on your systemdrawings. Pull the RSV out of its QuickDisconnect holster and lay it on a flat surface.Take the sample at the RSV inlet.
To take a sample that accurately represents thesystem’s effluent quality, do two things:
1. Wash down, brush, or wipe the RSV inletbefore taking the sample so that dislodgedsolids will not contaminate the sample.
2. Don’t run the pump manually to force aquick sample. Take the sample during normalsystem operation.
Sampling Schedule — Typically schedule full-scale annual sampling events for spring.
Sampling and Storage Methods — Samplingequipment, minimum sample size, and storageprocedures should conform to those recommend-ed in the most current edition of StandardMethods for the Examination of Water andWastewater, American Public Health Association(APHA), available from the Water EnvironmentFederation, 703-684-2400.
Analytical Methods — Analytical methodsshould conform to Standard Methods, cited above.
Routine Tests, Frequencies, and Typical Values
While regional requirements vary, Orenco recom-mends that the following effluent tests be per-formed three to six months after system start-up.An annual field-service inspection, including sam-pling, is to be scheduled in late spring or in earlysummer. For AXN systems, there must be at leastfour inspections during the first two years, withsampling once a year as described on the FieldSampling Report Form, and then annual inspec-tions with sampling thereafter.
These tests can be performed in the field; theycost very little and do not require lab work.However, they are very useful in assessing systemperformance and maintenance.
Parameter Methodology Typical Values*
Clarity Visual1 Clear (15± NTUs)
Odor Sniff 2 Non-offensive (musty isOK; rotten egg or cabbageis not OK)
Biotube® Visual No liquid level differentialinside/outside vaultNorm: 1-2 year cleaninginterval for recirculatingsystems
Oily film Visual; inside None; no red, blue,the pump vault green, or orange sheen
Foam Visual; inside tank None
pH Field 3 6-9
*Source: These typical values are recommended by varioussources. Biotube parameters are based on Orenco researchand development.
1 To check for clarity, service providers can carry a sample bottle of typical effluent, to compare against, or can use a portable turbidity meter.
Always put effluent sample in a clear glass container orbeaker to evaluate clarity. Using a small, removable sticker, write the date and place it low on the beaker.

O M&A D V A N T E X ® M A N U A L
2 To check for odor, service providers can simply sniff theeffluent sample or can use a sulfide measuring packet oran olfactory snifter device for detection of odors.
3 To check for pH, service providers can use litmus paper,a pocket pH meter, or a benchtop pH meter.
Supplemental Testing andTypical Values
If effluent is cloudy or smells pungent or if thebiomat on the textile filter appears greasy, waxy,or oily, further tests and troubleshooting of thefiltrate should be performed. The following filtrate tests provide invaluable information fortroubleshooting and diagnosing problems andcauses:
Parameter Methodology Typical Values (mg/L)AX1
Mode 1 Mode 3
BOD5 Grab 10± 10±
TSS Grab 10± 10±
TN Grab 25± 5-15±
G&O Grab <1
DO Field2 2.5-6±
pH Field 6-8±
1 AX values are based on Orenco and third-party testing.2 To check for Dissolved Oxygen, use a DO meter, avail-
able from VWR Scientific, Cole-Parmer, or Hach.3 Typical nitrogen reduction ranges from 60-80%±,
with sufficient carbon source and alkalinity.
Relationship Between TestResults and Loading Rates
As noted on pages 6-7, filtrate quality is depend-ent on a number of factors, including influentcharacteristics and loading rates. The followingcharts show how low-to-moderate loading ratesproduce BOD and TSS of <5mg/L, while higherloading rates produce BOD and TSS in the rangeof 15-25 mg/L.
17
NovaTec48.3 gpd/ft2
4 mo.
NovaTec60 gpd/ft2
10 mo.NovaTec60 gpd/ft2
10 mo.NovaTec48.3 gpd/ft2
4 mo.
O M&A D V A N T E X ® M A N U A L
Once you know the typical values for wastewatertreatment system performance (see pages 6, 7,16, and 17), you can be proactive and trou-bleshoot nontypical process indicators, before sys-tem performance is affected.
Troubleshooting Effluent Quality
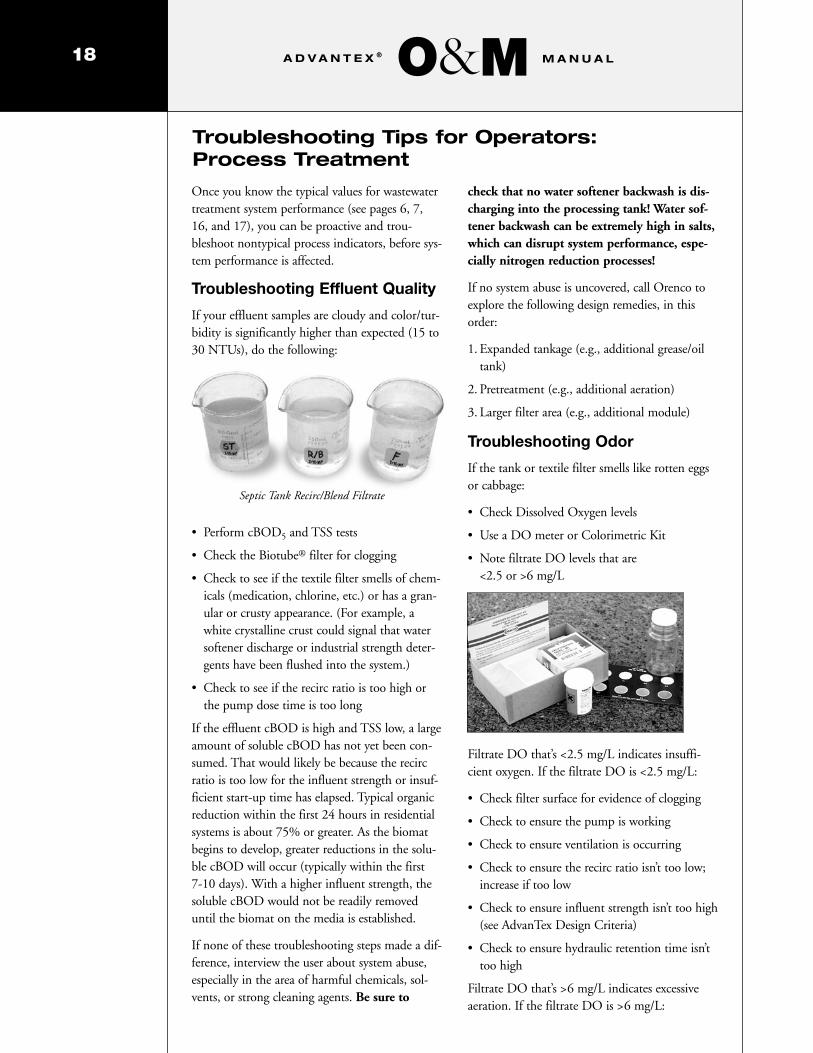
If your effluent samples are cloudy and color/tur-bidity is significantly higher than expected (15 to30 NTUs), do the following:
• Perform cBOD5 and TSS tests
• Check the Biotube® filter for clogging
• Check to see if the textile filter smells of chem-icals (medication, chlorine, etc.) or has a gran-ular or crusty appearance. (For example, awhite crystalline crust could signal that watersoftener discharge or industrial strength deter-gents have been flushed into the system.)
• Check to see if the recirc ratio is too high orthe pump dose time is too long
If the effluent cBOD is high and TSS low, a largeamount of soluble cBOD has not yet been con-sumed. That would likely be because the recircratio is too low for the influent strength or insuf-ficient start-up time has elapsed. Typical organicreduction within the first 24 hours in residentialsystems is about 75% or greater. As the biomatbegins to develop, greater reductions in the solu-ble cBOD will occur (typically within the first 7-10 days). With a higher influent strength, thesoluble cBOD would not be readily removeduntil the biomat on the media is established.
If none of these troubleshooting steps made a dif-ference, interview the user about system abuse,especially in the area of harmful chemicals, sol-vents, or strong cleaning agents. Be sure to
check that no water softener backwash is dis-charging into the processing tank! Water sof-tener backwash can be extremely high in salts,which can disrupt system performance, espe-cially nitrogen reduction processes!
If no system abuse is uncovered, call Orenco toexplore the following design remedies, in thisorder:
1. Expanded tankage (e.g., additional grease/oiltank)
2. Pretreatment (e.g., additional aeration)
3. Larger filter area (e.g., additional module)
Troubleshooting Odor
If the tank or textile filter smells like rotten eggsor cabbage:
• Check Dissolved Oxygen levels
• Use a DO meter or Colorimetric Kit
• Note filtrate DO levels that are <2.5 or >6 mg/L
Filtrate DO that’s <2.5 mg/L indicates insuffi-cient oxygen. If the filtrate DO is <2.5 mg/L:
• Check filter surface for evidence of clogging
• Check to ensure the pump is working
• Check to ensure ventilation is occurring
• Check to ensure the recirc ratio isn’t too low;increase if too low
• Check to ensure influent strength isn’t too high(see AdvanTex Design Criteria)
• Check to ensure hydraulic retention time isn’ttoo high
Filtrate DO that’s >6 mg/L indicates excessiveaeration. If the filtrate DO is >6 mg/L:
18
Troubleshooting Tips for Operators: Process Treatment
Septic Tank Recirc/Blend Filtrate

O M&A D V A N T E X ® M A N U A L
• Check to ensure recirc ratio isn’t too high
• Check to see if influent flows are below normal
• If influent flows are below normal or recircratio is too high, reduce recirc ratio
Troubleshooting Biotube FilterClogging
If a visual inspection of the Biotube filter for bio-mass build-up shows the need for cleaning moreoften than once every 1-2 years (which is typical for recirculating systems), try the following:
• Verify the pump isn’t running too long (typically 3 cycles/hour)
• Ensure the recirc ratio isn’t too high
• Verify normal DO levels; if high, reduce recirc ratio
• Check for below normal influent flows
• Check influent Grease & Oil and TSS; ifexcessive, a review of component sizes may be required
Troubleshooting Oily Film
All signs of oil or grease anywhere in the system(in the tank, in the vault, on the effluent or tex-tile filter) must be investigated. Ask the systemuser to identify the probable source:
• Recent change of car oil?
• Canning meat or poultry?
• Excessive use of garbage disposal?
• Excessive use of bath or mineral oils? (Jacuzzi® tub?)
• Excessive use of detergents?
If the system user can’t identify the probablesource, try the following:
• Sample/test effluent for BOD5 and Grease & Oil
• Sample/test at all process steps, including influent (if possible)
• Label, date, and photograph all samples
• Use standard glass beakers and set samples infront of a common, uniform background,when photographing
• Check biomat accumulation at AdvanTexFilter
• Note if biomat is yellowish and wax-like orlard-like. If so, scrape biomat sample foranalysis:
— Photograph/document biomat sample
— Send to lab with effluent samples
Note: Excessive Grease & Oil (>25 mg/L) is typically a design and management concernwith commercial applications.
Troubleshooting Foam
Foam indicates that microbes are producingexcessive gas byproducts. Foam rarely occurs inpacked bed filters (and AdvanTex is a packed bedfilter). If foam is present:
• Verify the pump isn’t running too long
• Ensure the recirc ratio isn’t too high
• Ask residents about detergent use
As an aid to troubleshooting, Appendix 3 givestypical timer settings for households of varioussizes.
19

O M&A D V A N T E X ® M A N U A L
AdvanTex Treatment Systems do an excellent jobof reducing nitrogen, especially in the Mode 3configuration, where Total Nitrogen* is typicallyreduced to 10 mg/L ±, with influent TKN of 55-65 mg/L. Because many people purchaseAdvanTex for its nitrogen reducing capabilities,and because nitrogen reduction is a complex,many-staged process, it’s important to under-stand the process, its related factors, the signs ofeffective nitrogen reduction, and how to keep theprocess optimized.
It’s also important to know the Total Nitrogenlimits required by the system user’s permit. Someregulatory agencies have no requirement; somerequire a specific percentage reduction of a cer-tain kind of nitrogen (90-95% nitrification ofammonia nitrogen, for example); and somerequire that Total Nitrogen be reduced to levelsat or near drinking water quality at the point offinal dispersal.
Finally, because influent characteristics greatlyaffect the amount of nitrogen reduction possiblefrom any given system, it’s vital to know the alkalinity of your waste source and the local/regional norms for organic and ammonia nitrogen.
The Process
In nitrogen reduction, ammonia is converted tonitrate and then reduced through bacterial actionto nitrogen gas, which can be released harmlesslyto the atmosphere. Optimum nitrogen reductionrequires the following:
• Adequate alkalinity of approximately 250±mg/L or higher (lab test shows levels)
• pH of 6-8. Fixed film microbial processes gen-erally thrive between pH 5.5 and 9. Treatmentproblems typically result from rapid changes inpH rather than extreme long-term mean val-ues, although long-term levels can result in lessefficient process activity
• Filtrate DO level of 2.5-8 mg/L, process tankDO level of <1 mg/L
• Adequate time for the nitrifying bacteria todevelop (one to three months)
• Adequate temperature (below 40° F retards the process)
• Good organic removal
For a thorough description of the nitrogen reduc-tion process, see Appendix 1. In residential waste-water, the ammonia level is typically about 60mg/L and the Total Nitrogen level is typicallyabout 65 mg/L.
Signs of Effective NitrogenReduction
Service providers frequently ask us, “How do Iknow if my wastewater treatment system isreducing nitrogen?” A thorough description ofkey indicators is included in the Appendix.Following is a brief summary:
• Clear, odorless filtrate effluent (a “see andsniff” test is generally considered sufficient)
• Normal-looking biomat on the textile filter(light-brown to dark-brown and gelatinous intexture)
Additional Filtrate Tests Will Show ...
• Typically, low BOD5 and high clarity
• DO of 2.5-6 mg/L and odorless or odor that isnot a nuisance
• Relatively low ammonia and high nitrate levels, since nitrification converts ammonia to nitrate
20
O&M For Nitrogen Reduction
* Total Nitrogen is the sum of organic and ammonia nitrogen, nitrate nitrogen, and nitrite nitrogen.(TN=ON + NH3-n + NO3-n + NO2-n ... or ... TN=TKN-n + NO3-n + NO2-n)

O M&A D V A N T E X ® M A N U A L
Troubleshooting NitrogenReduction
If you suspect that the System is not meetingexpectations for nitrogen reduction, troubleshooteach of the critical factors that contribute to opti-mum nitrogen reduction, to determine a cause.
Filtrate Alkalinity Too Low — Available alka-linity determines the degree of nitrification possi-ble for any wastewater treatment system, becauseit takes 7.14 parts alkalinity to nitrify 1 partammonia.
If filtrate alkalinity is too low:
• Check the recirc ratio; a high recirc ratioincreases alkalinity consumption*
• Check influent TKN or ammonia levels andsource alkalinity
If a large quantity of nitrification is required, itmay be necessary to add a buffering compoundto the system, to raise alkalinity levels.
Filtrate pH Too Low — Nitrification is particu-larly sensitive to pH but tends to thrive at levelsbetween pH 7.2 and 9. The nitrification processreleases hydrogen that consumes alkalinity andcauses pH levels to drop.
A pH level of <6 retards microbial activity of allkinds, including denitrification. Maintaining analkalinity of 50 to 80 in the effluent is typicallysufficient to maintain pH levels above 5.5. If thefiltrate pH level is too low:
• Check influent alkalinity level (pH drops whentoo much available alkalinity is consumed)
• Check recirc ratios; reduce if too high*
• Ask system user about chemical discharges intothe system, including carpet cleaners, chlorine,and photo developing agents
Filtrate DO Levels Outside Range of 2.5-6 mg/L — If your filtrate DO is too low(indicating insufficient oxygen), you may experi-ence periodic sulfide odors during dosing events,or perhaps a more lasting smell within the filterpod. Try the following:
• Check for surface clogging/ponding and cleanas necessary
• Check air flow through the vent assembly
• Check the recirc ratio; if it’s too low (<2:1±)increase as necessary*
If your filtrate DO is too high (indicating excessive aeration), it’s likely that excessive recirculation or insufficient hydraulic retentiontime are factors. Try the following:
• Decrease the recirc ratio*
High Filtrate Ammonia Levels — Becauseammonia is consumed during nitrification, highammonia levels are a sign that something isamiss. Try the following:
• Check for surface clogging/ponding and cleanas necessary
• Check for sufficient aeration (measure DO)
• Ensure no blockage of air flow into textile filter(indicated by thick biomat development or abuild-up of grease and oils)
• Ensure no blockage in the manifold, causing ...
— Localized hydraulic overloading, saturation
— Short circuiting
• Check for sufficient alkalinity; if insufficient,consider supplemental buffering. Call OrencoEngineering for assistance, if necessary.
21
*Keep in mind that a recirc ratio that’s too high can generate a highly aerobic biomat growth on the pump filter; and a recirc ratio that’s too low can tend to liberate periodic odors during dosing events. So search for the optimum ratio(typically between 2 and 4:1)

O M&A D V A N T E X ® M A N U A L22
Low Filtrate Nitrate Levels — Residentialpacked bed filters normally yield 98+ percentnitrification (ammonia to nitrate). Therefore theammonia levels in the filtrate should be low andthe nitrate levels higher. Some denitrification typ-ically is experienced through the packed bed fil-ter. So the normal nitrate level may vary. Be sureyou are familiar with the mode of operation, assome AdvanTexmodes are configured to producelower nitrate levels. If it appears that nitrificationis dropping off:
• Check the recirc ratio; adjust as necessary*(high recirc ratios may drive pH too low foreffective nitrification/denitrification and lowrecirc ratios may not provide sufficient aeration)
• Verify incoming ammonia levels
• Check recirc/blend for sufficient organic foodsource (high BOD — see Table, page 7 —may cause greater oxygen demand through thefilter, reducing nitrification)
Adequate Time and Temperature —Nitrifying bacteria require one to two months todevelop, and extremely cold temperatures (below40° F) retard that process. If the AdvanTexTreatment System has been installed in a verycold climate, nitrification may not “kick in” forseveral months until warmer temperatures arereached. Typically, a June-September installationprovides the necessary temperatures for a 30-60day nitrification start-up time. Once nitrifiers colonize, they typically continue to nitrifythrough normal winter conditions. Only inseverely cold regions should additional insulationbe necessary.
*Keep in mind that a recirc ratio that’s too high can generate a highly aerobic biomat growth on the pump filter; and a recirc ratio that’s too low can tend to liberate periodic odors during dosing events. So search for the optimum ratio(typically between 2 and 4:1)

Field Maintenance Report 23
AdvanTexTreatment SystemsWhile regional regulations may vary, Orenco Systems requires that the following inspection and maintenanceactivities be performed, by a qualified provider, on all AdvanTex Treatment Systems sold. All activities are to beperformed three-to-six months after system start-up; and an annual field-service inspection, including sam-pling, is to be scheduled in late spring or in early summer. For AXN systems, there is to be a minimum of fourinspections during the first two years, and then annual inspections thereafter. Copies of inspection and mainte-nance reports and additional comments/documentation are to be forwarded to the AdvanTex Dealer, or if no Dealer, to Orenco Systems, 814 Airway Avenue, Sutherlin, OR 97479.
Date: __________________ Site: ______________________________ Operator: ______________________________
Maintenance Activity Activity Check-Off/NotesA) Inspect Control/Alarm Panel
1) Check pump operations in manual mode �� __________________________
2) Check/record pump amperage and voltage �� __________________________
Voltage at rest: ______ Amps at rest: ______ Amps while pumping: ______
3) Check timer settings �� __________________________
4) Record elapsed time meter and counter readings (if applicable) �� __________________________
5) Confirm operation of audible and visual alarms �� __________________________
B) Inspect/Test Pumping System
1) Verify no leaks in riser �� __________________________
2) Inspect splice box for moisture and secure connections �� __________________________
3) Verify condition of and correct operation of all floats �� __________________________
4) Verify neat wrap of float cords �� __________________________
5) Pull pump and clean intake screen if necessary �� __________________________
6) Visually inspect recirculating splitter valve and liquid level �� __________________________
C) Inspect Effluent Filters/Pump Screens
1) Clean as needed �� __________________________
2) Visually inspect and comment on biomat growth �� __________________________
D) Inspect Processing Tank
1) Verify no inlet flow �� __________________________
2) Inspect liquid depth, odor, scum color, effluent characteristics �� __________________________
3) Measure sludge and scum; recommend tank pumping, if necessary �� __________________________
E) Inspect AdvanTex Filter
1) Inspect for ponding; assess character and color of biomat �� __________________________
2) Check squirt height �� __________________________
3) Verify proper orifice position, equal spray under orifices, no clogged orifices �� __________________________
4) Check for odors; adjust recirculating time if necessary �� __________________________
Normal: �� Musty �� Earthy �� Moldy
Pungent: �� Sulfide �� Cabbage �� Decay
5) Clean and flush manifold (if necessary) �� __________________________
6) Re-check squirt height �� __________________________
7) Flush underdrain �� __________________________
8) Inspect intake vent and clean as necessary �� __________________________
F) Miscellaneous
1) Exercise all valves �� __________________________
2) Return valves, control panel to proper settings �� __________________________
3) Submit required documentation �� __________________________
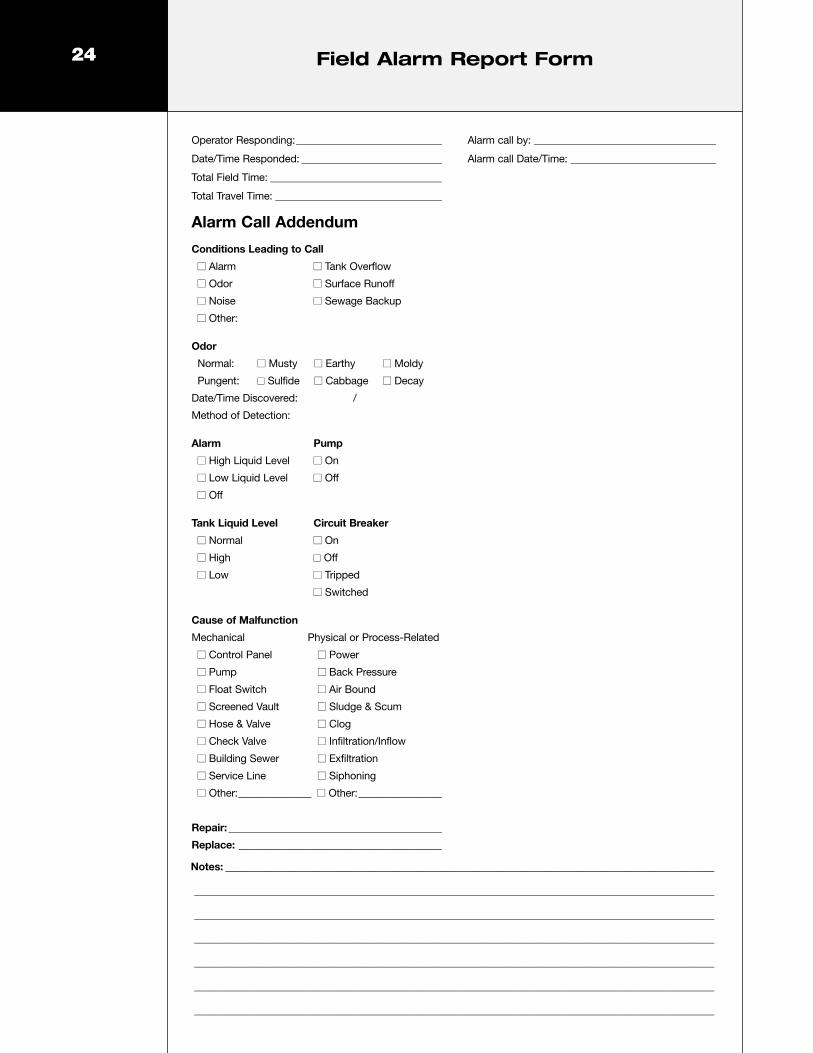
24 Field Alarm Report Form
Alarm Call Addendum
Conditions Leading to Call
�� Alarm �� Tank Overflow
�� Odor �� Surface Runoff
�� Noise �� Sewage Backup
�� Other:
Odor
Normal: �� Musty �� Earthy �� Moldy
Pungent: �� Sulfide �� Cabbage �� Decay
Date/Time Discovered: /
Method of Detection:
Alarm Pump
�� High Liquid Level �� On
�� Low Liquid Level �� Off
�� Off
Tank Liquid Level Circuit Breaker
�� Normal �� On
�� High �� Off
�� Low �� Tripped
�� Switched
Cause of Malfunction
Mechanical Physical or Process-Related
�� Control Panel �� Power
�� Pump �� Back Pressure
�� Float Switch �� Air Bound
�� Screened Vault �� Sludge & Scum
�� Hose & Valve �� Clog
�� Check Valve �� Infiltration/Inflow
�� Building Sewer �� Exfiltration
�� Service Line �� Siphoning
�� Other:______________ �� Other:________________
Repair: _________________________________________
Replace: _______________________________________
Operator Responding:____________________________
Date/Time Responded: ___________________________
Total Field Time: _________________________________
Total Travel Time: ________________________________
Alarm call by: ___________________________________
Alarm call Date/Time: ____________________________
Notes: ______________________________________________________________________________________________
____________________________________________________________________________________________________
____________________________________________________________________________________________________
____________________________________________________________________________________________________
____________________________________________________________________________________________________
____________________________________________________________________________________________________
____________________________________________________________________________________________________

25
Date: _______________________________________________________________________________________________
Inspector: ___________________________________________________________________________________________
Address: ____________________________________________________________________________________________
System Type: ________________________________________________________________________________________
The following effluent tests can be easily and routinely performed in the field. Perform annually, or as frequently
as necessary per the methodology indicated. For AXN systems, there is to be a minimum of four sampling
events the first two years and then annual sampling thereafter. Record your results/observations in the space
provided:
Parameter Methodology Typical Field Observations Pre-Test Lab Concurrence
Clarity Visual1 Clear (15 ± NTUs) _____________________
_____________________ ________________________
Odor Sniff2 Non-offensive (no _____________________ ________________________
smell of rotten eggs _____________________ ________________________
or cabbage; a musty, _____________________ ________________________
earthy, or moldy odor _____________________ ________________________
is normal) _____________________ ________________________
Oily film Visual; inside tank None (no red, blue, _____________________
green, or orange _____________________
sheen) _____________________
Foam Visual; inside tank None _____________________
pH Field 6-9 _____________________
Date_________________ Date: ___________________
_____________________ ________________________
Signature Signature
Field Sampler Lab Technician
1 To check for clarity, service providers can carry a lab-prepared sample bottle or bottles with known turbidities of 15NTUs and 30 NTUs, to compare against, or can use a portable turbidity meter. Always put effluent sample in aclear glass container or beaker to evaluate clarity. Using a small, removable sticker, write the date, place it low on thebeaker, and photograph for documentation.
2 To check for odor, service providers can simply sniff the effluent sample with the assistance of an olfactory snifterdevice and/or sulfide odor measuring packet. Whenever possible, interview system users about odor occurrences andrequest user’s assistance in verifying or detecting odors.
Field Sampling Report Form

26
Electronic Time Meter Log
Date ETM Reading ETM Differential Number of Duration: Minutes/Cycle
(Current - Prev.) Intervening Days (ETM Diff. / Interv. Days)
____________________________________________________________________________________________________
____________________________________________________________________________________________________
____________________________________________________________________________________________________
____________________________________________________________________________________________________
____________________________________________________________________________________________________
____________________________________________________________________________________________________
____________________________________________________________________________________________________
Comments: _________________________________________________________________________________________
____________________________________________________________________________________________________
____________________________________________________________________________________________________
Cycle Log
Date Cycle Reading CT Differential Number of Frequency: Cycles/Day
(Current - Prev.) Intervening Days (CT Diff. / Interv. Days)
____________________________________________________________________________________________________
____________________________________________________________________________________________________
____________________________________________________________________________________________________
____________________________________________________________________________________________________
____________________________________________________________________________________________________
____________________________________________________________________________________________________
____________________________________________________________________________________________________
Comments: _________________________________________________________________________________________
____________________________________________________________________________________________________
____________________________________________________________________________________________________
ETM/CT Log & Worksheet

27
Two-Compartment Tank
Operator Responding:____________________________
Address:________________________________________
Phone: _________________________________________
Date/Time Responded: ___________________________
Date of Installation: ______________________________
Date of Last Pumping: ___________________________
Scum & Sludge Monitoring
Date Depth Rate of (Inches) Accumulation
________________________________________________
________________________________________________
________________________________________________
________________________________________________
First Compartment Scum
Date Depth Rate of (Inches) Accumulation
________________________________________________
________________________________________________
________________________________________________
________________________________________________
Second Compartment Scum
Date Depth Rate of (Inches) Accumulation
________________________________________________
________________________________________________
________________________________________________
________________________________________________
First Compartment Sludge
Date Depth Rate of (Inches) Accumulation
________________________________________________
________________________________________________
________________________________________________
________________________________________________
Second Compartment Sludge
Comments: _________________________________________________________________________________________
____________________________________________________________________________________________________
____________________________________________________________________________________________________

O M&A D V A N T E X ® M A N U A L28
The ProcessNitrogen removal (or “nitrification/denitrifica-tion”) is a biochemical process in which ammo-nia is converted to nitrate (nitrification) (2NH3
converts to 2NO3 + 3H2O) and then reducedthrough bacterial action (denitrification) to nitro-gen gas, which can be released harmlessly to theatmosphere.
During the nitrification process, about 9 partsoxygen are consumed in converting 2 partsammonia to nitrate. Therefore, depending on theconcentration of ammonia, a considerableamount of air may be needed. Other processes,like biological (BOD) reduction, may occursimultaneously and further elevate the demandfor aeration, especially if the organic level is high.
In an abundance of air, all the aerobic or faculta-tive microbes compete for their share of oxygen.When the organic concentration is high, themicrobes that oxidize organic matter, primarilythe heterotrophic bacteria, are aggressive andtend to outcompete other microbes for the avail-able free oxygen in solution. The oxidation ofammonia is accomplished by autotrophic bacte-ria, which do not have as aggressive of a growthrate, so if there isn’t an abundance of oxygen,nitrification suffers. Consequently, the nitrifica-tion process usually lags until the organic concen-tration is depleted or until sufficient oxygen ispresent. At a 2.5:1 BOD/TKN ratio, the nitri-fiers may only make up about 10 percent of themicrobial population. At 0.5:1 BOD/TKN, thenitrifiers make up about 35 percent of the popu-lation.
In a filtering process, the filter column must bedeep enough, or the filter media must be efficientenough at filtering organic particles, to depleteorganic concentrations to a level in which a suffi-cient population of nitrifiers will be sustained.The physical (dimensional) features of the filterwill vary depending on the media’s characteristics— void ratio, moisture holding capacity, andeffective surface area per unit volume ratio.Tankage, surge capacity, application rates, andloading characteristics are other design considera-
tions that play a role in the sizing of the filterunit.
Performance Indicators To judge the nitrogen-reducing performance (orpotential) of any wastewater treatment system, be sure to check the following performance indicators:
Clear, Odorless Effluent — Simple, “see andsniff” tests can be performed easily in the field.Effluent from packed bed filters (recirculatingtextile filters, recirculating sand filters, intermit-tent sand filters) that are performing well shouldbe clear (with turbidity <20 NTUs±) and odorless.
Tests for Ammonia and Nitrate Nitrogen —If your system is oxidizing ammonia to nitrate(nitrifying), lab tests should measure relativelylow ammonia levels and relatively high nitratelevels in the filtrate. Because nitrificationresponds to many and varying conditions withinthe aerobic treatment processes, ammonia andnitrate nitrogen levels in the filtrate are the mostideal constituents to watch for any changes inperformance. Start-up times can be plotted, opti-mum recirc ratios can be gauged, cleaning fre-quencies can be predicted, and nonvisible clog-ging or saturation detected by watching either ofthese constituents.
Typical nitrification in single-family residentialsystems is expected to be in the 98-99% range.You’ll want to investigate if the process appears todegrade by 5 percentage points or more.
BOD — The nitrification process requires oxy-gen, which is why nitrification is enhanced whenBOD is extremely low. Measures of filtrate BODshould be <15 mg/L, although higher BOD maynot necessarily correlate with low levels of nitrifi-cation.
Typical influent characteristics are shown on page7. When BOD5 is high, there is a greater organicdemand for oxygen, which may hamper thenitrogenous demand for oxygen. Increasing therecirc ratio should help establish oxygen balance.
Appendix 1: The Nitrogen Reduction Processand Key Indicators

O M&A D V A N T E X ® M A N U A L 29
Dissolved Oxygen — Dissolved oxygen alsoprovides critical information with which to diag-nose how well a system is performing. Measuresof Dissolved Oxygen should be in the range of2.5 to 6 mg/L. If the DO level drops, the degreeof nitrification will normally drop as well, whichcould be a sign of blinding or saturated flow con-ditions — anything that might inhibit free airfrom flowing into the system. (Though it’s quitepossible to have low filtrate DOs and still havehigh effluent quality, as measured by BOD andTSS levels.)
Biological Growth on Filter — With “fixedfilm” treatment systems, biological growth on thefilter media is natural. The biomat should appearlight-brown to dark-brown in color and gelati-nous in texture.
Influent Characteristics — Influent character-istics (see page 7) will greatly affect the amountof nitrogen reduction that is possible from anywastewater treatment system. High solids and/orfats and cooking oils increase the oxygendemand and accumulation of material on andwithin the media, affecting the available oxygenfor nitrification.
pH — For normal residential nitrogen loads, pHis typically maintained between 6 and 8.
Alkalinity — The nitrification process releaseshydrogen ions into solution, which tends tolower the pH level. Alkalinity is essential fornitrification. For each part ammonia that is nitri-fied, 7.14 parts alkalinity are consumed (buffer-ing the acidity caused by the release of hydrogenions). Consequently, if the degree of nitrificationis less than expected, it could simply be a lack ofsufficient alkalinity to support more. Typical resi-dential nitrification requires alkalinity above250± mg/L for recirculating processes and doublethat for single pass processes. Many wastewaterstreams do not have sufficient alkalinity to supportcomplete nitrification.
Wastewater streams without sufficient alkalinityto support complete nitrification may, dependingon the type of process, cause a depletion in thealkalinity to the point where its ability to bufferstops. The pH correspondingly drops to a levelthat retards the microbial activity (<6±).Recirculating the effluent helps, since half the
alkalinity can be restored in the recirc or processtank, wherever denitrification occurs (and adjust-ing the recirc ratios may also bring the pH backto preferred operating levels). But wastewaterstreams that are alkalinity-starved can’t providefor 100% nitrification.
The use of low flush fixtures requires special con-sideration. Low flush fixtures tend to reducehydraulic loads, which causes elevation of waste-water constituents (i.e., higher concentrations ofBOD, TSS, TKN, etc.). In this case, the availablealkalinity in the water supply may not be ade-quate to accomplish the full level of nitrificationdesired.
These constraints exist for all wastewater treat-ment operations, regardless of whether the opera-tion involves a suspended growth contact stabi-lization process or an attached growth packedbed filter. Packed bed systems will perform better,especially if they have a large attached growthsurface area per unit volume ratio, because themicro-sites near the attached side of the biomat,where denitrification typically occurs, returnsome of the alkalinity. Textile packed bed filters,because of their large surface area per unit vol-ume ratio, tend to perform even better.Nevertheless, additional buffering may be neces-sary to accomplish the level of nitrificationdesired. In low alkalinity conditions, pH adjust-ment can be made with the addition of Quick orHydrated lime, soda ash, or caustic. (Note: atprocess points preceding sedimentation zones,lime adjustment — buffering — would be pre-ferred. Soda ash and caustic both contain sodi-um, which is a dispersant.)

3D Three dimensional (typically refers to a drawing)
amps Amperage
alkalinity Alkalinity is not a specific pollutingsubstance, but a combination of factors. It is the ability of water toneutralize an acid, and is due primari-ly to the presence of carbonate (seepH). Alkalinity is also essential fornitrification (for each part ammonianitrified, 7.14 parts alkalinity areused.) Insufficient alkalinity will resultin incomplete nitrification.
AX AX stands for Aligned Textile (hangingstyle) treatment media.
AWG American Wire Gauge
BOD5 Five-day biochemical oxygen demand
CB Circuit breakers
cfm Cubic feet per minute
CT Counter (a device that counts)
dia. Diameter
diff. Differential
DO Dissolved oxygen
EC E. Coli (Escherichia coli)
ETM Elapsed time meter
F Fahrenheit
FC Fecal coliform bacteria
ft. Feet
H20 Water
hp Horsepower
I & I Infiltration and inflow
interv. Intervening
gal. Gallon
G&O Fats, oils, and grease (aka FOG). Fatsand oils are the third major compo-nent of foodstuffs. The term “grease”as commonly used includes the fats,oils, waxes, and other related con-stituents found in wastewater. Fatsand oils are contributed to domesticwastewater in butter, lard, margarine,and vegetable fats and oils. Fats arealso commonly found in meats, in thegerminal area of cereals, in seeds, innuts, and in certain fruits. Fats areamong the more stable of organiccompounds and are not easilydecomposed by bacteria.
gpd Gallons per day
gpm Gallons per minute
grab sample An individual discrete sample
collected over a period of time not to exceed 15 minutes
min. Minute(s)
mg/L Milligrams per liter
Mode 1 AdvanTex Treatment System configuration in which the textile filter’s filtrate returns to the outlet endof the processing tank
Mode 3 AdvanTex Treatment System configuration in which the textile filter’s filtrate returns to the inlet endof the processing tank
MOA Manual/On/Off switch in control panel
NEC National Electric Code
NH3 Ammonia gas
NH4 Free ammonia
NO2 Nitrite
NO3 Nitrate
NTU Nephelometric turbidity unit (see turbidity unit)
O&M Operation and maintenance
pH pH is a measure of the activity ofhydrogen ions. A pH of 7.0 indicatesneutrality, greater than 7.0 indicatesalkalinity, lower than 7.0 indicatesacidity. Overall pH ranges from 0.0 to 14.0.
prev. Previous
psi Pounds per square inch
PVC Polyvinyl chloride
recirc Recirculating
RSV Recirculating Splitter Valve
SMUG Scum Measuring Utility Gauge
STEP Septic Tank Effluent Pump
STEP System Used to refer to an effluent (pressure)sewer
TDS Total dissolved solids
TKN Total Kjeldahl nitrogen (organic andammonia nitrogen)
TP Total phosphorus
TN Total nitrogen (organic and ammonianitrogen, plus nitrite and nitrate nitrogen)
TSS Total suspended solids
turbidity unit A measure of particulate and color inwater and wastewater streams
V Volts
30
Appendix 2: Abbreviations & Definitions
O M&A D V A N T E X ® M A N U A L

O M&A D V A N T E X ® M A N U A L 31
Notes
____________________________________________________________________________________________________
____________________________________________________________________________________________________
____________________________________________________________________________________________________
____________________________________________________________________________________________________
____________________________________________________________________________________________________
____________________________________________________________________________________________________
____________________________________________________________________________________________________
____________________________________________________________________________________________________
____________________________________________________________________________________________________
____________________________________________________________________________________________________
____________________________________________________________________________________________________
____________________________________________________________________________________________________
____________________________________________________________________________________________________
____________________________________________________________________________________________________
____________________________________________________________________________________________________
____________________________________________________________________________________________________
____________________________________________________________________________________________________
____________________________________________________________________________________________________
Appendix 3: Timer SettingsStart with these typical timer settings for households of various sizes. Calculations assume water usage of 50gallons per person per day and a return recirculation ratio of 3 : 1. For more detailed instructions about timersettings, consult the AX20 Timer Settings Worksheet, NDA-ATX-SET-2, available from the Document Libraryat www.orenco.com.
2 15 29.753 15 19.754 30 29.755 30 23.756 30 19.75
Number of Time ON Time OFF People (seconds) (minutes)

Record of System Facts
Property Address
Property Owner Name(s)
Property Owner Phone
Property Owner E-Mail
Start-Up Date
AdvanTex Model #
AdvanTex Serial Number (on filter pod)
Control Panel Model #
Float Model #(s)
Pump(s) Model #(s)
Pump(s) Design Specifications:
____________ gpm ____________ gpm
Design Flow
Tank(s) Size(s)
Recirc Ratio (start-up)
Recirc Timer Settings
Discharge Timer Settings (when applicable)
Initial Squirt Height
Dispersal Method
Dealer Name
Dealer Phone
Engineer Name
Engineer Phone
Installer Name
Installer Phone
Service Provider Name
Service Provider Phone
Regulatory Authority
Permit # (if applicable)
Contact Name
Contact Phone
Distributed by:
AIM-OM-ATXRev. 3.3, © 8/05Orenco Systems® Inc.
(Record in Pencil)
AdvanTex®
Treatment System
AXN Models meet
the requirements
of NSF-ANSI
Standard 40 for
Class I Systems.
NSF/ANSI STANDARD 4
0
NSF®