Embed Size (px)
Citation preview

August 2002
Advancing wealth management capability, reach and scale

Disclaimer
The material contained in the following presentation is intended to be general background information on Westpac Banking Corporation and its activities as at 26 August 2002.
The information is supplied in summary form and is therefore not necessarily complete. Also, it is not intended that it be relied upon as advice to investors or potential investors, who should consider seeking independent professional advice depending upon their specific investment objectives, financial situation or particular needs.
2.
Agenda
David MorganØ Strategic rationale Ø Deal summary
David ClarkeØ Combined strengths Ø Business model & integration
Rob CoombeØ The BT business
Philip ChronicanØ Financial impact
3.
Strategy
Broaden customer relationships
Improve wealth management position
Drive operational efficiency
Embed a high performance culture
Build corporate reputation

4.
Enhancing our growth trajectory
• Changing our business mix
• Without compromising returns
• Rothschild acquisition• Hastings acquisition
• AGC Sale
Invest in growth Manage for growth

5.
Corporate Super
Life
New Zealand Wrap
Margin Lending
Retail
Select investment management capabilities
BT brand
BT Acquisition
• Consideration $900 million
• Cash EPS positive by end 2004

6.
A new wealth management force
• Platform capabilitiesØ Best-in-class wrap platformØ Leading corporate superannuation platform
• Enhanced distribution reachØ Product relationships with 15,000 EFAsØ Platform relationships with 2,000 EFAs
• Critical mass and scale efficienciesØ 4th largest retail fund managerØ 2nd largest wrap/master trust providerØ Margin lending market share from 6% to 17%Ø 6th largest corporate super provider

7.
Rounding out our franchise –market share
Sourcesa. Reported customer numbers b. KPMG FIPS NZ 2002, AC Nielson, Greenwichc. Greenwich Associatesd. Corporate transactional business – Greenwich Associatese. Greenwich large corporate banking survey (9/01)f. Retail funds under management ASSIRT June 2002g. Melville Jessup Weaver, Investment Survey, March 2002
9g5fWealth management (before)
5g4fWealth management (after)
2e1dCorporate banking
2b2cBusiness banking
1b2aConsumer banking
New ZealandAustralia
8.
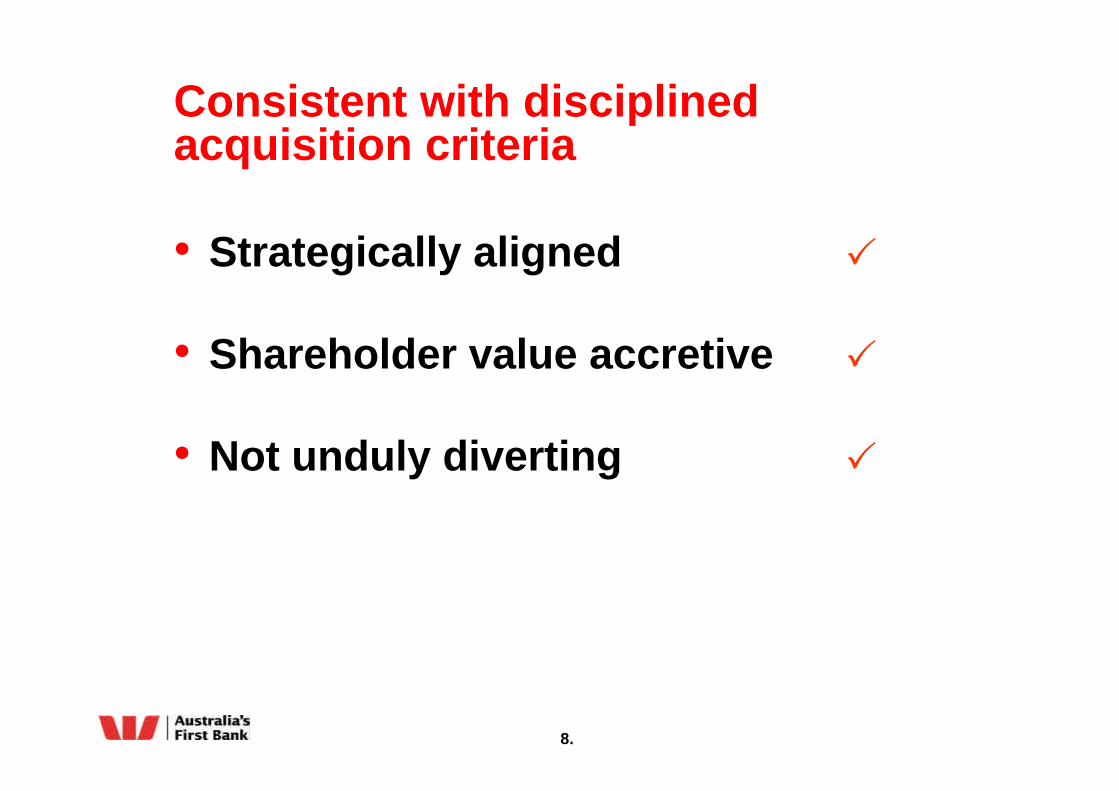
Consistent with disciplined acquisition criteria
Strategically aligned
Shareholder value accretive
Not unduly diverting
P
P
P

9.
Realigned executive team
David MorganChief Executive Officer
David ClarkeWealth Management
Phil CoffeyInstitutional Bank
Michael CoomerBusiness & Technology
Solutions & Service
Philip ChronicanChief Financial Officer
Ann SherryPeople & Performance
Mike PrattBusiness & Consumer Banking

10.
Agenda
David MorganØ Strategic rationale Ø Deal summary
David ClarkeØ Combined strengths Ø Business model & integration
Rob CoombeØ The BT business
Philip ChronicanØ Financial impact

12.
BT Financial Group overview
Strategic position• 450,000 Australian and New Zealand investors
• Strong brand and relationships but weathered some damage
• 1,300 experienced employees
$6.5bnFunds under wrap administration
$1.0 bnMargin lending
$1.2bnCorporate super
$11.4bnRetail funds under management
+ 2,000Wrap advisors
+15,000External financial advisors
Market position

13.
Increased scale – retail FUM
Source: ASSIRT, Market Share Report, June Quarter 2002
17
11 11 107
48
3429 28
22
05
101520253035404550
CBA / Colo
nial
Nation
al / M
LC AMP
Westpa
c/BT ING
Westpa
c
Macqu
arie BT
AXA
Perpe
tual
$ bi
llion
68% increase in retail funds under management

14.
Increased scale – wrap/master trust
Source: Plan for Life, March Quarter 2002Notes: NAB/MLC includes FUM in Masterkey balanced FUM
BT includes BT Wrap + retail super products classified as master trusts.
10 97
53
1010
1417
28
0
5
10
15
20
25
30
Nation
al / M
LC
Wes
tpac /
BT CBA
AMP BT
St Geo
rge
Norwich
Union
Westpa
c INGAXA
$ b
illio
nFrom 7th to 2nd in master trust/wrap funds under administration

15.
New Zealand – increased FUM
Source: Melville Jessup Weaver, Investment Survey, March 2002
3.83.1
2.3 2.3 1.9
4.24.24.35.7
10.3
0
2
4
6
8
10
12
AMP INGRSA
Tower
Westpa
cTru
st / B
T
CBA / Sov
ereign AXA
BNZ BT
Westpa
cTru
st
$ N
Z b
illio
n
Doubled funds under management to 5th largest player

16.
End to end capabilities
•JP Morgan relationship
•Service Centre
•Scale
•Growth style
•Ext ratings
•Extensive range
•Online platform access
•Wrap
•Corporate super
•15,000 EFA relationships
•2,000 EFA’son wrap
•Additional 450,000 customers
•RBC relationship
•Value style
•Ext ratings
•International alliances
•Development & execution excellence
•1,000 Premier planners
•Servicing platform
•80,000 customers
•Internal service centre
•True to label
•Core style
•Solid product range
•Structured investments
•Master trust
•Individually managed accounts
•700 internal planners & advisors
•7.4 million customers
•CRM capabilityW
estp
acR
oth
sch
ildB
T
Customers Distribution & Advice
BundlingPlatform
ProductManufacture
InvestmentManagement
BackOffice

17.
Wealth management structure
Rothschild Westpac Fin Services
BT Financial GroupSagitta
Asset Accumulation
InvestmentManagement Life New
Zealand
Integration

18.
Customers
Business Model
Westpac FP&A
External Advisers
&Distributors
Business Advisers
Distribution & Advice
BundlingPlatform
ProductManufacture
InvestmentManagement
Westpac Customers
EFA Customers
Business Customers
PP
S M
aster T
rust
Dealer M
aster T
rusts
“Wrap
” Platfo
rm
Corp Super
Su
per
Pen
sion
Investm
ent
Risk
Clien
t Services an
d A
dm
inistratio
n
Putnam
BlackRock
AEW
TAA
Value
Core
Growth
Back O
ffice
Margin Lending
Principal
Grosvenor
BackOffice

19.
Integration plans The current integration of Rothschild/Westpac Financial Services
will continue and then be merged with the BT integrationR
oth
sch
ild
Stage 1 - Priority
•Merge investment mgt, margin lending, Group Services
•Wrap/corporate super to bank channels
•Stabilise funds managementBT
Fin
anci
al
Stage 2 - Continuing
•Finalise structure & resourcing
•Single ‘on-sale’ product set
•Quick wins
Stage 1 - Completed
•Merge investment mgt
•Executive team in place
•Sagitta brand launched
Stage 2
• Integrate distribution models •Single ‘on-sale’ product set •Consolidate admin services
Westpac Financial Services
20.
Jobs impact
• Around 200 positions over the next two years from combined businesses of 2,000+ positions are likely to be impacted
• Majority of investment management team remains with Principal
• Westpac is actively seeking to retain key people from the Australian equites and Australian fixed interest teams
• The New Zealand investment management team is joining Westpac

21.
The international equities management transition
Current BT team, process and philosophy to continue
Additional processes and controls including Principal US oversight
Key business continuity plans in place

22.
Agenda
David MorganØ Strategic rationale Ø Deal summary
David ClarkeØ Combined strengths Ø Business model & integration
Rob CoombeØ The BT business
Philip ChronicanØ Financial impact

23.
BT Financial Group
$6.5bnFunds under wrap administration
$1.0bnMargin lending
$1.2bnCorporate super
$11.4bnRetail funds under management
+ 2,000Wrap advisors
+15,000External financial advisors
Market position

24.
2001 ASSIRT survey results
Ù
Ù
Ù
Ù
Ù
Ù
Overall marketing support
Overall administration support
Ease of doing business with the firm
Effectiveness of communication
Overall technical services
Quality of asset management
IndustryAverage
Low High
Ù Position of BT on survey scale

25.
Retail funds – decline in FUM over past 18 months
•Outsource international equities
•Researcher perception of international equities
•Broaden product range & move to open architecture
•Poor absolute performance
•Out of favour growth style
SolutionIssue

26.
Top1 seven wrap badges
1. Top 7 Badges by funds under administration and approximate number of registered advisers
200Associated Planners
90Investor Group
120The Money Managers
20Investar Portfolio Management
35Tynan Mackenzie
600Zurich
750Count Financial Limited
Approx No. of registered advisers
Badge
27.
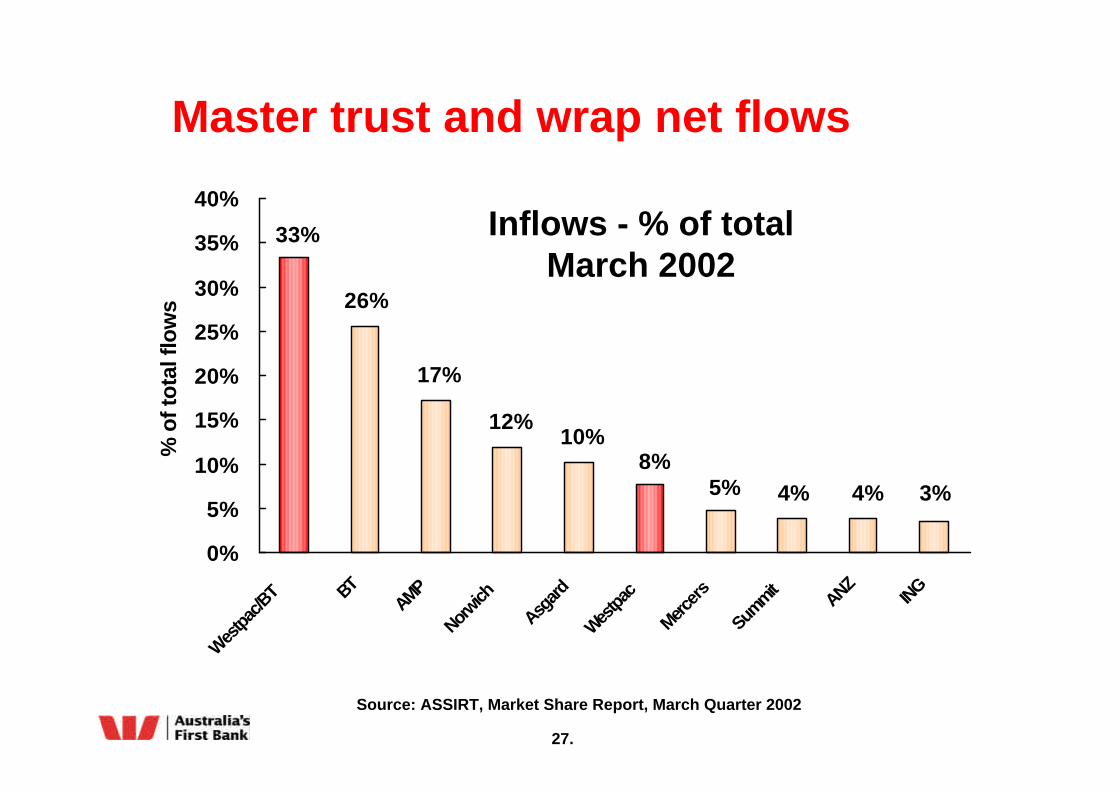
Master trust and wrap net flows
Source: ASSIRT, Market Share Report, March Quarter 2002
3%4%4%5%8%
33%
26%
17%
12%10%
0%
5%
10%
15%
20%
25%
30%
35%
40%
Wes
tpac/B
T BTAMP
Norwich
Asgard
Westpa
c
Mercers
Summit
ANZING
% o
f tot
al fl
ows
Inflows - % of totalMarch 2002

28.
Corporate Super - BT Lifetime Super – Employer Plan
• Recognised as a leading productØ “Without doubt, one of the two best products
for the up to $50m market”Warren Chant – Chant West Financial Services – Aug 2002
Ø Top rated product by Ausuper
• Scaleable administration
• Dedicated sales, service, education and technology
• Full featured plans


30.
Agenda
David MorganØ Strategic rationale Ø Deal summary
David ClarkeØ Combined strengths Ø Business model & integration
Rob CoombeØ The BT business
Philip ChronicanØ Financial impact
31.
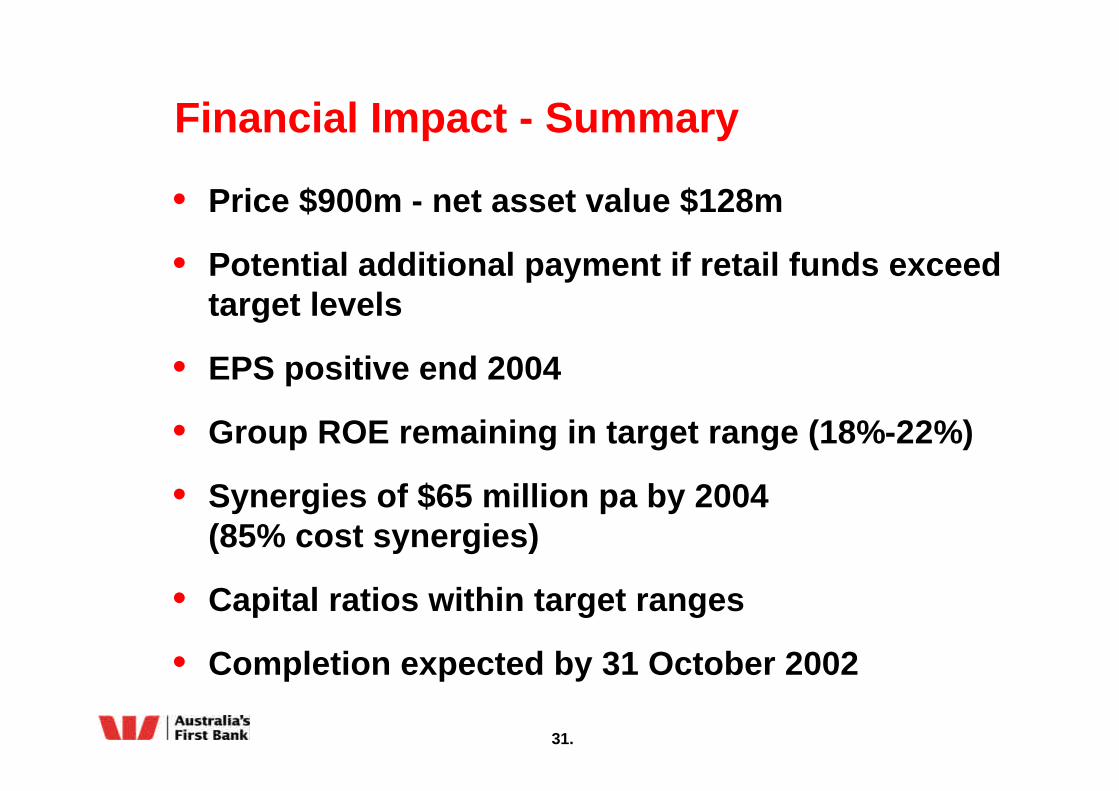
Financial Impact - Summary
• Price $900m - net asset value $128m
• Potential additional payment if retail funds exceed target levels
• EPS positive end 2004
• Group ROE remaining in target range (18%-22%)
• Synergies of $65 million pa by 2004 (85% cost synergies)
• Capital ratios within target ranges
• Completion expected by 31 October 2002
32.
Valuation
• NPV positive using 12% discount rate
• Retail funds outflow assumed to continue into 2003, turning around by end 2004 - base case
• Assumed to grow at market rate from 2005 onwards
• Current lack of profitability addressed by expense synergies planned
• Revenue synergies based on wrap and corporate super

33.
Valuation
36%
15%
1%
16%
4%
SynergiesAllocated
64%
5%
4%
25%
30%
Standalone
34%Portfolio services–Wrap & Corp Super
Total
Total
100%
20%
5%
41%
Margin lending and other
New Zealand
Retail product and distribution
• Valuation above price sees all revenue benefits and 25% of cost synergies retained
• Synergies allow for $100m of integration and transition expenses

34.
• Merge client services and administration
• Rationalise systems
• Merge product sets
• Integrate group services
Ongoing synergies $65 million pa to be achieved by end 2004
Cost Synergies and revenue benefits
• Wrap service across Westpac FP&A network
• Corporate super to Westpac business customers
• Increased sales through broader distribution footprint
Cost synergies Revenue benefits
85% 15%

35.
Potential additional payment
• Deferred contingent payment of up to $150 million
• Contingent on achieving above target retail funds under management by Dec 2004
• If trigger reached, further value accrues to both Westpac and Principal equally up to level of cap

36.
Projected financial outcomes
0.5%0.3%(0.3)%(1.0)%Cash EPS accretion/dilution
197(11)(18)Incremental cash earnings
45454545Funding cost2
64523427Additional earnings1,3
2006200520042003$ million
• Group ROE remains in target range 18% - 22%
1. BT net profit plus cost synergies and revenue benefits2. $900 million @ 7% pre tax3. Assumed integration costs expensed in 2002

37.
Funding plan
• Capital resources sufficient to fund internally
• Current buy-back not to be re-activated
• Continue to maintain capital ratios in target ranges
• Investigate opportunities to optimise capital mix:Ø Hybrid equityØ Other capital management initiatives Ø Outcomes will be presented at full year earnings
announcement
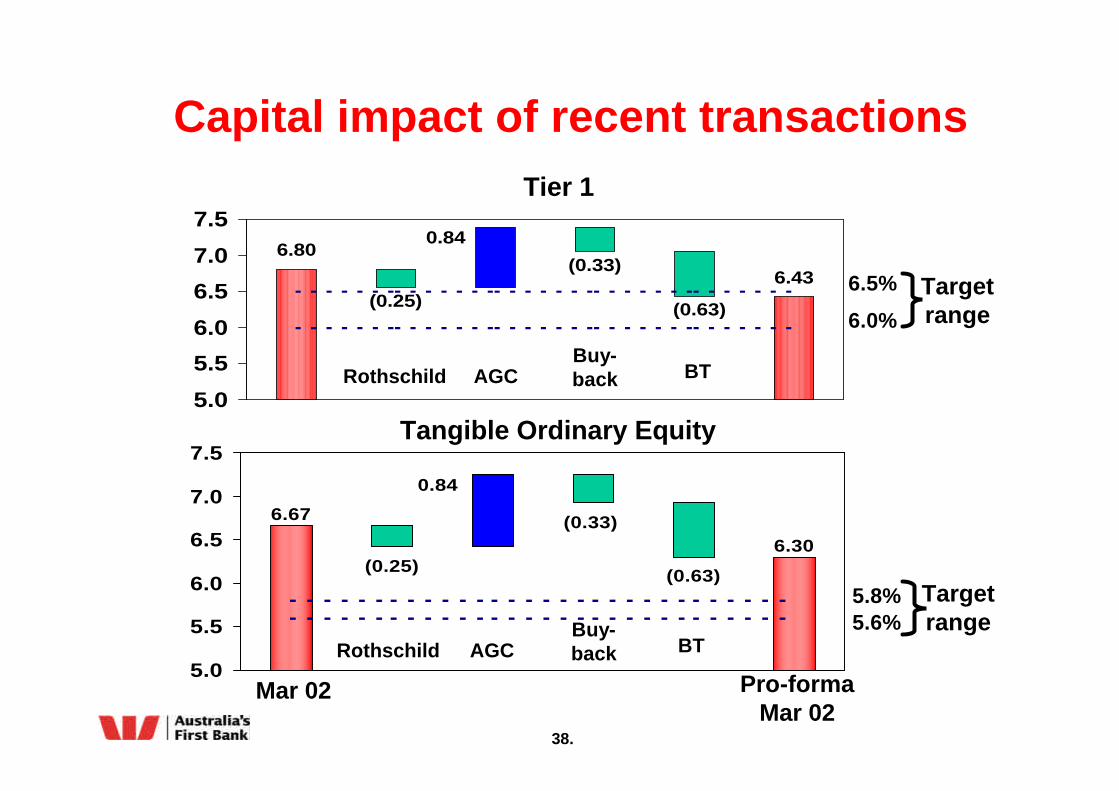
38.
6.30
6.67
(0.25)
0.84
(0.33)
(0.63)
5.0
5.5
6.0
6.5
7.0
7.5
6.43
6.80
(0.63)
(0.33)
0.84
(0.25)
5.0
5.5
6.0
6.5
7.0
7.5Tier 1
Tangible Ordinary Equity
Mar 02 Pro-formaMar 02
Rothschild AGCBuy-back
6.5%
6.0%
5.8%5.6%
Targetrange
Targetrange
Capital impact of recent transactions
BT
Rothschild AGCBuy-back BT

39.
Accounting treatment • Different valuation basis for wealth
management operations
Ø Rothschild planned to be carried at purchase price in the life company
Ø Embedded value used for revenue recognition in part of Westpac’s existing businesses
• BT acquisition further complicates treatment
• Undertaking a comprehensive analysis of wealth management structure
Ø Trade-off income volatility and goodwill perspectives
Ø Prefer common accounting treatment for all wealth management businesses
40.
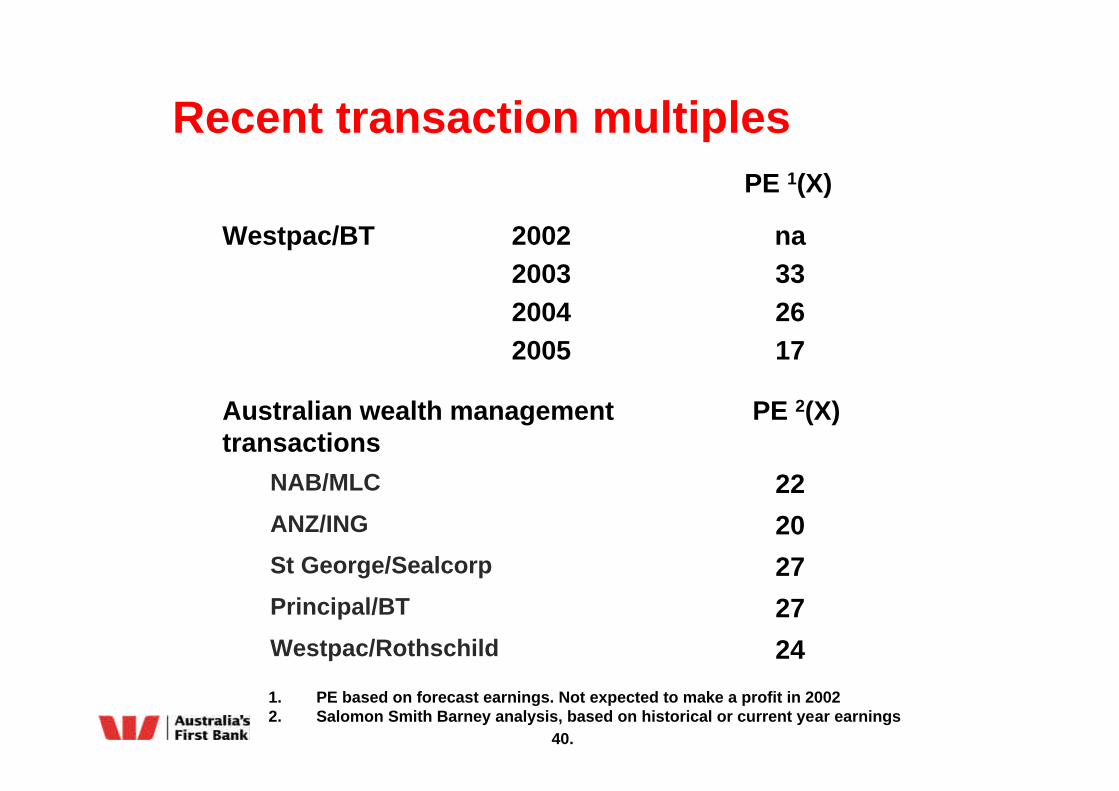
Recent transaction multiples
1. PE based on forecast earnings. Not expected to make a profit in 20022. Salomon Smith Barney analysis, based on historical or current year earnings
24Westpac/Rothschild
27Principal/BT
27St George/Sealcorp
20ANZ/ING
22NAB/MLC
Australian wealth management PE 2(X)transactions
na332617
Westpac/BT 2002200320042005
PE 1(X)
41.
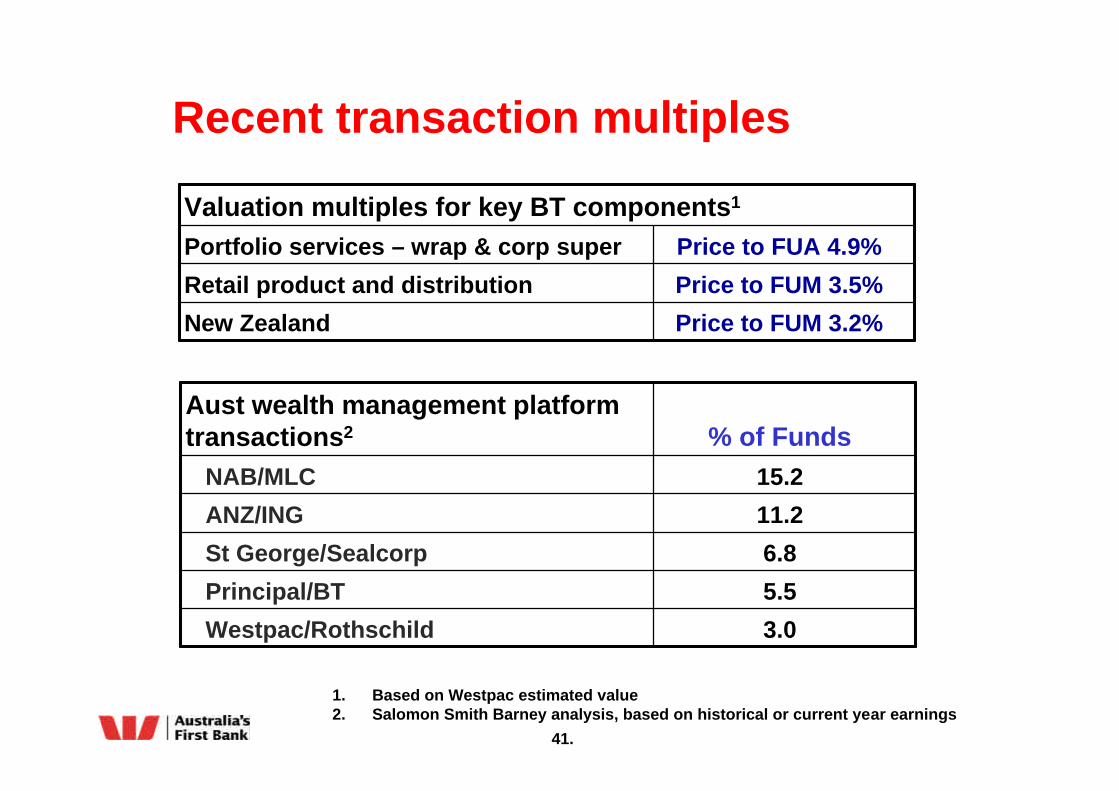
Recent transaction multiples
1. Based on Westpac estimated value 2. Salomon Smith Barney analysis, based on historical or current year earnings
% of FundsAust wealth management platform transactions2
3.0Westpac/Rothschild
5.5Principal/BT
6.8St George/Sealcorp
11.2ANZ/ING
15.2NAB/MLC
Price to FUA 4.9%Portfolio services – wrap & corp super
Valuation multiples for key BT components1
Price to FUM 3.2%
Price to FUM 3.5%
New Zealand
Retail product and distribution

42.
Gaining the scale, capability and reach in wealth management
Inside valuation criteria
Maintain strong financial position
Enhanced medium term growth prospects


44.

45.
Pro-forma P&L – Wealth ManagementProforma Profit & Loss Statement for Combined Wealth Management Businesses
WFS RAAM BT BT Synergies
2002 2002 2003 2003
$m
Operating income 395 120 255 3Expenses (168) (96) (262) 43Underlying profit 227 24 (7) 46Bad debts - - - - NPBT 227 24 (7) 46Tax expense (43) (6) 2 (14)NPAT 184 18 (5) 32
Note 1 Note 2 Note 3 Note 4
Note 1: WFS based on September 2002 full year forecast. Income includes $53m EV uplift (pre-tax)
Note 2: RAAM based on September 2002 full year forecast extrapolated for a full year ownership
Note 3: BT based on the acquired businesses for full year 2003
Note 4: Synergies as identified in BT acquisition valuation