Embed Size (px)
Citation preview
Advancing the Efficiency of Electricity Utilization: “Prices to DevicesSM” Background Paper 2006 EPRI Summer Seminar
Prepared by the EPRI Energy Technology Assessment Center

iii
EXECUTIVE SUMMARY
This purpose of this background paper is to stimulate discussion among the participants at EPRI’s 2006 Summer Seminar and was prepared by EPRI’s Energy Technology Assessment Center.
It begins with several assumptions:
o End-use energy efficiency remains a critically underutilized resource in the United States.
o This resource will become strategically more important as carbon constraints and affordability of energy create greater economic challenges to energy companies and consumers.
o The potential size of the energy efficiency resource is a matter of ongoing debate and analysis; estimates range from 10–25% of total U.S. electricity consumption.
o The upward bound on this potential is likely to grow as technology advances and as regulators and policy makers elevate its strategic priority.
The paper discusses the efficiency of electricity utilization in three broad categories:
o “Energy efficiency” consists of ongoing technology development and programs in energy efficiency driven by economic and policy drivers. In this sense, these drivers result in a built-in improvement in energy efficiency that is occurring on an ongoing basis. This area has a large and direct bearing on CO2 reduction as well as reduced electricity consumption.
o “Demand response” represents shifting the pattern of the load. This area has a small impact on energy reduction but a large role in enhancing system economics and reliability. It may or may not result in reduced CO2.
o “Dynamic systems” represents the future of networked, smart, end-use devices interacting with the marketplace for electricity and other consumer-based services. Market interaction includes sending direct “prices to devicesSM.” This area may have substantial impacts on system reliability, customer value, modest energy savings, and CO2 reductions.
The central hypothesis of the paper is that a set of four building blocks is needed to create the environment for dynamic systems to take root and flourish. Together, the building blocks leverage the rapid advances in communication and microprocessor technology and create the ability for consumers to optimize cost while increasing load management capabilities for energy companies.

iv
The following are the four building blocks:
o Communications infrastructure – It would add new functionality to the electricity system and allow for prices, market data, and decisions to flow in two directions: between electricity supplier/devices and consumers.
o Innovative rates and regulation – Regulations are needed to provide adequate incentives for energy efficiency investments for electricity suppliers and consumers alike.
o Innovative markets – Market design must ensure that energy efficiency measures instituted by regulation become self-sustaining in the marketplace.
o Smart end-use devices – Direct linkage of prices and other parameters to devices would allow dynamic energy management and coordination of networked devices, all on behalf of the customer and the energy company.
The paper concludes with R&D needs necessary to quantify the efficiency potential and develop technology aspects of the infrastructure composed of the four building blocks envisioned in this paper. It is intended to stimulate discussion among the Summer Seminar participants and will be modified and distributed publicly following the Summer Seminar.
1-1
TABLE OF CONTENTS
1 INTRODUCTION....................................................................................................................1-1
2 FOUR BUILDING BLOCKS ...................................................................................................2-1
3 STRATEGIC CONSIDERATIONS..........................................................................................3-1
4 2020 VISION OF THE “EFFICIENCY INFRASTRUCTURE” ................................................4-1
5 VALUING THE VISION .........................................................................................................5-1
6 CONCLUSIONS AND QUESTIONS FOR THE PARTICIPANTS...........................................6-1
7 BIBLIOGRAPHY ....................................................................................................................7-1
A ADDITIONAL TECHNOLOGY OPPORTUNITIES FOR IMPROVING END-USE EFFICIENCY .................................................................................................................... A-1
B HISTORIC RESULTS AND FUTURE POTENTIAL ............................................................. B-1
C SUPPLY-SIDE ENERGY EFFICIENCY IMPROVEMENT................................................... C-1

1-1
1 INTRODUCTION
The purpose of this background paper is to help frame the issues and stimulate discussion at the EPRI Summer Seminar, August 7–8, 2006, on the subject of “Advancing Energy Efficiency and End-Use Technologies.” This paper asserts that increased efficiency of electricity utilization is an essential element of any strategy seeking to meet national goals to conserve scarce energy resources, minimize air pollution, control global carbon emissions, protect and enhance economic growth, and move toward a more sustainable long-term energy supply. We offer a vision of an “infrastructure” of advanced technologies and supporting policies that we believe is necessary to fully realize the benefits of energy efficiency for both consumers and utilities.
Despite its multiple benefits, energy efficiency remains critically underutilized in the U.S. energy portfolio. This is largely due to the dominance of supply-oriented economic incentives, the legacy of regulatory policies, and the underutilization of advanced technology for customer interactions. With so many aspects in play, there is little agreement on the full potential of cost-effective energy savings, but most observers support the view that the potential is very large.
The potential for energy efficiency remains a matter of ongoing discussion and analysis. A peer-reviewed analysis of 11 studies in 20041 indicated a median achievable economic potential of 24% of total U.S. electricity demand, although with substantial variation among the studies reviewed. For perspective, this 24% estimated savings potential would dramatically reduce the 40% growth in U.S. electricity use projected by the U.S. Energy Information Administration through 20302. Other analyses (including those presented in this paper), which have been based on the direct experience by utilities over the last 10 years, estimate the economic potential to be on the order of 5–10% at the low end of estimates to substantially higher levels described later in this paper.
1 Nadel, Steven et al., “The Technical, Economic, and Achievable Potential for Energy Efficiency in the U.S. – A Meta-Analysis of Recent Studies,” Proceedings of the 2004 ACEEE Summer Study on Energy Efficiency in Buildings. 2 U.S. Energy Information Administration, “Annual Energy Outlook 2006 with Projections to 2030, February 2006. Energy Information Administration, DOE/EIA0383 (2006).

1-2
To facilitate discussion of the proposed vision, it is necessary to consider several aspects of the efficiency of electricity utilization: energy efficiency, demand response, and new strategies that enable access to the full range of benefits in these areas. This paper explores existing knowledge of these areas and how we might transition to the strategic vision discussed here.

2-1
2 FOUR BUILDING BLOCKS
The central hypothesis of this paper is that an interactive set of four building blocks constitutes an emerging “energy efficiency infrastructure” that will amplify the effectiveness of energy efficiency and demand response while creating the capability of widespread real-time continuous optimization. These four key building blocks are:
o Communications infrastructure
o Innovative rates and regulations
o Innovative markets
o Smart end-use devices
Understanding the interactions and integration of functions in these areas with the existing power system will be critical to meeting the national need for radical improvements in energy efficiency and demand response. Contemplating such an “energy efficiency infrastructure” leads to several challenges, including a number of research and development priorities.

3-1
3 STRATEGIC CONSIDERATIONS
A number of strategic challenges face the electricity industry:
o Increasing electricity production cost
o Steady growth in electricity demand
o Effective management of greenhouse gas emissions
o Pressures to control consumer energy costs
o National policies driving increasing energy independence
The value of a strategic approach to energy efficiency and demand response is that it can address these issues simultaneously. As a result, energy efficiency and demand response are being explored today with a new sense of urgency by policymakers and industry leaders alike. It’s evident that although energy efficiency and demand response offer many cost-effective alternatives to adding new capacity, substantial potential remains untapped.
Economic growth has been accompanied by increasing electricity intensity. Total electricity demand has continued to steadily grow (as reflected in the Energy Information Agency’s annual energy outlook studies), and total electricity sales are projected to increase 50% by 2030. 3 Concurrent with growing demand, fuel, production, and delivery costs have also risen, resulting in higher energy costs to consumers in all sectors (projected 7% increase by 2030, normalized to 2004 dollars. 4 These continuing trends, coupled with volatility and fuel cost increases in the oil and natural gas sectors, have created renewed political attention on ensuring continued affordability of energy and promoting national energy independence. The emergence of climate change and its multiple effects on the energy system introduces an important additional dimension to consider.
Climate Policy as a New Strategic Context for Energy Efficiency
If climate policy is to achieve the goal of stabilization of concentrations of greenhouse gases in the atmosphere, a near-complete transformation of the energy system will ultimately be required—from a global energy system that that is 85% CO2-emitting today to one that is predominantly non-emitting. Electricity and an expanded set of electric end uses will play a critical role in this transformation, with electricity expected to play a
3 Figure 55, U.S. Energy Information Administration, “Annual Energy Outlook 2006 with Projections to 2030, February, 2006. Energy Information Administration, DOE/EIA0383 (2006). 4 Ibid, Figure 66.
3-2
greater role in the energy system the tighter the CO2 constraint. In a carbon-constrained world, many direct uses of fossil fuels will likely be displaced by electric substitutes fueled by electric generation technologies that produce an ever increasing number of kWh per ton of CO2 emissions.
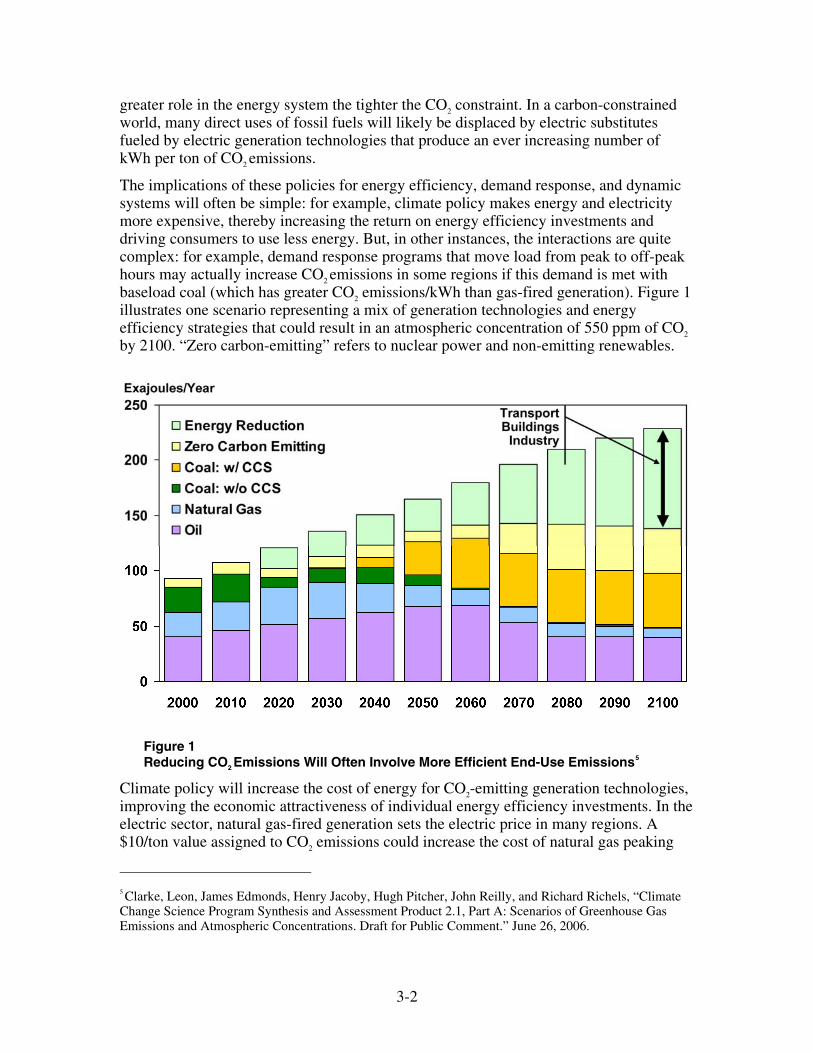
The implications of these policies for energy efficiency, demand response, and dynamic systems will often be simple: for example, climate policy makes energy and electricity more expensive, thereby increasing the return on energy efficiency investments and driving consumers to use less energy. But, in other instances, the interactions are quite complex: for example, demand response programs that move load from peak to off-peak hours may actually increase CO2 emissions in some regions if this demand is met with baseload coal (which has greater CO2 emissions/kWh than gas-fired generation). Figure 1 illustrates one scenario representing a mix of generation technologies and energy efficiency strategies that could result in an atmospheric concentration of 550 ppm of CO2 by 2100. “Zero carbon-emitting” refers to nuclear power and non-emitting renewables.
Figure 1 Reducing CO2 Emissions Will Often Involve More Efficient End-Use Emissions5
Climate policy will increase the cost of energy for CO2-emitting generation technologies, improving the economic attractiveness of individual energy efficiency investments. In the electric sector, natural gas-fired generation sets the electric price in many regions. A $10/ton value assigned to CO2 emissions could increase the cost of natural gas peaking
5 Clarke, Leon, James Edmonds, Henry Jacoby, Hugh Pitcher, John Reilly, and Richard Richels, “Climate Change Science Program Synthesis and Assessment Product 2.1, Part A: Scenarios of Greenhouse Gas Emissions and Atmospheric Concentrations. Draft for Public Comment.” June 26, 2006.
3-3
equipment by $5–7/MWh, likely creating substantial increases in wholesale and retail electricity markets. In regulated markets, average generation costs could also rise significantly with this additional cost, depending upon the composition of the generation portfolio and details of the climate policy. State utility commissions would determine how these costs would be allocated across consumer groups and levels of electricity usage. In either regulated or unregulated markets, a CO2 value can significantly improve the economics of individual energy efficiency projects.
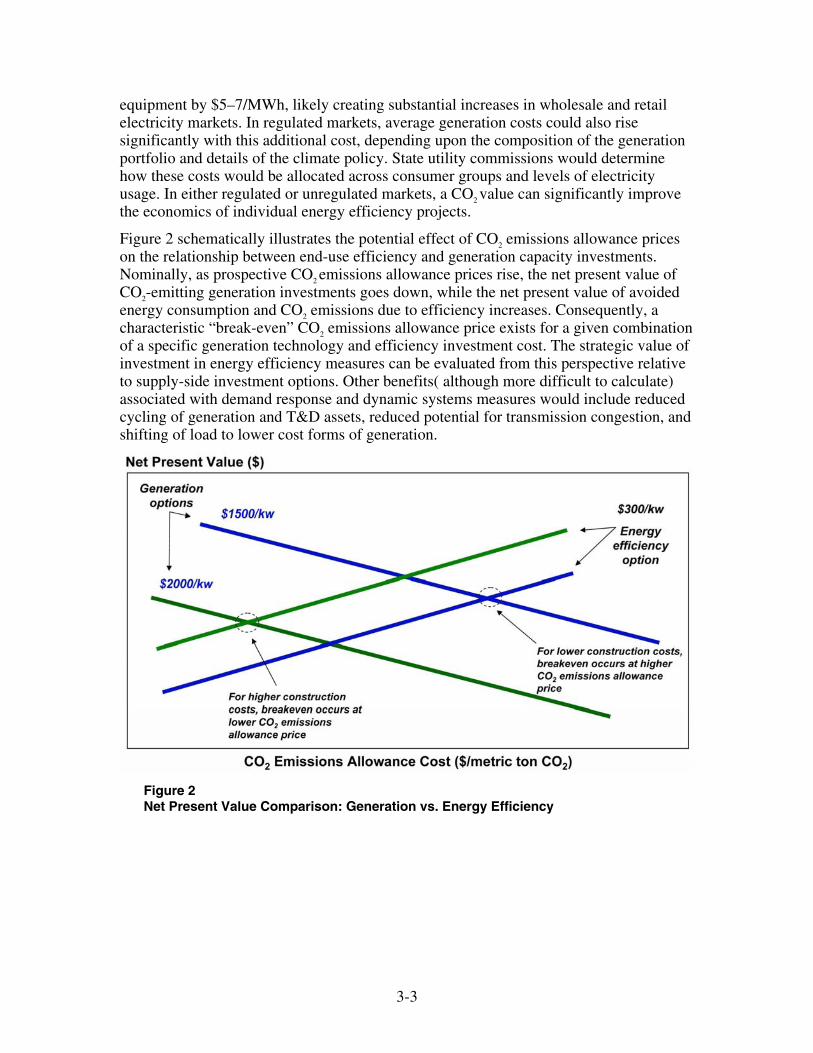
Figure 2 schematically illustrates the potential effect of CO2 emissions allowance prices on the relationship between end-use efficiency and generation capacity investments. Nominally, as prospective CO2 emissions allowance prices rise, the net present value of CO2-emitting generation investments goes down, while the net present value of avoided energy consumption and CO2 emissions due to efficiency increases. Consequently, a characteristic “break-even” CO2 emissions allowance price exists for a given combination of a specific generation technology and efficiency investment cost. The strategic value of investment in energy efficiency measures can be evaluated from this perspective relative to supply-side investment options. Other benefits( although more difficult to calculate) associated with demand response and dynamic systems measures would include reduced cycling of generation and T&D assets, reduced potential for transmission congestion, and shifting of load to lower cost forms of generation.
Figure 2 Net Present Value Comparison: Generation vs. Energy Efficiency
3-4
Energy Efficiency and Demand Response Segmentation
Management of energy and electricity consumption can be viewed in three segments:
o Energy efficiency
o Demand response
o Dynamic systems
“Energy efficiency” refers here to technical improvements in energy efficiency of devices fueled by the continuous drive in all businesses to improve economic efficiency. The aggregate effect of this economically driven activity is commonly estimated to reduce the growth in electricity demand in the United States by as much as 1% per year. “Energy efficiency” as discussed here also encompasses state and federal measures designed to stimulate the development and deployment of energy efficiency programs, new appliance standards, and incentives for consumers to invest in new energy equipment or to change behavior. Because these improvements and actions driven by policy are ongoing, they represent a built-in energy efficiency effect.
“Demand response” provides time- and price-dependent variation in demand. It provides a measure of control over the shape of the electrical load, and the ability to reduce peak load in supply-constrained situations. Much of the research performed to date has focused on technologies enabling shifting of load from peak periods to other times of the day.
“Dynamic systems” represents the concept of networked devices automatically optimizing customer value based on multiple inputs (including price, weather, and other loads) within constraints imposed by electricity system operations. It can be used to reduce energy use and demand in conjunction with other services for home and building automation. “Dynamic systems” combines some of the tools developed in demand response programs with advanced communications, embedded intelligence, and emerging “smart” end-use device technologies. The integration of an advanced communications infrastructure with the dynamic systems described here will also enable the retail load-serving entity (LSE) to engage the retail consumer in the operation of the consumer’s devices and processes. This will enable optimization of the LSE’s system within the limits of the consumer’s preferences. Both the LSE’s desired optimization and the consumer’s preferences will change through time, so that this engagement will require continual modification.
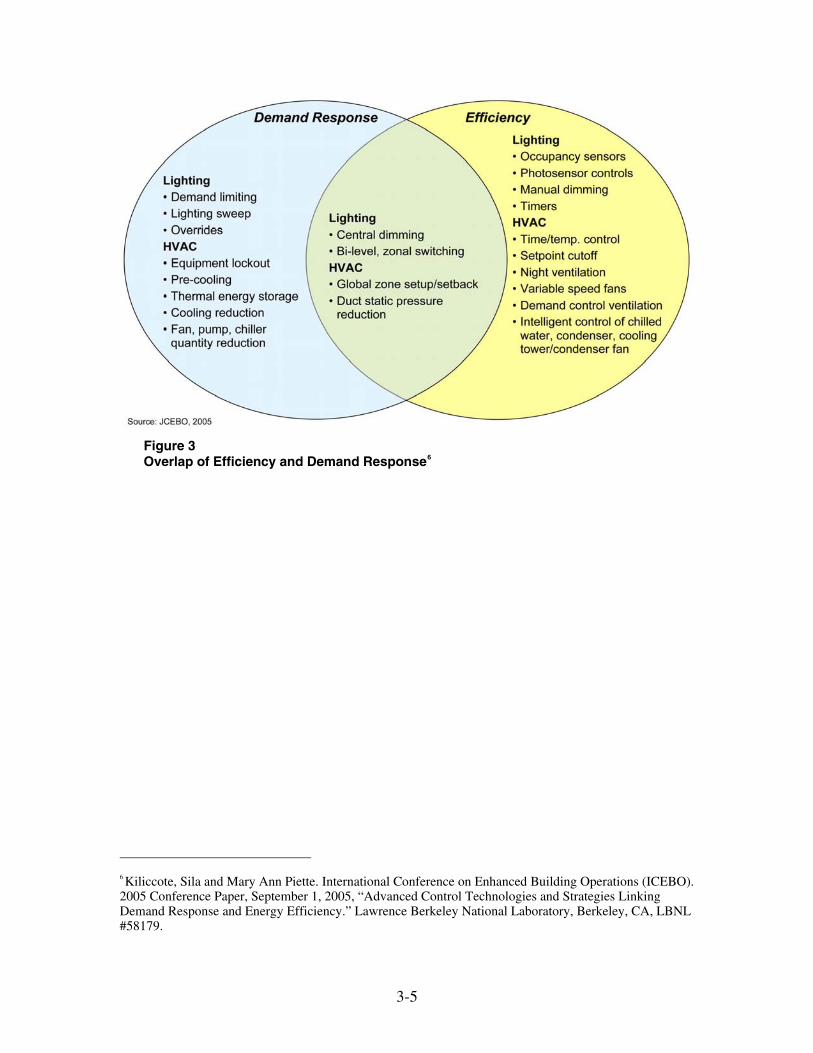
It will be possible to tackle multiple priorities with the same technologies in many cases. Figure 3 illustrates this, for lighting and heating, ventilating, and air conditioning (HVAC) applications. These functions are among the areas of highest electricity consumption in the residential and commercial sectors. More sophisticated algorithms for lighting and HVAC control are valuable for both energy efficiency and demand response.
3-5
Figure 3 Overlap of Efficiency and Demand Response6
6 Kiliccote, Sila and Mary Ann Piette. International Conference on Enhanced Building Operations (ICEBO). 2005 Conference Paper, September 1, 2005, “Advanced Control Technologies and Strategies Linking Demand Response and Energy Efficiency.” Lawrence Berkeley National Laboratory, Berkeley, CA, LBNL #58179.

4-1
4 2020 VISION OF THE “EFFICIENCY INFRASTRUCTURE”
The vision underlying this paper is that of an infrastructure that fully integrates end-use energy efficiency and demand response measures and is primed to enable broader use of networked communications with smart end-use devices to achieve “dynamic systems” capabilities. Dynamic systems could, in principle, unleash the next wave of efficiency potential.
The advantage of dynamic systems is that they could optimize electricity supply and demand across multiple criteria, including economic, environmental, societal, and technical. System protection and power quality could be better managed. Broad societal objectives, from environmental protection to consumer protection, could be internalized, managed, and monitored more readily. Supplier services could become more diverse and put out into the marketplace for trial. Consumer choice could become more fine-grained as price signals are sent directly to decision-making appliances (prices to devicesSM).
The strategic challenges facing electricity suppliers highlight the necessity to use all resources effectively to sustain an electricity system that supports economic growth within environmental objectives. Efficiency, demand response, and dynamic systems collectively represent a strategic option that should be considered in the same planning context as generation and transmission and distribution (T&D) asset development.
Realizing the expanding potential for efficiency requires an integrated combination of a communications infrastructure, policies and regulations, markets, and intelligent, adaptive devices. A fully integrated combination of these building blocks will enable the infrastructure envisioned in this paper.
Key Characteristics of the Infrastructure
This “efficiency infrastructure” would represent a significant step beyond current capabilities in two major ways: (1) aggregation and coordination of consumer data and (2) continuous optimization. First, an integrated infrastructure on the end-use side would feature automated self-management of loads at multiple levels: an individual device, a group of devices owned by the customer, or a group of loads for which aggregated treatment by the distribution operator is highly desirable. This infrastructure would permit the coordination and data exchange necessary for such flexibility as well as the means by which customer priorities and distribution operator priorities can be balanced or negotiated. Second, such an infrastructure would rapidly accelerate the development of software and hardware necessary for “self-learning.” Thus multiple externalities—rate structures, meteorological conditions, changing economic drivers, or evolving customer behavior or processes–could be addressed on an ongoing basis while minimizing human intervention.
4-2
The efficiency infrastructure would have the following system characteristics:
o Consumer portal – Widespread use of advanced meters, serving as consumer portals (gateways to the consumer premises) facilitating the two-way flow of information, price signals, decisions, and network intelligence in and out of the customer’s premises. The distributed intelligence built into appliances, tools, equipment, and processes could engage directly with the outside world or be subordinated to a larger energy management system governing all such transactions on behalf of the customer.
o Two-way learning – The ability of the on-site energy management systems to learn about the customer’s preferences for comfort and convenience and to use that knowledge to optimize patterns of demand along with heating, cooling, lighting, ventilation, refrigeration, and so on. Similarly, the electricity supply system would also engage in continuous learning and adaptation to customer demand on multiple scales.
o Distributed energy resources – Standards and protocols, coupled with the communications and adaptive capabilities described above, would allow distributed generation and storage to be readily integrated into either the customer facility or the electricity distribution system in a “plug and play” fashion. Utilities would have the incentives and the means to dispatch significant portions of these distributed resources to enhance power reliability and quality and to meet critical needs.
o Enhanced services – The array of services available to consumers and to energy companies would expand, including options such as automated interface of multiple end-use devices with multiple rate structures or automated load management of a group of devices on multiple distribution feeders.
Four Building Blocks of an Efficiency Infrastructure
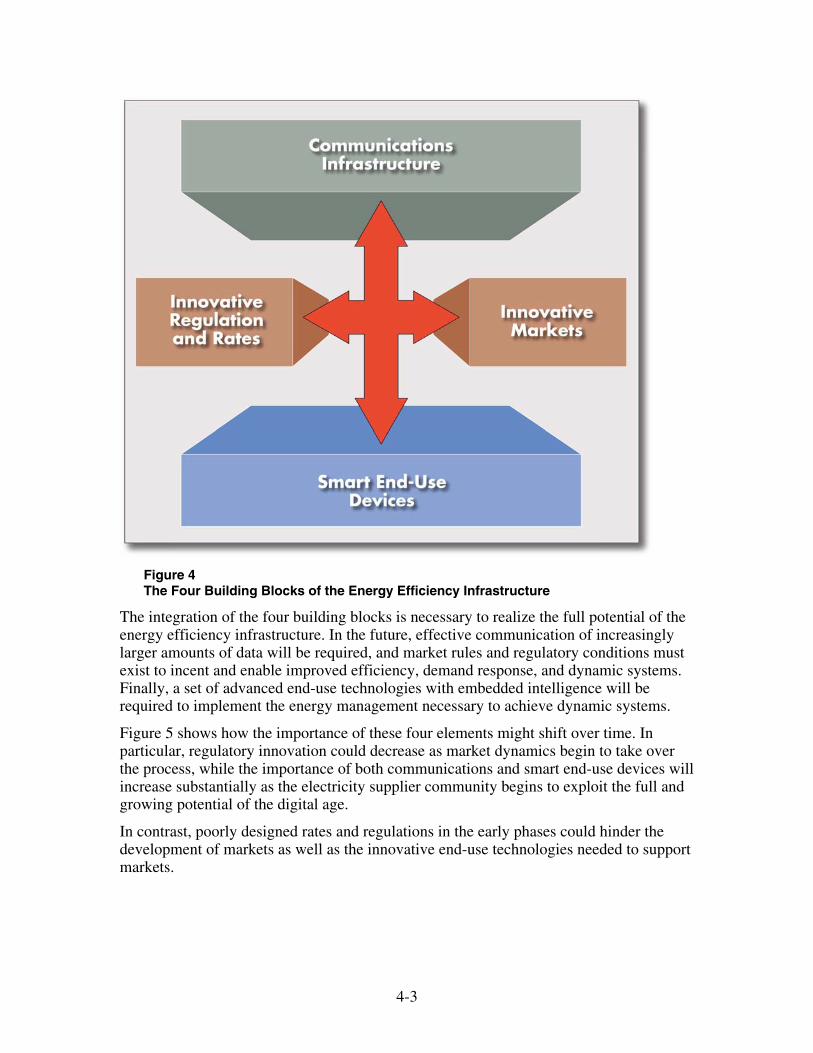
At EPRI, we believe that an integrated set of four building blocks—communications infrastructure, innovative rates and regulation, innovative markets, and smart end-use devices—constitutes an emerging energy efficiency infrastructure that will make the dynamic dimension of energy efficiency more robust over time, substantially expanding the potential for energy efficiency in the broadest sense (see Figure 4).
4-3
Figure 4 The Four Building Blocks of the Energy Efficiency Infrastructure
The integration of the four building blocks is necessary to realize the full potential of the energy efficiency infrastructure. In the future, effective communication of increasingly larger amounts of data will be required, and market rules and regulatory conditions must exist to incent and enable improved efficiency, demand response, and dynamic systems. Finally, a set of advanced end-use technologies with embedded intelligence will be required to implement the energy management necessary to achieve dynamic systems.
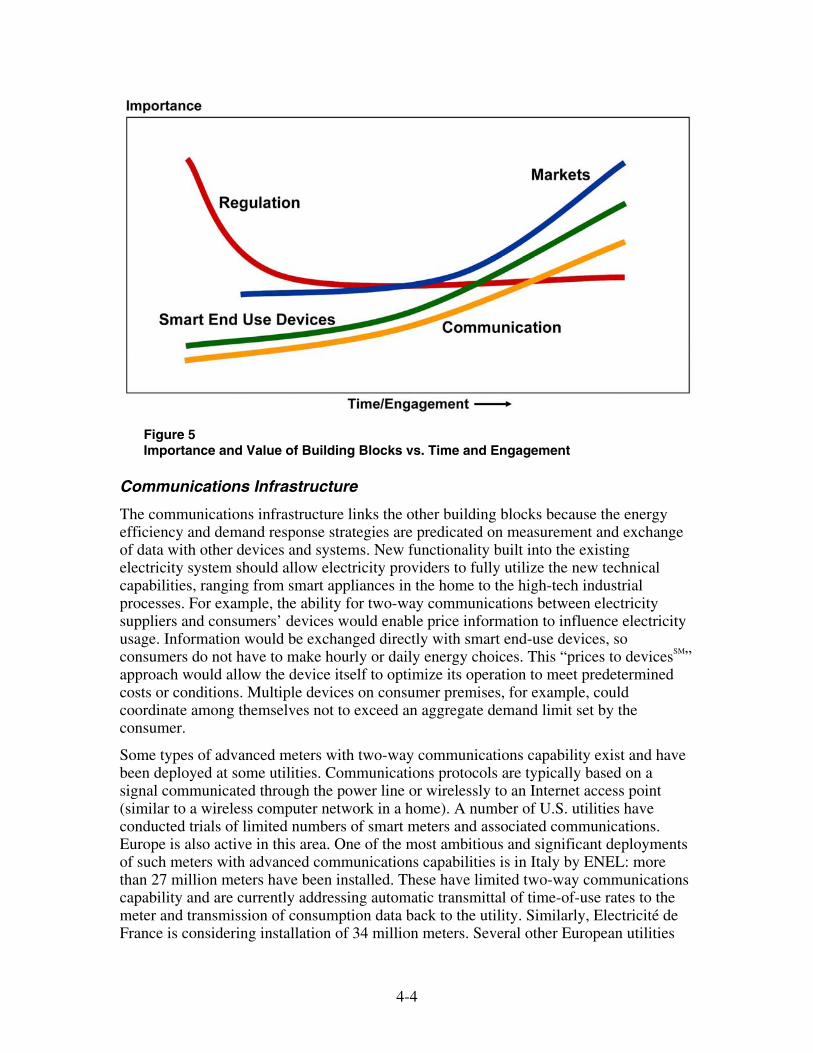
Figure 5 shows how the importance of these four elements might shift over time. In particular, regulatory innovation could decrease as market dynamics begin to take over the process, while the importance of both communications and smart end-use devices will increase substantially as the electricity supplier community begins to exploit the full and growing potential of the digital age.
In contrast, poorly designed rates and regulations in the early phases could hinder the development of markets as well as the innovative end-use technologies needed to support markets.
4-4
Figure 5 Importance and Value of Building Blocks vs. Time and Engagement
Communications Infrastructure
The communications infrastructure links the other building blocks because the energy efficiency and demand response strategies are predicated on measurement and exchange of data with other devices and systems. New functionality built into the existing electricity system should allow electricity providers to fully utilize the new technical capabilities, ranging from smart appliances in the home to the high-tech industrial processes. For example, the ability for two-way communications between electricity suppliers and consumers’ devices would enable price information to influence electricity usage. Information would be exchanged directly with smart end-use devices, so consumers do not have to make hourly or daily energy choices. This “prices to devicesSM” approach would allow the device itself to optimize its operation to meet predetermined costs or conditions. Multiple devices on consumer premises, for example, could coordinate among themselves not to exceed an aggregate demand limit set by the consumer.
Some types of advanced meters with two-way communications capability exist and have been deployed at some utilities. Communications protocols are typically based on a signal communicated through the power line or wirelessly to an Internet access point (similar to a wireless computer network in a home). A number of U.S. utilities have conducted trials of limited numbers of smart meters and associated communications. Europe is also active in this area. One of the most ambitious and significant deployments of such meters with advanced communications capabilities is in Italy by ENEL: more than 27 million meters have been installed. These have limited two-way communications capability and are currently addressing automatic transmittal of time-of-use rates to the meter and transmission of consumption data back to the utility. Similarly, Electricité de France is considering installation of 34 million meters. Several other European utilities
4-5
have installed several hundred thousand meters.7 Programs in the United States are not as extensive, but it is significant that the California experiment described next indicates that customers will respond to time-varying prices when the user is provided with enabling technology that gives them an element of control over their energy expenditures.8
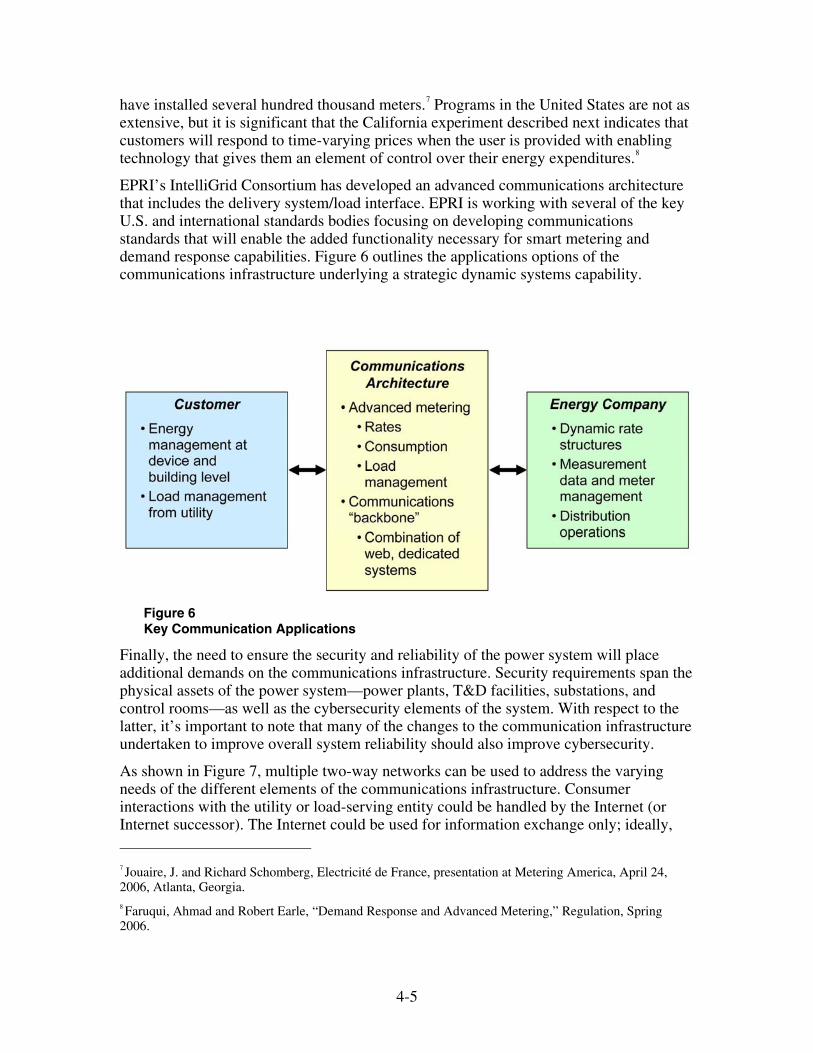
EPRI’s IntelliGrid Consortium has developed an advanced communications architecture that includes the delivery system/load interface. EPRI is working with several of the key U.S. and international standards bodies focusing on developing communications standards that will enable the added functionality necessary for smart metering and demand response capabilities. Figure 6 outlines the applications options of the communications infrastructure underlying a strategic dynamic systems capability.
Figure 6 Key Communication Applications
Finally, the need to ensure the security and reliability of the power system will place additional demands on the communications infrastructure. Security requirements span the physical assets of the power system—power plants, T&D facilities, substations, and control rooms—as well as the cybersecurity elements of the system. With respect to the latter, it’s important to note that many of the changes to the communication infrastructure undertaken to improve overall system reliability should also improve cybersecurity.
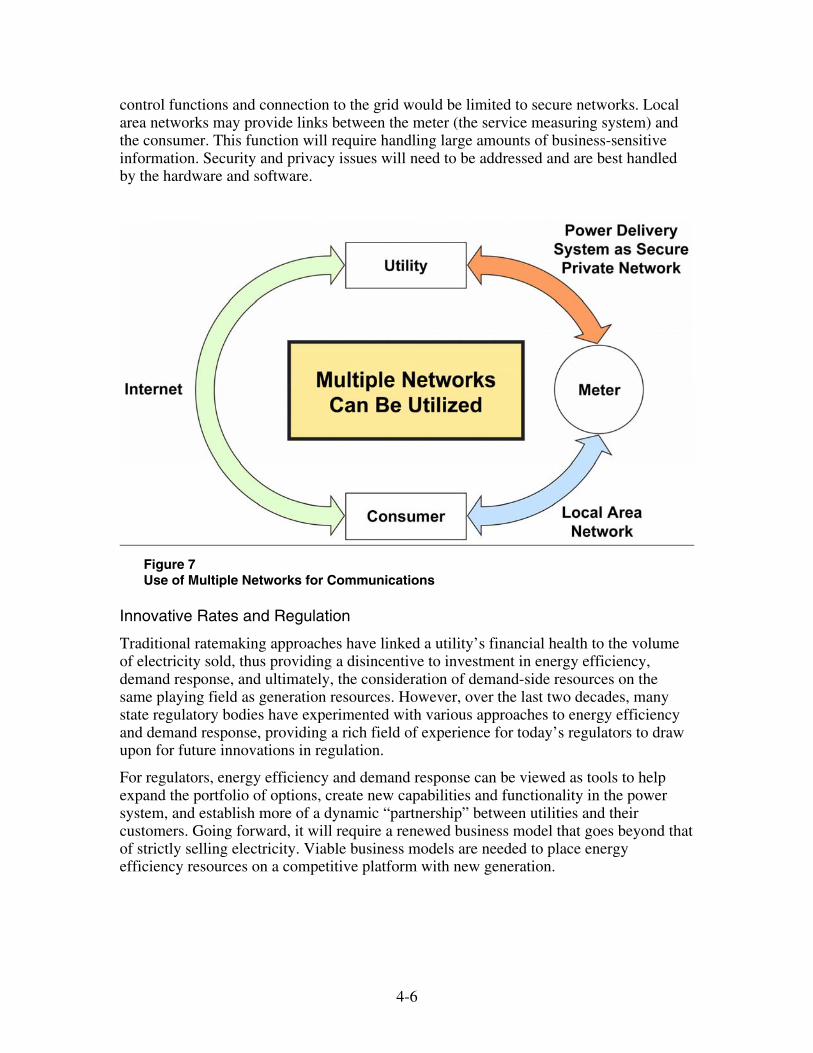
As shown in Figure 7, multiple two-way networks can be used to address the varying needs of the different elements of the communications infrastructure. Consumer interactions with the utility or load-serving entity could be handled by the Internet (or Internet successor). The Internet could be used for information exchange only; ideally,
7 Jouaire, J. and Richard Schomberg, Electricité de France, presentation at Metering America, April 24, 2006, Atlanta, Georgia. 8 Faruqui, Ahmad and Robert Earle, “Demand Response and Advanced Metering,” Regulation, Spring 2006.
4-6
control functions and connection to the grid would be limited to secure networks. Local area networks may provide links between the meter (the service measuring system) and the consumer. This function will require handling large amounts of business-sensitive information. Security and privacy issues will need to be addressed and are best handled by the hardware and software.
Figure 7 Use of Multiple Networks for Communications
Innovative Rates and Regulation
Traditional ratemaking approaches have linked a utility’s financial health to the volume of electricity sold, thus providing a disincentive to investment in energy efficiency, demand response, and ultimately, the consideration of demand-side resources on the same playing field as generation resources. However, over the last two decades, many state regulatory bodies have experimented with various approaches to energy efficiency and demand response, providing a rich field of experience for today’s regulators to draw upon for future innovations in regulation.
For regulators, energy efficiency and demand response can be viewed as tools to help expand the portfolio of options, create new capabilities and functionality in the power system, and establish more of a dynamic “partnership” between utilities and their customers. Going forward, it will require a renewed business model that goes beyond that of strictly selling electricity. Viable business models are needed to place energy efficiency resources on a competitive platform with new generation.
4-7
Regulation should:
o Remove the disincentive of lost revenues so that the utility does not lose money by selling less electricity
o Allow recovery of investment costs in infrastructure
o Provide incentives for utilities to achieve energy efficiency and demand response goals
Prior experience has shown that these business models must be designed carefully to avoid unintended effects detrimental to utilities and consumers.9
In the United States, significant legislative and regulatory experience associated with programs designed to foster energy efficiency and demand response exists and includes this: since passage of the 1980 Pacific Northwest Electric Power Planning and Conservation Act authorizing the states of Idaho, Montana, Oregon, and Washington to form the Council as an “interstate compact” agency, the Northwest Power and Conservation Council has been studying energy efficiency and demand response.10 For the past five years, the Council has issued its annual Northwest Electric Power and Conservation Plan, which systematically relies on energy efficiency and demand response as part of the regional integrated resource planning process.
Note that the following data from the United States11 are illustrative of programs in place as of the end of 2003:
o New Mexico’s legislature has declared energy efficiency the primary resource for meeting demand growth, followed by renewables, distributed generation, and fossil generation, in that order.
o California and Hawaii have been some of the leaders in regulatory innovation by decoupling electric utility profits from sales volume, positioning energy efficiency as the state’s most important electricity-based resource, and adjusting the loading order accordingly for new electric resources.
o Pennsylvania and Connecticut now include energy efficiency as an integral part of their resource portfolios.
o The Independent System Operator (ISO) New England put out a request for proposal for an energy efficiency resource that could address a growing reliability problem. The winning bid was a 5-MW commercial office lighting project.
o Minnesota, Iowa, and Massachusetts provide utilities with lost revenue adjustments for energy efficiency.
9 EEI/NRDC Letter to NARUC Commissioners, “Electric Resource Portfolio Management,” November 18, 2003. 10 Northwest Power and Conservation Council, “Fifth Northwest Electric Power and Conservation Plan,” 2005. 11 Revealing the Value of Demand Response: Regulatory and Market Options. EPRI: Palo Alto, CA: 2003. 1001638.

4-8
o Massachusetts and Minnesota also use system benefit charges to set spending budgets for energy efficiency. The formula is 2.5 mills/kWh in Massachusetts, and 1.5% of gross operating in Minnesota. The New York commission has set the 2006 budget at $175 million.
o Performance incentives are used in several states, including Rhode Island, Massachusetts, Connecticut, and Nevada.
New programs incorporating other aspects of energy efficiency and demand response are under development across the country. A description of these programs is beyond the scope of this paper, but some specific examples are described next.
Innovative Markets
Market innovation in the context of this paper has two dimensions: innovations needed to stimulate the market for energy efficiency capital stock as well as energy efficiency programs and those innovations needed in the structure of wholesale and retail electricity markets to stimulate dynamic systems.
Retail Markets for Energy Efficiency
The technical potential for improving energy efficiency in appliances, equipment and processes is substantially greater than anything realized to date. The actual achievements are likely to remain suboptimal without concerted efforts to intervene in the marketplace for equipment. A key reason is that both consumers and suppliers are focused on a wide array of performance features, only one of which is energy consumption. Most often energy efficiency improvement is simply a by-product of overall performance improvement in equipment and appliances.
As mentioned in the discussion of regulation, the current primary intervention in the marketplace occurs through regulatory action, the establishment of appliance standards and building codes, and the creation of consumer incentives. In addition, electricity suppliers have used a number of measures over the last few decades to stimulate the marketplace, some with significant and lasting results.
Key measures include:
o Trade ally cooperation, including home builders and contractors, professional societies, and trade groups
o Direct customer contact, for example, by market service representatives, energy auditors, and equipment servicing
o Energy Star Program, a large national effort to publicize efficiency improvements possible through innovative technology
o Direct incentives, including cash grants, rebates, buyback programs, and low-interest loans
o Alternative pricing, including time-of-use rates, inverted rates, and seasonal rates.
4-9
Wholesale Electricity Markets
The four building blocks provide for “24/7” time- and price-dependent variation in demand. This will entail structural accommodation by wholesale and retail power markets and is very likely to have a substantial impact on the price behavior of power markets. This in turn will require accommodation by the energy generators, energy distributors, and consumers, with particular attention to changes in load patterns, price patterns, and financial risk management. Marketplace drivers to advance efficiency in equipment and processes combined with development of advanced communications and dynamic systems will create the technology backbone on which innovative value propositions can be built to include efficiency and demand response elements.
Markets to Stimulate Energy Efficiency and Demand Response
As mentioned in the discussion of the building blocks of energy efficiency, market systems emerge as a key enabler that can allow market participants and customers access to new levels of value. Coupled with technology advances discussed in the communications and smart-end use device building blocks and with creative rate structures, markets can provide a platform for creative new value offerings that benefit both energy consumers and energy providers.
Reliance on market features that allow participants to develop new value presumes that competition will drive innovation and will successfully attract capital willing to accept the risks. There is ample evidence from well-developed markets on the wholesale energy side that this type of innovation occurs. In a recent example, one major northeast utility is obligated to sell any excess energy (above its native load) at a market clearing price. This ensures maximum cost-effective utilization of the generation asset and encourages functional market processes, whether the market prices are lower or higher than contract prices.
In comparison, development of markets on the consumer side is much less advanced. Numerous possibilities can be envisioned in a well-developed retail market. With appropriate rate structures, some energy-intensive businesses will find it cost-effective to re-engineer their processes to optimize their energy usage or to achieve energy flexibility and profit from dynamic systems. Others might find it more profitable to not operate under certain conditions where they could be compensated for reducing load, essentially adding to the capacity margin. A niche for aggregated load management could emerge in which aggregators could make financial commitments to owners of different loads and offer aggregated load management services to utilities under certain conditions as a hedge against situations where the additional capacity is needed. Utilities could provide additional value-added products other than electricity, for example, appliance diagnostics.
Appropriate market features enabling new innovative value propositions are necessary to enable market participants to adequately differentiate themselves to consumers and thus compete. For example, simple peak-shaving capabilities, while valuable to utilities, are often of only moderate value to consumers since the energy cost reduction may not be significant (however, there are large benefits to the economy and society from avoiding power curtailments to maintain system reliability). Another critical issue that can be addressed by markets is balancing important priorities for consumers, society, and market
4-10
participants. Markets increase the number of organizations looking to create solutions that respond to all priorities.
An interesting perspective on markets relative to the infrastructure concept discussed in this paper is that the emergence of the other three building blocks in many ways creates visibility and transparency on how value can be derived from investments in efficiency and demand response, thus incenting creation of markets where this value is accessible.
Several aspects of value become apparent:
o Deferral of investment in generation and/or T&D assets. Such deferral has a significant value because the present value associated with the principal and interest for the deferral period is permanently avoided.
o Capital and ensuing operations and maintenance investments in low-capacity factor peaking plants could be reduced. The marginal cost of peaking generation is very high and usually least profitable for investors.
o Uncertainty on potential profitability of generation investments associated with potential CO2 emissions allowance costs could be hedged in part by strategies including efficiency, demand response, and dynamic systems measures. In essence, some of the “risk premium” associated with investment in generation potentially affected by CO2 policies could be partially mitigated.
o A robust market in which multiple providers of “negawatts” exist would increase competition and reduce “peakiness” in spot energy prices because those “negawatts” could then be offered in other markets.
The design of new markets and contracts will require a flexible regulatory approach and proactive commitments on the part of all market participants to address the challenges of implementing the new structures. The advances discussed in the other building blocks composing the energy efficiency infrastructure will permit delivery of value to all stakeholders at a scale that will drive market development.
Smart End-Use Devices and Strategies
Many end-use technologies are beginning to evolve through advances in distributed intelligence, from static devices to those with much more dynamic capabilities. Southern California Edison (SCE), for example, has proposed a pilot program that will use Westinghouse’s two-way, wireless, dimmable energy efficiency T-5 fluorescent lighting as a retrofit for existing T-12 lamps in commercial, educational, and industrial facilities.
4-11
SCE will be able to dispatch these lighting systems using wireless technology and reduce lighting load at those facilities by as much as 50%.12
Similarly, air conditioner efficiency could be made more dynamic. An example of the substantial impact of intelligent devices can be seen in terms of space cooling. Embedded software and hardware in either a residential air condition system or a commercial HVAC system could provide the following capabilities:
o Ability to receive day-ahead and hourly electricity prices and day-ahead weather forecast through the Internet
o Ability to specify multiple target temperatures as a function of time of day
o Ability to “learn” the rate of house/building cool-down/heat-up based on factors such as occupant habits, outside temperature, and time of year
o Optimized operation to minimize consumers’ energy costs
o Ability to measure and communicate hourly power consumption to energy service provider through the Internet
An example of potential savings comes from one of three pricing experiments in California. Each experiment informed customers of future electricity prices. One pricing experiment was day ahead, another four hours ahead, and one featured enabling technologies in the form of smart thermostats that were price sensitive and designed to increase air conditioner settings when electricity prices increased. As reported by Ahmad Faruqui and Robert Earle of CRA International in the article, “Demand Response and Advanced Metering,” “the experiment revealed that customers did respond to time-varying prices. On average, residential customers reduced peak loads on critical days by 13.1 percent…Customers equipped with enabling technologies (automatic price-sensitive thermostats) delivered a response that was twice as high as those customers who did not have enabling technology.”13
In the longer term, networked intelligence will dominate. EPRI conducted significant research in smart appliances and networked homes in the 1990s and developed products to capitalize on the availability of information to monitor load at the device, for example, Non-Intrusive Appliance Load Monitoring System (NIALMS). But when deregulation changed EPRI’s customers’ business model, research in this area slowed. Similarly, companies like Cisco dropped their consumer business group focused on networked devices for the home.14 These efforts were ahead of their time. Today, networked devices are a commonplace topic to suppliers of consumer electronics, software, and networks. There are now conferences and web sites that concentrate on home and building automation, machine-to-machine communications, and networking technology.
Major hardware and software suppliers such as Intel and Microsoft now envision that every consumer device that can be networked will be networked. Cisco’s CEO John 12 Southern California Edison Design and Engineering Services, Lighting Technology Center, Remote-Controlled Dimmable Lighting. http://www.sce.com/RebatesandSavings/DesignandEngineering/SoCalLightingCenter/ RemoteControlledLighting.htm 13 See note 8. 14 “Cisco Plans Its Home Invasion,” Newsweek. March 20, 2006.

4-12
Chambers has a grand vision of the Home in the 21st century based on a “digital lifestyle.”15 Consumers will use these networked appliances in the home for entertainment, convenience, healthcare, and energy management. Building management systems will use networked appliances for lighting, comfort, and energy management.
Standards are in development to ensure that products can work together on networks. Open architecture to enable interoperability appears to be accepted, although it has taken years to achieve that. Virginia Williams, Director, Engineering & Standards, Technology and Standards, Consumer Electronics Association, said, “our own members…want a proprietary network. People don’t buy networks; they buy components, and they expect to be able to mix and match them, and they want competition on any given product. So the idea of a single-brand network…set back the industry maybe a decade.”16
With the home and commercial network in place to meet consumer demands such as entertainment, comfort, and energy management, adding the capability to receive electricity information will simply be another function. Managing device operations to respond to electricity price signals, for example, will be another added functionality. Consumers will be able to select their energy management scheme to operate automatically. Energy management schemes can take many forms, for example, to meet a desired comfort level at the minimum cost. Eventually, all electronic devices will have these capabilities, and the energy efficiency capabilities will be intrinsic to the devices and the networks.
Descriptions of other innovative end-use technologies are provided in Appendix A.17
15 Ibid. 16 Williams, Virginia, “Consumer Electronics Association,” Electronic Engineering Times. January 2006. 17 World Energy Council, Energy End-Use Technologies for the 21st Century. London, England (2004).

5-1
5 VALUING THE VISION
Can the priorities and investments implied by this national energy efficiency vision be justified by its benefits to utilities, consumers, and the society at large? We believe that they can, and as the potential energy savings grow over time, as technology advances, and as regulators and policy makers embrace energy efficiency as a major alternative to energy supply, these benefits will certainly grow.
Numerous energy efficiency programs by states and individual utilities have been in place for several decades, with mixed results. Utility restructuring that began in the 1990s set some of these programs back, while others withered away. Some regions have continued to aggressively pursue energy efficiency and demand response in integrated resource planning; the annual Electric Power and Conservation Plans developed by the Northwest Power and Conservation Council, a compact of Washington, Idaho, Montana, and Oregon, are examples.18 Nevertheless, there is a consensus that the nation has achieved only a small fraction of what is possible in this broad area. For example, there is very high potential for improving energy efficiency in four major areas of electricity consumption:
o Residential and commercial lighting
o Efficient appliances
o Industrial process improvements
o Air conditioning and refrigeration
The potential for energy efficiency remains a lively topic for discussion and ongoing analysis. A variety of studies have been conducted in various states and regions on the “achievable potential” efficiency improvement (a subset of technical and economic potential), using a variety of measures, assumptions, and approaches. Details of these studies are included in Appendix B and summarized in Figure 8 and Table 1.
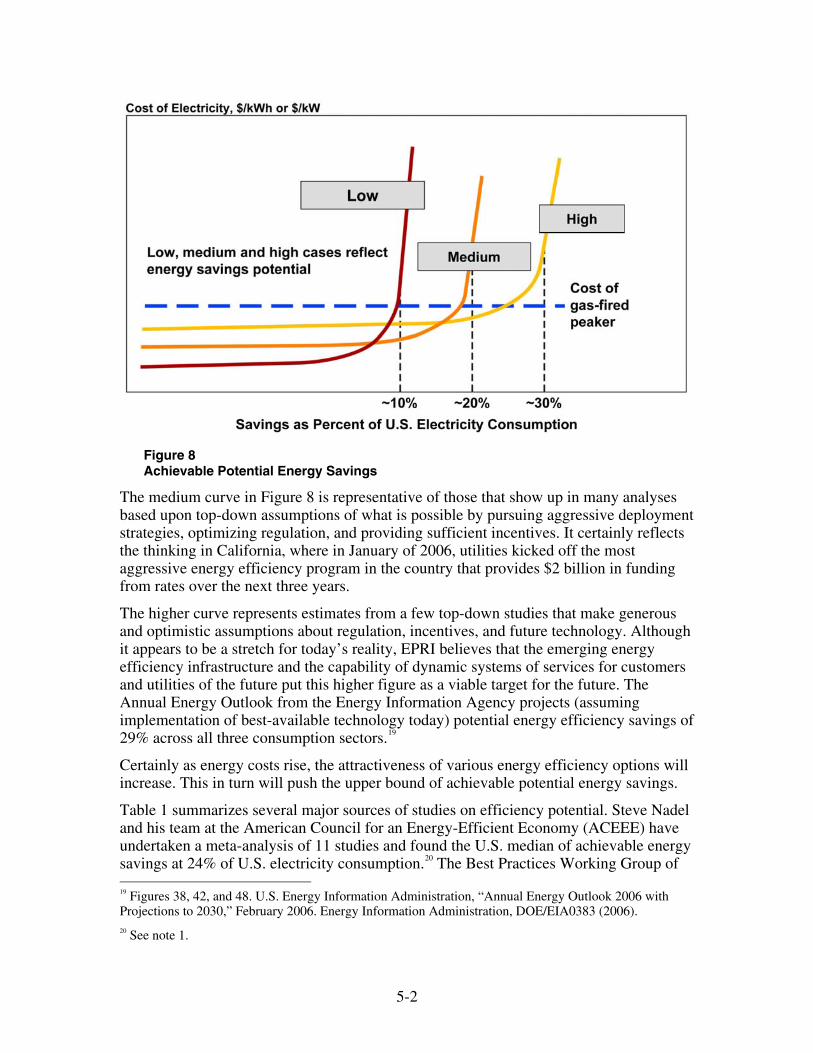
Figure 8 captures in conceptual form the general findings of low, medium, and high estimates of energy savings, at roughly 10%, 20%, and 30% of total U.S. electricity consumption. The lower figure represents the most conservative approach, using bottom-up analysis of actual implementation experience by electric utilities, current policy, regulations, and incentives.
18 See note 10.
5-2
Figure 8 Achievable Potential Energy Savings
The medium curve in Figure 8 is representative of those that show up in many analyses based upon top-down assumptions of what is possible by pursuing aggressive deployment strategies, optimizing regulation, and providing sufficient incentives. It certainly reflects the thinking in California, where in January of 2006, utilities kicked off the most aggressive energy efficiency program in the country that provides $2 billion in funding from rates over the next three years.
The higher curve represents estimates from a few top-down studies that make generous and optimistic assumptions about regulation, incentives, and future technology. Although it appears to be a stretch for today’s reality, EPRI believes that the emerging energy efficiency infrastructure and the capability of dynamic systems of services for customers and utilities of the future put this higher figure as a viable target for the future. The Annual Energy Outlook from the Energy Information Agency projects (assuming implementation of best-available technology today) potential energy efficiency savings of 29% across all three consumption sectors.19
Certainly as energy costs rise, the attractiveness of various energy efficiency options will increase. This in turn will push the upper bound of achievable potential energy savings.
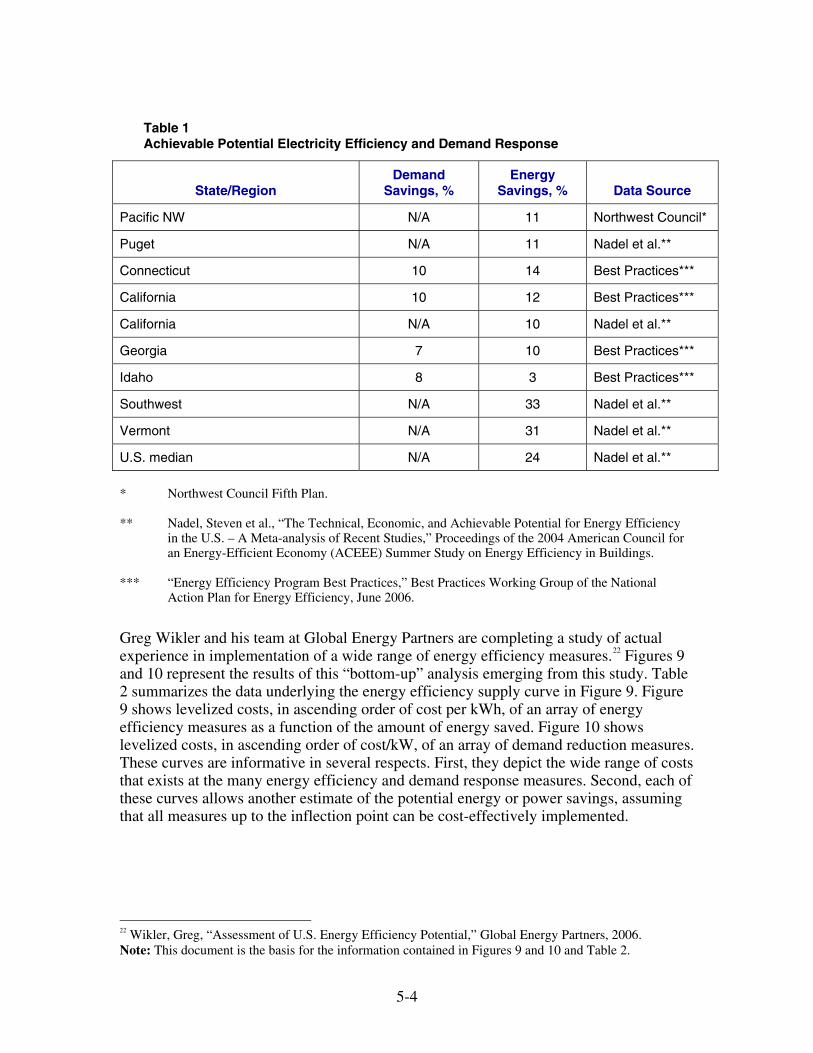
Table 1 summarizes several major sources of studies on efficiency potential. Steve Nadel and his team at the American Council for an Energy-Efficient Economy (ACEEE) have undertaken a meta-analysis of 11 studies and found the U.S. median of achievable energy savings at 24% of U.S. electricity consumption.20 The Best Practices Working Group of 19 Figures 38, 42, and 48. U.S. Energy Information Administration, “Annual Energy Outlook 2006 with Projections to 2030,” February 2006. Energy Information Administration, DOE/EIA0383 (2006). 20 See note 1.

5-3
the National Action Plan for Energy Efficiency surveyed a set of analyses indicating achievable potential in the range of 10% for demand savings and 12% for energy savings.21 The details and sources of the studies are included in Appendix B. It is important to recognize that three types of potential are traditionally defined in these studies. “Technical” refers what is possible based solely on technical feasibility. It is thus typically the highest estimate of potential. “Economic” represents a reduction to the technical potential considering requirements for cost effectiveness. “Achievable” further reduces the economic potential considering other factors that may limit the scope of implementation of energy efficiency and demand response measures. Thus, achievable potential is typically the lowest and most conservative estimate.
21 “Energy Efficiency Program Best Practices,” Best Practices Working Group of the National Action Plan for Energy Efficiency, June 2006.
5-4
Table 1 Achievable Potential Electricity Efficiency and Demand Response
State/Region Demand
Savings, % Energy
Savings, % Data Source
Pacific NW N/A 11 Northwest Council*
Puget N/A 11 Nadel et al.**
Connecticut 10 14 Best Practices***
California 10 12 Best Practices***
California N/A 10 Nadel et al.**
Georgia 7 10 Best Practices***
Idaho 8 3 Best Practices***
Southwest N/A 33 Nadel et al.**
Vermont N/A 31 Nadel et al.**
U.S. median N/A 24 Nadel et al.**
* Northwest Council Fifth Plan. ** Nadel, Steven et al., “The Technical, Economic, and Achievable Potential for Energy Efficiency
in the U.S. – A Meta-analysis of Recent Studies,” Proceedings of the 2004 American Council for an Energy-Efficient Economy (ACEEE) Summer Study on Energy Efficiency in Buildings.
*** “Energy Efficiency Program Best Practices,” Best Practices Working Group of the National
Action Plan for Energy Efficiency, June 2006.
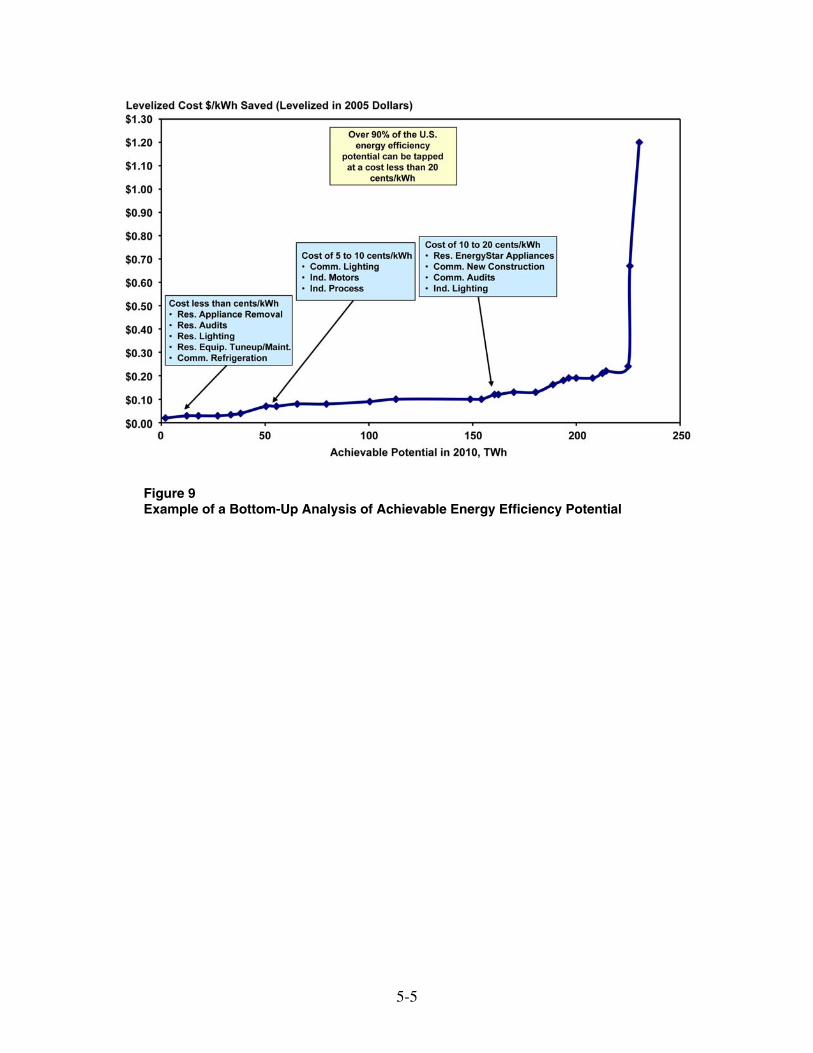
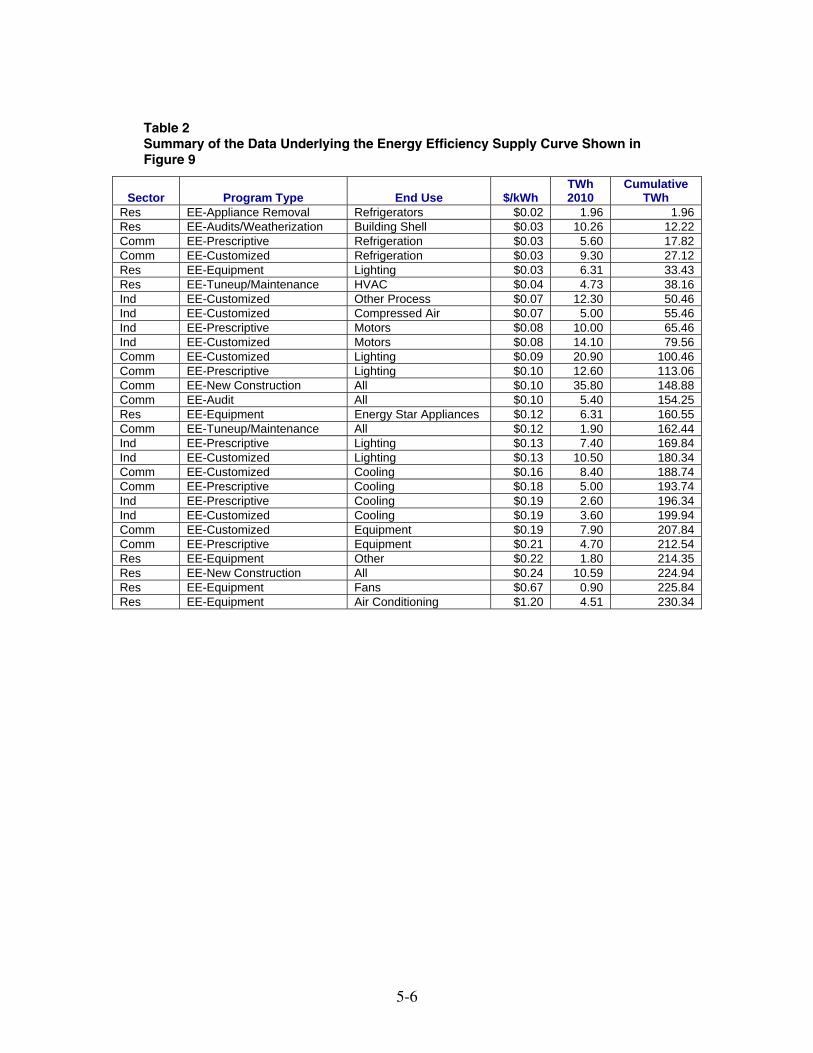
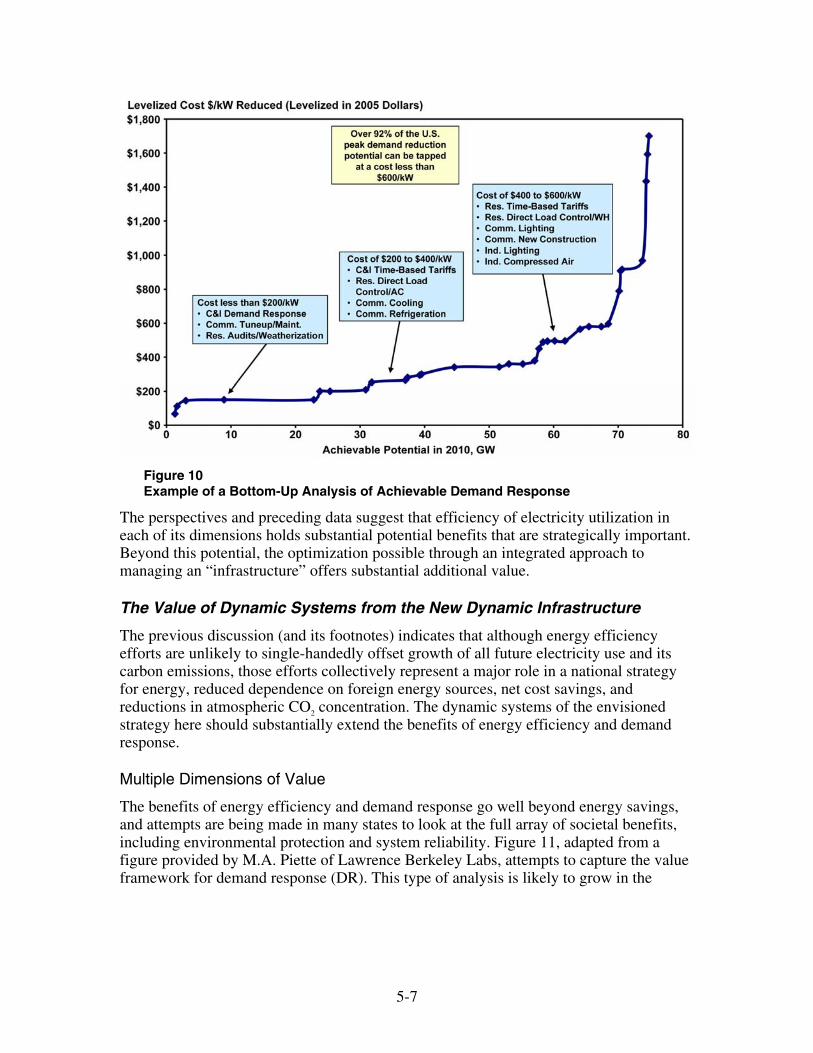
Greg Wikler and his team at Global Energy Partners are completing a study of actual experience in implementation of a wide range of energy efficiency measures.22 Figures 9 and 10 represent the results of this “bottom-up” analysis emerging from this study. Table 2 summarizes the data underlying the energy efficiency supply curve in Figure 9. Figure 9 shows levelized costs, in ascending order of cost per kWh, of an array of energy efficiency measures as a function of the amount of energy saved. Figure 10 shows levelized costs, in ascending order of cost/kW, of an array of demand reduction measures. These curves are informative in several respects. First, they depict the wide range of costs that exists at the many energy efficiency and demand response measures. Second, each of these curves allows another estimate of the potential energy or power savings, assuming that all measures up to the inflection point can be cost-effectively implemented.
22 Wikler, Greg, “Assessment of U.S. Energy Efficiency Potential,” Global Energy Partners, 2006. Note: This document is the basis for the information contained in Figures 9 and 10 and Table 2.
5-5
Figure 9 Example of a Bottom-Up Analysis of Achievable Energy Efficiency Potential
5-6
Table 2 Summary of the Data Underlying the Energy Efficiency Supply Curve Shown in Figure 9
Sector Program Type End Use $/kWh TWh 2010
Cumulative TWh
Res EE-Appliance Removal Refrigerators $0.02 1.96 1.96 Res EE-Audits/Weatherization Building Shell $0.03 10.26 12.22 Comm EE-Prescriptive Refrigeration $0.03 5.60 17.82 Comm EE-Customized Refrigeration $0.03 9.30 27.12 Res EE-Equipment Lighting $0.03 6.31 33.43 Res EE-Tuneup/Maintenance HVAC $0.04 4.73 38.16 Ind EE-Customized Other Process $0.07 12.30 50.46 Ind EE-Customized Compressed Air $0.07 5.00 55.46 Ind EE-Prescriptive Motors $0.08 10.00 65.46 Ind EE-Customized Motors $0.08 14.10 79.56 Comm EE-Customized Lighting $0.09 20.90 100.46 Comm EE-Prescriptive Lighting $0.10 12.60 113.06 Comm EE-New Construction All $0.10 35.80 148.88 Comm EE-Audit All $0.10 5.40 154.25 Res EE-Equipment Energy Star Appliances $0.12 6.31 160.55 Comm EE-Tuneup/Maintenance All $0.12 1.90 162.44 Ind EE-Prescriptive Lighting $0.13 7.40 169.84 Ind EE-Customized Lighting $0.13 10.50 180.34 Comm EE-Customized Cooling $0.16 8.40 188.74 Comm EE-Prescriptive Cooling $0.18 5.00 193.74 Ind EE-Prescriptive Cooling $0.19 2.60 196.34 Ind EE-Customized Cooling $0.19 3.60 199.94 Comm EE-Customized Equipment $0.19 7.90 207.84 Comm EE-Prescriptive Equipment $0.21 4.70 212.54 Res EE-Equipment Other $0.22 1.80 214.35 Res EE-New Construction All $0.24 10.59 224.94 Res EE-Equipment Fans $0.67 0.90 225.84 Res EE-Equipment Air Conditioning $1.20 4.51 230.34
5-7
Figure 10 Example of a Bottom-Up Analysis of Achievable Demand Response
The perspectives and preceding data suggest that efficiency of electricity utilization in each of its dimensions holds substantial potential benefits that are strategically important. Beyond this potential, the optimization possible through an integrated approach to managing an “infrastructure” offers substantial additional value.
The Value of Dynamic Systems from the New Dynamic Infrastructure
The previous discussion (and its footnotes) indicates that although energy efficiency efforts are unlikely to single-handedly offset growth of all future electricity use and its carbon emissions, those efforts collectively represent a major role in a national strategy for energy, reduced dependence on foreign energy sources, net cost savings, and reductions in atmospheric CO2 concentration. The dynamic systems of the envisioned strategy here should substantially extend the benefits of energy efficiency and demand response.
Multiple Dimensions of Value
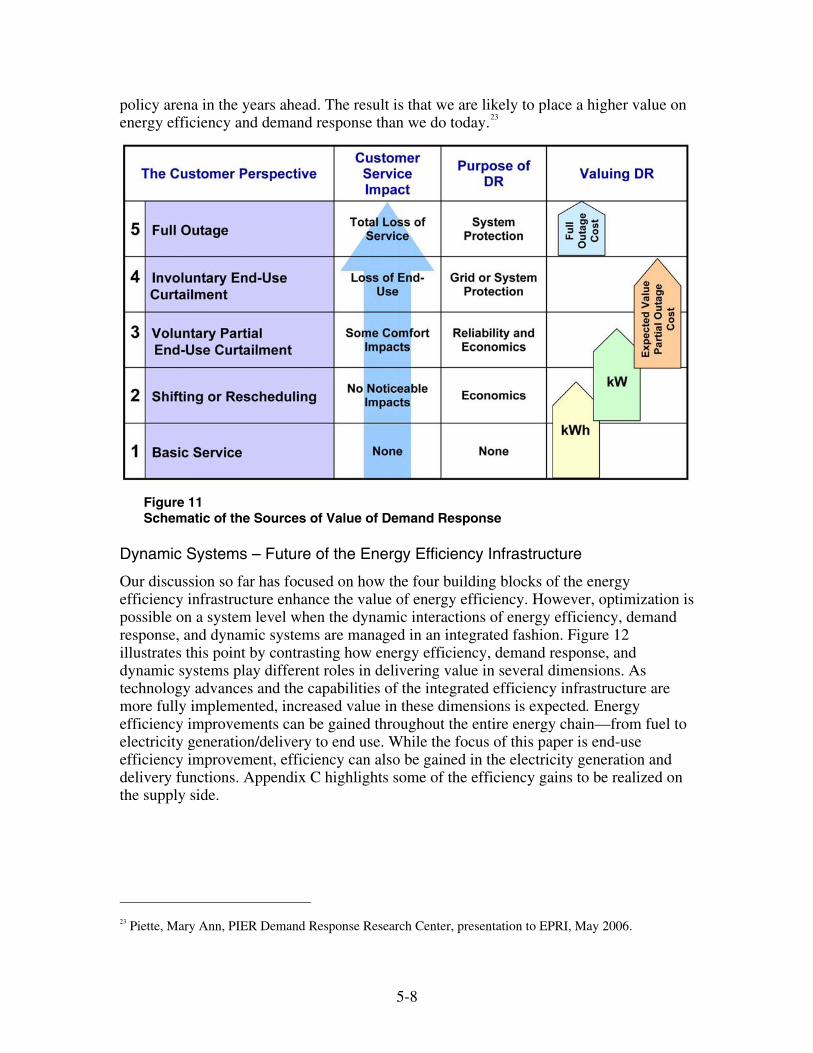
The benefits of energy efficiency and demand response go well beyond energy savings, and attempts are being made in many states to look at the full array of societal benefits, including environmental protection and system reliability. Figure 11, adapted from a figure provided by M.A. Piette of Lawrence Berkeley Labs, attempts to capture the value framework for demand response (DR). This type of analysis is likely to grow in the
5-8
policy arena in the years ahead. The result is that we are likely to place a higher value on energy efficiency and demand response than we do today.23
Figure 11 Schematic of the Sources of Value of Demand Response
Dynamic Systems – Future of the Energy Efficiency Infrastructure
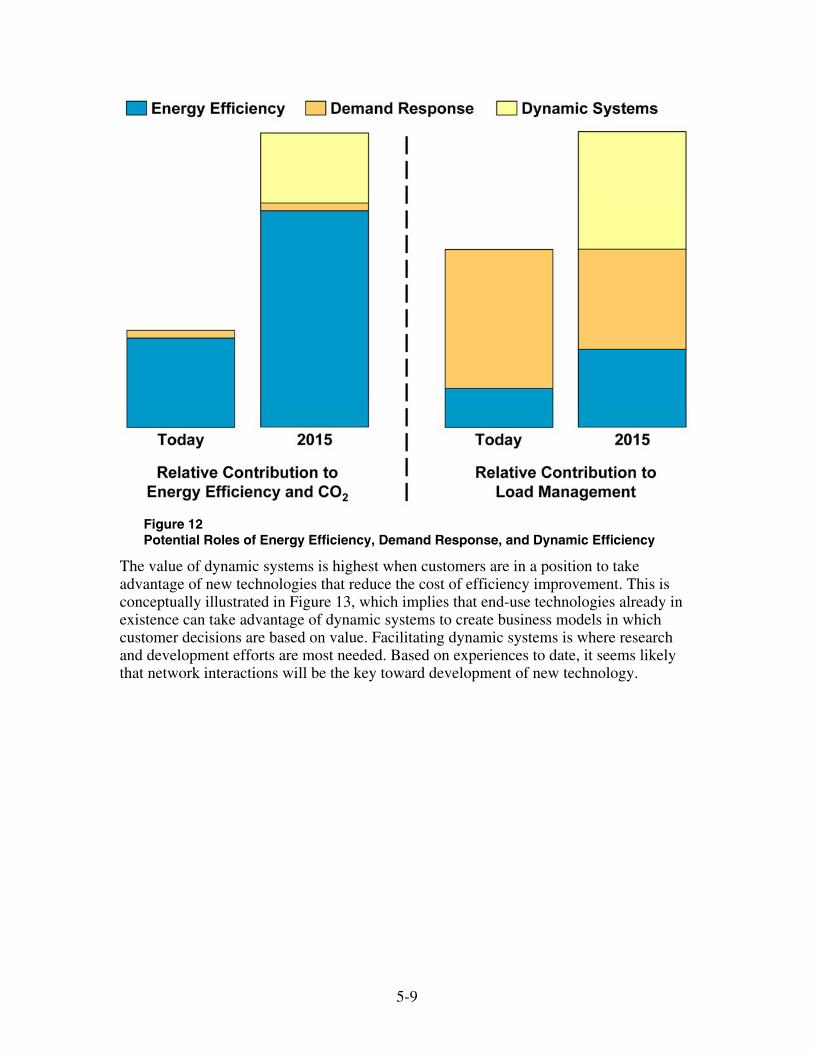
Our discussion so far has focused on how the four building blocks of the energy efficiency infrastructure enhance the value of energy efficiency. However, optimization is possible on a system level when the dynamic interactions of energy efficiency, demand response, and dynamic systems are managed in an integrated fashion. Figure 12 illustrates this point by contrasting how energy efficiency, demand response, and dynamic systems play different roles in delivering value in several dimensions. As technology advances and the capabilities of the integrated efficiency infrastructure are more fully implemented, increased value in these dimensions is expected. Energy efficiency improvements can be gained throughout the entire energy chain—from fuel to electricity generation/delivery to end use. While the focus of this paper is end-use efficiency improvement, efficiency can also be gained in the electricity generation and delivery functions. Appendix C highlights some of the efficiency gains to be realized on the supply side.
23 Piette, Mary Ann, PIER Demand Response Research Center, presentation to EPRI, May 2006.
5-9
Figure 12 Potential Roles of Energy Efficiency, Demand Response, and Dynamic Efficiency
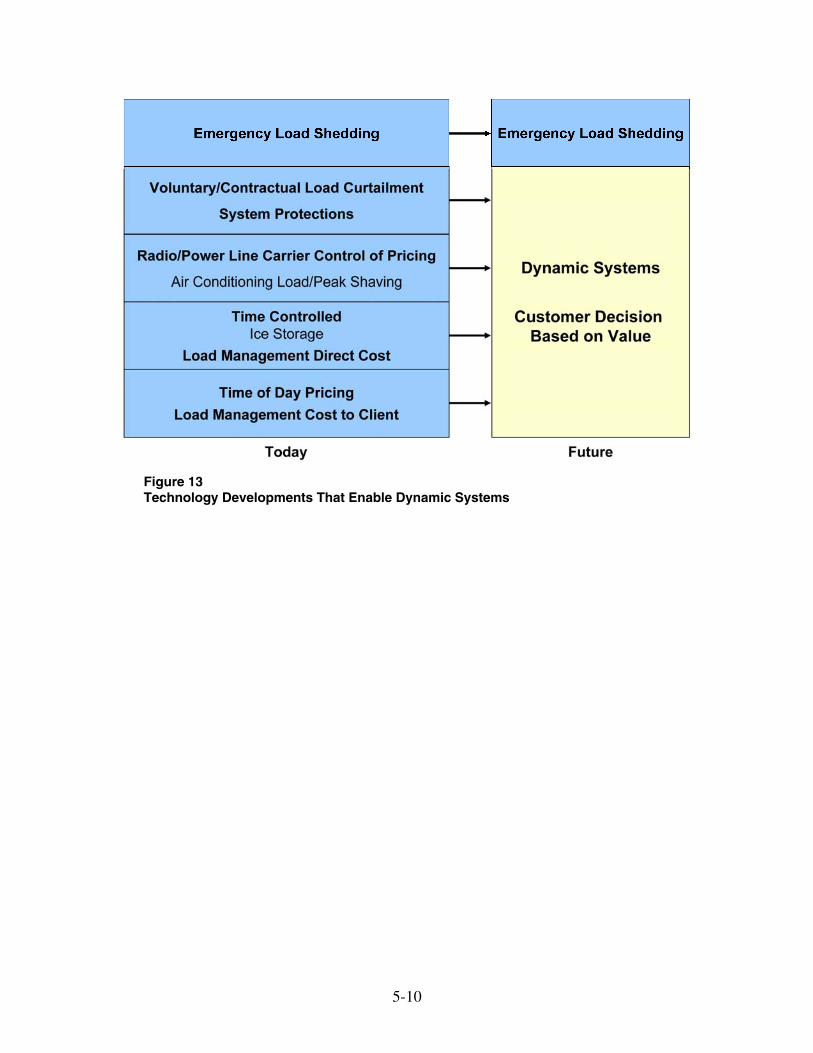
The value of dynamic systems is highest when customers are in a position to take advantage of new technologies that reduce the cost of efficiency improvement. This is conceptually illustrated in Figure 13, which implies that end-use technologies already in existence can take advantage of dynamic systems to create business models in which customer decisions are based on value. Facilitating dynamic systems is where research and development efforts are most needed. Based on experiences to date, it seems likely that network interactions will be the key toward development of new technology.
5-10
Figure 13 Technology Developments That Enable Dynamic Systems
6-1
6 CONCLUSIONS AND QUESTIONS FOR THE PARTICIPANTS
This paper is intended to stimulate discussion at the 2006 EPRI Summer Seminar. It provides an overview of the forces driving greater use of energy efficiency and demand response and explores the potential for both static and dynamic approaches. Some of its key observations are summarized next, followed by questions for the Seminar participants to consider.
Conclusions
o Energy efficiency and demand response can be cost-effective alternatives to adding new capacity.
o The programmatic approaches to energy efficiency and demand response have been successful, but substantial untapped potential remains in these two areas.
o There is a significant opportunity to utilize innovative technology, regulation, and markets to drive energy efficiency, demand response, and—through dynamic systems—even more effective electricity utilization than traditional approaches could offer.
o An interactive set of four building blocks—communications infrastructure, innovative rates and regulation, innovative markets, and smart end-use devices—constitutes an emerging “efficiency infrastructure” that will make the dynamic dimension of management of energy consumption more robust over time, substantially expanding the potential for energy efficiency.
o The potential for cost-effective energy efficiency, using today’s technology, is at least 5–10% of total electricity demand.
o Europe has well-developed energy efficiency and demand response programs, is pursuing the advantages of dynamic systems, and could offer valuable lessons for the United States.
o The achievable potential associated with implementation of dynamic systems as discussed here has not been quantified, but combined with optimistic projections for achievable potential for existing energy efficiency and demand response technologies, integrated implementation of an efficiency infrastructure including dynamic systems should substantially exceed 30% of electricity consumption in the coming decades.
o The potential impact on demand management of the efficiency infrastructure envisioned here should also be substantial as it represents a continuous (rather than periodic) process capable of optimization at multiple scales.
6-2
Research and Development Agenda
It is clear from the previous discussion that several questions exist around the concept of an integrated “efficiency infrastructure”: what is the potential inherent in such an approach, and what additional technologies are needed to realize this vision? New value propositions will have to be created for all stakeholders for the vision discussed here to be sustainable. Broadly, the research needs are present in three areas: hardware, software, and data and other items.
Based on the discussion in this paper and the research on which it is based, a number of R&D needs emerge; certainly others will emerge as the vision described in this paper is pursued. EPRI’s focus will be on the technology challenges associated with the communications infrastructure and development and implementation of the dynamic systems described. The R&D needs below represent an initial assessment.
Hardware:
o Develop, test, and demonstrate network communications infrastructure, including security, protocols, and standards.
o Appliance manufacturers must develop microdevices that are Internet addressable for purposes of monitoring of device operation, diagnosis of impending operational problems, maintenance, and repairs.
o Smart technology is needed to respond to electricity price information (for example, day-ahead or hour-by-hour) and optimize electricity use continually. The optimization process would include efficiency improvement and demand response and would incorporate a “prices to devices” approach to manage system optimization.
o Develop, test, and demonstrate real-time two-way information exchange between energy service providers and energy-consuming devices.
o Advanced metering infrastructure is needed to integrate automated meter reading, grid management and operations, energy procurement, and customer services.
o CO2 sensors for demand control of ventilation are needed. CO2 concentration is a dynamic measure of indoor air quality. New sensor designs incorporate a carbon nanofiber sensor to replace the older infrared technology; energy savings are estimated at 10–30%.
o Switchable electrochromic window coatings are needed. Electrochromics are expected to dominate the worldwide coatings market. Trillions of square feet of existing glass and annual additions of hundreds of millions of square feet would benefit from addition of coatings that increase and optimize energy efficiency.
o Energy management in data centers is needed. Heat generation without efficient dissipation has become the largest impediment to the development of the next generation of high-speed computing devices. Improvements are needed in the efficient removal of heat from its source, especially at Internet data centers.
o Smart sensors and radio frequency identification systems are needed.

6-3
Software:
o Adaptive software for integrated response to real-time rates, weather conditions, customer-specified energy management requirements, and utility-specified load management requirements is needed.
o Adaptive software for aggregated load management of multiple consumer devices is needed.
o Software for real-time data acquisition and analysis of energy efficiency, demand response, and dynamic systems data necessary to support adaptive software described above is needed.
Data and “other”:
o Need to develop a structure for studying and estimation the technical, economic, and achievable energy efficiency and demand response benefits associated with the efficiency infrastructure discussed here, including dynamic systems.
o Better data regarding the potential, what’s achievable, and what’s economic for the advanced energy efficiency/DR infrastructure hypothesized in this paper
Key Questions for Participants
1. What are your perspectives of the vision of the future we have laid out? Where do you see value in this vision to society, consumers, and utilities?
2. Numerous activities are underway among suppliers of consumer electronics, software, and network components to automate and network buildings and homes. How can the electricity enterprise tap into that groundswell of activities?
3. What are avenues for implementing the energy communications infrastructure? How should it be accomplished, and who has what roles?
4. What are examples of innovative regulation to enable dynamic systems? What are avenues for creating and implementing innovative regulation?
5. What are opportunities for creating markets to encourage sustainable dynamic systems?
6. What role will smart devices play in energy efficiency? Demand response? Dynamic systems?
7. What are the key research needs to bring dynamic systems to a sustainable reality?
8. What roles are there for EPRI to further the dynamic systems concepts?

7-1
7 BIBLIOGRAPHY
Best Practices Working Group: “Energy Efficiency Program Best Practices,” National Action Plan for Energy Efficiency, June 2006.
Bloom, Jeremy, “Program on Innovation: Opportunities for Advancing End-Use Energy Efficiency, Electric Power Research Institute, 2005.
California Energy Commission, “Is Efficiency Enough? Towards a New Framework for Carbon Savings in the California Residential Sector,” Public Interest Energy Research (PIER) Program Final Project Report. Report Number CEC-500-2005-162, October 2005.
Electric Power Research Institute, Electricity Technology Roadmap: 2003 Summary and Synthesis. Palo Alto, CA: 2003.
Electric Power Research Institute, Program on Technology Innovation: Opportunities for Advancing End-Use Energy Efficiency. Palo Alto, CA: 2005. 1012003.
Electric Power Research Institute, Principles and Practice of Demand-Side Management. Palo Alto, CA: 1993. TR-102556.
Electric Power Research Institute, Revealing the Value of Demand Response: Regulatory and Market Options. Palo Alto, CA: 2003. 1001638.
Enerex Corporation, “Advanced Metering and Demand Responsive Infrastructure: A Summary of the PIER/CEC Reference Design, Related Research, and Key Findings,” California Energy Commission, Consultant Report, June 2005.
European Communities, “Doing More with Less: Green Paper on Energy Efficiency,” Office for Official Publications of the European Communities, Luxembourg, 2005.
Faruqui, Ahmad and Stephen George, “Pushing the Envelope on Rate Design,” The Electricity Journal. March 2006.
Faruqui, Ahmad and Robert Earle, “Demand Response and Advanced Metering,” Regulation. Spring 2006.
Gellings, Clark and Kelly Parmenter, “Demand-Side Management,” Draft of CRC Handbook, 2005.
Global Environment Fund, “The Emerging Smart Grid: Investment and Entrepreneurial Potential in the Electric Power Grid of the Future,” Center for Smart Energy, October 2005.
Jouaire, J. and Richard Schomberg, Electricité de France, presentation at Metering America, April 24, 2006, Atlanta, Georgia.
7-2
Keystone Dialog on Global Climate Change, Final Report May 2003. The Keystone Center, www.keystone.org.
Kiliccote, Sila and Mary Ann Piette, “Advanced Control Technologies and Strategies Linking Demand Response and Energy Efficiency,” JCEBO 2005 Conference Paper, September 1, 2005. Lawrence Berkeley National Laboratory, Berkeley, CA, LBNL #58179.
Nadel, Steven et al., “The Technical, Economic, and Achievable Potential for Energy Efficiency in the U.S. – A Meta-Analysis of Recent Studies,” Proceedings of the 2004 ACEEE Summer Study on Energy Efficiency in Buildings.
“Cisco Plans its Home Invasion,” Newsweek. March 20, 2006.
Piette, Mary Ann, PIER Demand Response Research Center, presentation to EPRI, May 2006.
Rosenfeld, Arthur, “Air Pollution as Climate Forcing,” East-West Center, Honolulu, HI, April 5, 2005.
Rosenfeld, Arthur, “Past and Current Efficiency Successes and Future Plans,” ACEEE: Energy Efficiency as a Resource,” Berkeley, CA, September 26, 2005.
U.S. Energy Information Administration, “Annual Energy Outlook 2006 with Projections to 2030, February 2006. Energy Information Administration, DOE/EIA0383 (2006).
United States Government Accountability Office, “Electricity Markets: Consumers Could Benefit from Demand Programs, but Challenges Remain,” Report to the Chairman, Committee on Governmental Affairs, U.S. Senate, August 2004.
Wikler, Greg, “Assessment of U.S. Energy Efficiency Potential,” Global Energy Partners, 2006.
Williams, Virginia, “Consumer Electronics Association,” Electronic Engineering Times. January 2006.
World Energy Council, “Energy End-Use Technologies for the 21st Century,” London, England, 2004.
A-1
A ADDITIONAL TECHNOLOGY OPPORTUNITIES FOR IMPROVING END-USE EFFICIENCY
Leading the drive to higher end-use efficiency is a set of technologies that not only improve energy efficiency, but also improve productivity and add functionality to existing processes. Although much of the progress in developing these technologies focuses on communications and information technology, there are also many opportunities for improving efficiency in the process and manufacturing industries as well as buildings. This appendix gives several examples of improving efficiency in various industries, as well as in the commercial and residential sectors, that exhibit some of the ways in which integration of technologies provides a particularly rich set of capabilities.
Iron and Steel
A study by Lawrence Berkeley National Laboratory (LBNL) surveyed the trends in reducing the energy intensity of steel production in the United States, France, Germany, Japan, Korea, and Poland between 1970 and 1994. Energy intensity in the United States declined by over 20% during this period, driven in part by the growth in electric steelmaking. In addition, the authors investigated more than 45 specific energy saving improvements, which yielded an average energy improvement of about 18% below previously identified best practices.
In addition, the US DOE is funding a direct steel-making demonstration combining microwave, electric arc, and exothermal heating. The process is expected to save up to 25% of the energy consumed in conventional steelmaking by replacing the blast furnaces and basic oxygen furnaces with more efficient, electricity-based technologies. Moreover, the quality of the steel is higher.
Food, Chemicals, and Waste
Industrial and commercial electrotechnologies offer several examples of high end-use efficiencies. In the food processing industries, freeze concentration (for example) can be used for separation of solids and liquids, efficiently replacing distillation processes in water desalination. In the chemical industry, microwave processes for synthesis of ethylene are now available that reduce the energy requirement to about 10% of current processes. In the waste processing industries, membranes for purifying natural gas from landfills and anaerobic digesters could provide enough pure methane to replace 1% of all conventional fuels used to generate electricity.
In a variety of industries, advanced oxidation processes such as dielectric barrier discharge, corona discharge, and flow-stabilized discharge have the ability to destroy several categories of air pollutants simultaneously.

A-2
Other examples of commercial sector efficiency improvement are supermarket refrigeration and dehumidification systems, advanced lighting systems for offices, and initiatives in the healthcare industry.
Residential Buildings
Efficiency improvements in buildings address both the building envelope and the equipment and appliances that populate the building. These technologies interact. The space heating requirement, and hence the size of the furnace, is a function of window design, amount of insulation, and other factors. Today’s technology is capable of zero net energy for heating and cooling, and technologies such as incorporating solar cells into windows can substantially reduce the space heating load.
Although the technologies for zero net energy homes are well in hand, some questions remain. These questions focus on factors such as cost, whether the indoor climate would be acceptable to residents, and whether a “sealed” house would meet future consumer preferences and air quality.
Opportunities for improving efficiency can be found throughout the house. Many of these electronic systems are either “on” or in a standby mode throughout the day and night. The Danish Energy Agency estimates that 10% of electricity use in private homes is “wasted” on standby.
The situation is exacerbated in offices and commercial buildings where computers and office equipment, as well as lights, are operated outside of normal business hours. While the computer equipment is normally operated nearly continuously, the office space is typically lit even though only a few people may be using the building after hours. In both residences and commercial buildings, there is room for substantial optimization of standby electricity consumption.
B-1
B HISTORIC RESULTS AND FUTURE POTENTIAL
Historic Perspective on Energy Efficiency
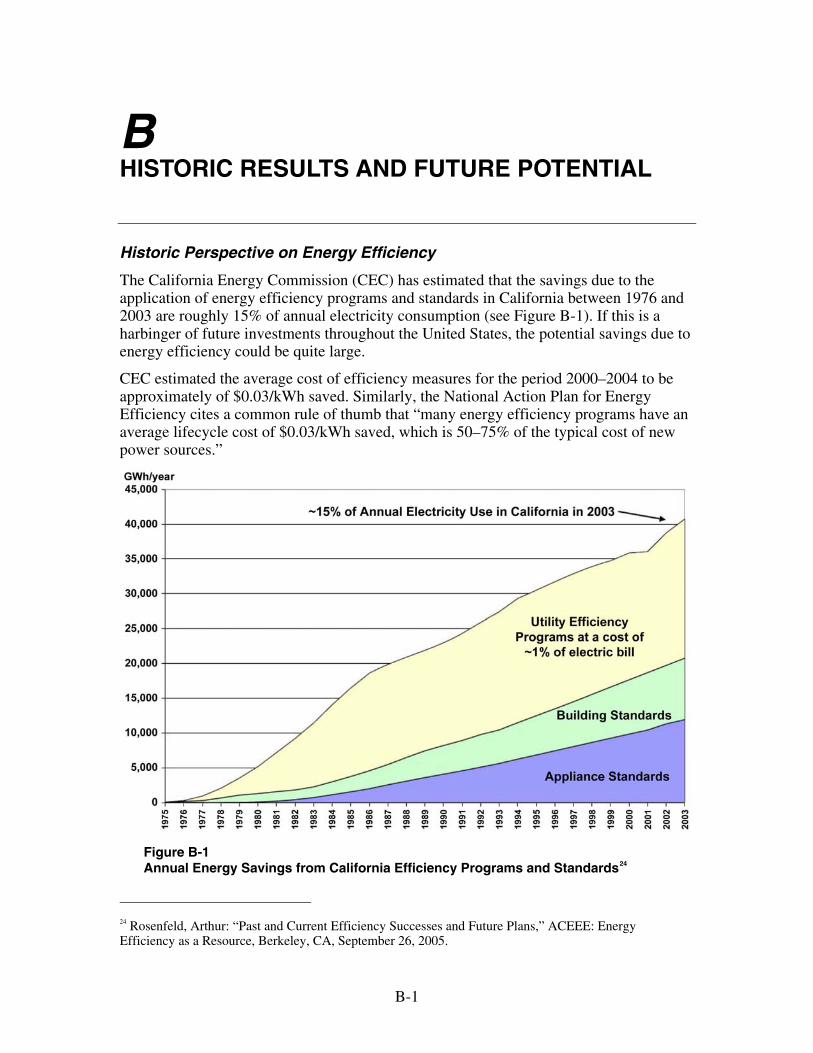
The California Energy Commission (CEC) has estimated that the savings due to the application of energy efficiency programs and standards in California between 1976 and 2003 are roughly 15% of annual electricity consumption (see Figure B-1). If this is a harbinger of future investments throughout the United States, the potential savings due to energy efficiency could be quite large.
CEC estimated the average cost of efficiency measures for the period 2000–2004 to be approximately of $0.03/kWh saved. Similarly, the National Action Plan for Energy Efficiency cites a common rule of thumb that “many energy efficiency programs have an average lifecycle cost of $0.03/kWh saved, which is 50–75% of the typical cost of new power sources.”
Figure B-1 Annual Energy Savings from California Efficiency Programs and Standards24
24 Rosenfeld, Arthur: “Past and Current Efficiency Successes and Future Plans,” ACEEE: Energy Efficiency as a Resource, Berkeley, CA, September 26, 2005.
B-2
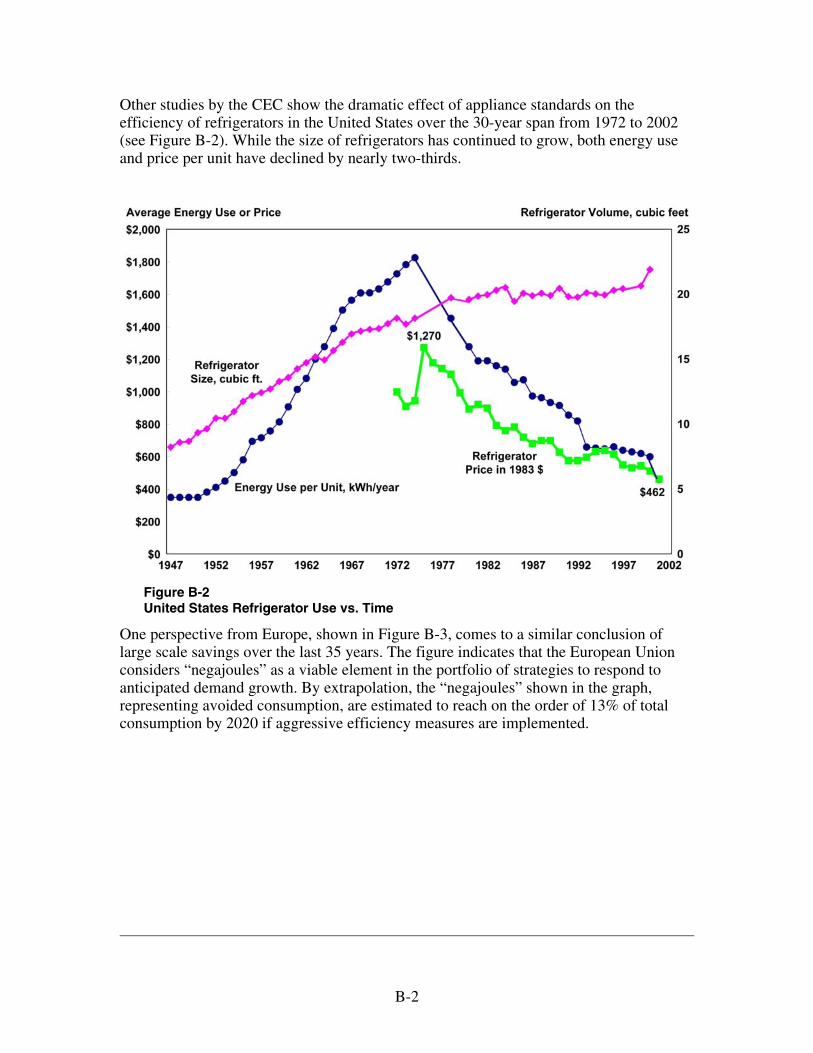
Other studies by the CEC show the dramatic effect of appliance standards on the efficiency of refrigerators in the United States over the 30-year span from 1972 to 2002 (see Figure B-2). While the size of refrigerators has continued to grow, both energy use and price per unit have declined by nearly two-thirds.
Figure B-2 United States Refrigerator Use vs. Time
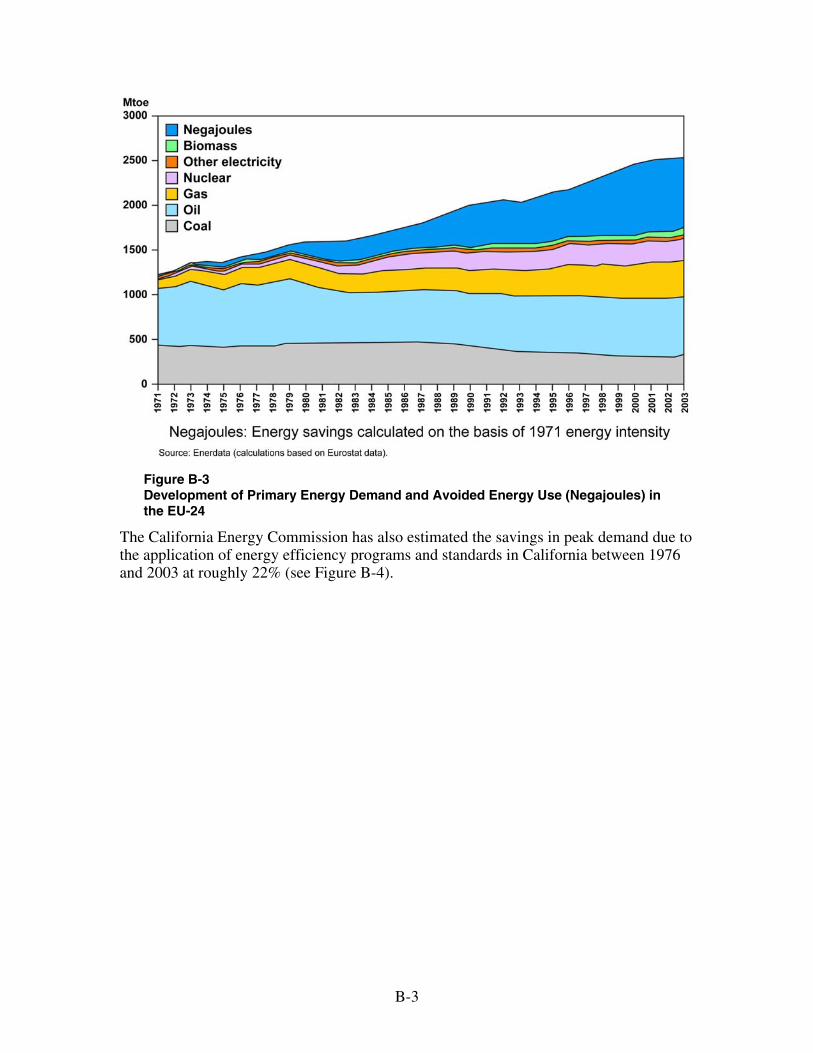
One perspective from Europe, shown in Figure B-3, comes to a similar conclusion of large scale savings over the last 35 years. The figure indicates that the European Union considers “negajoules” as a viable element in the portfolio of strategies to respond to anticipated demand growth. By extrapolation, the “negajoules” shown in the graph, representing avoided consumption, are estimated to reach on the order of 13% of total consumption by 2020 if aggressive efficiency measures are implemented.
B-3
Figure B-3 Development of Primary Energy Demand and Avoided Energy Use (Negajoules) in the EU-24
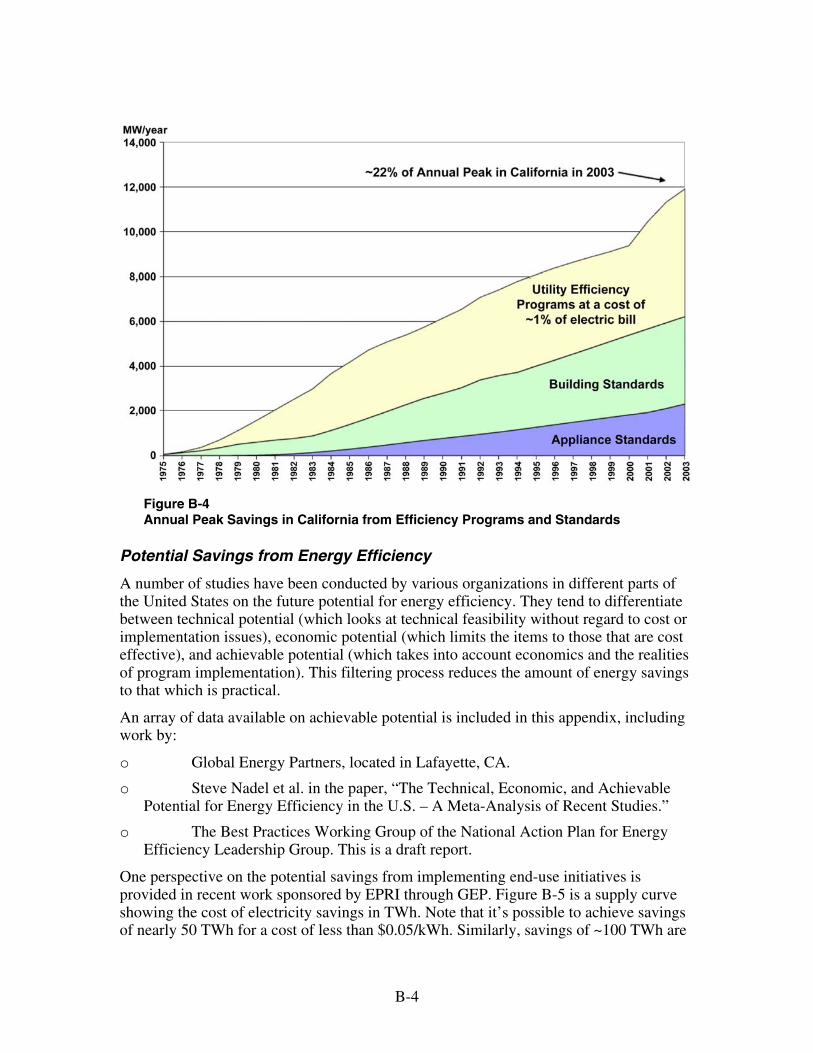
The California Energy Commission has also estimated the savings in peak demand due to the application of energy efficiency programs and standards in California between 1976 and 2003 at roughly 22% (see Figure B-4).
B-4
Figure B-4 Annual Peak Savings in California from Efficiency Programs and Standards
Potential Savings from Energy Efficiency
A number of studies have been conducted by various organizations in different parts of the United States on the future potential for energy efficiency. They tend to differentiate between technical potential (which looks at technical feasibility without regard to cost or implementation issues), economic potential (which limits the items to those that are cost effective), and achievable potential (which takes into account economics and the realities of program implementation). This filtering process reduces the amount of energy savings to that which is practical.
An array of data available on achievable potential is included in this appendix, including work by:
o Global Energy Partners, located in Lafayette, CA.
o Steve Nadel et al. in the paper, “The Technical, Economic, and Achievable Potential for Energy Efficiency in the U.S. – A Meta-Analysis of Recent Studies.”
o The Best Practices Working Group of the National Action Plan for Energy Efficiency Leadership Group. This is a draft report.
One perspective on the potential savings from implementing end-use initiatives is provided in recent work sponsored by EPRI through GEP. Figure B-5 is a supply curve showing the cost of electricity savings in TWh. Note that it’s possible to achieve savings of nearly 50 TWh for a cost of less than $0.05/kWh. Similarly, savings of ~100 TWh are
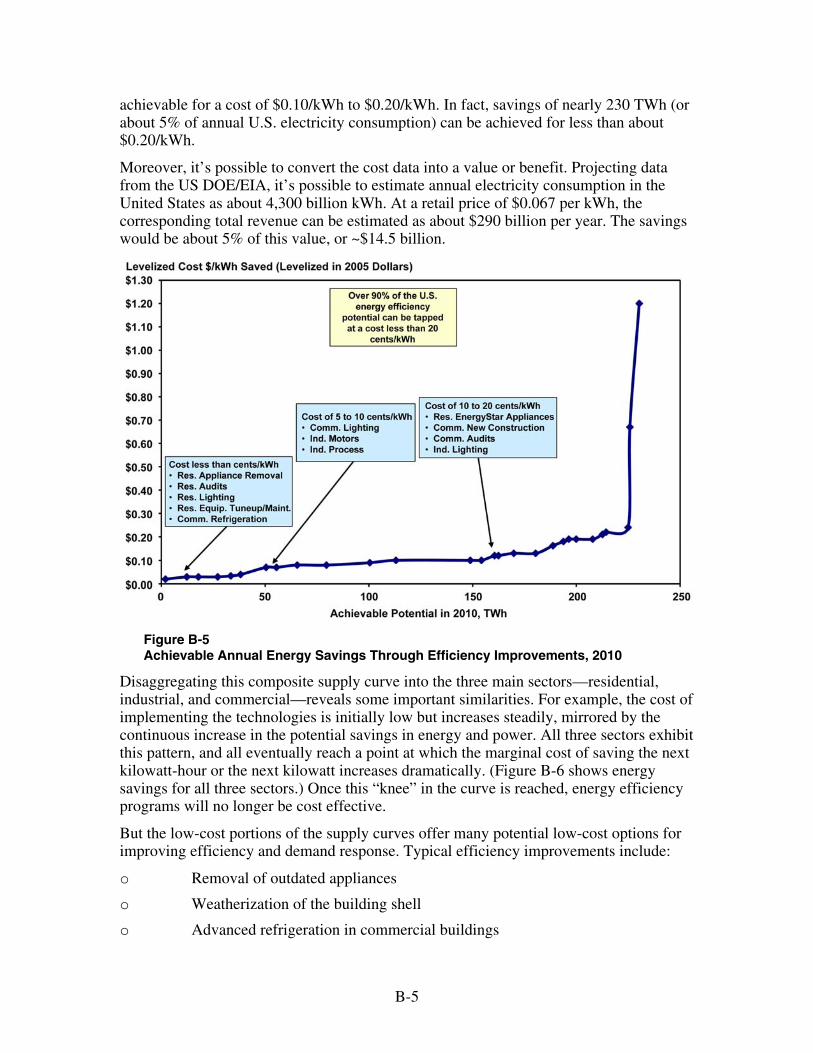
B-5
achievable for a cost of $0.10/kWh to $0.20/kWh. In fact, savings of nearly 230 TWh (or about 5% of annual U.S. electricity consumption) can be achieved for less than about $0.20/kWh.
Moreover, it’s possible to convert the cost data into a value or benefit. Projecting data from the US DOE/EIA, it’s possible to estimate annual electricity consumption in the United States as about 4,300 billion kWh. At a retail price of $0.067 per kWh, the corresponding total revenue can be estimated as about $290 billion per year. The savings would be about 5% of this value, or ~$14.5 billion.
Figure B-5 Achievable Annual Energy Savings Through Efficiency Improvements, 2010
Disaggregating this composite supply curve into the three main sectors—residential, industrial, and commercial—reveals some important similarities. For example, the cost of implementing the technologies is initially low but increases steadily, mirrored by the continuous increase in the potential savings in energy and power. All three sectors exhibit this pattern, and all eventually reach a point at which the marginal cost of saving the next kilowatt-hour or the next kilowatt increases dramatically. (Figure B-6 shows energy savings for all three sectors.) Once this “knee” in the curve is reached, energy efficiency programs will no longer be cost effective.
But the low-cost portions of the supply curves offer many potential low-cost options for improving efficiency and demand response. Typical efficiency improvements include:
o Removal of outdated appliances
o Weatherization of the building shell
o Advanced refrigeration in commercial buildings
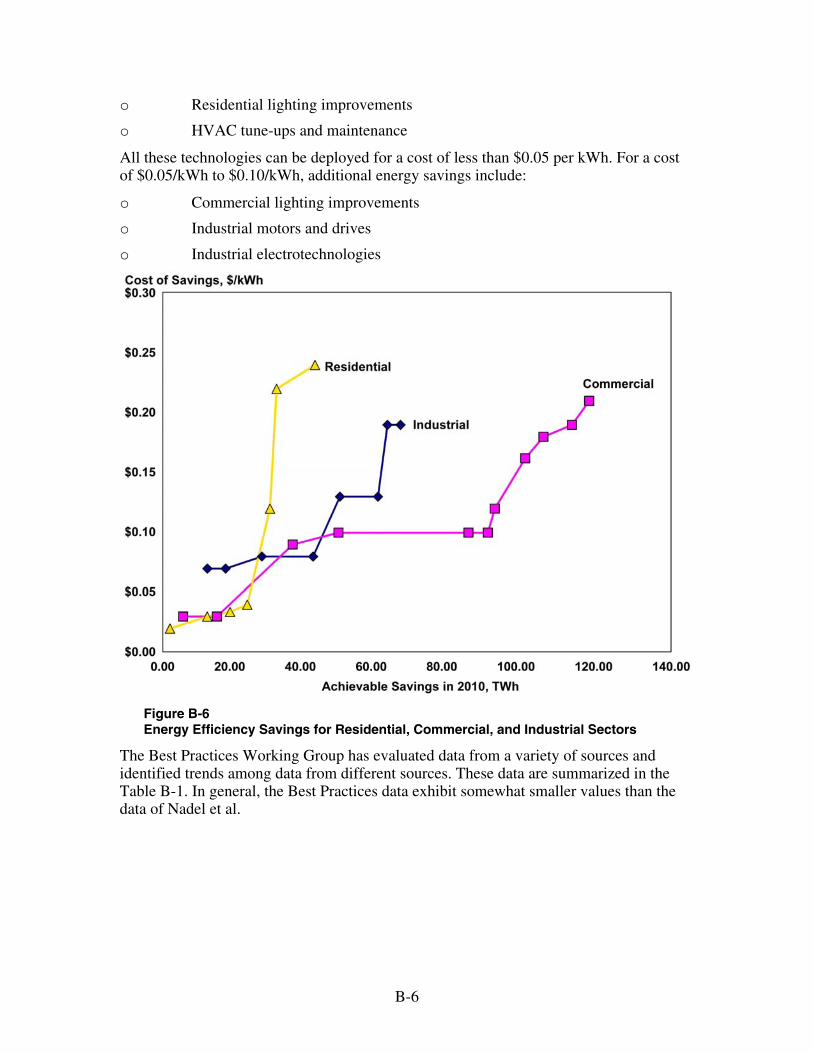
B-6
o Residential lighting improvements
o HVAC tune-ups and maintenance
All these technologies can be deployed for a cost of less than $0.05 per kWh. For a cost of $0.05/kWh to $0.10/kWh, additional energy savings include:
o Commercial lighting improvements
o Industrial motors and drives
o Industrial electrotechnologies
Figure B-6 Energy Efficiency Savings for Residential, Commercial, and Industrial Sectors
The Best Practices Working Group has evaluated data from a variety of sources and identified trends among data from different sources. These data are summarized in the Table B-1. In general, the Best Practices data exhibit somewhat smaller values than the data of Nadel et al.
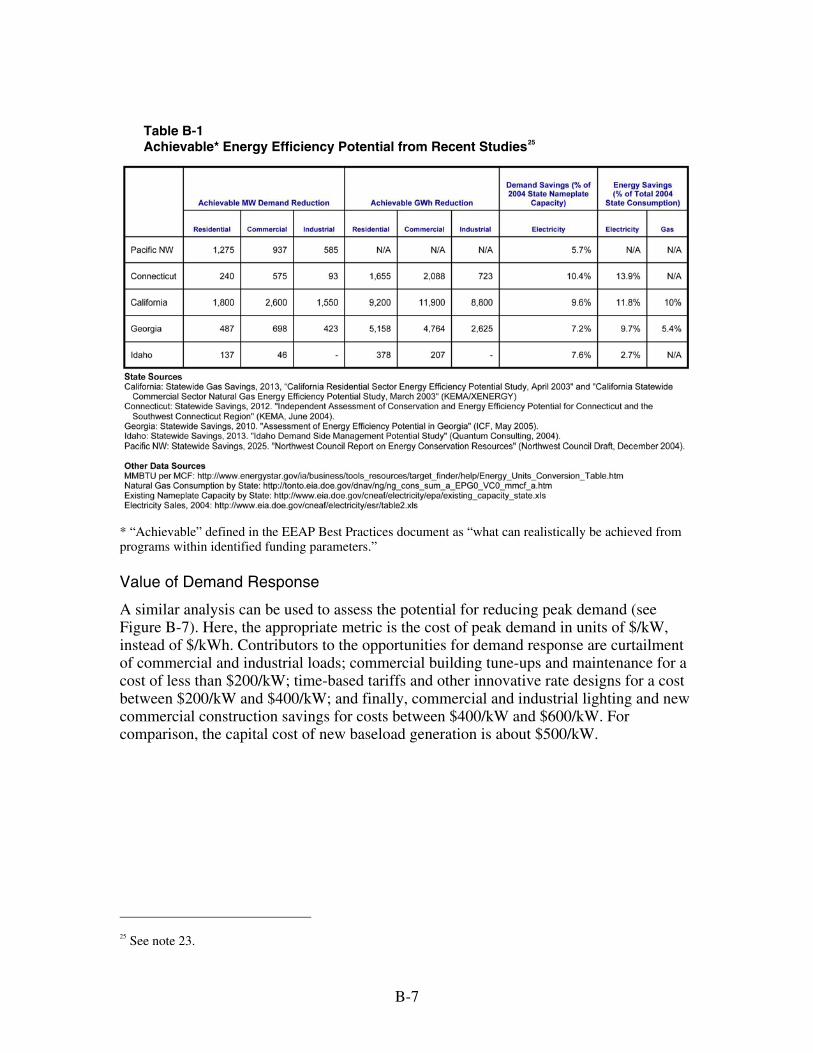
B-7
Table B-1 Achievable* Energy Efficiency Potential from Recent Studies25
* “Achievable” defined in the EEAP Best Practices document as “what can realistically be achieved from programs within identified funding parameters.”
Value of Demand Response
A similar analysis can be used to assess the potential for reducing peak demand (see Figure B-7). Here, the appropriate metric is the cost of peak demand in units of $/kW, instead of $/kWh. Contributors to the opportunities for demand response are curtailment of commercial and industrial loads; commercial building tune-ups and maintenance for a cost of less than $200/kW; time-based tariffs and other innovative rate designs for a cost between $200/kW and $400/kW; and finally, commercial and industrial lighting and new commercial construction savings for costs between $400/kW and $600/kW. For comparison, the capital cost of new baseload generation is about $500/kW.
25 See note 23.
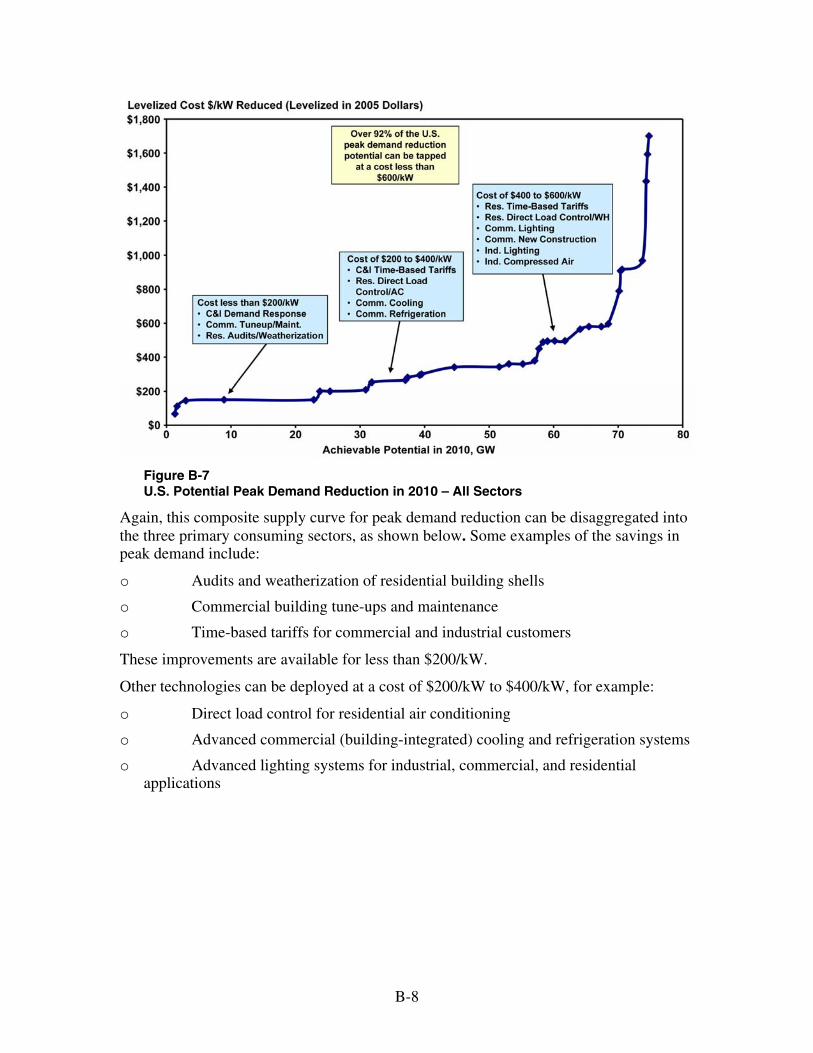
B-8
Figure B-7 U.S. Potential Peak Demand Reduction in 2010 – All Sectors
Again, this composite supply curve for peak demand reduction can be disaggregated into the three primary consuming sectors, as shown below. Some examples of the savings in peak demand include:
o Audits and weatherization of residential building shells
o Commercial building tune-ups and maintenance
o Time-based tariffs for commercial and industrial customers
These improvements are available for less than $200/kW.
Other technologies can be deployed at a cost of $200/kW to $400/kW, for example:
o Direct load control for residential air conditioning
o Advanced commercial (building-integrated) cooling and refrigeration systems
o Advanced lighting systems for industrial, commercial, and residential applications
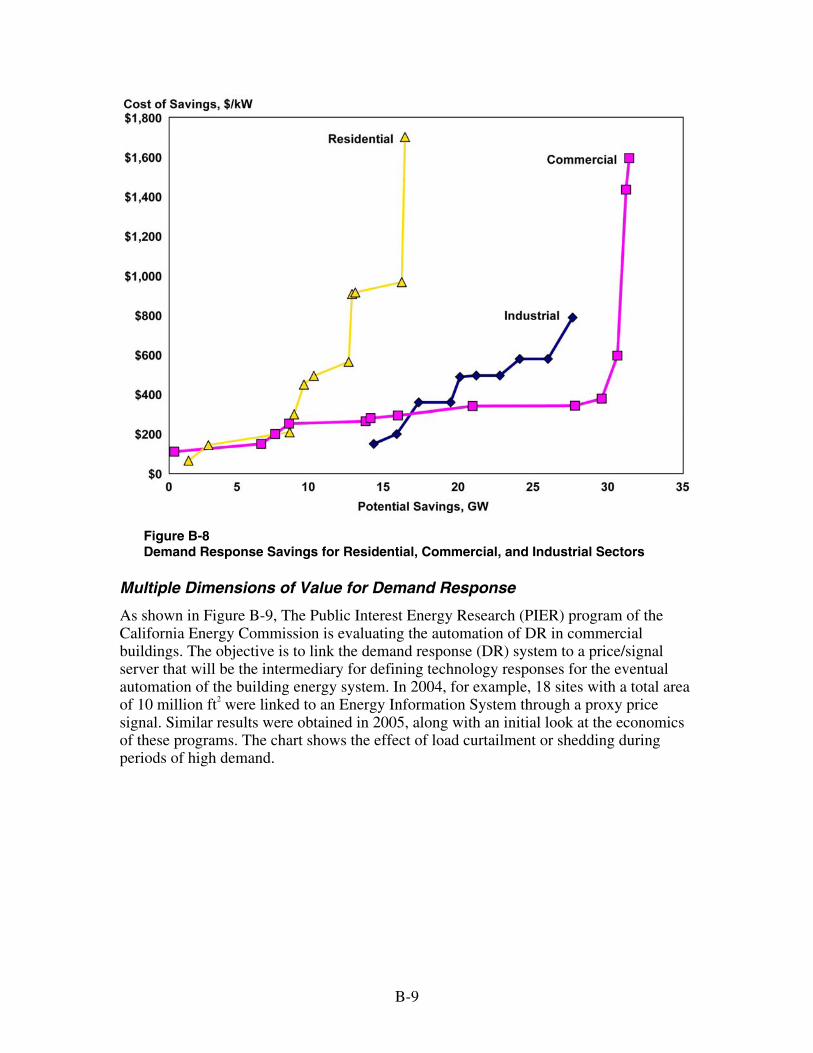
B-9
Figure B-8 Demand Response Savings for Residential, Commercial, and Industrial Sectors
Multiple Dimensions of Value for Demand Response
As shown in Figure B-9, The Public Interest Energy Research (PIER) program of the California Energy Commission is evaluating the automation of DR in commercial buildings. The objective is to link the demand response (DR) system to a price/signal server that will be the intermediary for defining technology responses for the eventual automation of the building energy system. In 2004, for example, 18 sites with a total area of 10 million ft2 were linked to an Energy Information System through a proxy price signal. Similar results were obtained in 2005, along with an initial look at the economics of these programs. The chart shows the effect of load curtailment or shedding during periods of high demand.
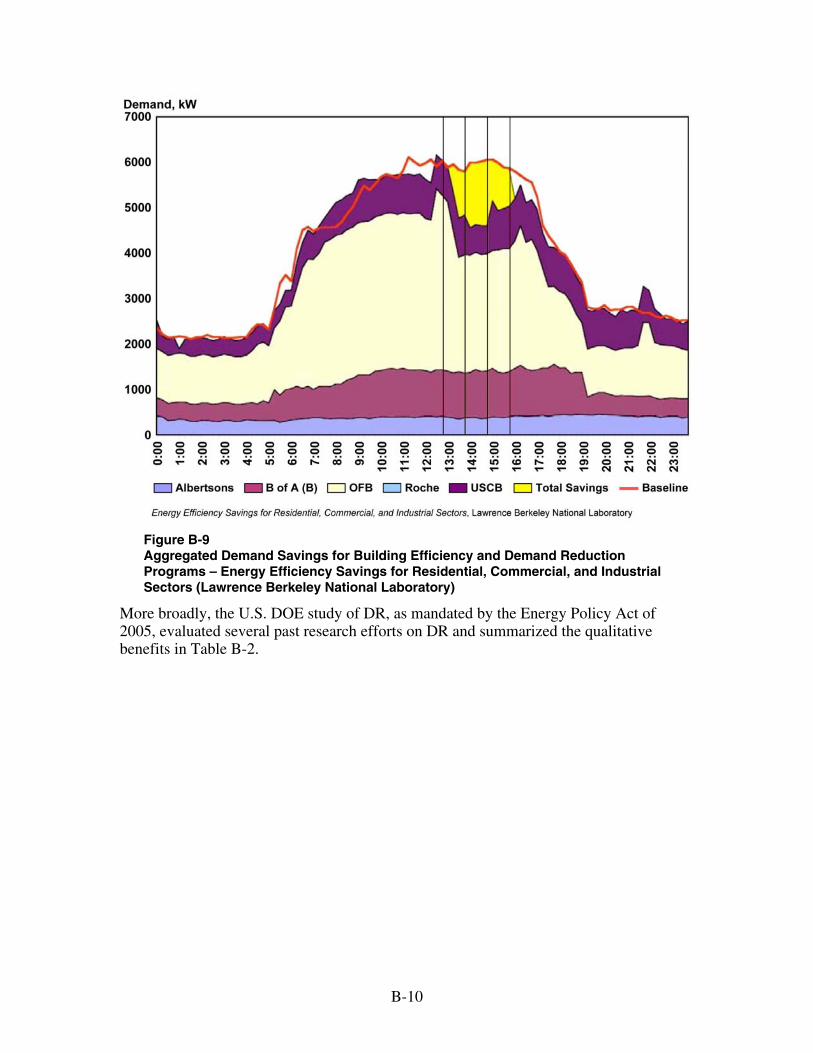
B-10
Figure B-9 Aggregated Demand Savings for Building Efficiency and Demand Reduction Programs – Energy Efficiency Savings for Residential, Commercial, and Industrial Sectors (Lawrence Berkeley National Laboratory)
More broadly, the U.S. DOE study of DR, as mandated by the Energy Policy Act of 2005, evaluated several past research efforts on DR and summarized the qualitative benefits in Table B-2.

B-11
Table B-2 Benefits of Demand Response

C-1
C SUPPLY-SIDE ENERGY EFFICIENCY IMPROVEMENT
Efficiency improvements can be gained throughout the entire energy chain—from fuel to electricity generation/delivery to end use. The focus of this paper remains on end-use efficiency improvement; however, this is just one element of the overall energy efficiency portfolio of the future. This section highlights some of efficiency gains to be realized on the supply side.
Generation
Supply-side opportunities are broadly classified as either improving the efficiency of existing plants or adding new high-efficiency plants to replace old plants and add new capacity to handle load growth. An example of the former is the improvement of the heat rate of fossil generation plants. (Heat rate is the amount of primary energy—coal, for example—needed to produce a kilowatt hour of electricity). Work by EPRI has shown that aggregate cost-effective reductions in heat rate of about 3% can be achieved by measures such as optimizing the thermal performance of the boiler, reducing the fouling of boiler tubes, reducing turbine blade corrosion, and adding performance monitoring and control software to keep the plants running under optimal conditions.
Natural gas generation has probably had the largest impact on supply-side efficiency during the last 10 years. In combined-cycle operation (using both a gas turbine and a heat recovery steam generator/steam turbine), heat rates are typically in the range of 7,500 Btu/kWh, as compared with nearly 9,000 Btu/kWh for supercritical coal-fired boilers. Unfortunately, the high efficiency of natural gas plants is partially offset by the high price and price volatility of gas. Even though gas is more efficient, coal generation prices are so much less that gas plants will be very low in the dispatch order. Efforts to reduce the cost and price of natural gas, perhaps by expanding the use of liquefied natural gas (LNG), will be needed to realize the high efficiency potential of gas generation.
In the case of renewables, as for nuclear generation, emissions are essentially zero and efficiency is most closely related to reducing the cost of generation, along with economic growth and the other factors mentioned above. In many cases, “footprint” issues have an efficiency impact for renewables. For example, if technology breakthroughs can increase the efficiency of solar photovoltaic (PV) generation to above 25%, it’s possible to reduce the size and visual impact of a PV array. Similar arguments can be made regarding wind and some kinds of biomass generation. These “low density” renewables are sometimes quite inefficient in their utilization of the land resource.
The next generation of fossil fuel electricity production (with plans for commercial availability by about 2020) will include carbon capture and storage technology. The additional energy burden of removing CO2 from the flue gas and storing it will
C-2
substantially reduce the energy conversion efficiency. For example, integrated-gasification–combined–cycle (IGCC) units are projected to have an efficiency of approximately 42% if CO2 is not captured, but only 37% if it is. Similar data are anticipated for other advanced coal-based generation options. These twin goals of increasing efficiency while minimizing CO2 emissions rank high among the technology challenges that the industry must resolve in the power system of the next few decades.
Transmission and Distribution
Transmission and distribution (T&D) systems in developed countries experience efficiency losses in two respects: dissipated power in conductors and reactive power consumed by magnetic fields resident in several devices within the systems. Losses due to dissipated power (so-called I2R losses) are on the order of 7%. Reactive power represents on the order of 35% of this dissipated power but varies depending on the specific combination of the voltage, current, and the degree of resistance, inductance, and capacitance present in a particular electrical load.
Driven by reliability and asset management criteria, several researchers, suppliers, and utilities around the world are exploring more advanced T&D cables composed of better conductors and advanced insulators. Some of these combinations will help reduce dissipative losses, but this will probably not be a significant effect relative to improved efficiencies achievable in electricity generation.
Two other significant issues affecting overall T&D system efficiency in the future are the level of distributed energy resources (DER) and the intermittency of renewable resources. Due to the variety of technologies and scales of generation, DER poses both opportunities and challenges to the T&D system. Local generation on a sufficient scale could reduce the burden of growth on distribution or even transmission networks while allowing customization of generation to different types of loads. Current research is looking at strategies and technical issues associated with treating aggregations of mixed types of DER as a “virtual” resource that provides stable, high availability output. The intermittency of renewable resources presents an interconnection challenge in that the T&D system is designed for sources with stable output.


The Electric Power Research Institute (EPRI)
The Electric Power Research Institute (EPRI), with major locations in Palo Alto, California, and Charlotte, North Carolina, was established in 1973 as an independent, nonprofit center for public interest energy and environmental research. EPRI brings together members, participants, the Institute’s scientists and engineers, and other leading experts to work collaboratively on solutions to the challenges of electric power. These solutions span nearly every area of electricity generation, delivery, and use, including health, safety, and environment. EPRI’s members represent over 90% of the electricity generated in the United States. International participation represents nearly 15% of EPRI’s total research, development, and demonstration program.
Together…Shaping the Future of Electricity
© 2006 Electric Power Research Institute (EPRI), Inc. All rights reserved. Electric Power Research Institute and EPRI are registered service marks of the Electric Power Research Institute, Inc.
Printed on recycled paper in the United States of America