Embed Size (px)
Citation preview
Advances of research on high-speed railway catenary
Zhigang Liu1 • Yang Song1 • Ye Han1 • Hongrui Wang1 • Jing Zhang1 •
Zhiwei Han1
Received: 14 February 2017 / Revised: 24 October 2017 / Accepted: 26 October 2017 / Published online: 10 November 2017
� The Author(s) 2017. This article is an open access publication
Abstract The interaction between the catenary and pan-
tograph is one of the most crucial factors that determine the
train operation in high-speed railway. The bad state of
catenary is able to directly influence the power supply
safety of traction power system. In this paper, four aspects
on the catenary research of high-speed railway are
reviewed in detail, namely the solution methods for cate-
nary equilibrium state, the dynamic modeling methods of
catenary, non-contact detection methods of catenary, and
the static and dynamic evaluation methods of catenary. In
addition, their recent advances are described. For the low
solution accuracy of the initial equilibrium state of cate-
nary, the structure finding method with multi-objective
constraint and nonlinear finite element procedure are
introduced to solve the problem. For the catenary’s
dynamic modeling, considering the influence of environ-
mental wind on the catenary, environmental wind simula-
tions and wind tunnel tests are used to obtain the
aerodynamic coefficients and build the wind field along the
catenary for analysis of its wind vibration characteristics.
In order to improve the detection accuracy of non-contact
detection for the catenary, the deep learning theory and
real-time detection algorithms should be adopted in the
future. In view of the lack of dynamic assessment method
for the catenary, the modern spectrum evaluation, time–
frequency analysis, big data technology and their combi-
nations will be the important means for future catenary
evaluation.
Keywords High-speed railway � Modeling of catenary �Simulation of catenary � Detection of catenary � Evaluationof catenary
1 Introduction
The current collection quality of pantograph–catenary
directly determines the stable and safe operation of high-
speed trains, which is one of the key factors restricting the
highest driving speed of trains [1]. Due to the huge cost and
difficulties of the field experiment in a real railway line,
mathematical modeling has been a prevalent tool to study
the dynamic performance of the pantograph–catenary sys-
tem. Nowadays, the studies of modeling and simulation for
railway catenary mainly focused on two points. The first
one is the static solution for the initial equilibrium state,
which is to calculate the static configuration of the catenary
to make it meet the design requirements (such as the ten-
sion, arrangement of droppers and pre-sag). The other one
is the dynamic solution for the pantograph–catenary
interaction, including the dynamic modeling method,
solution algorithm as well as some simulations for external
& Zhigang Liu
Yang Song
Ye Han
Hongrui Wang
Jing Zhang
Zhiwei Han
1 School of Electrical Engineering, Southwest Jiaotong
University, No. 111, North 1st Section of Second Ring Road,
Chengdu 610031, Sichuan, China
123
J. Mod. Transport. (2018) 26(1):1–23
https://doi.org/10.1007/s40534-017-0148-4
disturbances, such as wind, iced line and irregularities of
contact wire.
In 2012, the Ministry of Railways of China proposed
‘High-speed Railway Power Supply Security Detection and
Monitoring System,’ namely ‘6C’ system. The core idea is
to use the captured pictures and video to realize the non-
contact detection. However, the level of automatic image
recognition needs to be improved. High-speed railway
pantograph–catenary system is a random vibration system,
and its dynamic characteristic evaluation is difficult. At
present, the dynamic characteristic evaluation of pan-
tograph–catenary system is mainly based on statistical
parameters, such as the stationary mean value and variance
in the European standard [2]. These evaluation indexes
assume that the data of pantograph–catenary system is
generalized stationary, which cannot satisfy the require-
ment for dynamic analysis of high-speed pantograph–
catenary system; besides, it is difficult to evaluate the
pantograph–catenary system performance efficiently using
a single statistic.
The overview in this paper mainly focuses on four
aspects of the current research, which are the simulation,
modeling, detection and evaluation of catenary. Firstly, the
existing solution methods for the initial equilibrium state
are summarized. The common solution methods for linear
and nonlinear dynamics of catenary are classified and
discussed. And, previous studies on the effect of environ-
mental wind on catenary are reviewed. Then, non-contact
detection techniques for catenary, especially various
detection methods and strategies, are summarized. The
state evaluation of catenary is reviewed, which mainly
focuses on evaluation methods on the static and dynamic
state of catenary and their validity. At last, addressing the
current shortfalls, some suggestions are proposed for future
research.
2 Solution for catenary equilibrium state
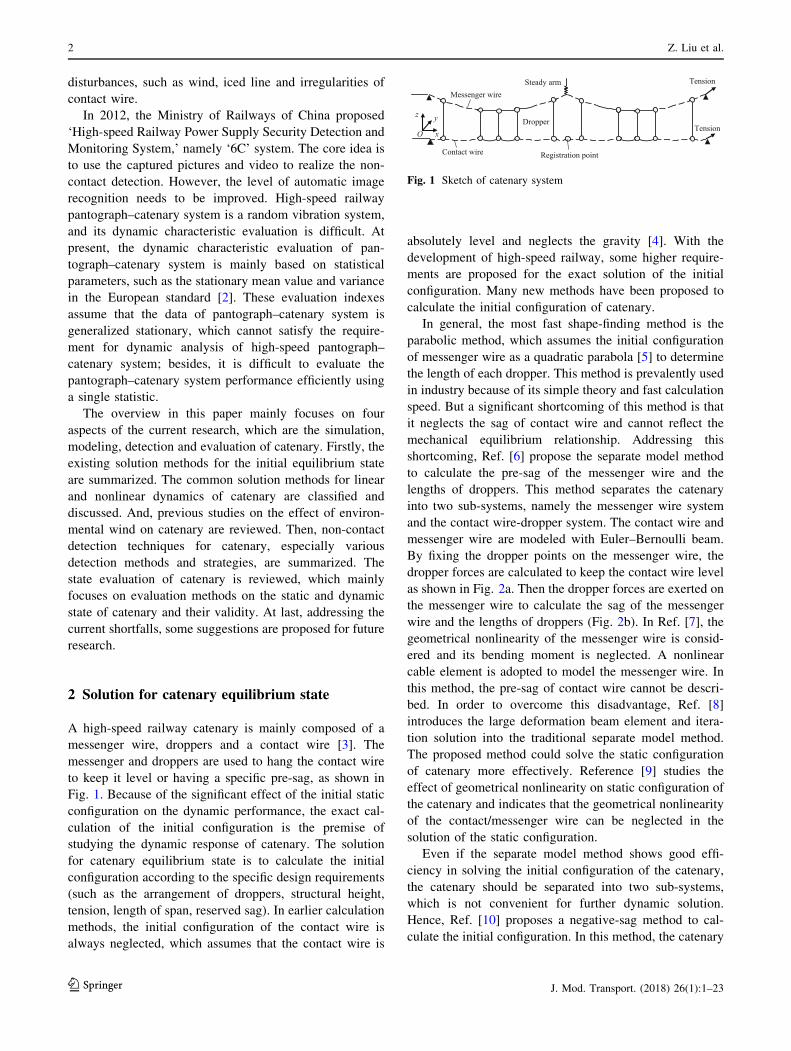
A high-speed railway catenary is mainly composed of a
messenger wire, droppers and a contact wire [3]. The
messenger and droppers are used to hang the contact wire
to keep it level or having a specific pre-sag, as shown in
Fig. 1. Because of the significant effect of the initial static
configuration on the dynamic performance, the exact cal-
culation of the initial configuration is the premise of
studying the dynamic response of catenary. The solution
for catenary equilibrium state is to calculate the initial
configuration according to the specific design requirements
(such as the arrangement of droppers, structural height,
tension, length of span, reserved sag). In earlier calculation
methods, the initial configuration of the contact wire is
always neglected, which assumes that the contact wire is
absolutely level and neglects the gravity [4]. With the
development of high-speed railway, some higher require-
ments are proposed for the exact solution of the initial
configuration. Many new methods have been proposed to
calculate the initial configuration of catenary.
In general, the most fast shape-finding method is the
parabolic method, which assumes the initial configuration
of messenger wire as a quadratic parabola [5] to determine
the length of each dropper. This method is prevalently used
in industry because of its simple theory and fast calculation
speed. But a significant shortcoming of this method is that
it neglects the sag of contact wire and cannot reflect the
mechanical equilibrium relationship. Addressing this
shortcoming, Ref. [6] propose the separate model method
to calculate the pre-sag of the messenger wire and the
lengths of droppers. This method separates the catenary
into two sub-systems, namely the messenger wire system
and the contact wire-dropper system. The contact wire and
messenger wire are modeled with Euler–Bernoulli beam.
By fixing the dropper points on the messenger wire, the
dropper forces are calculated to keep the contact wire level
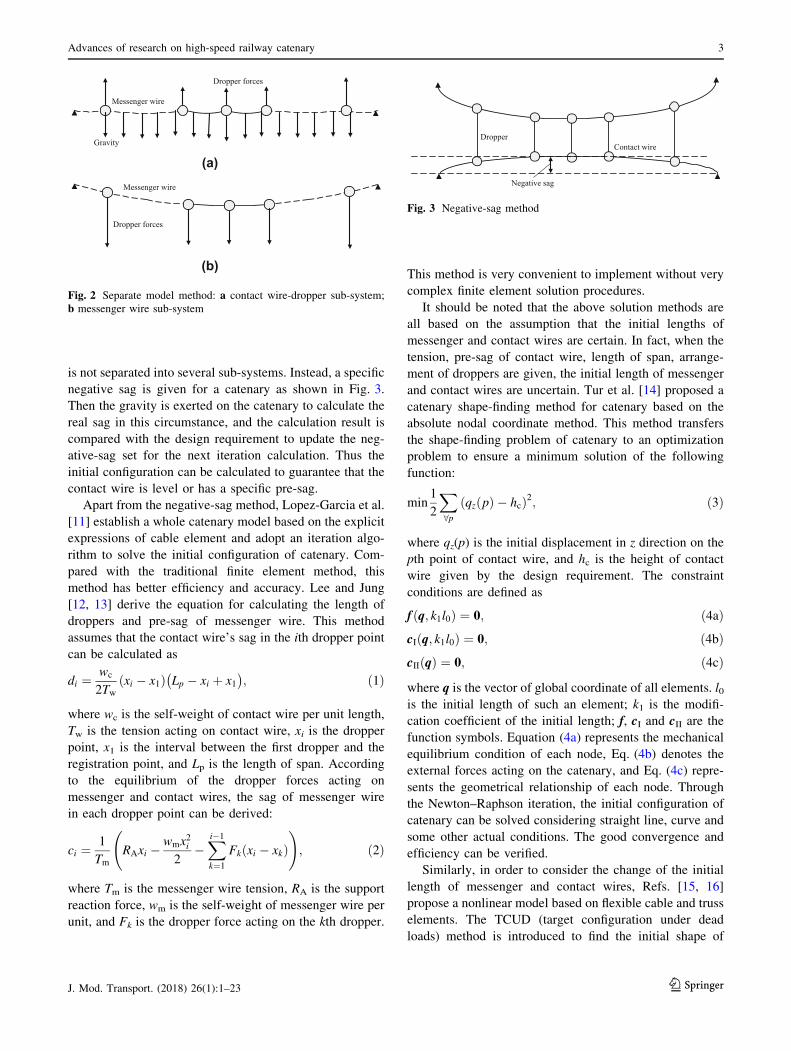
as shown in Fig. 2a. Then the dropper forces are exerted on
the messenger wire to calculate the sag of the messenger
wire and the lengths of droppers (Fig. 2b). In Ref. [7], the
geometrical nonlinearity of the messenger wire is consid-
ered and its bending moment is neglected. A nonlinear
cable element is adopted to model the messenger wire. In
this method, the pre-sag of contact wire cannot be descri-
bed. In order to overcome this disadvantage, Ref. [8]
introduces the large deformation beam element and itera-
tion solution into the traditional separate model method.
The proposed method could solve the static configuration
of catenary more effectively. Reference [9] studies the
effect of geometrical nonlinearity on static configuration of
the catenary and indicates that the geometrical nonlinearity
of the contact/messenger wire can be neglected in the
solution of the static configuration.
Even if the separate model method shows good effi-
ciency in solving the initial configuration of the catenary,
the catenary should be separated into two sub-systems,
which is not convenient for further dynamic solution.
Hence, Ref. [10] proposes a negative-sag method to cal-
culate the initial configuration. In this method, the catenary
Contact wire
Dropper
Steady arm
Registration point
Messenger wire
x
yz
Tension
OTension
Fig. 1 Sketch of catenary system
2 Z. Liu et al.
123 J. Mod. Transport. (2018) 26(1):1–23
is not separated into several sub-systems. Instead, a specific
negative sag is given for a catenary as shown in Fig. 3.
Then the gravity is exerted on the catenary to calculate the
real sag in this circumstance, and the calculation result is
compared with the design requirement to update the neg-
ative-sag set for the next iteration calculation. Thus the
initial configuration can be calculated to guarantee that the
contact wire is level or has a specific pre-sag.
Apart from the negative-sag method, Lopez-Garcia et al.
[11] establish a whole catenary model based on the explicit
expressions of cable element and adopt an iteration algo-
rithm to solve the initial configuration of catenary. Com-
pared with the traditional finite element method, this
method has better efficiency and accuracy. Lee and Jung
[12, 13] derive the equation for calculating the length of
droppers and pre-sag of messenger wire. This method
assumes that the contact wire’s sag in the ith dropper point
can be calculated as
di ¼wc
2Twxi � x1ð Þ Lp � xi þ x1
� �; ð1Þ
where wc is the self-weight of contact wire per unit length,
Tw is the tension acting on contact wire, xi is the dropper
point, x1 is the interval between the first dropper and the
registration point, and Lp is the length of span. According
to the equilibrium of the dropper forces acting on
messenger and contact wires, the sag of messenger wire
in each dropper point can be derived:
ci ¼1
TmRAxi �
wmx2i
2�Xi�1
k¼1
Fk xi � xkð Þ !
; ð2Þ
where Tm is the messenger wire tension, RA is the support
reaction force, wm is the self-weight of messenger wire per
unit, and Fk is the dropper force acting on the kth dropper.
This method is very convenient to implement without very
complex finite element solution procedures.
It should be noted that the above solution methods are
all based on the assumption that the initial lengths of
messenger and contact wires are certain. In fact, when the
tension, pre-sag of contact wire, length of span, arrange-
ment of droppers are given, the initial length of messenger
and contact wires are uncertain. Tur et al. [14] proposed a
catenary shape-finding method for catenary based on the
absolute nodal coordinate method. This method transfers
the shape-finding problem of catenary to an optimization
problem to ensure a minimum solution of the following
function:
min1
2
X
8pqz pð Þ � hcð Þ2; ð3Þ
where qz(p) is the initial displacement in z direction on the
pth point of contact wire, and hc is the height of contact
wire given by the design requirement. The constraint
conditions are defined as
f q; k1l0ð Þ ¼ 0; ð4aÞcI q; k1l0ð Þ ¼ 0; ð4bÞcII qð Þ ¼ 0; ð4cÞ
where q is the vector of global coordinate of all elements. l0is the initial length of such an element; k1 is the modifi-
cation coefficient of the initial length; f, cI and cII are the
function symbols. Equation (4a) represents the mechanical
equilibrium condition of each node, Eq. (4b) denotes the
external forces acting on the catenary, and Eq. (4c) repre-
sents the geometrical relationship of each node. Through
the Newton–Raphson iteration, the initial configuration of
catenary can be solved considering straight line, curve and
some other actual conditions. The good convergence and
efficiency can be verified.
Similarly, in order to consider the change of the initial
length of messenger and contact wires, Refs. [15, 16]
propose a nonlinear model based on flexible cable and truss
elements. The TCUD (target configuration under dead
loads) method is introduced to find the initial shape of
(a)
(b)
Dropper forces
Messenger wire
Dropper forces
Messenger wire
Gravity
Fig. 2 Separate model method: a contact wire-dropper sub-system;
b messenger wire sub-system
Contact wireDropper
Negative sag
Fig. 3 Negative-sag method
Advances of research on high-speed railway catenary 3
123J. Mod. Transport. (2018) 26(1):1–23
catenary. The differentiation for each cable or truss ele-
ment is conducted to generate the stiffness matrix related to
the incremental and initial length of each element. By
assembling the global stiffness matrix KC and KG (the
former is related to incremental coordinate, and the latter is
related to the initial length of each element), the following
equation of motion can be obtained:
dFC ¼ KCdX þ KGdL0; ð5Þ
where dX and dL0 are the vectors for incremental coordi-
nate and incremental initial length, respectively; and dFC is
the unbalanced force vector. According to the design
requirement, the constraint conditions are exerted on
Eq. (5) to reduce the number of unknowns and keep the
number of unknowns equal to the number of equations. At
last the Newton–Raphson iteration is utilized to calculate
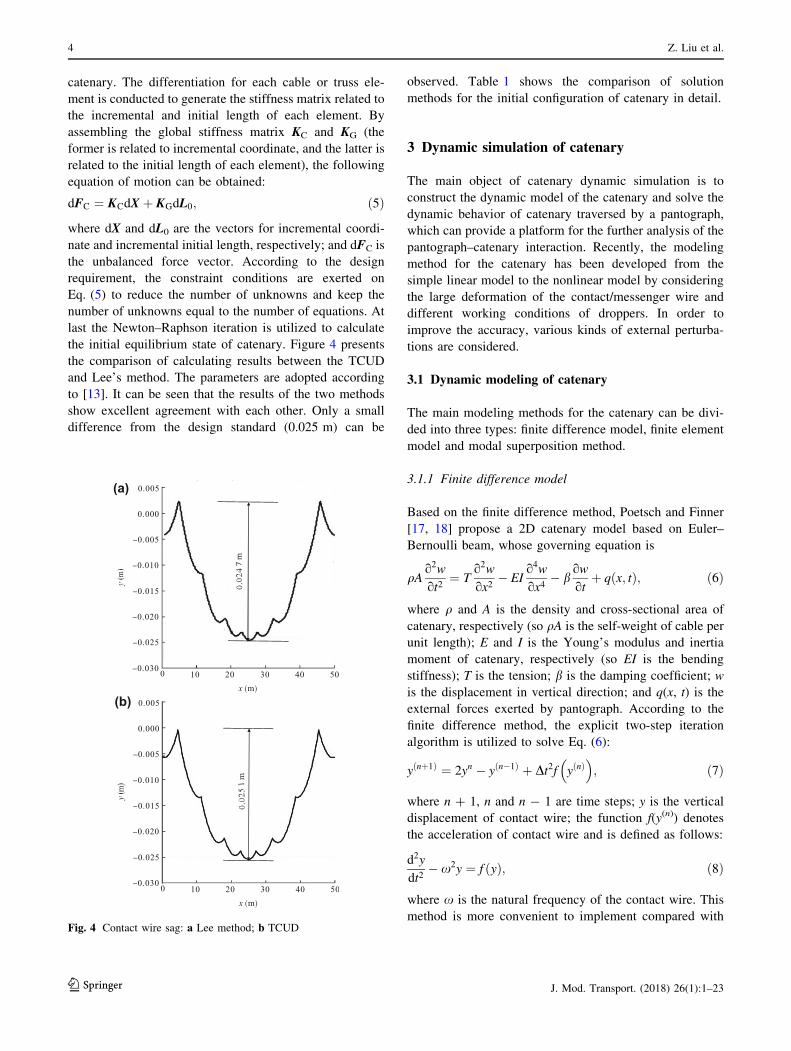
the initial equilibrium state of catenary. Figure 4 presents
the comparison of calculating results between the TCUD
and Lee’s method. The parameters are adopted according
to [13]. It can be seen that the results of the two methods
show excellent agreement with each other. Only a small
difference from the design standard (0.025 m) can be
observed. Table 1 shows the comparison of solution
methods for the initial configuration of catenary in detail.
3 Dynamic simulation of catenary
The main object of catenary dynamic simulation is to
construct the dynamic model of the catenary and solve the
dynamic behavior of catenary traversed by a pantograph,
which can provide a platform for the further analysis of the
pantograph–catenary interaction. Recently, the modeling
method for the catenary has been developed from the
simple linear model to the nonlinear model by considering
the large deformation of the contact/messenger wire and
different working conditions of droppers. In order to
improve the accuracy, various kinds of external perturba-
tions are considered.
3.1 Dynamic modeling of catenary
The main modeling methods for the catenary can be divi-
ded into three types: finite difference model, finite element
model and modal superposition method.
3.1.1 Finite difference model
Based on the finite difference method, Poetsch and Finner
[17, 18] propose a 2D catenary model based on Euler–
Bernoulli beam, whose governing equation is
qAo2w
ot2¼ T
o2w
ox2� EI
o4w
ox4� b
ow
otþ q x; tð Þ; ð6Þ
where q and A is the density and cross-sectional area of
catenary, respectively (so qA is the self-weight of cable per
unit length); E and I is the Young’s modulus and inertia
moment of catenary, respectively (so EI is the bending
stiffness); T is the tension; b is the damping coefficient; w
is the displacement in vertical direction; and q(x, t) is the
external forces exerted by pantograph. According to the
finite difference method, the explicit two-step iteration
algorithm is utilized to solve Eq. (6):
y nþ1ð Þ ¼ 2yn � y n�1ð Þ þ Dt2f y nð Þ� �
; ð7Þ
where n ? 1, n and n - 1 are time steps; y is the vertical
displacement of contact wire; the function f(y(n)) denotes
the acceleration of contact wire and is defined as follows:
d2y
dt2� x2y ¼ f yð Þ; ð8Þ
where x is the natural frequency of the contact wire. This
method is more convenient to implement compared with
(a)
(b)
Fig. 4 Contact wire sag: a Lee method; b TCUD
4 Z. Liu et al.
123 J. Mod. Transport. (2018) 26(1):1–23
the traditional finite element method (FEM), and the
solution speed is quite fast.
3.1.2 Finite element model
Finite element method is the most prevalent method to
model the catenary. Mostly, Euler–Bernoulli beam is used
to model the contact and messenger wires. According to
the geometrical structure of catenary, the global stiffness
matrix Kg ¼P
FEM Ke, which is generated by FEM, where
Ke is the element stiffness matrix. A three-dimensional
beam element stiffness matrix can be calculated as the
summation of Kð1Þe and Kð2Þ
e : Kð1Þe is the linear stiffness
matrix as shown in Eq. (9), and Kð2Þe is the initial stress
stiffness matrix as shown in Eq. (10), which is used to
model the deformation of beam element.
Kð1Þe ¼
EA
l
012EI
l3
0 012EI
l3Symmetric
0 0 � 6EI
l24EI
l3
06EI
l20 0
4EI
l3
�EA
l0 0 0 0
EA
l
0 � 12EI
l30 0 � 6EI
l20
12EI
l3
0 012EI
l36EI
l20 0 0
12EI
l3
0 0 � 6EI
l22EI
l0 0 0
1
10
4EI
l3
06EI
l20 0
2EI
l0 � 6EI
l20 0
4EI
l3
2
6666666666666666666666666666664
3
7777777777777777777777777777775
;
ð9Þ
Kð2Þe ¼ T
0
06
5l
0 06
5lSymmetric
0 0 � 1
10
4l
30
01
100 0
4l
300 0 0 0 0 0
0 � 6
5l0 0
1
100
6
5l
0 0 � 6
5l
1
100 0 0
6
5l
0 0 � 1
10� l
300 0 0
1
10
4l
30
01
100 0 � l
300 � 1
100 0
4l
30
2
666666666666666666666666664
3
777777777777777777777777775
:
ð10Þ
The structural equation of motion can be written as
MgD€uþ CgD _uþ KgDu ¼ DFg; ð11Þ
where Mg and Cg are the global mass and damping
matrices, respectively; Du, D _u and D€u are the vectors of
displacement, velocity and acceleration, respectively, and
DFg is the external force increment matrix.
Generally, the displacement of the contact wire is very
small, so the geometrical nonlinearity can be neglected.
The dropper is assumed as a nonlinear spring. In numerical
examples, the stiffness of dropper is updated in each time
step by comparing the initial length with the strained
length. So the global stiffness is updated in each time step
in Eq. (11). Ambrosio and Pombo [19–27] establish the
catenary model by this method and study the pantograph–
catenary interaction in combination with a pantograph.
Simultaneously, Cho et al. [28, 29] establish the catenary
model through this method and study the effect of the
contact wire sag and nonlinear droppers on the pan-
tograph–catenary behavior by introducing a pantograph
model. Stichel et al. [30, 31] construct the catenary model
and analyze its interaction with multiple pantographs.
Table 1 Comparison of initial configuration solutions of catenary
Solution method Separate
system
Nonlinearity of
wire
Types of cable/beam Contact wire
sag
Initial length of
cable
Parabola Y N N N N
Traditional separate model Y N Euler–Bernoulli beam N N
Developed separate model Y Y Nonlinear cable or beam N N
Developed iteration separate
model
Y Y Nonlinear beam Y N
Negative sag N Y Nonlinear cable or beam Y N
Force equilibrium N Y Absolute nodal coordinate formulation
(ANCF) beam
Y N
Explicit cable formulas N Y Nonlinear cable Y N
Objective function N Y ANCF beam Y Y
TCUD N Y Flexible cable Y Y
Advances of research on high-speed railway catenary 5
123J. Mod. Transport. (2018) 26(1):1–23
Bruni et al. [32, 33] construct the hardware-in-the-loop
hybrid pantograph platform, in which the catenary is
modeled by this method. Massat [34–36] build up the
pantograph–catenary model considering the contact wire
irregularities and aerodynamic disturbance to pantograph.
When the catenary deforms largely, especially in a high-
speed condition or a strong wind field, the geometrical
nonlinearity should be considered. In order to ensure the
calculation accuracy, the large deformation stiffness matrix
should be included. According to the principle of virtual
displacement, the equilibrium equation of beam can be
written as follows:
Kð1Þe þ Kð2Þ
e þ Kð3Þe
� �DDef g ¼ Fe � Qe; ð12Þ
where DDe is the incremental displacement vector; Fe is
the equivalent load vector; Qe is the unbalanced force
vector; and Kð3Þe is the large deformation stiffness matrix,
whose formula is very complex. Generally, the Newmark
iteration algorithm is used to solve the equation of motion,
Eq. (11), and the Newton–Raphson’s method is used to
solve Eq. (12).
Carnicero and Lopez-Garcia [37] adopt the nonlinear
finite element procedure to establish the catenary model.
Then the pantograph–catenary interaction is analyzed with
different catenary models [38]. In combination with a
vehicle-track model, the effect of random track irregulari-
ties on the pantograph–catenary contact force is studied
[39]. In order to improve the solution efficiency, Carnicero
et al. [40] also propose a moving mesh method for pan-
tograph–catenary model. Compared with the traditional
method, the computational cost is significantly decreased.
Simultaneously, Mitsuru Ikeda et al. [41–43] propose the
detection and control strategy based on a nonlinear finite
element catenary. Alberto and Bene [44, 45] neglect the
bending stiffness of the messenger/contact wire and
develop the 2D and 3D simulation platforms for the pan-
tograph–catenary system.
In order to consider the large deformation further, Park
and Kim [12, 13, 46, 47] utilize absolute nodal coordinate
formulation (ANCF) beam to model the large deformation
of contact/messenger wire. ANCF is firstly proposed by
Shabana [48], which can effectively deal with the large
deformation of the beam, shell and cable elements. Garcıa-
Vallejo et al. [49] write the formula between the stiffness
matrix and the nodal displacements, which is convenient
for different engineering applications, as follows:
KeðeÞ ¼X3
a¼1
vþ 2d2
Z
Ve
ST1S1eeTST1S1 � ST1S1
� �dVe
þX3
a¼1
X3
b¼1
b 6¼a
v2
Z
Ve
ST1S1eeTST2S2 � ST1S1
� �dVe
þX3
a¼1
X3
b¼1
b 6¼a
dZ
Ve
ST1S1eeTST2S2 � ST1S2
� �dVe;
ð13Þ
where v is the Lame constant, d is the shear elasticity of the
beam, Ve is the volume of the element, S1 and S2 are the shape-
function matrices, and e is the vector of coordinates of the two
nodes of beam. Each node has 12 DOFs, which can fully con-
sider various kinds of deformation. After obtaining the dis-
placement vector, the stiffness matrix can be generated through
Eq. (13), so that the large deformation can be considered.
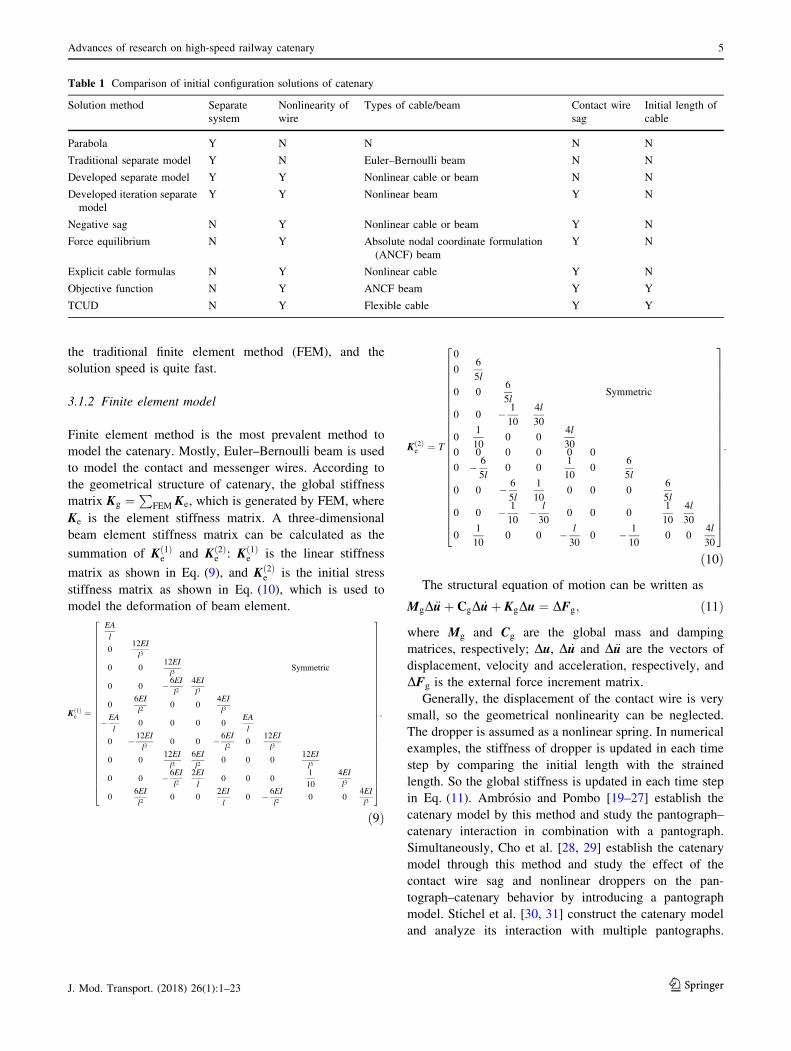
Similarly, in order to consider the large deformation of
contact wire, Refs. [15, 16] neglect the bending stiffness
and propose a catenary model based on flexible cable and
nonlinear truss elements. As shown in Fig. 5, A and B are
the two nodes of the flexible element. F1–F6 are the nodal
forces, L0 is the initial length; lx, ly and lz are the interval
between A and B in x, y and z directions; T1 and T2 are the
tensile forces. The equilibrium equation can be expressed
as
lx ¼F1L0
EAþ F1
pln
ffiffiffiffiffiffiffiffiffiffiffiffiffiffiffiffiffiffiffiffiffiffiffiffiffiffiffiF24 þ F2
5 þ F26
qþ F6
� �
� lnffiffiffiffiffiffiffiffiffiffiffiffiffiffiffiffiffiffiffiffiffiffiffiffiffiffiffiF21 þ F2
2 þ F23
p� F3
� �o;
ly ¼F2L0
EAþ F2
pln
ffiffiffiffiffiffiffiffiffiffiffiffiffiffiffiffiffiffiffiffiffiffiffiffiffiffiffiF24 þ F2
5 þ F26
qþ F6
� �
� lnffiffiffiffiffiffiffiffiffiffiffiffiffiffiffiffiffiffiffiffiffiffiffiffiffiffiffiF21 þ F2
2 þ F23
p� F3
� �o;
lz ¼F3L0
EAþ pL202EA
þ 1
pffiffiffiffiffiffiffiffiffiffiffiffiffiffiffiffiffiffiffiffiffiffiffiffiffiffiffiF24 þ F2
5 þ F26
q�
ffiffiffiffiffiffiffiffiffiffiffiffiffiffiffiffiffiffiffiffiffiffiffiffiffiffiffiF21 þ F2
2 þ F23
ph i;
8>>>>>>>>>>>>>>>>>>><
>>>>>>>>>>>>>>>>>>>:
ð14Þ
where p is the self-weight per unit length. The stiffness
matrix can be generated through differentiation of the two
sides of Eq. (14):
dlxdlydlz
8<
:
9=
;¼
olx
oF1
olx
oF2
olx
oF3oly
oF1
oly
oF2
oly
oF3olz
oF1
olz
oF2
olz
oF3
2
666664
3
777775
dF1
dF2
dF3
8<
:
9=
;¼ Ge
CdFe; ð15Þ
whereGeC is the flexibilitymatrix, andFe is the element nodal
force vector. The stiffness matrix can be obtained by taking
inverse of it. Similar to ANCF, Eq. (15) establishes the
relationship between the stiffness matrix and the nodal
6 Z. Liu et al.
123 J. Mod. Transport. (2018) 26(1):1–23
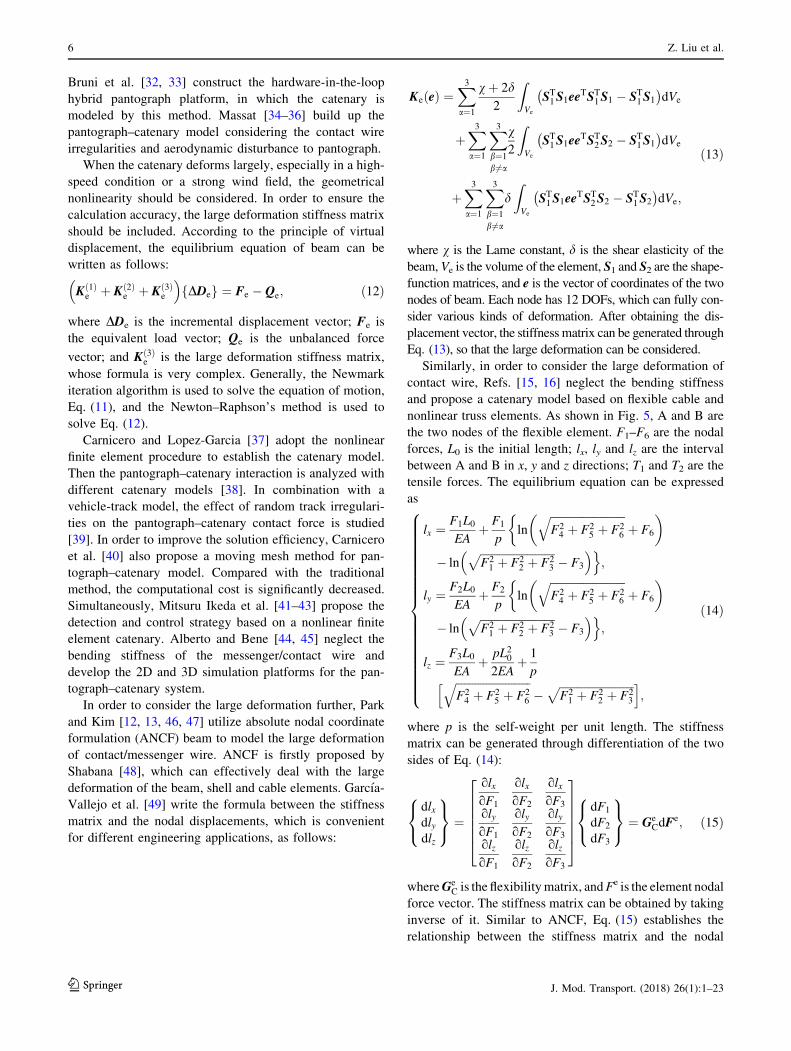
displacement. Through Newton–Raphson’s method, the
nodal forces can be calculated. Thus the stiffness matrix of
each element can be produced. Figure 6 compares the results
between this method and the FEM software. It can be seen
that only a little difference exists in the two sets of result.
3.1.3 Modal superposition method
In order to overcome the huge computation cost and the
low efficiency of the traditional finite element model,
modal superposition method is used to establish the equa-
tion of motion for catenary. Generally, a FEM model is
necessary to be established and then the modal analysis is
conducted. The displacement of catenary is described as
the summation of all modes:
z x; tð Þ ¼Xn
i¼1
/i xð Þqi tð Þ; ð16Þ
where /i xð Þ is the ith mode, qi(t) is the ith generalized
coordinate, and n is the total order of modes.
Considering the orthogonality of the main vibration
mode, the equation of motion can be obtained as
mii€qi þ 2miixiini _qi þ miix2iiqi ¼ Qi tð Þ i ¼ 1; 2; 3; . . .; nð Þ;
ð17Þ
where mii, xii, ni and Qi(t) are the ith modal mass, angular
frequency, damping ratio and generalized force, respec-
tively. Through Newmark iteration method, Eq. (17) can
be solved. Then the actual displacement of catenary can be
obtained through Eq. (16). Reference [50] indicates that
the modal order should be above 180 to guarantee a good
accuracy. Using this method, Refs. [51, 52] analyze the
catenary response and stress under the impact of pan-
tograph and develop a hardware-in-the-loop, in which the
catenary is modeled by modal superposition method
[53, 54].
Through the above discussion, it is found that the FEM
is the most prevalent method to model the catenary
dynamic behavior. One of the future developments is to
accurately describe the nonlinearity of catenary wires. The
modal superposition method and finite difference method
can be adopted when a fast solution speed is required. On
the other hand, considering more realistic conditions is
another research interest for many scholars. Reference [55]
proposes a rigid catenary modeling method. Rigid cate-
naries are mainly used in tunnels, whose structure is much
simpler than the flexible catenary. Reference [56] proposes
the modeling method for the overlap section. And the
contact wire irregularities are introduced in the catenary
model [57, 58].
3.2 Effect of wind load on catenary
In normal operations, railway catenary is very sensitive to
wind load because of its long-span and high flexibility. The
wind load is normally divided into two types: steady wind
and stochastic wind. Steady wind is not varying with time.
And stochastic wind varies with time and spatial position.
Under low-frequency and time-varying stochastic wind
load, the catenary can produce a forced vibration, which is
called buffeting. Under steady wind loads, the catenary can
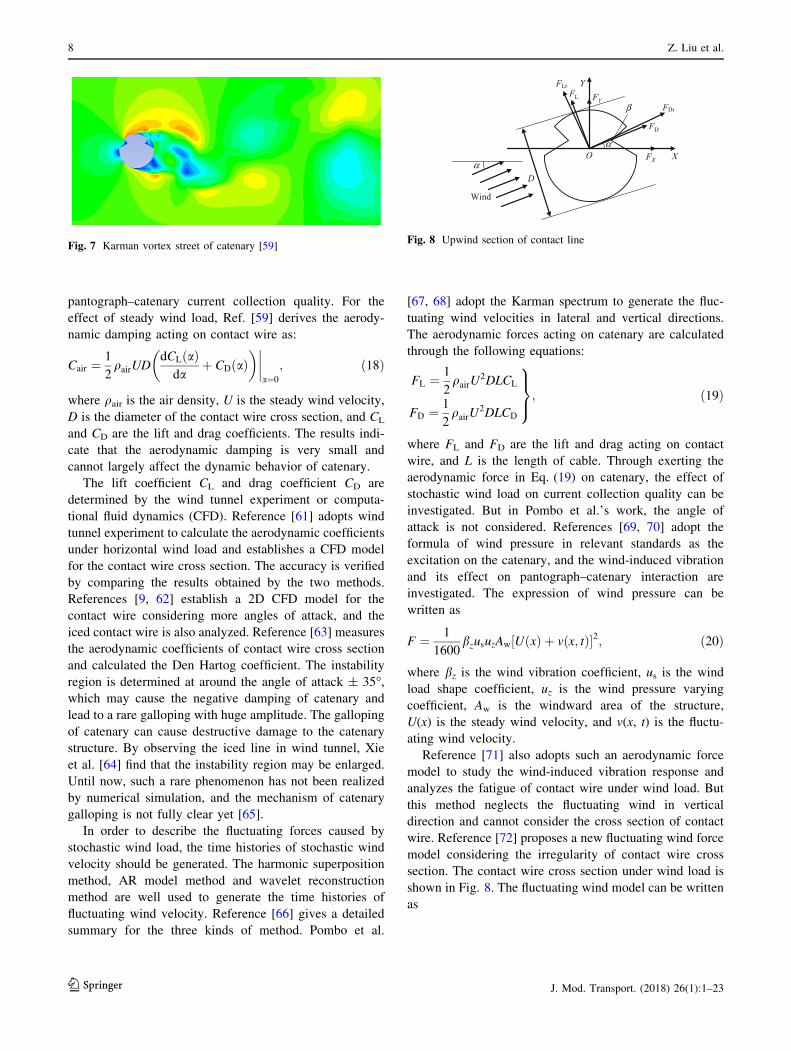
often produce wind deviations with vortex-induced vibra-
tion. The vortex-induced vibration is caused by the wind
flowing around slim cylinder as shown in Fig. 7 [59].
Reference [60] has done a detailed investigation on this
issue. Through exerting the vortex-induced forces on the
catenary model, the effect of wind velocity on the vortex-
induced vibration amplitude is analyzed. The results indi-
cate that the vortex-induced vibration for catenary is not
very large, and cannot produce huge detriment for
z
A
y
F1
F2
F3
T1
x
L0
T2
lx
ly
lz
F6
F5
F4
Fig. 5 Flexible cable element
0 1 2 3 4 550
100
150
200
250
300
350
Time (s)
Con
tact
forc
e (N
)
Proposed modelMSC-Marc
Fig. 6 Comparison in computation results of contact force between
MSC Marc and flexible cable model
Advances of research on high-speed railway catenary 7
123J. Mod. Transport. (2018) 26(1):1–23
pantograph–catenary current collection quality. For the
effect of steady wind load, Ref. [59] derives the aerody-
namic damping acting on contact wire as:
Cair ¼1
2qairUD
dCL að Þda
þ CD að Þ� �
a¼0
; ð18Þ
where qair is the air density, U is the steady wind velocity,
D is the diameter of the contact wire cross section, and CL
and CD are the lift and drag coefficients. The results indi-
cate that the aerodynamic damping is very small and
cannot largely affect the dynamic behavior of catenary.
The lift coefficient CL and drag coefficient CD are
determined by the wind tunnel experiment or computa-
tional fluid dynamics (CFD). Reference [61] adopts wind
tunnel experiment to calculate the aerodynamic coefficients
under horizontal wind load and establishes a CFD model
for the contact wire cross section. The accuracy is verified
by comparing the results obtained by the two methods.
References [9, 62] establish a 2D CFD model for the
contact wire considering more angles of attack, and the
iced contact wire is also analyzed. Reference [63] measures
the aerodynamic coefficients of contact wire cross section
and calculated the Den Hartog coefficient. The instability
region is determined at around the angle of attack ± 35�,which may cause the negative damping of catenary and
lead to a rare galloping with huge amplitude. The galloping
of catenary can cause destructive damage to the catenary
structure. By observing the iced line in wind tunnel, Xie
et al. [64] find that the instability region may be enlarged.
Until now, such a rare phenomenon has not been realized
by numerical simulation, and the mechanism of catenary
galloping is not fully clear yet [65].
In order to describe the fluctuating forces caused by
stochastic wind load, the time histories of stochastic wind
velocity should be generated. The harmonic superposition
method, AR model method and wavelet reconstruction
method are well used to generate the time histories of
fluctuating wind velocity. Reference [66] gives a detailed
summary for the three kinds of method. Pombo et al.
[67, 68] adopt the Karman spectrum to generate the fluc-
tuating wind velocities in lateral and vertical directions.
The aerodynamic forces acting on catenary are calculated
through the following equations:
FL ¼ 1
2qairU
2DLCL
FD ¼ 1
2qairU
2DLCD
9>=
>;; ð19Þ
where FL and FD are the lift and drag acting on contact
wire, and L is the length of cable. Through exerting the
aerodynamic force in Eq. (19) on catenary, the effect of
stochastic wind load on current collection quality can be
investigated. But in Pombo et al.’s work, the angle of
attack is not considered. References [69, 70] adopt the
formula of wind pressure in relevant standards as the
excitation on the catenary, and the wind-induced vibration
and its effect on pantograph–catenary interaction are
investigated. The expression of wind pressure can be
written as
F ¼ 1
1600bzusuzAw½U xð Þ þ v x; tð Þ�2; ð20Þ
where bz is the wind vibration coefficient, us is the wind
load shape coefficient, uz is the wind pressure varying
coefficient, Aw is the windward area of the structure,
U(x) is the steady wind velocity, and v(x, t) is the fluctu-
ating wind velocity.
Reference [71] also adopts such an aerodynamic force
model to study the wind-induced vibration response and
analyzes the fatigue of contact wire under wind load. But
this method neglects the fluctuating wind in vertical
direction and cannot consider the cross section of contact
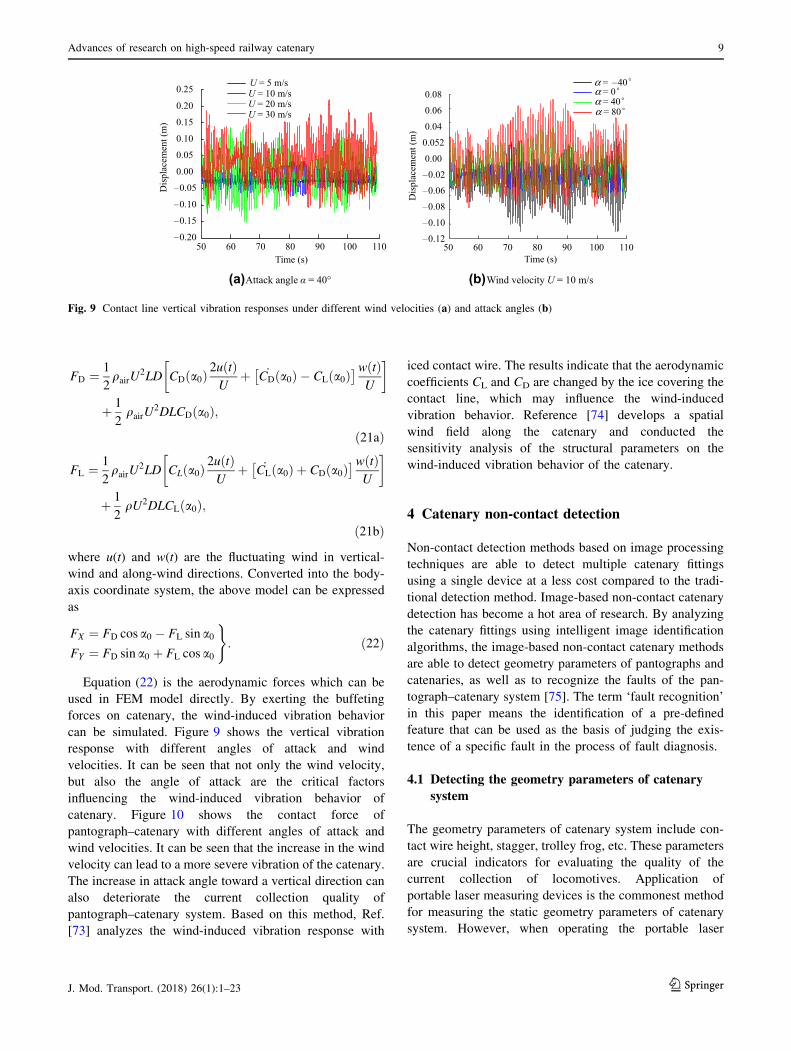
wire. Reference [72] proposes a new fluctuating wind force
model considering the irregularity of contact wire cross
section. The contact wire cross section under wind load is
shown in Fig. 8. The fluctuating wind model can be written
as
Fig. 7 Karman vortex street of catenary [59]
D
α
α
Wind
β
O
FLrFL FY
FDr
FD
FX
Y
X
Fig. 8 Upwind section of contact line
8 Z. Liu et al.
123 J. Mod. Transport. (2018) 26(1):1–23
FD ¼ 1
2qairU
2LD CDða0Þ2uðtÞU
þ _CDða0Þ � CLða0Þ� �wðtÞ
U
�
þ 1
2qairU
2DLCDða0Þ;
ð21aÞ
FL ¼ 1
2qairU
2LD CLða0Þ2uðtÞU
þ _CLða0Þ þ CDða0Þ� �wðtÞ
U
�
þ 1
2qU2DLCLða0Þ;
ð21bÞ
where u(t) and w(t) are the fluctuating wind in vertical-
wind and along-wind directions. Converted into the body-
axis coordinate system, the above model can be expressed
as
FX ¼ FD cos a0 � FL sin a0FY ¼ FD sin a0 þ FL cos a0
)
: ð22Þ
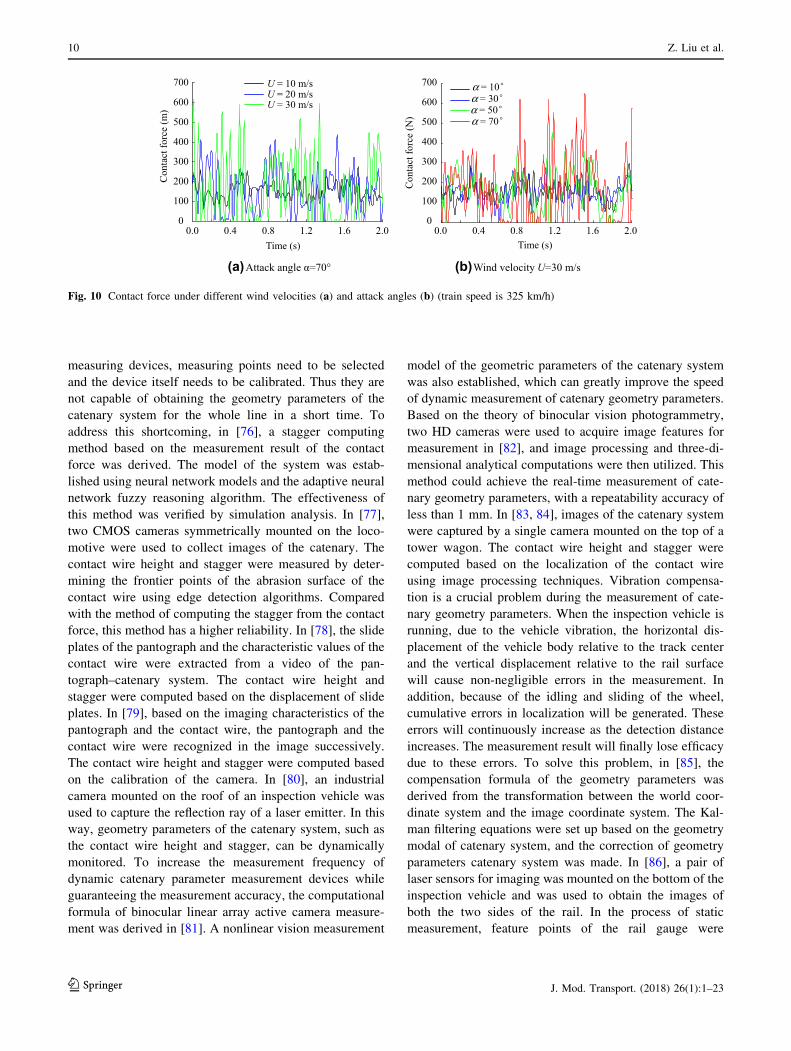
Equation (22) is the aerodynamic forces which can be
used in FEM model directly. By exerting the buffeting
forces on catenary, the wind-induced vibration behavior
can be simulated. Figure 9 shows the vertical vibration
response with different angles of attack and wind
velocities. It can be seen that not only the wind velocity,
but also the angle of attack are the critical factors
influencing the wind-induced vibration behavior of
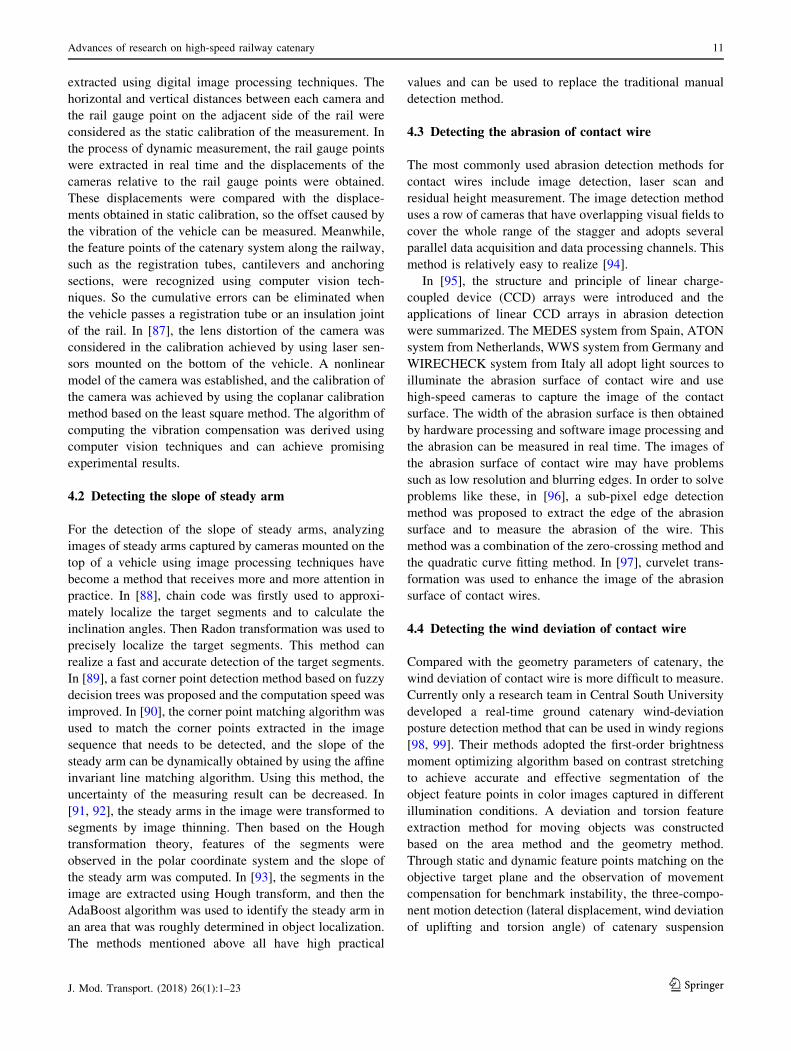
catenary. Figure 10 shows the contact force of
pantograph–catenary with different angles of attack and
wind velocities. It can be seen that the increase in the wind
velocity can lead to a more severe vibration of the catenary.
The increase in attack angle toward a vertical direction can
also deteriorate the current collection quality of
pantograph–catenary system. Based on this method, Ref.
[73] analyzes the wind-induced vibration response with
iced contact wire. The results indicate that the aerodynamic
coefficients CL and CD are changed by the ice covering the
contact line, which may influence the wind-induced
vibration behavior. Reference [74] develops a spatial
wind field along the catenary and conducted the
sensitivity analysis of the structural parameters on the
wind-induced vibration behavior of the catenary.
4 Catenary non-contact detection
Non-contact detection methods based on image processing
techniques are able to detect multiple catenary fittings
using a single device at a less cost compared to the tradi-
tional detection method. Image-based non-contact catenary
detection has become a hot area of research. By analyzing
the catenary fittings using intelligent image identification
algorithms, the image-based non-contact catenary methods
are able to detect geometry parameters of pantographs and
catenaries, as well as to recognize the faults of the pan-
tograph–catenary system [75]. The term ‘fault recognition’
in this paper means the identification of a pre-defined
feature that can be used as the basis of judging the exis-
tence of a specific fault in the process of fault diagnosis.
4.1 Detecting the geometry parameters of catenary
system
The geometry parameters of catenary system include con-
tact wire height, stagger, trolley frog, etc. These parameters
are crucial indicators for evaluating the quality of the
current collection of locomotives. Application of
portable laser measuring devices is the commonest method
for measuring the static geometry parameters of catenary
system. However, when operating the portable laser
(a)Attack angle α = 40° (b)Wind velocity U = 10 m/s
50 60 70 80 90 100 110
0.25
0.20
0.15
0.10
0.05
0.00
0.05
0.10
0.15
0.20
Time (s)
Dis
plac
emen
t (m
)
U = 5 m/sU = 10 m/sU = 20 m/sU = 30 m/s
50 60 70 80 90 100 110
0.08
0.06
0.04
0.052
0.00
0.06
0.08
0.10
0.12
α = 40α = 0α = 40α = 80
0.02
Time (s)
Dis
plac
emen
t (m
)
Fig. 9 Contact line vertical vibration responses under different wind velocities (a) and attack angles (b)
Advances of research on high-speed railway catenary 9
123J. Mod. Transport. (2018) 26(1):1–23
measuring devices, measuring points need to be selected
and the device itself needs to be calibrated. Thus they are
not capable of obtaining the geometry parameters of the
catenary system for the whole line in a short time. To
address this shortcoming, in [76], a stagger computing
method based on the measurement result of the contact
force was derived. The model of the system was estab-
lished using neural network models and the adaptive neural
network fuzzy reasoning algorithm. The effectiveness of
this method was verified by simulation analysis. In [77],
two CMOS cameras symmetrically mounted on the loco-
motive were used to collect images of the catenary. The
contact wire height and stagger were measured by deter-
mining the frontier points of the abrasion surface of the
contact wire using edge detection algorithms. Compared
with the method of computing the stagger from the contact
force, this method has a higher reliability. In [78], the slide
plates of the pantograph and the characteristic values of the
contact wire were extracted from a video of the pan-
tograph–catenary system. The contact wire height and
stagger were computed based on the displacement of slide
plates. In [79], based on the imaging characteristics of the
pantograph and the contact wire, the pantograph and the
contact wire were recognized in the image successively.
The contact wire height and stagger were computed based
on the calibration of the camera. In [80], an industrial
camera mounted on the roof of an inspection vehicle was
used to capture the reflection ray of a laser emitter. In this
way, geometry parameters of the catenary system, such as
the contact wire height and stagger, can be dynamically
monitored. To increase the measurement frequency of
dynamic catenary parameter measurement devices while
guaranteeing the measurement accuracy, the computational
formula of binocular linear array active camera measure-
ment was derived in [81]. A nonlinear vision measurement
model of the geometric parameters of the catenary system
was also established, which can greatly improve the speed
of dynamic measurement of catenary geometry parameters.
Based on the theory of binocular vision photogrammetry,
two HD cameras were used to acquire image features for
measurement in [82], and image processing and three-di-
mensional analytical computations were then utilized. This
method could achieve the real-time measurement of cate-
nary geometry parameters, with a repeatability accuracy of
less than 1 mm. In [83, 84], images of the catenary system
were captured by a single camera mounted on the top of a
tower wagon. The contact wire height and stagger were
computed based on the localization of the contact wire
using image processing techniques. Vibration compensa-
tion is a crucial problem during the measurement of cate-
nary geometry parameters. When the inspection vehicle is
running, due to the vehicle vibration, the horizontal dis-
placement of the vehicle body relative to the track center
and the vertical displacement relative to the rail surface
will cause non-negligible errors in the measurement. In
addition, because of the idling and sliding of the wheel,
cumulative errors in localization will be generated. These
errors will continuously increase as the detection distance
increases. The measurement result will finally lose efficacy
due to these errors. To solve this problem, in [85], the
compensation formula of the geometry parameters was
derived from the transformation between the world coor-
dinate system and the image coordinate system. The Kal-
man filtering equations were set up based on the geometry
modal of catenary system, and the correction of geometry
parameters catenary system was made. In [86], a pair of
laser sensors for imaging was mounted on the bottom of the
inspection vehicle and was used to obtain the images of
both the two sides of the rail. In the process of static
measurement, feature points of the rail gauge were
(a)Attack angle α=70° (b)Wind velocity U=30 m/s
0.0 0.4 0.8 1.2 1.6 2.0
700
600
500
400
300
200
100
0
U = 10 m/sU = 20 m/sU = 30 m/s
Time (s)
Con
tact
forc
e(m
)
0.0 0.4 0.8 1.2 1.6 2.0
700
600
500
400
300
200
100
0
α = 10α = 30α = 50α = 70
Time (s)
Con
tact
forc
e (N
)
Fig. 10 Contact force under different wind velocities (a) and attack angles (b) (train speed is 325 km/h)
10 Z. Liu et al.
123 J. Mod. Transport. (2018) 26(1):1–23
extracted using digital image processing techniques. The
horizontal and vertical distances between each camera and
the rail gauge point on the adjacent side of the rail were
considered as the static calibration of the measurement. In
the process of dynamic measurement, the rail gauge points
were extracted in real time and the displacements of the
cameras relative to the rail gauge points were obtained.
These displacements were compared with the displace-
ments obtained in static calibration, so the offset caused by
the vibration of the vehicle can be measured. Meanwhile,
the feature points of the catenary system along the railway,
such as the registration tubes, cantilevers and anchoring
sections, were recognized using computer vision tech-
niques. So the cumulative errors can be eliminated when
the vehicle passes a registration tube or an insulation joint
of the rail. In [87], the lens distortion of the camera was
considered in the calibration achieved by using laser sen-
sors mounted on the bottom of the vehicle. A nonlinear
model of the camera was established, and the calibration of
the camera was achieved by using the coplanar calibration
method based on the least square method. The algorithm of
computing the vibration compensation was derived using
computer vision techniques and can achieve promising
experimental results.
4.2 Detecting the slope of steady arm
For the detection of the slope of steady arms, analyzing
images of steady arms captured by cameras mounted on the
top of a vehicle using image processing techniques have
become a method that receives more and more attention in
practice. In [88], chain code was firstly used to approxi-
mately localize the target segments and to calculate the
inclination angles. Then Radon transformation was used to
precisely localize the target segments. This method can
realize a fast and accurate detection of the target segments.
In [89], a fast corner point detection method based on fuzzy
decision trees was proposed and the computation speed was
improved. In [90], the corner point matching algorithm was
used to match the corner points extracted in the image
sequence that needs to be detected, and the slope of the
steady arm can be dynamically obtained by using the affine
invariant line matching algorithm. Using this method, the
uncertainty of the measuring result can be decreased. In
[91, 92], the steady arms in the image were transformed to
segments by image thinning. Then based on the Hough
transformation theory, features of the segments were
observed in the polar coordinate system and the slope of
the steady arm was computed. In [93], the segments in the
image are extracted using Hough transform, and then the
AdaBoost algorithm was used to identify the steady arm in
an area that was roughly determined in object localization.
The methods mentioned above all have high practical
values and can be used to replace the traditional manual
detection method.
4.3 Detecting the abrasion of contact wire
The most commonly used abrasion detection methods for
contact wires include image detection, laser scan and
residual height measurement. The image detection method
uses a row of cameras that have overlapping visual fields to
cover the whole range of the stagger and adopts several
parallel data acquisition and data processing channels. This
method is relatively easy to realize [94].
In [95], the structure and principle of linear charge-
coupled device (CCD) arrays were introduced and the
applications of linear CCD arrays in abrasion detection
were summarized. The MEDES system from Spain, ATON
system from Netherlands, WWS system from Germany and
WIRECHECK system from Italy all adopt light sources to
illuminate the abrasion surface of contact wire and use
high-speed cameras to capture the image of the contact
surface. The width of the abrasion surface is then obtained
by hardware processing and software image processing and
the abrasion can be measured in real time. The images of
the abrasion surface of contact wire may have problems
such as low resolution and blurring edges. In order to solve
problems like these, in [96], a sub-pixel edge detection
method was proposed to extract the edge of the abrasion
surface and to measure the abrasion of the wire. This
method was a combination of the zero-crossing method and
the quadratic curve fitting method. In [97], curvelet trans-
formation was used to enhance the image of the abrasion
surface of contact wires.
4.4 Detecting the wind deviation of contact wire
Compared with the geometry parameters of catenary, the
wind deviation of contact wire is more difficult to measure.
Currently only a research team in Central South University
developed a real-time ground catenary wind-deviation
posture detection method that can be used in windy regions
[98, 99]. Their methods adopted the first-order brightness
moment optimizing algorithm based on contrast stretching
to achieve accurate and effective segmentation of the
object feature points in color images captured in different
illumination conditions. A deviation and torsion feature
extraction method for moving objects was constructed
based on the area method and the geometry method.
Through static and dynamic feature points matching on the
objective target plane and the observation of movement
compensation for benchmark instability, the three-compo-
nent motion detection (lateral displacement, wind deviation
of uplifting and torsion angle) of catenary suspension
Advances of research on high-speed railway catenary 11
123J. Mod. Transport. (2018) 26(1):1–23
structure was realized, including the contact wire, mes-
senger wire and dropper.
4.5 Detecting the abnormal working status
of catenary fittings
Because of the growing tension of the contact wire and
messenger wire, and the influence of operation environ-
ment, the strain and vibration of catenary fittings are also
increasing. Thus the safety problem of catenary fittings is
highlighted. Many researchers have developed automatic
recognition methods and fault detection methods for dif-
ferent types of catenary fittings. In [100], the effective
value and standard deviation of the leakage current were
considered as the feature value in contamination detection,
based on the grey relational analysis between the envi-
ronmental factor and the leakage current. In [101], tem-
plates of the catenary fittings were firstly created. These
templates were consulted when recognizing the fittings in
the detection phase. Then the geometrical morphology
analysis of the extracted fittings was performed and the
fittings with abnormalities can be found. In [102], the
localization of the insulators was achieved by template
matching and analyzing the characteristics of the reflected
ray. The foreign object between the insulator ceramic disks
was detected using the singularity of wavelet coefficients.
In [103], directional filtering was achieved using curvelet.
Then, the clustered coefficients of curvelet were enhanced
using mathematical morphology. Finally, the insulators
were localized by processing the curvelet coefficients using
the zonal energy statistical method. In [104], six different
affine invariant moments were used to localize the insula-
tor. The edges of the insulator were enhanced by dilation.
Then the foreign object was detected by using grayscale
parameter statistics. In [105], Harris corner points and
spectral clustering were combined to achieve anti-rotation
insulator matching and fault detection. In [106–109], the
detection of clevises and insulators was achieved by feature
matching, scale-invariant feature transform (SIFT) and
speeded-up robust features (SURF). The abnormal working
status of these fittings was detected by analyzing the edge
information and grayscale statistical information. Machine
learning methods based on local features have shown
promising results in catenary fitting fault detection. In
[110–112], local features such as histogram of oriented
gradients (HOG) were processed with pattern recognition
methods including support vector machine (SVM) and
cascaded AdaBoost. Fittings such as clevis, diagonal tube
and messenger wire bracket were successfully detected in
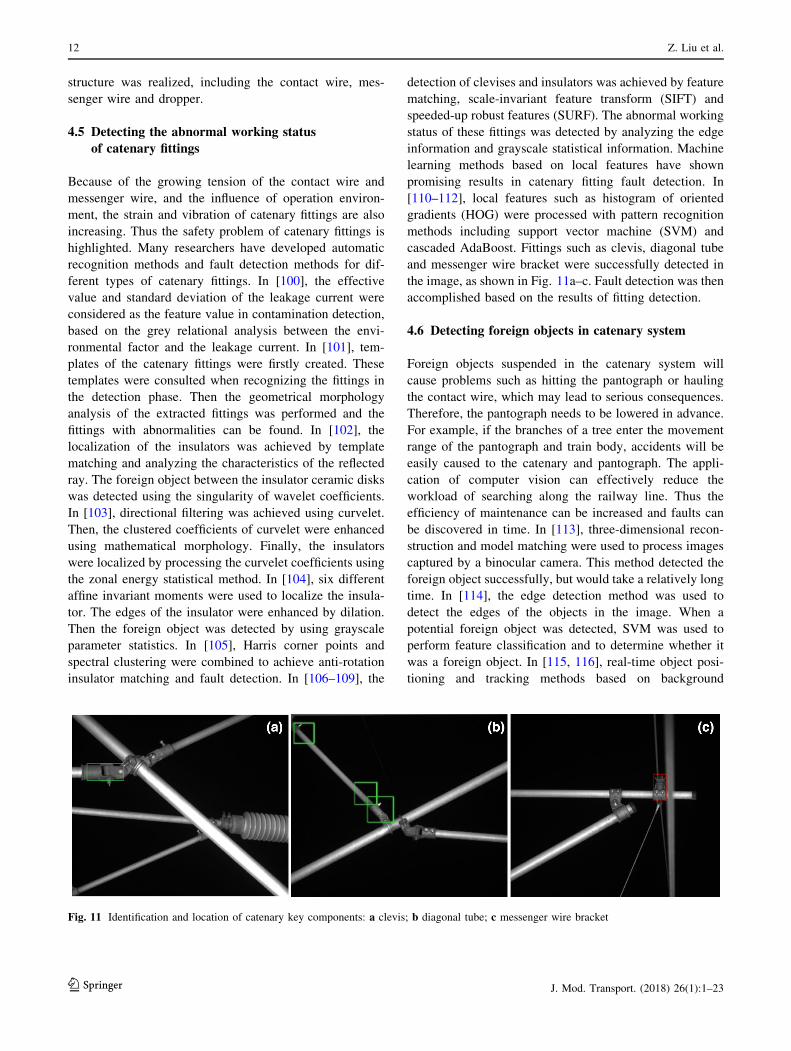
the image, as shown in Fig. 11a–c. Fault detection was then
accomplished based on the results of fitting detection.
4.6 Detecting foreign objects in catenary system
Foreign objects suspended in the catenary system will
cause problems such as hitting the pantograph or hauling
the contact wire, which may lead to serious consequences.
Therefore, the pantograph needs to be lowered in advance.
For example, if the branches of a tree enter the movement
range of the pantograph and train body, accidents will be
easily caused to the catenary and pantograph. The appli-
cation of computer vision can effectively reduce the
workload of searching along the railway line. Thus the
efficiency of maintenance can be increased and faults can
be discovered in time. In [113], three-dimensional recon-
struction and model matching were used to process images
captured by a binocular camera. This method detected the
foreign object successfully, but would take a relatively long
time. In [114], the edge detection method was used to
detect the edges of the objects in the image. When a
potential foreign object was detected, SVM was used to
perform feature classification and to determine whether it
was a foreign object. In [115, 116], real-time object posi-
tioning and tracking methods based on background
Fig. 11 Identification and location of catenary key components: a clevis; b diagonal tube; c messenger wire bracket
12 Z. Liu et al.
123 J. Mod. Transport. (2018) 26(1):1–23
difference were studied. Foreign objects were recognized
by analyzing their motion curves. In [117], a catenary
foreign object and electric arc detection method was pro-
posed. This method first used mean-shift method to track
the contact wire in the video. Then the foreground was
detected using the Gaussian mixture model. By doing this,
the foreign object or the electric arc can be detected. In
[118], Bayesian model was used to inspect the ‘high risk’
area around the mast and cantilever of the catenary. The
tree branches or bird nests entering the range of the cate-
nary can be detected. In [119], affine geometry principle
was used to create the detection model of the gradually
changing foreign object and. Radon transform was used to
monitor the rail. Gradually changing foreign objects that
enter the range of the catenary can then be detected. In
[120], SVM and Kalman filtering algorithm were combined
to realize the classification and tracking of the foreign
object.
In short, the catenary non-contact detection methods
based on image processing are widely applied in high-
speed railway catenary maintenance. Because of the com-
plex operating environment and rigorous operating condi-
tion of high-speed railway system, the existing detection
methods cannot completely meet the requirement of cate-
nary maintenance and fault detection. With the develop-
ment of image processing and computer vision, more
advanced detection technologies will be used in high-speed
railway catenary detection.
5 State evaluation of catenary system
The state evaluation of a catenary system refers to char-
acterizing, both qualitatively and quantitatively, the appli-
cability of the catenary to the normal operation of a railway
line by utilizing relevant measurement and simulation data.
The state evaluation can be applied in all stages of the
catenary system including design, acceptance and opera-
tion. This evaluation not only estimates the global and
long-term state of the catenary system, but also considers
the influences of local catenary defects. Another related
concept is the defect diagnosis of catenary system, which
means diagnosing certain types of catenary defects and
their severity based on relevant measurement data, mostly
after the catenary system is put into service. These defects
directly influence the catenary performance. Thus, the
results of catenary defect diagnosis are also included in the
state evaluation of catenary system.
5.1 State evaluation methods for catenary system
The catenary state evaluation is performed based on the
measurement data of the catenary system structure and the
interaction between pantograph and catenary. When the
catenary system is static without the pantograph, the geo-
metric parameters of contact wire, including the height,
stagger and thickness and the simultaneous location
information are basic static measurement data. With the
contact of pantograph, the dynamic measurement data of
catenary system mainly include the contact force between
pantograph and catenary, the pantograph vertical acceler-
ation, the vertical displacement of contact wire and pan-
tograph, the frequency of arcing occurrences, etc. Both
static and dynamic measurement data can be employed for
catenary state evaluation, respectively, for static and
dynamic state evaluations [121].
Normally, the static and dynamic state evaluations
should be combined for catenary state evaluation. How-
ever, because the conventional speed lines usually have
low requirements for dynamic measurement data, the static
state evaluation is the dominant way to assess their cate-
nary state in practice. Based on static data that are easy to
measure and indicators that are easy to calculate, long-term
catenary state evaluation has proven effective for in con-
ventional speed lines. Due to the technical difficulty and
high cost of performing the dynamic state evaluation, most
conventional speed lines only employ dynamic data at the
acceptance stage but not during the operation stage.
However, as the train speed increases, the static state
evaluation becomes insufficient for the operation and
maintenance of high-speed lines. Since dynamic state
evaluation is based on dynamic data that directly reflect the
dynamic interaction, it is more applicable for catenary state
evaluation compared with static state evaluation. Thus,
related measurement and evaluation techniques have been
developed in recent years to meet the emerging needs,
making the dynamic state evaluation promising and pop-
ular for high-speed railway lines. Meanwhile, to improve
the effect and reduce the cost of dynamic state evaluation, a
shorter inspection interval [122] and a higher sampling
frequency [123] than that in current practice are necessary
and helpful.
5.2 Static state evaluation of catenary system
In the static state evaluation of high-speed catenary system,
the static measurement data describe the spatial location
and wear pattern of the contact wire. The current spatial
location of contact wire, reflected by measurements of
height and stagger, indicates the degree of deviation from
the nominal position. The deviation is unfavorable for
current collection if is too high and must be fixed if higher
than a pre-defined threshold. Similarly, the contact wire
must be partly or entirely replaced if the wire thickness is
too low. With higher operation speed, the influence caused
by deviated wire location and wear will be more
Advances of research on high-speed railway catenary 13
123J. Mod. Transport. (2018) 26(1):1–23
significant. This prompted the proposal of the contact wire
irregularity (or unevenness), a concept that describes the
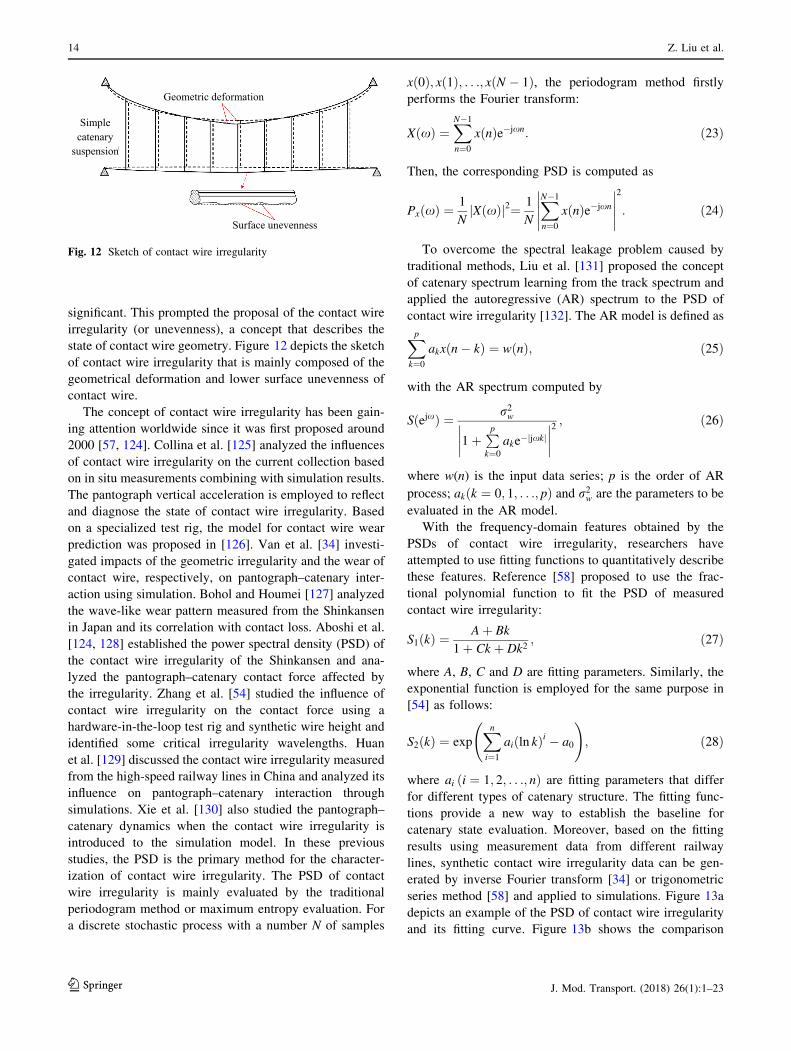
state of contact wire geometry. Figure 12 depicts the sketch
of contact wire irregularity that is mainly composed of the
geometrical deformation and lower surface unevenness of
contact wire.
The concept of contact wire irregularity has been gain-
ing attention worldwide since it was first proposed around
2000 [57, 124]. Collina et al. [125] analyzed the influences
of contact wire irregularity on the current collection based
on in situ measurements combining with simulation results.
The pantograph vertical acceleration is employed to reflect
and diagnose the state of contact wire irregularity. Based
on a specialized test rig, the model for contact wire wear
prediction was proposed in [126]. Van et al. [34] investi-
gated impacts of the geometric irregularity and the wear of
contact wire, respectively, on pantograph–catenary inter-
action using simulation. Bohol and Houmei [127] analyzed
the wave-like wear pattern measured from the Shinkansen
in Japan and its correlation with contact loss. Aboshi et al.
[124, 128] established the power spectral density (PSD) of
the contact wire irregularity of the Shinkansen and ana-
lyzed the pantograph–catenary contact force affected by
the irregularity. Zhang et al. [54] studied the influence of
contact wire irregularity on the contact force using a
hardware-in-the-loop test rig and synthetic wire height and
identified some critical irregularity wavelengths. Huan
et al. [129] discussed the contact wire irregularity measured
from the high-speed railway lines in China and analyzed its
influence on pantograph–catenary interaction through
simulations. Xie et al. [130] also studied the pantograph–
catenary dynamics when the contact wire irregularity is
introduced to the simulation model. In these previous
studies, the PSD is the primary method for the character-
ization of contact wire irregularity. The PSD of contact
wire irregularity is mainly evaluated by the traditional
periodogram method or maximum entropy evaluation. For
a discrete stochastic process with a number N of samples
xð0Þ; xð1Þ; . . .; xðN � 1Þ, the periodogram method firstly
performs the Fourier transform:
XðxÞ ¼XN�1
n¼0
xðnÞe�jxn: ð23Þ
Then, the corresponding PSD is computed as
PxðxÞ ¼1
NXðxÞj j2¼ 1
N
XN�1
n¼0
xðnÞe�jxn
2
: ð24Þ
To overcome the spectral leakage problem caused by
traditional methods, Liu et al. [131] proposed the concept
of catenary spectrum learning from the track spectrum and
applied the autoregressive (AR) spectrum to the PSD of
contact wire irregularity [132]. The AR model is defined as
Xp
k¼0
akxðn� kÞ ¼ wðnÞ; ð25Þ
with the AR spectrum computed by
SðejxÞ ¼ r2w
1þPp
k¼0
ake� jxkj j
2; ð26Þ
where w(n) is the input data series; p is the order of AR
process; akðk ¼ 0; 1; . . .; pÞ and r2w are the parameters to be
evaluated in the AR model.
With the frequency-domain features obtained by the
PSDs of contact wire irregularity, researchers have
attempted to use fitting functions to quantitatively describe
these features. Reference [58] proposed to use the frac-
tional polynomial function to fit the PSD of measured
contact wire irregularity:
S1ðkÞ ¼Aþ Bk
1þ Ck þ Dk2; ð27Þ
where A, B, C and D are fitting parameters. Similarly, the
exponential function is employed for the same purpose in
[54] as follows:
S2ðkÞ ¼ expXn
i¼1
aiðln kÞi � a0
!
; ð28Þ
where ai ði ¼ 1; 2; . . .; nÞ are fitting parameters that differ
for different types of catenary structure. The fitting func-
tions provide a new way to establish the baseline for
catenary state evaluation. Moreover, based on the fitting
results using measurement data from different railway
lines, synthetic contact wire irregularity data can be gen-
erated by inverse Fourier transform [34] or trigonometric
series method [58] and applied to simulations. Figure 13a
depicts an example of the PSD of contact wire irregularity
and its fitting curve. Figure 13b shows the comparison
Surface unevenness
Simple catenary
suspension
Geometric deformation
Fig. 12 Sketch of contact wire irregularity
14 Z. Liu et al.
123 J. Mod. Transport. (2018) 26(1):1–23
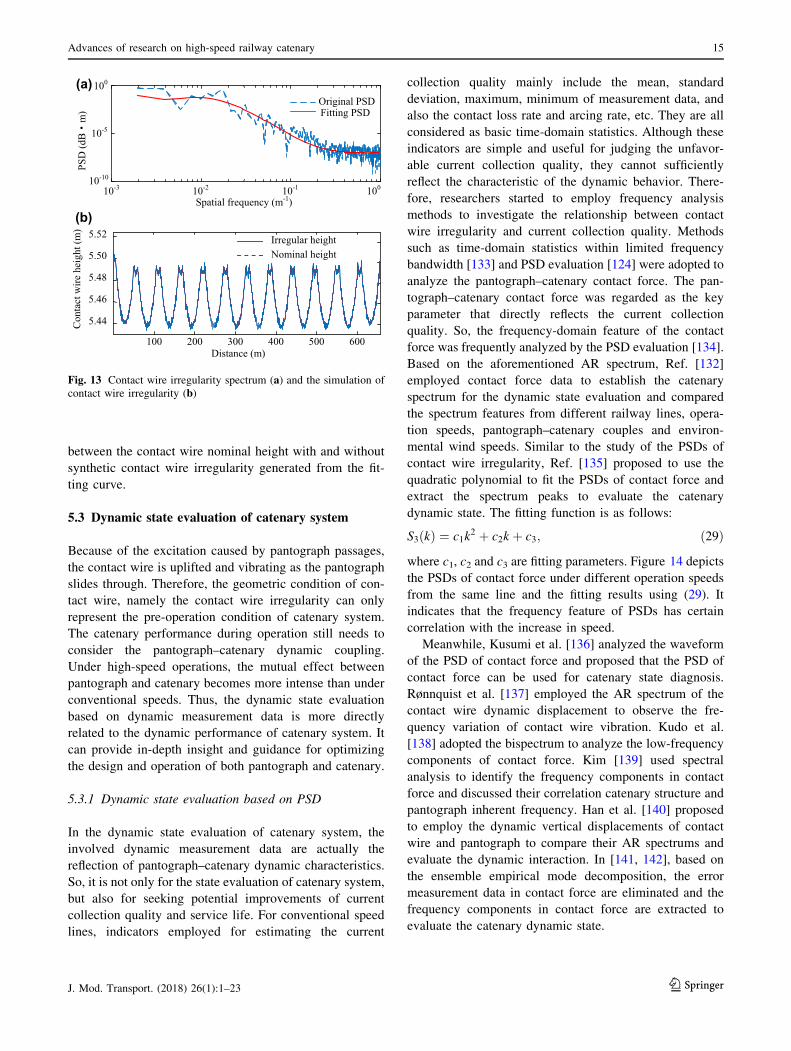
between the contact wire nominal height with and without
synthetic contact wire irregularity generated from the fit-
ting curve.
5.3 Dynamic state evaluation of catenary system
Because of the excitation caused by pantograph passages,
the contact wire is uplifted and vibrating as the pantograph
slides through. Therefore, the geometric condition of con-
tact wire, namely the contact wire irregularity can only
represent the pre-operation condition of catenary system.
The catenary performance during operation still needs to
consider the pantograph–catenary dynamic coupling.
Under high-speed operations, the mutual effect between
pantograph and catenary becomes more intense than under
conventional speeds. Thus, the dynamic state evaluation
based on dynamic measurement data is more directly
related to the dynamic performance of catenary system. It
can provide in-depth insight and guidance for optimizing
the design and operation of both pantograph and catenary.
5.3.1 Dynamic state evaluation based on PSD
In the dynamic state evaluation of catenary system, the
involved dynamic measurement data are actually the
reflection of pantograph–catenary dynamic characteristics.
So, it is not only for the state evaluation of catenary system,
but also for seeking potential improvements of current
collection quality and service life. For conventional speed
lines, indicators employed for estimating the current
collection quality mainly include the mean, standard
deviation, maximum, minimum of measurement data, and
also the contact loss rate and arcing rate, etc. They are all
considered as basic time-domain statistics. Although these
indicators are simple and useful for judging the unfavor-
able current collection quality, they cannot sufficiently
reflect the characteristic of the dynamic behavior. There-
fore, researchers started to employ frequency analysis
methods to investigate the relationship between contact
wire irregularity and current collection quality. Methods
such as time-domain statistics within limited frequency
bandwidth [133] and PSD evaluation [124] were adopted to
analyze the pantograph–catenary contact force. The pan-
tograph–catenary contact force was regarded as the key
parameter that directly reflects the current collection
quality. So, the frequency-domain feature of the contact
force was frequently analyzed by the PSD evaluation [134].
Based on the aforementioned AR spectrum, Ref. [132]
employed contact force data to establish the catenary
spectrum for the dynamic state evaluation and compared
the spectrum features from different railway lines, opera-
tion speeds, pantograph–catenary couples and environ-
mental wind speeds. Similar to the study of the PSDs of
contact wire irregularity, Ref. [135] proposed to use the
quadratic polynomial to fit the PSDs of contact force and
extract the spectrum peaks to evaluate the catenary
dynamic state. The fitting function is as follows:
S3ðkÞ ¼ c1k2 þ c2k þ c3; ð29Þ
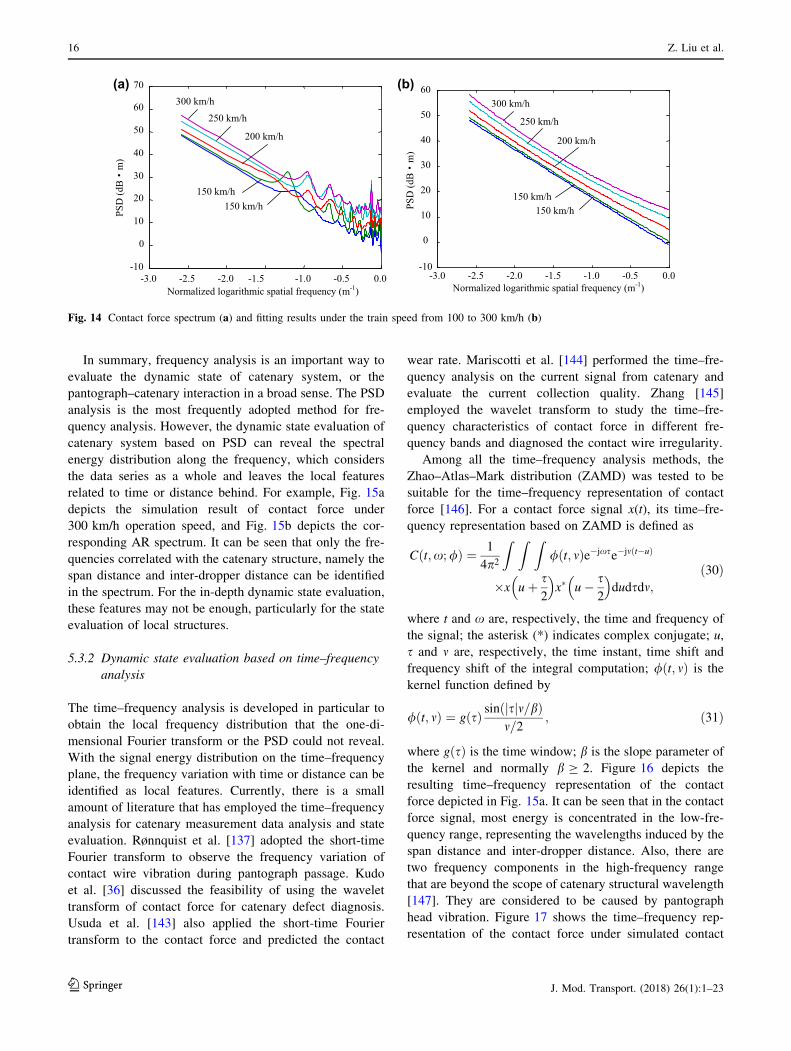
where c1, c2 and c3 are fitting parameters. Figure 14 depicts
the PSDs of contact force under different operation speeds
from the same line and the fitting results using (29). It
indicates that the frequency feature of PSDs has certain
correlation with the increase in speed.
Meanwhile, Kusumi et al. [136] analyzed the waveform
of the PSD of contact force and proposed that the PSD of
contact force can be used for catenary state diagnosis.
Rønnquist et al. [137] employed the AR spectrum of the
contact wire dynamic displacement to observe the fre-
quency variation of contact wire vibration. Kudo et al.
[138] adopted the bispectrum to analyze the low-frequency
components of contact force. Kim [139] used spectral
analysis to identify the frequency components in contact
force and discussed their correlation catenary structure and
pantograph inherent frequency. Han et al. [140] proposed
to employ the dynamic vertical displacements of contact
wire and pantograph to compare their AR spectrums and
evaluate the dynamic interaction. In [141, 142], based on
the ensemble empirical mode decomposition, the error
measurement data in contact force are eliminated and the
frequency components in contact force are extracted to
evaluate the catenary dynamic state.
(a)
(b)
100 200 300 400 500 600Distance (m)
5.44
5.46
5.48
5.50
5.52 Irregular heightNominal height
Con
tact
wire
hei
ght(
m)
Spatial frequency (m-1)
100
10-5
10-10
10-3 10-2 10-1 100
PSD
(dB
m)
Original PSDFitting PSD
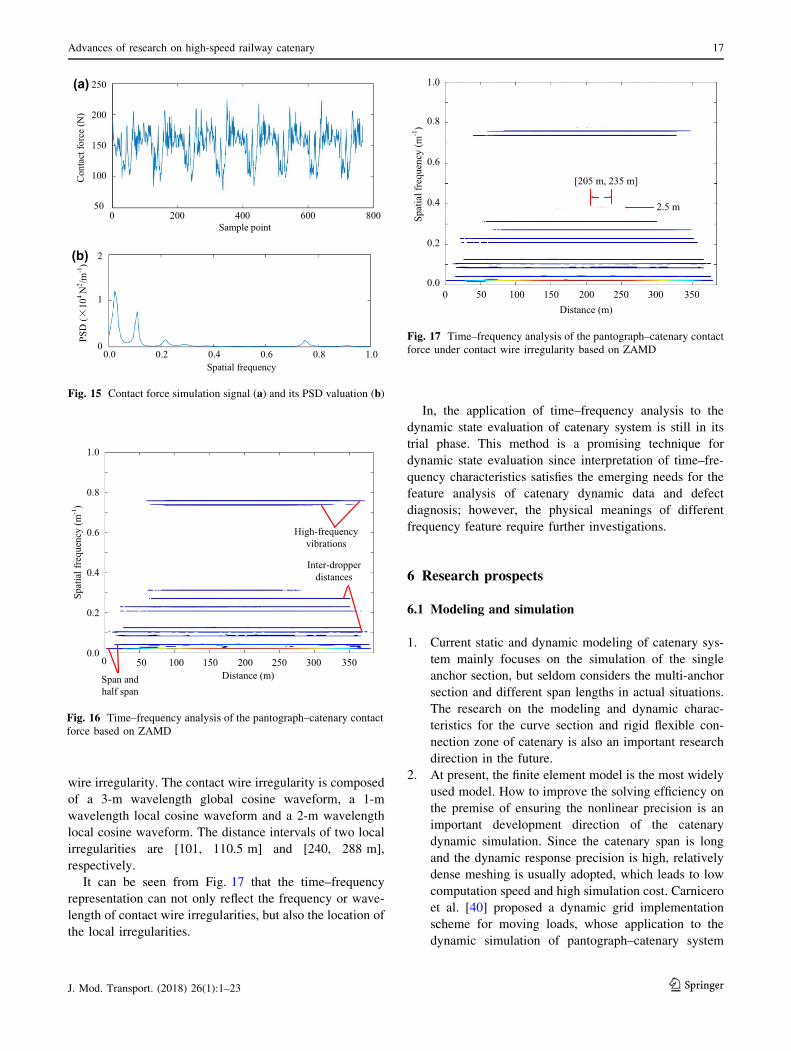
Fig. 13 Contact wire irregularity spectrum (a) and the simulation of
contact wire irregularity (b)
Advances of research on high-speed railway catenary 15
123J. Mod. Transport. (2018) 26(1):1–23
In summary, frequency analysis is an important way to
evaluate the dynamic state of catenary system, or the
pantograph–catenary interaction in a broad sense. The PSD
analysis is the most frequently adopted method for fre-
quency analysis. However, the dynamic state evaluation of
catenary system based on PSD can reveal the spectral
energy distribution along the frequency, which considers
the data series as a whole and leaves the local features
related to time or distance behind. For example, Fig. 15a
depicts the simulation result of contact force under
300 km/h operation speed, and Fig. 15b depicts the cor-
responding AR spectrum. It can be seen that only the fre-
quencies correlated with the catenary structure, namely the
span distance and inter-dropper distance can be identified
in the spectrum. For the in-depth dynamic state evaluation,
these features may not be enough, particularly for the state
evaluation of local structures.
5.3.2 Dynamic state evaluation based on time–frequency
analysis
The time–frequency analysis is developed in particular to
obtain the local frequency distribution that the one-di-
mensional Fourier transform or the PSD could not reveal.
With the signal energy distribution on the time–frequency
plane, the frequency variation with time or distance can be
identified as local features. Currently, there is a small
amount of literature that has employed the time–frequency
analysis for catenary measurement data analysis and state
evaluation. Rønnquist et al. [137] adopted the short-time
Fourier transform to observe the frequency variation of
contact wire vibration during pantograph passage. Kudo
et al. [36] discussed the feasibility of using the wavelet
transform of contact force for catenary defect diagnosis.
Usuda et al. [143] also applied the short-time Fourier
transform to the contact force and predicted the contact
wear rate. Mariscotti et al. [144] performed the time–fre-
quency analysis on the current signal from catenary and
evaluate the current collection quality. Zhang [145]
employed the wavelet transform to study the time–fre-
quency characteristics of contact force in different fre-
quency bands and diagnosed the contact wire irregularity.
Among all the time–frequency analysis methods, the
Zhao–Atlas–Mark distribution (ZAMD) was tested to be
suitable for the time–frequency representation of contact
force [146]. For a contact force signal x(t), its time–fre-
quency representation based on ZAMD is defined as
Cðt;x;/Þ ¼ 1
4p2
Z Z Z/ðt; mÞe�jxse�jmðt�uÞ
�x uþ s2
� �x� u� s
2
� �dudsdm;
ð30Þ
where t and x are, respectively, the time and frequency of
the signal; the asterisk (*) indicates complex conjugate; u,
s and m are, respectively, the time instant, time shift and
frequency shift of the integral computation; /ðt; mÞ is the
kernel function defined by
/ðt; mÞ ¼ gðsÞ sinð sj jm=bÞm=2
; ð31Þ
where gðsÞ is the time window; b is the slope parameter of
the kernel and normally b C 2. Figure 16 depicts the
resulting time–frequency representation of the contact
force depicted in Fig. 15a. It can be seen that in the contact
force signal, most energy is concentrated in the low-fre-
quency range, representing the wavelengths induced by the
span distance and inter-dropper distance. Also, there are
two frequency components in the high-frequency range
that are beyond the scope of catenary structural wavelength
[147]. They are considered to be caused by pantograph
head vibration. Figure 17 shows the time–frequency rep-
resentation of the contact force under simulated contact
(a) (b)
-3.0 -2.5 -2.0 -1.5 -1.0 -0.5 0.0-10
0
10
20
30
40
50
60
70
Normalized logarithmic spatial frequency (m-1)
PSD
(dB
m)
300 km/h
250 km/h
200 km/h
150 km/h150 km/h
-3.0 -2.5 -2.0 -1.5 -1.0 -0.5 0.0-10
0
10
20
30
40
50
60
Normalized logarithmic spatial frequency (m-1)
300 km/h
250 km/h
200 km/h
150 km/h150 km/hPS
D(d
Bm
)
Fig. 14 Contact force spectrum (a) and fitting results under the train speed from 100 to 300 km/h (b)
16 Z. Liu et al.
123 J. Mod. Transport. (2018) 26(1):1–23
wire irregularity. The contact wire irregularity is composed
of a 3-m wavelength global cosine waveform, a 1-m
wavelength local cosine waveform and a 2-m wavelength
local cosine waveform. The distance intervals of two local
irregularities are [101, 110.5 m] and [240, 288 m],
respectively.
It can be seen from Fig. 17 that the time–frequency
representation can not only reflect the frequency or wave-
length of contact wire irregularities, but also the location of
the local irregularities.
In, the application of time–frequency analysis to the
dynamic state evaluation of catenary system is still in its
trial phase. This method is a promising technique for
dynamic state evaluation since interpretation of time–fre-
quency characteristics satisfies the emerging needs for the
feature analysis of catenary dynamic data and defect
diagnosis; however, the physical meanings of different
frequency feature require further investigations.
6 Research prospects
6.1 Modeling and simulation
1. Current static and dynamic modeling of catenary sys-
tem mainly focuses on the simulation of the single
anchor section, but seldom considers the multi-anchor
section and different span lengths in actual situations.
The research on the modeling and dynamic charac-
teristics for the curve section and rigid flexible con-
nection zone of catenary is also an important research
direction in the future.
2. At present, the finite element model is the most widely
used model. How to improve the solving efficiency on
the premise of ensuring the nonlinear precision is an
important development direction of the catenary
dynamic simulation. Since the catenary span is long
and the dynamic response precision is high, relatively
dense meshing is usually adopted, which leads to low
computation speed and high simulation cost. Carnicero
et al. [40] proposed a dynamic grid implementation
scheme for moving loads, whose application to the
dynamic simulation of pantograph–catenary system
(a)
(b)
0.0 0.2 0.4 0.6 0.8 1.0
2
1
0
PSD
(10
4N
2 /m- 1
)
Spatial frequency
Con
tact
forc
e (N
)
Sample point0 200 400 600 800
250
200
150
100
50
Fig. 15 Contact force simulation signal (a) and its PSD valuation (b)
Span andhalf span
High-frequencyvibrations
Inter-dropperdistances
50 100 150 200 250 300 350Distance (m)
1.0
0.8
0.6
0.4
0.2
0.0
Spat
ial f
requ
ency
(m-1
)
0
Fig. 16 Time–frequency analysis of the pantograph–catenary contact
force based on ZAMD
50 100 150 200 250 300 350Distance (m)
1.0
0.8
0.6
0.4
0.2
0.0
Spat
ial f
requ
ency
(m-1
)
[205 m, 235 m]
2.5 m
0
Fig. 17 Time–frequency analysis of the pantograph–catenary contact
force under contact wire irregularity based on ZAMD
Advances of research on high-speed railway catenary 17
123J. Mod. Transport. (2018) 26(1):1–23
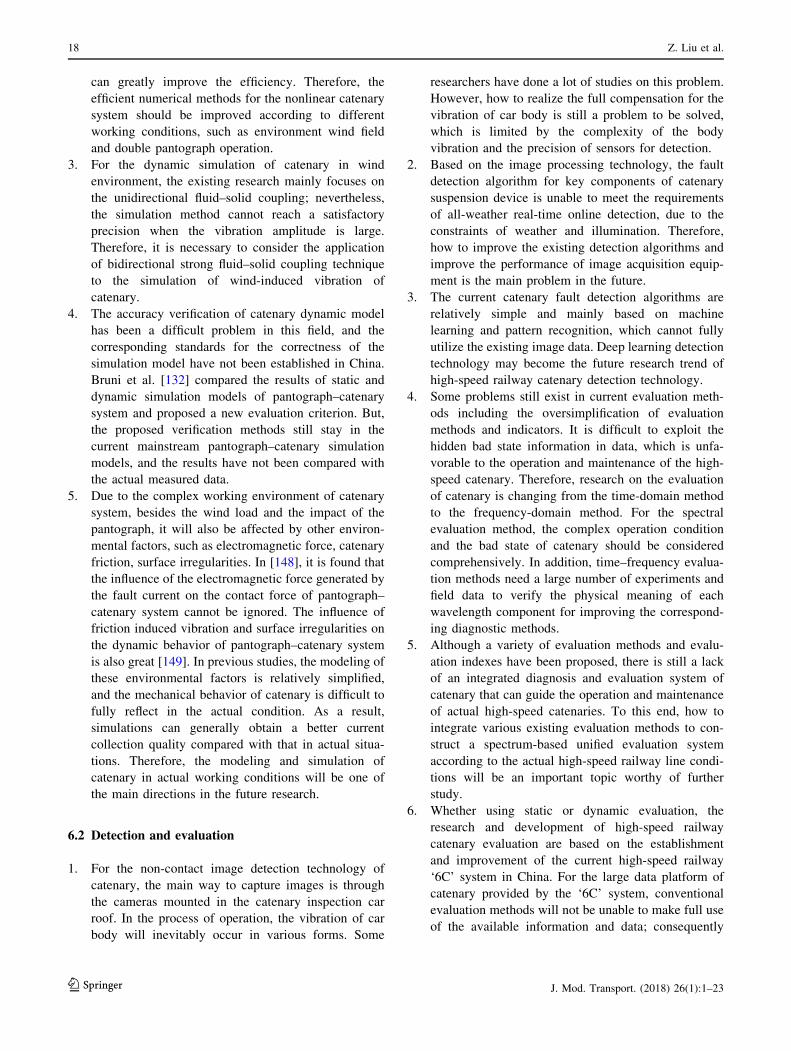
can greatly improve the efficiency. Therefore, the
efficient numerical methods for the nonlinear catenary
system should be improved according to different
working conditions, such as environment wind field
and double pantograph operation.
3. For the dynamic simulation of catenary in wind
environment, the existing research mainly focuses on
the unidirectional fluid–solid coupling; nevertheless,
the simulation method cannot reach a satisfactory
precision when the vibration amplitude is large.
Therefore, it is necessary to consider the application
of bidirectional strong fluid–solid coupling technique
to the simulation of wind-induced vibration of
catenary.
4. The accuracy verification of catenary dynamic model
has been a difficult problem in this field, and the
corresponding standards for the correctness of the
simulation model have not been established in China.
Bruni et al. [132] compared the results of static and
dynamic simulation models of pantograph–catenary
system and proposed a new evaluation criterion. But,
the proposed verification methods still stay in the
current mainstream pantograph–catenary simulation
models, and the results have not been compared with
the actual measured data.
5. Due to the complex working environment of catenary
system, besides the wind load and the impact of the
pantograph, it will also be affected by other environ-
mental factors, such as electromagnetic force, catenary
friction, surface irregularities. In [148], it is found that
the influence of the electromagnetic force generated by
the fault current on the contact force of pantograph–
catenary system cannot be ignored. The influence of
friction induced vibration and surface irregularities on
the dynamic behavior of pantograph–catenary system
is also great [149]. In previous studies, the modeling of
these environmental factors is relatively simplified,
and the mechanical behavior of catenary is difficult to
fully reflect in the actual condition. As a result,
simulations can generally obtain a better current
collection quality compared with that in actual situa-
tions. Therefore, the modeling and simulation of
catenary in actual working conditions will be one of
the main directions in the future research.
6.2 Detection and evaluation
1. For the non-contact image detection technology of
catenary, the main way to capture images is through
the cameras mounted in the catenary inspection car
roof. In the process of operation, the vibration of car
body will inevitably occur in various forms. Some
researchers have done a lot of studies on this problem.
However, how to realize the full compensation for the
vibration of car body is still a problem to be solved,
which is limited by the complexity of the body
vibration and the precision of sensors for detection.
2. Based on the image processing technology, the fault
detection algorithm for key components of catenary
suspension device is unable to meet the requirements
of all-weather real-time online detection, due to the
constraints of weather and illumination. Therefore,
how to improve the existing detection algorithms and
improve the performance of image acquisition equip-
ment is the main problem in the future.
3. The current catenary fault detection algorithms are
relatively simple and mainly based on machine
learning and pattern recognition, which cannot fully
utilize the existing image data. Deep learning detection
technology may become the future research trend of
high-speed railway catenary detection technology.
4. Some problems still exist in current evaluation meth-
ods including the oversimplification of evaluation
methods and indicators. It is difficult to exploit the
hidden bad state information in data, which is unfa-
vorable to the operation and maintenance of the high-
speed catenary. Therefore, research on the evaluation
of catenary is changing from the time-domain method
to the frequency-domain method. For the spectral
evaluation method, the complex operation condition
and the bad state of catenary should be considered
comprehensively. In addition, time–frequency evalua-
tion methods need a large number of experiments and
field data to verify the physical meaning of each
wavelength component for improving the correspond-
ing diagnostic methods.
5. Although a variety of evaluation methods and evalu-
ation indexes have been proposed, there is still a lack
of an integrated diagnosis and evaluation system of
catenary that can guide the operation and maintenance
of actual high-speed catenaries. To this end, how to
integrate various existing evaluation methods to con-
struct a spectrum-based unified evaluation system
according to the actual high-speed railway line condi-
tions will be an important topic worthy of further
study.
6. Whether using static or dynamic evaluation, the
research and development of high-speed railway
catenary evaluation are based on the establishment
and improvement of the current high-speed railway
‘6C’ system in China. For the large data platform of
catenary provided by the ‘6C’ system, conventional
evaluation methods will not be unable to make full use
of the available information and data; consequently
18 Z. Liu et al.
123 J. Mod. Transport. (2018) 26(1):1–23
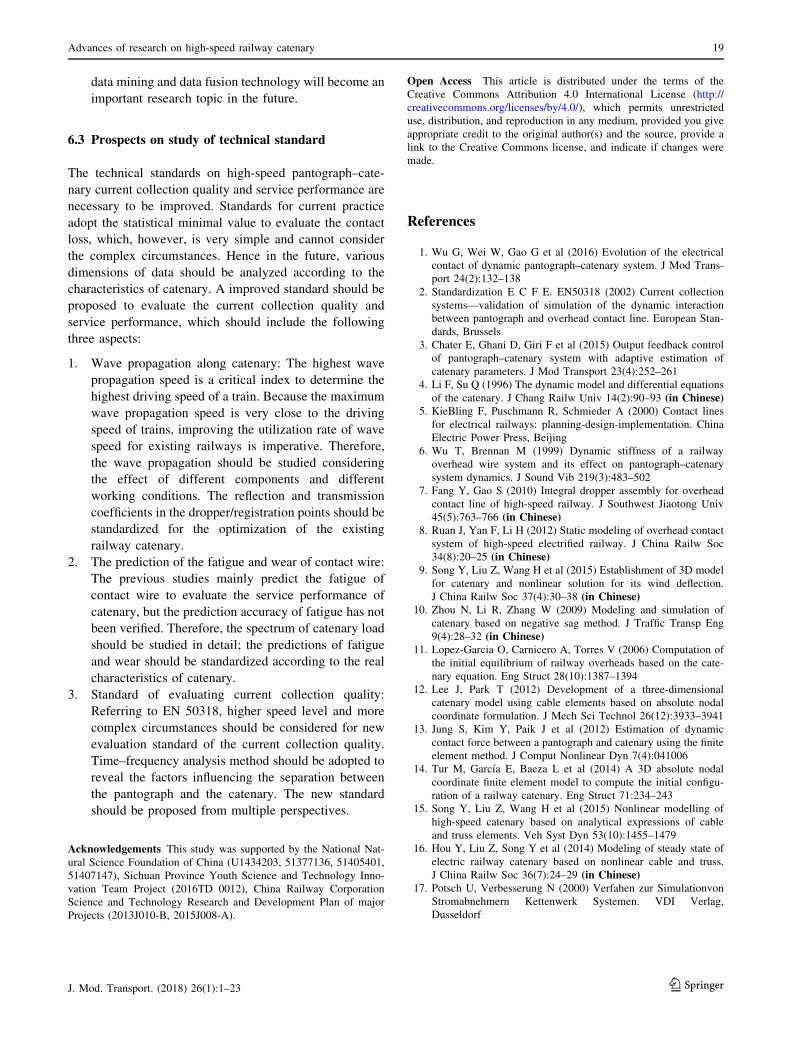
data mining and data fusion technology will become an
important research topic in the future.
6.3 Prospects on study of technical standard
The technical standards on high-speed pantograph–cate-
nary current collection quality and service performance are
necessary to be improved. Standards for current practice
adopt the statistical minimal value to evaluate the contact
loss, which, however, is very simple and cannot consider
the complex circumstances. Hence in the future, various
dimensions of data should be analyzed according to the
characteristics of catenary. A improved standard should be
proposed to evaluate the current collection quality and
service performance, which should include the following
three aspects:
1. Wave propagation along catenary: The highest wave
propagation speed is a critical index to determine the
highest driving speed of a train. Because the maximum
wave propagation speed is very close to the driving
speed of trains, improving the utilization rate of wave
speed for existing railways is imperative. Therefore,
the wave propagation should be studied considering
the effect of different components and different
working conditions. The reflection and transmission
coefficients in the dropper/registration points should be
standardized for the optimization of the existing
railway catenary.
2. The prediction of the fatigue and wear of contact wire:
The previous studies mainly predict the fatigue of
contact wire to evaluate the service performance of
catenary, but the prediction accuracy of fatigue has not
been verified. Therefore, the spectrum of catenary load
should be studied in detail; the predictions of fatigue
and wear should be standardized according to the real
characteristics of catenary.
3. Standard of evaluating current collection quality:
Referring to EN 50318, higher speed level and more
complex circumstances should be considered for new
evaluation standard of the current collection quality.
Time–frequency analysis method should be adopted to
reveal the factors influencing the separation between
the pantograph and the catenary. The new standard
should be proposed from multiple perspectives.
Acknowledgements This study was supported by the National Nat-
ural Science Foundation of China (U1434203, 51377136, 51405401,
51407147), Sichuan Province Youth Science and Technology Inno-
vation Team Project (2016TD 0012), China Railway Corporation
Science and Technology Research and Development Plan of major
Projects (2013J010-B, 2015J008-A).
Open Access This article is distributed under the terms of the
Creative Commons Attribution 4.0 International License (http://
creativecommons.org/licenses/by/4.0/), which permits unrestricted
use, distribution, and reproduction in any medium, provided you give
appropriate credit to the original author(s) and the source, provide a
link to the Creative Commons license, and indicate if changes were
made.
References
1. Wu G, Wei W, Gao G et al (2016) Evolution of the electrical
contact of dynamic pantograph–catenary system. J Mod Trans-
port 24(2):132–138
2. Standardization E C F E. EN50318 (2002) Current collection
systems—validation of simulation of the dynamic interaction
between pantograph and overhead contact line. European Stan-
dards, Brussels
3. Chater E, Ghani D, Giri F et al (2015) Output feedback control
of pantograph–catenary system with adaptive estimation of
catenary parameters. J Mod Transport 23(4):252–261
4. Li F, Su Q (1996) The dynamic model and differential equations
of the catenary. J Chang Railw Univ 14(2):90–93 (in Chinese)5. KieBling F, Puschmann R, Schmieder A (2000) Contact lines
for electrical railways: planning-design-implementation. China
Electric Power Press, Beijing
6. Wu T, Brennan M (1999) Dynamic stiffness of a railway
overhead wire system and its effect on pantograph–catenary
system dynamics. J Sound Vib 219(3):483–502
7. Fang Y, Gao S (2010) Integral dropper assembly for overhead
contact line of high-speed railway. J Southwest Jiaotong Univ
45(5):763–766 (in Chinese)8. Ruan J, Yan F, Li H (2012) Static modeling of overhead contact
system of high-speed electrified railway. J China Railw Soc
34(8):20–25 (in Chinese)9. Song Y, Liu Z, Wang H et al (2015) Establishment of 3D model
for catenary and nonlinear solution for its wind deflection.
J China Railw Soc 37(4):30–38 (in Chinese)10. Zhou N, Li R, Zhang W (2009) Modeling and simulation of
catenary based on negative sag method. J Traffic Transp Eng
9(4):28–32 (in Chinese)11. Lopez-Garcia O, Carnicero A, Torres V (2006) Computation of
the initial equilibrium of railway overheads based on the cate-
nary equation. Eng Struct 28(10):1387–1394
12. Lee J, Park T (2012) Development of a three-dimensional
catenary model using cable elements based on absolute nodal
coordinate formulation. J Mech Sci Technol 26(12):3933–3941
13. Jung S, Kim Y, Paik J et al (2012) Estimation of dynamic
contact force between a pantograph and catenary using the finite
element method. J Comput Nonlinear Dyn 7(4):041006
14. Tur M, Garcıa E, Baeza L et al (2014) A 3D absolute nodal
coordinate finite element model to compute the initial configu-
ration of a railway catenary. Eng Struct 71:234–243
15. Song Y, Liu Z, Wang H et al (2015) Nonlinear modelling of
high-speed catenary based on analytical expressions of cable
and truss elements. Veh Syst Dyn 53(10):1455–1479
16. Hou Y, Liu Z, Song Y et al (2014) Modeling of steady state of
electric railway catenary based on nonlinear cable and truss.
J China Railw Soc 36(7):24–29 (in Chinese)17. Potsch U, Verbesserung N (2000) Verfahen zur Simulationvon
Stromabnehmern Kettenwerk Systemen. VDI Verlag,
Dusseldorf
Advances of research on high-speed railway catenary 19
123J. Mod. Transport. (2018) 26(1):1–23
18. Finner L, Poetsch G, Sarnes B et al (2015) Program for cate-
nary–pantograph analysis, PrOSA statement of methods and
validation according EN 50318. Veh Syst Dyn 53(3):305–313
19. Ambrosio J, Rauter F, Pombo J et al (2010) Dynamics of high-
speed train pantograph–catenary co-simulation of finite element
and multibody codes. In: Proceedings of the international sym-
posium on computational mechanics and the 12th international
conference on the enhancement and promotion of computational
methods in engineering and science, vol 1233, no 1. AIP Pub-
lishing, Melville, pp 213–218
20. Antunes P, Mosca A, Ambrosio J et al (2012) Development of a
computational tool for the dynamic analysis of the pantograph–
catenary interaction for high-speed trains. In: Proceedings of the
11th international conference on computational structures tech-
nology. Civil-Comp Press, Stirlingshire
21. Ambrosio J, Pombo J, Rauter F et al (2009) A memory based
communication in the co-simulation of multibody and finite
element codes for pantograph–catenary interaction simulation.
In: Bottasso CL (ed) Multibody dynamics, vol 12. Springer,
Dordrecht, pp 231–252
22. Rauter F, Pombo J, Ambrosio J et al (2007) Contact model for the
pantograph–catenary interaction. J Syst Des Dyn 1(3):447–457
23. Ambrosio J, Pombo J, Pereira M et al (2012) Recent develop-
ments in pantograph–catenary interaction modelling and analy-
sis. Int J Railw Technol 1(1):249–278
24. Ambrosio J, Pombo J, Pereira M et al (2012) A computational
procedure for the dynamic analysis of the catenary–pantograph
interaction in high-speed trains. J Theor Appl Mech 50(3):681–699
25. Rauter F, Pombo J, Ambrosio J et al (2007) Multibody modeling
of pantographs for pantograph-catenary interaction. In: IUTAM
symposium on multiscale problems in multibody system con-
tacts, vol 1. Springer, Dordrecht, pp 205–226
26. Ambrosio J, Rauter F, Pombo J et al (2011) A flexible multibody
pantograph model for the analysis of the catenary–pantograph
contact. In: Arczewski K, Blajer W, Fraczek J, Wojtyra M (eds)
Multibody dynamics, vol 23. Springer, Dordrecht, pp 1–27
27. Ambrosio J, Pombo J, Pereira M (2013) Optimization of high-
speed railway pantographs for improving pantograph–catenary
contact. Theor Appl Mech Lett 3(1):013006
28. Cho Y, Lee K, Park Y et al (2010) Influence of contact wire pre-
sag on the dynamics of pantograph–railway catenary. Int J Mech
Sci 52(11):1471–1490
29. Cho Y (2008) Numerical simulation of the dynamic responses of
railway overhead contact lines to a moving pantograph, con-
sidering a nonlinear dropper. J Sound Vib 315(3):433–454
30. Andersson E, Froidh O, Stichel S et al (2014) Green train:
concept and technology overview. Int J Rail Transp 2(1):2–16
31. Liu Z, Jonsson PA, Stichel S et al (2014) Implications of the
operation of multiple pantographs on the soft catenary systems in
Sweden. Proc Inst Mech Eng F J Rail 230(3):0954409714559317
32. Facchinetti A, Bruni S (2012) Hardware-in-the-loop hybrid
simulation of pantograph–catenary interaction. J Sound Vib
331(12):2783–2797
33. Bruni S, Bucca G, Collina A et al (2012) Numerical and hardware-
in-the-loop tools for the design of very high speed pantograph–
catenary systems. J Comput Nonlinear Dyn 7(4):041013
34. Van Vo O, Massat JP, Laurent C et al (2014) Introduction of
variability into pantograph–catenary dynamic simulations. Veh
Syst Dyn 52(10):1254–1269
35. Massat J, Laine J, Bobillot A (2006) Pantograph–catenary
dynamics simulation. Veh Syst Dyn 44(sup1):551–559
36. Massat J, Laurent C, Bianchi J et al (2014) Pantograph catenary
dynamic optimisation based on advanced multibody and finite
element co-simulation tools. Veh Syst Dyn 52(sup1):338–354
37. Carnicero A, Lopez-Garcia O, Torres V et al (2006) An algo-
rithm based on finite element method and catenary equation to
compute the initial equilibrium of railway overhead. Paper
presented at 8th international conference on computational
structures technology, Las Palmas de Gran Canaria (Espana),
12–15 Sept 2006
38. Lopez-Garcia O, Carnicero A, Marono J (2007) Influence of
stiffness and contact modelling on catenary–pantograph system
dynamics. J Sound Vib 299(4):806–821
39. Carnicero A, Jimenez-Octavio J, Sanchez-Rebollo C et al (2012)
Influence of track irregularities in the catenary–pantograph
dynamic interaction. J Comput Nonlinear Dyn 7(4):041015
40. Jimenez-Octavio J, Carnicero A, Sanchez-Rebollo C et al (2015)
A moving mesh method to deal with cable structures subjected
to moving loads and its application to the catenary–pantograph
dynamic interaction. J Sound Vib 349:216–229
41. Yamashita Y, Ikeda M (2012) Advanced active control of
contact force between pantograph and catenary for high-speed
trains. Q Rep RTRI 53(1):28–33
42. Ikeda M, Nagasaka S, Takayuki A (2001) A precise contact
force measuring method for overhead catenary system. In:
WCRR 2001
43. Usuda T, Ikeda M, Yamashita Y (2011) Method for detecting
step-shaped wear on contact strips by measuring catenary
vibration. Q Rep RTRI 52(4):237–243
44. Alberto A, Benet J, Arias E et al (2008) A high performance tool
for the simulation of the dynamic pantograph–catenary inter-
action. Math Comput Simul 79(3):652–667
45. Benet J, Cuartero N, Cuartero F et al (2013) An advanced 3D-
model for the study and simulation of the pantograph catenary
system. Transp Res C Emerg Technol 36:138–156
46. Seo J, Kim S, Jung I et al (2006) Dynamic analysis of a pan-
tograph–catenary system using absolute nodal coordinates. Veh
Syst Dyn 44(8):615–630
47. Lee J, Park T, Oh H et al (2015) Analysis of dynamic interaction
between catenary and pantograph with experimental verification
and performance evaluation in new high-speed line. Veh Syst
Dyn 53(8):1117–1134
48. Shabana A, Zaazaa K, Sugiyama H (2007) Railroad vehicle
dynamics: a computational approach. CRC Press, Boca Raton
49. Garcıa-Vallejo D, Mayo J, Escalona J et al (2004) Efficient
evaluation of the elastic forces and the Jacobian in the absolute
nodal coordinate formulation. Nonlinear Dyn 35(4):313–329
50. Mei G (2010) The dynamic study of pantograph/catenary sys-
tem. Thesis, Southwest Jiaotong University Graduate
51. Zhang W, Liu Y, Mei G (2006) Evaluation of the coupled
dynamical response of a pantograph–catenary system: contact
force and stresses. Veh Syst Dyn 44(8):645–658
52. Liu Y, Zhang W, Mei G (2003) Study of dynamic stress of the
catenary in the pantograph/catenary vertical coupling move-
ment. J China Railw Soc 25(4):23–26 (in Chinese)53. Zhang W, Mei G, Wu X et al (2005) A study on dynamic
behaviour of pantographs by using hybrid simulation method.
Proc Inst Mech Eng F J Rail 219(3):189–199
54. Zhang W, Mei G, Wu X et al (2002) Hybrid simulation of
dynamics for the pantograph–catenary system. Veh Syst Dyn
38(6):393–414
55. Mei G, Zhang W (2003) Study on dynamics of rigid suspension
catenary. J China Railw Soc 25(2):24–29 (in Chinese)56. Mei G, Zhang W, Zhao H et al (2006) A hybrid method to
simulate the interaction of pantograph and catenary on overlap
span. Veh Syst Dyn 44(sup1):571–580
57. Zhang W, Mei G, Chen L (2000) Analysis of the influence of
catenary’s sag and irregularity upon the quality of current-
feeding. J China Railw Soc 22(6):50–54 (in Chinese)58. Jiang Y, Zhang W, Song D (2015) Study on the contact wire
unevenness of high-speed railway. J China Railw Soc
37(2):34–38 (in Chinese)
20 Z. Liu et al.
123 J. Mod. Transport. (2018) 26(1):1–23
59. Zhigang Liu, Song Y, Liu Y (2015) Aeolian vibration charac-
teristics of electrified high-speed railway catenary. J Southwest
Jiaotong Univ 50(1):1–6 (in Chinese)60. Liu Z, Han Z, Hou Y et al (2013) Modified formula of wave
motion velocity of catenary inclusive of air damping. J China
Railw Soc 35(1):41–45 (in Chinese)61. Liu Y, Liu Z, Song Y et al (2014) Simulation calculation and wind
tunnel test of static aerodynamic parameters of high-speed railway
contact line. J China Railw Soc 36(5):33–38 (in Chinese)62. Wang H, Liu Z, Song Y et al (2015) Aerodynamic parameters
simulation and wind-induced vibration responses of contact wire
of high-speed railway. J Vib Shock 34(6):6–12 (in Chinese)63. Xie Q, Wang W, Li H (2013) Wind tunnel test on the aerody-
namic characteristics of contact wire for high-speed railway.
China Railw Sci 6:75–82 (in Chinese)64. Xie Q, Wang W, Zhang H et al (2014) Wind tunnel test on
aerodynamic force characteristics of ice coating contact wire for
high-speed railway. China Railw Sci 35(1):78–85 (in Chinese)65. Zhang J, Liu Z, Lu X et al (2015) Study on aerodynamics
development of high-speed pantograph and catenary. J China
Railw Soc 37(1):7–14 (in Chinese)66. Liu Z, Hou Y, Han Z et al (2013) Analysis on dynamic char-
acteristics of high-speed railway catenary based on wind field
simulation. J China Railw Soc 35(11):21–28 (in Chinese)67. Pombo J, Ambrosio J, Pereira M et al (2009) Influence of the
aerodynamic forces on the pantograph–catenary system for
high-speed trains. Veh Syst Dyn 47(11):1327–1347
68. Pombo J, Ambrosio J (2013) Environmental and track pertur-
bations on multiple pantograph interaction with catenaries in
high-speed trains. Comput Struct 124:88–101
69. Zhao F, Liu Z, Han Z (2012) Simulation study on influence of
stochastic wind field to dynamic behavior of pantograph–cate-
nary system. J China Railw Soc 34(10):36–42 (in Chinese)70. Li R, Zhou N, Zhang W et al (2013) Fluctuating wind field and
wind-induced vibration response of catenary based on AR
model. J Traffic Transp Eng 13(4):56 (in Chinese)71. Cao S, Deng B, Ma S et al (2011) Fatigue reliability analysis of
contact wire under wind load. Mech Sci Technol 30(10):
1664–1668 (in Chinese)72. Song Y, Liu Z, Wang H et al (2014) Influence of high-speed
railway catenary buffeting on pantograph–catenary current col-
lection under fluctuating wind. J China Railw Soc 36(6):27–34
(in Chinese)73. Song Y, Liu Z, Wang H et al (2016) Nonlinear analysis of wind-
induced vibration of high-speed railway catenary and its influence
on pantograph–catenary interaction. Veh Syst Dyn 54(6):723–747
74. Song Y, Liu Z, Duan F et al (2017) Study on wind-induced
vibration behavior of railway catenary in spatial stochastic wind
field based on nonlinear finite element procedure. J Vib Acoust
140:011010
75. Han Z, Liu Z, Zhang G et al (2013) Overview of non-contact
image detection technology for pantograph–catenary monitor-
ing. J China Railw Soc 35(06):40–47 (in Chinese)76. Chen T, Xiao J (2005) The study of a new type of overhead
contact system deviation detecting method based on neural
networks. Paper presented at 2005 China intelligent automation
conference, Qingdao, China
77. Pan X, Zhang Y, Meng F et al (2011) Photo-electronic mea-
surement system on geometry parameter of electric locomotive
contact wire. Instrum Tech Sens 3:38–41 (in Chinese)78. Liu Y, Han T, Liu H (2012) Study on OCS dynamic geometric
parameters detection based on image processing. Railw Loco-
mot Car 32(5):86–91 (in Chinese)79. Zhang G, Ling C, Wang X et al (2014) Image detection system
design for geometry parameters of contact line. J Tianjin Poly-
tech Univ 33(5):57–62 (in Chinese)
80. He H (2013) High speed railway operation safety supervising
and monitoring technology. China Railw 03:1–7 (in Chinese)81. Zhang D, Yu L, Jian Xiao et al (2014) Study on high-speed and
dynamic vision measurement approach for overhead catenary
system geometric parameter inspection. Chin J Sci Instrum
35(08):1852–1859 (in Chinese)82. Shi Y, Liu C, Guo Y et al (2014) Measurement system of
geometric parameters for overhead line system based on
binocular vision. Infrared Laser Eng 06:1936–1942 (in Chinese)83. Zhang G, Liu Z, Liu W et al (2014) Non-contact detection of
conductor height & stagger of contact line based on camera
calibration. J China Railw Soc 36(3):25–30 (in Chinese)84. Liu W, Liu Z, Geng X et al (2015) Research on detection
method for geometrical parameters of catenary system based on
mean shift and particle filter algorithm. J China Railw Soc
37(11):30–36 (in Chinese)85. Liu W, Liu Z, Zhang G et al (2014) Correction of detected
values of catenary geometric parameters based on camera cali-
bration and Kalman filtering. J China Railw Soc 36(09):28–33
(in Chinese)86. Wang Y, You C, Liu B (2014) Catenary geometrical parameter
detection method based on machine vision technology.
J Lanzhou Jiaotong Univ 01:192–195 (in Chinese)87. Zhang D, Yu L, Xiao J et al (2013) Computer vision approach to
conductor rail detecting vehicle vibration compensation method
and its application. J China Railw Soc 35(01):25–30 (in Chinese)88. Fan H, Bian C, Zhu T et al (2010) Automatic detection of
position line in contactless overhead contact system. J Comput
Appl 12:102–103 (in Chinese)89. Duan R, Zhao W, Huang S et al (2011) Method for high-speed
corner detection based on the fuzzy ID3 decision tree. J Ts-
inghua Univ (Sci Technol) 51(12):1787–1791 (in Chinese)90. Zhang T, Hao K, Duan R (2013) Dynamic detection algorithm
of slope gradient of catenary locator based on computer vision
technology. Railw Stand Des 01:105–108 (in Chinese)91. Zhang Q, Yu L (2013) The application of computer vision in
steady arm slope identification. Paper presented at high-speed
railway catenary fitting safety and reliability technology, Baoji,
China
92. Yu B, Chen T, Yu L et al (2014) Locator slope detection based
on Hough transform in image processing. Urban Mass Transit
17(05):32–36 (in Chinese)93. Wang X, Wu J, Xu K et al (2014) Identification of OCS locator
based on AdaBoost algorithm. High Speed Railw Technol
5(3):9–12 (in Chinese)94. Peng C, Gao X (2007) Foreign catenary wire wearing detection
system. Chin Railw 4:66–68 (in Chinese)95. Qing L, Gao X (2005) Application of linear CCD on the wear
measurement of contact wire. Locomot Roll Stock Technol
4:011 (in Chinese)96. Pan X, Zhang Y, Meng F et al (2011) Photo-electronic mea-
surement system on geometry parameter of electric locomotive
contact wire. Instrum Technol Sens 03:38–40 (in Chinese)97. Wang F, Gu G (2014) Research on catenary abrasion image
enhancement based on curvelet transform. Railw Stand Des
2:112–116 (in Chinese)98. Zhou W (2012) Wind-deviation detection technique and
numerical simulation research of railway catenary in wind area.
Central South University, Changsha
99. Zhou W, Tian H (2013) An intensity-adaptive color image
segmentation based on contrast stretching and its application in
visual detection of catenary wind-deviation. J Cent South Univ
(Sci Technol) 44(04):1708–1713 (in Chinese)100. Zhang Z, Yu L, Chen T et al (2013) A study on the contami-
nation overhead contact line system insulators based on grey
relational analysis. Insul Surge Arresters 6:001 (in Chinese)
Advances of research on high-speed railway catenary 21
123J. Mod. Transport. (2018) 26(1):1–23
101. Xie D, Sun Z (2014) The application of image recognition
technology in catenary suspension status detection. Electr Railw
2:34–36 (in Chinese)102. Zhang G, Liu Z, Han Y et al (2013) A fast fuzzy matching
method of fault detection for rod insulators of high-speed rail-
ways. J China Railw Soc 35(05):27–33 (in Chinese)103. Han Z, Liu Z, Yang H et al (2013) Insulator fault detection
based on curvelet coefficients morphology and zonal energy
method. J China Railw Soc 35(3):36–40
104. Yang H, Liu Z, Han Z et al (2013) Foreign body detection
between insulator pieces in electrified railway based on affine
moment invariant. J China Railw Soc 35(04):30–36 (inChinese)
105. Zhang G, Liu Z (2014) Fault detection of catenary insulator
damage/foreign material based on corner matching and spectral
clustering. Chin J Sci Instrum 35(6):1370–1377 (in Chinese)106. Yang H, Liu Z, Han Y et al (2013) Defective condition detection of
insulators in electrified railway based on feature matching of
speeded-up robust features. Power Syst Technol 37(8):2297–2302
(in Chinese)107. Han Y, Liu Z, Han Z et al (2014) Fracture detection of ear
pieces of catenary support devices of high-speed railway based
on SIFT feature matching. J China Railw Soc 36(2):31–36 (inChinese)
108. Zhong J, Liu Z, Zhang G et al (2017) Defective condition
detection of swivel clevis pins in overhead contact system of
high-speed railway. J China Railw Soc 39(6):65–71
109. Yang H, Liu Z (2016) Defective condition detection of rotary
double ears of support device in electrified railway based on
feature matching of SURF. J China Railw Soc 38(8):28–34
110. Han Y, Liu Z, Geng X et al (2017) Fracture detection of ear
pieces in catenary support devices of high-speed railway based
on HOG features and two-dimensional Gabor transform. J China
Railw Soc 39(2):52–57
111. Chen J, Liu Z, Wang H et al (2017) Automatic defect detection
of fasteners on the catenary support device using deep convo-
lutional neural network. IEEE Trans Instrum Meas (in press)
112. Zhang G, Liu Z, Han Y et al (2017) High-speed railway catenary
messenger wire bracket recognition and missing fault detection.
J China Railw Soc 39(5):40–46 (in Chinese)113. Ohta M (2005) Level crossings obstacle detection system using
stereo cameras. Q Rep RTRI 46(2):110–117
114. Tong L, Zhu L, Yu Z et al (2012) Railway obstacle detection
using onboard forward-viewing camera. J Transp Syst Eng Inf
Technol 12(4):79–83 (in Chinese)115. Dong H, Ge D, Qin Y et al (2010) Research on railway invasion
detection technology based on intelligent video analysis. China
Railw Sci 31(2):121–125
116. Li J, Chen Z, Wang M (2013) Moving target real-time detection
of railway intrusion. J Railw Sci Eng 10(6):116–120
117. Aydin I, Karakose M, Akin E (2013) A robust anomaly detec-
tion in pantograph–catenary system based on mean-shift track-
ing and foreground detection. Proc IEEE Int Conf Syst Man
Cybern 8215(2):4444–4449
118. Tang P, Jin W, Chen L (2014) Visual abnormality detection
framework for train-mounted pantograph headline surveillance.
In: 17th IEEE international conference on intelligent trans-
portation systems, pp 847–852
119. Wang Q, Liang X, Liu Y et al (2014) Visual detection method
for the invasion of slowly changing foreign matters to railway
lines. China Railw Sci 35(3):137–143 (in Chinese)120. Shi H, Chai H, Wang Y et al (2015) Study on railway embedded
detection algorithm for railway intrusion based on object
recognition and tracking. J China Railw Soc 37(7):58–65 (inChinese)
121. Wu J (2010) Pantograph and Catenary System. Southwest
Jiaotong University Press, Chengdu (in Chinese)122. Carnevale M, Collina A (2016) Processing of collector accel-
eration data for condition-based monitoring of overhead lines.
Proc Inst Mech Eng F J Rail 230(2):472–485
123. Boffi P, Cattaneo G, Amoriello L et al (2009) Optical fiber
sensors to measure collector performance in the pantograph–
catenary interaction. IEEE Sens J 9(6):635–640
124. Aboshi M, Manabe K (2000) Analyses of contact force fluctu-
ation between catenary and pantograph. Q Rep RTRI
41(4):182–187
125. Collina A, Fossati F, Papi M et al (2007) Impact of overhead
line irregularity on current collection and diagnostics based on
the measurement of pantograph dynamics. Proc Inst Mech Eng F
J Rail 221(4):547–559
126. Bucca G, Collina A (2009) A procedure for the wear prediction
of collector strip and contact wire in pantograph–catenary sys-
tem. Wear 266(1):46–59
127. Bohol F, Yi H (1995) Study on the high-speed technology of the
shinkansen current collection system. Electr Tract Lett 10:20–25
128. Aboshi M (2004) Precise measurement and estimation method
for overhead contact line unevenness. IEEE Trans Ind Appl
124:871–877
129. Huan R, Jiao J, Su G et al (2012) Dynamics of pantograph–
catenary coupled system with contact wire vertical irregularities.
J China Railw Soc 34(7):15–21 (in Chinese)130. Xie J, Liu Z, Han Z et al (2009) Pantograph and overhead
contact line coupling dynamic model simulation and analysis of
imbalance of overhead contact line. Electr Railw 6:010 (inChinese)
131. Liu Z, Han Z (2011) Review of researches on catenary spectrum
in electrified railway. Electr Railw 1:1–3 (in Chinese)132. Liu Z, Han Z (2013) Study on electrical railway catenary line
spectrum based on AR model. J China Railw Soc 35(12):24–29
(in Chinese)133. Bruni S, Ambrosio J, Carnicero A et al (2015) The results of the
pantograph–catenary interaction benchmark. Veh Syst Dyn
53(3):412–435
134. Kim J, Chae H, Park B et al (2007) State sensitivity analysis of
the pantograph system for a high-speed rail vehicle considering
span length and static uplift force. J Sound Vib 303(3):405–427
135. Wang H, Liu Z, Han Z et al (2014) Feature extraction of pan-tograph–catenary contact force power spectrum of electrified
railway. J China Railw Soc 36(11):23–28 (in Chinese)136. Kusumi S, Fukutani T, Nezu K (2006) Diagnosis of overhead
contact line based on contact force. Q Rep RTRI 47(1):39–45
137. Rønnquist A, Navik P (2015) Dynamic assessment of existing
soft catenary systems using modal analysis to explore higher
train velocities: a case study of a Norwegian contact line system.
Veh Syst Dyn 53(6):756–774
138. Kudo S, Honda S, Ikeda M (2002) Contact force signal analysis of
current collecting with bispectrum and wavelet. In: Proceedings of
the 41st SICE annual conference, vol 4, pp 2478–2482
139. Kim J (2007) An experimental study of the dynamic charac-
teristics of the catenary–pantograph interface in high speed
trains. J Mech Sci Technol 21(12):2108–2116
140. Han Z (2013) The dynamic characteristics assessment of high-
speed catenary–pantograph based on modern spectrum analysis
and intelligent fault image identification. Southwest Jiaotong
University, Chengdu
141. Han Z, Liu Z, Zhang X et al (2013) Pantograph–catenary contact
force data analysis based on data correlation decomposed by
EEMD. J China Railw Soc 35(9):25–30 (in Chinese)142. Wang H, Liu Z, Song Y (2015) Analysis on wavelength com-
ponents in pantograph–catenary contact force of electric railway
22 Z. Liu et al.
123 J. Mod. Transport. (2018) 26(1):1–23

based on multiple EEMD. J China Railw Soc 37(5):34–41 (inChinese)
143. Usuda T (2007) Estimation of wear and strain of contact wire
using contact force of pantograph. Q Rep RTRI 48(3):170–175
144. Mariscotti A, Marrese A, Pasquino N et al (2013) Time and
frequency characterization of radiated disturbance in telecom-
munication bands due to pantograph arcing. Measurement
46(10):4342–4352
145. Zhang X (2013) The analysis of contact force between the
pantograph and contact line in electrified railway via signal
processing methods. Southwest Jiaotong University, Chengdu
146. Wang H, Liu Z, Song Y (2016) Time–frequency analysis of
pantograph–catenary contact force and contact wire irregularity
in high-speed railway based on ZAMD. J China Railw Soc
38(1):41–47 (in Chinese)147. Liu Z, Wang H, Dollevoet R et al (2016) Ensemble EMD-based
automatic extraction of the catenary structure wavelength from
the pantograph–catenary contact force. IEEE Trans Instrum
Meas 65(10):2272–2283
148. Zhao Y, Wu G, Gao G et al (2014) Study on electromagnetic
force of pantograph–catenary system. J China Railw Soc
36(10):28–32 (in Chinese)149. Qian W, Chen G, Zhang W et al (2013) Friction-induced, self-
excited vibration of a pantograph–catenary system. J Vib Acoust
135(5):521–523
Advances of research on high-speed railway catenary 23
123J. Mod. Transport. (2018) 26(1):1–23