Embed Size (px)
Citation preview
Advances in Water Resources 105 (2017) 82–95
Contents lists available at ScienceDirect
Advances in Water Resources
journal homepage: www.elsevier.com/locate/advwatres
Multiscale modelling of dual-porosity porous media; a computational
pore-scale study for flow and solute transport
Enno T. de Vries a , Amir Raoof a , ∗, Martinus Th. van Genuchten
a , b
a Department of Earth Sciences, Utrecht University, Utrecht, The Netherlands b NIDES Interdisciplinary Center for Social Development, Federal University of Rio de Janeiro, Rio de Janeiro, Brazil
a r t i c l e i n f o
Article history:
Received 8 December 2016
Revised 18 April 2017
Accepted 19 April 2017
Available online 20 April 2017
Keywords:
Pore network model
Aggregated soil
Dual-porosity
Solute transport
Mobile-immobile transport model
a b s t r a c t
Many environmental and agricultural applications involve the transport of water and dissolved con-
stituents through aggregated soil profiles, or porous media that are structured, fractured or macrop-
orous in other ways. During the past several decades, various process-based macroscopic models have
been used to simulate contaminant transport in such media. Many of these models consider advective-
dispersive transport through relatively large inter-aggregate pore domains, while exchange with the
smaller intra-aggregate pores is assumed to be controlled by diffusion. Exchange of solute between the
two domains is often represented using a first-order mass transfer coefficient, which is commonly ob-
tained by fitting to observed data. This study aims to understand and quantify the solute exchange term
by applying a dual-porosity pore-scale network model to relatively large domains, and analysing the pore-
scale results in terms of the classical dual-porosity (mobile-immobile) transport formulation.
We examined the effects of key parameters (notably aggregate porosity and aggregate permeability)
on the main dual-porosity model parameters, i.e., the mobile water fraction ( φm ) and the mass transfer
coefficient ( α). Results were obtained for a wide range of aggregate porosities (between 0.082 and 0.700).
The effect of aggregate permeability was explored by varying pore throat sizes within the aggregates. So-
lute breakthrough curves (BTCs) obtained with the pore-scale network model at several locations along
the domain were analysed using analytical solutions of the dual-porosity model to obtain estimates of
φm and α. An increase in aggregate porosity was found to decrease φm and increase α, leading to con-
siderable tailing in the BTCs. Changes in the aggregate pore throat size affected the relative flow velocity
between the intra- and inter-aggregate domains. Higher flow velocities within the aggregates caused a
change in the transport regime from diffusion dominated to more advection dominated. This change in-
creased the exchange rate of solutes between the mobile and immobile domains, with a related increase
in the value of the mass transfer coefficient and less tailing in the BTCs.
© 2017 The Authors. Published by Elsevier Ltd.
This is an open access article under the CC BY license. ( http://creativecommons.org/licenses/by/4.0/ )
2
c
d
a
h
b
Š
s
m
i
a
1. Introduction
Soil and groundwater pollution by a broad range of indus-
trial and agricultural contaminants is an ever-increasing problem
worldwide. One issue exacerbating effective management of the
subsurface is the problem of preferential flow of surface ap-
plied chemicals such as fertilizers, pesticides, trace elements and
pathogenic microorganisms. Much evidence exists that preferential
flow through especially the vadose zone is contributing to sur-
face and subsurface pollution problems (e.g., Flury et al., 1994;
Abbaspour et al., 2001; Hendrickx and Flury, 2001; Allaire et al.,
2009, Vogel et al., 2010 ; Zhang et al., 2013; Mahmoodlu et al.,
∗ Corresponding author.
E-mail address: [email protected] (A. Raoof).
a
a
s
d
http://dx.doi.org/10.1016/j.advwatres.2017.04.013
0309-1708/© 2017 The Authors. Published by Elsevier Ltd. This is an open access article u
013, 2014 ). In attempts to describe and quantify the basic pro-
esses leading to preferential flow, a large number of dual-porosity,
ual-permeability, multi-porosity and multi-permeability models
nd related approaches have been developed and verified. Compre-
ensive reviews of alternative modelling approaches are provided
y NRC (2001), Šim ̊unek et al. (2003), Gerke (2006), Jarvis (2007),
imunek and van Genuchten (2008) and Köhne et al. (2009) .
A commonality of many preferential flow models is the as-
umption that the liquid phase can be divided into relatively
obile and immobile parts representing the macropore (or
nter-aggregate or fracture) domain, and the micropore (or intra-
ggregate or soil matrix) domain, respectively, together with
ppropriate coupling terms to account for the exchange of water
nd/or dissolved constituents between the two domains. The
implest formulation arises when no flow occurs in the micropore
omain, and a first-order macropore/micropore solute exchange
nder the CC BY license. ( http://creativecommons.org/licenses/by/4.0/ )
E.T. de Vries et al. / Advances in Water Resources 105 (2017) 82–95 83
t
m
W
φ
w
r
c
t
fi
e
p
i
p
p
t
T
m
c
e
s
t
b
o
i
s
a
s
r
T
1
l
f
m
D
t
a
E
J
v
s
m
t
t
m
s
v
o
I
a
o
t
p
i
c
t
o
a
t
w
w
o
t
a
t
B
o
(
m
o
t
p
t
t
z
t
t
i
a
p
b
2
n
n
w
n
v
a
a
fl
W
c
m
2
d
t
a
s
m
a
(
i
q
M
u
P
a
(
s
l
a
p
v
i
2
u
o
p
e
s
2
erm is used, to lead to mobile-immobile (MIM) type dual-porosity
odels of the form ( Coats and Smith, 1964; van Genuchten and
ierenga, 1976 ):
m
θ∂ ̄c m
∂t = φm
θD m
∂ 2 c̄ m
∂ x 2 − q
∂ ̄c m
∂x − α( ̄c m
− c̄ im
) (1)
(1 − φm
) θ∂ ̄c im
∂t = α( ̄c m
− c̄ im
) (2)
here the subscripts m and im refer to the mobile and immobile
egion, c̄ is the average concentration, θ is the volumetric water
ontent, φm
is the mobile water fraction defined as θm
/ θ , D m
is
he dispersion coefficient, q is the volumetric fluid flux, and α is a
rst-order mass transfer coefficient.
The dual-porosity model given by Eqs. (1) and (2) involves sev-
ral assumptions, the most important being that advective trans-
ort in the smaller intra-aggregate pores can be neglected. This
mplies that the overall pore water velocity distribution within the
orous medium is approximated by the step function, with one
art of the medium having an average pore water velocity equal
o v m
= q/ θm
, while water in the other part is completely stagnant.
his assumption is generally not met since the intra-aggregate (soil
atrix) region often has some non-zero permeability, even if small
ompared to the inter-aggregate (or fracture) region.
Another simplifying assumption of Eqs. (1) and (2) is that solute
xchange between the mobile and immobile regions can be de-
cribed using a quasi-empirical first-order rate term proportional
o the difference between the average concentrations of the mo-
ile and immobile regions. Various attempts have been made to
btain a more physical basis of the mass transfer coefficient, α,
n terms of such parameters as the diffusion coefficient and the
hape and size of the aggregates or soil matrix. This has led to
number of analytical models that explicitly considered diffu-
ion from the inter-aggregate region into immobile intra-aggregate
egions of various shapes (e.g., Rasmuson and Neretnieks, 1980;
ang et al., 1981; Sudicky and Frind, 1982; van Genuchten et al.,
984; van Genuchten, 1985 ). These and related studies also al-
owed derivation of approximate relationship for the mass trans-
er coefficient, including through the use of Laplace transforms or
oment analyses, as exemplified in studies by van Genuchten and
alton (1986), Bolt (1979), Barker (1985), van Genuchten and Dal-
on (1985), Parker and Valocchi (1986), Goltz and Roberts (1987) ,
nd Hantush and Marino (1988) .
Another approach for estimating the parameters φm
and α in
qs. (1) and (2) is by direct measurement (e.g., Clothier et al., 1992;
aynes and Shao, 1999 ), or by analyzing a large number of pre-
iously published data such as shown by Maraqa (2001) . A latter
tudy revealed an approximately linear relationship between the
ass transfer coefficient and the residence time of the solute in
he transport domain ( Pontedeiro et al., 2010 ).
Both of the above assumptions (i.e., negligible advection within
he aggregates, and the use of a first-order exchange term) require
ore research. This includes how best to account for aggregate
hape and size, which are known to vary widely and may involve
arious spherical, blocky, columnar, and prismatic geometries,
r mixtures thereof (e.g., Tisdall and Oades, 1982; Hillel, 2003 ).
maging techniques can be of great value for determining the size
nd shapes of aggregates, and hence can reduce the dependency
n using idealized shapes ( Bultreys et al., 2015, 2016 ). The mass
ransfer coefficient is, in actuality, a more complex integrated
arameter whose value depends on many porous media character-
stics including pore and aggregate geometry, the solute diffusion
oefficient, the intra-aggregate permeability, the relative magni-
ude of the mobile and immobile region, as well as the dynamics
f the overall system such as the concentration gradients and the
pplied flow velocity. At relatively low pore water velocities, the
ime scale of solute diffusion into aggregates may be comparable
ith the transport time scale within the macropore domain, in
hich case a larger fraction of the solutes may diffuse into or out
f the aggregates, thus limiting any tailing in observed BTCs. At
he other extreme, at relatively high pore water velocities, macro-
nd micro-pores may become essentially disconnected, leading
o negligible solute exchange and possibility of dual peaks in the
TCs ( Zhou et al., 2014 ).
The value of the mass transfer coefficient, α, is commonly
btained by fitting macroscopic models to observed solute BTCs
Toride et al., 1995 ). Since BTCs often show tailing, this approach
ay be very time-consuming in terms of getting appropriate res-
lution in the data. Moreover, the BTC data then provide informa-
ion only of the macroscopic concentrations at selected observation
oints within the medium, or from column outflow experiments,
hus providing little insight into the internal concentration dis-
ributions and interactions between the mobile and immobile
ones. This makes it difficult to estimate contribution of different
ransport processes into the BTCs and extrapolate such BTC data
o other transport regimes. Methods are hence needed to provide
nformation in a systematic manner about the internal state of
ggregated media, including quantification of the basic transport
rocesses operating at the microscopic level. An alternative would
e to obtain the BTCs using pore scale modelling ( Raoof et al.,
010; Raoof and Hassanizadeh, 2013 ). For transport in unsaturated
on-aggregated media, Raoof and Hassanizadeh (2013) used pore
etwork modelling to obtain several BTCs in this manner, which
ould be difficult and time consuming to obtain experimentally.
Advanced 3D X-ray microtomography and related imaging tech-
iques are now being increasingly used to obtain non-destructive
isualizations of pore structures ( Allaire et al., 2009; Dal Ferro et
l., 2013; Mangalassery et al., 2013; Zhou et al., 2013; Martínez et
l., 2015) . This includes studies of dynamic processes such as fluid
ow and structural dynamic processes ( Cnudde and Boone, 2013;
ildenschild and Sheppard, 2013 ). Soil aggregates for such studies
ould be imaged and analysed individually to collect data on pore
orphology and connectivity ( Zhou et al., 2013; Dal Ferro et al.,
013 ), or direct fluid flow experiments could be performed on a
ual-porosity medium. Resulting information can then be utilized
o construct pore network structures needed for pore-scale flow
nd/or transport models.
Various pore-scale modelling approaches are now being pur-
ued, with differences pertaining to the specific mathematical for-
ulation such as the use of direct numerical solutions ( Bijeljic et
l., 2013; Fathi et al., 2017a, 2017 b), Lattice Boltzmann methods
Jafari et al., 2011 ) or pore network modelling ( Raoof et al., 2013 ),
ncluding differences in the invoked modelling resolution and re-
uired computational time ( Sahimi, 2011; Bultreys et al., 2016 ).
ulti-scale pore network modelling have been applied for sim-
lating two-phase flow ( Bultreys et al., 2015; Jiang et al., 2013;
rodanovi ́c et al., 2015 ) as well as solute transport ( Bijeljic et
l., 2013 ). and also using grain filling and pore filling method
Mehmani and Prodanovi ́c, 2014 ).
The aim of our study was to use a pore-scale network model to
imulate flow and transport in dual-porosity domains containing a
arge number of aggregates. The pore network modelling approach
ssumes that the porous medium continuum can be divided into
ore elements made up of pore bodies representing the larger
oids in the medium, and pore throats representing narrow open-
ngs connecting the pore bodies ( Raoof et al., 2013; Bultreys et al.,
016 ). Applying mass balance equations, flow and transport is sim-
lated within each individual pore. Averaging over a large number
f pores will then allow estimation of the macroscopic transport
roperties for porous media containing unimodal pore sizes ( Raoof
t al., 2010, 2013 ), or for multi-scale media with multimodal pore
ize distributions ( Bultreys et al., 2015; Mehmani and Prodanovi ́c,
014; Mehmani et al., 2015 ). The obtained information at the
84 E.T. de Vries et al. / Advances in Water Resources 105 (2017) 82–95
c
o
l
m
d
d
O
c
P
p
a
t
t
2
e
A
w
q
w
b
p
t
c
g
w
t
fl
∑
w
p
o
o
e
s
u
(
v
pore-scale makes it possible to relate macroscopic transport prop-
erties to the underlying physical pore-scale processes and pore size
distributions, and their connectivities ( Raoof et al., 2010; Raoof
and Hassanizadeh, 2013 ). Using such multi-scale porous media
requires description of the connectivity between the macro- and
micro-porosity domains, which computationally can be particularly
challenging for heterogeneous multimodal pore scale domains.
Our objective is to develop a dual-porosity pore structure to
represent an aggregated medium, and to use this structure to sim-
ulate flow and transport within the composite medium in order
to obtain pore-scale distributions of the solute concentration. The
resulting solute breakthrough curves are then compared with solu-
tions of the macroscopic equations given by Eqs (1) and (2) to ob-
tain estimates of the fraction of mobile water ( φm
), and the mass
transfer coefficient ( α). A large number of simulations will be car-
ried out to obtain dependencies of φm
and α on such soil aggre-
gate properties as porosity and internal permeability. Resulting in-
sight may be useful for field scale models to improve predictions
needed at the larger scales for evaluating alternative management
or contaminant remediation strategies, as well as industrial porous
media applications.
2. Theoretical development
In this section we describe the pore-scale network model that
was used to simulate flow and transport in the aggregated dual-
porosity pore structure. After a brief review of the pore-scale net-
work modelling approach in general, details are provided on how
the pore-scale model was used to generate pore structures and
conduct simulations for an aggregated medium.
2.1. Pore network model
Pore network modelling considers a porous medium as a sys-
tem of pore elements composed of pore bodies and pore throats.
While pore bodies, due to their larger size, mainly control the
porosity of the medium, the smaller pore throats determine the
hydraulic conductivity. The complete pore structure of an aggre-
gated soil requires the use of two types of pore spaces with dif-
ferent sizes. The aggregated medium in our study was obtained
by first generating a macropore domain. Since pore connectivity
is an important topological property of the medium, we used a
pore network model with random pore connectivity ( Raoof & Has-
sanizadeh, 2012 ) to represent the randomness of real porous me-
dia. Once the macropore domain was generated, several aggregates
were superimposed within the overall domain. Each aggregate of
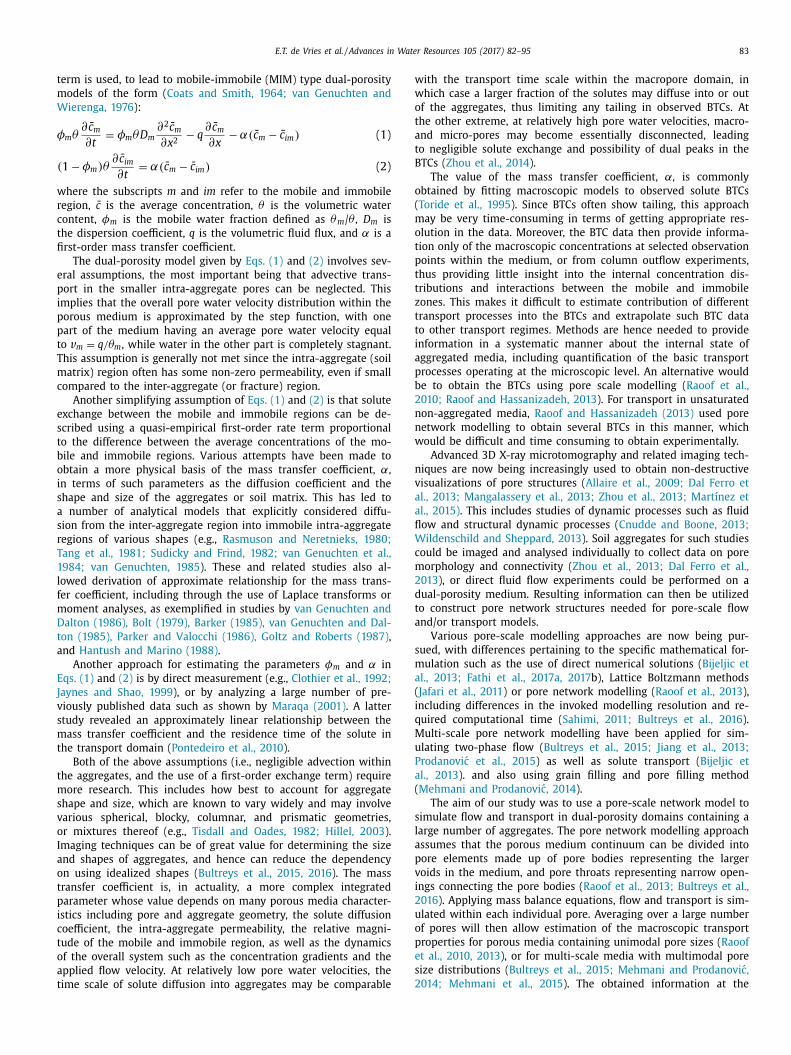
Fig. 1. Construction of the aggregated domain: macroscopic pore domain (the left plot) a
provide the ultimate multi-scale domain (the right plot).
ertain size was assumed to contain a large number of microp-
res. Algorithms were developed to connect the collection of pores
ocated at the outer surface of the aggregates to their adjacent
acropores. We generated for this purpose several domains with
ifferent aggregate fractions, with the aggregates themselves ran-
omly placed within the medium. An example is shown in Fig. 1 .
nce the pore structures were constructed, flow and transport pro-
esses were simulated within the pore network domain using the
oreFlow package developed by Raoof et al., (2013) , which is ca-
able of simulating saturated and variably-saturated flow, as well
s multi-component reactive transport, within arbitrary pore struc-
ures.
Since the adopted pore-scale model has been explained in de-
ail elsewhere ( Raoof and Hassanizadeh, 2010, 2012; Raoof et al.,
010, 2013 ), only a brief overview is provided here of the main
quations governing flow and transport within the porous medium.
ssuming laminar flow, the volumetric flow rate within each pore
as obtained using the Hagen-Poiseulle equation:
i j = g i j
(p j − p i
)(3)
here q ij is the volumetric volume rate through the pore throat
etween two adjacent connected pore bodies i and j, p i and p j are
ressures of the two adjacent pore bodies, and g ij is the conduc-
ance of the pore throat which, for a pore throat with a cylindrical
ross section, is given by:
i j =
πR
4 i j
8 μl i j
(4)
here R ij is the pore throat radius, l ij is the throat length, and μ is
he fluid dynamic viscosity.
Considering incompressible flow, the continuity equation for
ow is applied at pore junctions:
z i
j=1
q i j = 0 ; j = 1 , 2 , . . . , z i , (5)
here q ij is the volumetric flow rate within a pore throat from
ore body i to pore body j , and z i is the pore coordination number
f pore i .
Combining Eqs. (3) –(5) for all pores results in a linear system
f equations with a sparse, symmetric and positive-definite co-
fficient matrix, which is to be solved for the pore body pres-
ures. Considering the sample as a representative elementary vol-
me (REV), the average pore water velocity, v̄ , can be calculated as
Raoof et al., 2013 ):
¯ =
Q tot L
V f
(6)
s well as the aggregate domain (the middle plot) are created and superimposed to
E.T. de Vries et al. / Advances in Water Resources 105 (2017) 82–95 85
Table 1
Selected literature on aggregate properties: aggregate diameters, pore sizes, and porosities.
Reference Aggregate diameter (mm) Pore size (μm) Mean aggregate porosity [–] Imaging method
Czachor et al. (2015) 3–4 2.5–100 0.35 X-ray microtomography and paraffin intrusion
Dal Ferro et al. (2012) 1–2 0.074–100 0.37 X-ray microtomography and mercury intrusion
Dal Ferro et al. (2013) 5–6 12.5–200 0.11 X-ray microtomography
Khan et al. (2012) 1–5 1–85 0.40 Synchrotron-based nano-CT
Peth et al. (2008) 3–5 5–50 0.13 X-ray microtomography
Rabbi et al. (2015) 2–4 5.2–60 0.048 X-ray microtomography
Zhou et al. (2013) 1.5–2 10–500 0.14 X-ray microtomography
w
w
a
V
u
κ
w
t
o
t
(
p
v
c
d
F
e
V
w
r
t
c
t
r
i
V
w
(
P
b
c
a
c
w
a
a
2
i
a
p
M
n
l
m
2
a
r
h
i
s
r
m
p
f
T
a
r
o
e
e
f
d
t
t
h
1
a
t
t
s
t
t
w
o
m
t
a
d
p
p
l
C
p
a
i
s
here Q tot is the total discharge rate through the pore network,
hich can be determined at the inlet or outlet of the pore network
s the sum of all fluxes, L is the length of the pore network, and
f is the total volume of the fluid phase within the pore network.
The intrinsic permeability, κ , of the sample can be determined
sing Darcy’s law:
=
μQ tot L
A �P (7)
here μ is the dynamic viscosity, �P is the pressure difference be-
ween the inlet and outlet pores, and A is the cross-sectional area
f the pore network.
Solute transport through the pore network was described for
he general case involving both advective transport and diffusion
Vasilyev et al., 2012 ). Calculations were done by considering each
ore element (i.e., a pore body or a pore throat) as the control
olume. We used a backward Euler method for the temporal dis-
retization and first-order upwind and central schemes for spatial
iscretization of the advection and diffusion terms, respectively.
or a given pore body i , one can write the following mass balance
quation:
i
d c i dt
=
N throat in ∑
j=1
q i j c i j − Q i c i +
z i ∑
j=1
D 0 A i j
(c i j − c i
)l i j
, (8)
here V i is the volume of the pore body, Q i is the total volumetric
ate going out of the pore body, A ij is the cross-sectional area of
he pore throat, D 0 is the ionic or molecular diffusion coefficient,
i is the concentration in the pore body, c ij is the concentration in
he pore throat, l ij is again the length of the throat, while N
throat in
epresents the number of pore throats flowing into pore body i .
Similarly, the mass balance equation for solutes in a pore throat
j may be written as:
i j
d c i j
dt = q i j c j − q i j c i j + D 0 A i j
(c j − c i j
)l i j
+ D 0 A i j
(c i − c i j
)l i j
(9)
hich assumes that pore body j is the upstream node. Eqs. (8) and
10) were solved using a fully implicit scheme available in the
oreFlow software package ( Raoof et al., 2013 ). Flux-averaged
reakthrough curves at selected points were obtained by averaging
oncentrations over the network cross-section at successive times
s follows:
( x, t ) =
[ ∑ N x t
i c i ( x, t ) Q i ∑ N x t
i Q i
]
1
c 0 i = 1 , 2 , . . . , N t (10)
here c ( x,t ) is the normalized average concentration at location x
nd time t , N
x t refers to the total number of pores at location x ,
nd c 0 is the input concentration of the solute.
.2. Application to aggregated media
Imaging techniques such as X-ray microtomography are being
ncreasingly used to visualize the inner structures of aggregates
nd to provide information on pore size distribution, aggregate
orosity, and aggregate size and shape ( Mangalassery et al., 2013;
artínez et al., 2015; Zhou et al., 2013; Dal Ferro et al., 2013 ). We
ote that studies using only X-ray microtomography often show
ower aggregate porosities as compared to studies using multiple
easuring techniques ( Czachor et al., 2015; Dal Ferro et al., 2012,
013 ). The resolution of X-ray tomography has been shown to be
limiting factor since it tends to neglect the presence of below-
esolution pores. Additional techniques such as mercury intrusion
ence are often used to obtain a more realistic value for the poros-
ty of the aggregates ( Dal Ferro et al., 2013 ). Focused ion beam-
canning electron microscopy (FIB-SEM) can provide much higher
esolution images, as compared to X-ray tomography, for analysing
icroporosity ( Hemes et al., 2015 ). Using a combination of multi-
le techniques applicable to different scales will be most valuable
or multi-scale pore topology applications such as in this study.
able 1 shows aggregate sizes, pore sizes and aggregate porosities
s obtained from the literature. We used these data to establish as
ealistic ranges of properties as possible for the aggregates used in
ur calculations.
Transport processes within the aggregated media we consid-
red were studied by first creating a reference model. The refer-
nce model was then modified to consider i) domains with dif-
erent aggregate porosities by changing pore body sizes, and ii)
omains with different aggregate permeabilities by changing pore
hroat sizes to explore the effects of flow velocity differences be-
ween the macro- and aggregate domains. The reference model
ad a physical size of 100 × 20 × 20 mm
3 and contained a total of
0 0 0 aggregates. The mean distance between pore bodies in the
ggregates was taken to be 0.1 of the separation distance between
he macropores, while the mean coordination number was taken
o be 5. The minimum and maximum aggregate diameters were
et to 1.0 and 3.0 mm, respectively. Pore body sizes and aggregate
hroat sizes were assigned from a truncated log-normal distribu-
ion given by ( Raoof & Hassanizadeh, 2012 ).
f ( R i , σ ) =
√
2 exp
[ −(
1 2
)[ln
(R i R m
)/σ
]2 ]
√
πσ 2 R i
{er f
[ln
(R max
R m
)/ √
2 σ 2 ]−er f
[ln
(R min
R m
)/ √
2 σ 2 ]}
(11)
here R min , R max and R m
are the minimum, maximum and mean
f the distribution, and σ 2 is the variance of the distribution. The
acropore and micropore bodies each had their own size distribu-
ion. The macropore throat sizes were set as the smallest of the
djacent pore body sizes. The throat lengths were calculated by
etermining the length between the center points of two adjacent
ore bodies of the throat, while subtracting the radii of the two
ore bodies.
Table 2 provides the pore size statistics used for the calcu-
ations, with Cases I-3 and II-2 serving as the reference models.
ase I calculations were meant to show the effects of aggregate
orosity, and Case II calculations the effects of aggregate perme-
bility. Based on the data in Table 1 , the single aggregate poros-
ty (Case I in Table 2 ) was varied between 0.082 and 0.700 in 6
teps by changing the aggregate pore body size distributions. The
86 E.T. de Vries et al. / Advances in Water Resources 105 (2017) 82–95
Table 2
Minimum ( R min ), maximum ( R max ) and mean ( R m ) pore body radii (Case I) and pore throat radii (Case II), as
well as standard deviations ( σ ), of the pore-size distributions used in the calculations.
Poro
sity
eff
ects
Perm
eabi
lity
effe
cts
Table 3
Statistics of the generated aggregates.
Property Value ∗
Number of aggregates 10 0 0
Mean aggregate diameter (mm) 2.141 (0.475)
Aggregate pore bodies in domain 965,985
Mean pore bodies per aggregate 966 (578) ∗
Aggregate pore throats in domain 2,391,040
Mean pore throats per aggregate 2391 (1424) ∗
Mean coordination number 4.95
∗ Values in parenthesis indicate standard deviations.
0 0.05 0.1 0.15 0.2 0.25Radius [mm]
0
0.1
0.2
0.3
0.4
Nor
mal
ized
freq
uenc
y
0
0.02
0.04
0.06
0.08
0.1Pore throat agg.Pore body agg.Pore throat macroPore body macro
Fig. 2. Pore body (the right vertical axis) and pore throat (the left vertical axis)
size distributions used for the macropore and aggregate domains of the reference
model.
p
t
p
i
p
w
F
b
d
3
d
m
f
r
d
aggregate throat radii as well as the macropore sizes were kept
constant in these simulations to examine the effects of varying ag-
gregate porosities on flow and transport. For the Case II simula-
tions ( Table 2 ), the aggregate permeability was varied by chang-
ing the aggregate throat sizes in 4 steps, while the aggregate body
and macropore body/throat sizes were kept constant. Simulation II-
1 had smaller throats, and simulations II-3 and II-4 larger throats,
compared to the reference model (Case II-2).
The presence of macropores and aggregates with distinctly dif-
ferent micropore sizes created various pore systems. To explore
the contribution of the different pore systems, porosities were cal-
culated separately for the macropores and aggregates. Pore bod-
ies were presumed to be spherically shaped, and pore throats to
be cylindrical capillaries. Using the pore volumes of each domain,
the domain porosities could be obtained, with the total porosity of
the dual-porosity medium being simply the sum of the macropore
and micropore domain porosities. For all simulations we kept the
mean pore water velocity constant at a value of 1.50 × 10 −5 m/s.
The molecular diffusion coefficient, D 0 , was set at 1.6 × 10 −9 m
2 /s,
the viscosity at 0.001 Pa s, and the fluid density at 1 g/cm
3 .
For all simulations we injected into the pore network a pulse
of one pore volume (equivalent to 66 min) of a tracer having a rel-
ative concentration of 1.0. BTCs of the average concentrations as
obtained with the pore network model were analysed using the
CXTFIT program ( Toride et al., 1995 ) within the STANMOD soft-
ware of Šimunek et al. (20 0 0) , leading to estimates of the solute
dispersivity, λ= D m/ v , the fraction of mobile water, φm
, and the
mass transfer coefficient, α, in Eqs. (1) and (2) . This in turn also
produced values of the mobile water content, θm
, and the immo-
bile water content, θ im
. The intrinsic permeability was determined
for the domain as a whole, as well as for the macropore domain
separately (i.e., excluding the presence of the aggregates). In ad-
dition, simulations were performed to obtain the intrinsic perme-
ability of the single aggregates. For the Case II simulations, based
on the simulated pore velocities, the characteristic time scales of
diffusion and advection were calculated to explore the effects of
the porewater velocity ratio between the macropore and aggregate
domains on the calculations.
3. Results and discussion
Before presenting results of the various pore network calcula-
tions, we first summarize the pore network that was used for the
reference simulations.
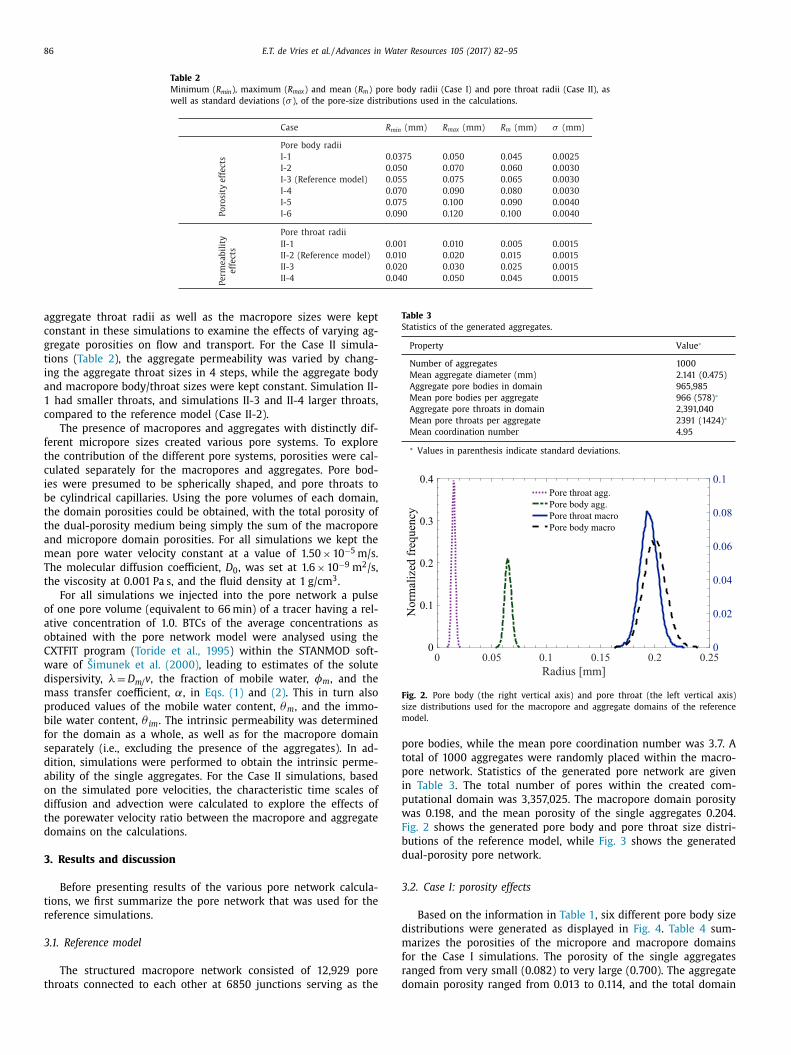
3.1. Reference model
The structured macropore network consisted of 12,929 pore
throats connected to each other at 6850 junctions serving as the
ore bodies, while the mean pore coordination number was 3.7. A
otal of 10 0 0 aggregates were randomly placed within the macro-
ore network. Statistics of the generated pore network are given
n Table 3 . The total number of pores within the created com-
utational domain was 3,357,025. The macropore domain porosity
as 0.198, and the mean porosity of the single aggregates 0.204.
ig. 2 shows the generated pore body and pore throat size distri-
utions of the reference model, while Fig. 3 shows the generated
ual-porosity pore network.
.2. Case I: porosity effects
Based on the information in Table 1 , six different pore body size
istributions were generated as displayed in Fig. 4 . Table 4 sum-
arizes the porosities of the micropore and macropore domains
or the Case I simulations. The porosity of the single aggregates
anged from very small (0.082) to very large (0.700). The aggregate
omain porosity ranged from 0.013 to 0.114, and the total domain
E.T. de Vries et al. / Advances in Water Resources 105 (2017) 82–95 87
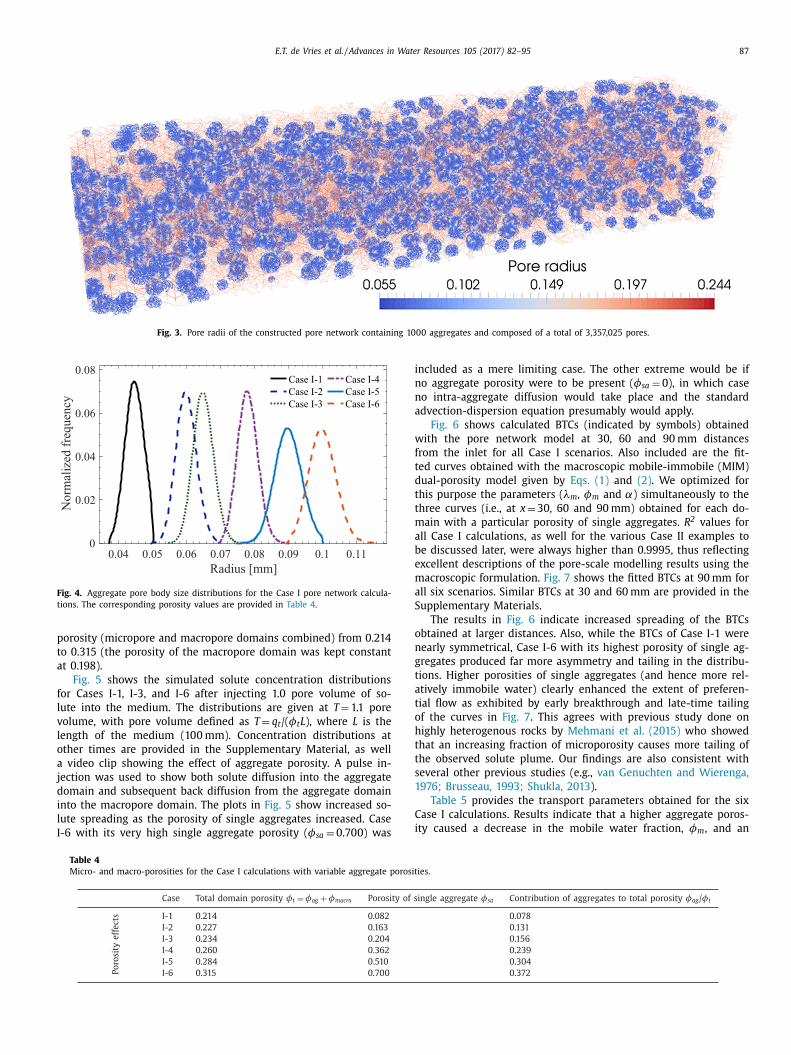
Fig. 3. Pore radii of the constructed pore network containing 10 0 0 aggregates and composed of a total of 3,357,025 pores.
0.04 0.05 0.06 0.07 0.08 0.09 0.1 0.11Radius [mm]
0
0.02
0.04
0.06
0.08
Nor
mal
ized
freq
uenc
y
Case I-4Case I-5Case I-6
Case I-1Case I-2Case I-3
Fig. 4. Aggregate pore body size distributions for the Case I pore network calcula-
tions. The corresponding porosity values are provided in Table 4 .
p
t
a
f
l
v
l
o
a
j
d
i
l
I
i
n
n
a
w
f
t
d
t
t
m
a
b
e
m
a
S
o
n
g
t
a
t
o
h
t
t
s
1
C
i
orosity (micropore and macropore domains combined) from 0.214
o 0.315 (the porosity of the macropore domain was kept constant
t 0.198).
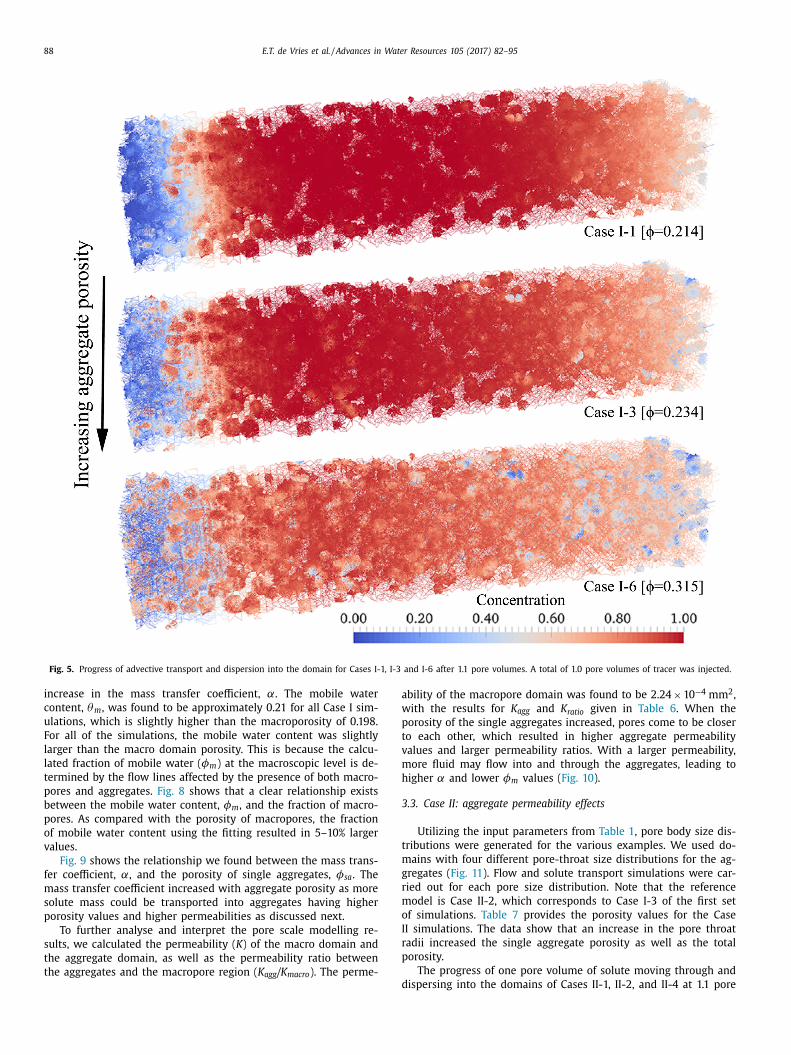
Fig. 5 shows the simulated solute concentration distributions
or Cases I-1, I-3, and I-6 after injecting 1.0 pore volume of so-
ute into the medium. The distributions are given at T = 1.1 pore
olume, with pore volume defined as T = q t /( φt L ), where L is the
ength of the medium (100 mm). Concentration distributions at
ther times are provided in the Supplementary Material, as well
video clip showing the effect of aggregate porosity. A pulse in-
ection was used to show both solute diffusion into the aggregate
omain and subsequent back diffusion from the aggregate domain
nto the macropore domain. The plots in Fig. 5 show increased so-
ute spreading as the porosity of single aggregates increased. Case
-6 with its very high single aggregate porosity ( φsa = 0.700) was
Table 4
Micro- and macro-porosities for the Case I calculations with variable aggregate porosit
ncluded as a mere limiting case. The other extreme would be if
o aggregate porosity were to be present ( φsa = 0), in which case
o intra-aggregate diffusion would take place and the standard
dvection-dispersion equation presumably would apply.
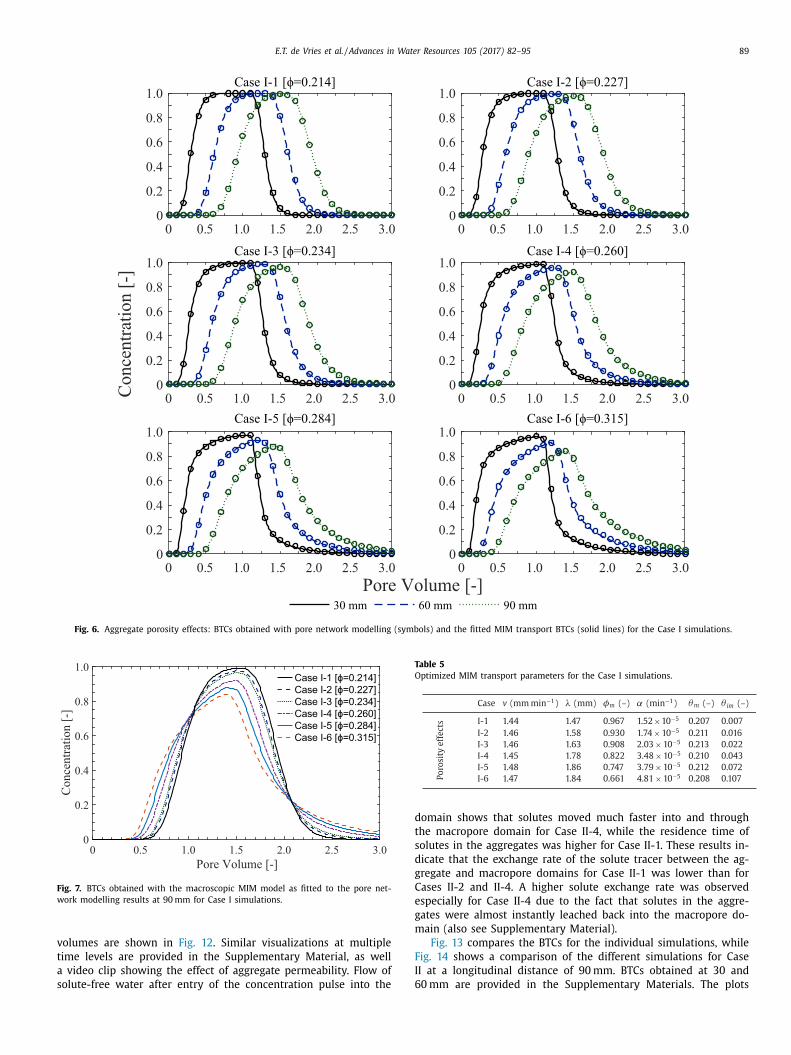
Fig. 6 shows calculated BTCs (indicated by symbols) obtained
ith the pore network model at 30, 60 and 90 mm distances
rom the inlet for all Case I scenarios. Also included are the fit-
ed curves obtained with the macroscopic mobile-immobile (MIM)
ual-porosity model given by Eqs. (1) and (2) . We optimized for
his purpose the parameters ( λm
, φm
and α) simultaneously to the
hree curves (i.e., at x = 30, 60 and 90 mm) obtained for each do-
ain with a particular porosity of single aggregates. R 2 values for
ll Case I calculations, as well for the various Case II examples to
e discussed later, were always higher than 0.9995, thus reflecting
xcellent descriptions of the pore-scale modelling results using the
acroscopic formulation. Fig. 7 shows the fitted BTCs at 90 mm for
ll six scenarios. Similar BTCs at 30 and 60 mm are provided in the
upplementary Materials.
The results in Fig. 6 indicate increased spreading of the BTCs
btained at larger distances. Also, while the BTCs of Case I-1 were
early symmetrical, Case I-6 with its highest porosity of single ag-
regates produced far more asymmetry and tailing in the distribu-
ions. Higher porosities of single aggregates (and hence more rel-
tively immobile water) clearly enhanced the extent of preferen-
ial flow as exhibited by early breakthrough and late-time tailing
f the curves in Fig. 7 . This agrees with previous study done on
ighly heterogenous rocks by Mehmani et al. (2015) who showed
hat an increasing fraction of microporosity causes more tailing of
he observed solute plume. Our findings are also consistent with
everal other previous studies (e.g., van Genuchten and Wierenga,
976; Brusseau, 1993; Shukla, 2013 ).
Table 5 provides the transport parameters obtained for the six
ase I calculations. Results indicate that a higher aggregate poros-
ty caused a decrease in the mobile water fraction, φm
, and an
ies.
88 E.T. de Vries et al. / Advances in Water Resources 105 (2017) 82–95
Fig. 5. Progress of advective transport and dispersion into the domain for Cases I-1, I-3 and I-6 after 1.1 pore volumes. A total of 1.0 pore volumes of tracer was injected.
a
w
p
t
v
m
h
3
t
m
g
r
m
o
I
r
p
increase in the mass transfer coefficient, α. The mobile water
content, θm
, was found to be approximately 0.21 for all Case I sim-
ulations, which is slightly higher than the macroporosity of 0.198.
For all of the simulations, the mobile water content was slightly
larger than the macro domain porosity. This is because the calcu-
lated fraction of mobile water ( φm
) at the macroscopic level is de-
termined by the flow lines affected by the presence of both macro-
pores and aggregates. Fig. 8 shows that a clear relationship exists
between the mobile water content, φm
, and the fraction of macro-
pores. As compared with the porosity of macropores, the fraction
of mobile water content using the fitting resulted in 5–10% larger
values.
Fig. 9 shows the relationship we found between the mass trans-
fer coefficient, α, and the porosity of single aggregates, φsa . The
mass transfer coefficient increased with aggregate porosity as more
solute mass could be transported into aggregates having higher
porosity values and higher permeabilities as discussed next.
To further analyse and interpret the pore scale modelling re-
sults, we calculated the permeability ( K ) of the macro domain and
the aggregate domain, as well as the permeability ratio between
the aggregates and the macropore region ( K agg /K macro ). The perme-
dbility of the macropore domain was found to be 2.24 × 10 −4 mm
2 ,
ith the results for K agg and K ratio given in Table 6 . When the
orosity of the single aggregates increased, pores come to be closer
o each other, which resulted in higher aggregate permeability
alues and larger permeability ratios. With a larger permeability,
ore fluid may flow into and through the aggregates, leading to
igher α and lower φm
values ( Fig. 10 ).
.3. Case II: aggregate permeability effects
Utilizing the input parameters from Table 1 , pore body size dis-
ributions were generated for the various examples. We used do-
ains with four different pore-throat size distributions for the ag-
regates ( Fig. 11 ). Flow and solute transport simulations were car-
ied out for each pore size distribution. Note that the reference
odel is Case II-2, which corresponds to Case I-3 of the first set
f simulations. Table 7 provides the porosity values for the Case
I simulations. The data show that an increase in the pore throat
adii increased the single aggregate porosity as well as the total
orosity.
The progress of one pore volume of solute moving through and
ispersing into the domains of Cases II-1, II-2, and II-4 at 1.1 pore
E.T. de Vries et al. / Advances in Water Resources 105 (2017) 82–95 89
Pore Volume [-]
Con
cent
ratio
n [-
]
0 0.5 1.0 1.5 2.0 2.5 3.00
0.2
0.4
0.6
0.8
1.0
0 0.5 1.0 1.5 2.0 2.5 3.00
0.2
0.4
0.6
0.8
1.0
0 0.5 1.0 1.5 2.0 2.5 3.00
0.2
0.4
0.6
0.8
1.0
0 0.5 1.0 1.5 2.0 2.5 3.00
0.2
0.4
0.6
0.8
1.0
0 0.5 1.0 1.5 2.0 2.5 3.00
0.2
0.4
0.6
0.8
1.0
0 0.5 1.0 1.5 2.0 2.5 3.00
0.2
0.4
0.6
0.8
1.0
30 mm 60 mm 90 mm
Case I-3 [ϕ=0.234] Case I-4 [ϕ=0.260]
Case I-1 [ϕ=0.214] Case I-2 [ϕ=0.227]
Case I-5 [ϕ=0.284] Case I-6 [ϕ=0.315]
Fig. 6. Aggregate porosity effects: BTCs obtained with pore network modelling (symbols) and the fitted MIM transport BTCs (solid lines) for the Case I simulations.
0 0.5 1.0 1.5 2.0 2.5 3.0Pore Volume [-]
0
0.2
0.4
0.6
0.8
1.0
Con
cent
ratio
n [-
]
Fig. 7. BTCs obtained with the macroscopic MIM model as fitted to the pore net-
work modelling results at 90 mm for Case I simulations.
v
t
a
s
Table 5
Optimized MIM transport parameters for the Case I simulations.
Poro
sity
eff
ects
d
t
s
d
g
C
e
g
m
F
I
6
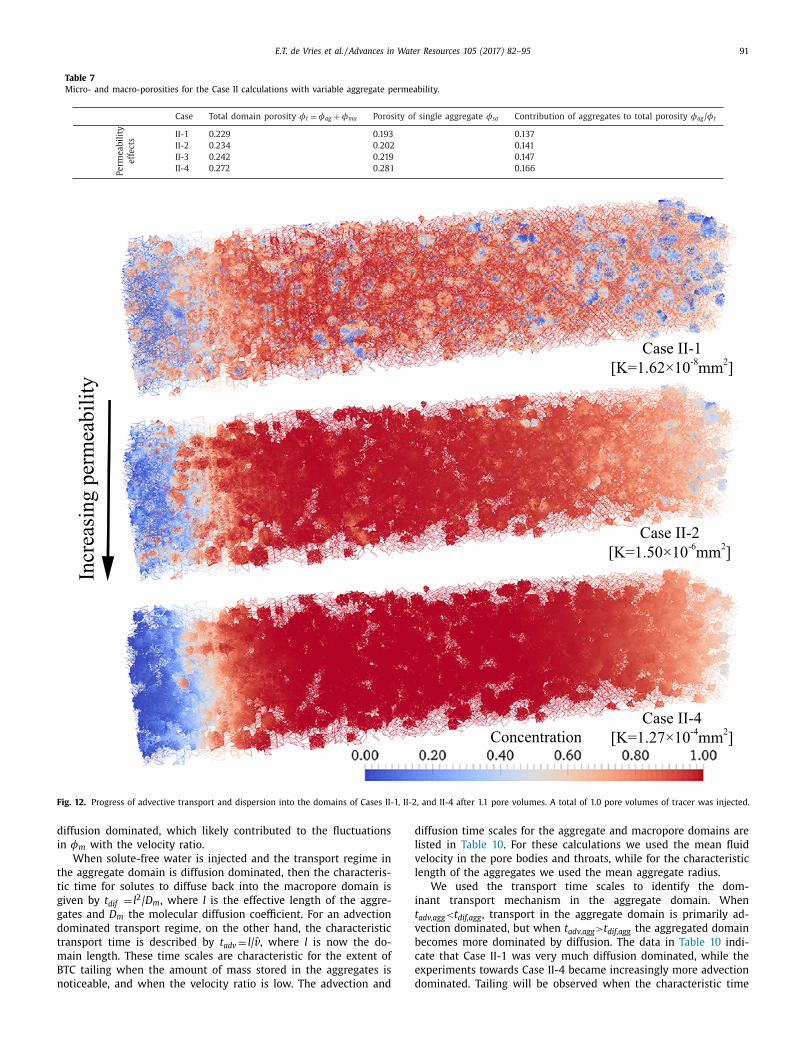
olumes are shown in Fig. 12 . Similar visualizations at multiple
ime levels are provided in the Supplementary Material, as well
video clip showing the effect of aggregate permeability. Flow of
olute-free water after entry of the concentration pulse into the
omain shows that solutes moved much faster into and through
he macropore domain for Case II-4, while the residence time of
olutes in the aggregates was higher for Case II-1. These results in-
icate that the exchange rate of the solute tracer between the ag-
regate and macropore domains for Case II-1 was lower than for
ases II-2 and II-4. A higher solute exchange rate was observed
specially for Case II-4 due to the fact that solutes in the aggre-
ates were almost instantly leached back into the macropore do-
ain (also see Supplementary Material).
Fig. 13 compares the BTCs for the individual simulations, while
ig. 14 shows a comparison of the different simulations for Case
I at a longitudinal distance of 90 mm. BTCs obtained at 30 and
0 mm are provided in the Supplementary Materials. The plots
90 E.T. de Vries et al. / Advances in Water Resources 105 (2017) 82–95
0.5 0.6 0.7 0.8 0.9 1Fraction of macro porosity [-]
0.5
0.6
0.7
0.8
0.9
1m
[-]
m = 1.05x + 9.97 10-3
R2 = 0.992
Fig. 8. Plot of the mobile water content ( φm ) against the fraction of macroporosity
for Case I simulations. A value of 1 for φm would mean the absence of any aggre-
gates.
0 0.1 0.2 0.3 0.4 0.5 0.6 0.7
sa [-]
0
1
2
3
4
5
[min
-1]
10-5
= 5.52 10-5sa + 9.59 10-6
R2 = 0.996
Fig. 9. Plot of the mass transfer coefficient ( α) against the porosity of single aggre-
gates ( φsa ) for Case I.
Table 6
Calculated permeability values for the aggregates, and the permeability ratio
( K agg /K macro ) for Case I.
0 0.02 0.04 0.06 0.08 0.1Permeability ratio [-]
0.65
0.7
0.75
0.8
0.85
0.9
0.95
1
m [-
]
1.5
2
2.5
3
3.5
4
4.5
5
[min
-1]
10-5
Fig. 10. Values of the mobile water fraction ( φm ) and the mass transfer coefficient
( α) plotted against the permeability ratio ( K agg /K macro ) for Case I.
0 0.01 0.02 0.03 0.04 0.05Radius [mm]
0
0.02
0.04
0.06
0.08
0.1
Nor
mal
ized
freq
uenc
y
Case II-3Case II-4
Case II-1Case II-2
Fig. 11. Aggregate pore throat size distributions for Case II pore network calcula-
tions. The corresponding porosity values are provided in Table 7 .
I
m
n
S
w
t
a
a
p
fl
s
e
a
a
p
p
f
C
m
i
m
I
s
c
m
show that reduced pore throat sizes lead to earlier breakthrough of
solute, increased attenuation of the peak concentration, and more
positive skewness of the BTCs in the form of tailing (e.g., Case II-1).
Increasing pore throat sizes, on the other hand, resulted in delayed
breakthrough curves with less tailing and more symmetrical BTCs.
This is consistent with the visualizations in Fig. 12 and the Sup-
plementary Materials, which show a more uniform solute front for
Case II-4 as compared to Case II-1. The latter case exhibits more
preferential flow and more pronounced tailing.
Utilizing the BTCs, transport parameters were again obtained
for each simulation using the CXTFIT program. The results are
given in Table 8 . The obtained mobile fraction, φm
, was found to
be higher than the volume fraction of macropores for Cases II-1,
I-2, and II-3, while φm
was lower than the volume fraction of
acropores for Cases II-4. These results are due to the hydrody-
amic effects caused by the presence of aggregates in the domain.
maller pore throats create relatively impermeable aggregates,
hich causes the overall fluid flow path through the macropores
o become more tortious, leading to higher immobile fractions
t the macroscopic scale. On the other hand, the presence of
ggregates with larger pore throats causes a less tortuous flow
ath as aggregates provide a noticeable contribution to the total
ow, leading to lower immobile water fractions at the macroscopic
cale. The mass transfer rate, α, was lowest for Case II-1 and high-
st for Case II-4. This is in agreement with our earlier observations
bout the visualizations.
Table 9 shows calculated pore water velocities of the macropore
nd micropore (aggregate) domains. The data indicate that larger
ore throat sizes lead to higher pore water velocities. Fig. 15 shows
lots φm
and α against the velocity ratio, v agg/ v ma . The mass trans-
er rate, α, decreased with a lower velocity ratio. In contrast with
ase I, an increase in α did not lead to longer tailing but produced
ore symmetric BTCs. Increasing the aggregate pore water veloc-
ties caused the dominant transport process in the micropore do-
ains to change from diffusion dominated to advection dominated.
nteractions between the aggregate and macropore domains con-
equently increased, leading to higher values of the mass transfer
oefficient, α. We note here that the two-region mobile-immobile
odel (MIM) considers the immobile domain to be completely
E.T. de Vries et al. / Advances in Water Resources 105 (2017) 82–95 91
Table 7
Micro- and macro-porosities for the Case II calculations with variable aggregate permeability.
Fig. 12. Progress of advective transport and dispersion into the domains of Cases II-1, II-2, and II-4 after 1.1 pore volumes. A total of 1.0 pore volumes of tracer was injected.
d
i
t
t
g
g
d
t
m
B
n
d
l
v
l
i
t
v
b
c
e
d
iffusion dominated, which likely contributed to the fluctuations
n φm
with the velocity ratio.
When solute-free water is injected and the transport regime in
he aggregate domain is diffusion dominated, then the characteris-
ic time for solutes to diffuse back into the macropore domain is
iven by t dif = l 2 / D m
, where l is the effective length of the aggre-
ates and D m
the molecular diffusion coefficient. For an advection
ominated transport regime, on the other hand, the characteristic
ransport time is described by t adv = l / ̄v , where l is now the do-
ain length. These time scales are characteristic for the extent of
TC tailing when the amount of mass stored in the aggregates is
oticeable, and when the velocity ratio is low. The advection and
iffusion time scales for the aggregate and macropore domains are
isted in Table 10 . For these calculations we used the mean fluid
elocity in the pore bodies and throats, while for the characteristic
ength of the aggregates we used the mean aggregate radius.
We used the transport time scales to identify the dom-
nant transport mechanism in the aggregate domain. When
adv,agg < t dif,agg , transport in the aggregate domain is primarily ad-
ection dominated, but when t adv,agg > t dif,agg the aggregated domain
ecomes more dominated by diffusion. The data in Table 10 indi-
ate that Case II-1 was very much diffusion dominated, while the
xperiments towards Case II-4 became increasingly more advection
ominated. Tailing will be observed when the characteristic time
92 E.T. de Vries et al. / Advances in Water Resources 105 (2017) 82–95
Pore Volume [-]
Con
cent
rati
on [-
]
0 0.5 1.0 1.5 2.0 2.5 3.00
0.2
0.4
0.6
0.8
1.0
0 0.5 1.0 1.5 2.0 2.5 3.00
0.2
0.4
0.6
0.8
1.0
0 0.5 1.0 1.5 2.0 2.5 3.00
0.2
0.4
0.6
0.8
1.0
0 0.5 1.0 1.5 2.0 2.5 3.00
0.2
0.4
0.6
0.8
1.0
30 mm 60 mm 90 mm
Case II-1 [Κ=1.62×10⁻⁸ mm2] Case II-2 [Κ=1.50×10⁻⁶ mm2]
Case II-3 [Κ=1.21×10⁻⁵ mm2] Case II-4 [Κ=1.27×10⁻⁴ mm2]
Fig. 13. Aggregate permeability effects: BTCs obtained with pore network modelling (symbols) and the fitted MIM transport BTCs (solid lines) for the Case II simulations.
0 0.5 1.0 1.5 2.0 2.5 3.0Pore Volume [-]
0
0.2
0.4
0.6
0.8
1.0
Con
cent
ratio
n [-
]
Case II-1[Κ=1.62×10⁻⁸mm2]
Case II-2[Κ=1.50×10⁻⁶ mm2]
Case II-3[Κ=1.21×10⁻⁵ mm2]
Case II-4[Κ=1.27×10⁻⁴ mm2]
Fig. 14. BTCs obtained with the macroscopic MIM model as fitted to the pore net-
work modelling results at 90 mm for Case II.
f
v
t
d
i
t
t
t
i
i
b
d
t
e
W
t
C
t
t
i
g
t
I
for diffusive transport in the aggregates is similar or becomes less
in comparison to the advection time scale in the macropore do-
main.
For Case II-1, when the transport domain is leached, the
amount of solute tracer remains relatively high in the micropore
domain since the time of solute tracer to be transported back into
the macropore domain is much lower than the front of the solute-
Table 8
Optimized MIM transport parameters for the Case II simulat
ree water passing through the domain. This effect becomes less
isible for Case II-2, and is almost absent for Case II-4. Extensive
ailing is observed when the transport regime in the aggregates is
iffusion dominated and the transport regime in the macro domain
s advection dominated. For flow conditions when the velocity ra-
io between the two domains is close to 1, fluid passes through
he aggregates as well as through the macropore domain, leading
o relatively symmetrical BTCs. Fluid flow at lower velocity ratios
s relatively much slower in the aggregates, leading to long tails
n the BTC. These findings agree with other studies, such as those
y Brusseau (1993) and Bijeljic et al. (2013) , who found that the
egree of non-equilibrium and dominance of the velocity varia-
ions between the inter-aggregate and intra-aggregate pores influ-
nce the severity of tailing.
Values of the calculated permeabilities are listed in Table 11 .
ith increasing pore throat sizes, the permeability increased, with
he permeability ratio increasing from a value of 7.24 × 10 −5 for
ase II-1 to 0.56 for Case II-4. This means that for Case II-4
he fluid penetrated into aggregates almost as easy as it passed
hrough the macropores. For Case II-1 the ratio is very low, mean-
ng that fluid flow now takes place much less through the aggre-
ate pores as compared to the macropores. This is consistent with
he fact that considerable tailing was observed in the BTCs of Case
I-1, while Case II-4 produced more symmetrical BTCs.
ions.
E.T. de Vries et al. / Advances in Water Resources 105 (2017) 82–95 93
Table 9
Mean pore water velocities in the macropore and aggregated domains for Case II.
0 0.05 0.1 0.15 0.2 0.25 0.3Velocity ratio [-]
0.78
0.8
0.82
0.84
0.86
0.88
0.9
0.92
m [-
]
0
0.2
0.4
0.6
0.8
1
1.2
1.4
[min
-1]
10-3
m
Fig. 15. Values of the mobile water fraction ( φm ) and the mass transfer coefficient
( α) plotted against the velocity ratio ( v agg/ v ma ) for Case II.
Table 10
Characteristic advection and diffusion times (in minutes) for the Case II simula-
tions.
Table 11
Calculated permeability values for the aggregates, and the permeability ratio
( K agg /K macro ) for Case II.
4
p
c
p
A
t
p
s
t
t
t
p
p
v
m
i
d
s
0
t
m
g
p
l
l
B
c
t
l
t
t
p
t
o
p
p
i
t
b
v
p
e
d
t
b
b
a
w
a
o
m
t
o
p
A
R
b
S
f
. Conclusions
We investigated the effects of multi-scale pore sizes in a dual-
orosity porous medium on fluid flow and solute transport pro-
esses. Several dual-porosity pore networks were constructed by
lacing a large number of aggregates into the macropore domain.
fter construction of the aggregate domains, fluid flow and solute
ransport were simulated using the PoreFlow ( Raoof et al., 2013 )
ore network model to obtain three-dimensional flow fields and
olute distributions, as well as the BTCs at several locations along
he flow path. The resulting BTCs were fitted analysed in terms of
he conventional macroscopic dual-porosity (MIM) transport model
o estimate several key macroscopic transport parameters. Use of
ore scale modelling provided information to link the transport
roperties to the underlying pore scale processes, which would be
ery difficult and time-consuming to do using only experimental
ethods.
A pore network model consisting of 10 0 0 aggregates, each hav-
ng an average of 966 intra-aggregate pores, was generated to pro-
uce a domain with total of 3,357,025 pores. By varying the pore
izes, different aggregates with porosity values between 0.082 and
.700 were obtained. We showed that increasing aggregate porosi-
ies did lead to higher values of the mass transfer coefficient and
ore tailing in the BTCs. Higher fluid velocities within the ag-
regate domain also increased the mass transfer coefficient, but
roduced less tailing in the calculated BTCs. On the other hand,
ower pore water velocities in the micropore domain produced
ower mass transfer coefficients but more extensive tailing in the
TCs. The velocity ratio between the aggregated and macro domain
ould explain the magnitude of tailing observed in the BTCs.
We showed that dual-porosity pore network models are at-
ractive tools for investigating the basic processes governing so-
ute interactions between the macropore domain (containing in-
eraggregate pores) and the micropore or aggregate domain (con-
aining intra-aggregate pores). The developed pore network model
rovides a flexible means of analysing the effects of pore scale
ransport properties such as aggregate porosity and permeability
n macroscopic flow and transport parameters of dual-porosity
orous media.
While in this study we focused on the effects of aggregate
orosity and permeability on macroscopic transport, further stud-
es are needed to better understand all of the pore scale proper-
ies of aggregates. In our work we varied the aggregate porosity
y varying the size of the pore bodies. The aggregate porosity can
ary also as a result of changes in the number of pore bodies, the
ore coordination number, and the size of the throats. The influ-
nce of the range, variance, skewness, and curtosis of the pore size
istribution on the mass transfer coefficients must also be inves-
igated further. We note also that aggregate domain porosity can
e influenced by the size and number of aggregates, which have
een kept constant in this study. We furthermore did not consider
ny direct connections between the aggregates. These connections
ill have an influence on the residence time of the solute in the
ggregated domain. They very likely will influence the magnitude
f transferred mass, and how solutes are exchanged between the
icropore and macropore domains. The use of suitable imaging
echniques remains indispensable in all of this to most accurately
btain the exact micropore structures of the aggregates, and the
orous medium as a whole.
cknowledgements
This work is part of the Veni Talent Scheme awarded to A.
aoof with project number 016.151.047 , which is (partly) financed
y the Netherlands Organisation for Scientific Research (NWO).
upplementary materials
Supplementary material associated with this article can be
ound, in the online version, at doi:10.1016/j.advwatres.2017.04.013 .
94 E.T. de Vries et al. / Advances in Water Resources 105 (2017) 82–95
K
K
M
M
M
M
M
M
M
N
P
P
P
P
R
R
R
R
R
R
S
S
Š
Š
Š
References
Abbaspour, K.C., Kohler, A., Šimunek, J., Fritsch, M., Schulin, R., 2001. Application
of a two-dimensional model to simulate flow and transport in a macroporous
agricultural soil with tile drains. Eur. J. Soil Sci. 52, 433–447. http://dx.doi.org/10.1046/j.1365-2389.20 01.0 0389.x .
Allaire, S.E., Roulier, S., Cessna, A.J., 2009. Quantifying preferential flow in soils: a re-view of different techniques. J. Hydrol. 378, 179–204. http://dx.doi.org/10.1016/
j.jhydrol.2009.08.013 . Barker, J.A. , 1985. Block-geometry functions characterizing transport in densely fis-
sured media. J. Hydrol. 77, 263–279 .
Bolt, G.H. , 1979. Movement of solutes in soil: principles of adsorption/exchangechromatography. In: Bolt, G.H. (Ed.), Soil Chemistry, B. Physico-Chemical Models.
Developments in Soil Science 5B. Elsevier, Amsterdam, pp. 295–348 . Bijeljic, B., Mostaghimi, P., Blunt, M.J., 2013. Insights into non-Fickian solute trans-
port in carbonates. Water Resour. Res. 49 (5), 2714–2728. http://dx.doi.org/10.1002/wrcr.20238 .
Brusseau, M.L. , 1993. The influence of solute size, pore water velocity, and intra-particle porosity on solute dispersion and transport in soil. Water Resour. Res.
29 (4), 1071–1080 .
Bultreys, T., Van Hoorebeke, L., Cnudde, V., 2015. Multi-scale, micro-computedtomography-based pore network models to simulate drainage in heterogeneous
rocks. Adv. Water Resour. 78, 36–49. http://dx.doi.org/10.1016/j.advwatres.2015.02.003 .
Bultreys, T., De Boever, W., Cnudde, V., 2016. Imaging and image-based fluid trans-port modeling at the pore scale in geological materials: a practical introduction
to the current state-of-the-art. Earth-Sci. Rev. 155, 93–128. http://dx.doi.org/10.
1016/j.earscirev.2016.02.001 . Cnudde, V., Boone, M.N., 2013. High-resolution X-ray computed tomography in geo-
sciences: a review of the current technology and applications. Earth-Sci. Rev.123, 1–17. http://dx.doi.org/10.1016/j.earscirev.2013.04.003 .
Czachor, H., Charytanowicz, M., Gonet, S., Niewczas, J., Jozefaciuk, G., Lichner, L.,2015. Impact of long-term mineral and organic fertilizer application on the wa-
ter stability, wettability and porosity of aggregates obtained from two loamy
soils. Eur. J. Soil Sci. 66 (3), 577–588. http://dx.doi.org/10.1111/ejss.12242 . Clothier, B.E. , Kirkham, M.B. , McLean, J.E. , 1992. In situ measurements of the ef-
fective transport volume of solute moving through soil. Soil Sci. Soc. Am J. 56,733–736 .
Coats, K.H. , Smith, B.D. , 1964. Dead end pore volume and dispersion in porous me-dia. Soc. Petrol. Eng. J. 4, 73–84 .
Dal Ferro, N., Berti, A., Francioso, O., Ferrari, E., Matthews, G.P., Morari, F., 2012. In-
vestigating the effects of wettability and pore size distribution on aggregate sta-bility: the role of soil organic matter and the humic fraction. Eur. J. Soil Sci. 63
(2), 152–164. http://dx.doi.org/10.1111/j.1365-2389.2012.01427.x . Dal Ferro, N., Charrier, P., Morari, F., 2013. Dual-scale micro-CT assessment of soil
structure in a long-term fertilization experiment. Geoderma 204, 84–93. http://dx.doi.org/10.1016/j.geoderma.2013.04.012 .
Fathi, H., Raoof, A., Mansouri, S.H., van Genuchten, M.T., 2017a. Effects of porosity
and water saturation on the effective diffusivity of a cathode catalyst layer. J.Electrochem. Soc. 164 (4), F298–F305. http://dx.doi.org/10.1149/2.0871704jes .
Fathi, H., Raoof, A., Mansouri, S.H., 2017b. Insights into the role of wettability incathode catalyst layer of proton exchange membrane fuel cell; pore scale im-
miscible flow and transport processes. J. Power Sources 346, 57–67. http://dx.doi.org/10.1016/j.jpowsour.2017.03.012 .
Flury, M. , Flühler, H. , Jury, W.A. , Leuenberger, J. , 1994. Susceptibility of soils to pref-
erential flow of water: a field study. Water Resour. Res. 30, 1945–1954 . Gerke, H.H., 2006. Preferential flow descriptions for structured soils. J. Plant Nutr.
Soil Sci. 169, 382–400. http://dx.doi.org/10.1002/jpln.200521955 . Goltz, M.N. , Roberts, P.V. , 1987. Using the method of moments to analyze three-di-
mensional diffusion-limited solute transport from temporal and spatial perspec-tives. Water Resour. Res. 23 (8), 1575–1585 .
Hantush, M.M. , Mariño, M.A. , 1988. Interlayer diffusive transfer and transport ofcontaminants in stratified formation. I. Theory. J. Hydrogeol. Eng., ASCE. 3 (4),
232–240 .
Hendrickx, J.M.H. , Flury, M. , 2001. Uniform and preferential flow mechanisms in thevadose zone. In: Conceptual Models of Flow and Transport in the Fractured Va-
dose Zone. National Research Council, National Academy Press, Washington, DC,pp. 149–187 .
Hemes, S., Desbois, G., Urai, J.L., Schröppel, B., Schwarz, J.O., 2015. Multi-scalecharacterization of porosity in Boom Clay (HADES-level, Mol, Belgium) using
a combination of X-ray μ-CT, 2D BIB-SEM and FIB-SEM tomography. Microp-
orous Mesoporous Mater. 208, 1–20. http://dx.doi.org/10.1016/j.micromeso.2015.01.022 .
Hillel, D. , 2003. Introduction to Environmental Soil Physics. Academic Press . Jafari, S., Yamamoto, R., Rahnama, M., 2011. Lattice-Boltzmann method combined
with smoothed-profile method for particulate suspensions. Phys. Rev. E. 83 (2).http://dx.doi.org/10.1103/PhysRevE.83.026702 .
Jarvis, N.J., 2007. A review of nonequilibrium water flow and solute transport in soil
macropores: principles, controlling factors and consequences for water quality.Eur. J. Soil Sci. 58, 523–546. http://dx.doi.org/10.1111/j.1365-2389.20 07.0 0915.x .
Jaynes, D.B. , Shao, M. , 1999. Evaluation of a simple technique for estimating two–domain transport parameters. Soil Sci. 164, 82–91 .
Jiang, Z., Dijke, M.I.J., Sorbie, K.S., Couples, G.D., 2013. Representation of multiscaleheterogeneity via multiscale pore networks. Water Resour. Res. 49 (9), 5437–
5449. http://dx.doi.org/10.1002/wrcr.20304 .
han, F., Enzmann, F., Kersten, M., Wiegmann, A., Steiner, K., 2012. 3D simulation ofthe permeability tensor in a soil aggregate on basis of nanotomographic imag-
ing and LBE solver. J. Soils Sediments 12 (1), 86–96. http://dx.doi.org/10.1007/s11368-011-0435-3 .
öhne, J.M., Köhne, S.K., Šim ̊unek, J., 2009. A review of model applications for struc-tured soils: a) Water flow and tracer transport. J. Contam. Hydrol. 104, 4–35.
http://dx.doi.org/10.1016/j.jconhyd.2008.10.002 . ahmoodlu, M.G., Hartog, N., Hassanizadeh, S.M., Raoof, A., 2013. Oxidation of
volatile organic vapours in air by solid potassium permanganate. Chemosphere
91 (11), 1534–1538. http://dx.doi.org/10.1016/j.chemosphere.2012.12.035 . ahmoodlu, M.G., Hassanizadeh, S.M., Hartog, N., Raoof, A., 2014. Oxidation of
trichloroethylene, toluene, and ethanol vapors by a partially saturated perme-able reactive barrier. J. Contam. Hydrol. 164, 193–208. http://dx.doi.org/10.1016/
j.jconhyd.2014.05.013 . angalassery, S., Sjögersten, S., Sparkes, D.L., Sturrock, C.J., Mooney, S.J., 2013. The
effect of soil aggregate size on pore structure and its consequence on emission
of greenhouse gases. Soil Till. Res. 132, 39–46. http://dx.doi.org/10.1016/j.still.2013.05.003 .
araqa, M.A., 2001. Prediction of mass-transfer coefficient for solute transportin porous media. J. Contam. Hydrol. 53, 163–171. http://dx.doi.org/10.1016/
S0169-7722(01)00107-3 . artínez, F.S.J., Ortega, F.M., Monreal, F.C., Kravchenko, A.N., Wang, W., 2015. Soil
aggregate geometry: measurements and morphology. Geoderma 237, 36–48.
http://dx.doi.org/10.1016/j.geoderma.2014.08.003 . ehmani, A., Prodanovi ́c, M., 2014. The effect of microporosity on transport proper-
ties in porous media. Adv. Water Resour. 63, 104–119. http://dx.doi.org/10.1016/j.advwatres.2013.10.009 .
ehmani, A., Mehmani, Y., Prodanovi ́c, M., Balhoff, M., 2015. A forward analysis onthe applicability of tracer breakthrough profiles in revealing the pore structure
of tight gas sandstone and carbonate rocks. Water Resour. Res. 51 (6), 4751–
4767. http://dx.doi.org/10.1002/2015WR016948 . RC, 2001. Conceptual Models of Flow and Transport in the Fractured Vadose Zone.
National Research Council, National Academy Press, Washington, DC . arker, J.C. , Valocchi, A.J. , 1986. Constraints on the validity of equilibrium and
first-order kinetic transport models in structured soils. Water Resour. Res. 22(3), 399–407 .
eth, S., Horn, R., Beckmann, F., Donath, T., Fischer, J., Smucker, A.J.M., 2008.
Three-dimensional quantification of intra-aggregate pore-space features usingsynchrotron-radiation-based microtomography. Soil Sci. Soc. Am. J. 72 (4), 897–
907. http://dx.doi.org/10.2136/sssaj2007.0130 . ontedeiro, E.M., van Genuchten, M.Th., Cotta, R.M., Šim ̊unek, J., 2010. The effects of
preferential flow and soil texture on risk assessments of a NORM waste disposalsite. J. Hazard. Mater 174, 648–655. http://dx.doi.org/10.1016/j.jhazmat.2009.09.
100 .
rodanovi ́c, M., Mehmani, A., Sheppard, A.P., 2015. Imaged-based multiscale net-work modelling of microporosity in carbonates. Geol. Soc. Lond. Special Pub-
lications 406 (1), 95–113. http://dx.doi.org/10.1144/SP406.9 . abbi, S.F., Wilson, B.R., Lockwood, P.V., Daniel, H., Young, I.M., 2015. Aggregate hier-
archy and carbon mineralization in two Oxisols of New South Wales, Australia.Soil Till. Res. 146, 193–203. http://dx.doi.org/10.1016/j.still.2014.10.008 .
aoof, A., Hassanizadeh, S.M., 2010. A new method for generating pore-networkmodels of porous media. Transp. Porous Media 81 (3), 391–407. http://dx.doi.
org/10.10 07/s11242-0 09-9412-3 .
aoof, A., Hassanizadeh, S.M., Leijnse, A., 2010. Upscaling transport of adsorbing so-lutes in porous media: pore-network modeling. Vadose Zone J. 9 (3), 624–636.
http://dx.doi.org/10.2136/vzj2010.0026 . aoof, A., Hassanizadeh, S.M., 2012. A new formulation for pore-network mod-
eling of two-phase flow. Water Resour. Res. 48 (1). http://dx.doi.org/10.1029/2010WR010180 .
aoof, A., Hassanizadeh, S.M., 2013. Saturation-dependent solute dispersivity in
porous media: pore-scale processes. Water Resour. Res. 49 (4), 1943–1951.http://dx.doi.org/10.1002/wrcr.20152 .
aoof, A., Nick, H.M., Hassanizadeh, S.M., Spiers, C.J., 2013. PoreFlow: a complexpore-network model for simulation of reactive transport in variably saturated
porous media. Comp. Geosci. 61, 160–174. http://dx.doi.org/10.1016/j.cageo.2013.08.005 .
Rasmuson, A. , Neretnieks, I. , 1980. Exact solution of a model for diffusion in par-
ticles and longitudinal dispersion in packed beds. Am. Inst. Chem. Eng. J. 26,686–690 .
ahimi, M., 2011. Flow and Transport in Porous Media and Fractured Rock: FromClassical Methods to Modern Approaches. Wiley-VCH. http://dx.doi.org/10.1002/
9783527636693 . hukla, M.K. , 2013. Soil Physics: An Introduction. CRC Press .
im ̊unek, J., Jarvis, N.J., van Genuchten, M.Th., Gärdenäs, A., 2003. Review and com-
parison of models for describing non-equilibrium and preferential flow andtransport in the vadose zone. J. Hydrol. 272 (1), 14–35. http://dx.doi.org/10.1016/
S0 022-1694(02)0 0252-4 . imunek, J. , van Genuchten, M.Th. , Šejna, M. , Toride, N. , Leij, F.J. , 20 0 0. The STAN-
MOD computer software for evaluating solute transport in porous media us-ing analytical solutions of convection-dispersion equation. In: Version 2.0, IG-
WMC-TPS-71 , Int. Ground Water Modeling Center (IGWMC). Colorado School of
Mines, Golden, Colorado, p. 32 . imunek, J., van Genuchten, M.Th, 2008. Modeling nonequilibrium flow and trans-
port processes using HYDRUS. Vadose Zone J. 7 (2), 782–797. http://dx.doi.org/10.2136/vzj20 07.0 074 .
E.T. de Vries et al. / Advances in Water Resources 105 (2017) 82–95 95
S
T
T
T
V
v
v
v
v
V
W
Z
Z
Z
udicky, E.A. , Frind, E.O. , 1982. Contaminant transport in fractured porous media:analytical solutions for a system of parallel fractures. Water Resour. Res. 18 (6),
1634–1642 . ang, D.H. , Frind, E.O. , Sudicky, E.A. , 1981. Contaminant transport in fractured porous
media: analytical solution for a single fracture. Water Resour. Res. 17, 555–564 . isdall, J.M. , Oades, J. , 1982. Organic matter and water-stable aggregates in soils. J.
Soil Sci. 33 (2), 141–163 . oride, N. , Leij, F.J. , van Genuchten, M.Th , 1995. The CXTFIT code for estimating
transport parameters from laboratory or field tracer experiments. In: Version
2.10. U.S. Salinity Laboratory. USDA-ARS, Riverside, CA, p. 121 . asilyev, L., Raoof, A., Nordbotten, J.M., 2012. Effect of mean network coordination
number on dispersivity characteristics. Transp. Porous Media 95 (2), 447–463.http://dx.doi.org/10.1007/s11242-012-0054-5 .
an Genuchten, M.Th. , Dalton, F.N. , 1986. Models for simulating salt movement inaggregated field soils. Geoderma 38 (1), 165–183 .
an Genuchten, M.Th , 1985. General approach for modeling solute transport in
structured soils. Memoires Int. Assoc. Hydrogeol. 17 (2), 513–526 . an Genuchten, M.Th. , Wierenga, P.J. , 1976. Mass transfer studies in sorbing porous
media, I. Analytical solutions. Soil Sci. Soc. Am. J. 40 (4), 473–480 .
an Genuchten, M.Th. , Tang, D.H. , Guennelon, R. , 1984. Some exact solutions for so-lute transport through soils containing large cylindrical macropores. Water Re-
sour. Res. 20 (3), 335–346 . ogel, T., Sanda, M., Dusek, J., Dohnal, M., Votrubova, J., 2010. Using oxygen-18 to
study the role of perefential flow in the formation of hillslope runoff. VadoseZone J. 9, 252–259. http://dx.doi.org/10.2136/vzj20 09.0 066 .
ildenschild, D., Sheppard, A.P., 2013. X-ray imaging and analysis techniques forquantifying pore-scale structure and processes in subsurface porous medium
systems. Adv. Water Resour. 50, 217–246. http://dx.doi.org/10.1016/j.advwatres.
2012.07.018 . hang, Q., Hassanizadeh, S.M., Karadimitriou, N.K., Raoof, A., Liu, B., Kleingeld, P.J.,
Imhof, A., 2013. Retention and remobilization of colloids during steady-state andtransient two-phase flow. Water Resour. Res. 49 (12), 8005–8016. http://dx.doi.
org/10.1002/2013WR014345 . hou, H., Peng, X., Perfect, E., Xiao, T., Peng, G., 2013. Effects of organic and inorganic
fertilization on soil aggregation in an Ultisol as characterized by synchrotron
based X-ray micro-computed tomography. Geoderma 195, 23–30. http://dx.doi.org/10.1016/j.geoderma.2014.08.003 .
hou, B.B., Li, Y., Wang, Q., Jiang, Y.L., Li, S., 2014. Simulation of chloride transport inan aggregated soil using three conceptual models. Arab. J. Geosci. 7 (7), 2539–
2546. http://dx.doi.org/10.1007/s12517- 013- 0970- x .
![BEC… · Web viewMiranda: Lin Jaynes. [silence] Lin Jaynes? I think Lin Jaynes might be here; it’s just really hard to hear her. Are you there, Lin? [silence] Or maybe not](https://img.pdfslide.us/doc/110x75/5a7135e87f8b9ac0538cb0c0/wwworegongovwwworegongovblindbepdocuments03-24-16-becdoc.jpg)