Embed Size (px)
Citation preview

Advances in Molding Technology
David KazmerUniversity of Massachusetts Lowell

Introduction

Who Is David Kazmer?
1985 1990 1995 2000 2005
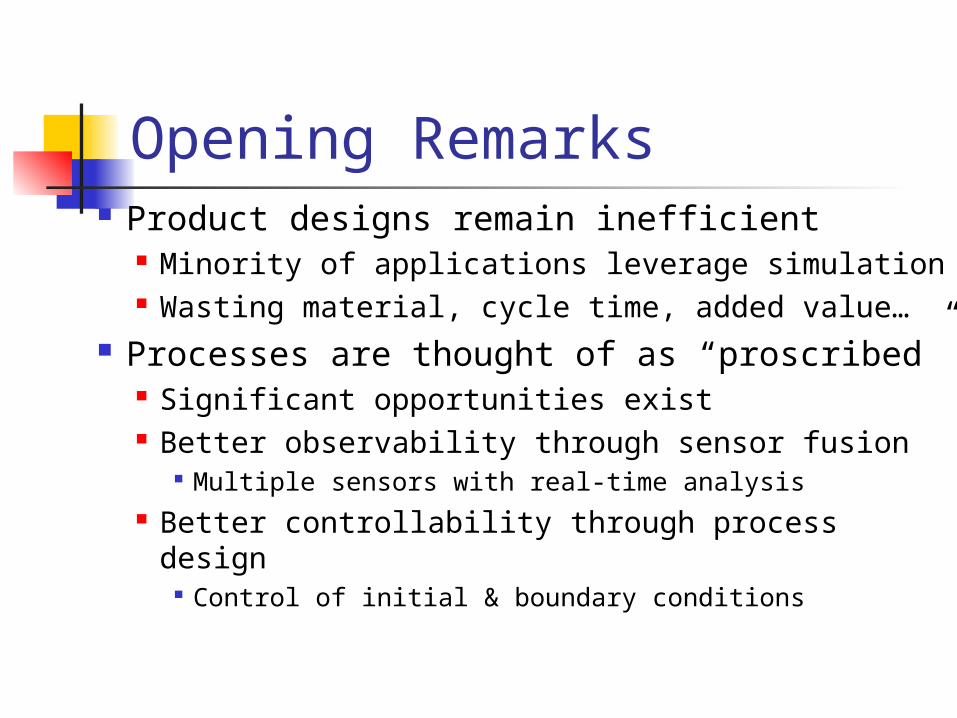
Opening Remarks Product designs remain inefficient
Minority of applications leverage simulation Wasting material, cycle time, added value…
Processes are thought of as “proscribed” Significant opportunities exist Better observability through sensor fusion
Multiple sensors with real-time analysis Better controllability through process design
Control of initial & boundary conditions
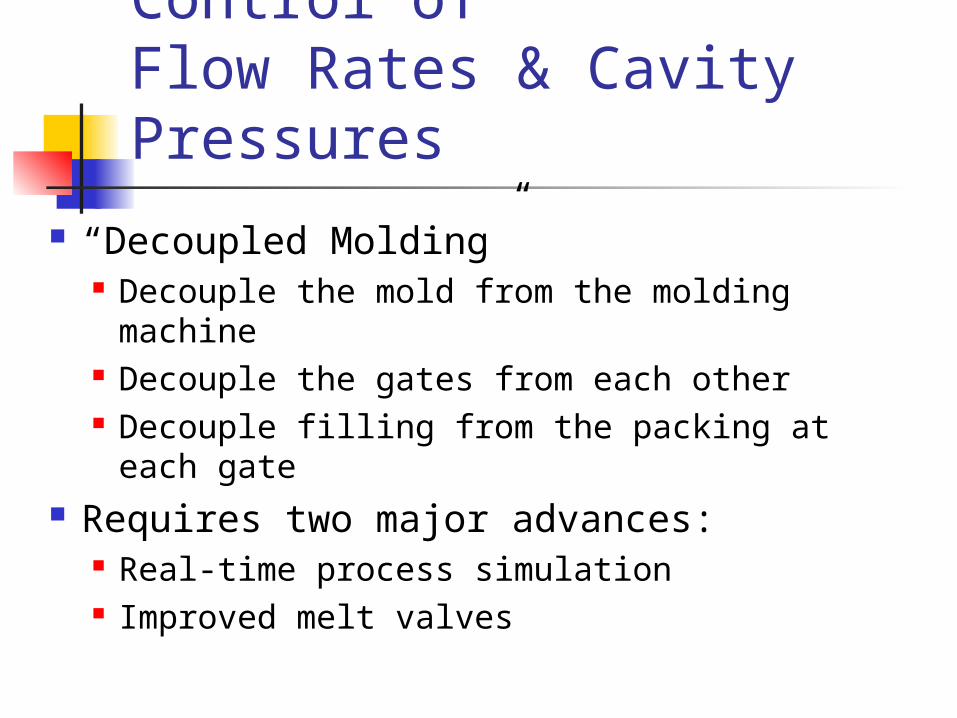
Vision: Gate-Level Control ofFlow Rates & Cavity Pressures
“Decoupled Molding” Decouple the mold from the molding machine Decouple the gates from each other Decouple filling from the packing at each gate
Requires two major advances: Real-time process simulation Improved melt valves
Real Time Process Simulation
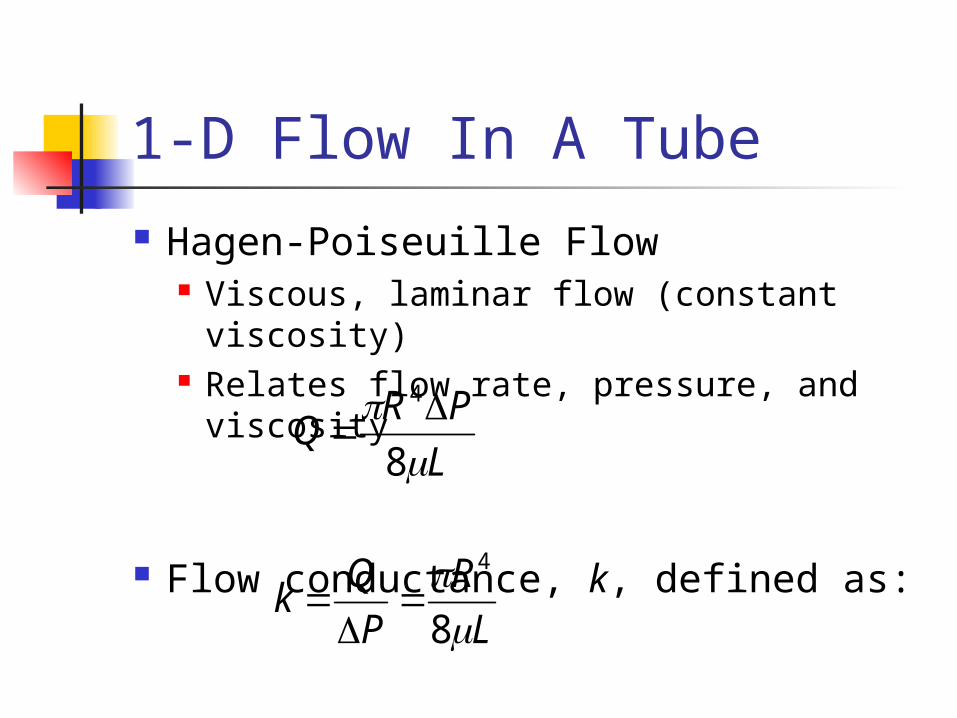
1-D Flow In A Tube
Hagen-Poiseuille Flow Viscous, laminar flow (constant
viscosity) Relates flow rate, pressure, and
viscosity
Flow conductance, k, defined as:
L
PRQ
8
4
L
R
P
Qk
8
4
Flow Network Analysis
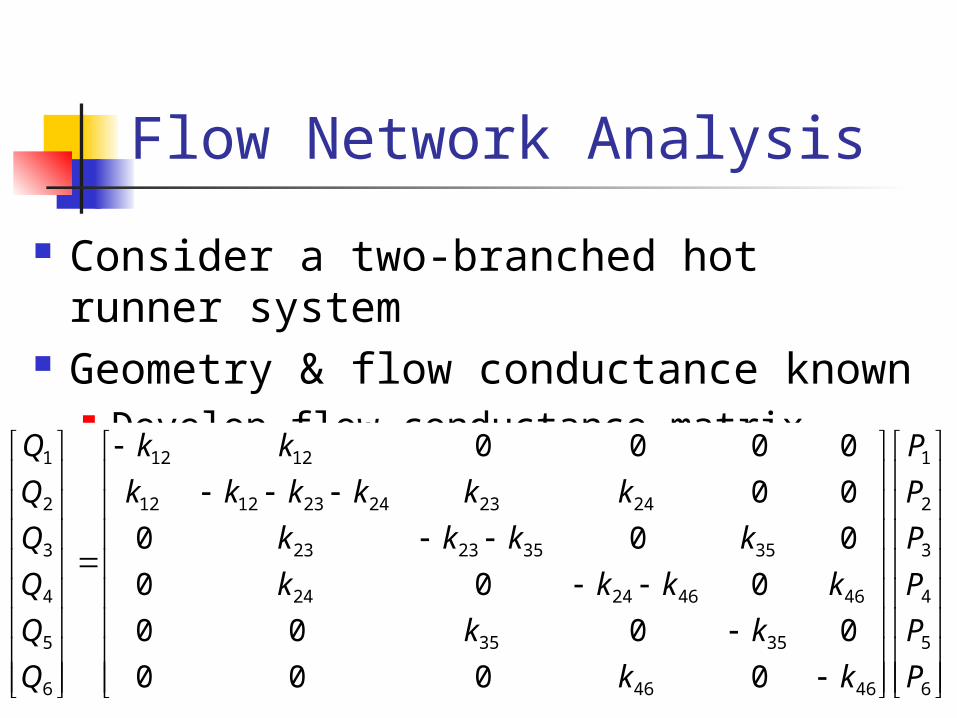
Consider a two-branched hot runner system
Geometry & flow conductance known Develop flow conductance matrix 1
2 3 4
5 6
6
5
4
3
2
1
4646
3535
46462424
35352323
242324231212
1212
6
5
4
3
2
1
0000
0000
000
000
00
0000
P
P
P
P
P
P
kk
kk
kkkk
kkkk
kkkkkk
kk
Q
Q
Q
Q
Q
Q
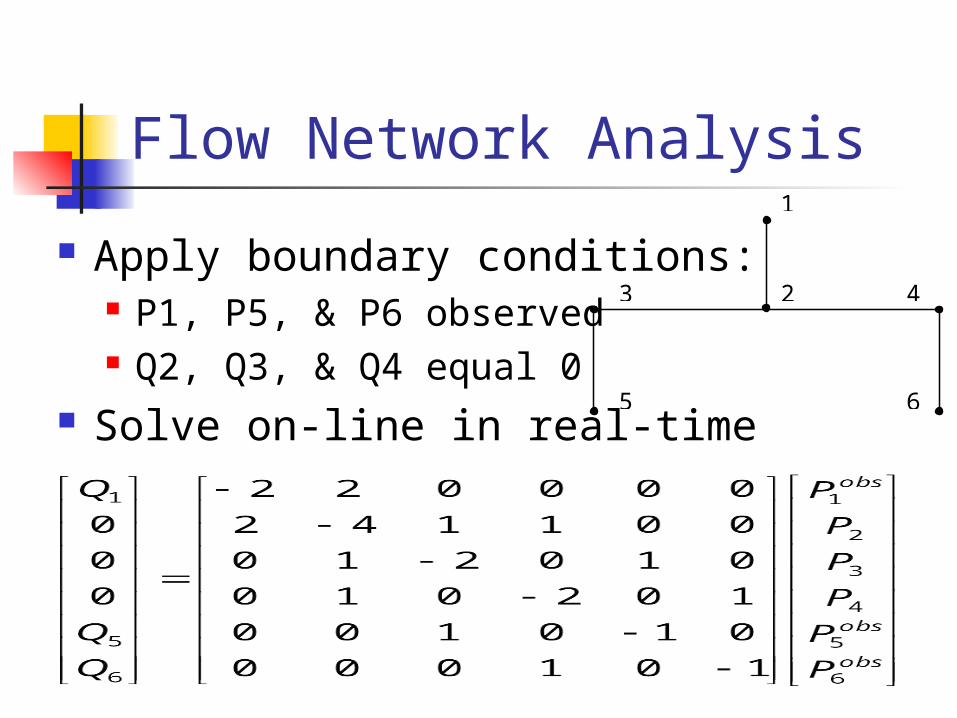
Flow Network Analysis
Apply boundary conditions: P1, P5, & P6 observed Q2, Q3, & Q4 equal 0
Solve on-line in real-time
1
2 3 4
5 6
obs
obs
obs
P
P
P
P
P
P
kk
kk
kkkk
kkkk
kkkkkk
kk
Q
Q
Q
6
5
4
3
2
1
4646
3535
46462424
35352323
242324231212
1212
6
5
1
0000
0000
000
000
00
0000
0
0
0
Notes
Previous approach is relatively easy Hot runner geometry known Constant viscosity assumed
“Newtonian” Flow conductance matrix pre-computed
and remains constant Able to invert matrix in microseconds
Definitely feasible for 64+ cavities
Not so accurate: ignores shear heating and shear thinning
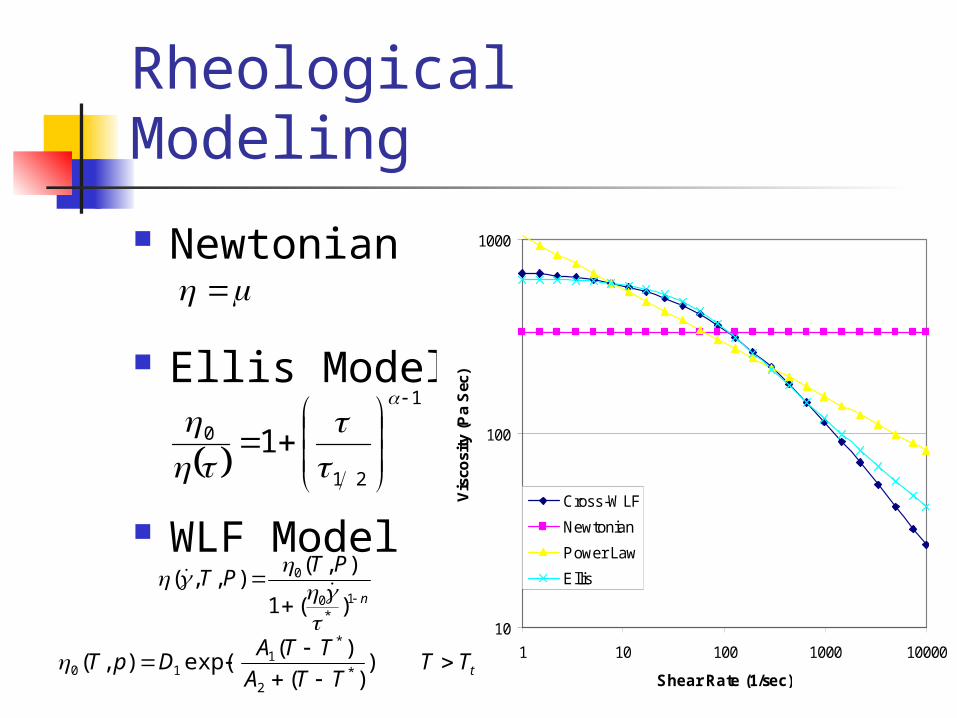
Rheological Modeling
Newtonian
Ellis Model
WLF Model
10
100
1000
1 10 100 1000 10000
Shear Rate (1/sec)
Vis
cosi
ty (
Pa
Sec
)
Cross-WLF
Newtonian
Power Law
Ellis
1
21
0 1
n
PTPT
1*
0
0
)(1
),(),,(
tTTTTA
TTADpT
))(
)(exp(),(
*2
*1
10
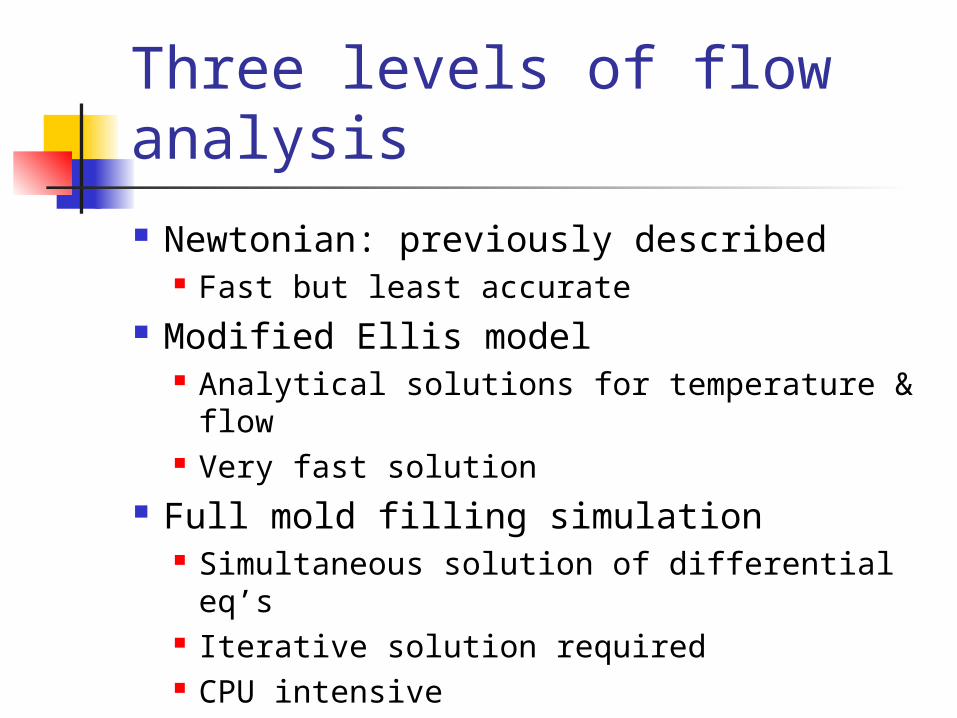
Three levels of flow analysis
Newtonian: previously described Fast but least accurate
Modified Ellis model Analytical solutions for temperature &
flow Very fast solution
Full mold filling simulation Simultaneous solution of differential eq’s Iterative solution required CPU intensive
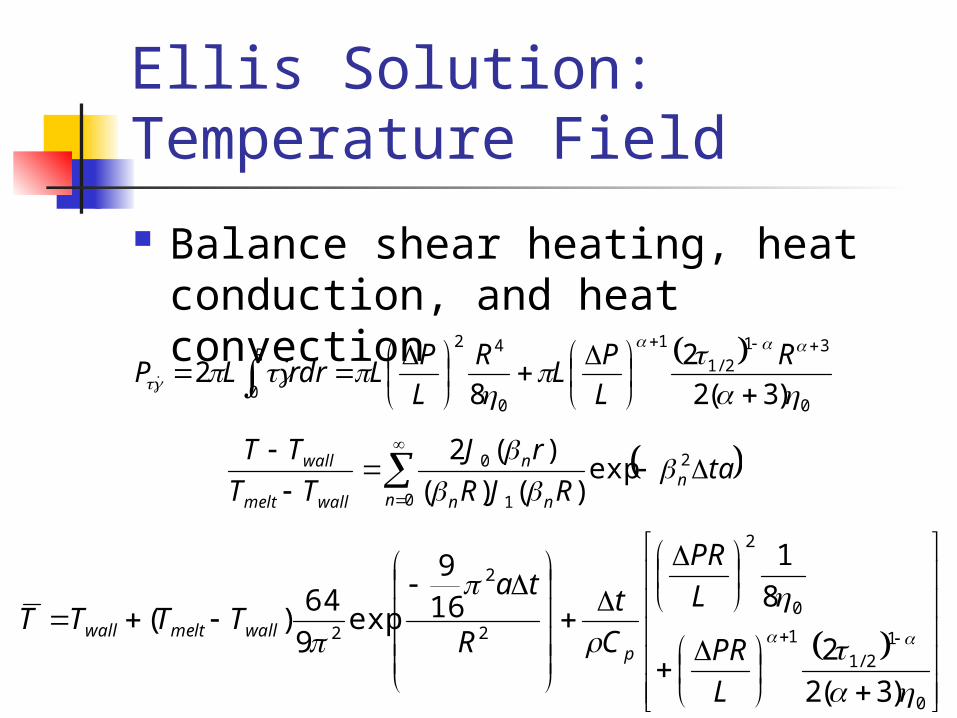
Ellis Solution:Temperature Field
Balance shear heating, heat conduction, and heat convection
0
12/1
1
0
2
2
2
2
)3(2
2
8
1
16
9
exp9
64)(
L
PR
L
PR
C
t
R
taTTTT
pwallmeltwall
0
312/1
1
0
42
0 )3(2
2
82
R
L
PL
R
L
PLrdrLP
R
taRJR
rJ
TT
TTn
n nn
n
wallmelt
wall
2
0 1
0 exp)()(
)(2
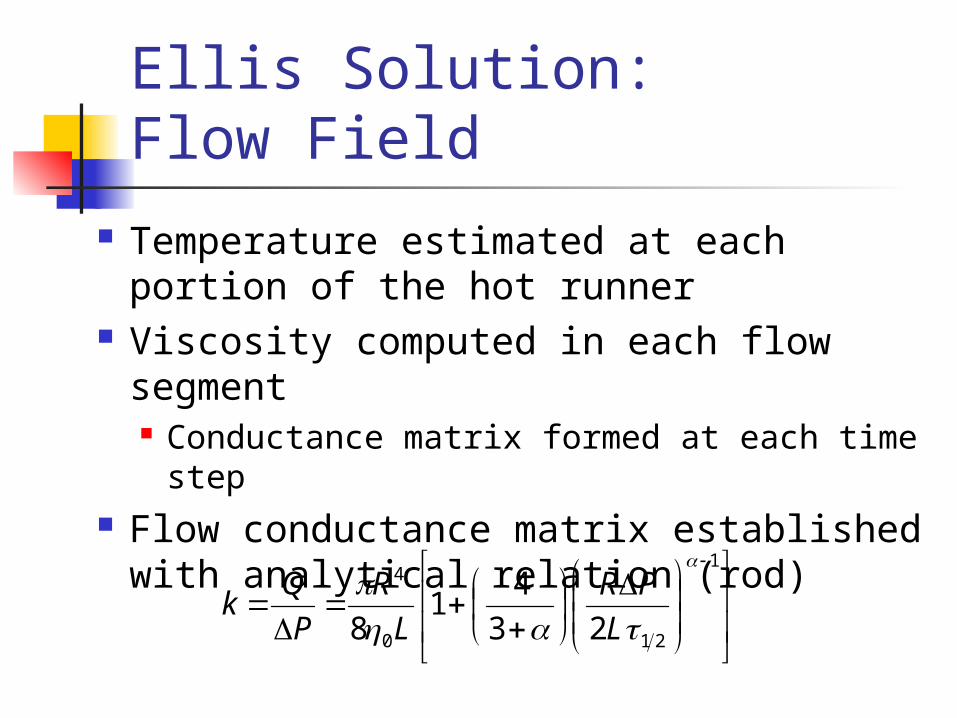
Ellis Solution:Flow Field
Temperature estimated at each portion of the hot runner
Viscosity computed in each flow segment Conductance matrix formed at each
time step Flow conductance matrix established
with analytical relation (rod)
1
210
4
23
41
8
L
PR
L
R
P
Qk
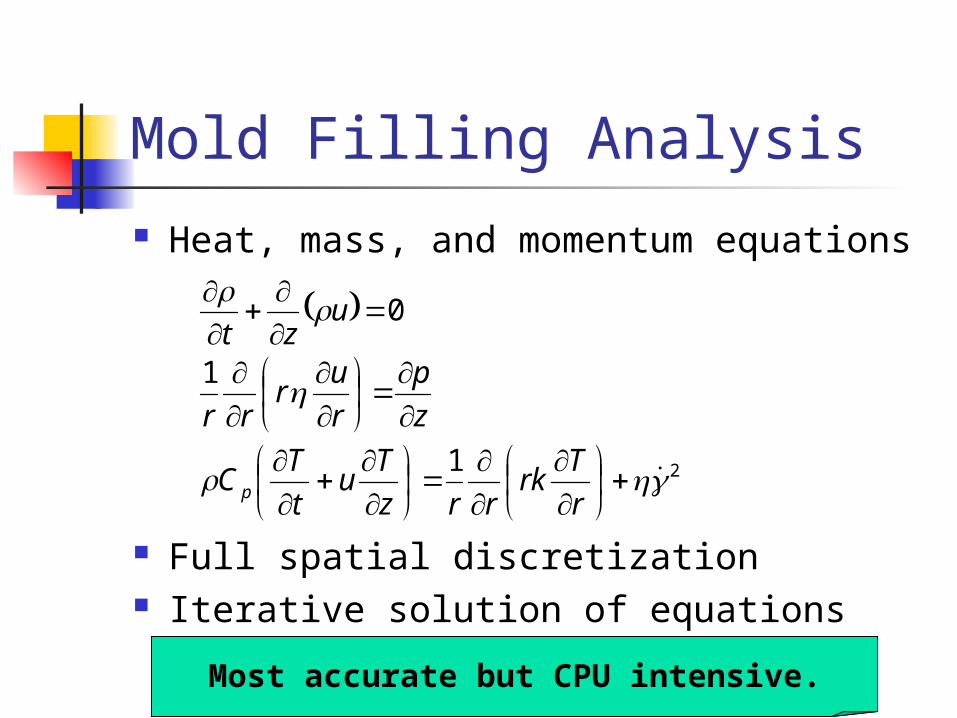
Mold Filling Analysis Heat, mass, and momentum equations
Full spatial discretization Iterative solution of equations
0
uzt (27)
z
p
r
ur
rr
1 (28)
21
r
Trk
rrz
Tu
t
TC p
(29)
Most accurate but CPU intensive.
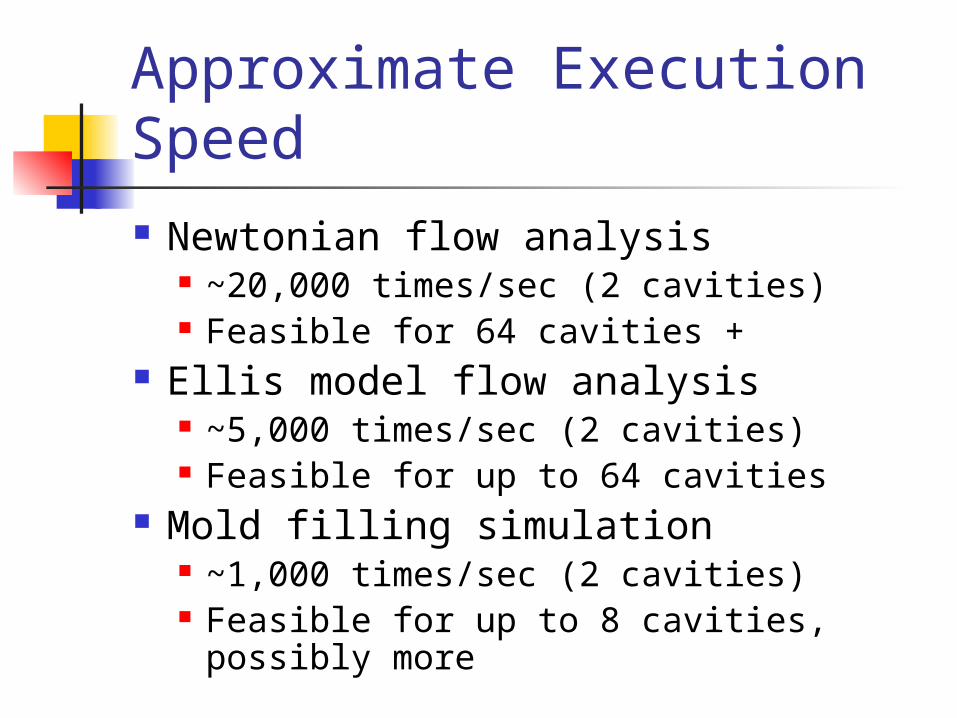
Approximate Execution Speed Newtonian flow analysis
~20,000 times/sec (2 cavities) Feasible for 64 cavities +
Ellis model flow analysis ~5,000 times/sec (2 cavities) Feasible for up to 64 cavities
Mold filling simulation ~1,000 times/sec (2 cavities) Feasible for up to 8 cavities, possibly
more
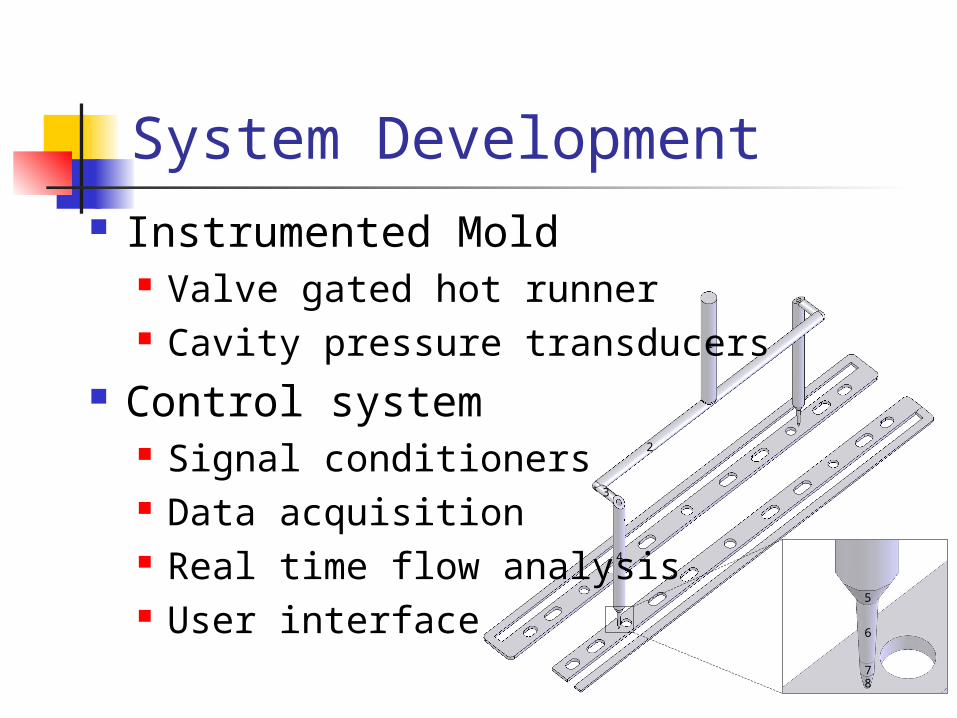
System Development
1
2
3
4
87
5
6
Instrumented Mold Valve gated hot runner Cavity pressure transducers
Control system Signal conditioners Data acquisition Real time flow analysis User interface
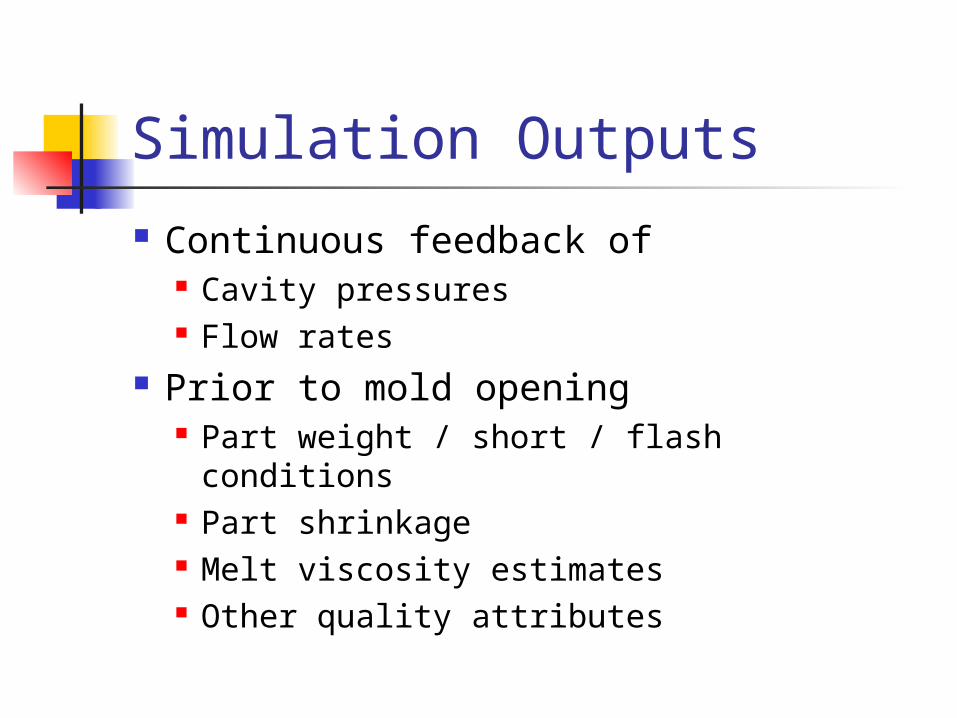
Simulation Outputs
Continuous feedback of Cavity pressures Flow rates
Prior to mold opening Part weight / short / flash conditions Part shrinkage Melt viscosity estimates Other quality attributes
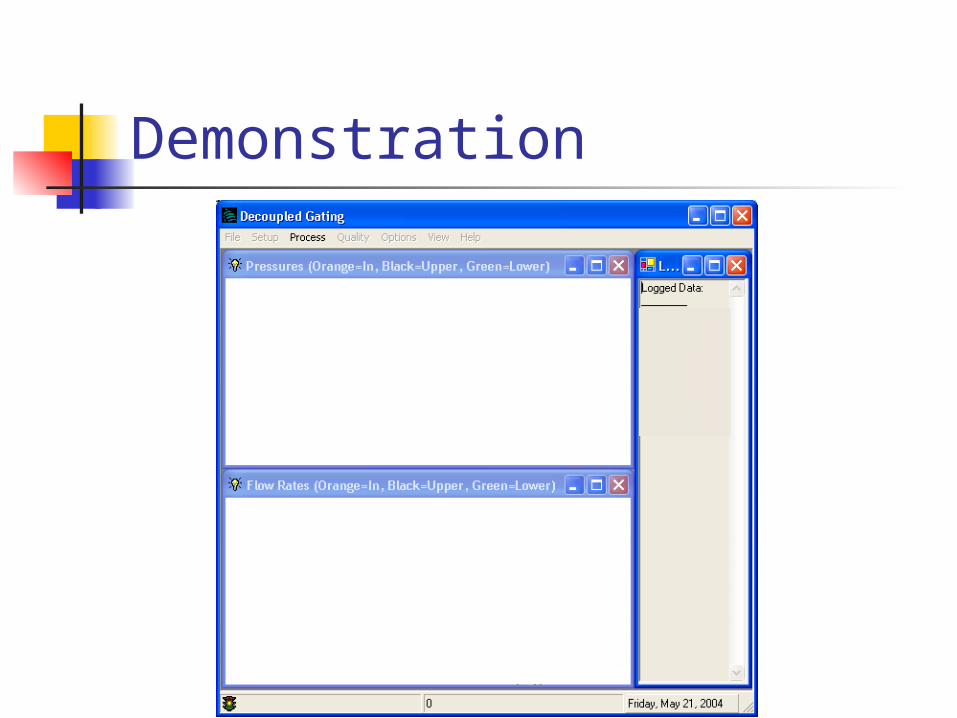
Demonstration
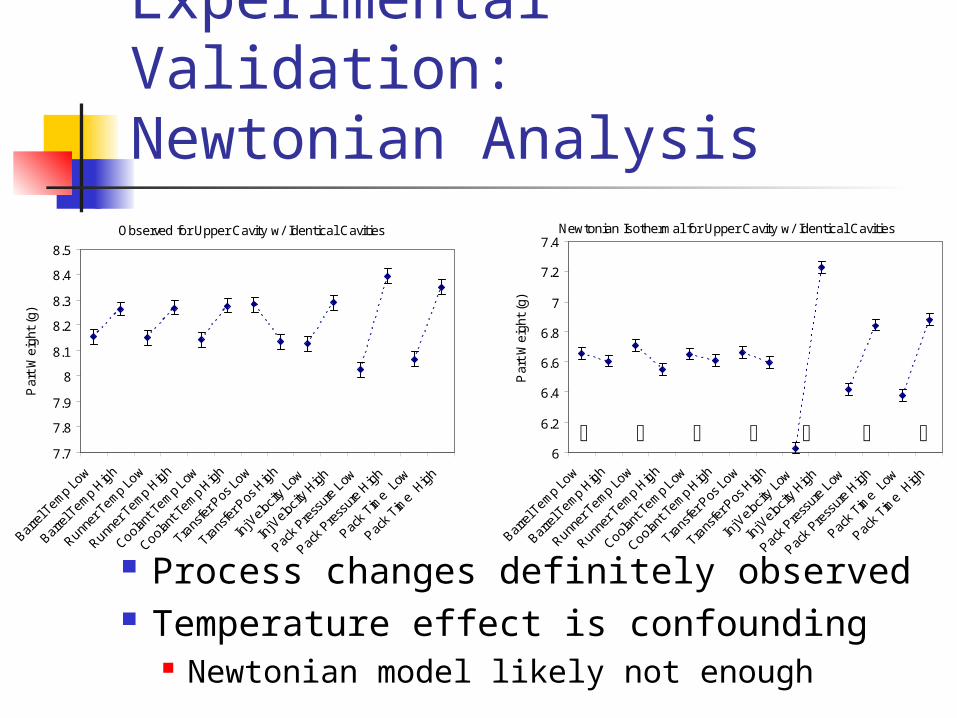
Experimental Validation:Newtonian Analysis
Observed for Upper Cavity w/ Identical Cavities
7.7
7.8
7.9
8
8.1
8.2
8.3
8.4
8.5
Par
t W
eigh
t (g
)
Newtonian Isothermal for Upper Cavity w/ Identical Cavities
6
6.2
6.4
6.6
6.8
7
7.2
7.4
Par
t W
eigh
t (g
)
Process changes definitely observed Temperature effect is confounding
Newtonian model likely not enough
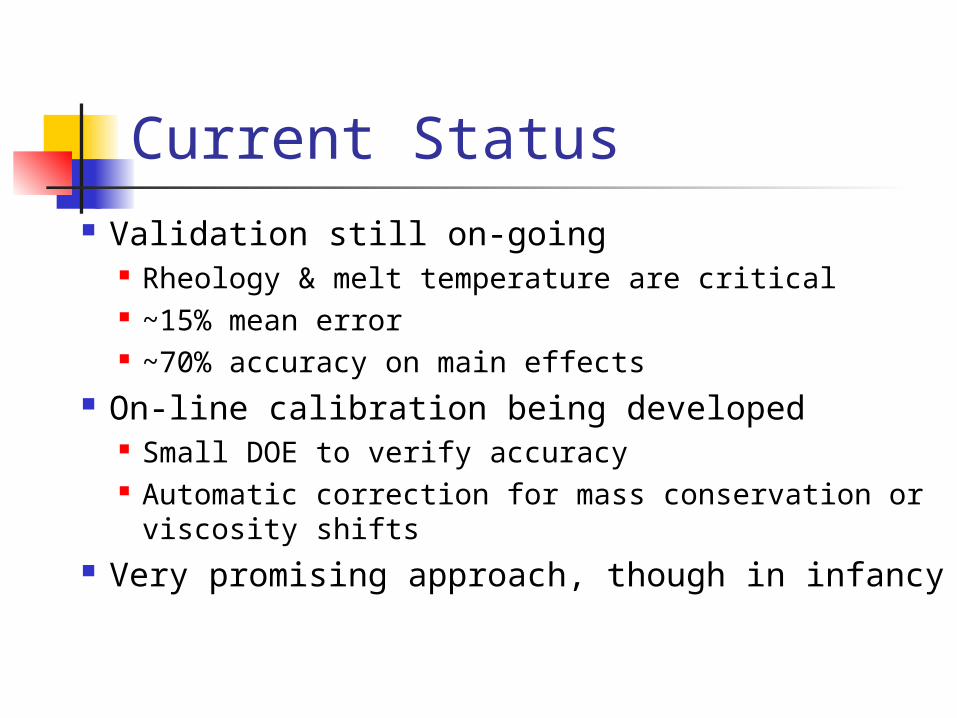
Current Status Validation still on-going
Rheology & melt temperature are critical ~15% mean error ~70% accuracy on main effects
On-line calibration being developed Small DOE to verify accuracy Automatic correction for mass conservation or
viscosity shifts Very promising approach, though in infancy
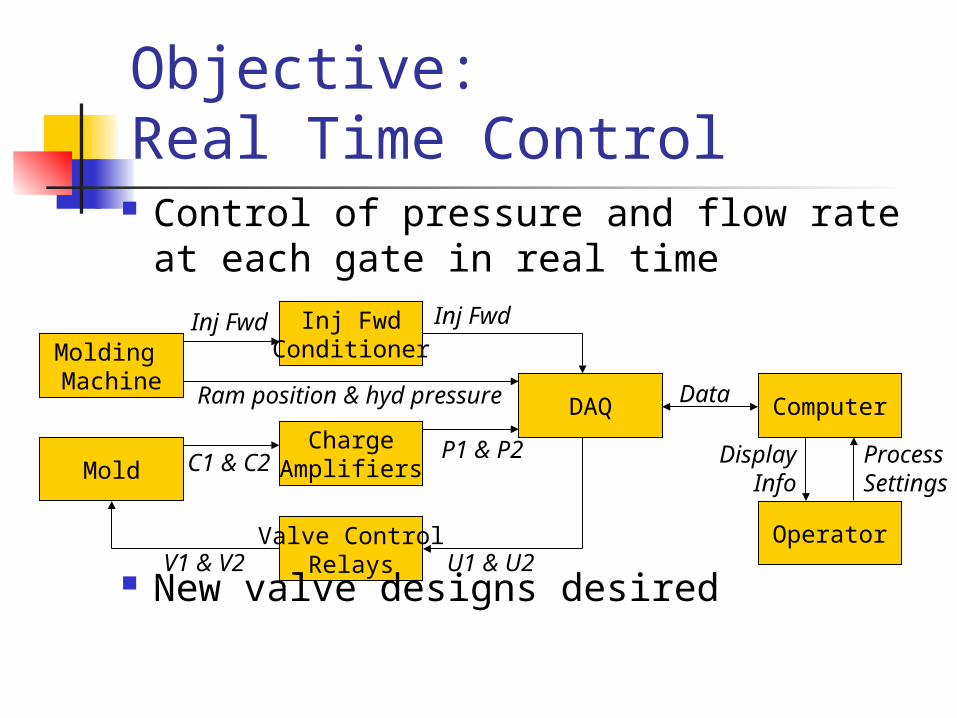
Objective:Real Time Control
Molding Machine
Mold
DAQ Computer
Operator
ChargeAmplifiers
Inj FwdConditioner
Valve ControlRelays
Inj Fwd
Ram position & hyd pressure
C1 & C2
Inj Fwd
P1 & P2
V1 & V2 U1 & U2
Data
DisplayInfo
ProcessSettings
Control of pressure and flow rate at each gate in real time
New valve designs desired
New Valve Designs
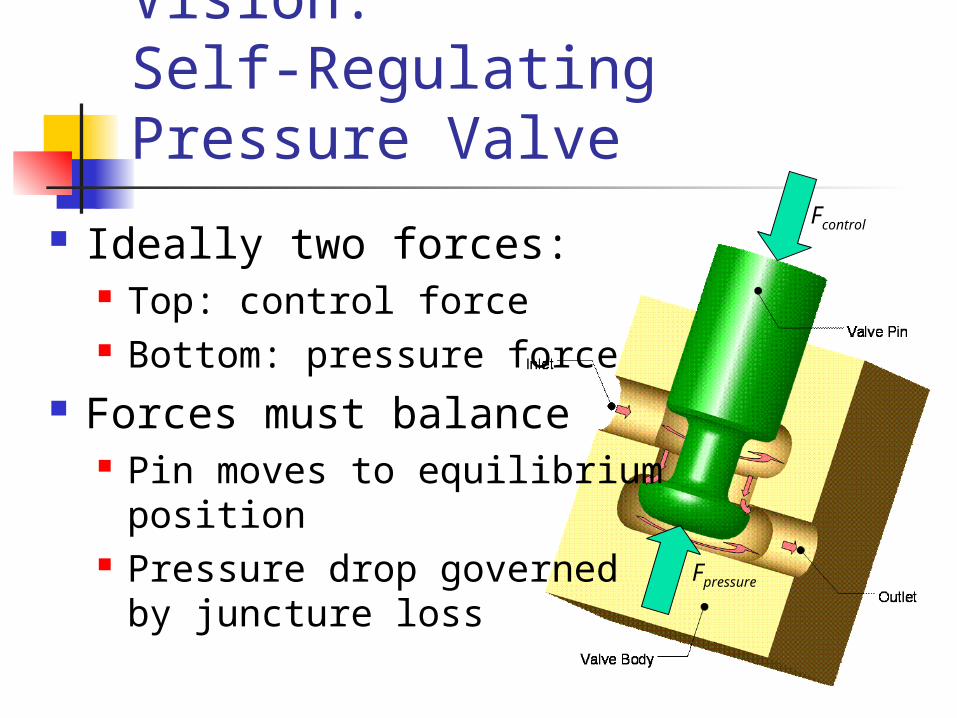
Vision: Self-Regulating Pressure Valve
Ideally two forces: Top: control force Bottom: pressure force
Forces must balance Pin moves to equilibrium
position Pressure drop governed
by juncture loss
Fcontrol
Fpressure
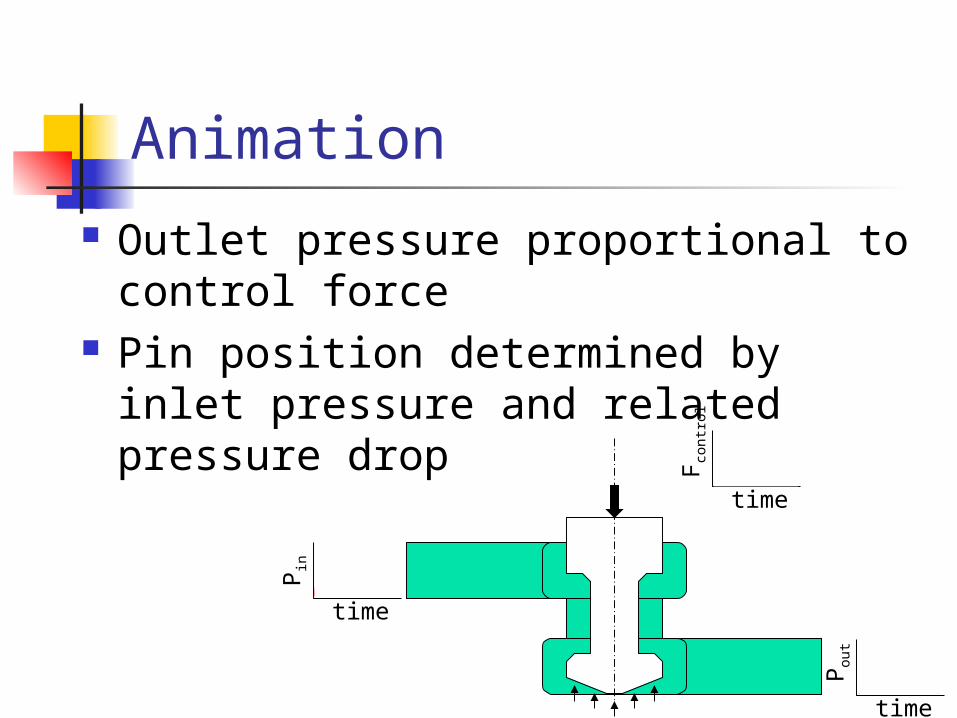
Animation Outlet pressure proportional to
control force Pin position determined by inlet
pressure and related pressure drop
F contr
ol
time
Pou
t
time
Pin
time
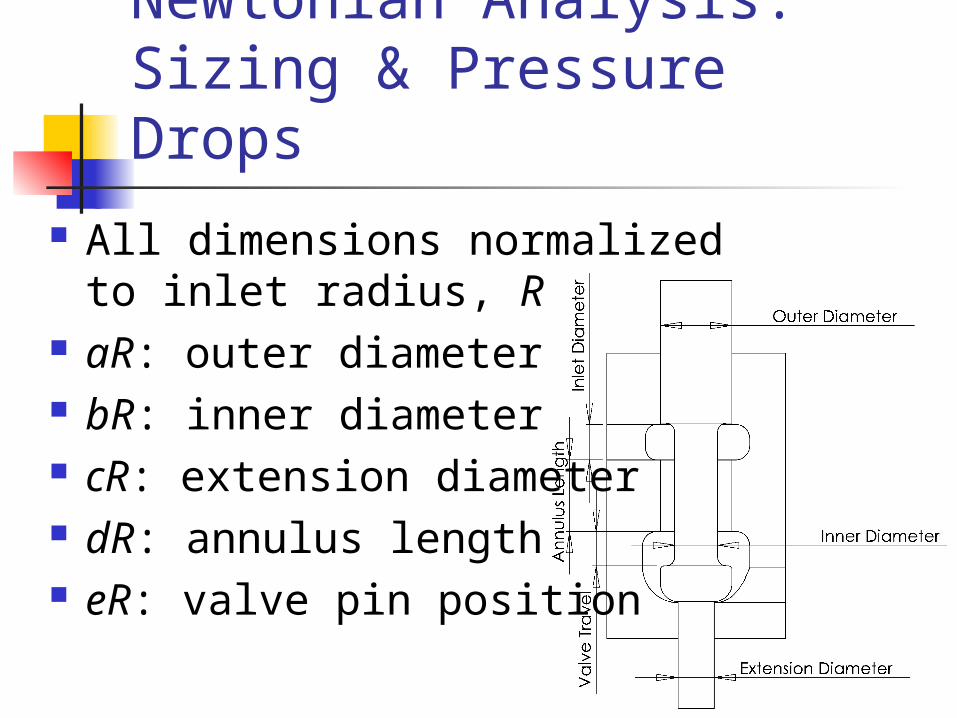
Newtonian Analysis:Sizing & Pressure Drops
All dimensions normalizedto inlet radius, R
aR: outer diameter bR: inner diameter cR: extension diameter dR: annulus length eR: valve pin position
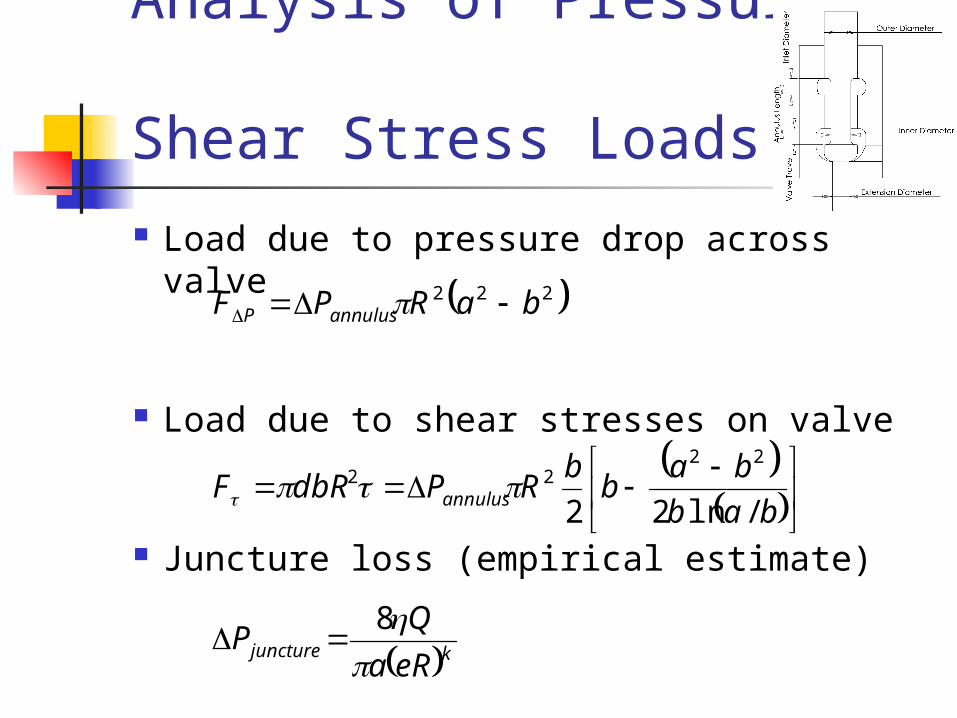
Analysis of Pressure & Shear Stress Loads
Load due to pressure drop across valve
Load due to shear stresses on valve
Juncture loss (empirical estimate)
222 baRPF annulusP
bab
bab
bRPdbRF annulus /ln22
2222
kjunctureeRa
QP
8
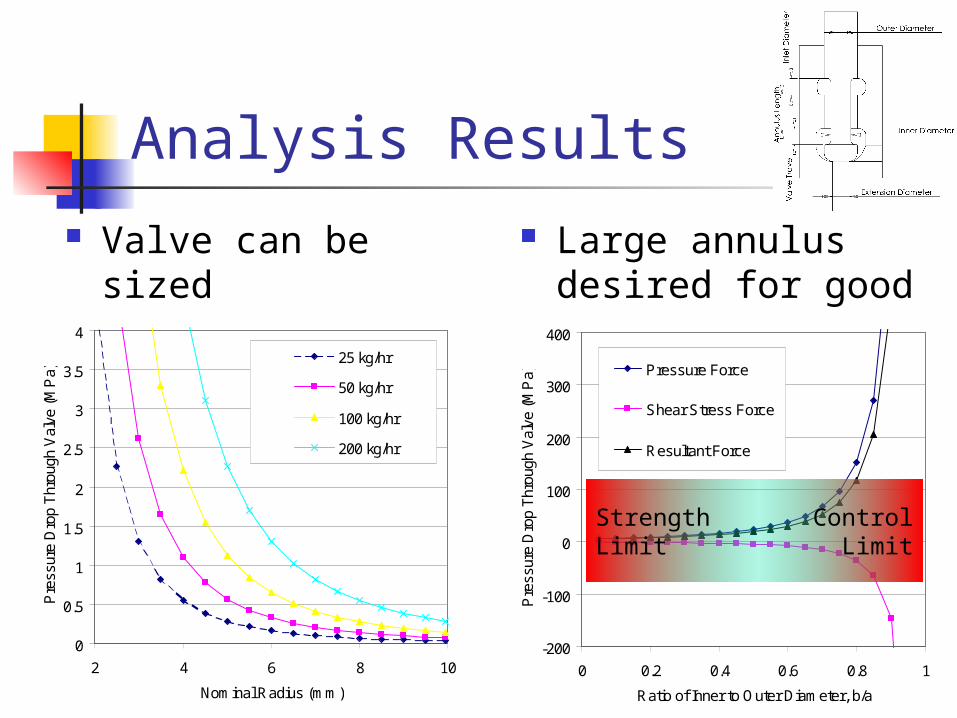
Analysis Results Valve can be sized
for mass rate and P
Large annulus desired for good control
0
0.5
1
1.5
2
2.5
3
3.5
4
2 4 6 8 10
Nominal Radius (mm)
Pre
ssur
e D
rop
Thr
ough
Val
ve (
MP
a)
25 kg/hr
50 kg/hr
100 kg/hr
200 kg/hr
-200
-100
0
100
200
300
400
0 0.2 0.4 0.6 0.8 1
Ratio of Inner to Outer Diameter, b/a
Pre
ssur
e D
rop
Thr
ough
Val
ve (
MP
a) Pressure Force
Shear Stress Force
Resultant Force
ControlLimit
StrengthLimit
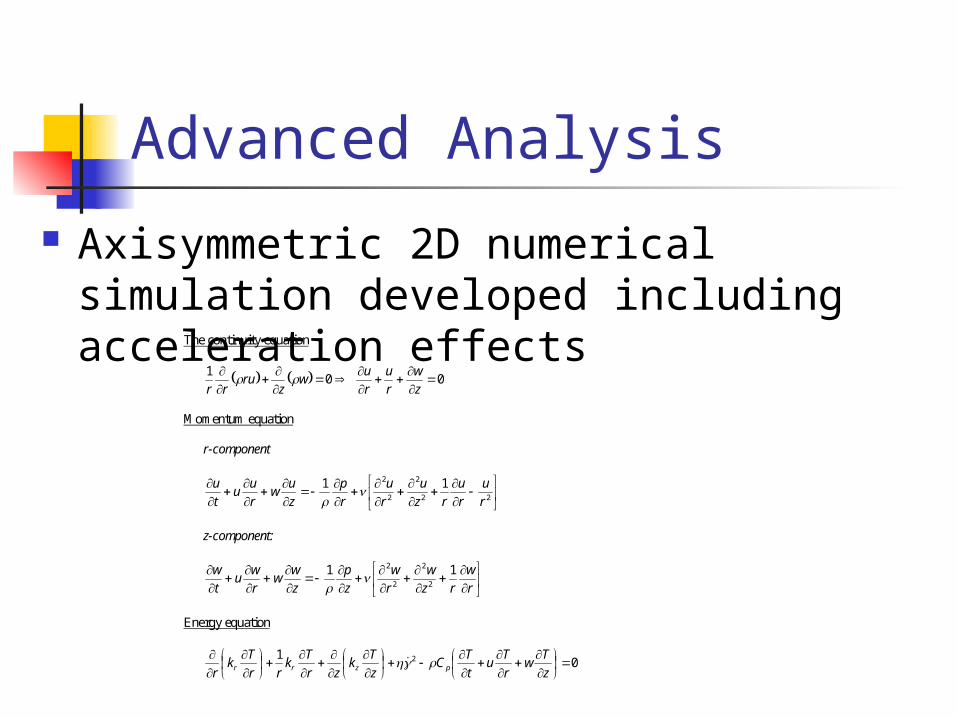
Advanced Analysis
Axisymmetric 2D numerical simulation developed including acceleration effectsThe continuity equation
0 01
z
w
r
u
r
uw
zru
rr (1)
Momentum equation
r-component
22
2
2
2 11
r
u
r
u
rz
u
r
u
r
p
z
uw
r
uu
t
u
(2)
z-component:
r
w
rz
w
r
w
z
p
z
ww
r
wu
t
w 112
2
2
2
(3)
Energy equation
01 2
z
Tw
r
Tu
t
TC
z
Tk
zr
Tk
rr
Tk
r pzrr (4)
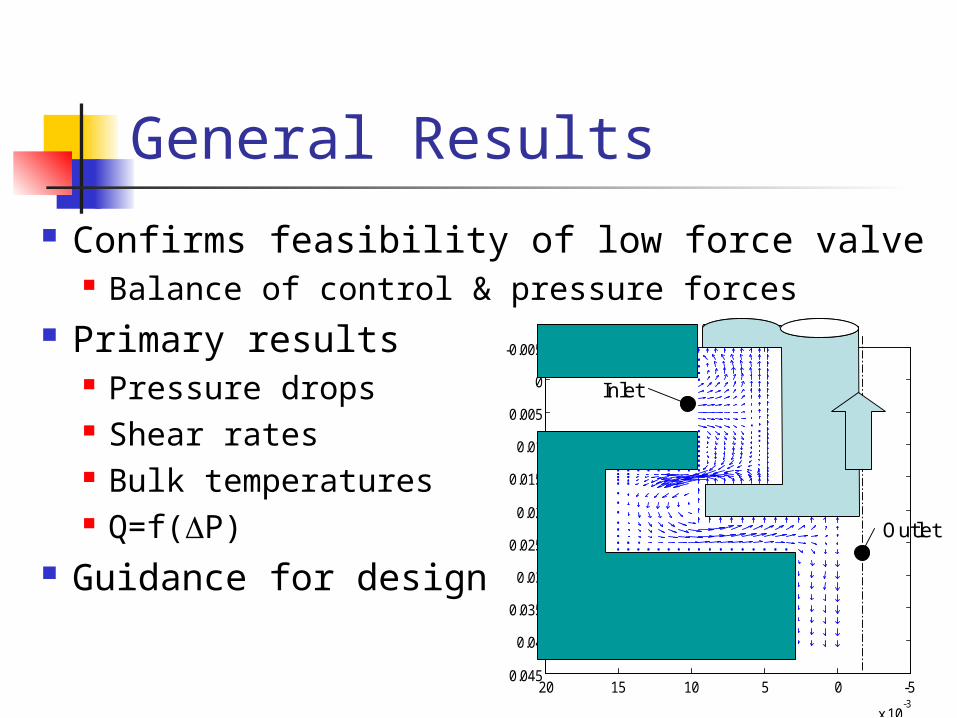
General Results
Confirms feasibility of low force valve Balance of control & pressure forces
Primary results Pressure drops Shear rates Bulk temperatures Q=f(P)
Guidance for design-505101520
x 10-3
-0.005
0
0.005
0.01
0.015
0.02
0.025
0.03
0.035
0.04
0.045
Inlet
Outlet
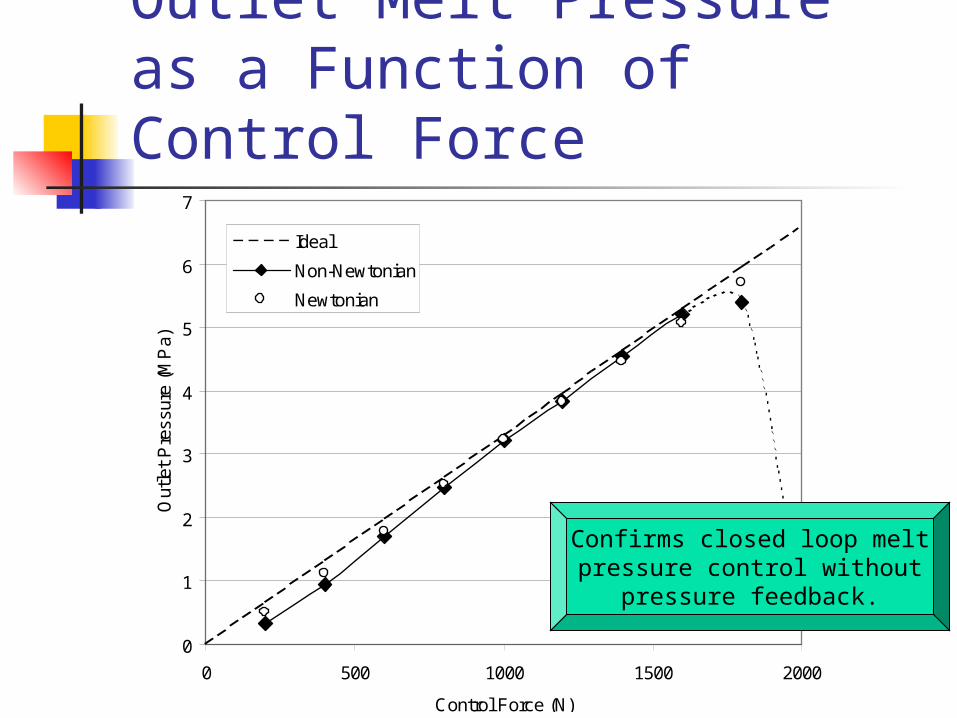
Outlet Melt Pressure as a Function of Control Force
0
1
2
3
4
5
6
7
0 500 1000 1500 2000
Control Force (N)
Out
let
Pre
ssur
e (M
Pa)
Ideal
Non-Newtonian
Newtonian
Confirms closed loop meltpressure control without
pressure feedback.
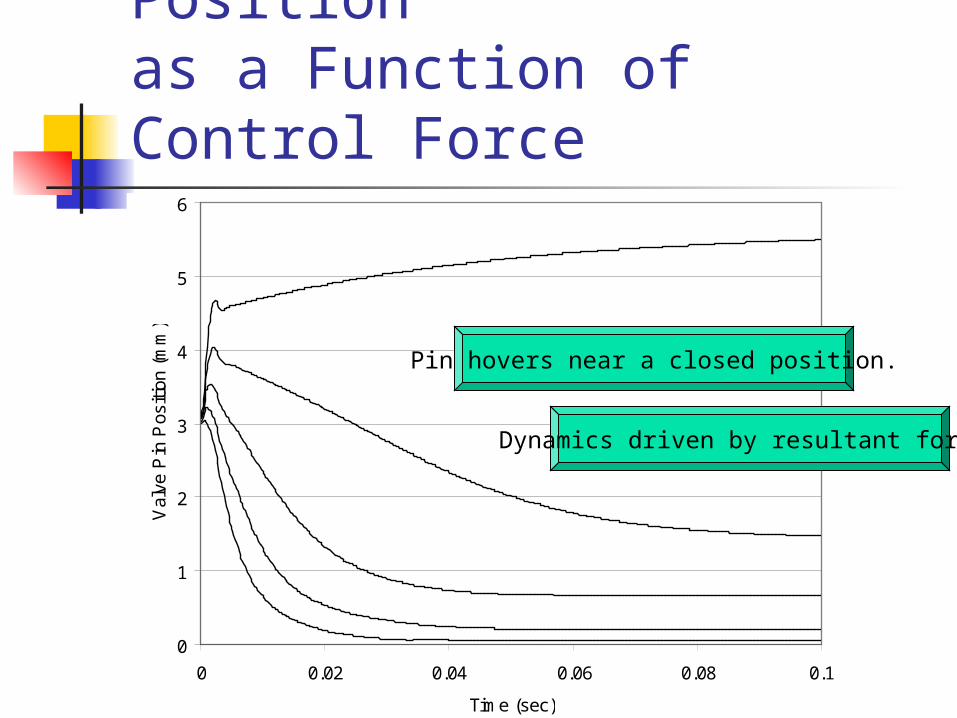
Dynamic Response & Positionas a Function of Control Force
0
1
2
3
4
5
6
0 0.02 0.04 0.06 0.08 0.1
Time (sec)
Val
ve P
in P
ositi
on (
mm
)
2000 N
1600 N
1200 N800 N400 N
Dynamics driven by resultant force.
Pin hovers near a closed position.
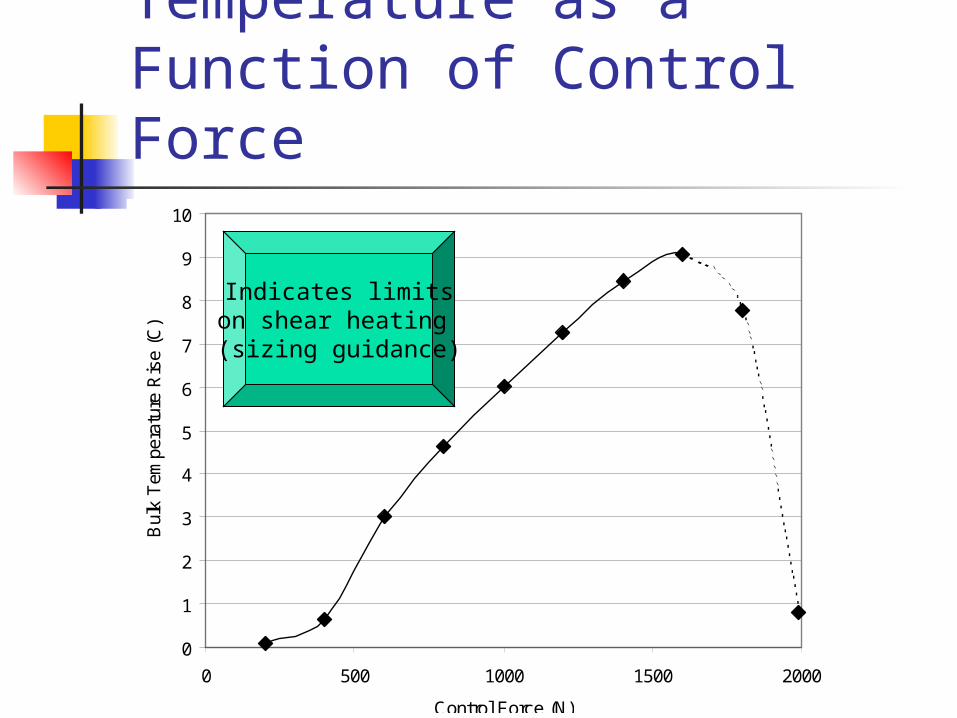
Outlet Bulk Temperature as a Function of Control Force
0
1
2
3
4
5
6
7
8
9
10
0 500 1000 1500 2000
Control Force (N)
Bul
k T
empe
ratu
re R
ise
(C)
Indicates limitson shear heating (sizing guidance)
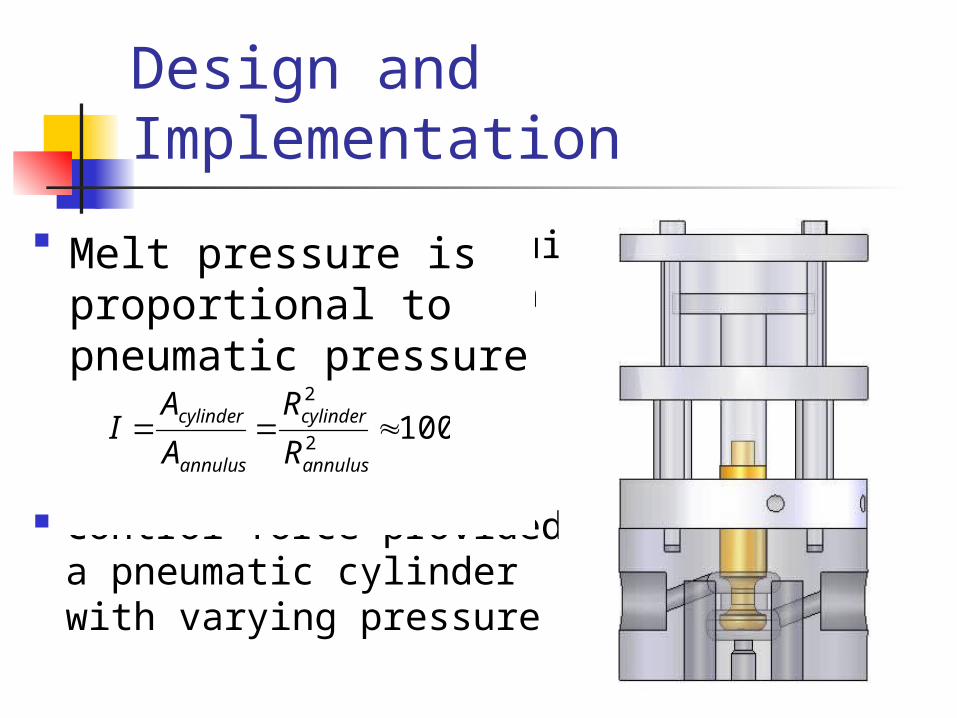
Design and Implementation
Valve designed and built Inlet diameter of 8 mm In-line configuration Pressure transducers
At inlet Below valve pin
Control force provided bya pneumatic cylinder with varying pressure
Melt pressure is proportional to pneumatic pressure
1002
2
annulus
cylinder
annulus
cylinder
R
R
A
AI
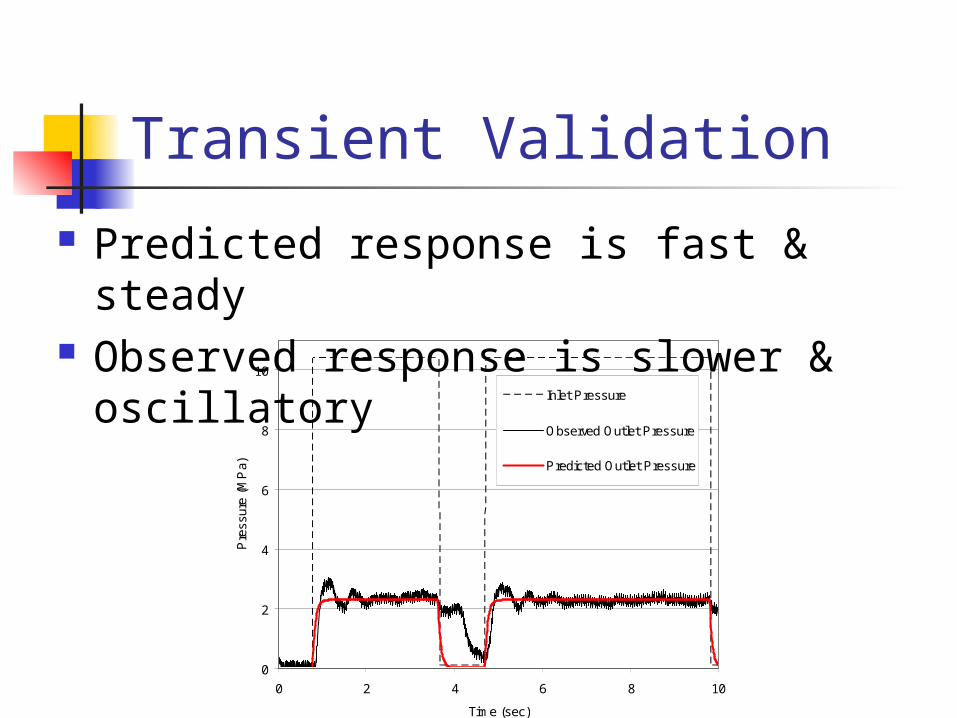
0
2
4
6
8
10
0 2 4 6 8 10
Time (sec)
Pre
ssur
e (M
Pa)
Inlet Pressure
Observed Outlet Pressure
Predicted Outlet Pressure
Transient Validation
Predicted response is fast & steady Observed response is slower &
oscillatory
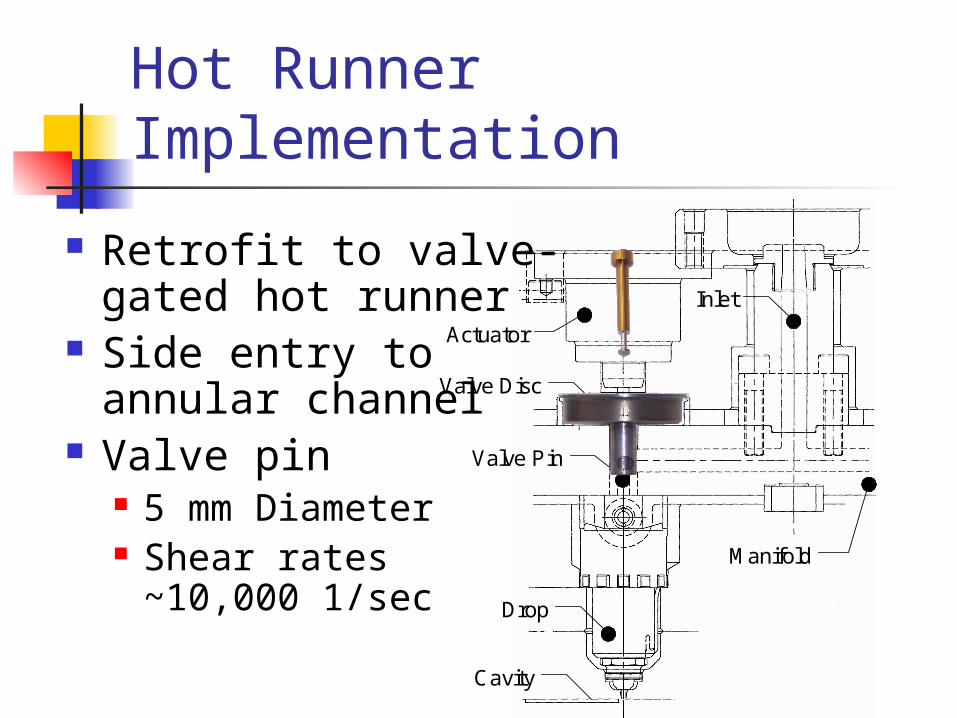
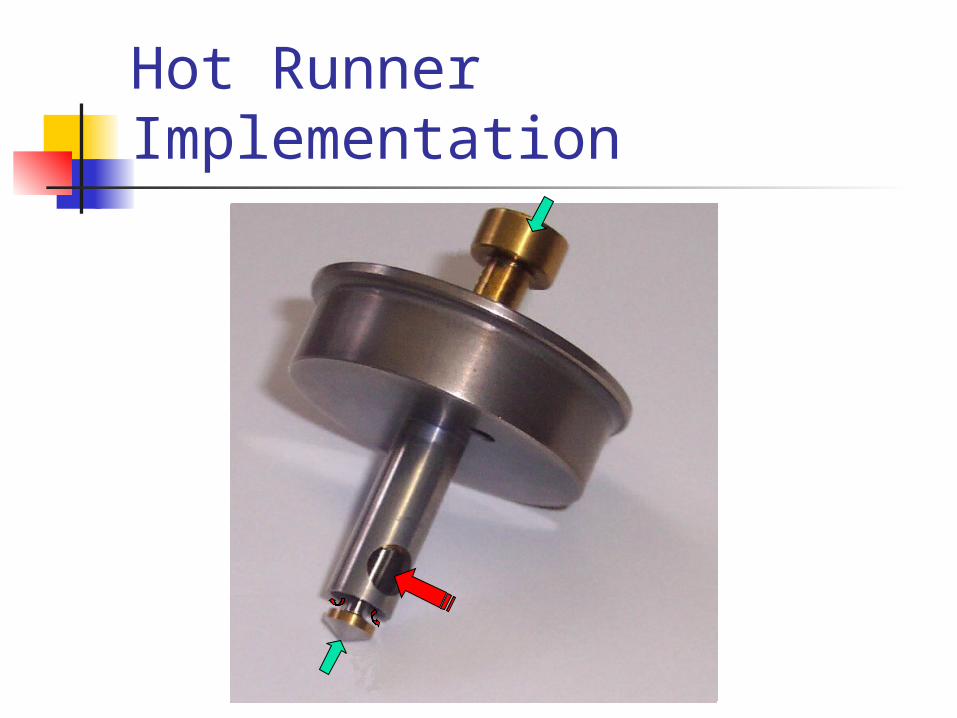
Hot Runner Implementation
Manifold
Valve Disc
Valve Pin
Actuator
Inlet
Drop
Cavity
Retrofit to valve-gated hot runner
Side entry toannular channel
Valve pin 5 mm Diameter Shear rates
~10,000 1/sec
Hot Runner Implementation
Resulting Capability
Cavity pressure control without pressure transducers! If cavity pressure transducers are used,
then process simulation can provide flow rates and other quality estimates
Can measure load on extended valve pin to completely eliminate pressure transducers
Conclusion
Closing Statements Vision is solid
Difficult work is done Capability must be validated
This is “where rubber hits the road” What is the best we can do?
Validation & specification nearly done Commercial feasibility studies in 2005

Two More Quick Projects
Wireless Pressure Sensor
The Alpha-Sigma Project
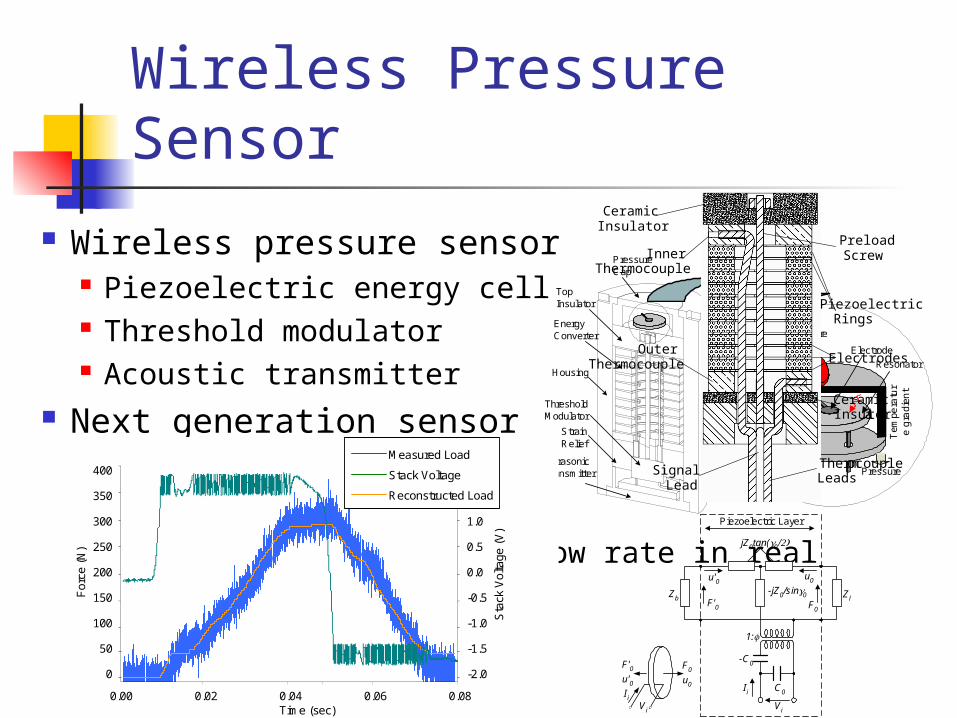
Resonator
Electrode
High Temperature
Melt
Tem
pera
tur
e g
radi
ent
Pressure Pressure
Pressure Cap
Top Insulator
Energy Converter
Strain Relief
Ultrasonic Transmitter
Housing
Threshold Modulator
Wireless Pressure Sensor
Wireless pressure sensor Piezoelectric energy cell Threshold modulator Acoustic transmitter
Next generation sensor =f(T) Multiple sensor arrays Pressure, temperature, flow rate in real time!
~5-10 years out
Signal Lead
Ceramic Insulator
Inner Thermocouple
Outer Thermocouple
Thermocouple Leads
Ceramic Insulator
Electrodes
Piezoelectric Rings
Preload Screw
Comparison of Pressure Curve and Threshold Modulator Reconstruction
0
50
100
150
200
250
300
350
400
-0.02 0 0.02 0.04 0.06 0.08Time (sec)
0.00 0.02 0.04 0.06 0.08Time (sec)
400
350
300
250
200
150
100
50
0
For
ce (
N)
2.0
1.5
1.0
0.5
0.0
-0.5
-1.0
-1.5
-2.0
Sta
ck V
olta
ge (
V)
Measured Load
Stack Voltage
Reconstructed Load
Vi
F0u0
-jZ0/sin0
jZ0tan(0
Vi
-C0
C0
1:
Ii
Zb
Piezoelectric Layer
Ii
F'0u'0
ZlF'0
u'0
F0
u0
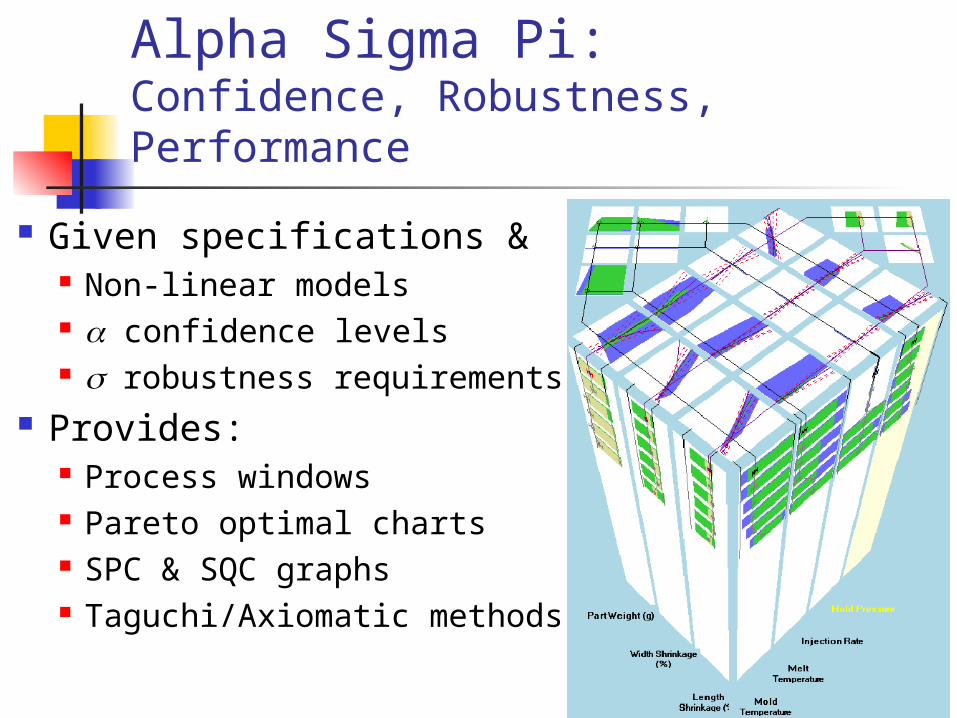
Alpha Sigma Pi: Confidence, Robustness, Performance
Given specifications & Non-linear models confidence levels robustness requirements
Provides: Process windows Pareto optimal charts SPC & SQC graphs Taguchi/Axiomatic methods

Graduate Students
You are important!
I want you to succeed!!
Guidelines
How to address me? Speaking to me: Dave Speaking to other faculty: Prof.
Kazmer Speaking to other students:
Kazmer #^&@@#^%

Guidelines
How to work with me: Respect and protect my time
Do high quality work Have others check your work, especially
thesis Be proactive
You’re empowered: assume authority Execute to plan
Commit and deliver
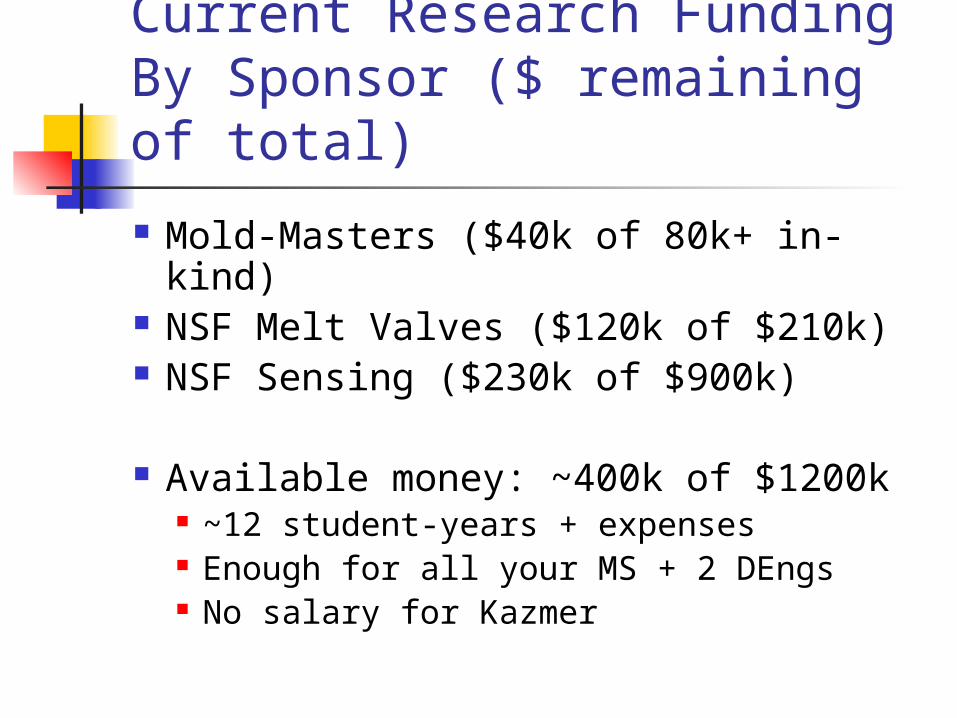
Current Research FundingBy Sponsor ($ remaining of total)
Mold-Masters ($40k of 80k+ in-kind) NSF Melt Valves ($120k of $210k) NSF Sensing ($230k of $900k)
Available money: ~400k of $1200k ~12 student-years + expenses Enough for all your MS + 2 DEngs No salary for Kazmer
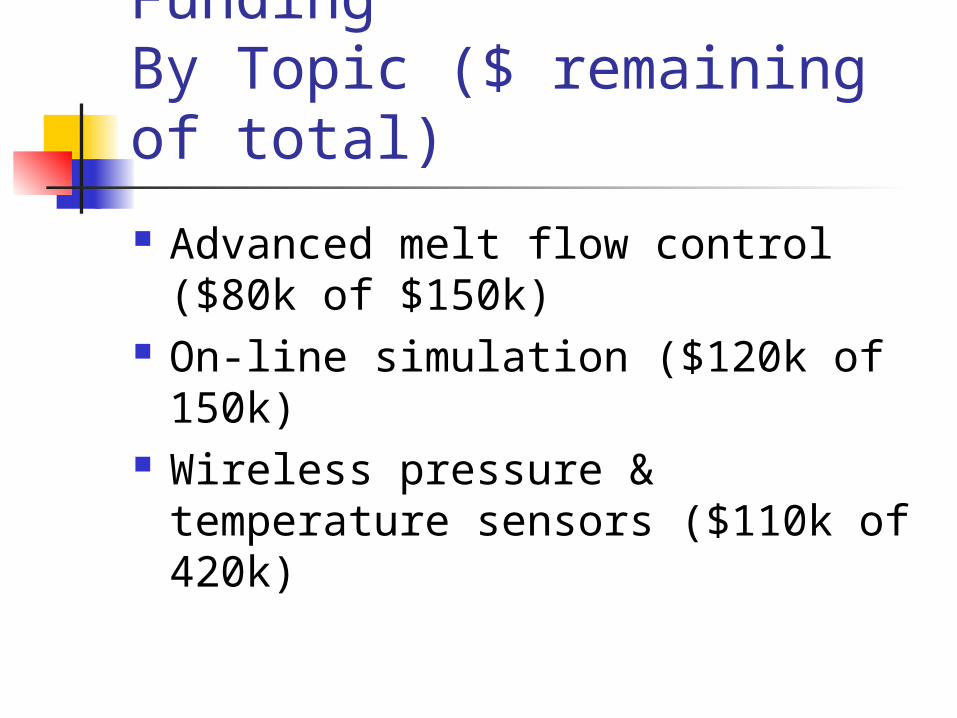
Current Research FundingBy Topic ($ remaining of total)
Advanced melt flow control ($80k of $150k)
On-line simulation ($120k of 150k) Wireless pressure & temperature
sensors ($110k of 420k)
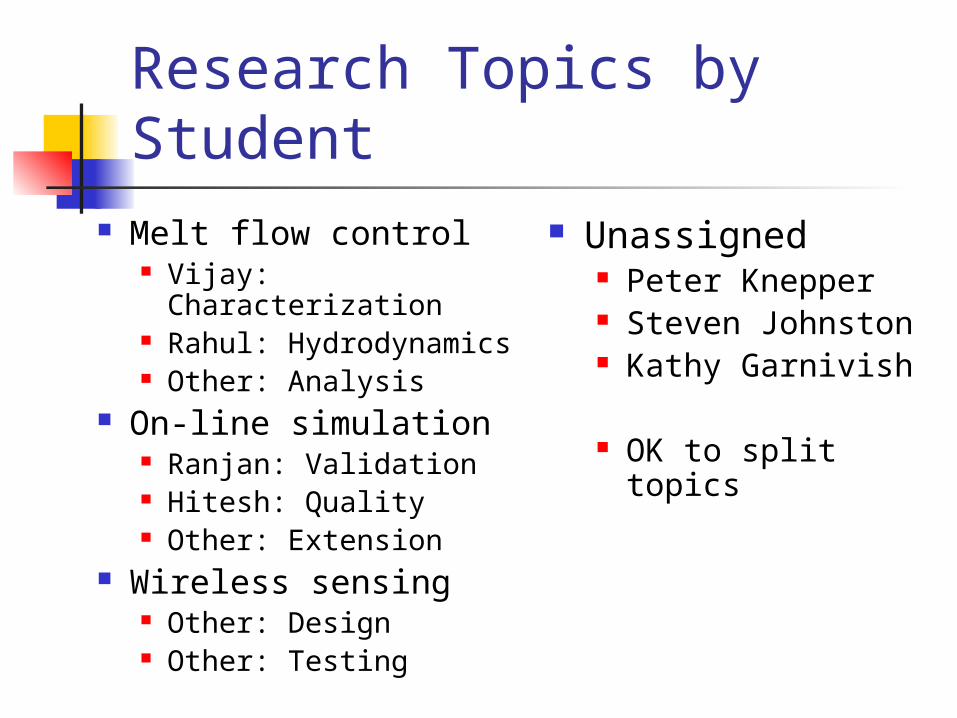
Research Topics by Student
Melt flow control Vijay:
Characterization Rahul: Hydrodynamics Other: Analysis
On-line simulation Ranjan: Validation Hitesh: Quality Other: Extension
Wireless sensing Other: Design Other: Testing
Unassigned Peter Knepper Steven Johnston Kathy Garnivish
OK to split topics