Embed Size (px)
Citation preview

School of Food and Nutritional Sciences
University College Cork
Ireland
School of Food and Nutritional Sciences
University College Cork
Ireland
Professor Elke Arendt
Advances in gluten free cereal research,

Coeliac Disease
What is coeliac disease?
Autoimmune disease
Intolerance to gluten
Changes to the lining of the
upper part of intestine
Malabsorption
Possible causes
Genetic predisposition
Environmental factors
Immunological based
inflammationIceberg model depicting prevalence of
coeliac disease from Feighery (1999)

CD is a multi-organ autoimmune
disease caused by gluten intolerance
adapted from Rewers 2005

Treatment – Gluten free diet
Wheat Barley Rye ?Oats

Eragrostis tef
Teff
Eleusin
coracana
Finger millet
Cereals Allowed:
GF Cereals and Pseudocereals
Oryzoidae
Rice
Panicoideae
zea mays
Maize
Sorghum bicolor
Sorghum
Pennisetum
glaucum
Perl Millet
Setaria Italica
Italien Millet
Fagopyrum
esculentum
Buckwheat
Amaranthus
cruentus
Amaranth
Chenopodium
quinoa
Quinoa
Pseudocereals

Consumers benefitting from a gluten free diet
Coeliac Disease patients
( 1 to 2 % of the population)
Gluten sensitivity (10 to 20 %)
Wheat protein allergies (very small %)
Autism
Irritable Bowel Syndrome and Crones
Disease (approx. 20 %)
Skin-disorders
Life style choice
Special diets
Relations from above patients
9 out of 10 consumers buying GF-foods
are not Coeliac patients

Gluten free Market study
100 bread products from 15 countries
Free-from market: 300% growth since 2000
Growth rate of 25% per year
Only 1 out of 10 consumers buying GF-products
are coeliac patients
Marketing study UCC
Dry, crumbly mouth feel and off-flavor
Lack of Nutrients, high in fat
Rapid staling (mostly starch based)
Expensive
Long shelf life
Nutritional Information
Volume
Texture
Sensory evaluation
Price

Nutritional Composition of GF Breads
Gluten free white bread Wheat bread
Calories 196 kcal 311 kcal 219 kcal
Fat 1.7 % 15.6 % 1.4 %
Protein 1.1 % 6.6 % 8.7 %
Carbohydrates 35.0 % 62.7 % 43.0 %
Fibre 0.1 % 8.3 % 2.8 %

wheat flour + water
mixing
proofing
baking
GF flour + water
mixing
proofing
baking
Bread-making
Wheat vs. Gluten-free
CLSM of bread crumbs
CLSM of dough/batter

Gluten-free flours
New Generation Gluten-free bread development
Functional ingredients
Novel processing approaches
EnzymesLactic acid bacteria
Hydrocolloids Dough improversCereals Pseudo-cereals
High fibre
ingredients
Malting
Starches

School of Food and Nutritional Sciences
University College Cork
Ireland
Gluten free cereals and their characterization

Eragrostis tef Teff
Eleusin coracanaFinger millet
Gluten free cereals
OryzoidaeRice
Panicoideaezea mays
Maize
Sorghum bicolorSorghum
Pennisetumglaucum
Proso Millet
Avena sativa L.Oats
Fagopyrum
esculentum
Buckwheat
Amaranthus cruentus
Amaranth
Chenopodium quinoaQuinoa
Pseudocereals

Potential nutritional deficiencies
On diagnosis On GF diet On long-term
GF diet
Protein/calorie
Fibre
Fe, Zn, Cu, Mn
Vit D, Vit K
Ca, Mg
Folate, B12
Thiamin
Niacin
Pyridoxine
Riboflavin
Se, Carnitine
Fibre
Fe, Zn
Vit D
Ca, Mg
Folate, B12
Niacin
Riboflavin
Fibre
Folate, B12
Niacin
Pyridoxine
based on data provided by Kennedy et al.

Evaluation of technological and nutritional properties of gluten-free raw materials and end products
Nutrition
•Protein
•Aminoacids
•Fat
•Starch
•Fibre
•Folate
•Minerals
•Polyphenols
Technology
• Rheology
• Bioanalyser
• Rapid Viscoanalyser
• Enzyme activities
• Rheofermentometer
• Particle size
• Waterholdingcapacity
• Differential scanning calorimetry
Product quality
• Loaf volume
• Moisture
• Water activity
• Crumb texture
• Crumb structure
• Staling
• Microbial shelf life
• Bake loss
• In vitro digestibility
• Sensory evaluation
• Ultrastructure

Gluten-free flours – nutritional value 4%10%
13%
72%
1%
Whole wheat
2%
11%
13%
73%
1%
Wheat
2% 6%
14%
78%
0%
Maize4%
12%
13%
69%
2%
Buckwheat1%
7%
13%
78%
1%
Rice4%
13%
10%
71%
2%
Teff
7%7%
10%
75%
1%
Oat
3% 5%
11%
80%
1%
Sorghum
9%
14%
12%63%
2%
Quinoa

School of Food and Nutritional Sciences
University College Cork
Ireland
Nutritional Quality of GF grains
Protein content [%] Dietary fibre content [%]
Calcium content [mg/100g]Iron content [mg/100g]
Hager, A.-S., A. Wolter, et al. (2012). "Nutritional properties and ultra-structure of commercial gluten free flours from different botanical sources compared to wheat flours." Journal of Cereal Science 56(2): 239-247.
1834 33 30
180
132
77
37
96
Folic acid [µg/100g]

Gluten-free flours – baking properties
120
95 90 85
67 63
0
20
40
60
80
100
120
Wat
er
leve
l [%
bas
ed
on
flo
ur]
Oat represents exception: sensory score and loaf quality comparable to
wheat bread
Quality of gluten free breads inferior to wheat counterparts regarding taste attributes, loaf
volume, crumb texture, microbial shelf life, staling

SEM micrographs (1500/2000x) of wheat flour (a); dough (b), and bread (c).
a b c
SEM micrographs (1500/1000x) of maize flour (a), dough (b), and bread (c)
a b c
•c
SEM micrographs (2200/2300x) of quinoa flour (a), dough (b) and bread (c)
a b c

Evaluation of technological and nutritional properties of gluten-free starches
Composition
•Moisture
•Total starch
•Amylose
•Amylopectin
•Damaged starch
•Protein
•Alpha- Amylase
•Beta-Amylase
Morphology
Pasting,
Visco-elastic properties
• Rapid Viscoanalyser
• Rheometer
Bread analysis
• Loaf volume
• Moisture
• Crumb texture
• Crumb structure
• Bake loss
18
•Scanning electron microscopy
•Confocal laser scanning microscopy

19
Starch Size (µm)
Potato starch 4- 25 ; 31- 87
Tapioca starch 4– 20
Corn starch 3- 21
Rice starch 3- 7
Wheat starch 4- 14 ; 17- 30
Scanning electron micrographs. Magnification 1000x. Scale bar represent 10µm
Granules sizes of the
different starches
Potato starch Rice starchCorn starch
Wheat starch Tapioca starch

Potato starch
Impact of starch on model bread quality
Wheat starchRice starchCorn starchTapioca starch
Starches show very different behaviour and composition
Bread quality is dependent on the type of starch used.

School of Food and Nutritional Sciences
University College Cork
Ireland
Hydrocolloids and LAB producing EPS

Hydrocolloids
• Group of polysaccharides
• Sources include trees, plants, seaweed and bacteria
• used in food products to control
rheology and texture
stabilise emulsions
organoleptic properties
• produce highly viscous solutions, form gels with varying texture
Commonly found Hydrocolloids in
GF-cereal products

Gluten free model systems:
With HPMC
• Gas retention
• High volume
• Porous structure
No HPMC
• Weak structure
• Poor volume
• Dense, heavy texture
Impact of Hydrocolloids

ExopolysaccharidesEPS produced by LAB
EPS are extracellularly secreted microbial polysaccharides
Their amount and chemical structure depend on microorganism and substrate
Cereal associated lactic acid bacteria (LAB) are known to produce EPS in
large quantities
Two classes of EPS: homo- and heteropolysaccharides
HeteropolysaccharideComposed of repeated subunitsRepeating units consists of three to eight monosaccharidesSynthesised intracellularly from sugar nucleotide precursorsLow yield: <2g/l
HomopolysaccharideComposed of one type of monosaccharides (Glucose or Fructose)Synthesised by extracellular glycansucrases using sucroseUp to 50g/l
Laser-scanning electron microscopy of EPS LAB producing EPS

Sourdough technology: Hydrocolloids (LAB - EPS)
Exopolysacarideproduce LAB
EPS are extracellularl secreted microbial polysaccharides
Their amount and chemical structure depends on the microorganism and the growth substrate
Cereal associated LAB are known to produce EPS in large quantities
Dry, crumbly mouth feel and rapid staling
• LAB screening for EPS producer and EPS isolation
• Physicochemical characterisation (monomer composition, type of linkage, MW)
• GF sourdough fermentation (growth condition, optimisation, metabolic profile, EPS formation)
Experimental design
In vitro screening
In vitro characterisation
In situ investigation

LAB EPS production – Effect on bread
Wheat (EPS +) sourdough bread Wheat (EPS -) sourdough bread
Control Sourdough EPS producer
Effect on bread
Improves volume
Reduces staling
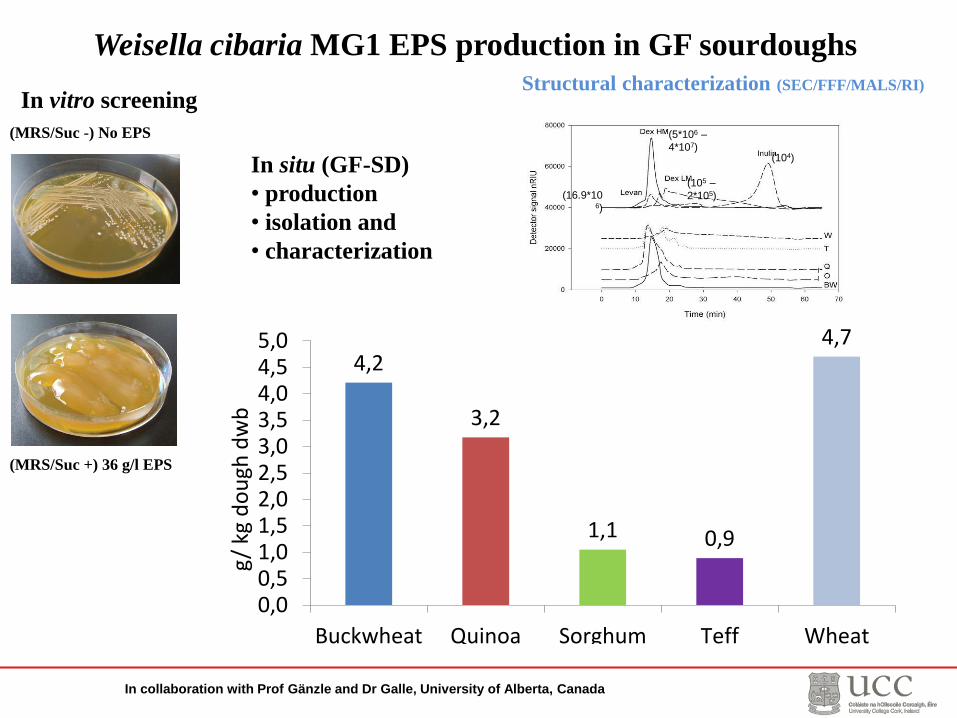
(5*106 –
4*107)(104)
(16.9*106)
(105 –
2*105)
Weisella cibaria MG1 EPS production in GF sourdoughsStructural characterization (SEC/FFF/MALS/RI)
In collaboration with Prof Gänzle and Dr Galle, University of Alberta, Canada
(MRS/Suc +) 36 g/l EPS
(MRS/Suc -) No EPS
In vitro screening
In situ (GF-SD)
• production
• isolation and
• characterization
4,2
3,2
1,1 0,9
4,7
0,00,51,01,52,02,53,03,54,04,55,0
Buckwheat Quinoa Sorghum Teff Wheat
g/
kg d
ou
gh d
wb

Sourdough fermentation – improvement of texture & taste
Breads produced with 20% sourdough fermented with Weissella cibaria
Strain produces Exopolysaccharides
0
0,5
1
1,5
2
2,5
3
3,5
4
Spec
ific
vo
lum
e [m
L/g]
Ctrl Bread
SD Bread
05
101520253035404550
Cru
mb
har
dn
ess
[N]
• Specific volume was significantly improved only in wheat breads• Crumb hardness reduced in all breads but sorghum• Staling rate reduced in teff and buckwheat bread• Improved sensory profile with addition of sourdough
In collaboration with Prof Gänzle and Dr Galle, University of Alberta, Canada

School of Food and Nutritional Sciences
University College Cork
Ireland
Enzymes and their impact on gluten free model breads
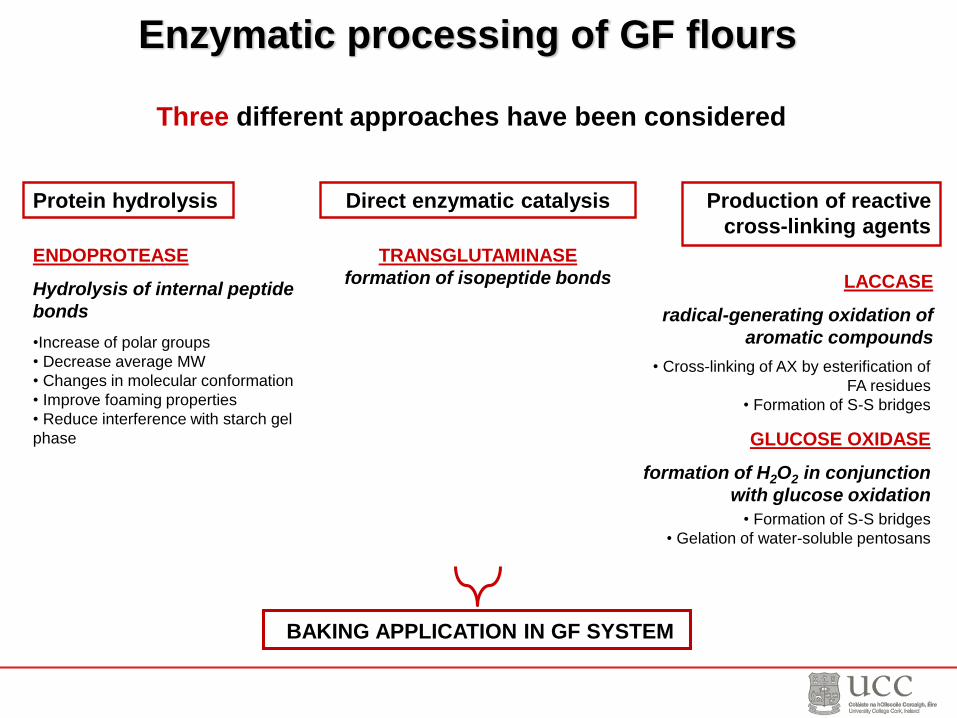
Enzymatic processing of GF flours
Production of reactive
cross-linking agents
LACCASE
radical-generating oxidation of
aromatic compounds
GLUCOSE OXIDASE
formation of H2O2 in conjunction
with glucose oxidation
• Cross-linking of AX by esterification of
FA residues
• Formation of S-S bridges
• Formation of S-S bridges
• Gelation of water-soluble pentosans
Protein hydrolysis
BAKING APPLICATION IN GF SYSTEM
ENDOPROTEASE
Hydrolysis of internal peptide
bonds
•Increase of polar groups
• Decrease average MW
• Changes in molecular conformation
• Improve foaming properties
• Reduce interference with starch gel
phase
Three different approaches have been considered
Direct enzymatic catalysis
TRANSGLUTAMINASE
formation of isopeptide bonds

Enzymes and their influence on GF -bread
Screening of the effect of enzymes on gluten free cereals
Transglutaminase, Laccase, Glucose oxidase & Protease
Characterisation the impact on rheological properties
Fundamental rheology, viscometry, creep-test, rapid visco-analyser
Impact of bread characteristics and ultra structure
Texture profile analysis, image analysis, rheo-fermento-meter, laser scanning microscopy,
electron-microscopy
Understanding of the interactions
Capillary electrophoresis, size exclusion
chromatography, NIR, HPLC, SDS, 2D electrophoresis
0
1000
2000
3000
4000
5000
6000
7000
0 1 2 3 4 5 6 7
time (h)
G', G
'' (
Pa
) .
G' 10 U/g G'' 10 U/g
G' 1 U/g G'' 1 U/g
G' 0 U/g G'' 0 U/g

Transglutaminase – Different GF-Raw-material
-No
changes
NoneSorghum
-No
changes
NoneTeff
-No
changes
NoneOats
+G’ ↓
G’’ ↓
Positive
Corn
+G’ ↑
G’’ -
Positive
Brown rice
+G’ ↑
G’’ -
Positive
Buckwheat
LaserRheologyStructurRaw-material

Frequency (Hz)
0.1 1 10
|G*|
(P
a)
10
100
1000
10000
10
15
20
25
30
-20
0
20
40
60
80
100
120
0 10 20 30 40 50 60
retention time (min)
mA
U
control
incubated
A BA B
TGase processing of GF flours
Fundamental
rheology of batters
SE-HPLC of protein
fractions
2D gel of protein
fractions
Buckwheat
Untreated Treated
In collaboration with Prof Vogel and Dr Behr, TU – Munich, Germany

School of Food and Nutritional Sciences
University College Cork
Ireland
In vitro starch digestibility and estimated glycaemic index of various gluten-free breads upon sourdough addition

• Extent of increase of blood glucose concentration
• Characterisation of carbohydrate-containing foods into categories (Atkinson’s table 2008)
35
Glycaemic index
www.rogerspeakperformers.com
The GI is defined as the incremental area under the curve (AUC) of the blood glucoseconcentration upon ingestion of a carbohydrate-containing food relative to reference food(glucose, GI glucose=100, or white wheat bread, GI white wheat bread=100) (Jenkins et al.1981)
Factors influencing glycaemic response

Baking
In vitro multi-enzyme dialysis
Sourdough
Sourdough breads
Control breads
Pepsin α-amylase Glass beads
buffer
sample
10-11 kDa
Weissella cibaria
Lactobacillus plantarum
Brennan 2008

In vitro glycaemic index – Control breads
37

Sorghum, teff:Higher gelatinisation temperatures
Oat-, sorghum- and teffHigher dietary fibre content
Decrease GI
Quinoa:Smallest granules
Higher enzymatic starch susceptibility
Lowest amylose content Reduced recrystallization
Buckwheat:Low dietary fibre content
Quinoa <1-2 µmBuckwheat, Teff 5 µmSorghum 10 µmWheat 6/15 µm
Size
Increase GI
71°C Teff 69°C Sorghum
66°C Buckwheat61°C Wheat 58°C Quinoa56°C Oat
Gelatinisation
Influence on in vitro GI – Starch properties
38

0
20
40
60
80
100
120
Wheat Teff Sorghum Quinoa Oat Buckwheat
Control W.cibaria MG1 L.plantarum FST1.7
20% sourdough addition: Reduced GI for wheat breadGluten-free breads: Only in teff and sorghum with Lactobacillus plantarum
Influence of sourdough on glycaemic index

The right mix
Hydrocolloids
Sourdough
Protein Source
GF Cereals
rich in fibre &
micro-nutrientsHigh fibre
ingredients
WaterStarch
Enzymes
Malt

School of Food and Nutritional Sciences
University College Cork
Ireland
Commercial Gluten Free Bread

Nutritional Information
Typical values per 100g of dry product
Energy 219 kcal 296 kcal 204 kcal 196 – 311 Kcal
Protein 8.7g 8.4g 6.6 g 1.1 – 8.4 g
Carbohydrates
Of which sugar
43g
2.42g
41.1g
3.0g
34.2 g 35.0 – 62.7
1.13 g
Fat
Of which saturates
1.4g
0.4g
13.0g
0.9g
2.8 g 1,7 -15,6
Fibre 2.8g 9.7g 8.0 g 0,1 – 8.3
Sodium 0.45g 0.63g 0.62 g
Range based on market study
Comparison of GF-breads and wheat bread
Consumer studies showed that GF bread developed in UCC could not be
distinguished from wheat bread

It is possible to produce a Gluten free bread comparable to wheat bread

Further Reading

Department of Food and Nutritional Sciences,
University College Cork, Ireland
Thank you very much
for your attention!