Embed Size (px)
Citation preview
Advances in Engineering: an International Journal (ADEIJ), Vol. 1, No.1, September 2016
55
ANALYSIS OF LIGHTNING STRIKE WITH CORONA ON
OHTL NEAR THE SUBSTATION BY EMTP
Zahira ANANE1 , AbdElhafid BAYADI1 and Alen Bernadić2
1 Department of Electrical engineering
Automatic Laboratory (LAS) of Setif 1 Faculty of technology, UFAS, Setif, Algeria
2Associate on Faculty of Electrical Engineering Mechanical Engineering and Naval Architecture University of Split,
ABSTRACT
Lightning protection and insulation coordination of transmission lines and substations require an accurate
knowledge of the magnitudes and waveforms of lightning overvoltage. To simulate the lightning
overvoltage precisely near the substation, this study has shown how to consider the lightning impulse
corona for distortion effect of this overvoltage.
Attenuation and deformation effects of lightning impulse corona along transmission lines are evaluated by
the simulation results. This paper describes the substation equipment modeling in the software
Electromagnetic Transients Program–Alternative Transients Program EMTP. Corona effect is incorporate
in order to estimate the attenuation and deformation of overvoltage’s travelling waves on transmission
lines near substations. Variations of lightning stroke current magnitudes, protection distances, and the
impact points are obvious due to the applied dynamic corona model. Several elements of substation
equipment are modeled in ATP/EMTP using MODELS language. The Simulation results show that the
amplitude and voltage travelling wave-fronts attenuated remarkably. Deformation of the wave shapes
mainly occurs when the impulse voltage exceeds the corona inception voltage.
KEYWORDS:
Lightning Stroke, Corona Impulse, EMTP, Transmission Lines, Modeling Of Substation, Attenuation,
Deformation; Overvoltage Protection, MODELS Language
1.1 INTRODUCTION
Very Fast Transient (VFT) in power substation can be divided into internal and external transients [1]. The theoretical methods for overvoltage analysis are developed, in the domain of lightning surges for reason of difficult measure the transient surge occurring in real HV and EHV power systems, so mathematical models of physical phenomena as lightning strike, corona discharge and flashover , using computers and techniques are applied. Several simulation models of the power insulation have been proposed in literature [2-8], and it contain tower segments, tower grounding system, Flashover of insulator strings, Insulators, transformers, transmission lines, lightning strike [9-10] and corona discharge [11-18]. Presented analysis is important for insulation coordination of substations since the computed peak overvoltages are used for the evaluation of the substation outage rate as well as for the selection of the necessary protection measures.
Advances in Engineering: an International Journal (ADEIJ), Vol. 1, No.1, September 2016
56
In this paper lightning stroke is applied at the grounding wire on the overhead line. Its impact on underground cables was studied. Transient program Electromagnetic Transients Program (ATP-EMTP) is used to create a model of the power system for simulation of lightning stroke at the grounding wire on the overhead line and its impact on underground cables and surge arresters. The results of the simulation are briefly presented and discussed in the paper. This paper describes a power substation and analyses the variations of VFTO magnitudes at different points in 420 kV substation using ATP/EMTP as a platform for the simulation of transients phenomenon. And the effect of different protection elements is treated in this study and the effect of corona discharge at the transmission lines is introduced by a dynamic model of corona using the type-94 element of ATP/EMTP.
2. POWER SYSTEM DESCRIPTION
The substation model in this study is developed using the Electromagnetic Transients Program–Alternative Transients Program (EMTP-ATP) software. Following components are used in the simulation cases:
2.1 High-Voltage Overhead Line And Cables Modeling
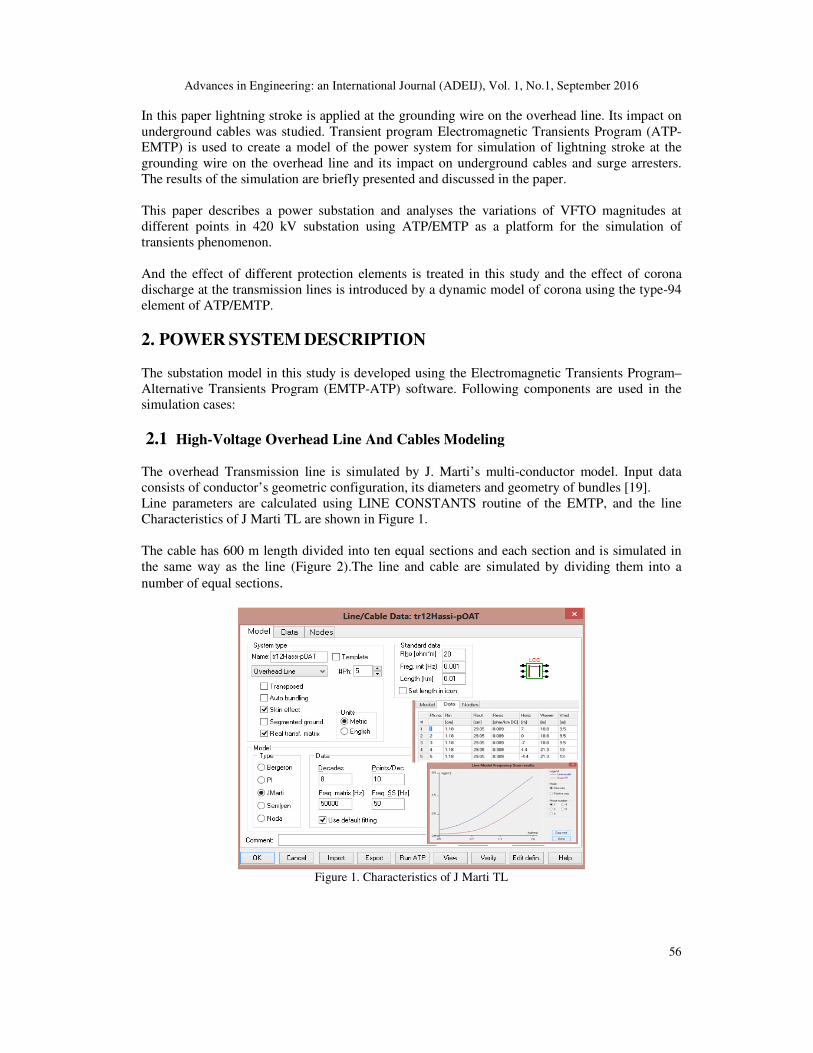
The overhead Transmission line is simulated by J. Marti’s multi-conductor model. Input data consists of conductor’s geometric configuration, its diameters and geometry of bundles [19]. Line parameters are calculated using LINE CONSTANTS routine of the EMTP, and the line Characteristics of J Marti TL are shown in Figure 1. The cable has 600 m length divided into ten equal sections and each section and is simulated in the same way as the line (Figure 2).The line and cable are simulated by dividing them into a
number of equal sections.
Figure 1. Characteristics of J Marti TL
Advances in Engineering: an International Journal (ADEIJ), Vol. 1, No.1, September 2016
57
2.2 Lightning Stroke
Different models have been proposed in order to estimate the severity of voltages induced by indirect lightning return strokes [9, 10, 20] Lightning discharge is represented by a current source of positive polarity. The Heidler’s function is used to represent lightning current waveform [20]:
( )0( )
1
n
tf Tau
n
f
tT
i t I e
tT
−
=
+
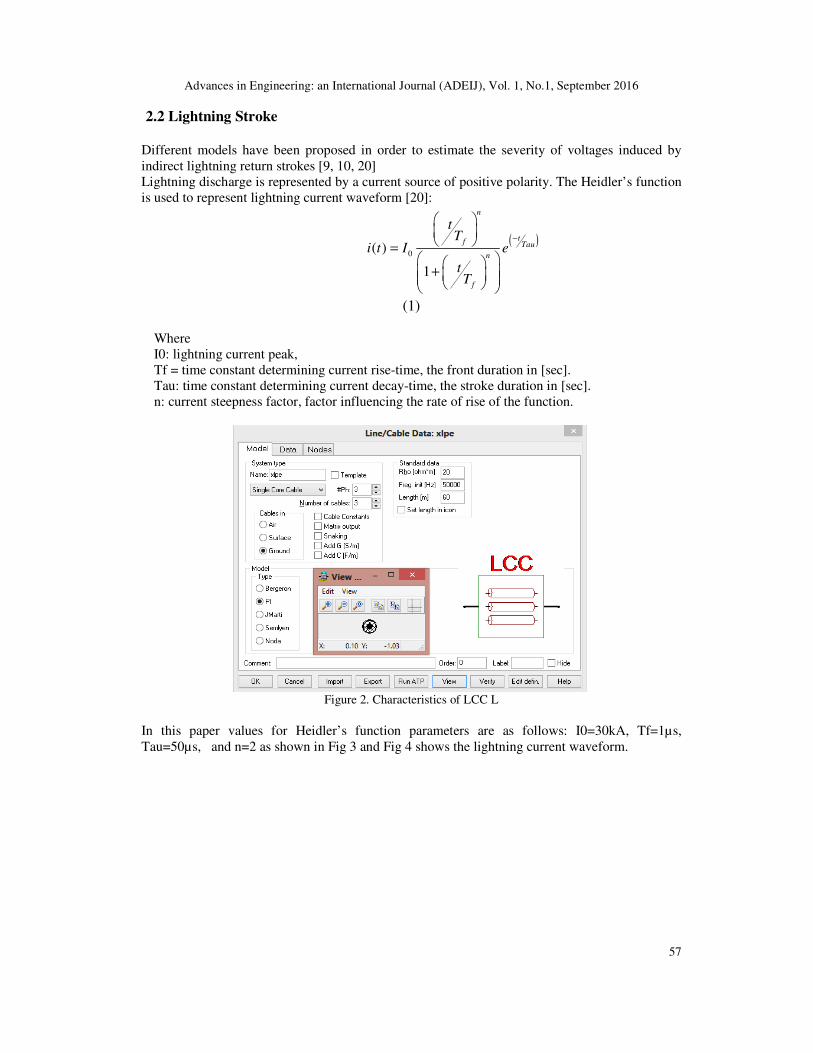
(1) Where I0: lightning current peak, Tf = time constant determining current rise-time, the front duration in [sec]. Tau: time constant determining current decay-time, the stroke duration in [sec]. n: current steepness factor, factor influencing the rate of rise of the function.
Figure 2. Characteristics of LCC L
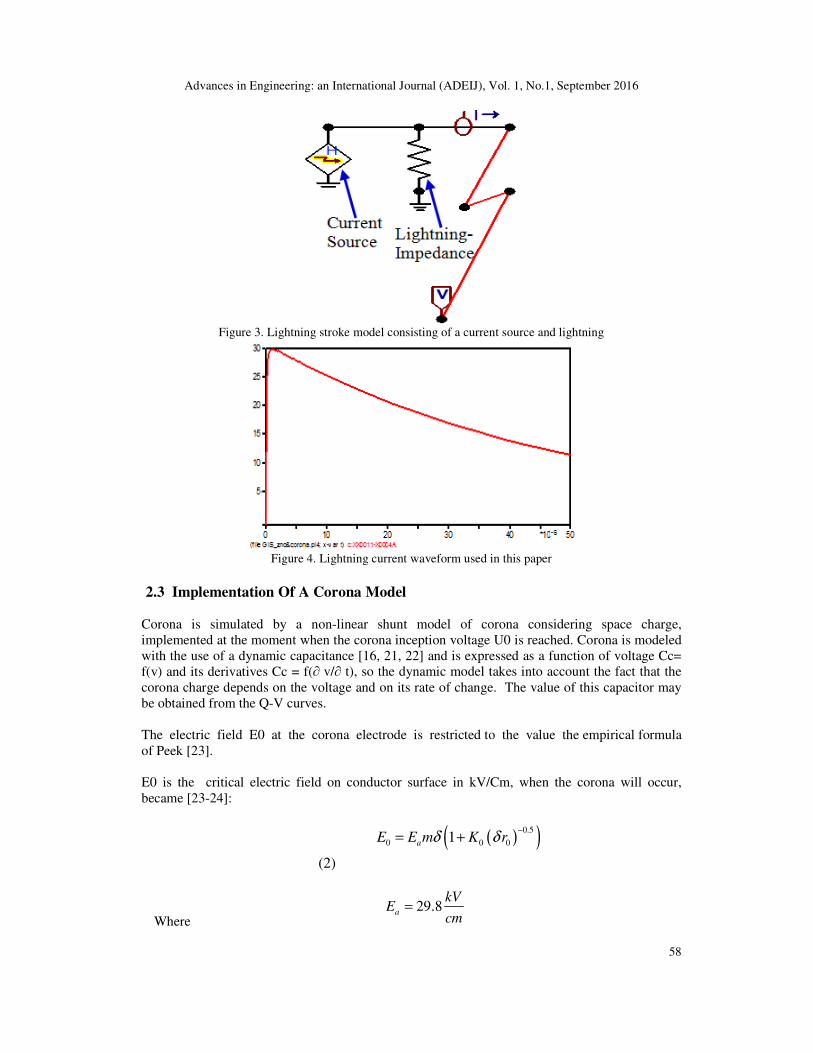
In this paper values for Heidler’s function parameters are as follows: I0=30kA, Tf=1µs, Tau=50µs, and n=2 as shown in Fig 3 and Fig 4 shows the lightning current waveform.
Advances in Engineering: an International Journal (ADEIJ), Vol. 1, No.1, September 2016
58
Figure 3. Lightning stroke model consisting of a current source and lightning
Figure 4. Lightning current waveform used in this paper
2.3 Implementation Of A Corona Model
Corona is simulated by a non-linear shunt model of corona considering space charge, implemented at the moment when the corona inception voltage U0 is reached. Corona is modeled with the use of a dynamic capacitance [16, 21, 22] and is expressed as a function of voltage Cc= f(v) and its derivatives Cc = f(∂ v/∂ t), so the dynamic model takes into account the fact that the corona charge depends on the voltage and on its rate of change. The value of this capacitor may be obtained from the Q-V curves. The electric field E0 at the corona electrode is restricted to the value the empirical formula of Peek [23]. E0 is the critical electric field on conductor surface in kV/Cm, when the corona will occur, became [23-24]:
( )( )0.5
0 0 01aE E m K rδ δ−
= +
(2)
Where 29.8a
kVE
cm=
Advances in Engineering: an International Journal (ADEIJ), Vol. 1, No.1, September 2016
59
m is the roughness factor (surface state of conductor) [24] , K0=0.301 and δ is air relative density.
( )
( )0
0
273
273
rP T
P Tδ
+=
+
(3)
is the atmospheric pressure in kPa, is the environment pressure.
is the atmospheric temperature in °C, and is the environment temperature. Where: E0 is the corona inception field determined by Empirical formulas of Peek’s [23],
which take place in the ionization zone around the stressed conductor. The corona inception voltage can be calculated by a modified Peek’s formula [25, 26]:
0 0
00
0.3081 lna
RU E r
rr
= +
(4) For a configuration above the ground, the inception corona voltage became [26]:
0 00
0 0
2ln
2
Q h rU
rπε
−=
(5)
Where and are inner and outer radius of the coaxial cylindrical electrode respectively. is the corona inception voltage in kV. The Q-V diagram is calculated by the corona inception voltage and the charge bound on the conductor with following expressions [27], [21]:
0
22
2c
c c
h Xq X E
hπε
− =
(6)
00 0
0
(2 ) (2 ) 2ln ln
(2 ) 2c c c c c
c c
X h r E X h X h XV E r
r h X h X
− − −= +
−
(7) Solution of the two equations above will give the positions of the corona shells, and this movement is computed iteratively by the Dichotomy numerical method. As a result of this model a computed Q-V curve compared with the experimental results available in the literature [11], is shown in Figure 5. Reasonable agreement is obvious between them. We used the system of
radius: and applying a switching voltage (120 / 2200 µs) with 250 kV.
Advances in Engineering: an International Journal (ADEIJ), Vol. 1, No.1, September 2016
60
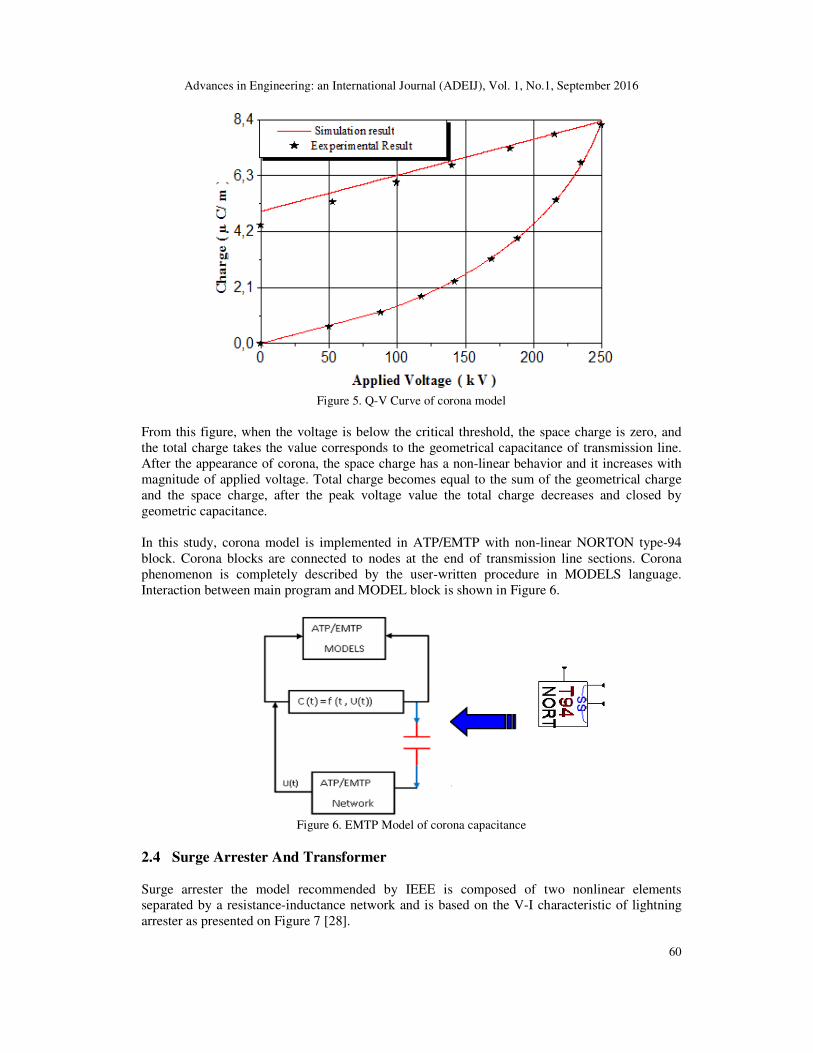
Figure 5. Q-V Curve of corona model
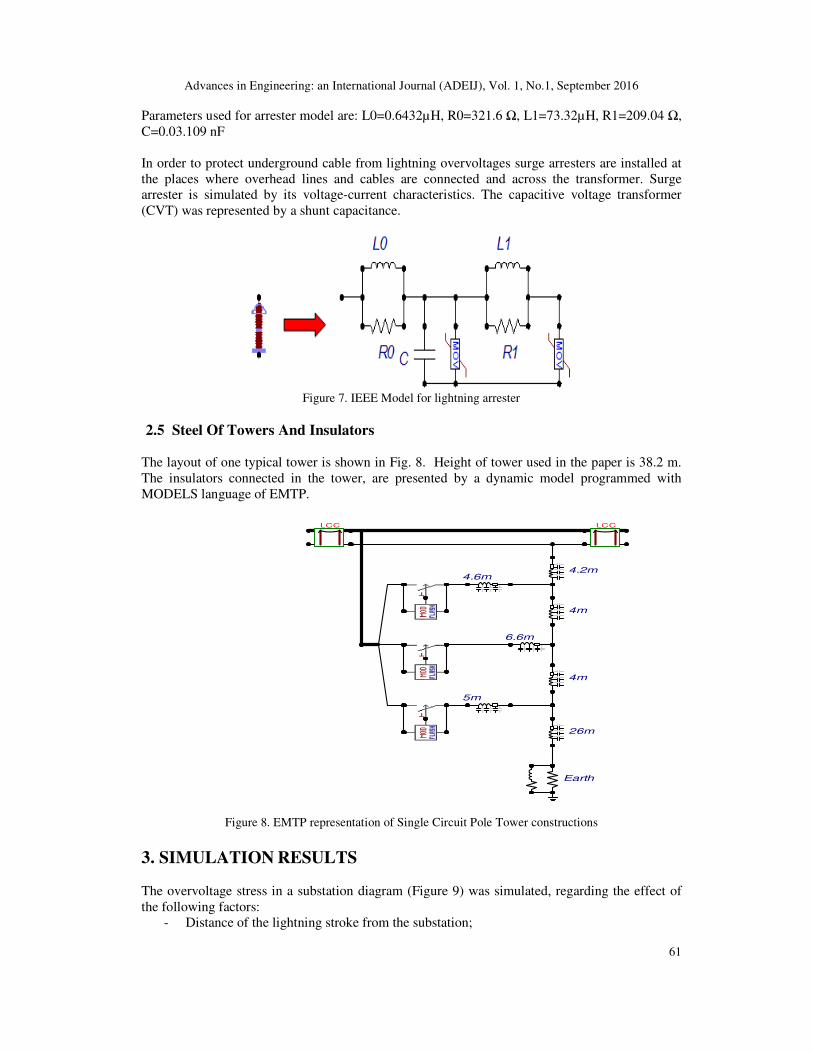
From this figure, when the voltage is below the critical threshold, the space charge is zero, and the total charge takes the value corresponds to the geometrical capacitance of transmission line. After the appearance of corona, the space charge has a non-linear behavior and it increases with magnitude of applied voltage. Total charge becomes equal to the sum of the geometrical charge and the space charge, after the peak voltage value the total charge decreases and closed by geometric capacitance. In this study, corona model is implemented in ATP/EMTP with non-linear NORTON type-94 block. Corona blocks are connected to nodes at the end of transmission line sections. Corona phenomenon is completely described by the user-written procedure in MODELS language. Interaction between main program and MODEL block is shown in Figure 6.
Figure 6. EMTP Model of corona capacitance
2.4 Surge Arrester And Transformer
Surge arrester the model recommended by IEEE is composed of two nonlinear elements separated by a resistance-inductance network and is based on the V-I characteristic of lightning arrester as presented on Figure 7 [28].
Advances in Engineering: an International Journal (ADEIJ), Vol. 1, No.1, September 2016
61
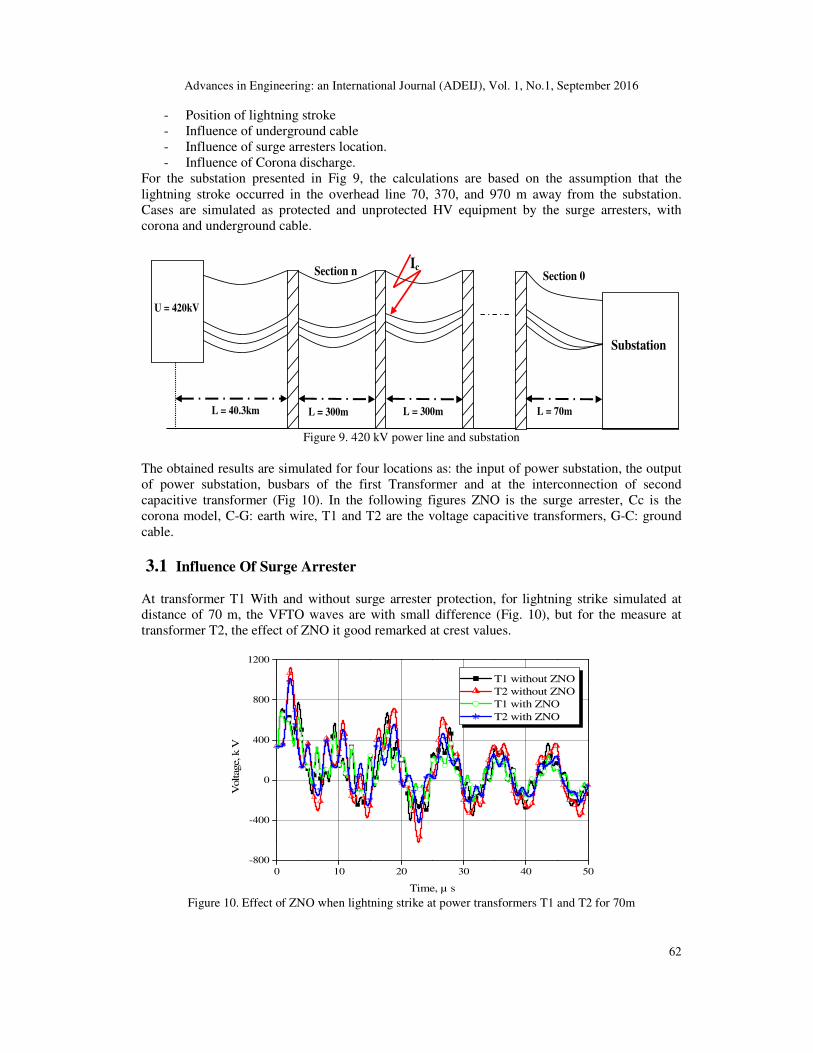
Parameters used for arrester model are: L0=0.6432µH, R0=321.6 Ω, L1=73.32µH, R1=209.04 Ω, C=0.03.109 nF In order to protect underground cable from lightning overvoltages surge arresters are installed at the places where overhead lines and cables are connected and across the transformer. Surge arrester is simulated by its voltage-current characteristics. The capacitive voltage transformer (CVT) was represented by a shunt capacitance.
Figure 7. IEEE Model for lightning arrester
2.5 Steel Of Towers And Insulators
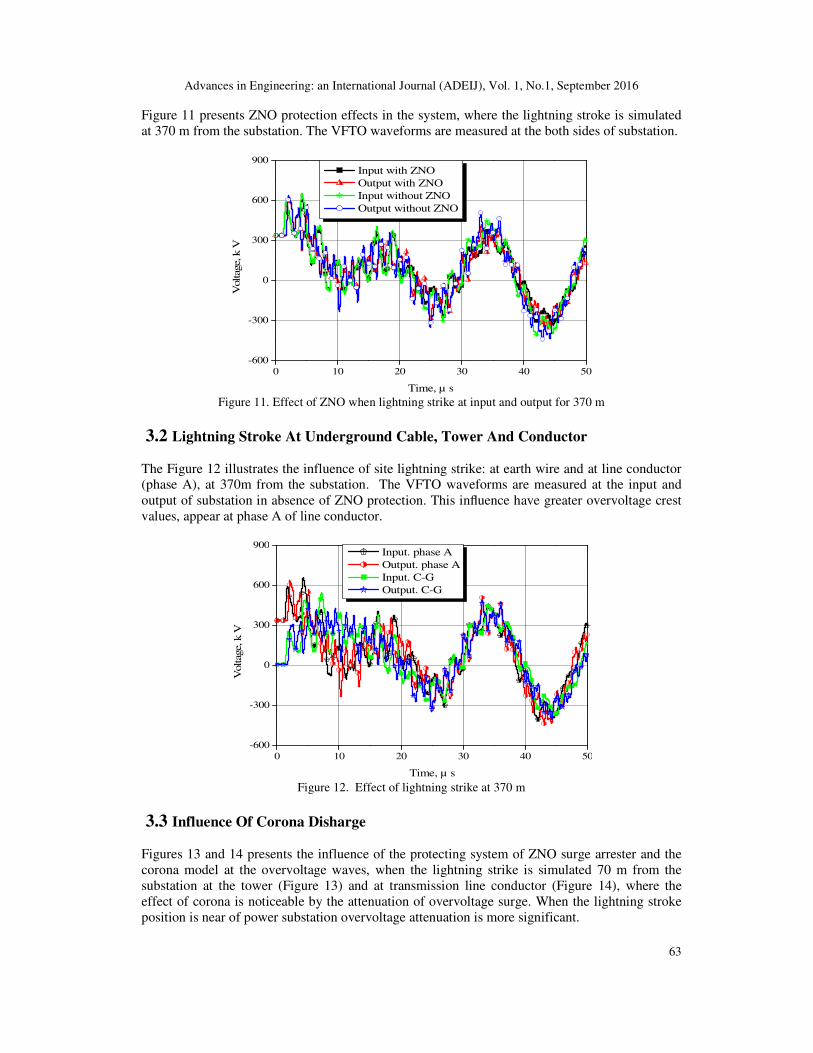
The layout of one typical tower is shown in Fig. 8. Height of tower used in the paper is 38.2 m. The insulators connected in the tower, are presented by a dynamic model programmed with MODELS language of EMTP.
Figure 8. EMTP representation of Single Circuit Pole Tower constructions
3. SIMULATION RESULTS
The overvoltage stress in a substation diagram (Figure 9) was simulated, regarding the effect of the following factors:
- Distance of the lightning stroke from the substation;
LCCLCC
4m
4.2m
26m
Earth
4.6m
6.6m
5m
4m
Advances in Engineering: an International Journal (ADEIJ), Vol. 1, No.1, September 2016
62
- Position of lightning stroke - Influence of underground cable - Influence of surge arresters location. - Influence of Corona discharge.
For the substation presented in Fig 9, the calculations are based on the assumption that the lightning stroke occurred in the overhead line 70, 370, and 970 m away from the substation. Cases are simulated as protected and unprotected HV equipment by the surge arresters, with corona and underground cable.
Substation
Ic Section 0 Section n
L = 40.3km L = 300m L = 70m L = 300m
U = 420kV
Figure 9. 420 kV power line and substation
The obtained results are simulated for four locations as: the input of power substation, the output of power substation, busbars of the first Transformer and at the interconnection of second capacitive transformer (Fig 10). In the following figures ZNO is the surge arrester, Cc is the corona model, C-G: earth wire, T1 and T2 are the voltage capacitive transformers, G-C: ground cable.
3.1 Influence Of Surge Arrester
At transformer T1 With and without surge arrester protection, for lightning strike simulated at distance of 70 m, the VFTO waves are with small difference (Fig. 10), but for the measure at transformer T2, the effect of ZNO it good remarked at crest values.
0 10 20 30 40 50-800
-400
0
400
800
1200
T1 without ZNO
T2 without ZNO
T1 with ZNO
T2 with ZNO
Voltag
e, k
V
Time, µ s Figure 10. Effect of ZNO when lightning strike at power transformers T1 and T2 for 70m
Advances in Engineering: an International Journal (ADEIJ), Vol. 1, No.1, September 2016
63
Figure 11 presents ZNO protection effects in the system, where the lightning stroke is simulated at 370 m from the substation. The VFTO waveforms are measured at the both sides of substation.
0 10 20 30 40 50-600
-300
0
300
600
900 Input with ZNO
Output with ZNO
Input without ZNO
Output without ZNO
Voltag
e, k
V
Time, µ s Figure 11. Effect of ZNO when lightning strike at input and output for 370 m
3.2 Lightning Stroke At Underground Cable, Tower And Conductor
The Figure 12 illustrates the influence of site lightning strike: at earth wire and at line conductor (phase A), at 370m from the substation. The VFTO waveforms are measured at the input and output of substation in absence of ZNO protection. This influence have greater overvoltage crest values, appear at phase A of line conductor.
0 10 20 30 40 50-600
-300
0
300
600
900 Input. phase A
Output. phase A
Input. C-G
Output. C-G
Voltag
e, k
V
Time, µ s Figure 12. Effect of lightning strike at 370 m
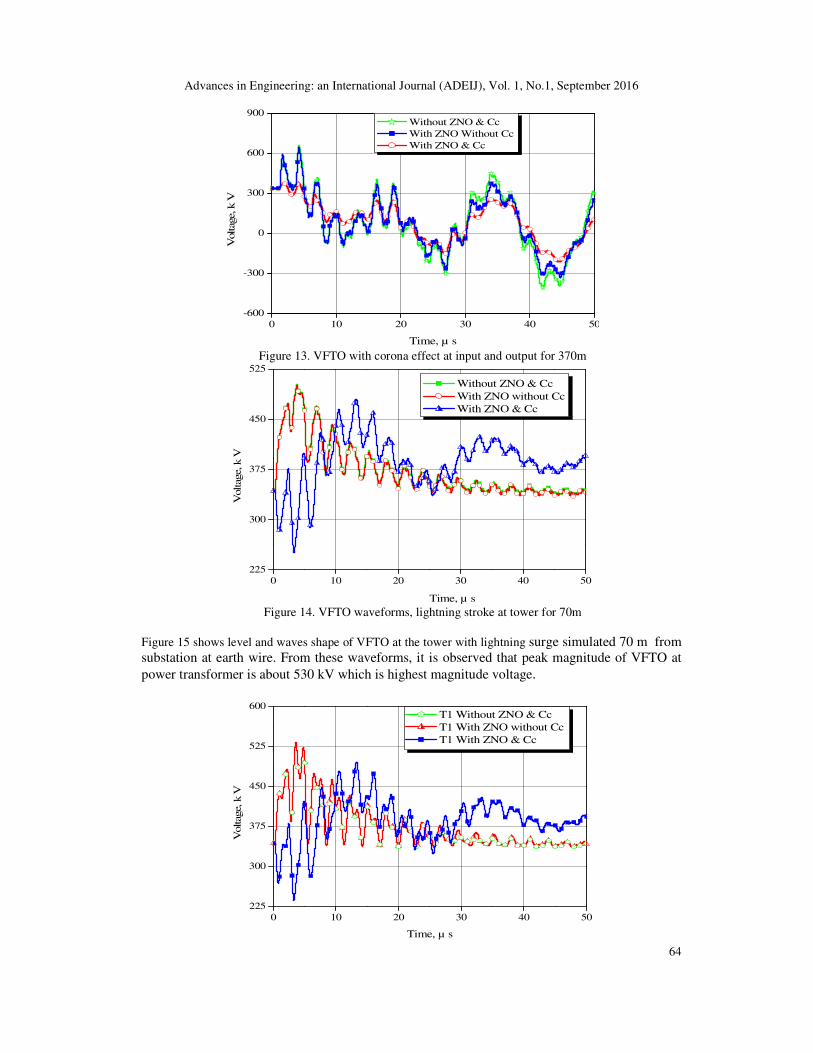
3.3 Influence Of Corona Disharge
Figures 13 and 14 presents the influence of the protecting system of ZNO surge arrester and the corona model at the overvoltage waves, when the lightning strike is simulated 70 m from the substation at the tower (Figure 13) and at transmission line conductor (Figure 14), where the effect of corona is noticeable by the attenuation of overvoltage surge. When the lightning stroke position is near of power substation overvoltage attenuation is more significant.
Advances in Engineering: an International Journal (ADEIJ), Vol. 1, No.1, September 2016
64
0 10 20 30 40 50-600
-300
0
300
600
900
Voltag
e, k
V
Time, µ s
Without ZNO & Cc
With ZNO Without Cc
With ZNO & Cc
Figure 13. VFTO with corona effect at input and output for 370m
0 10 20 30 40 50225
300
375
450
525
Voltag
e, k
V
Time, µ s
Without ZNO & Cc
With ZNO without Cc
With ZNO & Cc
Figure 14. VFTO waveforms, lightning stroke at tower for 70m
Figure 15 shows level and waves shape of VFTO at the tower with lightning surge simulated 70 m from substation at earth wire. From these waveforms, it is observed that peak magnitude of VFTO at
power transformer is about 530 kV which is highest magnitude voltage.
0 10 20 30 40 50225
300
375
450
525
600
Voltag
e, k
V
Time, µ s
T1 Without ZNO & Cc
T1 With ZNO without Cc
T1 With ZNO & Cc
Advances in Engineering: an International Journal (ADEIJ), Vol. 1, No.1, September 2016
65
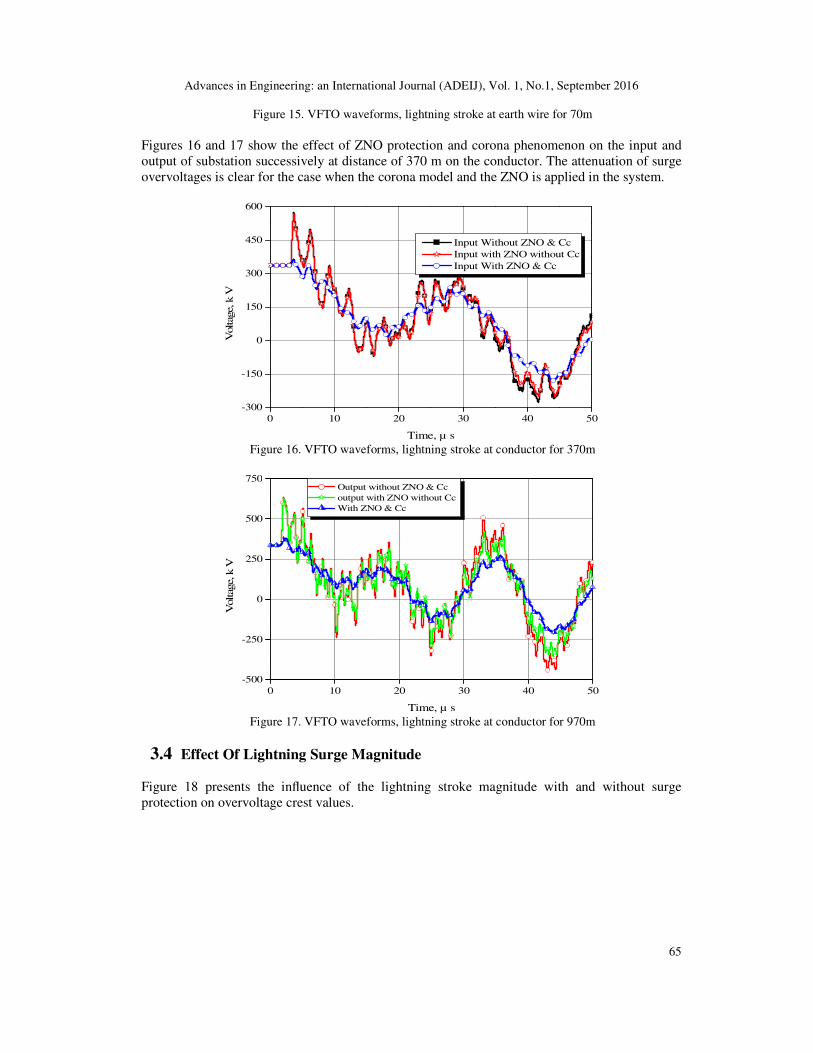
Figure 15. VFTO waveforms, lightning stroke at earth wire for 70m
Figures 16 and 17 show the effect of ZNO protection and corona phenomenon on the input and output of substation successively at distance of 370 m on the conductor. The attenuation of surge overvoltages is clear for the case when the corona model and the ZNO is applied in the system.
0 10 20 30 40 50-300
-150
0
150
300
450
600
Input Without ZNO & Cc
Input with ZNO without Cc
Input With ZNO & Cc
Voltag
e, k
V
Time, µ s Figure 16. VFTO waveforms, lightning stroke at conductor for 370m
0 10 20 30 40 50-500
-250
0
250
500
750 Output without ZNO & Cc
output with ZNO without Cc
With ZNO & Cc
Voltag
e, k
V
Time, µ s Figure 17. VFTO waveforms, lightning stroke at conductor for 970m
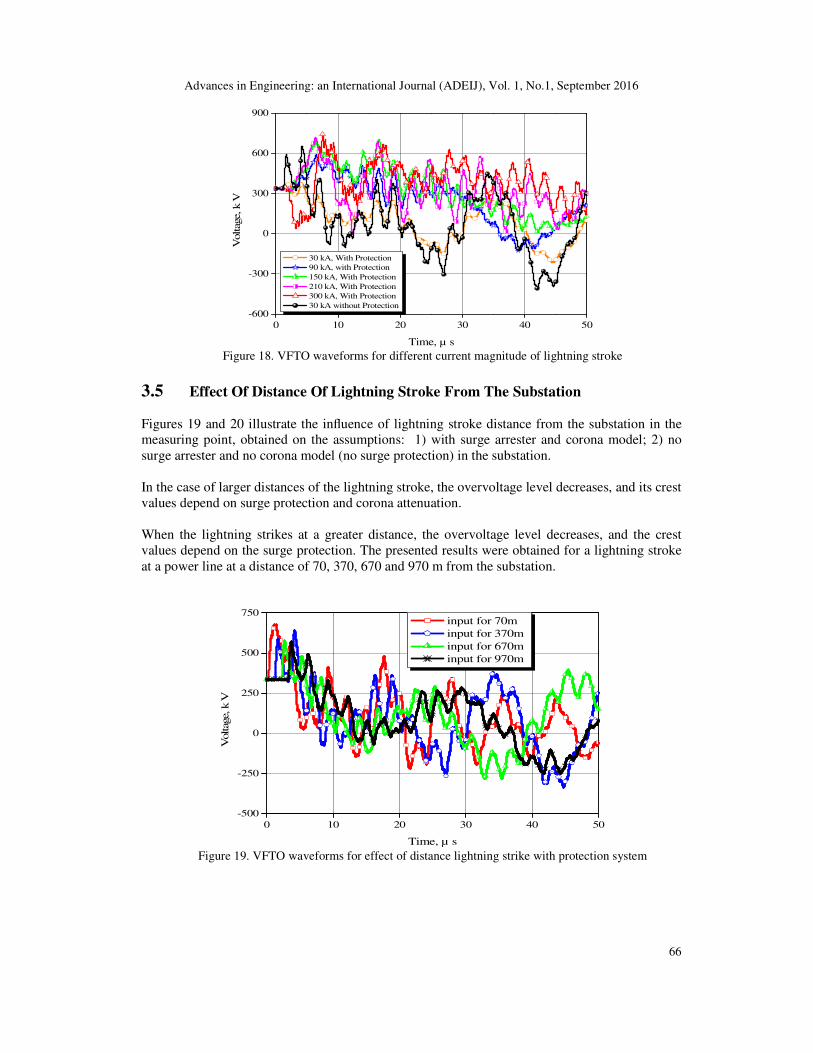
3.4 Effect Of Lightning Surge Magnitude
Figure 18 presents the influence of the lightning stroke magnitude with and without surge protection on overvoltage crest values.
Advances in Engineering: an International Journal (ADEIJ), Vol. 1, No.1, September 2016
66
0 10 20 30 40 50-600
-300
0
300
600
900
30 kA, With Protection
90 kA, with Protection
150 kA, With Protection
210 kA, With Protection
300 kA, With Protection
30 kA without Protection
Voltag
e, k
V
Time, µ s Figure 18. VFTO waveforms for different current magnitude of lightning stroke
3.5 Effect Of Distance Of Lightning Stroke From The Substation
Figures 19 and 20 illustrate the influence of lightning stroke distance from the substation in the measuring point, obtained on the assumptions: 1) with surge arrester and corona model; 2) no surge arrester and no corona model (no surge protection) in the substation. In the case of larger distances of the lightning stroke, the overvoltage level decreases, and its crest values depend on surge protection and corona attenuation. When the lightning strikes at a greater distance, the overvoltage level decreases, and the crest values depend on the surge protection. The presented results were obtained for a lightning stroke at a power line at a distance of 70, 370, 670 and 970 m from the substation.
0 10 20 30 40 50-500
-250
0
250
500
750 input for 70m
input for 370m
input for 670m
input for 970m
Voltag
e, k
V
Time, µ s Figure 19. VFTO waveforms for effect of distance lightning strike with protection system
Advances in Engineering: an International Journal (ADEIJ), Vol. 1, No.1, September 2016
67
0 10 20 30 40 50-500
-250
0
250
500
750 Input for 70m
Input for 370m
Input for 670m
Input for 970m
Voltag
e, k
V
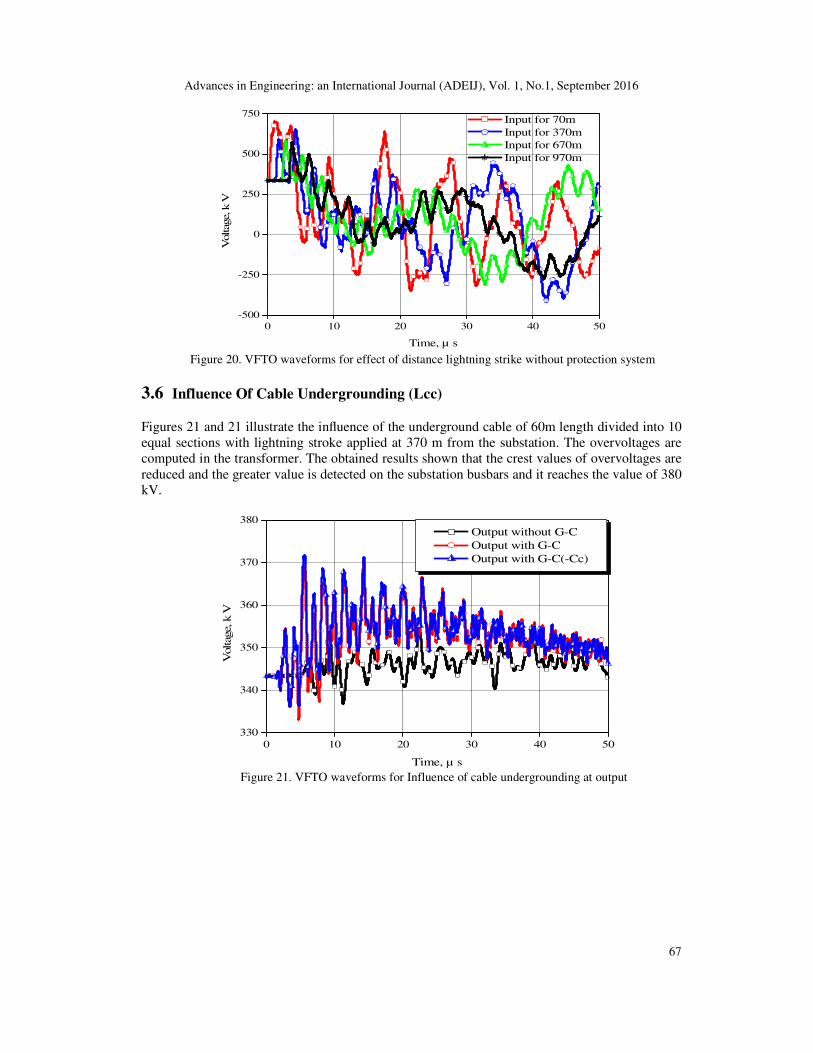
Time, µ s Figure 20. VFTO waveforms for effect of distance lightning strike without protection system
3.6 Influence Of Cable Undergrounding (Lcc)
Figures 21 and 21 illustrate the influence of the underground cable of 60m length divided into 10 equal sections with lightning stroke applied at 370 m from the substation. The overvoltages are computed in the transformer. The obtained results shown that the crest values of overvoltages are reduced and the greater value is detected on the substation busbars and it reaches the value of 380 kV.
0 10 20 30 40 50330
340
350
360
370
380
Output without G-C
Output with G-C
Output with G-C(-Cc)
Voltag
e, k
V
Time, µ s Figure 21. VFTO waveforms for Influence of cable undergrounding at output
Advances in Engineering: an International Journal (ADEIJ), Vol. 1, No.1, September 2016
68
0 10 20 30 40 50330
345
360
375
390 Input with G-C
Input without G-C
Input with G-C (-Cc)
Voltag
e, k
V
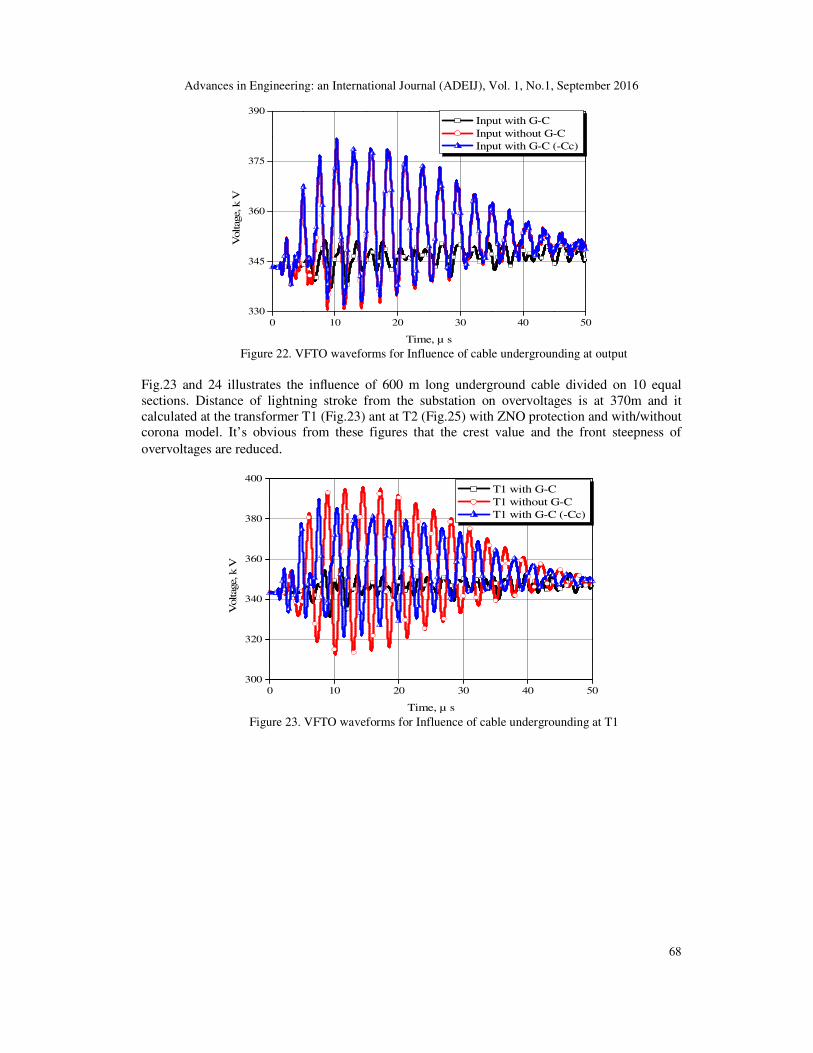
Time, µ s Figure 22. VFTO waveforms for Influence of cable undergrounding at output
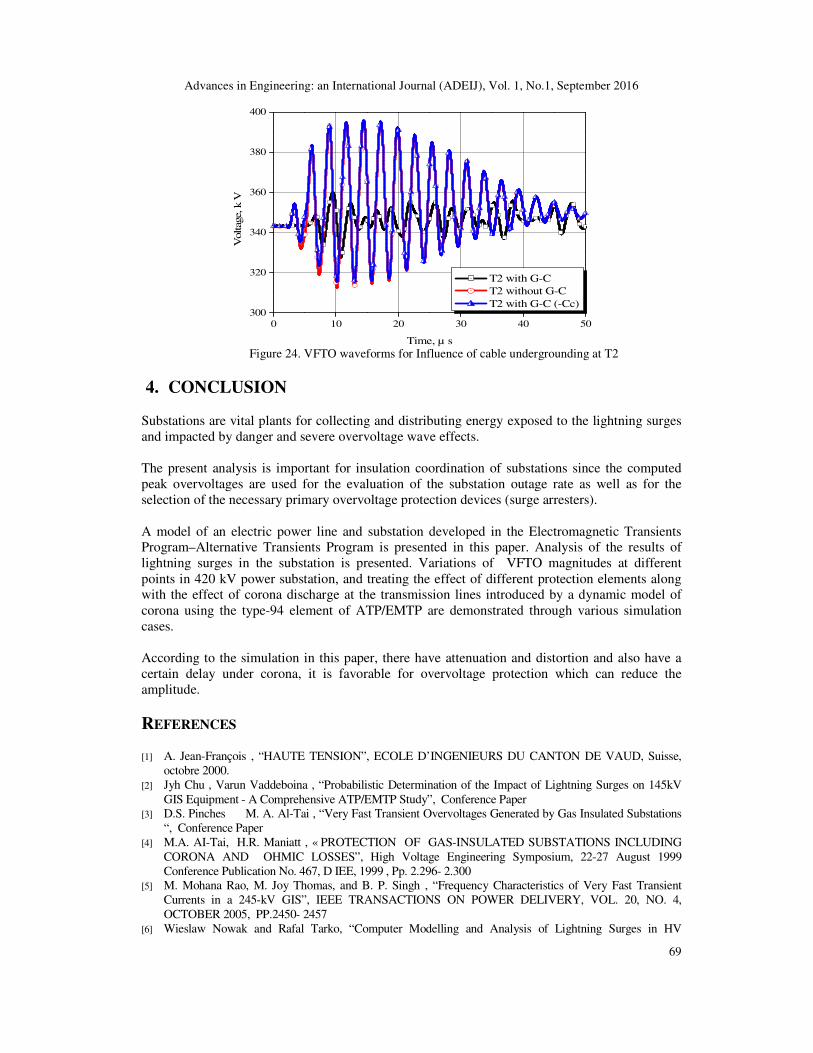
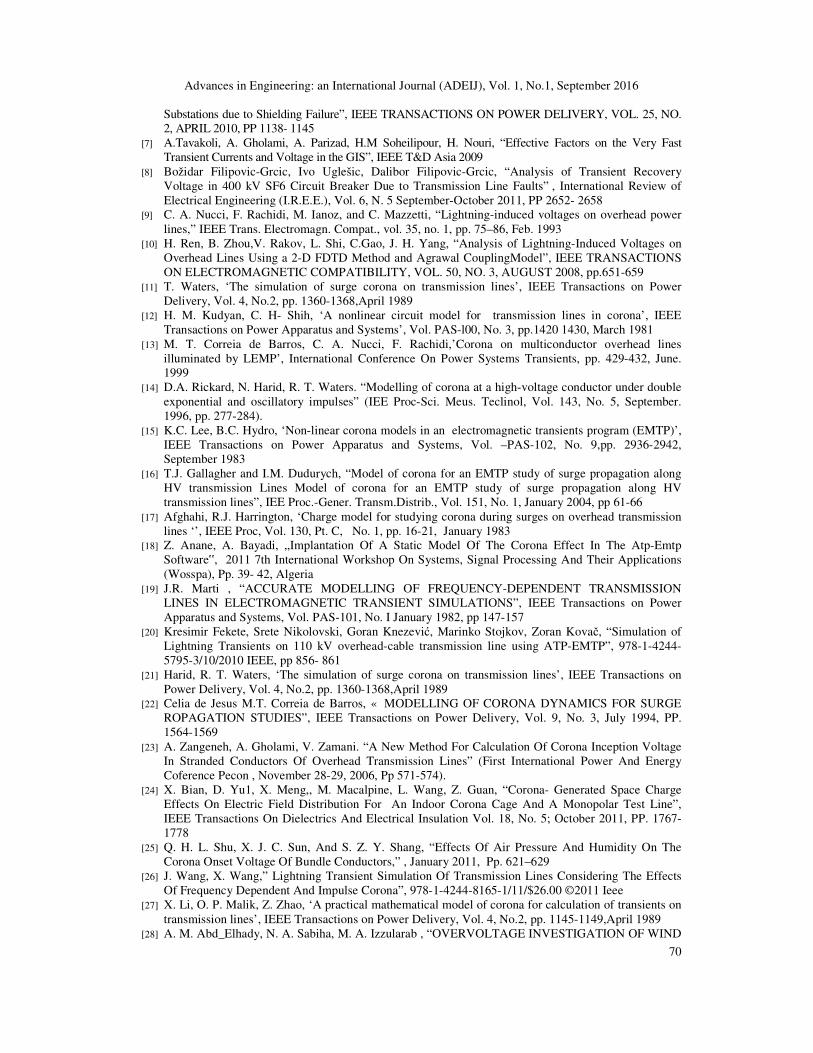
Fig.23 and 24 illustrates the influence of 600 m long underground cable divided on 10 equal sections. Distance of lightning stroke from the substation on overvoltages is at 370m and it calculated at the transformer T1 (Fig.23) ant at T2 (Fig.25) with ZNO protection and with/without corona model. It’s obvious from these figures that the crest value and the front steepness of
overvoltages are reduced.
0 10 20 30 40 50300
320
340
360
380
400 T1 with G-C
T1 without G-C
T1 with G-C (-Cc)
Voltag
e, k
V
Time, µ s Figure 23. VFTO waveforms for Influence of cable undergrounding at T1
Advances in Engineering: an International Journal (ADEIJ), Vol. 1, No.1, September 2016
69
0 10 20 30 40 50300
320
340
360
380
400
T2 with G-C
T2 without G-C
T2 with G-C (-Cc)
Voltag
e, k
V
Time, µ s Figure 24. VFTO waveforms for Influence of cable undergrounding at T2
4. CONCLUSION
Substations are vital plants for collecting and distributing energy exposed to the lightning surges and impacted by danger and severe overvoltage wave effects. The present analysis is important for insulation coordination of substations since the computed peak overvoltages are used for the evaluation of the substation outage rate as well as for the selection of the necessary primary overvoltage protection devices (surge arresters). A model of an electric power line and substation developed in the Electromagnetic Transients Program–Alternative Transients Program is presented in this paper. Analysis of the results of lightning surges in the substation is presented. Variations of VFTO magnitudes at different points in 420 kV power substation, and treating the effect of different protection elements along with the effect of corona discharge at the transmission lines introduced by a dynamic model of corona using the type-94 element of ATP/EMTP are demonstrated through various simulation cases. According to the simulation in this paper, there have attenuation and distortion and also have a certain delay under corona, it is favorable for overvoltage protection which can reduce the amplitude.
REFERENCES [1] A. Jean-François , “HAUTE TENSION”, ECOLE D’INGENIEURS DU CANTON DE VAUD, Suisse,
octobre 2000. [2] Jyh Chu , Varun Vaddeboina , “Probabilistic Determination of the Impact of Lightning Surges on 145kV
GIS Equipment - A Comprehensive ATP/EMTP Study”, Conference Paper [3] D.S. Pinches M. A. Al-Tai , “Very Fast Transient Overvoltages Generated by Gas Insulated Substations
“, Conference Paper [4] M.A. AI-Tai, H.R. Maniatt , « PROTECTION OF GAS-INSULATED SUBSTATIONS INCLUDING
CORONA AND OHMIC LOSSES”, High Voltage Engineering Symposium, 22-27 August 1999 Conference Publication No. 467, D IEE, 1999 , Pp. 2.296- 2.300
[5] M. Mohana Rao, M. Joy Thomas, and B. P. Singh , “Frequency Characteristics of Very Fast Transient Currents in a 245-kV GIS”, IEEE TRANSACTIONS ON POWER DELIVERY, VOL. 20, NO. 4, OCTOBER 2005, PP.2450- 2457
[6] Wieslaw Nowak and Rafal Tarko, “Computer Modelling and Analysis of Lightning Surges in HV
Advances in Engineering: an International Journal (ADEIJ), Vol. 1, No.1, September 2016
70
Substations due to Shielding Failure”, IEEE TRANSACTIONS ON POWER DELIVERY, VOL. 25, NO. 2, APRIL 2010, PP 1138- 1145
[7] A.Tavakoli, A. Gholami, A. Parizad, H.M Soheilipour, H. Nouri, “Effective Factors on the Very Fast Transient Currents and Voltage in the GIS”, IEEE T&D Asia 2009
[8] Božidar Filipovic-Grcic, Ivo Uglešic, Dalibor Filipovic-Grcic, “Analysis of Transient Recovery Voltage in 400 kV SF6 Circuit Breaker Due to Transmission Line Faults” , International Review of Electrical Engineering (I.R.E.E.), Vol. 6, N. 5 September-October 2011, PP 2652- 2658
[9] C. A. Nucci, F. Rachidi, M. Ianoz, and C. Mazzetti, “Lightning-induced voltages on overhead power lines,” IEEE Trans. Electromagn. Compat., vol. 35, no. 1, pp. 75–86, Feb. 1993
[10] H. Ren, B. Zhou,V. Rakov, L. Shi, C.Gao, J. H. Yang, “Analysis of Lightning-Induced Voltages on Overhead Lines Using a 2-D FDTD Method and Agrawal CouplingModel”, IEEE TRANSACTIONS ON ELECTROMAGNETIC COMPATIBILITY, VOL. 50, NO. 3, AUGUST 2008, pp.651-659
[11] T. Waters, ‘The simulation of surge corona on transmission lines’, IEEE Transactions on Power Delivery, Vol. 4, No.2, pp. 1360-1368,April 1989
[12] H. M. Kudyan, C. H- Shih, ‘A nonlinear circuit model for transmission lines in corona’, IEEE Transactions on Power Apparatus and Systems’, Vol. PAS-l00, No. 3, pp.1420 1430, March 1981
[13] M. T. Correia de Barros, C. A. Nucci, F. Rachidi,’Corona on multiconductor overhead lines illuminated by LEMP’, International Conference On Power Systems Transients, pp. 429-432, June. 1999
[14] D.A. Rickard, N. Harid, R. T. Waters. “Modelling of corona at a high-voltage conductor under double exponential and oscillatory impulses” (IEE Proc-Sci. Meus. Teclinol, Vol. 143, No. 5, September. 1996, pp. 277-284).
[15] K.C. Lee, B.C. Hydro, ‘Non-linear corona models in an electromagnetic transients program (EMTP)’, IEEE Transactions on Power Apparatus and Systems, Vol. –PAS-102, No. 9,pp. 2936-2942, September 1983
[16] T.J. Gallagher and I.M. Dudurych, “Model of corona for an EMTP study of surge propagation along HV transmission Lines Model of corona for an EMTP study of surge propagation along HV transmission lines”, IEE Proc.-Gener. Transm.Distrib., Vol. 151, No. 1, January 2004, pp 61-66
[17] Afghahi, R.J. Harrington, ‘Charge model for studying corona during surges on overhead transmission lines ‘’, IEEE Proc, Vol. 130, Pt. C, No. 1, pp. 16-21, January 1983
[18] Z. Anane, A. Bayadi, „Implantation Of A Static Model Of The Corona Effect In The Atp-Emtp Software‟, 2011 7th International Workshop On Systems, Signal Processing And Their Applications (Wosspa), Pp. 39- 42, Algeria
[19] J.R. Marti , “ACCURATE MODELLING OF FREQUENCY-DEPENDENT TRANSMISSION LINES IN ELECTROMAGNETIC TRANSIENT SIMULATIONS”, IEEE Transactions on Power Apparatus and Systems, Vol. PAS-101, No. I January 1982, pp 147-157
[20] Kresimir Fekete, Srete Nikolovski, Goran Knezević, Marinko Stojkov, Zoran Kovač, “Simulation of Lightning Transients on 110 kV overhead-cable transmission line using ATP-EMTP”, 978-1-4244-5795-3/10/2010 IEEE, pp 856- 861
[21] Harid, R. T. Waters, ‘The simulation of surge corona on transmission lines’, IEEE Transactions on Power Delivery, Vol. 4, No.2, pp. 1360-1368,April 1989
[22] Celia de Jesus M.T. Correia de Barros, « MODELLING OF CORONA DYNAMICS FOR SURGE ROPAGATION STUDIES”, IEEE Transactions on Power Delivery, Vol. 9, No. 3, July 1994, PP. 1564-1569
[23] A. Zangeneh, A. Gholami, V. Zamani. “A New Method For Calculation Of Corona Inception Voltage In Stranded Conductors Of Overhead Transmission Lines” (First International Power And Energy Coference Pecon , November 28-29, 2006, Pp 571-574).
[24] X. Bian, D. Yu1, X. Meng,, M. Macalpine, L. Wang, Z. Guan, “Corona- Generated Space Charge Effects On Electric Field Distribution For An Indoor Corona Cage And A Monopolar Test Line”, IEEE Transactions On Dielectrics And Electrical Insulation Vol. 18, No. 5; October 2011, PP. 1767- 1778
[25] Q. H. L. Shu, X. J. C. Sun, And S. Z. Y. Shang, “Effects Of Air Pressure And Humidity On The Corona Onset Voltage Of Bundle Conductors,” , January 2011, Pp. 621–629
[26] J. Wang, X. Wang,” Lightning Transient Simulation Of Transmission Lines Considering The Effects Of Frequency Dependent And Impulse Corona”, 978-1-4244-8165-1/11/$26.00 ©2011 Ieee
[27] X. Li, O. P. Malik, Z. Zhao, ‘A practical mathematical model of corona for calculation of transients on transmission lines’, IEEE Transactions on Power Delivery, Vol. 4, No.2, pp. 1145-1149,April 1989
[28] A. M. Abd_Elhady, N. A. Sabiha, M. A. Izzularab , “OVERVOLTAGE INVESTIGATION OF WIND
Advances in Engineering: an International Journal (ADEIJ), Vol. 1, No.1, September 2016
71
FARM UNDER LIGHTNING STROKES”, Electrical Engineering Department, Faculty of Engineering, Minoufiya University, Shebin Elkom, Egypt
AUTHORS
Zahira ANANE Was born in Algeria, on 2nd may, 1983. She received the ‘Ingenieur d’Etat’ and ‘Magister’ degrees from Setif_1 University in 2007 and 2011 respectively, all in Electrical Engineering. Currently, she is a post graduate research, from 2011 until now for prepared his PhD thesis. His research interests are High Voltage Engineering, Power System Modelling, simulation and protection, and Electromagnetic fields.
Alen Bernadić Born at 6th of march, 1971. in Mostar, Bosnia and Herzegovina, graduated PhD on University of Split, at Faculty of Electrical Engineering, Mechanical Engineering and Naval Architecture, at Power systems department with theme "Transient modelling of multiconductor transmission line with frequency dependent parameters". Alen is with Electricity Transmission Company of Bosnia and Herzegovina. He published a few scientific papers in international high-rank Journals. His main interests are electromagnetic transients in power systems, finite element method and power system simulations. He is also author and co-author of few Studies for Distributed Generation connections on external power network (Distribution or Transmission grid). He is associate on University of Split, at Faculty of Electrical Engineering, Mechanical Engineering and Naval Architecture, Power systems department, member of Programme Committee of International Conference on Environment and Electrical Engineering (EEEIC), and Reviewer in respectable scientific journals.