Embed Size (px)
Citation preview
1
Advances in Civil Engineering Materials, Vol. 1 (1), 14 pp., Sept. 2012
Relating Compressive Strength to Heat Release in Mortars
Dale P. Bentza, Tim Barrettb, Igor De la Vargab, W. Jason Weissa,b
aMaterials and Structural Systems Division
National Institute of Standards and Technology
100 Bureau Drive, Stop 8615
Gaithersburg, MD 20899
E-mail: dale. [email protected]
bPurdue University, School of Engineering
550 Stadium Mall Drive
West Lafayette, IN 47907
E-mail: [email protected], [email protected], [email protected]
Abstract
Conventionally, isothermal calorimetry and ASTM C186 heat of hydration results are
reported on a per mass of cement (powder) basis, with typical units being J/g (cement) for
example. Based on the recognition that it is the filling of porosity with hydration products that is
chiefly responsible for strength development in cement-based materials, there may be merit in
instead reporting these results on a per unit volume of (initial) water basis. This paper examines
a database of well over 200 mortar mixtures to investigate the relationship between heat release
and mortar cube compressive strength development. For reasonably low water-to-cementitious
materials ratios (w/cm < 0.43), a single universal straight line relationship with some scatter is
obtained. Based on numerous experimental data sets and accompanying theoretical
computations, the effects of w/cm, sand volume fraction, cement chemical composition, sulfate
content, cement fineness, the incorporation of a high range water reducing admixture, and curing
conditions on this universal relationship are all considered. Fifty data points from the Cement
and Concrete Reference Laboratory (CCRL) proficiency sample program are analyzed to
develop a linear relationship between ASTM C109 mortar cube compressive strengths and
ASTM C186 heats of hydration at 7 d and 28 d. The application of this relationship for virtual
testing is also evaluated. In this case, computer simulations would be employed to predict the
heat of hydration vs. time for a particular cement and the developed equations would be
employed to convert this heat release to a strength prediction at the age(s) of interest. In general,
it appears that these relationships can be used to predict mortar cube compressive strengths based
on measured heats of hydration, within about ± 10 % of the experimentally measured strengths.
A preliminary analysis of a single dataset for concretes with and without limestone replacement
for cement indicates that the linear relationship between strength and heat release likely holds for
concretes as well as mortars.
Keywords: Compressive strength; heat release; hydration; isothermal calorimetry; mortar;
virtual testing.
2
Introduction
Compressive strength is the most commonly used property for characterizing a concrete
mixture. Years ago, Powers and Brownyard provided a fundamental basis for understanding
compressive strength development in cement-based materials as a function of hydration and
starting water-to-cement ratio (w/c), based on a gel-space ratio parameter that quantifies the
space-filling capabilities of the cement hydration products [1]. Powers and Brownyard found
compressive strength to be generally proportional to their gel-space ratio raised to a power,
typically in the range of 2.6 to 3.0, with a pre-factor that depended on cement composition and
other factors. In the present paper, the relationship between cumulative heat release (indicative
of the cumulative hydration) and compressive strength is explored for a database comprising a
wide variety of cement-based mortar specimens. Previously, Zelic et al. have investigated the
relationship between degree of hydration as assessed by heat release and compressive strength
development in mortars containing various quantities of silica fume [2]. They employed
Knudsen’s dispersion models [3] to develop a linear relationship between the hydration ratio
defined as α/(1-α), where α represents the degree of hydration of the cement, and the strength
ratio defined as fc/(fc∞-fc), where fc is compressive strength and fc∞ represents the compressive
strength after very long curing. They found that the coefficients for this linear relationship were
different for each blended mixture of silica fume and cement, thus requiring separate calibration.
More recently, Ioan et al. have demonstrated the successful prediction of 28-d compressive
strengths based on early-age heat of hydration obtained from semi-adiabatic calorimetry
measurements, with a reported accuracy of ± 2.5 MPa [4]. In the current study, a more universal
relationship between compressive strength and cumulative heat release at early ages is sought
based on analysis of a database that contains hundreds of mortar specimens comprising ordinary
portland cement mortars, mortars with fly ash replacement for cement, and ternary blends of
limestone, fly ash, and cement [5-15].
Data Sources
Compressive strengths and calorimetry data were obtained from a variety of published
studies on mortars, and one study on concrete, as indicated in Table 1. These studies were
conducted at either the National Institute of Standards and Technology (NIST) or at Purdue
University. Generally, mortar cube compressive strengths were obtained on specimens that were
cured in limewater, with the exception of references [10] and [11], where sealed curing was
employed. Conversely, isothermal calorimetry was generally conducted on small specimens of
the same mortar mixtures that were placed in sealed vials. (The influence of curing conditions
will be addressed in more detail in the Results and Discussion section.) Typically, isothermal
calorimetry data are only collected for 7 d or perhaps 14 d, as beyond these times, the signal-to-
noise ratio becomes quite small. For the ASTM C109 [16] mortar cube tests [14,15] at ages of 7
d and 28 d, therefore, the cumulative heat release values were instead obtained from the ASTM
C186 Standard Test Method for Heat of Hydration of Hydraulic Cement [17], which measures
the heat of solution of hydrated paste (7 d or 28 d) and original cement powder samples. The
heat of hydration or cumulative heat release is then obtained by difference. For the mixtures, w/c
indicates water-to-cement mass ratio for pastes containing only portland cement and water, w/cm
refers to water-to-cementitious materials ratio on a mass basis where cementitious material
3
includes cement and fly ash, and w/p refers to water-to-powder mass ratio for mixtures with
limestone additions where the powder includes cement, limestone, and fly ash if present.
Table 1. Data sources for cumulative heat release and mortar cube compressive strengths
employed in the present analysis.
Number of
data points Ages (d)
w/c, w/cm, or
w/p
Blaine fineness
(m2/kg)
C3SA
(%) Reference
18 1, 3, and 7 0.40 302-613 61-62 [5]
12 1, 3, and 7 0.325-0.425 380 57.5 [6]
55 1, 3, and 7 0.35-0.427 > 376 57 [7]
24 1 and 7 0.30-0.42 476 52 [8]
18 1 and 7 0.30 387, 613 61-62 [9]
40 1, 3, 7, and 14 0.30-0.42 476 52 [10]
40 1 to 14 0.45 476 52 [11]
81B 1, 3, and 7 0.38, 0.42, 0.46 various 42-66 [12]
9 7 ~0.484 367 52 [13]
50 7 and 28 0.484 (0.40) various various [14,15] ACement chemistry notation is used throughout this paper: C=CaO, S=SiO2, A=Al2O3, F=Fe2O3,
H=H2O BCompressive strengths for concrete cylinders, heat release on equivalent mortars
Results and Discussion
Influence of w/c
Typically, isothermal calorimetry cumulative heat release results are reported on a basis
of either grams of cement [17] or grams of cementitious binder, typically in units of J/g. While
this provides a convenient indication of the reactivity of the cement (cementitious materials), it
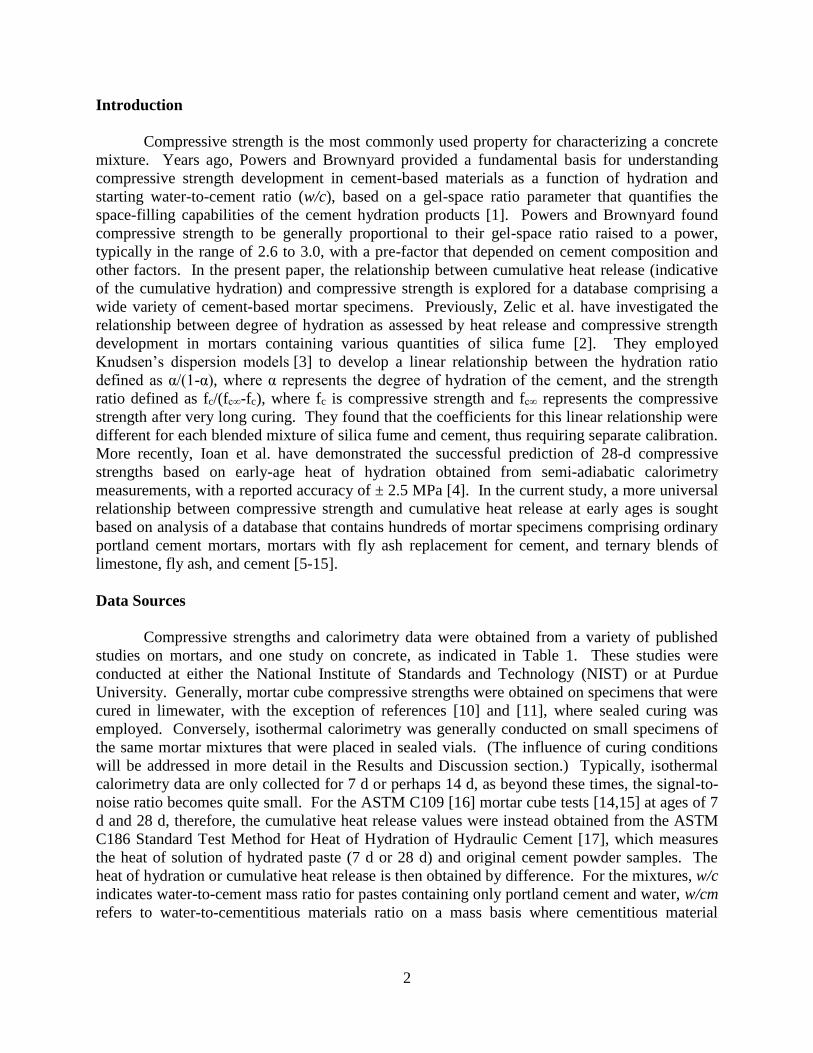
may not be the best basis for use in comparison to strength data. For example, Figure 1 shows
mortar cube compressive strength plotted vs. cumulative heat release on per gram of cement for a
series of ordinary portland cement mortars prepared at four different w/c ranging from 0.325
to 0.425 [6], with a constant volume fraction of sand. While each w/c dataset shows a highly
linear relationship between strength and cumulative heat release (R2 > 0.99 in each of the four
cases), they are clearly not all the same. Thinking back to Powers and Brownyard’s original gel-
space ratio concept, it is primarily the filling of pore space by hydration products that is
responsible for strength development in cement-based materials. Since the initial porosity of a
paste or mortar is dependent only on the powder and liquid densities and the starting w/c
(neglecting any air voids), it is perhaps not surprising that the data produces four different lines
in Figure 1 when the normalization is performed on a per mass of cement basis.
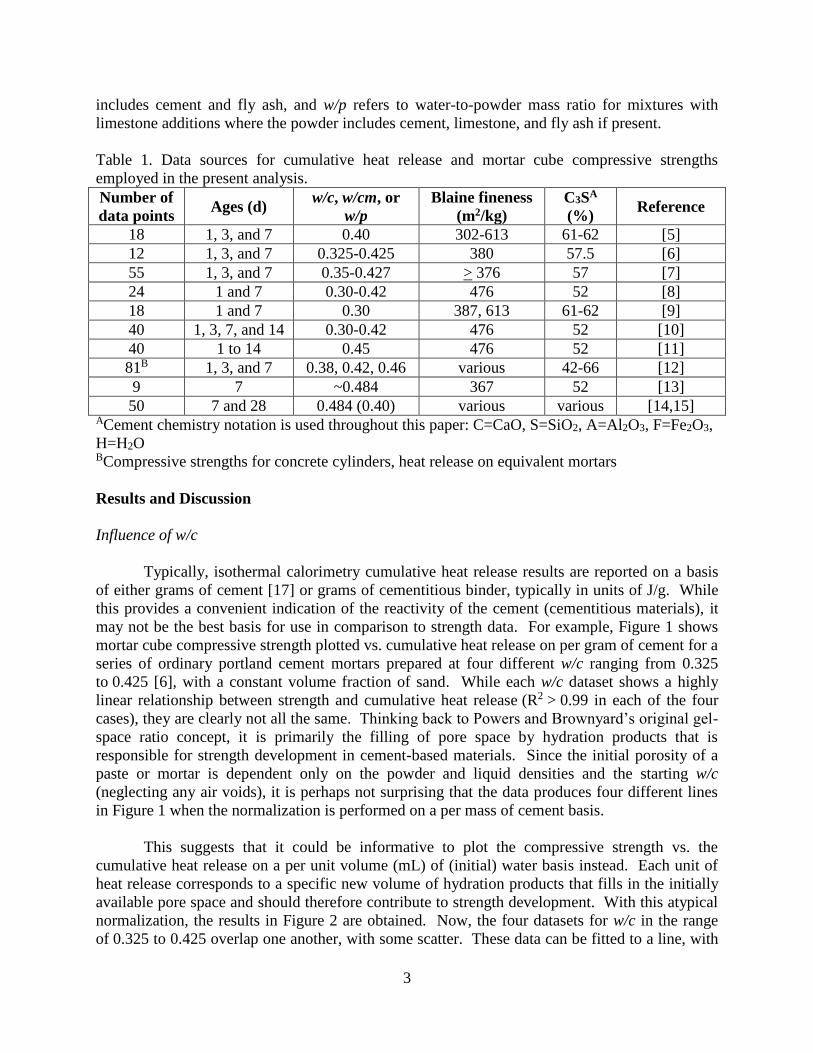
This suggests that it could be informative to plot the compressive strength vs. the
cumulative heat release on a per unit volume (mL) of (initial) water basis instead. Each unit of
heat release corresponds to a specific new volume of hydration products that fills in the initially
available pore space and should therefore contribute to strength development. With this atypical
normalization, the results in Figure 2 are obtained. Now, the four datasets for w/c in the range
of 0.325 to 0.425 overlap one another, with some scatter. These data can be fitted to a line, with
4
a slope of 0.101 MPa/(J/mL), an intercept of -18.14 MPa, and R2=0.974. The negative intercept
implies that some heat release (hydration) must occur prior to the beginning of the development
of compressive strength. This initial hydration during setting would establish a network of
connected (partially) hydrated cement particles that would provide the framework (scaffold or
backbone) for future growth and strength development.
Figure 1. Compressive strength (1 d, 3 d, and 7 d) vs. cumulative heat release per gram of cement
for mortars with four different w/c [6].
Figure 2. Compressive strength (1 d, 3 d, and 7 d) vs. cumulative heat release per mL of (mix)
water for mortars with four different w/c [6]. The solid line shows the best fit for the w/c=0.325
to 0.425 data while the two dashed lines indicate ±10 % from the best fit.
It has been shown that the setting of cement paste, a physical measurement of the
percolation of the solids within the cement paste microstructure, is also dependent on the starting
w/c [6,18]. With this in mind, it is perhaps surprising that the four datasets in Figure 2 do in fact
5
overlap, since one might expect a different intercept for each w/c. Apparently, for this limited
range of rather low w/c (0.325 to 0.425), the initial flocculation of the cement particles provides
a common or similar framework for strength development, independent of their particle
concentration (the volume fractions of cement and water). Water reducers were not used in any
of these four mortars [6], so that the initial flocculation of their cement particles should be
extensive and quite similar, perhaps resulting in the formation of a single three-dimensional floc.
For substantially higher w/c, one might expect that even more heat release would be required to
establish this backbone and initiate strength development. A single data point for a w/c=0.484
cement mortar [13], prepared with a similar cement from the same cement plant as that used in
reference [6], is included in Figure 2 to show that indeed this is the case. As would be expected,
for a given heat release, the w/c=0.484 mortar achieved a lower strength than those exhibited by
the four lower w/c mortars. This influence of w/c will be explored in more detail when the
w/c=0.484 ASTM C109 mortar cube compressive strength results are examined later in this
discussion.
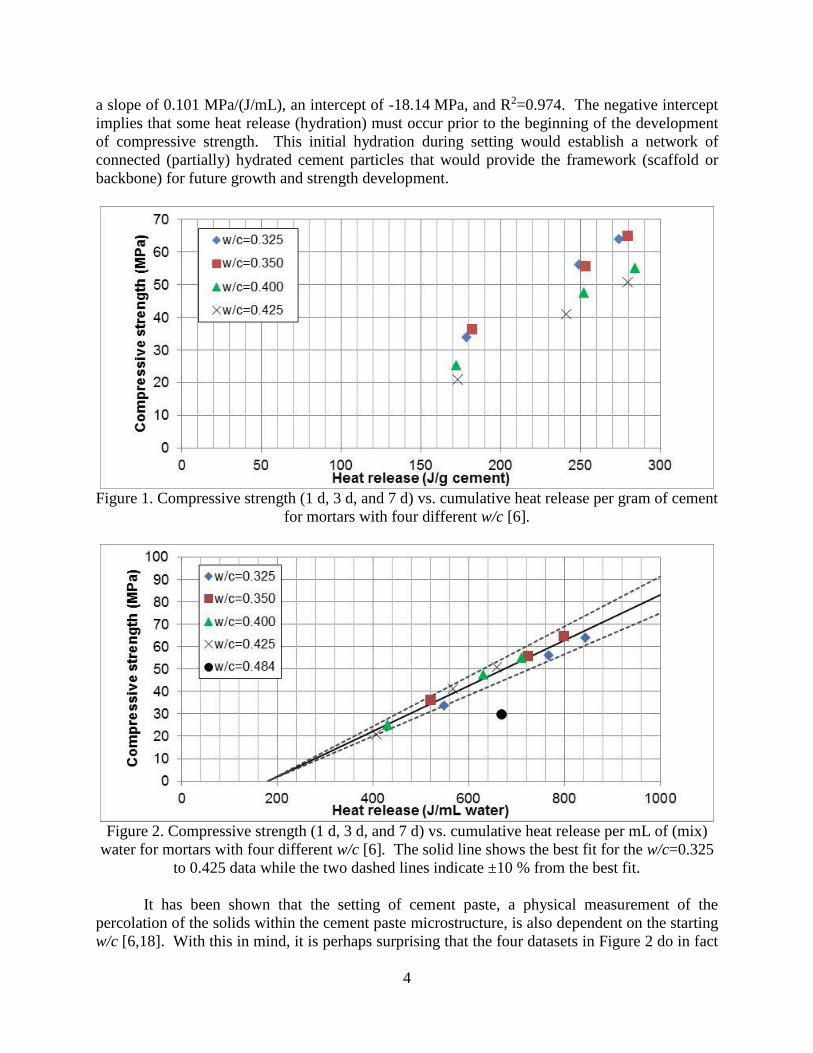
Figure 3 shows the extension of this analysis to over 100 mortar specimens taken from
recent literature [5] to [9]. All of these mortars have w/c, w/cm, or w/p within the range of 0.30
to 0.427, with some also containing a high range water reducer. While there is certainly more
scatter present in this plot than in Figure 2, the data still cluster around a best fit line with a slope
of 0.107 MPa/(J/mL), an intercept of -21.5 MPa, and R2=0.896, quite similar to the parameters
determined for the much smaller dataset in Figure 2. The majority of the data in Figure 3 fall
within the ± 20 % bounding lines for this linear fit relationship, suggesting that for these mortars,
their compressive strength could be generally predicted to this level of accuracy via
measurement of their cumulative heat release using isothermal calorimetry.
Figure 3. Compressive strength vs. heat release per mL of water for mortars from references [5]
to [9]. The solid line indicates the best fit linear relationship, with the two dashed lines
indicating ± 20 % from the best fit values.
6
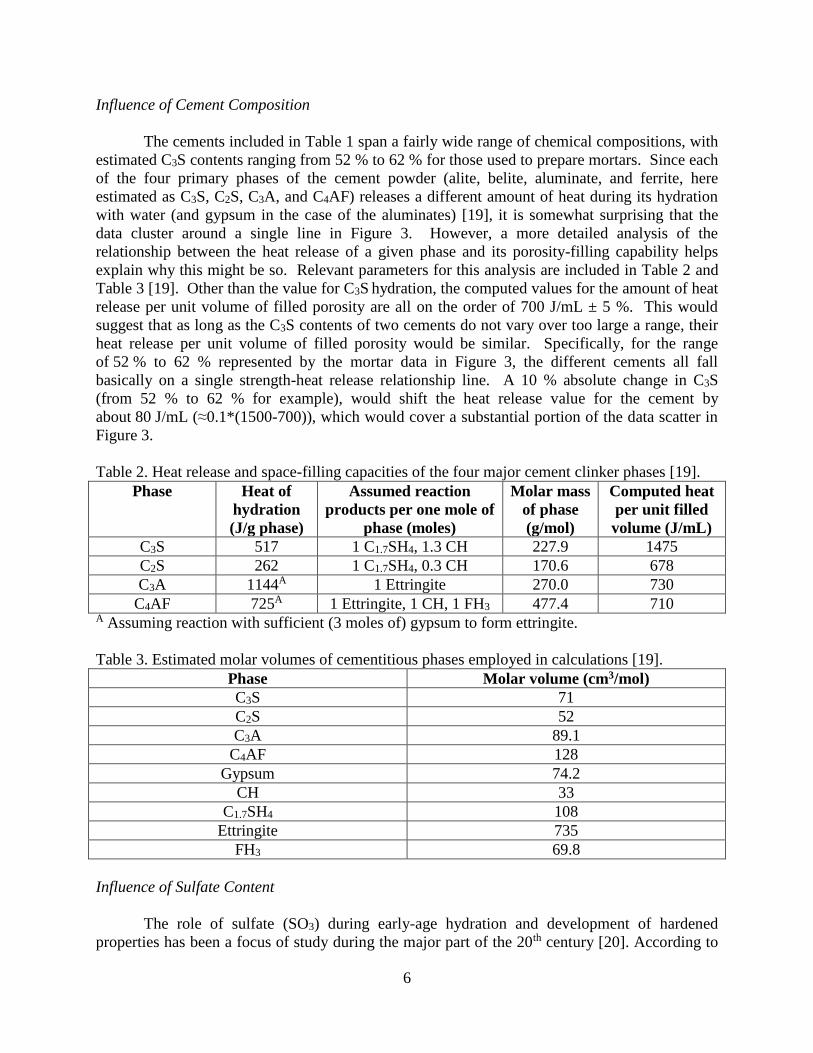
Influence of Cement Composition
The cements included in Table 1 span a fairly wide range of chemical compositions, with
estimated C3S contents ranging from 52 % to 62 % for those used to prepare mortars. Since each
of the four primary phases of the cement powder (alite, belite, aluminate, and ferrite, here
estimated as C3S, C2S, C3A, and C4AF) releases a different amount of heat during its hydration
with water (and gypsum in the case of the aluminates) [19], it is somewhat surprising that the
data cluster around a single line in Figure 3. However, a more detailed analysis of the
relationship between the heat release of a given phase and its porosity-filling capability helps
explain why this might be so. Relevant parameters for this analysis are included in Table 2 and
Table 3 [19]. Other than the value for C3S hydration, the computed values for the amount of heat
release per unit volume of filled porosity are all on the order of 700 J/mL ± 5 %. This would
suggest that as long as the C3S contents of two cements do not vary over too large a range, their
heat release per unit volume of filled porosity would be similar. Specifically, for the range
of 52 % to 62 % represented by the mortar data in Figure 3, the different cements all fall
basically on a single strength-heat release relationship line. A 10 % absolute change in C3S
(from 52 % to 62 % for example), would shift the heat release value for the cement by
about 80 J/mL (≈0.1*(1500-700)), which would cover a substantial portion of the data scatter in
Figure 3.
Table 2. Heat release and space-filling capacities of the four major cement clinker phases [19].
Phase Heat of
hydration
(J/g phase)
Assumed reaction
products per one mole of
phase (moles)
Molar mass
of phase
(g/mol)
Computed heat
per unit filled
volume (J/mL)
C3S 517 1 C1.7SH4, 1.3 CH 227.9 1475
C2S 262 1 C1.7SH4, 0.3 CH 170.6 678
C3A 1144A 1 Ettringite 270.0 730
C4AF 725A 1 Ettringite, 1 CH, 1 FH3 477.4 710 A Assuming reaction with sufficient (3 moles of) gypsum to form ettringite.
Table 3. Estimated molar volumes of cementitious phases employed in calculations [19].
Phase Molar volume (cm3/mol)
C3S 71
C2S 52
C3A 89.1
C4AF 128
Gypsum 74.2
CH 33
C1.7SH4 108
Ettringite 735
FH3 69.8
Influence of Sulfate Content
The role of sulfate (SO3) during early-age hydration and development of hardened
properties has been a focus of study during the major part of the 20th century [20]. According to
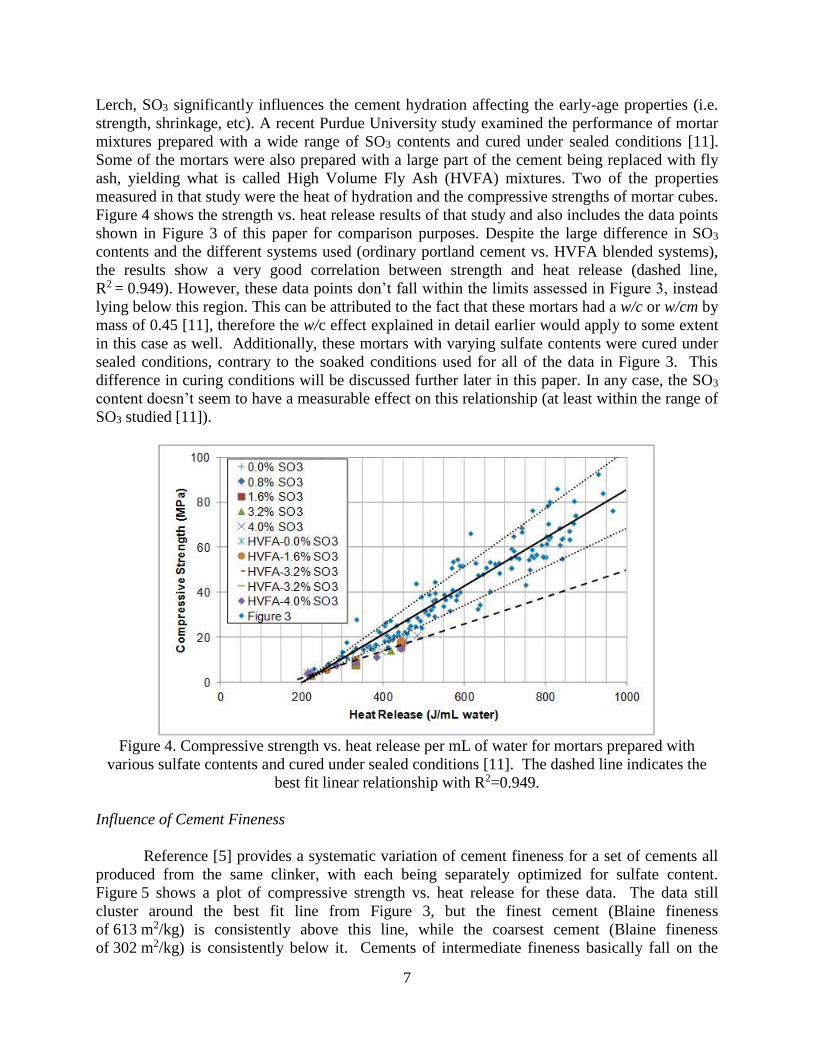
7
Lerch, SO3 significantly influences the cement hydration affecting the early-age properties (i.e.
strength, shrinkage, etc). A recent Purdue University study examined the performance of mortar
mixtures prepared with a wide range of SO3 contents and cured under sealed conditions [11].
Some of the mortars were also prepared with a large part of the cement being replaced with fly
ash, yielding what is called High Volume Fly Ash (HVFA) mixtures. Two of the properties
measured in that study were the heat of hydration and the compressive strengths of mortar cubes.
Figure 4 shows the strength vs. heat release results of that study and also includes the data points
shown in Figure 3 of this paper for comparison purposes. Despite the large difference in SO3
contents and the different systems used (ordinary portland cement vs. HVFA blended systems),
the results show a very good correlation between strength and heat release (dashed line,
R2 = 0.949). However, these data points don’t fall within the limits assessed in Figure 3, instead
lying below this region. This can be attributed to the fact that these mortars had a w/c or w/cm by
mass of 0.45 [11], therefore the w/c effect explained in detail earlier would apply to some extent
in this case as well. Additionally, these mortars with varying sulfate contents were cured under
sealed conditions, contrary to the soaked conditions used for all of the data in Figure 3. This
difference in curing conditions will be discussed further later in this paper. In any case, the SO3
content doesn’t seem to have a measurable effect on this relationship (at least within the range of
SO3 studied [11]).
Figure 4. Compressive strength vs. heat release per mL of water for mortars prepared with
various sulfate contents and cured under sealed conditions [11]. The dashed line indicates the
best fit linear relationship with R2=0.949.
Influence of Cement Fineness
Reference [5] provides a systematic variation of cement fineness for a set of cements all
produced from the same clinker, with each being separately optimized for sulfate content.
Figure 5 shows a plot of compressive strength vs. heat release for these data. The data still
cluster around the best fit line from Figure 3, but the finest cement (Blaine fineness
of 613 m2/kg) is consistently above this line, while the coarsest cement (Blaine fineness
of 302 m2/kg) is consistently below it. Cements of intermediate fineness basically fall on the
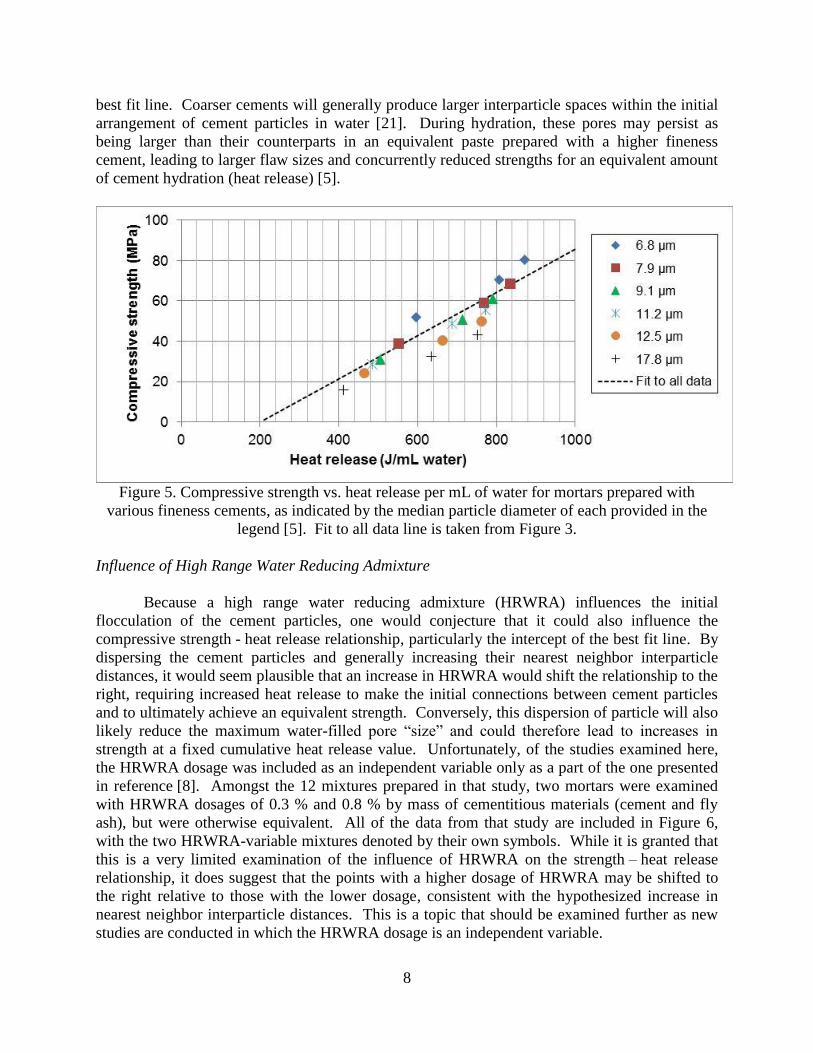
8
best fit line. Coarser cements will generally produce larger interparticle spaces within the initial
arrangement of cement particles in water [21]. During hydration, these pores may persist as
being larger than their counterparts in an equivalent paste prepared with a higher fineness
cement, leading to larger flaw sizes and concurrently reduced strengths for an equivalent amount
of cement hydration (heat release) [5].
Figure 5. Compressive strength vs. heat release per mL of water for mortars prepared with
various fineness cements, as indicated by the median particle diameter of each provided in the
legend [5]. Fit to all data line is taken from Figure 3.
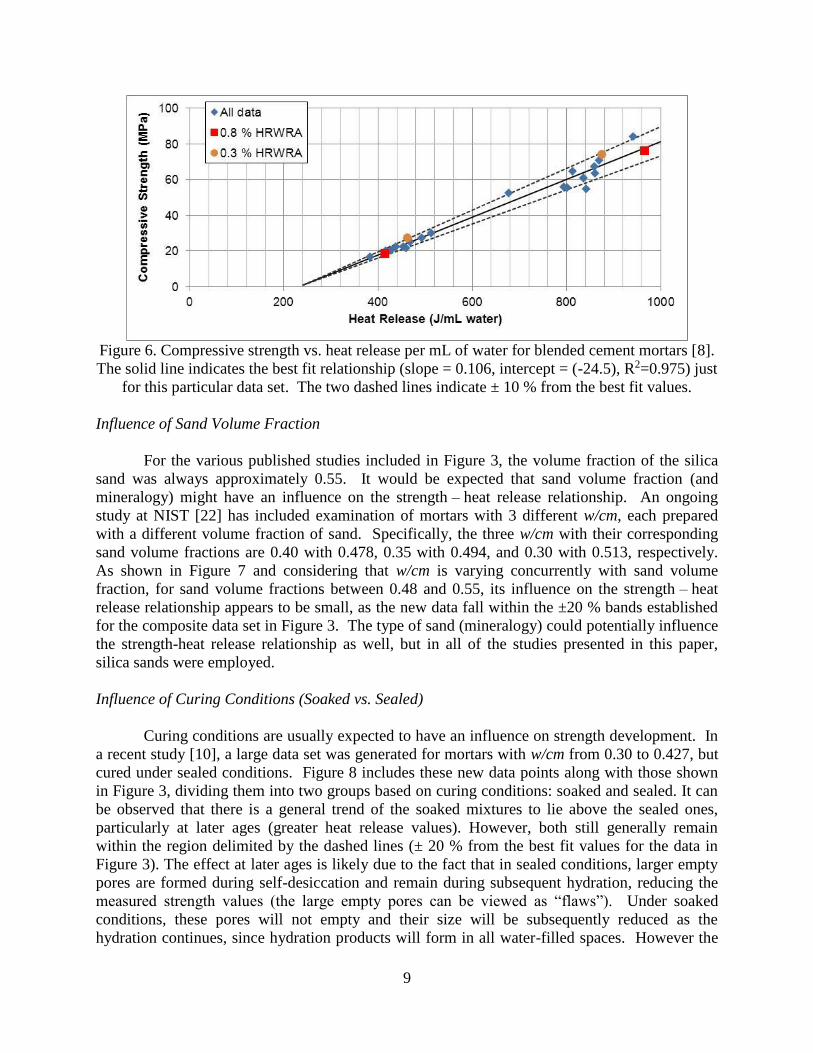
Influence of High Range Water Reducing Admixture
Because a high range water reducing admixture (HRWRA) influences the initial
flocculation of the cement particles, one would conjecture that it could also influence the
compressive strength - heat release relationship, particularly the intercept of the best fit line. By
dispersing the cement particles and generally increasing their nearest neighbor interparticle
distances, it would seem plausible that an increase in HRWRA would shift the relationship to the
right, requiring increased heat release to make the initial connections between cement particles
and to ultimately achieve an equivalent strength. Conversely, this dispersion of particle will also
likely reduce the maximum water-filled pore “size” and could therefore lead to increases in
strength at a fixed cumulative heat release value. Unfortunately, of the studies examined here,
the HRWRA dosage was included as an independent variable only as a part of the one presented
in reference [8]. Amongst the 12 mixtures prepared in that study, two mortars were examined
with HRWRA dosages of 0.3 % and 0.8 % by mass of cementitious materials (cement and fly
ash), but were otherwise equivalent. All of the data from that study are included in Figure 6,
with the two HRWRA-variable mixtures denoted by their own symbols. While it is granted that
this is a very limited examination of the influence of HRWRA on the strength – heat release
relationship, it does suggest that the points with a higher dosage of HRWRA may be shifted to
the right relative to those with the lower dosage, consistent with the hypothesized increase in
nearest neighbor interparticle distances. This is a topic that should be examined further as new
studies are conducted in which the HRWRA dosage is an independent variable.
9
Figure 6. Compressive strength vs. heat release per mL of water for blended cement mortars [8].
The solid line indicates the best fit relationship (slope = 0.106, intercept = (-24.5), R2=0.975) just
for this particular data set. The two dashed lines indicate ± 10 % from the best fit values.
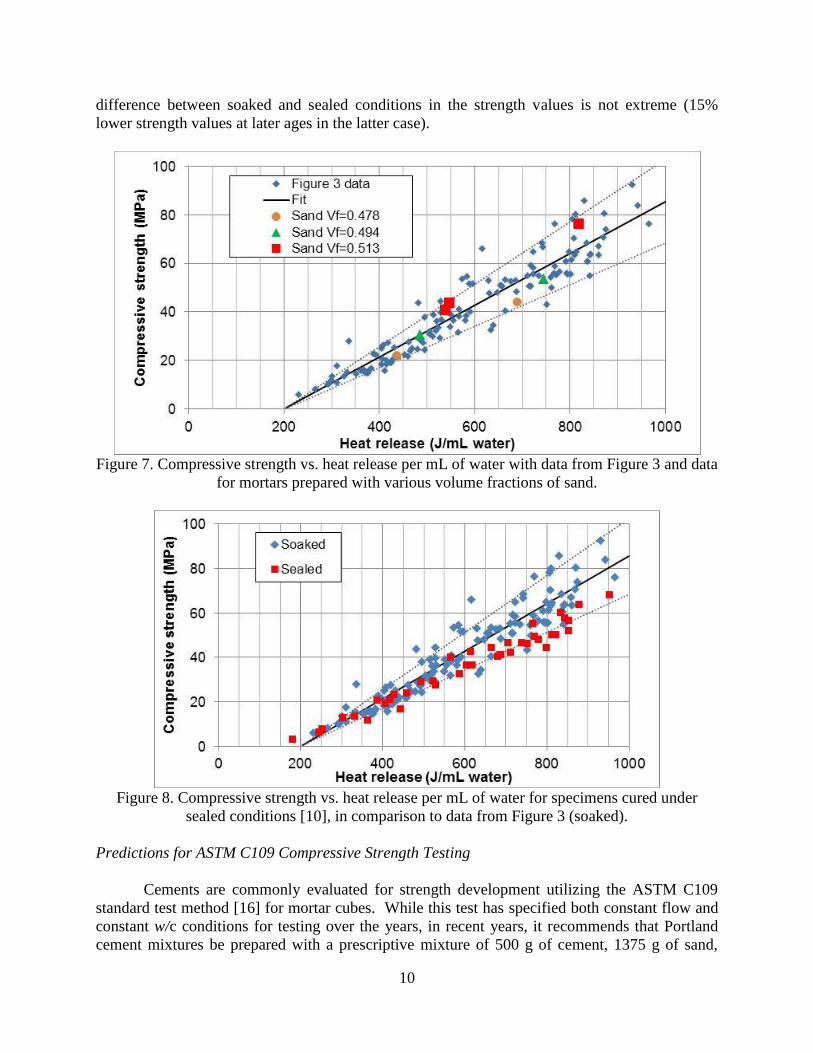
Influence of Sand Volume Fraction
For the various published studies included in Figure 3, the volume fraction of the silica
sand was always approximately 0.55. It would be expected that sand volume fraction (and
mineralogy) might have an influence on the strength – heat release relationship. An ongoing
study at NIST [22] has included examination of mortars with 3 different w/cm, each prepared
with a different volume fraction of sand. Specifically, the three w/cm with their corresponding
sand volume fractions are 0.40 with 0.478, 0.35 with 0.494, and 0.30 with 0.513, respectively.
As shown in Figure 7 and considering that w/cm is varying concurrently with sand volume
fraction, for sand volume fractions between 0.48 and 0.55, its influence on the strength – heat
release relationship appears to be small, as the new data fall within the ±20 % bands established
for the composite data set in Figure 3. The type of sand (mineralogy) could potentially influence
the strength-heat release relationship as well, but in all of the studies presented in this paper,
silica sands were employed.
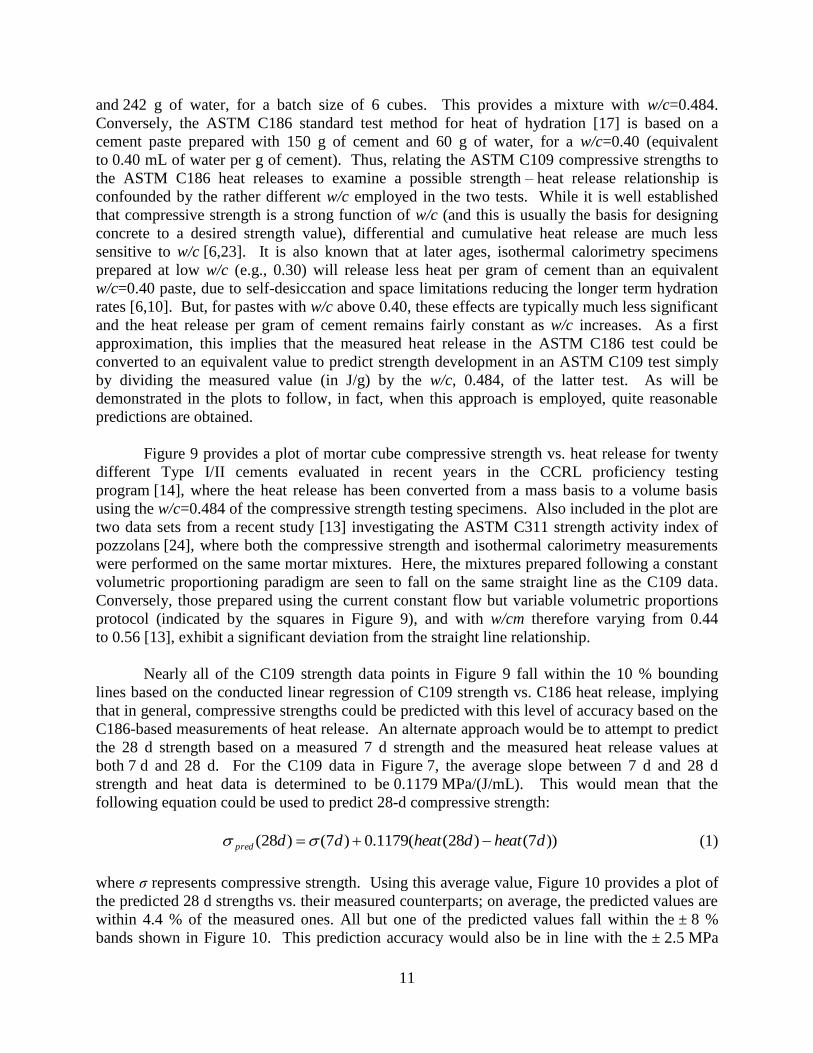
Influence of Curing Conditions (Soaked vs. Sealed)
Curing conditions are usually expected to have an influence on strength development. In
a recent study [10], a large data set was generated for mortars with w/cm from 0.30 to 0.427, but
cured under sealed conditions. Figure 8 includes these new data points along with those shown
in Figure 3, dividing them into two groups based on curing conditions: soaked and sealed. It can
be observed that there is a general trend of the soaked mixtures to lie above the sealed ones,
particularly at later ages (greater heat release values). However, both still generally remain
within the region delimited by the dashed lines (± 20 % from the best fit values for the data in
Figure 3). The effect at later ages is likely due to the fact that in sealed conditions, larger empty
pores are formed during self-desiccation and remain during subsequent hydration, reducing the
measured strength values (the large empty pores can be viewed as “flaws”). Under soaked
conditions, these pores will not empty and their size will be subsequently reduced as the
hydration continues, since hydration products will form in all water-filled spaces. However the
10
difference between soaked and sealed conditions in the strength values is not extreme (15%
lower strength values at later ages in the latter case).
Figure 7. Compressive strength vs. heat release per mL of water with data from Figure 3 and data
for mortars prepared with various volume fractions of sand.
Figure 8. Compressive strength vs. heat release per mL of water for specimens cured under
sealed conditions [10], in comparison to data from Figure 3 (soaked).
Predictions for ASTM C109 Compressive Strength Testing
Cements are commonly evaluated for strength development utilizing the ASTM C109
standard test method [16] for mortar cubes. While this test has specified both constant flow and
constant w/c conditions for testing over the years, in recent years, it recommends that Portland
cement mixtures be prepared with a prescriptive mixture of 500 g of cement, 1375 g of sand,
11
and 242 g of water, for a batch size of 6 cubes. This provides a mixture with w/c=0.484.
Conversely, the ASTM C186 standard test method for heat of hydration [17] is based on a
cement paste prepared with 150 g of cement and 60 g of water, for a w/c=0.40 (equivalent
to 0.40 mL of water per g of cement). Thus, relating the ASTM C109 compressive strengths to
the ASTM C186 heat releases to examine a possible strength – heat release relationship is
confounded by the rather different w/c employed in the two tests. While it is well established
that compressive strength is a strong function of w/c (and this is usually the basis for designing
concrete to a desired strength value), differential and cumulative heat release are much less
sensitive to w/c [6,23]. It is also known that at later ages, isothermal calorimetry specimens
prepared at low w/c (e.g., 0.30) will release less heat per gram of cement than an equivalent
w/c=0.40 paste, due to self-desiccation and space limitations reducing the longer term hydration
rates [6,10]. But, for pastes with w/c above 0.40, these effects are typically much less significant
and the heat release per gram of cement remains fairly constant as w/c increases. As a first
approximation, this implies that the measured heat release in the ASTM C186 test could be
converted to an equivalent value to predict strength development in an ASTM C109 test simply
by dividing the measured value (in J/g) by the w/c, 0.484, of the latter test. As will be
demonstrated in the plots to follow, in fact, when this approach is employed, quite reasonable
predictions are obtained.
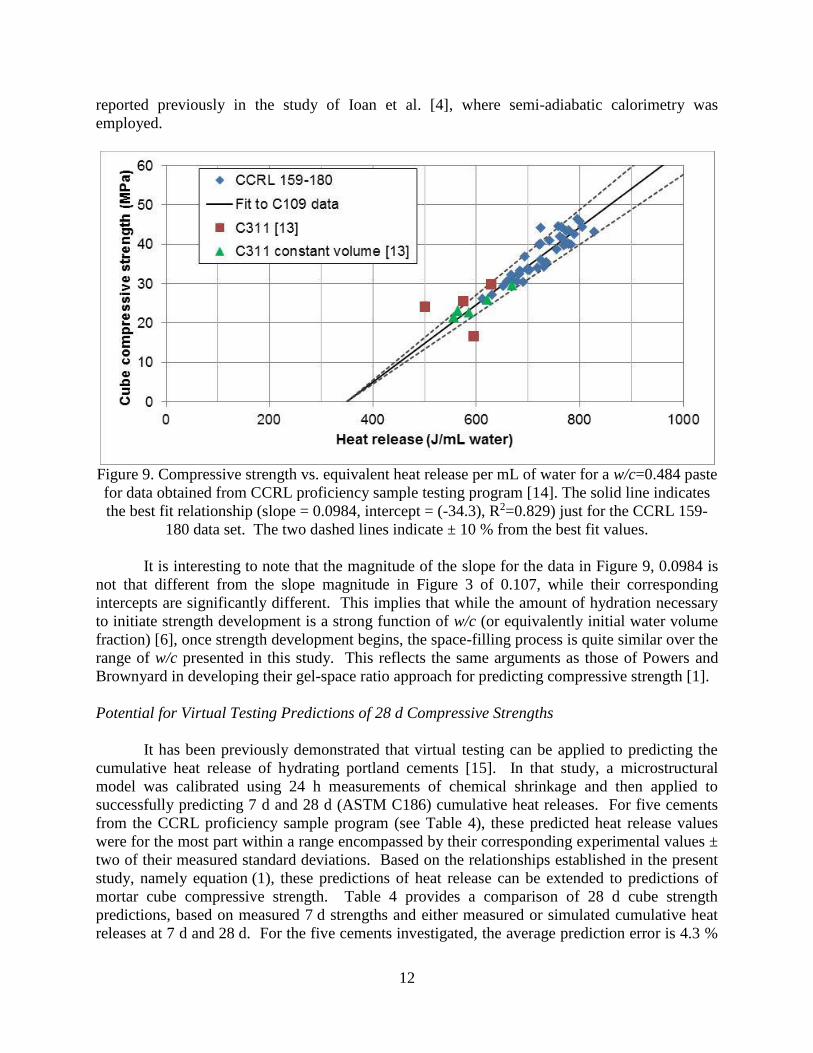
Figure 9 provides a plot of mortar cube compressive strength vs. heat release for twenty
different Type I/II cements evaluated in recent years in the CCRL proficiency testing
program [14], where the heat release has been converted from a mass basis to a volume basis
using the w/c=0.484 of the compressive strength testing specimens. Also included in the plot are
two data sets from a recent study [13] investigating the ASTM C311 strength activity index of
pozzolans [24], where both the compressive strength and isothermal calorimetry measurements
were performed on the same mortar mixtures. Here, the mixtures prepared following a constant
volumetric proportioning paradigm are seen to fall on the same straight line as the C109 data.
Conversely, those prepared using the current constant flow but variable volumetric proportions
protocol (indicated by the squares in Figure 9), and with w/cm therefore varying from 0.44
to 0.56 [13], exhibit a significant deviation from the straight line relationship.
Nearly all of the C109 strength data points in Figure 9 fall within the 10 % bounding
lines based on the conducted linear regression of C109 strength vs. C186 heat release, implying
that in general, compressive strengths could be predicted with this level of accuracy based on the
C186-based measurements of heat release. An alternate approach would be to attempt to predict
the 28 d strength based on a measured 7 d strength and the measured heat release values at
both 7 d and 28 d. For the C109 data in Figure 7, the average slope between 7 d and 28 d
strength and heat data is determined to be 0.1179 MPa/(J/mL). This would mean that the
following equation could be used to predict 28-d compressive strength:
))7()28((1179.0)7()28( dheatdheatddpred (1)
where σ represents compressive strength. Using this average value, Figure 10 provides a plot of
the predicted 28 d strengths vs. their measured counterparts; on average, the predicted values are
within 4.4 % of the measured ones. All but one of the predicted values fall within the ± 8 %
bands shown in Figure 10. This prediction accuracy would also be in line with the ± 2.5 MPa
12
reported previously in the study of Ioan et al. [4], where semi-adiabatic calorimetry was
employed.
Figure 9. Compressive strength vs. equivalent heat release per mL of water for a w/c=0.484 paste
for data obtained from CCRL proficiency sample testing program [14]. The solid line indicates
the best fit relationship (slope = 0.0984, intercept = (-34.3), R2=0.829) just for the CCRL 159-
180 data set. The two dashed lines indicate ± 10 % from the best fit values.
It is interesting to note that the magnitude of the slope for the data in Figure 9, 0.0984 is
not that different from the slope magnitude in Figure 3 of 0.107, while their corresponding
intercepts are significantly different. This implies that while the amount of hydration necessary
to initiate strength development is a strong function of w/c (or equivalently initial water volume
fraction) [6], once strength development begins, the space-filling process is quite similar over the
range of w/c presented in this study. This reflects the same arguments as those of Powers and
Brownyard in developing their gel-space ratio approach for predicting compressive strength [1].
Potential for Virtual Testing Predictions of 28 d Compressive Strengths
It has been previously demonstrated that virtual testing can be applied to predicting the
cumulative heat release of hydrating portland cements [15]. In that study, a microstructural
model was calibrated using 24 h measurements of chemical shrinkage and then applied to
successfully predicting 7 d and 28 d (ASTM C186) cumulative heat releases. For five cements
from the CCRL proficiency sample program (see Table 4), these predicted heat release values
were for the most part within a range encompassed by their corresponding experimental values ±
two of their measured standard deviations. Based on the relationships established in the present
study, namely equation (1), these predictions of heat release can be extended to predictions of
mortar cube compressive strength. Table 4 provides a comparison of 28 d cube strength
predictions, based on measured 7 d strengths and either measured or simulated cumulative heat
releases at 7 d and 28 d. For the five cements investigated, the average prediction error is 4.3 %

13
when equation (1) is applied using the measured heat release values, quite similar to the 4.4 %
determined for the data in Figure 10. When virtual testing is employed to provide the heat
release values, this average error is increased to 9 %, suggesting that the experimental heat
release values should be employed when available, but that the virtual testing may provide a
reasonable estimate for compressive strength when the experimental heat release data are not
available. If, instead, the regression equation determined for the data in Figure 9 is employed for
the strength predictions, the average prediction errors when using the measured or virtual 28 d
cumulative heat release values are 9 % and 11.6 %, respectively. As one might expect, this
indicates that having the 7 d strength data available improves the ability for predicting the 28 d
strength based on heat release measurements.
Figure 10. Predicted 28 d mortar cube compressive strength vs. measured strength for 20 CCRL-
tested mortars. The solid line indicates a 1:1 relationship, while the two dashed lines indicate a
variation of ± 8 % from this 1:1 relationship.
Table 4. Virtual Testing Predictions for 28 d Compressive Strengths
CCRL
Cement
ID
Measured
heat releases
(J/g cement)
CEMHYD3D
predicted heat
releases [15]
(J/g cement)
Measured
strengths
(MPa)
Predicted 28-d
strength based on
equation (1) and
measured values
(MPa) (Difference
from measured %)
Predicted 28-d
strength based on
equation (1) and
CEMHYD3D
(MPa) (Difference
from measured %)
115 7 d-310.9
28 d-368.6
7 d- 305.3
28 d-346.3
7 d-30.7
28 d-43.8
44.7 (2.1 %) 40.6 (7.2 %)
116 7 d-359.8
28 d-402.1
7 d-339.6
28 d-383.0
7 d-33.9
28 d-43.8
44.2 (1.0 %) 44.5 (1.6 %)
135 7 d-326.4
28 d-360.2
7 d- 327.4
28 d-375.0
7 d-31.7
28 d-40.6
39.9 (1.6 %) 43.3 (6.5 %)
141 7 d-351.1
28 d-380.7
7 d-344.2
28 d-399.6
7 d-32.6
28 d-38.3
39.8 (4.0 %) 46.1 (20.3 %)
152 7 d-362.8
28 d-415.0
7 d-372.3
28 d-417.3
7 d-37.1
28 d-44.1
49.8 (12.9 %) 48.1 (8.9 %)
14
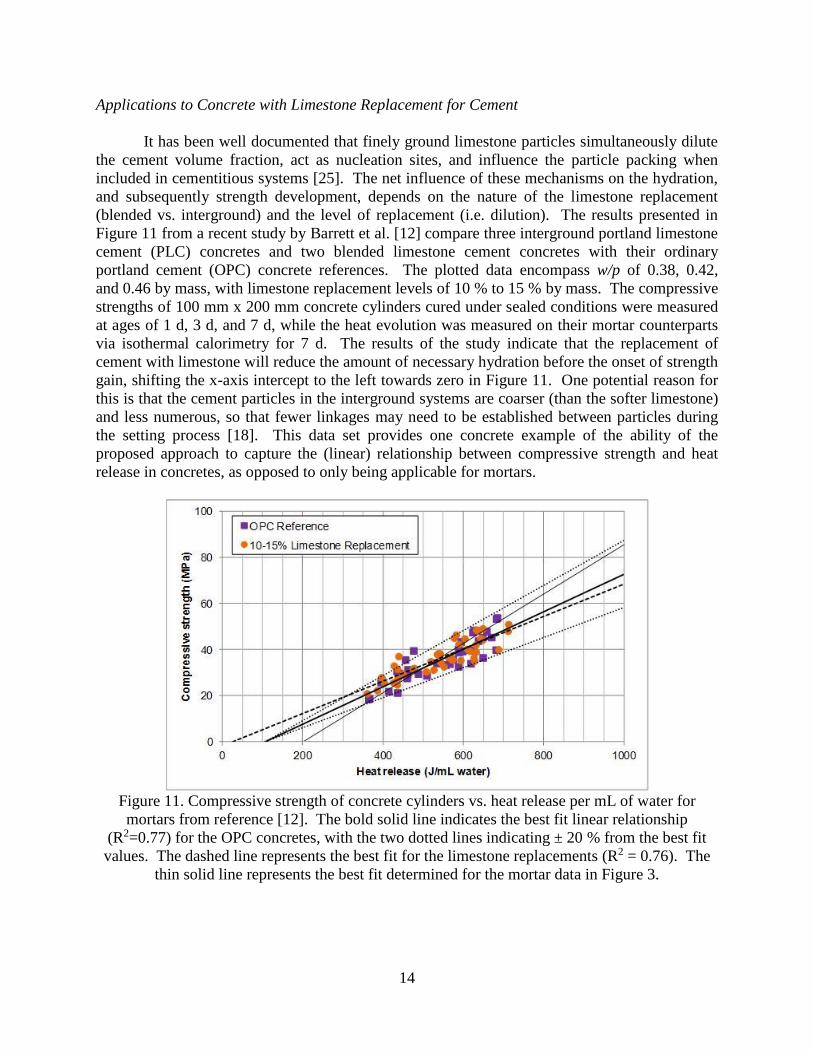
Applications to Concrete with Limestone Replacement for Cement
It has been well documented that finely ground limestone particles simultaneously dilute
the cement volume fraction, act as nucleation sites, and influence the particle packing when
included in cementitious systems [25]. The net influence of these mechanisms on the hydration,
and subsequently strength development, depends on the nature of the limestone replacement
(blended vs. interground) and the level of replacement (i.e. dilution). The results presented in
Figure 11 from a recent study by Barrett et al. [12] compare three interground portland limestone
cement (PLC) concretes and two blended limestone cement concretes with their ordinary
portland cement (OPC) concrete references. The plotted data encompass w/p of 0.38, 0.42,
and 0.46 by mass, with limestone replacement levels of 10 % to 15 % by mass. The compressive
strengths of 100 mm x 200 mm concrete cylinders cured under sealed conditions were measured
at ages of 1 d, 3 d, and 7 d, while the heat evolution was measured on their mortar counterparts
via isothermal calorimetry for 7 d. The results of the study indicate that the replacement of
cement with limestone will reduce the amount of necessary hydration before the onset of strength
gain, shifting the x-axis intercept to the left towards zero in Figure 11. One potential reason for
this is that the cement particles in the interground systems are coarser (than the softer limestone)
and less numerous, so that fewer linkages may need to be established between particles during
the setting process [18]. This data set provides one concrete example of the ability of the
proposed approach to capture the (linear) relationship between compressive strength and heat
release in concretes, as opposed to only being applicable for mortars.
Figure 11. Compressive strength of concrete cylinders vs. heat release per mL of water for
mortars from reference [12]. The bold solid line indicates the best fit linear relationship
(R2=0.77) for the OPC concretes, with the two dotted lines indicating ± 20 % from the best fit
values. The dashed line represents the best fit for the limestone replacements (R2 = 0.76). The
thin solid line represents the best fit determined for the mortar data in Figure 3.
15
Conclusions
The presented results indicate a linear relationship between compressive strength and
cumulative heat release when the latter is determined on a per unit volume of initial water basis.
While the straight line relation depends on the starting w/cm, for the data investigated in this
study for mortars, for w/cm < 0.43, a single line can be used to characterize all of the data. The
relationship for mortars is relatively robust, with variability in sulfate content, cement
composition, cement fineness, or sand volume fraction, or replacement of cement by fly ash or
limestone having only minimal impacts. Sealed curing vs. soaking was observed to have a
significant influence on the strength-heat release relationship, particularly for later age
specimens. The potential for using ASTM C186 cement paste heat release results to predict the
compressive strengths provided by ASTM C109 mortar cube testing has been demonstrated. As
an extension of this, virtual testing could be employed to predict both heat release and
compressive strength results at 7 d and 28 d. Predictions of mortar cube compressive strength
based on isothermal calorimetry heat release are generally within ± 10 % of the measured
strength values. Analysis of one dataset for concretes with and without limestone replacements
for cement has indicated that the linear relationship between strength and cumulative heat release
per unit volume of water is applicable to concretes as well as mortars.
References
1) Mindess, S., and Young, J.F., Concrete, Prentice-Hall, Englewood Cliffs, NJ, 1981.
2) Zelic, J., Rusic, D., Krstulovic, R., A Mathematical Model for Prediction of Compressive
Strength in Cement-Silica Fume Blends, Cement and Concrete Research, Vol. 34, 2319-
2328, 2004.
3) Knudsen, T., The Dispersion Model for Hydration of Portland Cement: I. General
Concepts, Cement and Concrete Research, Vol. 14, 622-630, 1984.
4) Ioan, M., Radu, L., and Mandoiu, C., Software-Enhanced Method for Rapid
Determination of the Early Heat of Hydration of Cement CEM II/A and B-S to Predict
the 28-day Compressive Strength, Proceedings of the 1st International Proficiency Testing
Conference, Sinaia, Romania, Oct. 11-13, 355-362, 2007.
5) Bentz, D.P., Blending Different Fineness Cements to Engineer the Properties of Cement-
Based Materials, Magazine of Concrete Research, Vol. 62 (5), 327-338, 2010.
6) Bentz, D.P., Peltz, M.A., Winpigler, J., Early-Age Properties of Cement-Based Materials:
II. Influence of Water-to-Cement Ratio, ASCE Journal of Materials in Civil Engineering,
Vol. 21 (9), 512-517, 2009.
7) Bentz, D.P., Ferraris, C.F., and Filliben, J.J., Optimization of Particle Sizes in High
Volume Fly Ash Blended Cements, NISTIR 7763, U.S. Department of Commerce, Feb.
2011.
8) Bentz, D.P., Sato, T., de la Varga, I., and Weiss, W.J., Fine Limestone Additions to
Regulate Setting in High Volume Fly Ash Mixtures, Cement and Concrete Composites,
Vol. 34 (1), 11-17, 2012.
9) Bentz, D.P., Ferraris, C.F., De la Varga, I., Peltz, M.A., and Winpigler, J., Mixture
Proportioning Options for Improving High Volume Fly Ash Concretes, International
Journal of Pavement Research and Technology, Vol. 3 (5), 234-240, 2010.
16
10) De la Varga, I., Castro, J., Bentz, D., and Weiss, J., Application of Internal Curing for
Mixtures Containing High Volumes of Fly Ash, Cement and Concrete Composites, Vol.
34, 1001-1008, 2012.
11) De la Varga, I., Increased Use of Fly Ash in Concrete Structures, Ph.D. Thesis, Purdue
University, 2013.
12) Barrett, T.J., et al., Performance of More Sustainable Cements that Include Interground
Limestone Additions of up to 15 %, Joint Transportation Research Program, 2012.
13) Bentz, D.P., Duran-Herrera, A., and Galvez-Moreno, D., Comparison of ASTM C311
Strength Activity Index Testing vs. Testing Based on Constant Volumetric Proportions,
Journal of ASTM International, Vol. 9 (1), 2012.
14) CCRL Proficiency Sample Reports, available at http://www.ccrl.us/Psp/Reports.htm
(access verified Sept. 8, 2011).
15) Bentz, D.P., Verification, Validation, and Variability of Virtual Standards, 12th
International Congress on the Chemistry of Cement, Montreal, 2007, CD-RoM.
16) ASTM C109/C109M-11. Standard Test Method for Compressive Strength of Hydraulic
Cement Mortars (Using 2-in. or [50-mm] Cube Specimens). ASTM International, West
Conshohocken, PA, 2011.
17) ASTM C186-05. Standard Test Method for Heat of Hydration of Hydraulic Cement.
ASTM International, West Conshohocken, PA, 2005.
18) Bentz, D.P., Cement Hydration: Building Bridges and Dams at the Microstructure Level,
Materials and Structures, Vol. 40 (4), 397-404, 2007.
19) Bentz, D.P., Three-Dimensional Computer Simulation of Portland Cement Hydration and
Microstructure Development, Journal of the American Ceramic Society, Vol. 80 (1),
3-21, 1997.
20) Lerch, W., The Influence of Gypsum on the Heat of Hydration and Properties of Portland
Cement Pastes, American Society of Testing Materials, Bulletin 12, 1946.
21) Bentz, D.P., and Aitcin, P.-C., The Hidden Meaning of Water-to-Cement Ratio, Concrete
International, Vol. 30 (5), 51-54, 2008.
22) Bentz, D.P., Stutzman, P.E., Sakulich, A.R., and Weiss, W.J., Study of Early-Age Bridge
Deck Cracking in Nevada and Wyoming, NISTIR 7841, U.S. Department of Commerce,
2012.
23) Sandberg, P.J., and Roberts, L.R., Cement-Admixture Interactions Related to Aluminate
Control, Journal of ASTM International, Vol. 2 (6), 1-14, 2005.
24) ASTM C311-11a. Standard Test Methods for Sampling and Testing Fly Ash or Natural
Pozzolans for Use in Portland-Cement Concrete. ASTM International, West
Conshohocken, PA, 2011.
25) Tennis, P.D., Thomas, M.D.A., and Weiss, W.J., State-of-the-Art Report on Use of
Limestone in Cement at Levels of up to 15 %, PCA R&D Serial No. SN3148, Portland
Cement Association, Skokie, IL, 2011.