Embed Size (px)
Citation preview
NASCTN Plan [P-18-1]
Advanced Wireless Service 3 (AWS-3) Long-
Term Evolution (LTE) Impacts on Aeronautical
Mobile Telemetry (AMT)
Test and Metrology Test Plan
Mark Lofquist MITRE
Dan Jablonski JHU APL
Ari Cortes MITRE
William F. Young MITRE
Duncan McGillivray NIST/CTL
Melissa Midzor NIST/CTL
Keith Hartley MITRE
Irena Stevens NIST/CTL
December 15, 2018

National Advanced Spectrum and Communications
Test Network (NASCTN)
The mission of the National Advanced Spectrum and Communications Test Network (NASCTN)
is to provide, through its members, robust test processes and validated measurement data
necessary to develop, evaluate, and deploy spectrum sharing technologies that can increase
access to the spectrum by both federal agencies and non-federal spectrum users.
NASCTN was formed to provide a single focal point for engaging industry, academia, and other
government agencies on advanced spectrum technologies, including testing, measurement,
validation, and conformity assessment. The National Institute of Standards and Technology
(NIST) hosts the NASCTN capability at the Department of Commerce Boulder Laboratories in
Boulder, Colorado.
NASCTN is a membership organization under a charter agreement. Members
• Make available, in accordance with their organization’s rules policies and regulations,
engineering capabilities and test facilities, with typical consideration for cost.
• Coordinate their efforts to identify, develop, and test spectrum sharing ideas, concepts, and
technology to support the goal of advancing more efficient and effective spectrum sharing.
• Make available information related to spectrum sharing, considering requirements for the
protection of intellectual property, national security, and other organizational controls, and,
to the maximum extent possible, allow the publication of NASCTN test results.
• Ensure all spectrum sharing efforts are identified to other interested members.
Current charter members are:
• Department of Defense Chief Information Officer (DoD CIO)
• National Institute of Standards and Technology (NIST)
• National Oceanic and Atmospheric Administration (NOAA)
• National Science Foundation (NSF)
• National Telecommunications and Information Administration (NTIA)
• National Aeronautics and Space Administration (NASA)

NASCTN Plan [P-18-1]
Advanced Wireless Service 3 (AWS-3) Long-
Term Evolution (LTE) Impacts on Aeronautical
Mobile Telemetry (AMT)
Test and Metrology Test Plan
Mark Lofquist MITRE
Dan Jablonski JHU APL
Ari Cortes MITRE
William F. Young MITRE
Duncan McGillivray NIST/CTL
Irena Stevens CU, ITP
Keith Hartley MITRE (Project Manager)
Melissa Midzor NIST/CTL (Program Manager)
December 15, 2018

ii
Disclaimer
This document is disseminated by the National Advanced Spectrum and Communications Test
Network (NASCTN) in the interest of information exchange. The United States Government
assumes no liability for the contents or use thereof. The United States Government does not
endorse products or manufacturers. Trade or manufacturers’ names appear herein solely because
they are considered essential to the objective of this report.

iii
Preface
The National Advanced Spectrum and Communications Test Network (NASCTN) provides an
impartial, scientifically rigorous forum for addressing spectrum-sharing challenges in an effort to
accelerate the deployment of wireless technologies among commercial and federal users and to
measure the impacts of spectrum dependent systems deployments.
NASCTN’s mission is to provide robust test processes, validated measurement data, and
statistical analysis necessary to develop, evaluate, and deploy spectrum sharing technologies that
can increase access to the spectrum by both federal agencies and non-federal spectrum users.
Representatives from Edwards Air Force Base (EAFB) submitted a proposal to NASCTN to
measure long-term evolution (LTE) User Equipment (UE) emissions in the United States
Advanced Wireless Service (AWS)-3 frequency band (1755-1780 MHz) and aeronautical mobile
telemetry (AMT) systems in the adjacent L-Band (1780-1850 MHz). This proposal builds on and
extends a previous NASCTN project that measured the out of band (OoB) LTE evolved Node B
(eNB) and UE AWS-3 emissions into adjacent L and S (2200-2395 MHz) frequency band AMT
systems. The results of the previous NASCTN project are documented in NIST Technical Note
TN-1980 [1]. While the previous test measured general LTE OoB emissions, this project
specifically measures the impact to AMT systems.
After the NASCTN steering committee accepted the EAFB proposal as a NASCTN test, a test
plan development team was assembled composed of experienced engineers and other
professionals. The results of that work plus the knowledge and creativity of the team members
culminated in the production of this test plan.
The test plan is designed to yield reproducible measurements. This NASCTN effort focuses on
impacts of LTE UE AWS-3 activities to AMT activities in the adjacent L-Band. NASCTN will
solicit comments about the test plan from the engineering community within federal and non-
federal groups and entities.

iv
Contents
Disclaimer ....................................................................................................................................... ii
Preface............................................................................................................................................ iii
List of Figures ................................................................................................................................ vi
List of Tables ................................................................................................................................ vii
Executive Summary ..................................................................................................................... viii
1. Introduction ............................................................................................................................... 1
1.1. Background ...................................................................................................................... 2
1.2. Objectives ......................................................................................................................... 4
1.3. Scope ................................................................................................................................ 4
1.4. Deliverables ...................................................................................................................... 5
2. Test Methods ............................................................................................................................. 6
2.1. Power Measurements ....................................................................................................... 6
2.2. Key Performance Indicators (KPIs) ................................................................................. 8
2.3. Devices Under Test (DUTs) ............................................................................................. 9
2.3.1. Test Signals ............................................................................................................... 9
2.3.2. LTE Waveforms........................................................................................................ 9
2.3.3. AMT ........................................................................................................................ 11
2.4. Measurement Equipment................................................................................................ 11
2.5. Measurement Setup ........................................................................................................ 11
2.6. Measurement Procedures ............................................................................................... 13
2.7. Calibration and Verification Procedure.......................................................................... 14
2.8. Measurement Location(s) ............................................................................................... 16
3. Statistical Test Design............................................................................................................. 17
3.1. Overview ........................................................................................................................ 17
3.2. Problem Scope and Test Objectives ............................................................................... 17
3.3. Response Variables ........................................................................................................ 18
3.4. Control Variable Considerations: ................................................................................... 18
3.5. Plan for Testing .............................................................................................................. 18
3.5.1. Near LTE Condition ............................................................................................... 19
3.5.2. Far LTE Condition .................................................................................................. 19
3.6. Final Test Space Coverage (subject to change) ............................................................. 20
3.7. Final AMT Testing Strategy .......................................................................................... 21
3.8. Statistical Data Analysis and Evaluation Plan ............................................................... 21
4. Test Support ............................................................................................................................ 22
4.1. Coordination and Outreach ............................................................................................ 22
4.2. Data Management .......................................................................................................... 22

v
4.3. Safety .............................................................................................................................. 22
4.4. Project Tasks .................................................................................................................. 23
5. References ............................................................................................................................... 24
6. Acronyms ................................................................................................................................ 26
Appendix A – Design of Experiment............................................................................................ 28
Appendix B – D-Optimal Split-Split-Plot Run Matrix ................................................................. 30
Appendix C – Test Plan Compared to Existing Test Methods ..................................................... 34

vi
List of Figures
Figure 1. Description of AWS-3 band. ........................................................................................... 2
Figure 2. Frequency bands of interest for this test. ......................................................................... 3
Figure 3. Operational View of Test ................................................................................................ 4
Figure 4. LTE OoB Emissions extending into the Federal band .................................................... 6
Figure 5. Test scenario concept ...................................................................................................... 7
Figure 6. Delta path loss for two 100 meter-spaced UE ................................................................. 8
Figure 7. Response versus KPIs...................................................................................................... 8
Figure 8. OoB of UEs from NIST TN-1980 ................................................................................. 10
Figure 9. Basic RF elements and connections of the test setup. ................................................... 12
Figure 10. Instrument control and data collection connectivity for the test setup ........................ 13
Figure 11. Design of Experiment. ................................................................................................. 28
Figure 12. DOE-based Test Design Framework ........................................................................... 29
Figure 13. LTE interference effects across one KPI versus multiple KPIs .................................. 35

vii
List of Tables
Table 1. List of Test Equipment ................................................................................................... 11
Table 2. Example of uncertainty values collected during the calibration and verification
process........................................................................................................................................... 15
Table 3. Test Space Coverage ....................................................................................................... 20
Table 4. Attributes of DOE-based Test Design ............................................................................ 29
Table 5. D-Optimal Split-Split-Plot Run Matrix (176-run, 16-flights) ........................................ 30
Table 9. comparison of control factors and response variables (subject to change after pre-
test activities) ................................................................................................................................ 34

viii
Executive Summary
The purpose of this NASCTN project is to establish a test methodology and perform laboratory measurements of L-Band aeronautical mobile telemetry (AMT) system performance in the presence of adjacent-band Long Term Evolution (LTE) uplink emissions. The LTE user equipment (UE) operates in the United States Advanced Wireless Service 31 (AWS-3) frequency band and the AMT systems operate in the adjacent 1780 – 1850 MHz federal frequency band. This test plan provides a repeatable and disciplined test methodology for measuring and analyzing the impact to AMT systems from AWS-3 equipment emissions. The test execution will demonstrate the methodology and produce a report of the effects on AMT in the presence of varying levels of LTE signal power into the AMT receiver.
The test is divided into three primary objectives:
1 – Determine the impact of LTE on AMT systems using a combination of sensitivity and susceptibility analysis. 2 – Curate a catalog of LTE waveforms representing conditions encountered by AMT systems for use within the testing and to be used after the test by the AMT community. 3 – Conduct in-situ LTE measurements using AMT receivers to inform the first two objectives.
This plan is intended to ensure these fundamental goals:
• a transparent, well-calibrated test method
• a clear path from measurement setup to data collection and analyzed results
• statistics-based data analysis
To provide a controlled setting, the NASCTN team is focusing on a conducted (over cables) test environment for the first test objective. Testing over cables allows for control over many of the factors under test. The waveforms used in this testing assume some basic features of a communication system architecture. The plan includes baseline and simultaneous emissions of LTE UE / AMT in adjacent spectrum. In actual field deployments, LTE UE emission behavior varies in power, user density, and duty cycle therefore a subset of these behaviors will be used in the testing. Likewise, AMT has many settings and deployment scenarios, and a consensus-driven subset of these behaviors will be used in testing.
To support and complement the main impact analysis testing, NASCTN will generate and collect a catalog of LTE waveforms that represent likely and other identified conditions AMT receiver systems will experience. This catalog of waveforms will be informed by in-situ measurements of LTE emissions using real AMT receivers to determine what waveforms and conditions are most likely encountered at deployed AMT locations.
NASCTN will solicit and adjudicate comments on this test plan from the LTE and AMT stakeholders within the federal and non-federal communities.
1 AWS-3 is known in LTE parlance as Band 66 which was licensed for low-power uplink in the 1755-1780 MHz
band, paired with high power downlink in the 2155-2180 MHz band. Source:
http://wireless.fcc.gov/auctions/default.htm?job=auction_summary&id=97

1
LTE Impacts on AMT
Test and Metrology Test Plan
Mark Lofquist,2 Air Cortes,2 Dan Jablonski,3 William Young,2 Duncan McGillivray,4 Irena Stevens,5
Keith Hartley,2 Melissa Midzor4
Abstract: A test plan for measuring the impact of long-term evolution (LTE)
uplink emissions on aeronautical mobile telemetry (AMT) systems is presented
that ensures objective, repeatable, and reproducible measurement results. The test
plan describes emission measurements that will be performed by National
Advanced Spectrum and Communications Test Network (NASCTN) on a variety
of LTE emissions on a sample of AMT equipment. These measurements will
provide data on emissions from advanced wireless service 3 (AWS-3) equipment
and their impact on AMT systems. NASCTN will also curate a catalog of LTE
waveforms that represent waveforms of interest to be encountered by AMT
systems using a combination of laboratory and field collections. The data may
inform interference analyses for band sharing studies, including frequency and
distance separation parameters between LTE hardware and telemetry receiving
systems. The data collected could inform conditions of harmful interference from
UEs to telemetry links. The test methods are intended to affirm or provide
potential improvements to existing AMT coexistence testing methods. It is not the
goal of this test to make determinations on harmful interference or make spectrum
regulation determinations.
Keywords: advanced wireless service 3 (AWS-3); band sharing; band sharing
analysis; emission spectrum; interference analysis; long-term evolution (LTE);
national advanced spectrum and communications test network (NASCTN);
telemetry links; user equipment (UE); 1755-1780 MHz, 1780-1850 MHz;
aeronautical mobile telemetry (AMT); spectrum measurements.
1. Introduction
Edwards Air Force Base (EAFB) proposed a measurement campaign to the National Advanced
Spectrum and Communications Test Network (NASCTN) to measure and analyze L-Band
(1780-1850 MHz) aeronautical mobile telemetry (AMT) system effects in the presence of
varying levels of adjacent band long-term evolution (LTE) user equipment (UE). In the advanced
2 The authors are with the MITRE Corporation, Boulder, CO 80305. 3 The author is with the Johns Hopkins University Applied Physics Laboratory, Laurel, MD, 20723. 4 The authors are with the Communications Technology Laboratory, National Institute of Standards and
Technology, U.S. Department of Commerce, Boulder, CO 80305. 5 The author is with the Interdisciplinary Telecom Program, University of Colorado, Boulder, Colorado 80309.

2
wireless service 3 (AWS-3) band LTE uplink of user devices are slated to operate between1755
MHz and 1780 MHz).
This plan describes a series of controlled laboratory measurements of key parameters to the
operation of an AMT system across a variety of LTE UE signaling conditions. This plan
describes a methodology, test execution, and the data analysis needed to produce the final report.
To support the laboratory test, NASCTN will also develop a catalog of LTE waveforms to serve
as the added signal. The catalog will use a combination of laboratory and field measurement
collections to represent the types of LTE waveforms ATM systems could encounter at deployed
locations.
1.1. Background
In the 2010 Presidential Memorandum on Unleashing the Wireless Broadband Revolution [2],
the National Telecommunications and Information Administration (NTIA) was tasked to identify
underutilized spectrum suitable for wireless broadband use. In the subsequent NTIA Fast Track
Report [3], many federal bands were identified as commercially viable. From this report, the
Federal Communication Commission (FCC) identified 1695 MHz to 1710 MHz, 1755 MHz to
1780 MHz, and 2155 MHz to 2180 MHz together as the 3rd advanced wireless services group of
bands (called together AWS-3) in July 2013, shown in Figure 1. The FCC adopted a Report and
Order in March 2014 with allocation, technical, and licensing rules for commercial use of the
AWS-3 bands [4]. The uplink blocks of interest here are the 5 MHz blocks labeled G, H, and I
and the 10 MHz J block.
Figure 1. Description of AWS-3 band.
Through Auction 97 [5], the AWS-3 band was auctioned for commercial mobile broadband
usage in the United States. The auction raised $41B in revenue for the United States Treasury
and required federal agencies in the AWS-3 band to look for other ways to accomplish their
missions. In the 1755 MHz to 1780 MHz portion of the AWS-3 band, the DoD is using a
combination of sharing, compression, and relocation to other bands (including the 2025 MHz to
2110 MHz band).

3
The FCC is issuing licenses for the introduction of new mobile radio systems into the 1755–1780
MHz (uplink) and 2155–2180 MHz (downlink). Emissions from LTE devices have the potential
to impact operation of adjacent-band AMT systems that operate in the 1780–1850 MHz (L-
Band). This part of the frequency spectrum is depicted in Figure 2.
Figure 2. Frequency bands of interest for this test.
Regarding the new AWS-3 LTE UE systems that will deploy in the 1755–1780 MHz spectrum,
the adjacent-band telemetry systems are air-to-ground links that support U.S. flight-test and
space operations. These links use high-gain antennas that may be pointed at elevation angles
approaching 0 degrees (the horizon). This condition is due to systems mission requirement to
support long link ranges between airborne test platforms and ground stations to track airborne
platforms carrying telemetry transmitters. The airborne telemetry transmitter signals are received
ground-based telemetry antennas which then feed into ground-based telemetry receivers for
reception of real-time data feeds that can be monitored, recorded and analyzed.
Detailed measurements and analyses need to be performed to determine the potential impact of
AWS-3 LTE UE emissions on AMT systems. These measurements are valuable in that they
could inform on spectrum sharing and collision avoidance and how much off-tuning (number of
megahertz) or distance separation (number of kilometers) are needed between transmitters and
telemetry receiver stations to avoid harmful interference6 to the telemetry receivers.
LTE transmission, reception, OoB limits, and testing are governed by 3rd Generation Partnership
Project (3GPP) specifications [6][7][8].
AMT standards are developed and maintained by the Range Commander’s Council (RCC)
Telemetry Group [9]. IRIG 106 Appendix 2F states protection criteria for AMT systems in all
the available telemetry bands. Protection criteria for telemetry systems in the aeronautical
mobile service are defined and maintained by the International Telecommunications Union
(ITU) [10].
6 It is not in the mission of NASCTN to provide recommendations about spectrum sharing, or what impacts describe
harmful interference.
DoD Federal UseeNBTX
1755MHz
1780MHz
1850MHz
2155MHz
2180MHz
2200MHz
2395MHz
25MHz
70MHz
25MHz
195MHz
305MHz
20MHz
AWS-3UL
L Band AWS-3DL
S Band
UETX

4
Test ideas are influenced and informed by previous NASCTN projects [11] and independent
studies by others, such as [12].
Figure 3 provides a high-level operational view of how LTE UE emissions could enter the AMT
link. In Figure 3, the blue shape is intended signals and the red is unintended signals. The
NASCTN test will seek to duplicate this scenario in a controlled laboratory environment. Details
on the equipment, setup, and procedures are provided in Section 2.
Figure 3. Operational View of Test
1.2. Objectives
The overall objective of this test plan is to develop a methodology that quantifies the effects on
AMT systems in the presence of uplink LTE adjacent-band emissions. This analysis will be
accomplished through three separate but related objectives:
1 – Determine the impact of LTE on AMT systems using a combination of sensitivity and
susceptibility analyses, presented as absolute powers and carrier to interference ratios.
2 – Curate a catalog of LTE waveforms representing conditions encountered by AMT systems
for use within the testing and to be used after the test by the AMT community.
3 – Conduct in-situ LTE measurements using AMT antenna platforms or equivalent to inform
the first two objectives.
1.3. Scope
The test method discussed here focuses on a conducted (over cables) setup with settings intended
to reproduce the setup shown in Figure 3. This test measures the LTE impacts on AMT, not
AMT impacts to LTE. While collecting data and analyzing the impact to LTE may also be of
interest, there is no sponsor requesting such testing, and it is beyond the scope of this test.

5
A key aspect in the investigation is to understand the quality and availability of response
variables for AMT systems. These response variables are a subset of AMT’s key performance
indicators (KPIs) and provide an indication of the impact of LTE emissions to the AMT systems.
A specific response variable recorded from software or a piece of test equipment will be referred
to as a measurand. When possible, each measurand will be given with bounds of certainty.
Emphasis is on real-world expected signals. However, where practical, the signal levels will
cover a range of power levels that could inform system architecture considerations.
An important consideration in the testing is the specifics of the LTE waveform. The UE uplink
closest (uppermost block is the J-block, 1770-1780 MHz) to the AMT band is considered the
block most likely to cause disruption.
1.4. Deliverables
➢ A test plan which includes a repeatable test methodology to collect LTE UE and AMT
data
➢ A set of raw and processed data from lab testing to validate test methodology
➢ List of key response variables (with confidence bounds) that indicate an impact on AMT
systems (such as AMT KPIs versus interference power)
➢ Analysis techniques and results to capture impact of LTE on AMT systems
➢ Catalog of LTE waveforms (frequency agnostic frequency domain duplexed (FDD) In-
Phase and Quadrature (IQ) waveforms categorized by LTE parameters)
➢ AMT KPI response curves as parameterized by LTE waveforms that are included in the
catalog
6
2. Test Methods
As a high-level explanation, varying levels of adjacent band LTE UE power (Section 2.1) and
varying LTE characteristics and quantities (Section 2.3) will be applied to a telemetry link in a
laboratory setting to determine effects on system KPIs (Section 2.2) as a function of AMT and
LTE signal levels.
2.1. Power Measurements
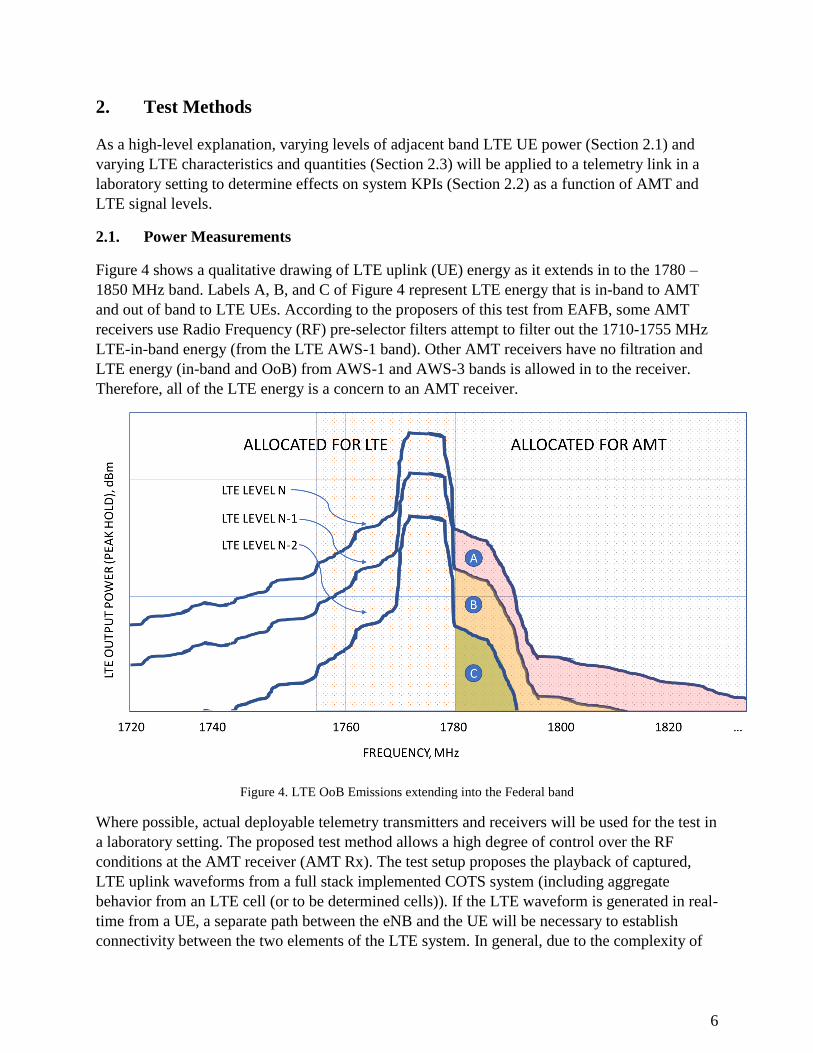
Figure 4 shows a qualitative drawing of LTE uplink (UE) energy as it extends in to the 1780 –
1850 MHz band. Labels A, B, and C of Figure 4 represent LTE energy that is in-band to AMT
and out of band to LTE UEs. According to the proposers of this test from EAFB, some AMT
receivers use Radio Frequency (RF) pre-selector filters attempt to filter out the 1710-1755 MHz
LTE-in-band energy (from the LTE AWS-1 band). Other AMT receivers have no filtration and
LTE energy (in-band and OoB) from AWS-1 and AWS-3 bands is allowed in to the receiver.
Therefore, all of the LTE energy is a concern to an AMT receiver.
Figure 4. LTE OoB Emissions extending into the Federal band
Where possible, actual deployable telemetry transmitters and receivers will be used for the test in
a laboratory setting. The proposed test method allows a high degree of control over the RF
conditions at the AMT receiver (AMT Rx). The test setup proposes the playback of captured,
LTE uplink waveforms from a full stack implemented COTS system (including aggregate
behavior from an LTE cell (or to be determined cells)). If the LTE waveform is generated in real-
time from a UE, a separate path between the eNB and the UE will be necessary to establish
connectivity between the two elements of the LTE system. In general, due to the complexity of

7
LTE signaling, a surrogate LTE waveform created from the capture of actual LTE behavior may
be desirable for repeatability and uncertainty analysis. The selection of LTE waveforms will be
influenced by laboratory generated waveforms along with in-situ measurements of LTE
emissions using AMT antenna and signal conditioning architectures or equivalent.
Commercial and federal test ranges that support AMT missions have fixed and transportable
receive assets with high-gain parabolic dishes, with typical dimensions of 4’, 6’, 8’, 10’, 15’, and
30’ in diameter. An estimate of the antenna gains is found using the following equation.
𝐺 = 10log10 [𝜂 (𝜋𝐷
𝜆)
2
],
where 𝐺= antenna gain over an isotropic source, 𝜂 = antenna efficiency, 𝐷 = diameter of the
parabolic reflector in meters, and 𝜆 = wavelength of the signal in meters. Thus, for antenna
efficiencies between 35% to 55%, with frequencies between 1750 MHz to 1850 MHz, the gain
will range from approximately 9 dB to 20 dB. These gain figures need to be budgeted for in the
test bed.
Figure 5. Test scenario concept
Figure 5 depicts the test scenario in more detail. All factors are treated as random variables and
are defined as:
PT = telemetry transmitter equivalent isotropic radiated power (EIRP), in dBm
PLAMT, PLUE, PLN = path loss values, in dB
dAMT, dUE = distances, in km
PR, PR,UE = telemetry ground station equivalent isotropic incident power (EIIP), in dBm
As mentioned in Section 2.3.2 in more detail; LTE UE powers do not add coherently. The LTE
scheduling algorithm that dictates the uplink signal structures from a UE to the eNB governs the
resource grants given to the UE. This impacts the resource block allocation, in time and
frequency given to individual UEs in a given cell. In addition, the LTE assessed UE signal path

8
to the eNB also impacts transmit power of the UE. In the simplest case, a UE near the eNB cell
edge may radiate at higher power levels per resource block as compared to a UE in close
proximity to an eNB. UEs far away from each other are emitting energy differing by many
orders of magnitude. As distance increases, the change in power between neighboring UEs
decreases accordingly. Therefore, this test campaign will attempt to develop waveforms to
include multiple transmitting UEs with different UE to eNB signal condition profiles.
Figure 6. Delta path loss for two 100 meter-spaced UE
As an example of how power differs at a receiver, Figure 6 shows the delta path loss between
two pairs of UEs that are spaced 100 meters apart. Using Friis equation: 𝑃𝐿(𝑑𝐵) =
(𝑃𝑡𝑥 + 𝐺𝑡𝑥)𝐸𝐼𝑅𝑃 + 𝐺𝑟𝑥 + 20𝑙𝑜𝑔10 (𝜆
4𝜋𝑑𝑁), and using d1, d2, d3, and d4 for dN. From this
equation, UE2 is 6 dB lower in power at the telemetry receiver than UE1, and UE4 is 0.2 dB
lower in power than UE3 at the telemetry receiver. Since a telemetry receiver uses a high gain
dish, distant UEs can offer significant powers at a distance.
2.2. Key Performance Indicators (KPIs)
AMT systems include several response
variables, the most important of which will be
labeled as KPIs.
These KPIs define if the AMT systems are
meeting their designed operation objectives. For
this test, a subset of all AMT KPIs is evaluated
as response variables to indicate if LTE
emissions are impacting AMT operations. An
initial list of KPIs evaluated as response
variables for this test are:
➢ Bit synchronization
➢ BER distributions (from AMT receiver)
➢ Received signal strength indicator (RSSI)
Figure 7. Response versus KPIs
Response Variables
KPIs Control Variables

9
Other AMT operating conditions also are included in the test considerations (control variables),
an example of test considerations for this test is:
➢ Test AMT at a variety of AMT (signal strengths and modulation types), and variety of
LTE conditions to arrive at various combinations of C/I. Additive testing with additional
sources of noise to arrive at CINR.
2.3. Devices Under Test (DUTs)
2.3.1. Test Signals
An AMT link can be more susceptible to different types of interferers. The first testing phase is
exploratory to determine which type of interference AMT is sensitive. The first phase of testing
involves injecting synthesized test signals from a vector signal generator to investigate an AMT
link’s sensitivity to different types of interference. A test matrix for this portion will evolve
through testing and will be included in the final report. Signals used for this activity will include
(i) broadband white gaussian noise, (ii) narrow band white gaussian noise (180 kHz to mimic an
LTE resource block), and a (iii) hopping resource block bandwidths. Each of these signal types
will be applied to the AMT link at varying power levels. These waveforms will be first centered
at the LTE uplink frequency allocation, however may be swept across the frequency band of
interest to glean additional insights into AMT receiver susceptibility. The broadband noise
represents an LTE network received from far away; the hopping 180 kHz mimics LTE UE
equipment that is near an AMT receiver. For example, if the output of this exploratory phase
demonstrates that AMT is much more sensitive to one type of interferer, it will focus the study
on LTE waveforms that resemble those type of interferers. The goal of this phase is to narrow
down the types of LTE signals and their characteristics investigated in the next steps.
2.3.2. LTE Waveforms
LTE energy enters an AMT receiving system (also known as ground station) in the AMT band
(as an LTE OoB emission) and out of the AMT band (as an in-band LTE emission). LTE
emissions are dynamic in power, frequency, and time dimensions. The fundamental unit of
measure describing LTE emissions is the resource block. This resources block is 1 millisecond in
time and 180 kilohertz (kHz) wide in frequency. The resource block is made up of twelve 15 kHz
orthogonal frequency division multiplexing (OFDM) resource elements. The J-block of band 66
is 10 MHz wide, spanning from 1770 – 1780 MHz, and contains fifty resource blocks and two
500 kHz guard bands on each side. An LTE network (controlled by the eNB) is constantly
distributing resource blocks to the UEs that have data to send. A UE may be attached to an eNB
and have no data to transmit for the majority of a day. To better understand LTE emissions in the
context of interference to receivers, there are many test efforts across federal and non-federal
stakeholders quantifying the emissive behavior of UEs in the aggregate7.
7 Such as three projects sponsored by the National Spectrum Consortium(NSC), NSC-16-0401, NSC-16-0402, NSC-
16-0403. Listed on the NSC website: https://www.nationalspectrumconsortium.org/project-awards/

10
UEs operating in an LTE network may fill the entire 10 MHz band or only a small portion (i.e.,
use a limited number of resource blocks). LTE emission characteristics need to be treated as a
statistical distribution as those emissions are defined by LTE scheduling algorithms that dictate
the frequency and temporal components. If enough UEs are summed together, the behavior is
typically considered to approach white gaussian noise (WGN). From the perspective of a ground-
based receiver, those aggregate conditions may not be met, for example, if a single UE is in close
physical proximity to the AMT receiver. In this scenario, LTE uplink emissions could be
dominated by the closest UE and the background UEs are many orders of magnitude lower in
power. This phenomenon can be observed in LTE spectrum monitoring efforts such as an NTIA
Institute for Telecommunication Sciences (ITS) interim report [13].
In a previous test NASCTN performed sponsored by Edwards AFB, the OOB emissions of
handsets and eNBs were collected [1]. The shape and expected roll-off of UEs was captured with
a dynamic range of more than 100 dB, shown in Figure 8.
Figure 8. OoB of UEs from NIST TN-1980
This test was informative to the question of how much energy would be in the 1780 – 1850 MHz
federal band but does not reveal the temporal or spurious components that may be a dominant
interference mechanism to an AMT receiving system. Therefore, for this test, a time series of a
UE, and multiple UEs will be used as an injected signal, or “interfering signal”.
The LTE UE emissions used for this test will include tests injecting a variety of LTE UE
emissions that emulate operational LTE scenarios. Emphasis on which UE scenarios will be
informed by the pretest activities and measurements of UEs from lab and field. An LTE cell
commanded by the eNodeB coordinates user traffic by sharing resource blocks resulting in only
a few UEs emitting at the same time per cell. The number of simultaneous UEs emitting in a cell
is currently being measured by the ongoing NASCTN test titled Aggregate LTE: Characterizing
User Equipment Emissions [14]. Comparing the emissions of actual UEs in laboratory and in-situ
field measurements will inform the NASCTN test execution team which signals to use for the
LTE portion of the test bed.

11
2.3.3. AMT
This test plan is focused on AMT equipment that operates in the upper L-Band, specifically 1780
– 1850 MHz. DoD telemetry operations are in the process of transitioning out of the AWS-3
band and upgrading hardware to coexist with LTE uplink emissions in the adjacent 1755 – 1780
MHz. AMT equipment has many variations in deployment locations (including transportable)
and hardware. The test execution phase will be performed with AMT equipment agreed upon by
the greater telemetry community as representative hardware. When possible, actual telemetry
equipment will be used and KPIs extracted from its log files. The design of experiment is written
to allow for two variations of telemetry hardware. Some factors the telemetry will be tested over
include configurations such as modulation types (SOQPSK, SOQPSK-LDPC, and ARTM CPM).
2.4. Measurement Equipment
The list of equipment needed for the test shown in Table 1. Categories of the equipment includes
items used to 1) create the RF test environment and waveforms, 2) collect data, 3) calibrate and
verify the test setup, and 4) devices under test.
Table 1. List of Test Equipment
Equipment Use
LTE Network Commercial eNB for UE emission collection.
LTE Protocol Analyzer Monitoring and collecting LTE network statistics
CMW500 Traffic Generator LTE waveform generation
AMT Transmitter/Receivers Serves as device under test (DUT) – example equipment
is the receiver and receiver analyzer from Quasonix
Equipment will be able to report AMT KPI that can be
logged for further statistical analysis
Vector Signal Generator (VSG) Generation of synthesized test waveforms and playback
of LTE captures
Vector Network Analyzer (VNA) Calibration and verification
Bit Error Rate (BER) Counter Tracking BER of the AMT link
Spectrum Analyzer Monitoring spectrum activity in the test bed
Power Meter Calibration and verification
Vector Signal Analyzer (VSA) Monitoring signal levels, and error vector magnitude
RF Combiner Test bed
RF Programmable Attenuators Test bed
RF Cables Test bed
Data Storage Test bed, telemetry data logging devices
Universal Serial Bus
(USB)/Ethernet Hubs
Test bed
2.5. Measurement Setup
The proposed test method uses conducted connections between all elements of the test setup.
Figure 9 is a high-level description of the connection paths between the LTE waveform

12
generation and the AMT signal chain (e.g., the AMT Transmitter (Tx) to AMT Rx). In this setup,
it is assumed that any handshaking between the AMT Tx and AMT Rx are handled by a separate
path not subject to the impacts of the LTE waveform. Handshaking is not used in serial
streaming telemetry. Figure 9 assumes the playback of a captured, surrogate LTE waveform. If
the LTE waveform is generated in real-time from a UE, a separate path between the eNB and the
UE will be necessary to establish connectivity between the two elements of the LTE system. The
setup assumes that the LTE UE signal is not impacted by the AMT Tx to an extent that changes
the UE waveform during transmission.
Figure 9 includes the ability to add white Gaussian noise into the signal chain if needed to raise
the noise power over the inherent noise floor of the signal chain. This will allow a measure of
signal-to-noise ratio (SNR) independent of the receiver. In this setup, the noise level is kept fixed
once the level is set. Varying the AMT Tx and LTE waveforms will allow stepping through the
desired carrier-to-noise-plus-interference (CNIR) ranges. The goal is to subject every receiver
under test to the same CNR and CNIR conditions.
The AMT Rx should be placed into a shielded enclosure to avoid connection to the AMT Tx via
a leakage path. This will also reduce the potential of other spurious RF signals from impacting
the AMT Rx during the test.
Figure 9. Basic RF elements and connections of the test setup.
A control architecture necessary for automation, synchronization, and data collection overlays
the RF layout. Figure 10 illustrates connectivity to the various RF elements, including the
programmable RF attenuators and the waveform generators. The connections may be a
combination of interfaces, such as Ethernet, USB, and RS232. In this diagram, the
computer/controller is shown as directly interfacing to the AMT Rx (the AMT Rx interface is

13
grayed out). If additional hardware is used to interface with the AMT Rx, the
computer/controller will connect to that hardware.
Figure 10. Instrument control and data collection connectivity for the test setup
Data parsing, processing and analysis is performed in an ex post fashion.
2.6. Measurement Procedures
The basic measurement procedure is to establish a connection between the AMT Tx (or
surrogate) and the AMT Rx via the RF connection path shown in Figure 9. The AMT connection
is initially established without LTE activity present to collect baseline KPI data. The amount of
data collected (and time duration) will depend on statistical test design criteria discussed in
Section 3.
With the AMT link established, an LTE surrogate waveform will be injected into the AMT RF
channel via the RF combiner shown in Figure 9. The RF attenuation of the LTE waveform in the
test setup will be fixed for a given test point so that any variations in the LTE waveform are due
to the utilization of resource blocks and data encoding inherent to actual LTE system behavior.
The testing will cover a combination of AMT link signal strength) and LTE activity levels. A test
matrix will be developed that captures the distinguishing elements of the AMT communications
(e.g. path loss, modulation coding) and the LTE waveforms (e.g. power levels, operating
conditions).

14
2.7. Calibration and Verification Procedure
The test setup shown in Figure 9 for studying the impacts of LTE on AMT receiver performance
enables the collection of laboratory measurement data. To more fully understand the quality and
limitations of the testbed data, calibrations on instrumentation and verification checks are
necessary. For example, if the LTE signal needs to step by 3 dB increments, the verification and
calibration process should demonstrate that the incremental changes correspond to 3 dB changes
in power and provide the associated uncertainty with that value. This section outlines calibration
and verification considerations to ensure the quality of the result data.
In some cases, the calibration can be completed by using an independent instrument such as a
power meter, VSA, or VNA. Other verification checks on data in the communications stack
layers above the physical layer (RF conditions) require examination of data sets for baseline
performance. For example, a check on AMT system’s nominal state requires examination of the
statistical distribution of KPIs without LTE activity present. The baseline performance state
under nominal conditions gives a starting point to understand system response to test variables. It
is of note that this baseline response assessment is conducted with the test-setup in place as
compared to an ideal signal path. This insures that the nominal/baseline condition includes
inherent variability in the KPIs due to the test architecture. The list below contains items
identified for the proposed test setup; others may also exist depending on the actual
implementation.
1) Measurement equipment
a) Verify all measurement equipment (e.g., spectrum analyzers, power meters, VNAs, etc.)
manufacturer calibrations are up-to-date
2) Radio Frequency
a) Reported power
i) Check reported power values against a power meter or VSA
b) Variable attenuators
i) Verify attenuator performance across the frequency bands and dB setting range
c) RF cables and RF connections
i) Check losses, and if possible, phase behavior (e.g., through a VNA measurement), at
frequency band of interest
d) RF amplifiers
i) Verify the performance of the amplifier at the level of operation (linearity)
3) Radio Frequency Shielding
a) Verify that the receiver is not connecting to the AMT Tx via a leakage path
4) Output from potential interference source (e.g., LTE waveform generation)
a) Waveform
i) Verify total power
ii) If surrogate waveform, verify it fits the allowable spectral mask
(1) Verify structure – not just total power
(2) Demodulate with an intended receiver or signal analyzer if possible to ensure the
waveform transmitter integrity

15
b) Verify RF isolation paths
i) to ensure the AMT waveform does not impact the LTE waveform generator
ii) Sources of noise are appropriately accounted for
5) White Gaussian noise source (optional)
a) Waveform
i) Ensure bandwidth covers in-band and adjacent band signals
ii) Ensure sufficient pseudo-random signal length is sufficient
iii) measure the power at the receiver both with and without the noise source (without the
AMT or LTE signals transmitting)
6) Data
a) Data
i) Determine stable collection and extraction cycle
ii) Storage requirements on/off devices
b) Timing
i) Time synchronization in data sets
ii) Determine resolution differences between devices
c) Stability of KPIs/response variables
i) Variability in baseline configurations
(1) Collect data to provide statistics of baseline conditions, e.g., only one system
operating – either AMT or LTE
d) Sensitivity of KPIs to test variables
e) Reaction time of KPIs to test variables
Documentation for calibration and verification checks in the final report should include the
process and method, as well as figures and/or data which indicate the state of the setup. In the
final report, tables should list the Type A or B uncertainty values associated with the
elements of the setup. Uncertainty values are typically obtained from a variety of sources,
including measurements in the lab, manufacturer’s data sheets, and expert input. Table 2 is
an example of the collection of uncertainty values from the calibration and verification
process.
Table 2. Example of uncertainty values collected during the calibration and verification process.
Classification Factor Probability Distribution Evaluation Type Uncertainty (dB)
Instrumentation
LTE waveform power
Normal B 0.4
Test setup Calibration of setup
Normal B 0.5
Amplifier drift
Normal A 0.1

16
2.8. Measurement Location(s)
Location to execute the test methods will be influenced by the selection of the Technical Lead
and what location can be quickly, and cost effectively, scheduled to support the testing schedule.
Potential test locations being investigated include:
➢ Recording of radiated emissions of COTS LTE AWS-3 hardware:
o NIST Broadband Interoperability Testbed (Boulder Labs, Boulder CO)
o NASCTN lab (Boulder)
o MITRE (Bedford, MA/McLean, VA)
o Applied Physics Laboratory at Johns Hopkins University (Laurel, MD)
o NTS (commercial facility in Longmont)
➢ Capture of LTE AWS-1 emissions and statistical analysis of spectrum congestion:
o Telemetry Range Sites (Edwards AFB, CA)
o NASA Langley Research Center, LRAS facility (Hampton VA)

17
3. Statistical Test Design
3.1. Overview
The basic test design methodology is explained in Appendix A. A test design based on design of
experiment methodologies will be performed in a controlled laboratory environment. The test
team evaluated a series of experiment design types such as full and fractional factorials, space
filling, and D-Optimal split-plot designs using standard design evaluation criterion such as the
distribution of test points across the test space, statistical power and confidence, optimality
criteria, variance of the prediction coefficients, pairwise comparison between the factor effects,
and the prediction variance vs. fraction of design space. Based on that evaluation of the
candidate test designs, the team has selected a design that is referred to as a “Split-split-Plot
Design.” Details about this design are provided in the sections below.
3.2. Problem Scope and Test Objectives
As stated in Section 1.3, the scope of this project is to develop a calibrated, reproducible
laboratory test methodology that will capture data on the behavior of AMT Rx KPIs in the
presence of various power levels of adjacent band LTE activity, with calculated uncertainties.
The breadth, depth, and represented conditions in the data sets shall support statistical analysis
that translates laboratory results to AMT interference protection criteria and future design
considerations.
Specifically, the objective of this test is to quantify the effects of various AWS-3 LTE UE
emissions on an AMT receiver as a function of the factors (i.e., control variables) listed in Table
3, In other words, the analysis should establish the relationship between all factors listed in Table
3 and the KPIs, also referred to as response variables in design of experiments methodologies, a
selection of which are listed in Section 2.2.

18
3.3. Response Variables
Section 2.2 provides a down-selected list of the KPIs that are tracked and evaluated throughout
the test.
3.4. Control Variable Considerations:
➢ With respect to bit synch, BER measurement implies that bit synch has occurred
➢ Recording AMT receiver signal levels
➢ Recording with and without a receiver equalizer for Shaped Offset Quadrature Phase
Shift Keying (SOQPSK) is very important
➢ Space-time coding improvements
➢ RSSI data
3.5. Plan for Testing
The goals of the test campaign are to
i) Determine the impact of LTE on AMT systems using a combination of sensitivity and
susceptibility analysis. Test AMT sensitivity using synthesized waveforms in varied
time, frequency, and power conditions and introduce a set of LTE energy recordings
and then perform AMT susceptibility testing using captured LTE waveforms.
ii) Capture LTE waveforms in a laboratory setting (such as within an anechoic chamber)
using consumer off-the-shelf (COTS) hardware in operational scenarios learned from
part i). These captures (recordings) LTE will be used as surrogate waveforms for
testing.
iii) Describe methods and help perform an observational study of in situ captures (using
AMT receiver plus vector signal transceiver) to collect AWS-1 emissions. These
collections will be of distant AWS-1 LTE energy and can be used as surrogate
waveforms for testing and to inform AWS-3 LTE waveform selection.
Part i) is two parts, information-gathering exploratory and final LTE susceptibility to AMT
measuring how a variety of signal structures affect AMT. In other words, this phase will address
questions like: if -55 dBm (for instance) of white gaussian noise does measurable harm to an
AMT link, how does that -55 dBm differ if the WGN energy is narrow band or frequency-
hopping?
This phase will be performed in a laboratory setting using equipment connected over coaxial
cables and splitters, such as in Figure 9, substituting the LTE box with a arbitrary waveform
generator equipped vector signal generator. The exploratory portion injects synthesized
waveforms produced from a signal generator mimicking classes of waveforms that LTE can
resemble. The exploratory work will determine the AMT link’s sensitivity to waveform types or
classes. The same test bed will be used for injecting LTE captured waveforms to test effects on
the AMT link. The LTE testing will determine an AMT link’s susceptibility to LTE.

19
Part ii) will be a collection of LTE energy focusing on what is learned from the exploratory
findings. Placing a small set of LTE UEs in a large anechoic chamber, attaching UEs to an eNB,
sending realistic traffic, and collecting UE emissions with a VST. These captures can be injected
into the AMT test set, portrayed in Figure 9, as an interfering source. These captures can be done
in the intended AWS-3 band.
Part iii) is for both information-gathering and to serve as informing another set of interference
waveforms to inject into the test set. These waveforms will be collected at the AWS-1 band
using AMT architecture through its intended high-gain antenna. The waveforms collected will be
in-situ and offer differing characteristics based on measurement location such as a littoral
environment in close proximity to an urban environment to a desert environment with
considerable distance (20 to 40 km) to a populated area. It is expected that distant LTE traffic
will be more noise like in signal structure, whereas nearby LTE traffic may be more structured.
3.5.1. Near LTE Condition
From previous NASCTN testing, it was observed that a single (or “sufficiently small set”) UE
emits a more temporal signal with a low duty cycle. From the perspective of an AMT receiver, a
temporal condition would mimic an operational scenario of a near UE (or small set of UEs).
Pulsing a small set of resource blocks at a level expected from a UE near an AMT receiver is
covered in this test phase.
3.5.2. Far LTE Condition
Also covered in the discovery phase is simulating several UEs at a farther setting. In the “far”
scenario of LTE conditions, such as when a telemetry receiver points its antenna towards a
population center that includes many UEs attached to many uncoordinated eNBs, the signal is
expected to appear more noise-like.

20
3.6. Final Test Space Coverage (subject to change)
Table 3. Test Space Coverage
Factor Factor Definition Units Type No.
Levels
Notional Levels Change
Type
A AMT Receiver
Filter
n/a Categorical 2 Legacy, Upgrade VHTC
B Receiver Asset
Type
n/a Categorical 2 Fixed, Portable HTC
C AMT Modulation n/a Categorical 3 SOQPSK, ARTM
CPM, SOQPSK-
LDPC
ETC
D Permissible CNIR
levels for a given
AMT
performance
dB Continuous 2 1-10 ETC
E Distance (path
loss) between
transmitter and
telemetry
receivers
Km Continuous 2 0.05-320 ETC
F Neighboring (J-
Block) LTE
waveform
n/a Categorical 4 None, W1, W2, W3 ETC
Table 3 provides a list of the controlled factors, or input variables, that could potentially
influence the KPIs. Controlled factors are systematically varied throughout the test to understand
their effects have on the KPIs, or response variables. The systematic combination of controlled
factors serves as the basis for generating the test run matrix. Our controlled factors are of two
types: continuous and categorical. Continuous factors are numeric independent variables that
have an infinite number of values between any two points. Categorical factors contain a finite
number of categories or groups, such as the factor levels themselves. Factor levels are the
different values that a factor can take. Change Type refers to how easily the factor levels can be
changed: easy-to-change (ETC), hard-to-change (HTC), or very-hard-to-change (VHTC) factors.
The factors and their associated levels were selected by a group of subject matter experts and test
designers.

21
3.7. Final AMT Testing Strategy
The initial test design structure consists of a split-split-plot design with one whole-plot (VHTC)
factor and one sub-plot (HTC) factor. There are sixteen sub-plots (referred to as “Flights”) with
11 runs per sub-plot. The sixteen whole plots provide adequate replication to obtain a reasonable
estimate of the whole-plot factor variance. A sample complete run matrix is illustrated in the
Table 5, in 6.Appendix B.
3.8. Statistical Data Analysis and Evaluation Plan
The main objectives of the analysis are: (1) to determine which of the factors listed in Table 3,
influence the responses listed in Section 2.2; (2) to establish a relationship (i.e. and empirical
low-order Taylor Series approximation) between the response variables and factors. The core of
the statistical data analysis involves the use of techniques such as descriptive statistics, analysis
of variance, analysis of covariance, and restricted maximum likelihood for regression.

22
4. Test Support
4.1. Coordination and Outreach
A NASCTN test brings science, outreach, and information handling components to its tests. The
coordination and outreach plan for this test began during the test plan drafting stages. To expand
the reach for community comment solicitation, this test plan were posted on the NASCTN
website (https://www.nist.gov/communications-technology-laboratory-ctl/nasctn/projects/) and
emailed to known stakeholders and interested organizations. Further distribution to their
membership is encouraged. Comments were requested via a form and subsequently adjudicated.
The comment period lasted for almost three weeks. After the comments were adjudicated the
draft was updated. A workshop will be scheduled to discuss the updated test plan with the
sponsor and affected community before test execution begins.
The NASCTN test team is interested in tracking AMT KPIs in the presence of unintended
signals. These KPIs may be controlled information that an organization may not wish to share
outside of NASCTN. In the case of working with controlled information, NASCTN is prepared
to protect information by drafting contracts such as non-disclosure agreements (NDAs) or
cooperative research and development agreements (CRADAs). Contact the NASCTN Program
Manager, Dr. Melissa Midzor ([email protected], 303.497.3591) to discuss
implementing agreements.
To maintain impartiality and scientific quality standards, NASCTN will oversee and manage the
test execution and data analysis to obtain the highest degree of trust amongst all stakeholders.
The final test report will be peer reviewed and published as a NASCTN Report. The report will
be provided to the sponsor of the test upon completion of the Editorial Review Board process.
NASCTN will also provide an out-brief, describing test execution and results made at a time
agreeable to the sponsor and key stakeholders.
4.2. Data Management
The following measures will be taken to manage data.
• Measurement data will be recorded on local media storage at the test location and will be
physically removed by NASCTN personnel at the end of the measurement period.
• There are no classified or proprietary data handling concerns identified at this time.
• Measurement data will be released as an open publication to the general public after review.
4.3. Safety
Safety considerations both specific to the test location and equipment shall be reviewed and
discussed with the test team by the project and technical leaders. Team members will need to
demonstrate they have completed all safety training necessary to carry out the testing in the
laboratory or other designated location.

23
4.4. Project Tasks
The following are the major tasks of the project.
Develop and Write Test Plan
External Outreach and Test Plan Review
Collect and Adjudicate Comments
Feedback Review Information to Test Plan
Conduct AMT KPI Response & KPI sensitivity Testing (Objective 1a)
Conduct waveform captures of LTE Waveforms from COTS hardware in anechoic
environment
Curate catalog of LTE Waveforms (Objective 2)
Perform in-situ LTE measurements at potential sights as identified on page 16 (Objective
3)
Test Preparation / prepare synthesized test waveforms
Automated conducted test setup and Baseline Tests
Conduct AMT Susceptibility Testing (Objective 1b) to LTE waveforms
Data Analysis and Report
Describe in-situ data collection procedure / collect in-site waveform distributions at
telemetry site
NASCTN Data and Report Review Process (including Director)
Issue Report

24
5. References
[1] “Measured Emission Spectra of Selected AWS-3 LTE Transmitters”, NIST Technical
Note 1980, retrieved from
https://nvlpubs.nist.gov/nistpubs/TechnicalNotes/NIST.TN.1980.pdf
[2] “Presidential Memorandum: Unleashing the wireless broadband revolution”, June 18,
2010, accessible at https://www.gpo.gov/fdsys/pkg/CFR-2011-title3-vol1/pdf/CFR-2011-
title3-vol1-other-id236.pdf.
[3] “An assessment of the near-term viability of accommodating wireless broadband systems
in the 1675-1710 MHz, 1755-1780 MHz, 3500-3650 MHz, and 4200-4220 MHz, 4380-
4400 MHz bands”, (NTIA, October, 2010), accessible at
https://www.ntia.doc.gov/files/ntia/publications/fasttrackevaluation_11152010.pdf.
[4] “Amendment of the commission’s rules with regard to commercial operations in the 1695-
1710 MHz, 1755-1780 MHz, and 2155-2180 MHz Bands” FCC Report and Order, FCC
14-31, March 31, 2014, accessible at
https://transition.fcc.gov/Daily_Releases/Daily_Business/2014/db0401/FCC-14-31A1.pdf.
[5] FCC Auction 97, “Advanced wireless services (AWS-3)”, accessible at
http://wireless.fcc.gov/auctions/default.htm?job=auction_summary&id=97
[6] 3GPP TR 36.101 “Evolved Universal Terrestrial Radio Access (E-UTRA); User
Equipment (UE) radio transmission and reception;” retrieved from
https://portal.3gpp.org/desktopmodules/Specifications/SpecificationDetails.aspx?specifica
tionId=2411
[7] 3GPP 34.121 “Terminal conformance specification, Radio transmission and reception
(FDD);” retrieved from https://portal.3gpp.org/desktopmodules/Specifications/
SpecificationDetails.aspx?specificationId=2362
[8] 3GPP TR 36.141 “Evolved Universal Terrestrial Radio Access (E-UTRA); Base Station
(BS) conformance testing;” retrieved from https://portal.3gpp.org/desktopmodules/
Specifications/SpecificationDetails.aspx?specificationId=2421
[9] IRIG STANDARD 106-17 “Telemetry Standards”, Telemetry Group, Range
Commander’s Council, retrieved from http://irig106.org/docs/106-17/106-
17_Telemetry_Standards.pdf
[10] ITU-R M.1459 “Protection criteria for telemetry systems in the aeronautical mobile
service and mitigation techniques to facilitate sharing with geostationary broadcasting-
satellite and mobile-satellite services in the frequency bands 1 452-1 1525 MHz and 2
310-2 360 MHz”, International Telecommunication Union, retrieved from
http://www.itu.int/rec/R-REC-M.1459/en
[11] “LTE Impacts on GPS”, NIST Technical Note 1952, retrieved from
https://nvlpubs.nist.gov/nistpubs/TechnicalNotes/NIST.TN.1952.pdf
[12] “An Initial Look At Adjacent Band Interference Between Aeronautical Mobile Telemetry
And Long-term Evolution Wireless Service”. Kenneth Temple. 4 July 2016. Retrieved
from http://www.dtic.mil/dtic/tr/fulltext/u2/1012630.pdf
[13] “LTE Aggregate Power Measurements from VZW DEN Marshall Cell Site Location”,
Presentation to the Defense Spectrum Office, Eric Nelson [email protected] (303)
497-7410, 13 March 2018
[14] “Aggregate LTE: Characterizing User Equipment Emissions”, Draft Test Plan, Hale et.al
6 September, 2017. Retrieved from

25
https://www.nist.gov/sites/default/files/documents/2017/09/11/aggregate_lte_test_plan_v
14.pdf
[15] “Design and Analysis of Experiments, 9th ed.”, Douglas C. Montgomery. (2017). Wiley &
Sons: New York, NY.
[16] IRIG STANDARD 118 “Test Methods For Telemetry Systems and Subsystems”,
Telemetry Group, Range Commander’s Council. Retrieved from
http://www.irig106.org/docs/rcc/118-12_Volume_2.pdf

26
6. Acronyms
3GPP 3rd Generation Partnership Project
AMT Aeronautical mobile telemetry
AWS-3 3rd group of Advanced Wireless Services bands
BER Bit Error Rate
CINR Carrier to Interference + Noise Ratio
CIO Chief Information Officer
CRADA Cooperative Research and Development Agreement
DL Down Link
DoD Department of Defense
DOE Design of Experiment
DUT Device Under Test
EAFB Edwards Air Force Base
EIIP Equivalent Isotropic Incident Power
EIRP Equivalent Isotropic Radiated Power
eNB evolved UTRAN Node B or Evolved Node B
ETC Easy to Change
EVM Error Vector Magnitude
FCC Federal Communications Commission
FDD Frequency Division Duplex
HTC Hard to Change
IP Internet Protocol
ITS Institute for Telecommunication Sciences
ITU International Telecommunications Union
KPI Key Performance Indicators
LTE Long Term Evolution
NASCTN National Advanced Spectrum and Communications Test Network
NDA Non-Disclosure Agreement
NIST National Institute of Standards and Technology
NOAA National Oceanic and Atmospheric Administration
NSF National Science Foundation
NTIA National Telecommunications and Information Administration
OFDM Orthogonal Frequency Division Multiplexing
OoB Out of Band
RCC Range Commander’s Council
RF Radio Frequency
RSSI Received Signal Strength Indicator
Rx Receiver
SOQPSK Shaped Offset Quadrature Phase Shift Keying
T&E Test and Evaluation
Tx Transmitter
UE User Equipment
UL Up Link
USB Universal Serial Bus

27
UTG UE Traffic Generator
VNA Vector Network Analyzer
VSA Vector Signal Analyzer
VSG Vector Signal Generator
WGN White Gaussian Noise

28
Appendix A – Design of Experiment
In general, the design of experiment (DOE) provides the techniques and methods to deal with the
imperatives in the test plan. DOE is the systematic integration of well-defined and structured
scientific strategies for gathering empirical knowledge about a system or process using statistical
methods for planning, designing, executing, and analyzing an experiment or test. DOE-based test
design is a best practice for test and evaluation (T&E).
As illustrated in Figure 11, DOE seeks to explain how
changes in the setting of controllable factors influence
the response variables, given a process and the natural
variability embedded in the process, controllable factors,
and uncontrollable factors. The system is represented by
the gray box. Typically, the controllable factors are of
interest and may influence the outcome of the experiment
while the uncontrollable factors (also known as nuisance
factors, tend to obscure the outcome of experiments even
though there is no interest in them. Input variables
become factors when they can take two or more
values, called levels. In general, DOE methodologies
allow for: (1) identifying the factors and interactions that influence system performance
(screening); (2) defining empirical models (characterization) that could be useful for decision
making and performance assessment; (3) finding factor settings that maximize or minimize the
responses of interest (optimization); (4) making statistically defensible choices between options
(comparison); and (5) validating system performance (validation). The relationship between the
factors and the response may be partially known or unknown a priori.
DOE-based test designs leverage the amalgamation of rigorous and disciplined scientific
processes and statistics into a foundational framework that helps facilitate an understanding of
the tradeoffs in the risks, cost, and utility of information domains. The framework has been well
established within the DOE community of practice for years and has been published in many
papers and textbooks (such as [15]). That framework is leveraged into a set of desired end states
in the context of the plan-design-execute-analyze paradigm as illustrated in Figure 12. The
attributes of well design tests are listed in Table 4.
Figure 11. Design of Experiment.

29
Figure 12. DOE-based Test Design Framework
Table 4. Attributes of DOE-based Test Design
Phase Target Area Attribute
Planning
Test Objectives Well-defined, end-to-end, mission-oriented objectives within the
scope of the decisions that will be informed
Response
Variables
Testable technical performance and mission-oriented response
variables to inform the evaluations and assessments
Test Space
Coverage
Controllable and uncontrollable factors and conditions mapped to
the technical and operational requirements
Design Test Structure DOE-based test designs that fit the problem, with good properties,
and practical run matrices
Execution Test Strategy Sound test protocols and adequate test strategies consistent with
DOE-generated run matrices
Analysis
Statistical Data
Analysis
Inferential statistics, adequate assessment techniques, and standard
evaluation criteria
Evaluation Valid conclusions and defensible information-quality products to
inform decisions

30
Appendix B – D-Optimal Split-Split-Plot Run Matrix
Table 5. D-Optimal Split-Split-Plot Run Matrix (176-run, 16-flights)
Whole-
Plot Factor
Sub-Plot
Factors
Whole-Plot
Number
Sub-Plot
Number
(Flight No.)
Run
AMT
Receiver
Filter
(Factor A)
Receiver
Type
(Factor B)
AMT
Modulation
(Factor C)
SINR
(Factor D)
Range
(Factor E)
LTE
Waveform
(Factor F)
1 1 1 Upgrade Portable SOQPSK 1 0.05 W2
1 1 2 Upgrade Portable ARTM CPM 1 37.27 None
1 1 3 Upgrade Portable ARTM CPM 10 75.71 W3
1 1 4 Upgrade Portable SOQPSK 10 115.14 None
1 1 5 Upgrade Portable SOQPSK 1 152.04 W1
1 1 6 Upgrade Portable PCMFM 1 160.03 W3
1 1 7 Upgrade Portable SOQPSK 10 187.59 W3
1 1 8 Upgrade Portable ARTM CPM 1 223.41 W2
1 1 9 Upgrade Portable ARTM CPM 10 257.66 W1
1 1 10 Upgrade Portable PCMFM 10 290.17 W1
1 1 11 Upgrade Portable PCMFM 10 320.00 W2
1 2 1 Upgrade Portable SOQPSK 1 0.05 None
1 2 2 Upgrade Portable SOQPSK 10 37.27 W2
1 2 3 Upgrade Portable SOQPSK 10 75.71 W1
1 2 4 Upgrade Portable ARTM CPM 1 115.14 W3
1 2 5 Upgrade Portable PCMFM 1 152.04 W1
1 2 6 Upgrade Portable ARTM CPM 10 160.03 None
1 2 7 Upgrade Portable PCMFM 1 187.59 None
1 2 8 Upgrade Portable SOQPSK 1 223.41 W3
1 2 9 Upgrade Portable ARTM CPM 10 257.66 W1
1 2 10 Upgrade Portable ARTM CPM 1 290.17 W2
1 2 11 Upgrade Portable PCMFM 10 320.00 W3
2 3 1 Legacy Fixed ARTM CPM 1 0.05 W2
2 3 2 Legacy Fixed PCMFM 10 37.27 W1
2 3 3 Legacy Fixed PCMFM 1 75.71 W3
2 3 4 Legacy Fixed SOQPSK 1 115.14 W1
2 3 5 Legacy Fixed ARTM CPM 1 152.04 W3
2 3 6 Legacy Fixed ARTM CPM 1 160.03 None
2 3 7 Legacy Fixed SOQPSK 10 187.59 W3
2 3 8 Legacy Fixed PCMFM 1 223.41 None
2 3 9 Legacy Fixed SOQPSK 10 257.66 W2
2 3 10 Legacy Fixed ARTM CPM 10 290.17 W1
2 3 11 Legacy Fixed SOQPSK 10 320.00 None
2 4 1 Legacy Portable SOQPSK 10 0.05 W1
2 4 2 Legacy Portable ARTM CPM 10 37.27 None
2 4 3 Legacy Portable SOQPSK 10 75.71 None
2 4 4 Legacy Portable PCMFM 10 115.14 W3
2 4 5 Legacy Portable PCMFM 10 152.04 W2
2 4 6 Legacy Portable PCMFM 10 160.03 W1
2 4 7 Legacy Portable PCMFM 1 187.59 None
2 4 8 Legacy Portable ARTM CPM 1 223.41 W3
2 4 9 Legacy Portable ARTM CPM 1 257.66 W2
2 4 10 Legacy Portable SOQPSK 1 290.17 W2
2 4 11 Legacy Portable SOQPSK 1 320.00 W1
Layout

31
Table 5 (Cont.). D-Optimal Split-Split-Plot Run Matrix (176-run, 16-flights)
Whole-
Plot Factor
Sub-Plot
Factors
Whole-Plot
Number
Sub-Plot
Number
(Flight No.)
Run
AMT
Receiver
Filter
(Factor A)
Receiver
Type
(Factor B)
AMT
Modulation
(Factor C)
SINR
(Factor D)
Range
(Factor E)
LTE
Waveform
(Factor F)
3 5 1 Upgrade Portable ARTM CPM 10 0.05 W2
3 5 2 Upgrade Portable SOQPSK 1 37.27 None
3 5 3 Upgrade Portable SOQPSK 10 75.71 W3
3 5 4 Upgrade Portable ARTM CPM 1 115.14 W1
3 5 5 Upgrade Portable PCMFM 10 152.04 W2
3 5 6 Upgrade Portable PCMFM 10 160.03 None
3 5 7 Upgrade Portable SOQPSK 10 187.59 W1
3 5 8 Upgrade Portable ARTM CPM 10 223.41 None
3 5 9 Upgrade Portable SOQPSK 1 257.66 W2
3 5 10 Upgrade Portable PCMFM 1 290.17 W3
3 5 11 Upgrade Portable PCMFM 10 320.00 W1
3 6 1 Upgrade Fixed PCMFM 10 0.05 W2
3 6 2 Upgrade Fixed ARTM CPM 10 37.27 W1
3 6 3 Upgrade Fixed ARTM CPM 1 75.71 W3
3 6 4 Upgrade Fixed SOQPSK 10 115.14 W3
3 6 5 Upgrade Fixed SOQPSK 1 152.04 W2
3 6 6 Upgrade Fixed SOQPSK 10 160.03 None
3 6 7 Upgrade Fixed PCMFM 1 187.59 W1
3 6 8 Upgrade Fixed ARTM CPM 1 223.41 W2
3 6 9 Upgrade Fixed PCMFM 10 257.66 W3
3 6 10 Upgrade Fixed ARTM CPM 10 290.17 None
3 6 11 Upgrade Fixed SOQPSK 1 320.00 None
4 7 1 Legacy Portable ARTM CPM 10 0.05 W3
4 7 2 Legacy Portable PCMFM 1 37.27 W1
4 7 3 Legacy Portable PCMFM 10 75.71 W3
4 7 4 Legacy Portable PCMFM 1 115.14 None
4 7 5 Legacy Portable ARTM CPM 1 152.04 W2
4 7 6 Legacy Portable PCMFM 10 160.03 W2
4 7 7 Legacy Portable SOQPSK 10 187.59 W2
4 7 8 Legacy Portable SOQPSK 1 223.41 W2
4 7 9 Legacy Portable ARTM CPM 10 257.66 None
4 7 10 Legacy Portable SOQPSK 1 290.17 W3
4 7 11 Legacy Portable ARTM CPM 10 320.00 W1
4 8 1 Legacy Portable ARTM CPM 10 0.05 W3
4 8 2 Legacy Portable PCMFM 1 37.27 W2
4 8 3 Legacy Portable ARTM CPM 10 75.71 W2
4 8 4 Legacy Portable PCMFM 10 115.14 W3
4 8 5 Legacy Portable ARTM CPM 10 152.04 W1
4 8 6 Legacy Portable SOQPSK 10 160.03 None
4 8 7 Legacy Portable PCMFM 1 187.59 W3
4 8 8 Legacy Portable SOQPSK 10 223.41 None
4 8 9 Legacy Portable SOQPSK 1 257.66 W3
4 8 10 Legacy Portable PCMFM 1 290.17 W1
4 8 11 Legacy Portable ARTM CPM 1 320.00 None
Layout

32
Whole-
Plot Factor
Sub-Plot
Factors
Whole-Plot
Number
Sub-Plot
Number
(Flight No.)
Run
AMT
Receiver
Filter
(Factor A)
Receiver
Type
(Factor B)
AMT
Modulation
(Factor C)
SINR
(Factor D)
Range
(Factor E)
LTE
Waveform
(Factor F)
5 9 1 Legacy Fixed ARTM CPM 10 0.05 None
5 9 2 Legacy Fixed PCMFM 10 37.27 W2
5 9 3 Legacy Fixed SOQPSK 10 75.71 W1
5 9 4 Legacy Fixed PCMFM 1 115.14 None
5 9 5 Legacy Fixed PCMFM 1 152.04 W1
5 9 6 Legacy Fixed SOQPSK 10 160.03 W2
5 9 7 Legacy Fixed SOQPSK 1 187.59 W3
5 9 8 Legacy Fixed ARTM CPM 1 223.41 W2
5 9 9 Legacy Fixed ARTM CPM 10 257.66 W3
5 9 10 Legacy Fixed PCMFM 10 290.17 W3
5 9 11 Legacy Fixed ARTM CPM 1 320.00 W1
5 10 1 Legacy Fixed ARTM CPM 1 0.05 W3
5 10 2 Legacy Fixed SOQPSK 10 37.27 W3
5 10 3 Legacy Fixed PCMFM 1 75.71 W3
5 10 4 Legacy Fixed SOQPSK 1 115.14 None
5 10 5 Legacy Fixed PCMFM 10 152.04 None
5 10 6 Legacy Fixed SOQPSK 10 160.03 W1
5 10 7 Legacy Fixed ARTM CPM 10 187.59 W1
5 10 8 Legacy Fixed PCMFM 10 223.41 W2
5 10 9 Legacy Fixed ARTM CPM 1 257.66 None
5 10 10 Legacy Fixed SOQPSK 1 290.17 W2
5 10 11 Legacy Fixed PCMFM 1 320.00 W1
6 11 1 Upgrade Fixed PCMFM 1 0.05 W2
6 11 2 Upgrade Fixed SOQPSK 1 37.27 W3
6 11 3 Upgrade Fixed ARTM CPM 10 75.71 W3
6 11 4 Upgrade Fixed ARTM CPM 10 115.14 None
6 11 5 Upgrade Fixed SOQPSK 10 152.04 W2
6 11 6 Upgrade Fixed PCMFM 10 160.03 W1
6 11 7 Upgrade Fixed SOQPSK 10 187.59 W1
6 11 8 Upgrade Fixed PCMFM 10 223.41 W3
6 11 9 Upgrade Fixed SOQPSK 1 257.66 W1
6 11 10 Upgrade Fixed PCMFM 1 290.17 None
6 11 11 Upgrade Fixed ARTM CPM 1 320.00 W2
6 12 1 Upgrade Fixed PCMFM 10 0.05 W3
6 12 2 Upgrade Fixed SOQPSK 10 37.27 None
6 12 3 Upgrade Fixed SOQPSK 10 75.71 W2
6 12 4 Upgrade Fixed SOQPSK 1 115.14 W1
6 12 5 Upgrade Fixed PCMFM 1 152.04 W1
6 12 6 Upgrade Fixed SOQPSK 1 160.03 W3
6 12 7 Upgrade Fixed ARTM CPM 10 187.59 W2
6 12 8 Upgrade Fixed PCMFM 1 223.41 W2
6 12 9 Upgrade Fixed ARTM CPM 10 257.66 W1
6 12 10 Upgrade Fixed ARTM CPM 1 290.17 None
6 12 11 Upgrade Fixed PCMFM 10 320.00 None
Layout
Table 5 (Cont.). D-Optimal Split-Split-Plot Run Matrix (176-run, 16-flights)

33
Table 5 (Cont.). D-Optimal Split-Split-Plot Run Matrix (176-run, 16-flights)
Whole-
Plot Factor
Sub-Plot
Factors
Whole-Plot
Number
Sub-Plot
Number
(Flight No.)
Run
AMT
Receiver
Filter
(Factor A)
Receiver
Type
(Factor B)
AMT
Modulation
(Factor C)
SINR
(Factor D)
Range
(Factor E)
LTE
Waveform
(Factor F)
7 13 1 Legacy Fixed SOQPSK 10 0.05 W3
7 13 2 Legacy Fixed ARTM CPM 1 37.27 W1
7 13 3 Legacy Fixed PCMFM 10 75.71 W1
7 13 4 Legacy Fixed ARTM CPM 10 115.14 None
7 13 5 Legacy Fixed PCMFM 1 152.04 W3
7 13 6 Legacy Fixed PCMFM 1 160.03 W2
7 13 7 Legacy Fixed SOQPSK 1 187.59 None
7 13 8 Legacy Fixed PCMFM 10 223.41 None
7 13 9 Legacy Fixed ARTM CPM 10 257.66 W3
7 13 10 Legacy Fixed SOQPSK 1 290.17 W2
7 13 11 Legacy Fixed ARTM CPM 10 320.00 W2
7 14 1 Legacy Portable ARTM CPM 10 0.05 W2
7 14 2 Legacy Portable PCMFM 10 37.27 W1
7 14 3 Legacy Portable SOQPSK 1 75.71 None
7 14 4 Legacy Portable PCMFM 10 115.14 None
7 14 5 Legacy Portable ARTM CPM 1 152.04 None
7 14 6 Legacy Portable SOQPSK 10 160.03 W3
7 14 7 Legacy Portable PCMFM 1 187.59 W2
7 14 8 Legacy Portable SOQPSK 1 223.41 W1
7 14 9 Legacy Portable ARTM CPM 1 257.66 W3
7 14 10 Legacy Portable SOQPSK 10 290.17 W2
7 14 11 Legacy Portable ARTM CPM 1 320.00 W1
8 15 1 Upgrade Portable SOQPSK 10 0.05 W2
8 15 2 Upgrade Portable SOQPSK 1 37.27 None
8 15 3 Upgrade Portable ARTM CPM 10 75.71 W3
8 15 4 Upgrade Portable SOQPSK 1 115.14 W3
8 15 5 Upgrade Portable SOQPSK 10 152.04 W1
8 15 6 Upgrade Portable PCMFM 10 160.03 None
8 15 7 Upgrade Portable ARTM CPM 1 187.59 None
8 15 8 Upgrade Portable PCMFM 1 223.41 W1
8 15 9 Upgrade Portable PCMFM 1 257.66 W2
8 15 10 Upgrade Portable ARTM CPM 1 290.17 W1
8 15 11 Upgrade Portable ARTM CPM 10 320.00 W2
8 16 1 Upgrade Fixed SOQPSK 10 0.05 W3
8 16 2 Upgrade Fixed SOQPSK 1 37.27 W2
8 16 3 Upgrade Fixed PCMFM 1 75.71 W3
8 16 4 Upgrade Fixed PCMFM 10 115.14 W2
8 16 5 Upgrade Fixed PCMFM 1 152.04 None
8 16 6 Upgrade Fixed SOQPSK 10 160.03 None
8 16 7 Upgrade Fixed ARTM CPM 1 187.59 W3
8 16 8 Upgrade Fixed PCMFM 10 223.41 W1
8 16 9 Upgrade Fixed ARTM CPM 10 257.66 W2
8 16 10 Upgrade Fixed SOQPSK 10 290.17 W1
8 16 11 Upgrade Fixed ARTM CPM 1 320.00 W1
Layout

34
Appendix C – Test Plan Compared to Existing Test Methods
Related test methods exist for telemetry, particularly the Range Commanders Council IRIG 118
Volume 2, Chapter 4.22 TEST: Receiver Adjacent Channel Interference and Chapter 7.5 TEST:
Demodulator Adjacent Channel Interference Test [16]. The methods in [16] connect the
telemetry system in operational mode and monitor BER8. A key consideration is that the BER is
set to 10-5 with injected white Gaussian noise when no interference is present. Then attenuators
are adjusted to maintain that BER value as the interference is introduced.
This test plan proposes an expanded method to (i) include multiple LTE UE emissions across
power levels and traffic types, (ii) track additional telemetry response variables, and (iii) exercise
the telemetry link across more operational and control settings. This expansion on the IRIG 118
method should reveal a sensitivity of the response variables to the presence and variations of
interference. The most sensitive response variables can then be down-selected to KPIs to best
measure the effects of various interference conditions from the adjacent band.
Table 6. comparison of control factors and response variables (subject to change after pre-test activities)
Table 6 summarizes the differences in telemetry link conditions and values recorded. The table
does not show the multiple runs that will be recorded to produce the statistical power needed to
uncover the uncontrolled covariates and quantify the error bars of the measurands. Having more
KPIs to track allows for a test space which creates an "area" of effects shown in Figure 13. An
area of results will give the results a richer understanding of effects and their repercussions.
8 Other response variables are not considered, but may lend more insight in to effects of the LTE energy

35
Figure 13. LTE interference effects across one KPI versus multiple KPIs
The IRIG methods uses pre-biasing the setup to a BER and then add interference in the adjacent
band. The waterfall behavior of the receiver BER is either derived or measured assuming
Gaussian or approximately Gaussian noise. There is no reason to assume that the adjacent band
signal would add to the noise in a Gaussian manner, and thus assume the extrapolated
performance would closely track the waterfall plot based on Gaussian noise. If a test takes 10
hours unattended using automation versus one hour attended without automation, with more
assumptions, and with a higher uncertainty, it is not obvious the latter method is a better
approach. Considering that automation of the test process should be used to capture sufficient
data points for a robust statistical analysis, reduce potential human error, and improve
repeatability, the benefits of saving time are not immediately obvious.

REPORT DOCUMENTATION PAGEForm Approved
OMB No. 0704-0188
The public reporting burden for this collection of information is estimated to average 1 hour per response, including the time for reviewing instructions, searching existing data sources, gathering and maintainingthe data needed, and completing and reviewing the collection of information. Send comments regarding this burden estimate or any other aspect of this collection of information, including suggestions forreducing the burden, to Department of Defense, Washington Headquarters Services, Directorate for Information Operations and Reports (0704-0188), 1215 Jefferson Davis Highway, Suite 1204, Arlington, VA 22202-4302. Respondents should be aware that notwithstanding any other provision of law, no person shall be subject to any penalty for failing to comply with a collection of information if it does not display acurrently valid OMB control number.
PLEASE DO NOT RETURN YOUR FORM TO THE ABOVE ADDRESS.
1. REPORT DATE (DD-MM-YYYY) 2. REPORT TYPE
4. TITLE AND SUBTITLE
6. AUTHOR(S)
8. PERFORMING ORGANIZATION REPORT NUMBER
10. SPONSOR/MONITOR'S ACRONYM(S)
13. SUPPLEMENTARY NOTES
12. DISTRIBUTION/AVAILABILITY STATEMENT
14. ABSTRACT
15. SUBJECT TERMS
Standard Form 298 (Rev. 8-98)Prescribed by ANSI Std. 239-18
ADMINISTRATION/IPSG ELECTRONIC FORM
7. PERFORMING ORGANIZATION NAME(S) AND ADDRESS(ES)
9. SPONSORING/MONITORING AGENCY NAME(S) AND ADDRESS(ES)
3. DATES COVERED (From - To)
5a. CONTRACT NUMBER
5b. GRANT NUMBER
5c. PROGRAM ELEMENT NUMBER
5d. PROJECT NUMBER
5e. TASK NUMBER
5f. WORK UNIT NUMBER
11. SPONSOR/MONITOR'S REPORT NUMBER(S)
16. SECURITY CLASSIFICATION OF:
a. REPORT b. ABSTRACT c. THIS PAGE
17. LIMITATION OF ABSTRACT
18. NUMBER OF PAGES
19a. NAME OF RESPONSIBLE PERSON
19b. TELEPHONE NUMBER (Include area code)