Embed Size (px)
Citation preview
Advanced Plug-in Electric Vehicle Travel and Charging Behavior
Michael Nicholas, Ph.D. Gil Tal, Ph.D.
Thomas Turrentine, Ph.D. (ARB Contract 12-319 – Funding from CARB and CEC)
Advanced Clean Cars Symposium September 27, 2016
1
Overview
• Project Background • Baseline statistics on participating households • Household travel changes over time • Engine starts of plug-in hybrids • Overall motivation to plug in
– Charging behavior of participating households
2
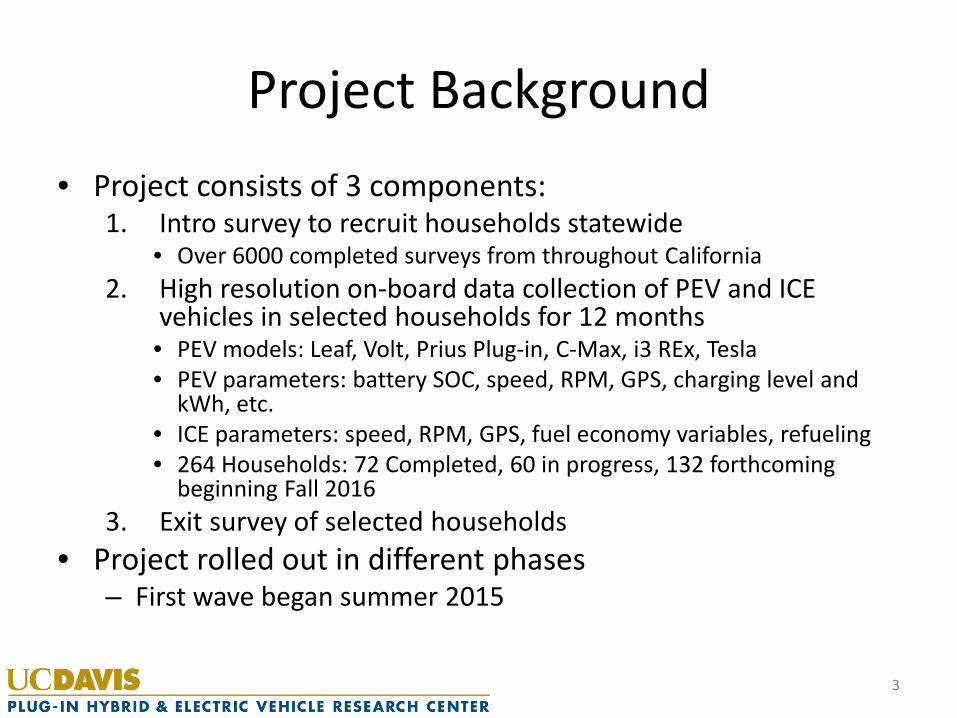
Project Background • Project consists of 3 components:
1. Intro survey to recruit households statewide • Over 6000 completed surveys from throughout California
2. High resolution on-board data collection of PEV and ICE vehicles in selected households for 12 months • PEV models: Leaf, Volt, Prius Plug-in, C-Max, i3 REx, Tesla • PEV parameters: battery SOC, speed, RPM, GPS, charging level and
kWh, etc. • ICE parameters: speed, RPM, GPS, fuel economy variables, refueling • 264 Households: 72 Completed, 60 in progress, 132 forthcoming
beginning Fall 2016 3. Exit survey of selected households
• Project rolled out in different phases – First wave began summer 2015
3
0
2000
4000
6000
8000
10000
12000
14000
16000
18000
20000
0 20 40 60 80 100 120 140
Annu
al e
VMT
EPA Electric Range
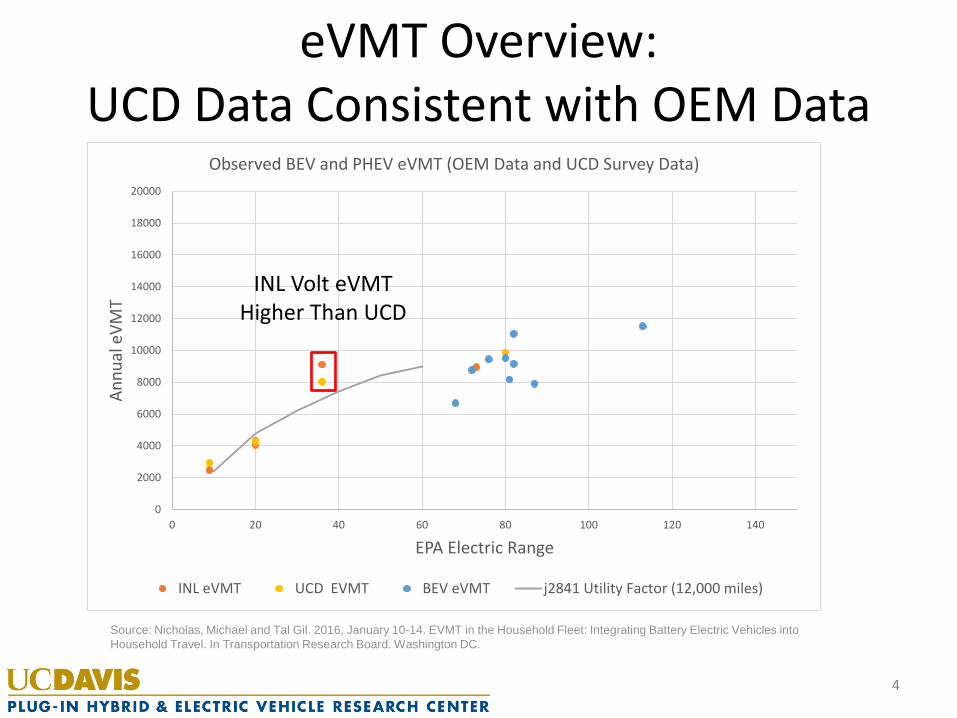
Observed BEV and PHEV eVMT (OEM Data and UCD Survey Data)
INL eVMT UCD EVMT BEV eVMT j2841 Utility Factor (12,000 miles)
eVMT Overview: UCD Data Consistent with OEM Data
Source: Nicholas, Michael and Tal Gil. 2016, January 10-14. EVMT in the Household Fleet: Integrating Battery Electric Vehicles into Household Travel. In Transportation Research Board. Washington DC.
4
INL Volt eVMT Higher Than UCD
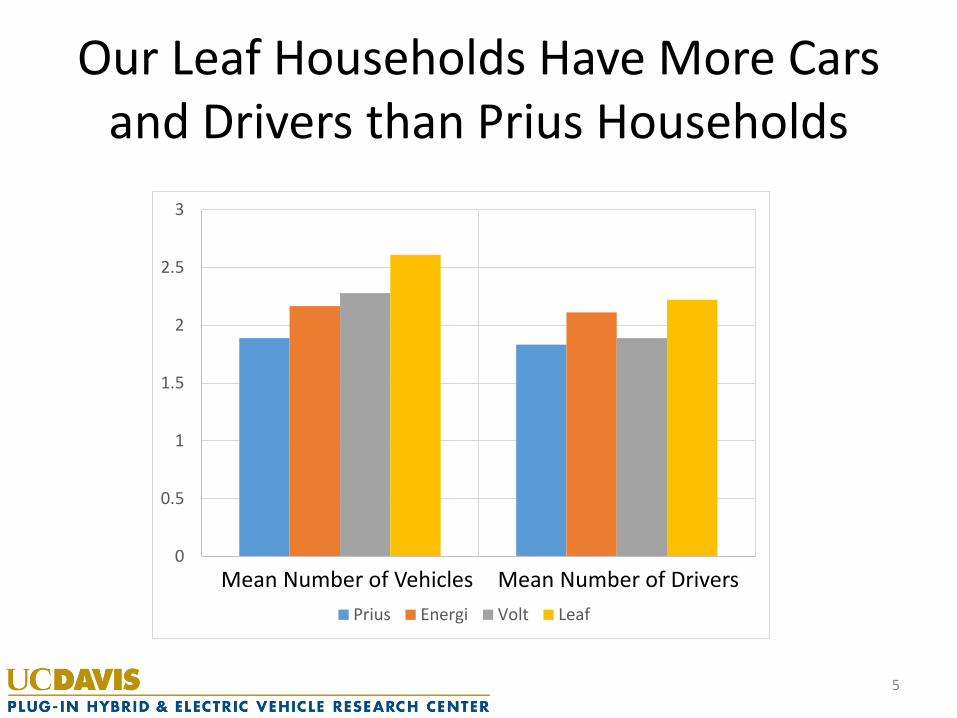
Our Leaf Households Have More Cars and Drivers than Prius Households
5
0
0.5
1
1.5
2
2.5
3
Mean Number of Vehicles Mean Number of Drivers
Prius Energi Volt Leaf
Mean Number of Vehicles Mean Number of Drivers
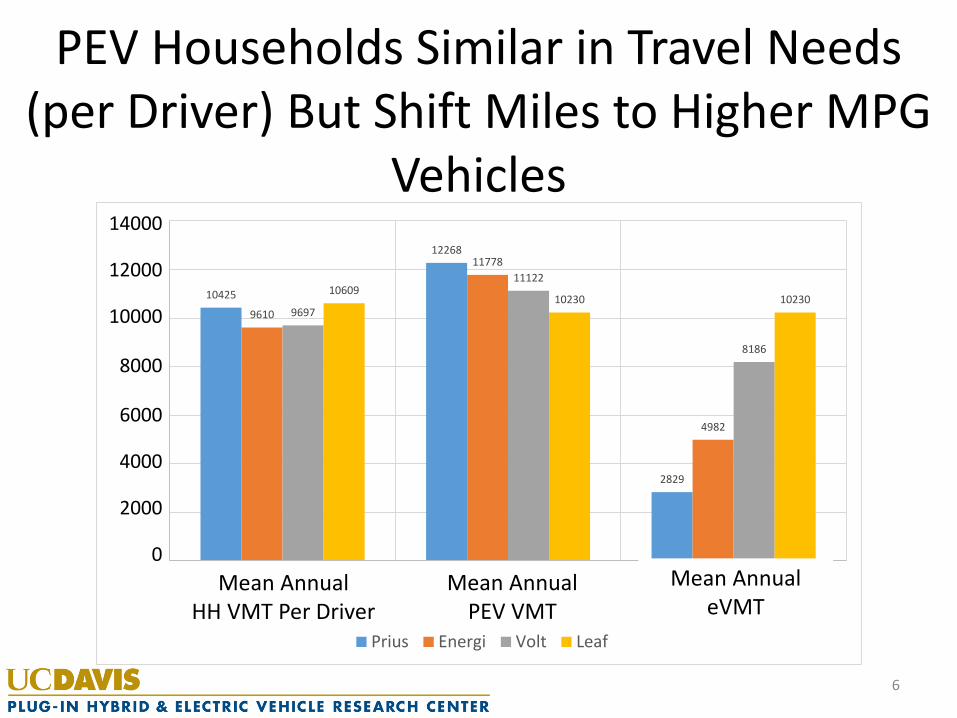
PEV Households Similar in Travel Needs (per Driver) But Shift Miles to Higher MPG
Vehicles
6
10425
12268
2829
9610
11778
4982
9697
11122
8186
1060910230 10230
0
2000
4000
6000
8000
10000
12000
14000
Mean Annual HH VMT PerDriver
Mean Annual PEV VMT Mean Annual eVMT
Prius Energi Volt Leaf
Mean Annual HH VMT Per Driver
Mean Annual PEV VMT
Mean Annual eVMT
14000
12000
10000
8000
6000
4000
2000
0
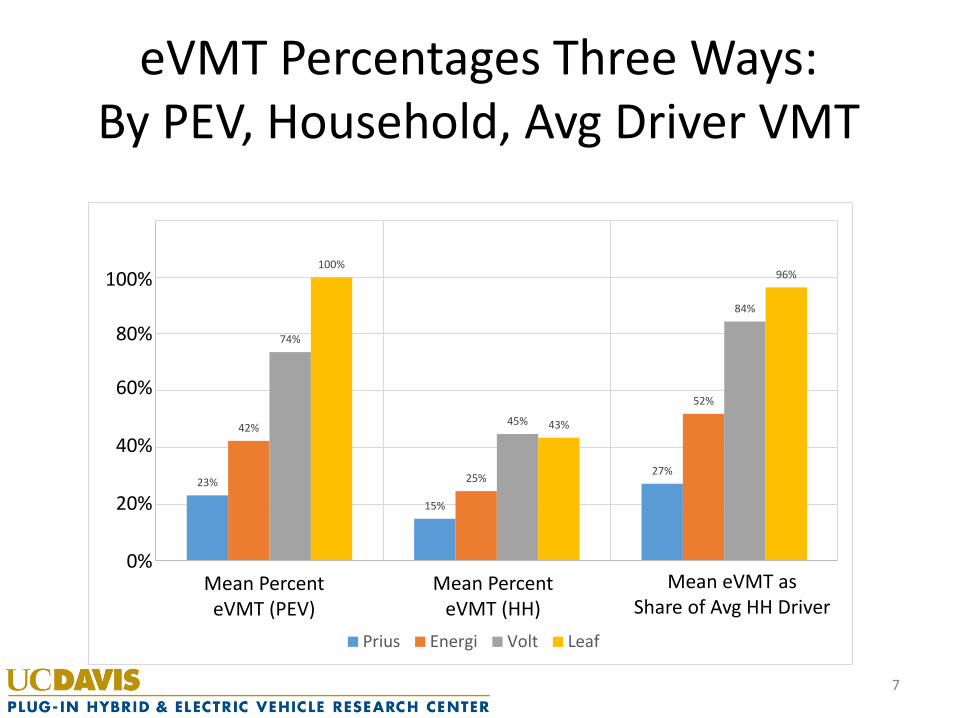
eVMT Percentages Three Ways: By PEV, Household, Avg Driver VMT
7
23%
15%
27%
42%
25%
52%
74%
45%
84%
100%
43%
96%
0%
20%
40%
60%
80%
100%
120%
Mean Percent eVMT (PEV) Mean Percent eVMT (HH) Mean eVMT as Share ofAverage HH Driver
Prius Energi Volt Leaf
Mean Percent eVMT (PEV)
Mean Percent eVMT (HH)
Mean eVMT as Share of Avg HH Driver
100%
80%
60%
40%
20%
0%
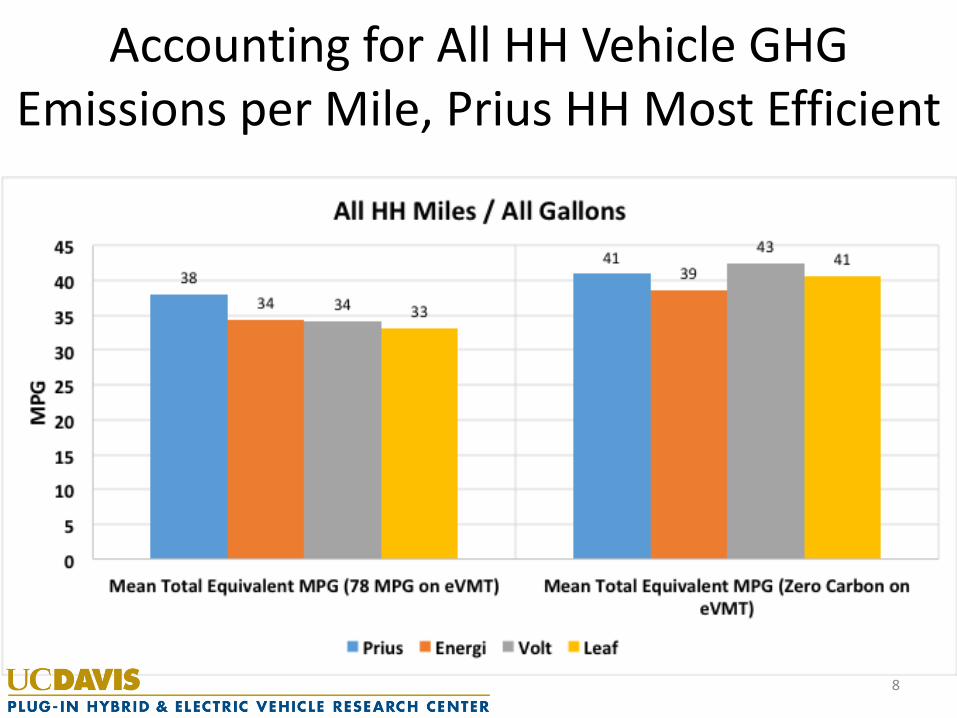
Accounting for All HH Vehicle GHG Emissions per Mile, Prius HH Most Efficient
8
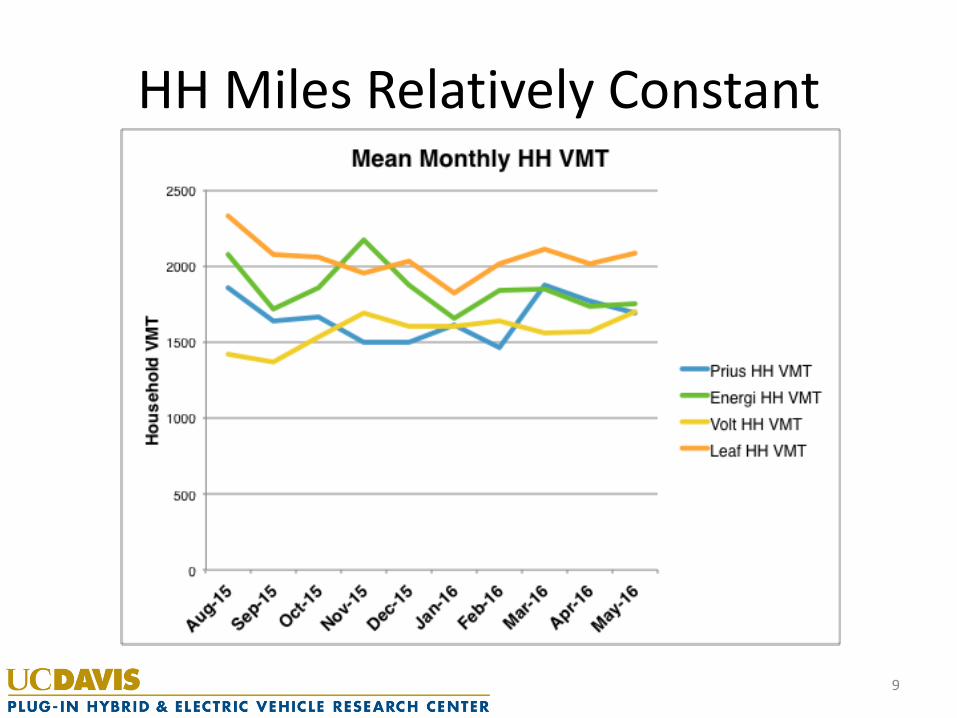
HH Miles Relatively Constant
9
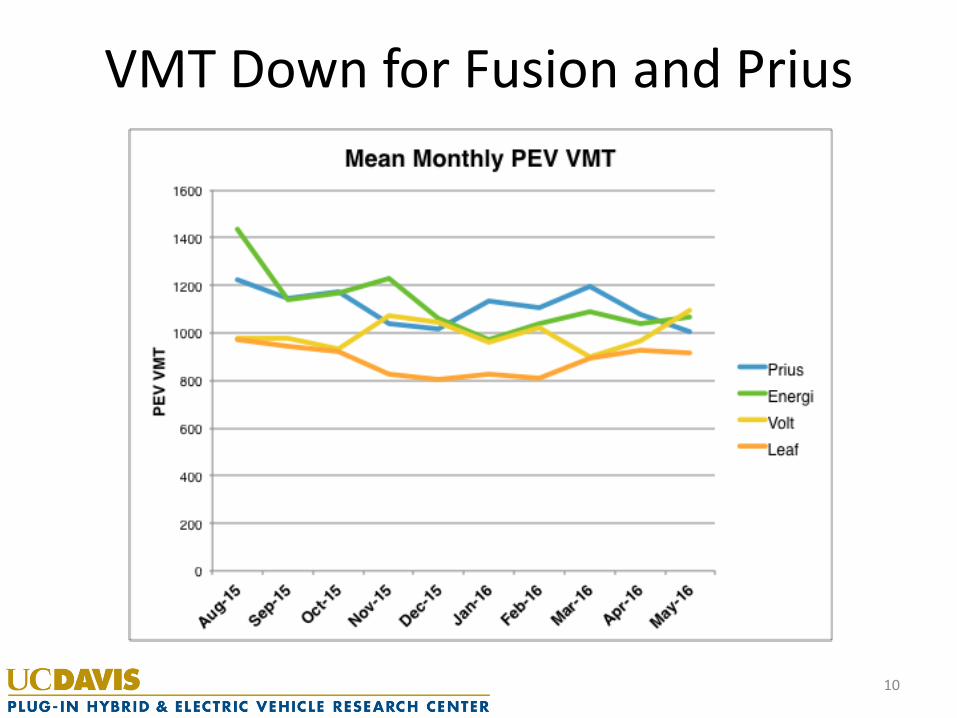
VMT Down for Fusion and Prius
10
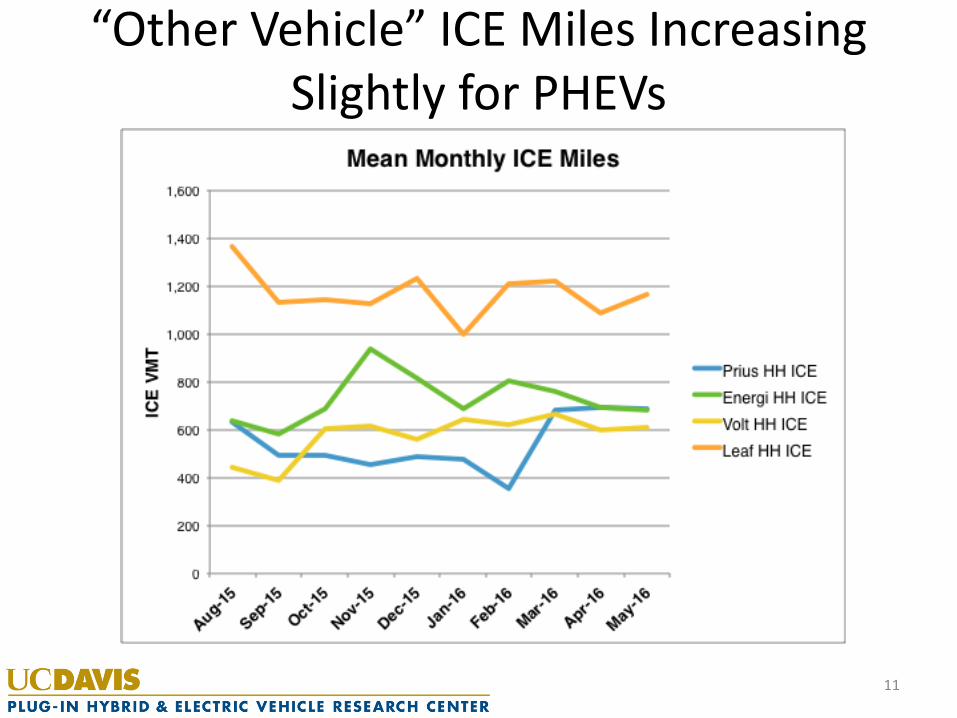
“Other Vehicle” ICE Miles Increasing Slightly for PHEVs
11
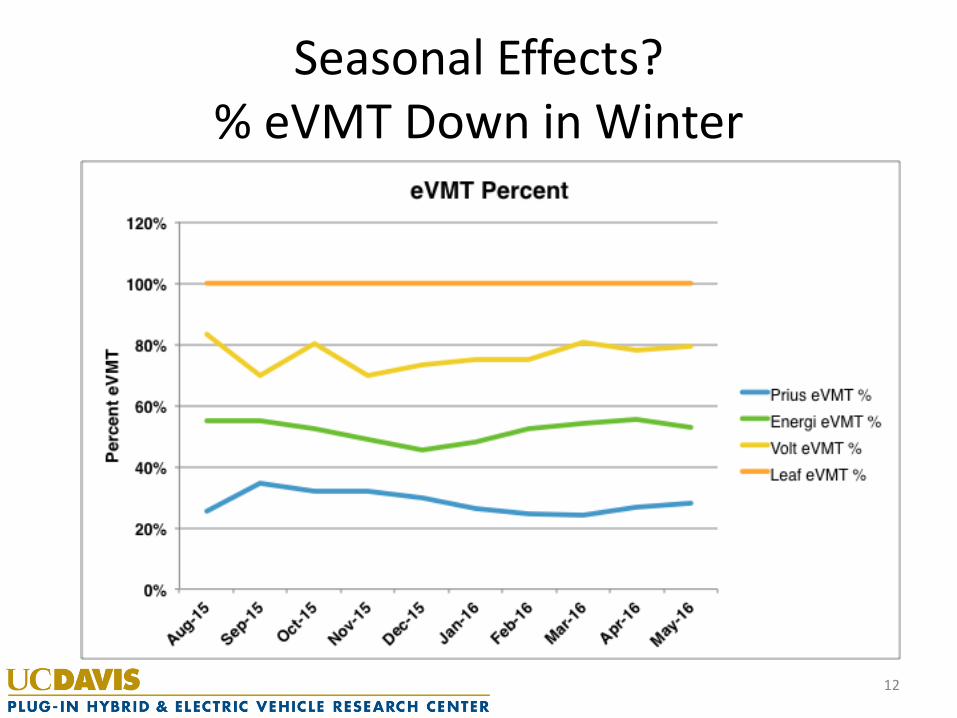
Seasonal Effects? % eVMT Down in Winter
12
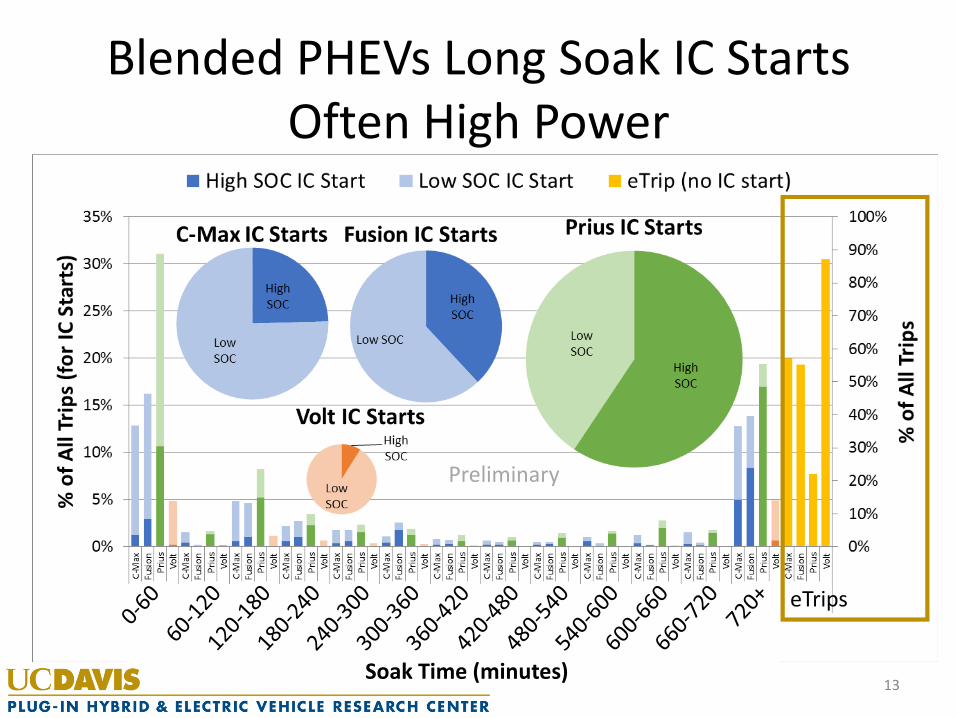
Blended PHEVs Long Soak IC Starts Often High Power
Soak Time (minutes)
eTrips
13
Preliminary
Overall Motivation to Plug In
• You must plug in to get eVMT – Is it worth it to the driver? What is the cost/benefit?
• Analysis of survey respondents shows PHEVs more likely to be plugged in when more range can be recovered – Longer range PHEVs less likely to never be plugged in
because they provide greater potential for more miles to be recovered per charging event
– Every mile recovered from a charge event increases the likelihood of plugging in by 1.4%
14
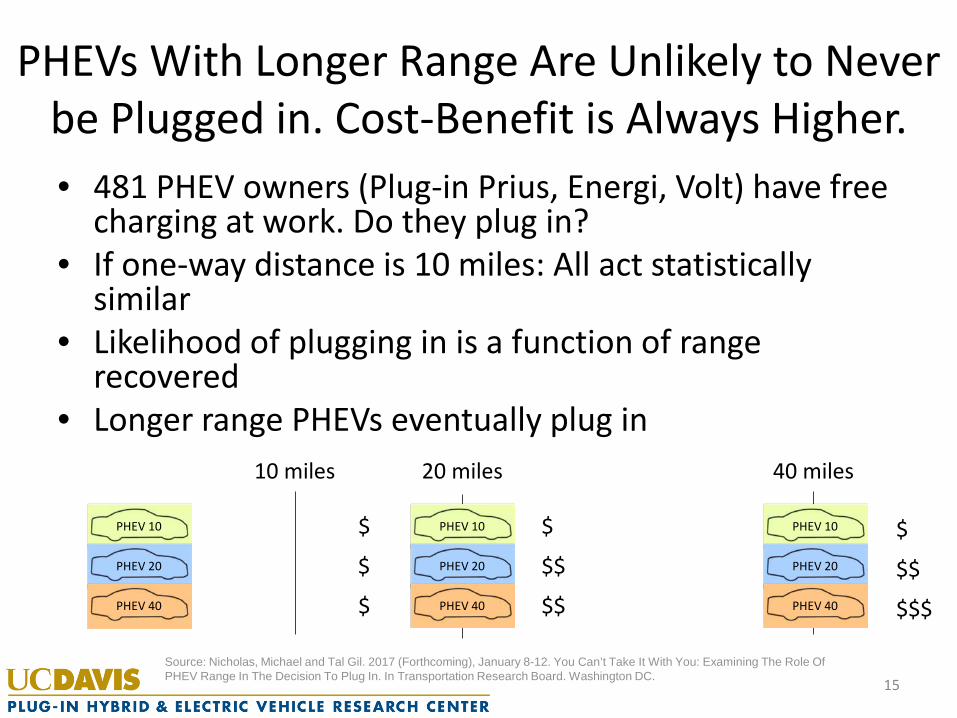
PHEVs With Longer Range Are Unlikely to Never be Plugged in. Cost-Benefit is Always Higher. • 481 PHEV owners (Plug-in Prius, Energi, Volt) have free
charging at work. Do they plug in? • If one-way distance is 10 miles: All act statistically
similar • Likelihood of plugging in is a function of range
recovered • Longer range PHEVs eventually plug in
PHEV 10
PHEV 20
PHEV 40
10 miles 20 miles 40 miles
PHEV 10
PHEV 20
PHEV 40
PHEV 10
PHEV 20
PHEV 40
Source: Nicholas, Michael and Tal Gil. 2017 (Forthcoming), January 8-12. You Can’t Take It With You: Examining The Role Of PHEV Range In The Decision To Plug In. In Transportation Research Board. Washington DC.
$
$
$
$
$$
$$
$
$$
$$$
15
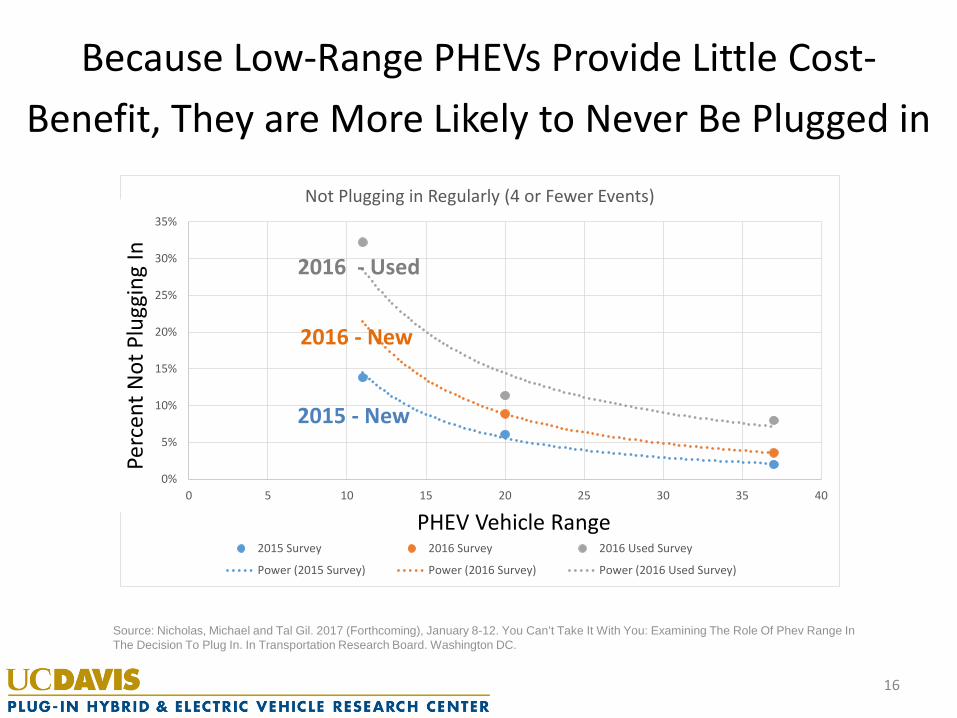
Because Low-Range PHEVs Provide Little Cost-Benefit, They are More Likely to Never Be Plugged in
Source: Nicholas, Michael and Tal Gil. 2017 (Forthcoming), January 8-12. You Can’t Take It With You: Examining The Role Of Phev Range In The Decision To Plug In. In Transportation Research Board. Washington DC.
0%
5%
10%
15%
20%
25%
30%
35%
0 5 10 15 20 25 30 35 40
Perc
ent N
ot P
lugg
ing
In
PHEV Vehicle Range
Not Plugging in Regularly (4 or Fewer Events)
2015 Survey 2016 Survey 2016 Used Survey
Power (2015 Survey) Power (2016 Survey) Power (2016 Used Survey)
16
PHEV Vehicle Range
Perc
ent N
ot P
lugg
ing
In
2015 - New
2016 - New
2016 - Used
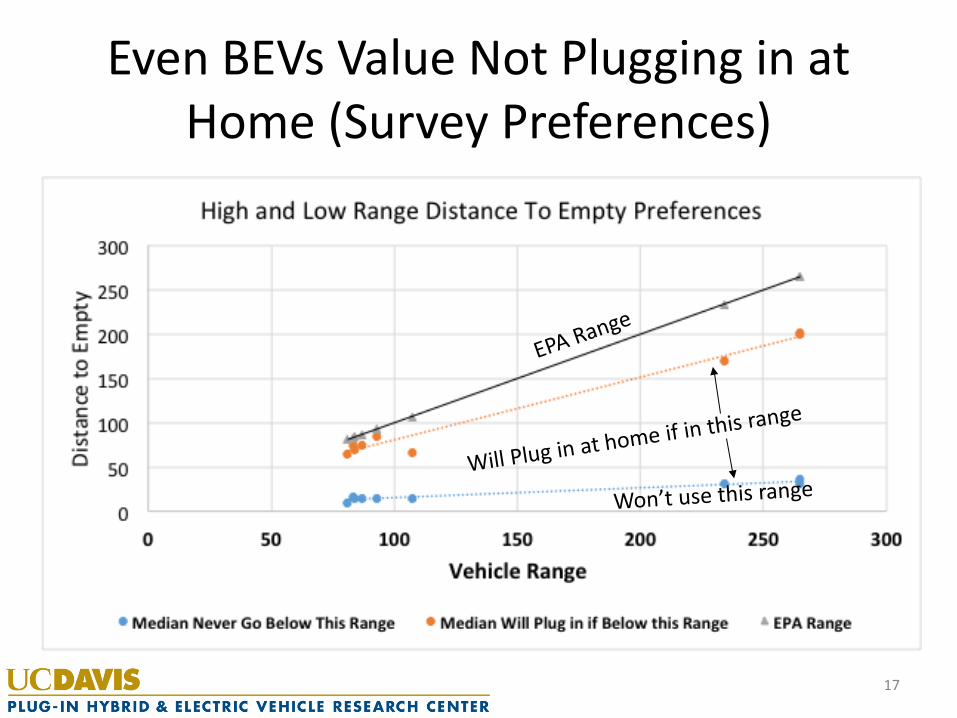
Even BEVs Value Not Plugging in at Home (Survey Preferences)
17
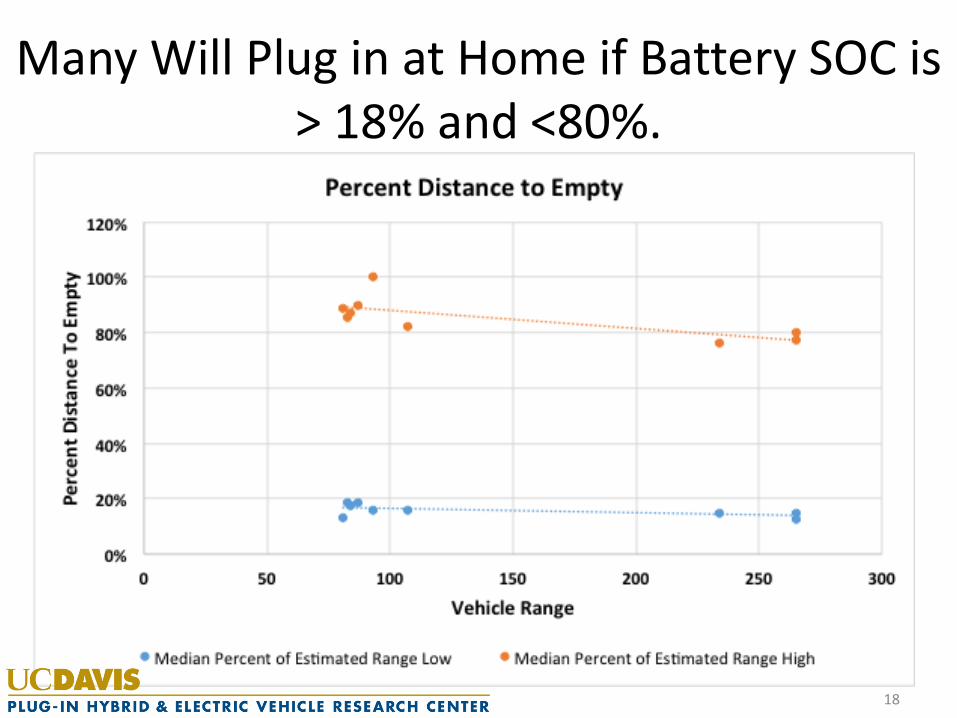
Many Will Plug in at Home if Battery SOC is > 18% and <80%.
18
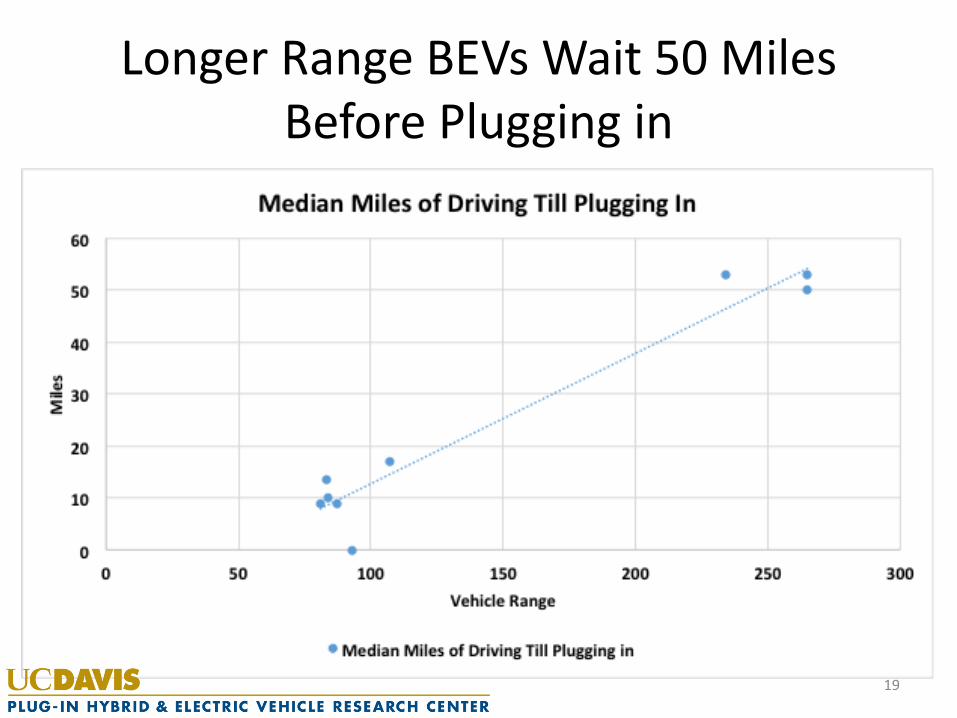
Longer Range BEVs Wait 50 Miles Before Plugging in
19
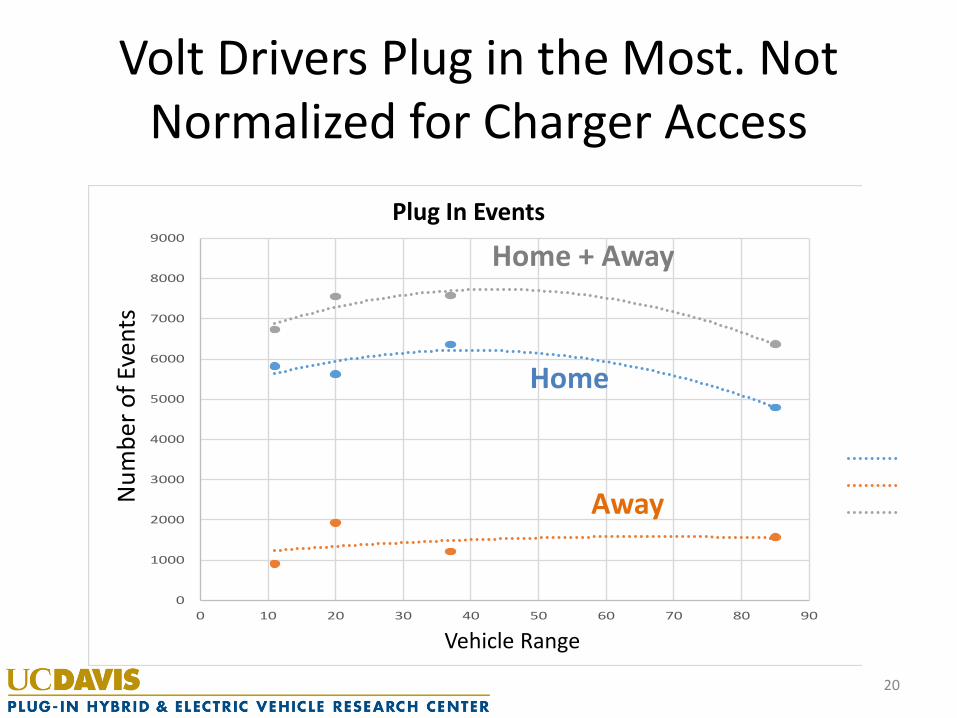
Volt Drivers Plug in the Most. Not Normalized for Charger Access
20
0
1000
2000
3000
4000
5000
6000
7000
8000
9000
0 10 20 30 40 50 60 70 80 90
Numb
er of
Even
ts
Vehicle Range
Plug In Events
Vehicle Range
Num
ber o
f Eve
nts
Home
Away
Home + Away Plug In Events
Conclusions
• Many…but for this project: • The lower the electric range the fewer eVMT
(duh!) – Technical potential is lower – Customers are not as willing to plug in
• Volts are similar in behavior and potential to Leafs for our sample, but slightly lower eVMT
21
More Conclusions • Household data show declining use of PEV
– Older vehicles are naturally used less – Gas prices decrease
• High power cold starts more likely on smaller battery PHEVs
• GHG per household mile shows inefficient household miles (especially in BEV HH) need to be replaced with efficient miles. – Vehicle replacement is key – Substitute gasoline miles in an efficient PHEV – Zero carbon electricity is necessary
22
Thank You
• Michael Nicholas [email protected] • Gil Tal [email protected] • Thomas Turrentine [email protected]
23
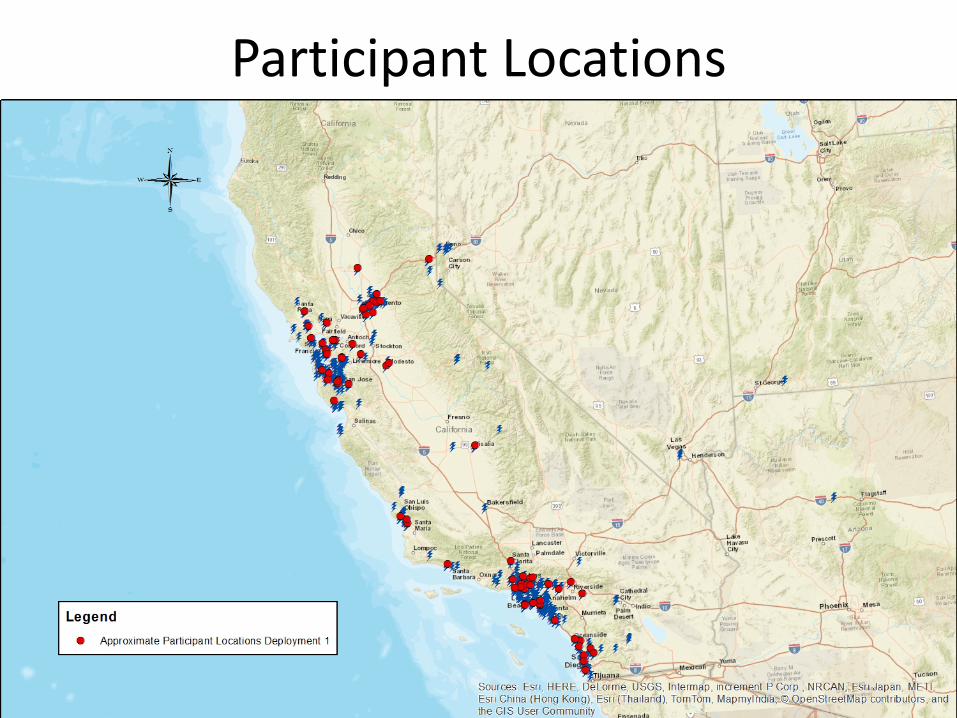
Participant Locations
24
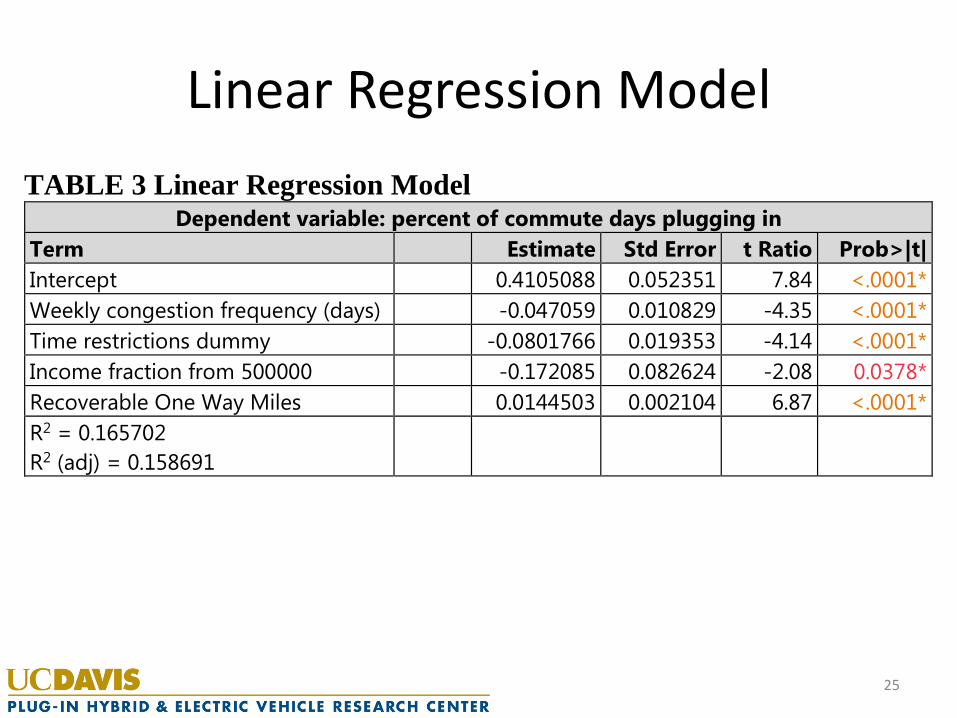
Linear Regression Model TABLE 3 Linear Regression Model
Dependent variable: percent of commute days plugging in Term Estimate Std Error t Ratio Prob>|t| Intercept 0.4105088 0.052351 7.84 <.0001* Weekly congestion frequency (days) -0.047059 0.010829 -4.35 <.0001* Time restrictions dummy -0.0801766 0.019353 -4.14 <.0001* Income fraction from 500000 -0.172085 0.082624 -2.08 0.0378* Recoverable One Way Miles 0.0144503 0.002104 6.87 <.0001* R2 = 0.165702 R2 (adj) = 0.158691
25