Embed Size (px)
Citation preview

July 2005
NASA/TP-2005-213782
Advanced Pathway Guidance Evaluations on a
Synthetic Vision Head-Up Display
Lynda J. Kramer, Lawrence J. Prinzel III, Jarvis J. Arthur III, and Randall E. Bailey
Langley Research Center, Hampton, Virginia
https://ntrs.nasa.gov/search.jsp?R=20050206398 2019-08-07T19:47:52+00:00Z

The NASA STI Program Office . . . in Profile
Since its founding, NASA has been dedicated to the
advancement of aeronautics and space science. The
NASA Scientific and Technical Information (STI)
Program Office plays a key part in helping NASA
maintain this important role.
The NASA STI Program Office is operated by
Langley Research Center, the lead center for NASA’s
scientific and technical information. The NASA STI
Program Office provides access to the NASA STI
Database, the largest collection of aeronautical and
space science STI in the world. The Program Office is
also NASA’s institutional mechanism for
disseminating the results of its research and
development activities. These results are published by
NASA in the NASA STI Report Series, which
includes the following report types:
• TECHNICAL PUBLICATION. Reports of
completed research or a major significant phase
of research that present the results of NASA
programs and include extensive data or
theoretical analysis. Includes compilations of
significant scientific and technical data and
information deemed to be of continuing
reference value. NASA counterpart of peer-
reviewed formal professional papers, but having
less stringent limitations on manuscript length
and extent of graphic presentations.
• TECHNICAL MEMORANDUM. Scientific
and technical findings that are preliminary or of
specialized interest, e.g., quick release reports,
working papers, and bibliographies that contain
minimal annotation. Does not contain extensive
analysis.
• CONTRACTOR REPORT. Scientific and
technical findings by NASA-sponsored
contractors and grantees.
• CONFERENCE PUBLICATION. Collected
papers from scientific and technical
conferences, symposia, seminars, or other
meetings sponsored or co-sponsored by NASA.
• SPECIAL PUBLICATION. Scientific,
technical, or historical information from NASA
programs, projects, and missions, often
concerned with subjects having substantial
public interest.
• TECHNICAL TRANSLATION. English-
language translations of foreign scientific and
technical material pertinent to NASA’s mission.
Specialized services that complement the STI
Program Office’s diverse offerings include creating
custom thesauri, building customized databases,
organizing and publishing research results ... even
providing videos.
For more information about the NASA STI Program
Office, see the following:
• Access the NASA STI Program Home Page at
http://www.sti.nasa.gov
• E-mail your question via the Internet to
• Fax your question to the NASA STI Help Desk
at (301) 621-0134
• Phone the NASA STI Help Desk at
(301) 621-0390
• Write to:
NASA STI Help Desk
NASA Center for AeroSpace Information
7121 Standard Drive
Hanover, MD 21076-1320

National Aeronautics and
Space Administration
Langley Research Center
Hampton, Virginia 23681-2199
July 2005
NASA/TP-2005-213782
Advanced Pathway Guidance Evaluations on a
Synthetic Vision Head-Up Display
Lynda J. Kramer, Lawrence J. Prinzel III, Jarvis J. Arthur III, and Randall E. Bailey
Langley Research Center, Hampton, Virginia

Available from:
NASA Center for AeroSpace Information (CASI) National Technical Information Service (NTIS)
7121 Standard Drive 5285 Port Royal Road
Hanover, MD 21076-1320 Springfield, VA 22161-2171
(301) 621-0390 (703) 605-6000

iii
Table of Contents
List of Tables................................................................................................................................................................iv List of Figures................................................................................................................................................................v Symbols and Abbreviations..........................................................................................................................................vi Introduction ...................................................................................................................................................................1 Background....................................................................................................................................................................1
Synthetic Vision ........................................................................................................................................................2 HUD as Retrofit Approach to SVS implementation..................................................................................................3 The Pathway-In-The-Sky Concept ............................................................................................................................4 Pathway-In-The-Sky Research ..................................................................................................................................5 Head-Up Displays and Attention Capture .................................................................................................................9
Current Study...............................................................................................................................................................10 Experiment Objectives.............................................................................................................................................11 Hypotheses ..............................................................................................................................................................11
Methodology................................................................................................................................................................12 Test Subjects............................................................................................................................................................12 Simulation Facility ..................................................................................................................................................12 Evaluation Tasks......................................................................................................................................................13 Independent Variables .............................................................................................................................................14 Experiment Design ..................................................................................................................................................16 Dependent Measures for the Objective Data Analyses............................................................................................17 Dependent Measures for the Subjective Data Analyses ..........................................................................................19 Procedure.................................................................................................................................................................19
Results .........................................................................................................................................................................19 Objective Results .....................................................................................................................................................19 Subjective Results....................................................................................................................................................21 Discussion................................................................................................................................................................28
Conclusions .................................................................................................................................................................29 Future Research ...........................................................................................................................................................30 References ...................................................................................................................................................................31 Appendix A: Pathway Concepts Experiment For Head-Down Synthetic Vision Displays .........................................33 Appendix B: Required Navigation Performance .........................................................................................................39 Appendix C: Post run questionnaires...........................................................................................................................40

iv
List of Tables
Table 1. Experimental Run Matrix .............................................................................................................................16 Table 2. Lateral Navigation Performance Bin Definitions .........................................................................................18 Table 3. Vertical Navigation Performance Bin Definitions........................................................................................18

v
List of Figures
Figure 1. Synthetic Vision Systems concept.................................................................................................................2 Figure 2. Head-down SVS pathway concepts presented on a Size D display with synthetic terrain of RNO. .............7 Figure 3. Dynamic tunnel presentation of the ownship on path (left picture) and outside the defined tunnel boundary
(right picture). ........................................................................................................................................................7 Figure 4. Integration Flight Deck simulation facility with HUD and SVS-RD. .........................................................13 Figure 5. Evaluation tasks for Sparks East Visual Arrival to runway 16R. ................................................................14 Figure 6. Head-up tunnel concepts and guidance symbologies. .................................................................................15 Figure 7. Head-down display suite: PFD (left picture) and ND (right picture) .........................................................15 Figure 8. B-737 aircraft in nominal hold position and in runway incursion position. ................................................16 Figure 9. RMS lateral and verical path error for tunnel/guidance concepts tested. ....................................................20 Figure 10. SART ratings for the tunnel/guidance concept tested. ...............................................................................21 Figure 11. SA-SWORD rankings for the tunnel/guidance concepts tested. ...............................................................22 Figure 12. SA-SWORD rankings for the tunel concepts tested..................................................................................23 Figure 13. SWORD rankings for the tunnel/guidance concepts tested.......................................................................24 Figure 14. SWORD rankings for the tunnel concepts tested. .....................................................................................24 Figure 15. Rating of pilots’ response to post run question two. .................................................................................25 Figure 16. Rating of pilots’ response to post run question five. .................................................................................26 Figure 17. Likert scale used for rating the effectiveness of the tunnel or guidance concepts. ....................................26 Figure 18. Likert scale used for rating of workload of the tunnel concepts................................................................26 Figure A1. SART and AFFTC workload estimation scale results..............................................................................34 Figure A2. Approach RMS path error. .......................................................................................................................35 Figure A3. Effectiveness of tunnel concepts for flight path segments........................................................................36 Figure A4. Effectiveness of guidance symbology for flight path segments. ..............................................................37 Figure C1. Air Force Flight Technical Center workload estimate scale .....................................................................40 Figure C2. SART scale. ..............................................................................................................................................40 Figure C3. Post-run questionnaire. .............................................................................................................................40

vi
Symbols and Abbreviations
ADS-B Automatic Dependent Surveillance – Broadcast AFFTC Air Force Flight Technical Center AFL Above Field Level ANOVA Analysis of Variance ANP Actual Navigation Performance ARIES Airborne Research Integrated Experiment System AvSSP Aviation Safety and Security Program CFIT Controlled Flight Into Terrain DFW FAA airport identifier for Dallas/Fort Worth International Airport EADI Electronic Attitude Direction Indicator EFIS Electronic Flight Instrumentation System EGE FAA airport identifier for Eagle County, Colorado Regional Airport EVS Enhanced Vision System FTE Flight Technical Error GPS Global Positioning System HDD Head-Down Display HGS Head-Up Guidance System HSCT High-Speed Civil Transport HUD Head-Up Display IFD Integration Flight Deck IMC Instrument Meteorological Conditions INS Inertial Navigation System LAAS Local Area Augmentation System LaRC Langley Research Center NASA National Aeronautics and Space Administration ND Navigation Display nm nautical mile PFD Primary Flight Display RIPS Runway Incursion Prevention System RMS Root-mean square RNAV Area Navigation RNO FAA airport identifier for Reno/Tahoe International Airport RNP Required Navigation Performance SA Situation Awareness SART Situation Awareness Rating Technique SA-SWORD Situation Awareness – Subjective Workload Dominance SNK Student-Newman-Keuls SVS Synthetic Vision System SVS-RD Synthetic Vision System-Research Display SWORD Subjective Workload Dominance TAWS Terrain Awareness and Warning System TIS-B Traffic Information Services - Broadcast VMC Visual Meteorological Conditions VNAV Vertical Navigation WAAS Wide Area Augmentation System XGA 1024 x 768 resolution

1
ABSTRACT
NASA’s Synthetic Vision Systems (SVS) project is developing
technologies with practical applications to potentially eliminate low visibility conditions as a causal factor to civil aircraft accidents while replicating the operational benefits of clear day flight operations, regardless of the actual outside visibility condition. A major thrust of the SVS project involves the development/demonstration of affordable, certifiable display configurations that provide intuitive out-the-window terrain and obstacle information with advanced guidance for commercial and business aircraft. This experiment evaluated the influence of different pathway and guidance display concepts upon pilot situation awareness (SA), mental workload, and flight path tracking performance for Synthetic Vision display concepts using a Head-Up Display (HUD). Two pathway formats (dynamic and minimal tunnel presentations) were evaluated against a baseline condition (no tunnel) during simulated instrument meterological conditions approaches to Reno-Tahoe International airport. Two guidance cues (tadpole, follow-me aircraft) were also evaluated to assess their influence. Results indicated that the presence of a tunnel on an SVS HUD had no effect on flight path performance but that it did have significant effects on pilot SA and mental workload. The dynamic tunnel concept with the follow-me aircraft guidance symbol produced the lowest workload and provided the highest SA among the tunnel concepts evaluated.
Introduction
Synthetic Vision Systems (SVS) represent a technology solution to mitigate aviation safety concerns and substantially increase operational throughput beyond that experienced when visibility conditions degrade to instrument flight rules. The National Aeronautics and Space Administration (NASA) Aviation Safety and Security Program (AvSSP), SVS project has endeavored to research the human factors of synthetic vision technology to ensure human-centered design. Many issues have been identified and experimental data collected that document the efficacy of Synthetic Vision Systems to solve visibility-induced problems encountered daily in the National Airspace System. While flight test and simulation research have elucidated that the optimal retrofit path for Part 25 aircraft is the use of head-up displays, how best to implement synthetic vision on these displays requires further study. In particular, the professional community has voiced the need for pathway-in-the-sky, or tunnel display formats, to help fully meet the potential of the display technology. However, little research exists as to how to best design these tunnel formats for synthetic vision head-up displays and on the tunnel format impacts on cognitive information processing. Hence, a study was conducted with the research goal to empirically evaluate different tunnel formats as part of a SVS head-up display (HUD) and examine the impact of the tunnel formats on cognitive information processing. This paper discusses the background, method, results, and conclusions of this study and explores future research directions.
Background
To better understand the integrated display, previous work in the primary display elements, namely synthetic vision and pathway-in-the-sky are discussed below. Additionally, research regarding implementation issues of retrofit to existing aircraft, and attention capture of these types of displays also are worthy of review, as they weigh heavily in the design of the displays used in this study.

2
Synthetic Vision
Limited visibility and reduced and/or insufficient situation awareness have been cited as predominant causal factors for Controlled Flight Into Terrain (CFIT) accidents, where a functioning airplane is inadvertently flown into the ground, water, or an obstacle. In commercial aviation, over 30-percent of all fatal accidents worldwide are categorized as CFIT.1 Limited or reduced visibility is also the single largest factor causing airport delays since runway capacity can be limited and increased air traffic separation required when weather conditions fall below visual flight rule operations. Therefore, significant benefits would accrue in aviation if somehow the leitmotif of problems involved in limited visibility could be solved. One such solution involves the creation of a “virtual meteorological condition” through something termed, “synthetic vision”. Synthetic vision represents a technology solution designed to provide the pilot an unobstructed view of the world around the aircraft through the display of computer-generated imagery derived from an onboard database of terrain, obstacle, and airport information. Synthetic vision concepts can be operationally defined in many ways ranging from simple presentations of terrain information to more sophisticated, integrated systems that include terrain data, pathway guidance information, and terrain integrity monitoring functionality. The latter concepts take advantage of many enabling technologies that, together, provide more than just a display of terrain information but instead represent operational display systems with substantially improved performance over those with only terrain depiction alone. One such system is being developed under NASA’s AvSSP SVS Project. The NASA Synthetic Vision System
The SVS Project of the NASA AvSSP is developing technologies with practical applications to potentially eliminate low visibility conditions as a causal factor to civil aircraft accidents while replicating the operational benefits of clear day flight operations, regardless of the actual outside visibility condition. The uniqueness of the NASA SVS concept (Figure 1) is the integration of many enabling technologies designed to mitigate or even eliminate the etiologies identified as aviation safety concerns and operational inefficiencies.
Figure 1. Synthetic Vision Systems concept.
Real-time Synthetic Vision Display w/ Advanced Pathway Guidance
Worldwide Terrain, Obstacle & Airport
Databases
Worldwide Terrain, Obstacle & Airport
Databases
INS / GPS (LAAS/ WAAS)
INS / GPS (LAAS/ WAAS)
Real-time tactical hazards (Weather,
NOTAMS)
Real-time tactical hazards (Weather,
NOTAMS)
Relevant Traffic Information
(ADS-B, TIS-B)
Relevant Traffic Information
(ADS-B, TIS-B)
Advanced Sensorsfor Database Integrity & Object Detection
Advanced Sensorsfor Database Integrity & Object Detection
Advanced Sensorsfor Database Integrity & Object Detection

3
The SVS display (Figure 1) is generated by visually rendering the terrain, obstacles and airports, around the aircraft, derived from an onboard database using precise position and navigation data obtained through GPS (Global Positioning System) data, with augmentation from differential correction sources such as Local Area Augmentation Systems (LAAS) and Wide Area Augmentation Systems (WAAS), as well as blending from on-board Inertial Navigation System (INS) information. Active imaging sensors, real-time hazard information (e.g., weather and wake vortices), and traffic information as provided by Automatic Dependent Surveillance – Broadcast (ADS-B) and Traffic Information Services - Broadcast (TIS-B) can additionally enhance the information value of this synthetic vision display concept. Although the display representation to the pilot is synthetically derived, object detection and integrity monitoring functions are envisioned to ensure sufficient accuracy and reliability for certification. The SVS display also includes the display of intended flight path by tunnel (pathway-in-the-sky presentations) which, together, would help to fully meet the operational benefits possible with such display technology. When coupled with a synthetic or enhanced view of the outside world, the spatially-integrated depiction of the intended aircraft flight path and its relation to the world provides an intuitive, easily interpretable display of flight-critical information for the pilot. By combining this precision guidance capability with SVS terrain information, the potential to eliminate the low-visibility precursors to accidents is significantly increased. It is this combination of pathway-in-the-sky with the other enabling technologies that truly allows the benefits of synthetic vision to be realized. Potential Benefits of NASA SVS
Together, these technologies provide the capability of the SVS to help reduce or even prevent CFIT accidents, which are the single greatest contributing category of fatal worldwide airline and general aviation accidents.1 Other potential safety benefits include reduced approach and landing accidents and loss-of-control accidents.2 Operational benefits potentially include more approach and departure options and lower visibility minimums for SVS-equipped aircraft. The impressive SVS benefits, however, must be tempered by an understanding that new technology often transforms the nature of the piloting task. Sufficient research must be conducted to ensure that the potential of a Synthetic Vision System is met without introduction of other risks and ensures human-centered design. For example, an important human-centered design question concerns how best to retrofit existing Part 25 non-glass aircraft that represent 66% of the existing fleet. These non-EFIS (electronic flight information system) aircraft have significant design limitations that will affect SVS implementation with potential human factors concerns. The best candidate to answer that question appears to be the use of head-up displays as a retrofit option for Synthetic Vision Systems. Although HUDs have proven operational benefits, the synthetic vision HUD will not simply substitute for the traditional head-up displays. Instead, the new technology will add new complexity and new capability requiring empirical evaluation of its efficacy. The next section discusses the HUD as a retrofit option for commercial aircraft and flight test research on display system utility for operational use.
HUD as Retrofit Approach to SVS implementation
To accommodate as many existing aircraft as possible, much of the SVS research has focused on implementing SVS display technology as retrofit. Though this levies additional constraints on the design of the system, it affords application of the concept to the current aircraft fleet. This approach employs existing head down display (HDD) capabilities for glass cockpits (cockpits already equipped with raster-capable HDDs) and head-up display (HUD) capabilities for the other aircraft. A cost-effective retrofit path for SVS in electro-mechanical cockpits may be possible by generation of a synthetic vision image as the raster input source to a stroke-on-raster HUD. This display concept is analogous in many respects to the Enhanced Vision System (EVS) certified on the Gulfstream G-V aircraft, except that the raster image is synthetically-derived rather than being a direct imaging sensor output. Unlike EVS displays, the SVS HUD concept does not generate any raster HUD image above the terrain (i.e., it shows a “clear sky” as opposed to a sensor image of the sky). To evaluate retrofit options for SVS displays, two major NASA flight tests have been conducted for assessment and evaluation of the SVS developments. Both flight tests have used the NASA/Langley Research Center (LaRC)-modified Boeing 757-200 jetliner (known as ARIES). The first flight test was flown Sept-Oct 2000 in nighttime

4
operations at Dallas-Ft. Worth (FAA Identifier: DFW)3. The second flight test was flown Aug-Sept 2001 in simulated daylight Instrument Meteorological Conditions (IMC) at Eagle County Regional Airport, CO (FAA Identifier: EGE).4,5 The feasibility of the SVS display technology retrofit concept using a HUD was verified for both day and night operations.3,4,5 Pilots reported greater situation awareness and obtained lower flight technical error (FTE) while operating with the SVS-HUD concepts compared to the conventional displays. The conclusion drawn from these flight tests was that the HUD represents the most promising candidate for retrofit of Synthetic Vision Systems on Part 25 aircraft. Past NASA research has established that the optimal retrofit solution employs the use of synthetic vision HUDs for commercial and business aircraft. A significant advantage of the NASA SVS HUD is that it employs the use of “pathway-in-the-sky” or “tunnel-in-the-sky” presentations. Quantitative and qualitative data have consistently evinced that these displays reduce pilot flight technical error, enhance situation awareness, and lower mental workload owing largely to the coupling of pathway and terrain presentation. Therefore, the conclusions that may be drawn is that tunnel displays are essential to the Synthetic Vision System. However, the pathway symbology employed in previous research made use of symbology derived from past studies on the high-speed civil transport (HSCT) which may, or may not, be the optimal presentation for a Synthetic Vision System HUD. Furthermore, there are no direct comparisons of the NASA SVS head-up display with and without a pathway-in-the-sky. Because HUDs are the likely candidate for retrofit of Part 25 aircraft, these research questions need be addressed. The current study was designed to evaluate the efficacy of integrating pathway-in-the-sky information in synthetic vision HUDs and determine the usability of various tunnel formats available for SVS HUD design.
The Pathway-In-The-Sky Concept
Previous research has shown the promise of “pathway-in-the-sky,” or “tunnel-in-the-sky,” displays, which present a spatial analog of the aircraft trajectory to be flown. These displays enhance situational awareness6,7,8 and allow for lower flight technical error9,10 without concomitant increases in mental workload.6,11 The primary advantage of tunnel displays is that the pilot no longer has to integrate several sources of information to translate and mentally reconstruct the aircraft spatiotemporal position into a representation of the natural world. Rather, the tunnel is an integration of several planar, two-dimensional information sources into a single projection of the aircraft computed path through a geometrical shape presented on a cockpit display. The resultant display takes advantage of the intuitive way humans naturally encode and decipher information --- visually --- and allows the pilots to assimilate visual motion cues and instantaneously extract three-dimensional positional information of ownship in relation to other world objects of interest. These advantages significantly enhance the potential of SVS displays to meet safety and operational benefit objectives, but the human factors of pathway formats and the potential to transform the nature of pilot tasks must be carefully considered and researched to ensure human-centered design. The next section describes information-centered theoretic analyses of pathway-in-the-sky displays and the importance for SVS display design. Human Factors Issues
The effectiveness of pathway-in-the-sky displays has been confirmed through information-centered analyses of pilot interaction with cockpit tunnel displays. Task analyses reveal that pilots use these displays in a characteristically different way than traditional displays. First, pilots engage in boundary-control tasks with the boundaries defined by the size of the tunnel. Tunnel presentations dictate control behavior which diminishes their concern for path errors that exist within spatial and temporal constraints defined by the tunnel parameters. Within these constraints, the pilot engages in error-neglecting control. However, if pilots are instructed to optimize flight technical performance, or when tunnel size is small, error-neglecting control is non-existent and a path optimization control strategy is utilized. Therefore, when paired with control guidance that defined the optimal path within the tunnel, individual pilot variability may account for the strategy employed. In fact, previous research has shown that if only a pursuit guidance is presented, the flight technical error is lower but mental workload is substantially greater. This is probably because, with tunnel presentation, flight path deviation tolerance is always defined and known to the pilot through the tunnel boundaries. When the tunnel is removed, the pilot is left with a single primary source of path

5
information and, therefore, must expend greater effort to match precisely the pursuit guidance with the flight path marker in order to ensure conformance with the defined path. Second, pilots engage in either a regulation task or an anticipation task dependent upon the trajectory of the tunnel path. When the trajectory consists of a straight segment, the task is a regulation task of flying the path and nulling lateral and vertical errors. However, when the tunnel segment is a curved trajectory, the pilot must instead anticipate and execute a transition manuever between the steady straight segment conditions. Mulder12,13 conducted an information-theoretic analyses of straight and curved tunnel segments to obtain an understanding of pilot-display interaction in the regulation and anticipation tasks of guiding an aircraft along straight and curved tunnel trajectories. Through theoretic and empirical analysis, it was shown that optical gradients of perspective and compression in conjunction with pseudohorizons and vanishing point determine pilot behavior for regulation of flight path along straight tunnel segments. However, the optical gradients of perspective and compression are less useful to the pilot during curved segments and curved segments, which in contrast, yield neither vanishing point nor stationary optical invariants. Only optical gradients of nearby elements convey locomotive information to the pilot which often presents a biased perspective of aircraft positioning and motion relative to trajectory, making it much more difficult to accurately perform path following. The conclusion that may be drawn from theoretic information analyses of pilot use with pathway-in-the-sky display is that the absence or presence of the symbology significantly changes the nature of the aviation task; the distinction being error-neglecting or error-nulling pilot behavior. Without a tunnel presentation, the pilot engages in the task by responding to path error feedback to null out the error. The path optimization strategy is real-time and reactive in opposition to the error-neglecting strategy encouraged in the presence of a pathway-in-the-sky. The tunnel provides constraints and boundaries that permit the pilot to reduce the workload required to maintain the precision otherwise required in the absence of the information provided by the tunnel presentation. The strategy is further influenced by the trajectory of the tunnel segments with curved trajectory requiring greater error-neglecting control and transition maneuvers. Therefore, a natural postulation would be that pilots flying without a tunnel would attempt to minimize flight technical error at the expense of higher workload and lower situation awareness compared to strategies when a tunnel is present. The sections below describe related pathway research that evinces the effect of tunnel presentation on pilot path maintenance control, including research on the use of pathway-in-the-sky as part of a synthetic vision display.
Pathway-In-The-Sky Research
Although avionics have advanced significantly since Jimmy Doolittle flew the first “blind” flight in 1929, Theunissen14 noted that significant increases in aviation safety are unlikely to come by extrapolating from current display concepts. He further stated that, “new functionality and new technology cannot simply be layered onto previous design concepts, because the current system complexities are already too high. Better human-machine interfaces require a fundamentally new approach” (ref. 14; p.7). Bennet and Flach15 argued that such an approach should not focus on development of “idiot-proof” systems because of the infinite potential problem space, but rather should provide the pilot with information that would enable successful solution sets to be generated. Displays should present continuous information about spatial constraints rather than command changes to reduce error states, and should show error margins that depict the bounds within which the pilot may safety operate in contrast to the compensatory control strategy required by current cockpit instruments. “Pathway” or “tunnel” displays provide information in a form that meets these requirements. Early research on pathway displays included LaRussa “Path-in-the-sky head-up display”16, which became known as a “contact analog” display. The hallmark of a contact analog is the display of surfaces whose kinematics are similar to real surfaces in the natural visual environment. The LaRussa display, for example, presented true and artificial horizons, a central roadway, runway outline, and “sidewalks” that provided a direct or “contact” view of the world. Other notable contact analog displays include Klopfstein contact analog HUD symbology17; Cross and Cavallero18; Bersome19; DeCelles, Burke, and Burroughs20; Wilckens21; Carel22; and Gallaher, Hunt, and Williges23. However, this early flight display work in both technologies was limited graphically to connected straight line segments by the rendering capabilities available then as the state of the art (i.e., stroke generators). Because Pathway Displays attempted to represent the intended flight path of the airplane connecting geospatial waypoints, and because of the two dimensional nature of Instrument Landing Systems, which generated rectangular boundaries, the earliest Pathway Displays were quite amenable to stroke presentations. The natural inclination to include a runway representation at the end of the final approach segment of the Pathway Display led to its initial coupling with

6
Synthetic Vision. In addition to a runway representation, some primitive attempts were also made to represent first, the ground plane, and eventually terrain. As computer graphics technology has matured, pathway (and terrain) presentations have improved dramatically. However, the basic concept of presenting the desired vertical and lateral path ahead of the airplane, viewed from the pilot’s position, in a three dimensional perspective scene has been maintained. From these nascent tunnel-in-the-sky displays have emerged sophisticated tunnel-in-the-sky displays and a wealth of human factors literature on the efficacy of pathway displays. A considerable body of research exists demonstrating the effectiveness of pathway displays for horizontal and vertical guidance and enhancing situation awareness.24,25 Many of these studies, however, failed to emulate the flight conditions that create problems which tunnel displays are postulated to ameliorate (e.g., deviations from curved approaches). Rather, they are often conducted using part-task simulations under conditions of low workload (e.g., straight-in approaches). Moreover, the tunnels were presented alone, supplemented only by minimal flight instrumentation. Therefore, few studies14,26 are available to guide tunnel and guidance symbology design for complex graphical displays, such as synthetic vision. Below are two studies that specifically addressed the design of pathway-in-the-sky formats for synthetic vision displays. Synthetic Vision Head-Down Display Pathway Research
Researchers at NASA LaRC conducted an experiment examining the efficacy of different tunnel and guidance concepts (see Fig. 2) for head-down synthetic vision displays.30 This experiment focused on an SVS head-down primary flight display (PFD) and examined four tunnel concepts (box, minimal, dynamic, and pathway) and three guidance symbologies (ball, tadpole, follow-me aircraft). The box tunnel concept (used frequently in past tunnel research) consisted of a series of boxes connected at the corners to form a path within which the pilot is directed to fly. The minimal tunnel concept consisted of a series of “crow’s feet” which represented the truncated corners of nominally-connected 2-dimensional rectangles spaced at 0.2 nautical mile (nm) increments along the desired path. The crow’s feet were linearly decreased in brightness so, by 3.0 nm from own-ship, the brightness of the bottom crow’s feet was reduced to zero. The dynamic tunnel concept had the crow’s feet grow as a function of path error to provide the pilots feedback on how well they were flying the defined path. The idea of the dynamic tunnel (see Fig. 3) is to minimize clutter when the pilots are flying on path and to alert them as their path error grows by dynamically lengthening the sides of the tunnel in the direction of the path error. The pathway tunnel concept was a variation of the dynamic tunnel concept in which the floor of the tunnel was presented at all times. In addition, the pathway tunnel concept was not dynamic until the path error was greater than 0.5 dots. For both the dynamic and pathway tunnel concepts, when the pilot left the tunnel, the tunnel would change to a trough that resembled three sides of the box tunnel concept. The tunnel was open on one side to “invite” the pilot back into the tunnel (see Fig. 3).

7
Minimal
Dynamic
Box
Pathway
Ball
Tadpole
Follow-me aircraft (Ghost)
MinimalMinimal
DynamicDynamic
BoxBox
PathwayPathway
BallBall
TadpoleTadpole
Follow-me aircraft (Ghost)
Figure 2. Head-down SVS pathway concepts presented on a Size D display with synthetic terrain of RNO.
Figure 3. Dynamic tunnel presentation of the ownship on path (left picture) and outside the defined tunnel boundary (right picture). All three guidance concepts (ball, tadpole, follow-me aircraft) were driven by the same modified pursuit guidance laws and only differed in their presentation (see Fig. 2) to the pilot.27 The guidance symbol was positioned 30 seconds ahead of the ownship nominally on the centerline of the tunnel. Yaw, pitch, and roll attitude changes of the guidance symbol reflected the track and flight path angles of the path at that lead position. The ball symbol was a laterally and vertically integrated guidance cue. The tadpole guidance symbol was the same as the integrated ball guidance with added track change information provided by a vertical line. The idea being that the “tadpole” line gives the pilot lateral anticipation of the guidance symbol. The line pointed straight up if the desired track was

8
constant. As the track changed, it rotated left or right in the direction of the track change to denote desired lateral path. The follow-me aircraft (also referred to as the “ghost”) guidance symbol provided the pilot with visual yaw, pitch, and roll changes as it flew the path 30 seconds ahead of the ownship. The specific tunnel/guidance concepts tested (see Fig. 2) were: box tunnel/ball guidance, minimal tunnel/ball guidance, pathway tunnel/ball guidance, dynamic tunnel/ball guidance, dynamic tunnel/tadpole guidance, and dynamic tunnel/ghost guidance. The tunnel concepts were evaluated against a baseline concept (no tunnel using the ball guidance symbology). All concepts and the baseline were paired with a navigation display (ND) with a Terrain Awareness and Warning System (TAWS). Results from this SVS head-down experiment indicated that the presence of a tunnel on an SVS primary flight display had a marginal effect on enhancing lateral flight path performance but significant improvements were evident for situation awareness (SA) and workload.30 For both SA and workload, the no-tunnel condition (baseline) was rated significantly worse (higher workload and lower SA) than any of the tunnel concepts employed. Based on pilot rankings, the dynamic tunnel concept produced the lowest workload and provided the highest SA among the tunnel concepts evaluated. The choice of guidance symbol had no effect on either path performance or workload but did have a significant effect on SA. The ball was rated significantly lower in SA than either the tadpole or ghost but there were no appreciable differences between these latter two guidance symbologies. In Appendix A, a comprehensive treatment of the results from this SVS head-down experiment is presented. As a result of this SVS head-down experiment, for the current study, two tunnel formats (dynamic, minimal) were selected to be evaluated against a baseline condition (no tunnel). Additionally, two guidance cues (tadpole, ghost) that were found to be equally effective in an SVS head-down experiment were also evaluated in the current study to assess their influence on the tunnel format evaluations. Synthetic Vision Head-Up Display Pathway Research
Snow and French28 examined pilot performance, workload and situation awareness in a HUD SVS study in which HUD-experienced pilots flew complex precision approaches under three visibility conditions (day visual meteorological conditions (VMC), night VMC, day IMC), two terrain conditions (with, without), and two flight symbology conditions (pathway-in-the-sky, traditional military HUD symbology known as MIL-STD HUD). This study also examined whether the presence of a pathway would lead to cognitive capture and result in reduced SA for required crew duties other than those associated with the pathway. The authors hypothesized that including a pathway with synthetic terrain on a HUD results in a conformal symbology set which would naturally draw a pilot’s attention to external events. In a conformal display, distant display images are displayed at the correct size and location angularly as their real world sources would be if viewed through a window. Their hypothesis was tested by placing an aircraft on the approach end of the runway to see if the pilots would recognize the runway incursion. As has been seen in previous NASA studies3,5,29 comparing traditional flight directors to pathway concepts, pilot performance (in terms of flight technical error) was significantly better with the pathway concepts. In addition, the pathway concept decreased workload and enhanced SA. By having increased SA of future-related events, the pilots experienced reduced workload, which allowed for better management of secondary tasks. Results from this study also supported their hypothesis that cognitive capture associated with pathway displays can be alleviated by the application of conformal symbology in a head-up location. The use of conformal pathway symbology in combination with a synthetic runway outline on a HUD facilitated increased SA of events in the far domain that were near to or were overlaid by the symbology. Implications of Pathway Research for SVS HUD Design
Prinzel et al.30 demonstrated that the presence of a pathway display on a head-down synthetic vision system substantially enhances situation awareness and lower mental workload during operationally complex, low-visibility approaches. Moreover, the results evinced that the type of pathway-in-the-sky format substantially affects the amount of benefit afforded by the tunnel presentation. Snow and French28 also further confirmed the efficacy of pathway presentation for design of SVS head-up displays. However, these researchers did not evaluate different pathway format options as Prinzel et al. did for head-down synthetic vision displays, and instead compared a single rudimentary pathway presentation to traditional MIL-STD HUD symbology. Although this tunnel concept was superior to the traditional symbology format, it remains whether other pathway-in-the-sky displays may further enhance the efficacy of these types of displays for synthetic vision HUDs.
9
Head-Up Displays and Attention Capture
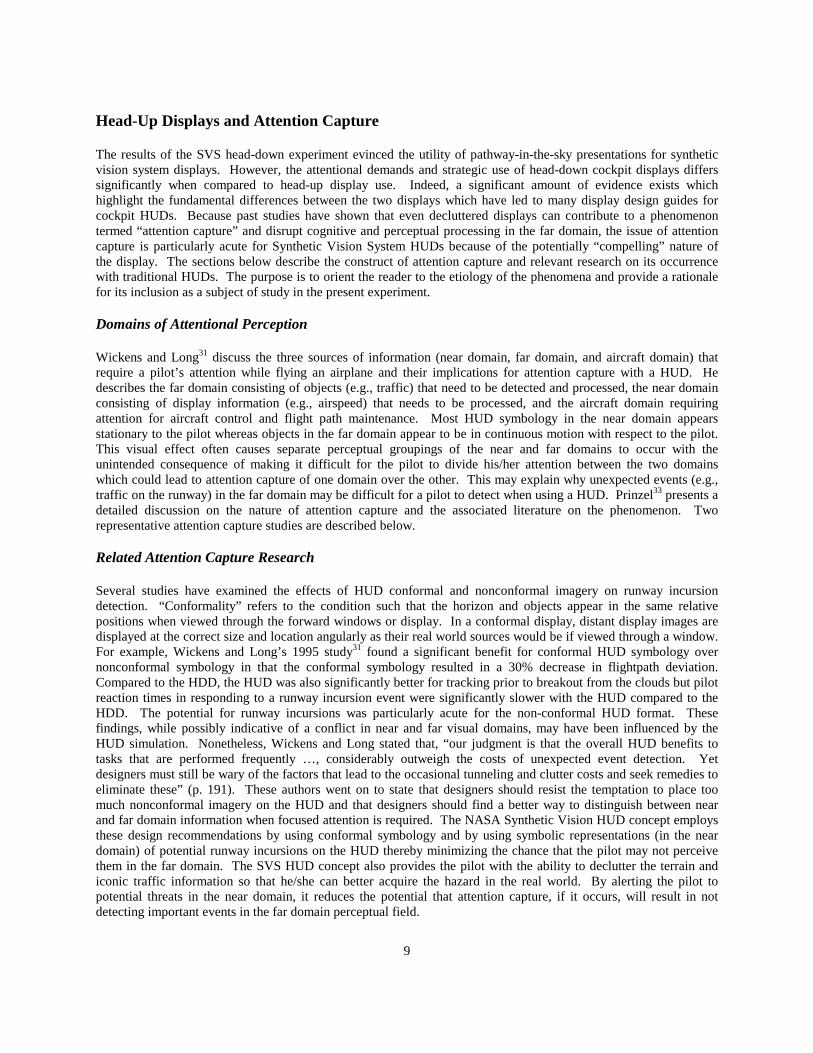
The results of the SVS head-down experiment evinced the utility of pathway-in-the-sky presentations for synthetic vision system displays. However, the attentional demands and strategic use of head-down cockpit displays differs significantly when compared to head-up display use. Indeed, a significant amount of evidence exists which highlight the fundamental differences between the two displays which have led to many display design guides for cockpit HUDs. Because past studies have shown that even decluttered displays can contribute to a phenomenon termed “attention capture” and disrupt cognitive and perceptual processing in the far domain, the issue of attention capture is particularly acute for Synthetic Vision System HUDs because of the potentially “compelling” nature of the display. The sections below describe the construct of attention capture and relevant research on its occurrence with traditional HUDs. The purpose is to orient the reader to the etiology of the phenomena and provide a rationale for its inclusion as a subject of study in the present experiment. Domains of Attentional Perception
Wickens and Long31 discuss the three sources of information (near domain, far domain, and aircraft domain) that require a pilot’s attention while flying an airplane and their implications for attention capture with a HUD. He describes the far domain consisting of objects (e.g., traffic) that need to be detected and processed, the near domain consisting of display information (e.g., airspeed) that needs to be processed, and the aircraft domain requiring attention for aircraft control and flight path maintenance. Most HUD symbology in the near domain appears stationary to the pilot whereas objects in the far domain appear to be in continuous motion with respect to the pilot. This visual effect often causes separate perceptual groupings of the near and far domains to occur with the unintended consequence of making it difficult for the pilot to divide his/her attention between the two domains which could lead to attention capture of one domain over the other. This may explain why unexpected events (e.g., traffic on the runway) in the far domain may be difficult for a pilot to detect when using a HUD. Prinzel33 presents a detailed discussion on the nature of attention capture and the associated literature on the phenomenon. Two representative attention capture studies are described below. Related Attention Capture Research
Several studies have examined the effects of HUD conformal and nonconformal imagery on runway incursion detection. “Conformality” refers to the condition such that the horizon and objects appear in the same relative positions when viewed through the forward windows or display. In a conformal display, distant display images are displayed at the correct size and location angularly as their real world sources would be if viewed through a window. For example, Wickens and Long’s 1995 study31 found a significant benefit for conformal HUD symbology over nonconformal symbology in that the conformal symbology resulted in a 30% decrease in flightpath deviation. Compared to the HDD, the HUD was also significantly better for tracking prior to breakout from the clouds but pilot reaction times in responding to a runway incursion event were significantly slower with the HUD compared to the HDD. The potential for runway incursions was particularly acute for the non-conformal HUD format. These findings, while possibly indicative of a conflict in near and far visual domains, may have been influenced by the HUD simulation. Nonetheless, Wickens and Long stated that, “our judgment is that the overall HUD benefits to tasks that are performed frequently …, considerably outweigh the costs of unexpected event detection. Yet designers must still be wary of the factors that lead to the occasional tunneling and clutter costs and seek remedies to eliminate these” (p. 191). These authors went on to state that designers should resist the temptation to place too much nonconformal imagery on the HUD and that designers should find a better way to distinguish between near and far domain information when focused attention is required. The NASA Synthetic Vision HUD concept employs these design recommendations by using conformal symbology and by using symbolic representations (in the near domain) of potential runway incursions on the HUD thereby minimizing the chance that the pilot may not perceive them in the far domain. The SVS HUD concept also provides the pilot with the ability to declutter the terrain and iconic traffic information so that he/she can better acquire the hazard in the real world. By alerting the pilot to potential threats in the near domain, it reduces the potential that attention capture, if it occurs, will result in not detecting important events in the far domain perceptual field.

10
Few studies are available that allow comparison of results to that posited for a synthetic vision HUD. One exception was reported by Hofer, Braune, Boucek, & Plaff32. The second study investigated attention capture on a high speed civil transport (HCST) external vision systems display that was slated to use high definition cameras to portray the outside world to the pilots. The HSCT program was a precursor to SVS and shares many commonalities in objectives and system display design. As part of the Boeing HSCT Tactical Flight Path Management effort, Hofer, Braune, Boucek, & Plaff32 conducted a fixed-base simulation experiment to investigate whether a “minimum symbol set” was sufficient for use with an external vision system. Twelve pilots performed HSCT noise abatement takeoffs and approach scenarios at 3,000 ft. on a base leg to the final approach. Unlike a real HUD, the external vision system used a superposition of out-the-window imagery and symbology on an uncollimated monitor. In this test, the out-the-window imagery was simulated by computer-generated graphics for the external vision system. Pilots manually flew the scenarios in the Boeing R-cab simulator that simulated the HSCT cockpit with a version of the HSCT “quickened” GAMMA/dot V control law. Autothrottles were used and turbulence was set at 3 ft/sec. and crosswind at 15 knots. During each scenario, pilots experienced one of several events: (a) display events (i.e., frozen speed during takeoff; frozen altitude or DME during approach); (b) scene events (i.e., truck or airplane incursion during takeoff or approach); and display+scene events (i.e., scene event represented an airplane or parked truck that needed to be monitored for possible incursion). Pilots also were required to perform an airplane visual detection task and to report traffic when detected. The weather was simulated VMC with unlimited visibility down to IMC with a 100ft Decision Height. Each pilot performed 4 takeoffs and 4 approaches with both the HUD and HDD displays for a total of 16 runs per pilot. Across the 12 pilots, there were a total of 192 events with 72 serious enough to have produced an “accident” if the pilot missed the event. For the HUD condition, 35.6% of the events were missed and 26% of the HDD events were missed. All the missed events for the HUD condition would have actually caused an accident (as opposed to an incident only). None of the accident events were missed with the HDD. Said another way, all the missed events with the HDD would have resulted in an incident, not an accident. The authors concluded that, “The results obtained in the present study are consistent with the HUD research results, which have accumulated over a period of 20 years and which, have shown that pilot performance of the detection of unexpected events is generally worse when a HUD is present. The results of this study are even more convincing since the pilots had knowledge about the type of events that could occur. They knew an event would occur, however they were not told about the exact nature of the specific event” (ref. 32, p.2). The authors went on to state that,
“A common misconception about the use of HUD technology is that the information presented on the HUD can be processed by the pilot in parallel with the information present in the outside visual scene. The data presented here together with the already existing research provide very strong evidence against this idea. When superimposing compelling information (e.g., data, symbology, etc.) on the outside visual scene a conscious attention switch by the pilot is required in order for him/her to be able to process the information. Furthermore, if the information/task combination creates a higher workload situation (e.g., approach/landing in low visibility conditions) this attention switch becomes even more difficult to perform. Pilots think they are seeing everything because all the information is being presented in their visual field when in fact they are not attending and processing everything “(p. 2).
Prinzel33 reviewed the literature on attention capture and the evidence clearly documents the phenomenon of the construct and the dangers possible when human factors are not considered in the design of head-up displays. The concern may be more acute with a synthetic vision system head-up display because of its potential compelling nature. Although Snow and French28 reported that a conformal synthetic vision HUD did not contribute to attention capture, it is important to gather further confirmation of this finding in light of a body of literature documenting the phenomena for more traditional HUDs. Consequently, an objective of the current study was to investigate the construct of attention capture with synthetic vision HUDs.
Current Study
This study’s goal is to empirically evaluate different tunnel formats as part of a SVS head-up display, and examine their impact on cognitive information processing. To accomplish this research goal, a flight simulation experiment was conducted to examine the efficacy of pathway and guidance concepts for synthetic vision head-up displays. Two tunnel formats (dynamic, minimal), which were found to be effective in an SVS head-down display application

11
(see Appendix A), were evaluated against a baseline condition (no tunnel) during approaches to Reno-Tahoe International airport (RNO) using the 16R Sparks Visual Arrival under IMC. Only two tunnel formats were used in the experiment to keep the scope of the test reasonable. The minimal tunnel was selected as one of the tunnel formats (over the pathway and box tunnel concepts - see Introduction under Synthetic Vision Head-Down Display Pathway Research for tunnel definitions) based on the concern that clutter would be more detrimental for a monochrome HUD than a full color PFD. Past studies3,5,29 have shown that the path deviation indicators (present on all display concepts including baseline in the current study) and the pursuit guidance symbology used in conjunction with the flight path vector can compensate for the limited path information provided by the minimal tunnel concept. On the contrary, the box tunnel, based on the HDD evaluation results (see Appendix A), was felt to be a poor candidate for the HUD because of its predominance of clutter. The pathway tunnel presentation was considered, but the results of the HDD evaluation were similar to the dynamic tunnel. Thus it was reasoned that the HUD results between these two tunnel concepts would be comparable so the pathway tunnel was not included in the evaluation. Two guidance cues (tadpole, ghost) that were found to be equally effective in an SVS head-down application were also evaluated to assess their influence on the tunnel format evaluations. Note that the tadpole and ghost guidance cues were driven with the same guidance algorithm. A “rare event” runway incursion scenario, unannounced to the evaluation pilot, was also presented to evaluate “attention capture” issues associated with SVS HUDs.
Experiment Objectives
The objectives of this experiment were to: 1) evaluate the efficacy of tunnel concepts for an SVS head-up display; 2) evaluate two different guidance cues and assess their influence on the tunnel format evaluations; 3) compare SVS concepts to a baseline concept in terms of workload and situation awareness; 4) compare SVS concepts to a baseline concepts in terms of flight technical error and required navigation performance (see Appendix B) and 5) evaluate “attention capture” issues associated with an SVS HUD.
Hypotheses
1. No significant differences would be found for flight technical error or required navigation performance between the tunnel and guidance concepts tested, including the baseline (no tunnel) concept.
The baseline display does not have a tunnel whereas the synthetic vision pathway displays have either a minimum or dynamic tunnel presentation. The presence or absence of the tunnel presentation represents the only marked difference between the displays. The guidance cues (e.g., pursuit guidance cue, path deviation indicators), on the other hand, are essentially identical and provide the same path guidance information. Past research has shown that with advanced guidance information (used in conjuction with a flight path marker) the tunnel presentation is relegated to a situation awareness enhancement tool for the pilots; that is, they use the pathway for strategic management of the upcoming flight path.
2. Significant differences will be found between baseline concept (no tunnel) and synthetic vision system
pathway displays for situation awareness and workload. Pilots will rate the pathway-in-the-sky displays as contributing to higher situation awareness and lower workload.
Because the tunnel presentation provides a perspective of the error margins and boundary conditions, it allows for mental model development of the flight path flown. Pilots do not have to follow an error-nulling strategy of high precision matching of the flight path marker to the pursuit guidance cue. Therefore, the presence of the tunnel allows the pilot to engage in error-neglecting control with a greater error tolerance leading to reduced mental workload and higher situation awareness.

12
3. Pilots will rate situation awareness higher and mental workload lower while flying the dynamic pathway concept compared to the minimal tunnel concept.
The head-down synthetic vision system pathway experiment showed significant differences between the minimum tunnel (“crow feet”) and dynamic tunnel presentation. Pilots reported that the dynamic tunnel concept provided greater situation awareness of upcoming turns which allowed them to strategically plan and maneuver the aircraft better leading to lower workload.
The hypothesis, however, may be tempered by the acute differences between head-down and head-up displays. Because of the requirement to be able to “look through” the display to the far domain, HUD symbology tends to be characterized by a lower clutter subset of symbology typically found in a head-down counterpart. Therefore, it is important to evaluate the effects of the two tunnel formats to determine whether the increase clutter costs of the dynamic tunnel presentation outweigh the situation awareness benefits found in the head-down pathway experiment.
4. The effects of the guidance cue symbology will significantly interact with tunnel format. The dynamic
tunnel concept paired with the ghost symbology will result in the highest situation awareness. The no tunnel/tadpole combination is hypothesized to result in the lowest situation awareness.
Both the dynamic tunnel and ghost guidance cue symbology present the most information to the pilot allowing for strategic flight path maintenance. As described in hypothesis #2, pilots would report that the presence of the tunnel would significantly enhance their situation awareness and lower workload. However, the combination of no tunnel concept with the tadpole guidance symbology would present little additional flight path information than that gathered from the navigation display and path deviation indicators.
5. No significant results would be found between the tunnel and guidance concepts for attention capture. It is
hypothesized that pilots will not encounter a runway incursion event regardless of the tunnel and guidance cue combination.
The NASA Synthetic Vision System concept uniquely declutters the synthetic terrain and pathway symbology on the HUD display at 200 feet Above Field Level (AFL) in order to allow the pilot to transition to the outside world view and capture the far domain information. Therefore, it is hypothesized that, without the compelling near domain information to disrupt scan, pilots will be more easily able to detect off-nominal events in the far domain.
Methodology
Test Subjects
Nine pilots, representing four airlines and a major transport aircraft manufacturer, participated in the experiment. All participants were HUD qualified and B-757 type-rated. The subjects had an average of 683.7 hours of HUD flying experience and an average of 9.7 years and 12.2 years of commercial and military flying experience, respectively. Simulation Facility
The experiment was conducted in the Integration Flight Deck (IFD) simulation facility (see Fig. 4) at NASA LaRC. The IFD is a fixed based simulator of a Boeing 757-200 cockpit and provides researchers with a full-mission simulator capability.34 The simulation cockpit is populated with flight instrumentation, including the overhead subsystem panels, to replicate the B-757 and uses the same pilot controls as NASA LaRC’s experimental B757 aircraft known as the Airborne Research Integrated Experiment System (ARIES). It also employs a large field of view, collimated, out-the-window visual system.

13
HUD
SVS-RD
Figure 4. Integration Flight Deck simulation facility with HUD and SVS-RD. The subjects occupied the left seat of the IFD for this experiment. This position was furnished with an overhead HUD projection unit and a head down SVS Research Display (SVS-RD) (see Fig. 4).
Head-Up Display
The Dassault projection HUD was interfaced with an experimental Flight Dynamics Head-Up Guidance System (HGS)-4000 computer. The HGS-4000 computer is stroke-on-raster capable using an RS-343 raster video format input. The HGS-4000 “Primary Mode” stroke symbology set was used as the baseline, albeit with the compass rose symbol set and other miscellaneous alphanumeric indicators removed. In addition, the advanced pathway and guidance symbologies were drawn in stroke. The SVS terrain database was rendered on the raster channel. The field of view of the HUD was measured to be 22o vertical by 28o horizontal. The following HUD brightness and contrast controls were selectable by the pilot: a) overall brightness of the HUD, b) Stroke-only brightness; c) Raster image (SVS terrain imagery) brightness; and d) Raster image contrast. SVS-RD
The SVS-RD consists of two independent XGA (1024x768 resolution) LCDs tiled together to generate the PFD (left display) and ND (right display). The PFD and ND were rendered to be Size D (6.4 inch square display surface) with a resulting resolution of approximately 100 pixels per inch. The SVS-RD was installed over the forward instrument panel cluster on the left hand side of the IFD cockpit (see Fig. 4). The captain’s mechanical standby instruments (attitude direction indicator, airspeed, and altitude) were not covered by the SVS-RD.
Evaluation Tasks
Pilot participants flew the Sparks Visual Arrival (also referred to as the Sparks East Approach) to RNO Runway 16R under simulated IMC. The approach was manually-flown with the autothrottles engaged to maintain an approach speed of 138 knots. The aircraft was configured for landing prior to each run (landing gear down and flaps set to 30 degrees). At 500 feet Above Ground Level, the aircraft would break out of the clouds and the pilots were instructed to land if it was safe; otherwise, they were instructed to execute a go-around maneuver. The data run ended at either touchdown or go-around. For some of the runs, pilots were instructed by simulated ATC to fly “direct-to” the waypoint MCRAN at the KNB16 waypoint (see Fig. 5). Pilots were instructed to follow this request which required them to fly outside of the tunnel at KNB16 and recapture at MCRAN. The purpose of this maneuver was to gather subjective data on the pilot’s ability to reacquire the tunnel. Also, on the dynamic tunnel concept, when the aircraft was outside the tunnel,

14
the tunnel would be rendered as a completely connected box tunnel with one side open (i.e., resembling a trough) to indicate how the pilot was to return to the tunnel (see Fig. 3). From previous experiments and flight tests, giving the pilots the ability to declutter the HUD (i.e., removal of the tunnel, terrain, and symbology from the display) was found to be very beneficial. However, for this experiment, the synthetic terrain and the tunnel were automatically removed (decluttered) at 200 feet AFL since this procedure was established as a key operational feature of the SVS-HUD implementation. Consequently, manual decluttering of the terrain and tunnel was not permitted in this experiment to eliminate decluttering as a possible covariate in the statistical analyses.
KNB16MCRANDirect to MCRAN.
Descend and maintain 6200 MSL. Cross at or
above 6200
Cleared for approachTo 16R ILS Freq 110.90
Re-enter Tunnel
End Run @ Touchdown
1
2
3
4
NuggetHotel
GolfCourse
Sparks(Noise Sensitive)
HiltonHotel
MUSTANGVOR
16R4
3
2
1
Sparks East Nominal Run
Sparks East ATC Run
Sun Valley(Noise Sensitive)
“ATC Run” Events:
Figure 5. Evaluation tasks for Sparks East Visual Arrival to runway 16R.
Independent Variables
The independent variables were tunnel concept (no tunnel, minimal, dynamic), guidance symbology (tadpole, ghost), and pilot. Tunnel Concepts
Two tunnel concepts (dynamic and minimal) and a baseline (no tunnel) were evaluated (see Fig. 6) on the SVS HUD. The tunnel presentation on the HUD had some minor differences from that used in the head-down pathway experiment30. In particular, the tunnels were drawn in stroke and were green since the HUD was monochrome. Both tunnel concepts (dynamic and minimal) on the HUD displayed 5 segments of the path ahead at 0.2 nautical mile increments and there was no fading or haloing of these elements. Guidance Concepts
Two guidance symbologies (tadpole and ghost) (see Fig. 6) were evaluated with each tunnel concept (dynamic and minimal). The SVS HUD no tunnel baseline condition only used the tadpole guidance symbol. The tadpole guidance symbology is currently used in some military aircraft HUDs (e.g., F-16). The same head-down display suite (PFD and ND) was used for each HUD run (see Fig. 7). The PFD used conventional symbology and used the tadpole guidance symbol with no tunnel and the ND was enhanced with TAWS.

15
Figure 6. Head-up tunnel concepts and guidance symbologies.
Figure 7. Head-down display suite: PFD (left picture) and ND (right picture).

16
Experiment Design
In this experiment, the three tunnel concepts (no tunnel, minimal, and dynamic) and the two guidance symbologies (tadpole and ghost) were varied; however, the ghost guidance and no tunnel combination was not used. The experiment design matrix is shown in Table 1. All independent variables were treated as fixed-effects variables and the pilot variable was treated as a random-effect variable.
Table 1. Experimental Run Matrix
Tunnel Type Guidance Type No Tunnel Minimal Tunnel Dynamic Tunnel
Tadpole 3 reps 3 reps 3 reps Ghost N/A 3 reps 3 reps
Organization of Trials
Each pilot flew 5 different tunnel and guidance combinations (hereinafter referred to as tunnel/guidance concepts) with 3 repetitions of each for a total of 15 data runs (see Table 1). The initial starting position was randomly varied from the Mustang VOR with respect to the desired flight path over the 3 repetitions: 1) 1000 feet high, 2) 1000 feet right, and 3) 500 feet low/500 feet left. The five different tunnel/guidance concepts (no tunnel with tadpole, minimal tunnel with either tadpole or ghost and dynamic tunnel with either tadpole or ghost) were also randomly assigned. Finally, there were two evaluation tasks: 1) nominal Sparks 16R Visual Approach, but flown under IMC, and 2) a “cut-the-corner” scenario in which the pilot was instructed by a simulated Air Traffic Control call to leave the tunnel and fly “direct to” the MCRAN waypoint (see Fig. 5). The latter scenario required the pilot to utilize the navigation display (i.e., using the turn predictor symbol to acquire the heading) and later, to use the guidance symbology and velocity vector to reenter the tunnel (if present) at the MCRAN waypoint. Of the three repetitions with each tunnel/guidance combination, two were with the nominal Sparks 16R Visual Approach evaluation task and one was with the “cut-the-corner” evaluation task. A runway incursion event was randomly assigned to one of the 15 evaluation runs for each pilot to evaluate “attention capture.” The incurring aircraft was a Boeing 737 aircraft that had crossed over the hold short line on the approach end of RNO Runway 16R (see Fig.8). In the other 14 runs, the Boeing 737 stopped before the hold-short line. There was no indication to the pilots of the incurring aircraft’s location other than by visual observation (i.e., Runway Incursion Prevention System (RIPS) technology35 was not used during the test.)
Nominal RunNominal Run Runway IncursionRunway Incursion
Figure 8. B-737 aircraft in nominal hold position and in runway incursion position.

17
Dependent Measures for the Objective Data Analyses
Root-mean-square (RMS) calculations of lateral and vertical path error were used as the measures for flight path performance on the nominal (not the ATC runs) Sparks East approach runs only. The data were analyzed by Analysis of Variance (ANOVA) across pilot, tunnel concept (no tunnel, minimal, dynamic), and guidance symbology (tadpole, ghost). The main factor, pilot, was treated as a random-effect variable while the other main factors, tunnel concept and guidance symbology, were treated as fixed-effects variables. Within the ANOVAs, only main effects and the second order interaction between tunnel concept and guidance symbology were tested. Higher order interactions were pooled into the experimental error term. Separate ANOVAs were also performed on the RMS lateral and vertical path error with pilot (random-effect variable) and tunnel/guidance concept (fixed-effect variable) as the main factors. Within these ANOVAS, only the main effects were tested. For statistically significant factors revealed by the ANOVAs, Student-Newman-Keuls (SNK) tests (at a 5-percent significance level) of individual means were performed at appropriate stages in the analyses. In addition, FTE was used to determine what level of Required Navigation Performance (RNP) criteria the pilots could achieve while hand-flying the approach. RNP is a statement of the navigation performance accuracy necessary for operation within a defined airspace.39 RNP operations are only allowed if for at least 95% of the time the navigational performance in the horizontal plane is less than the applicable RNP number. For example, RNP-1 means that for at least 95% of the time the navigational performance in the horizontal plane, or the total horizontal system error, is less than 1.0 nmi. Vertical navigation (VNAV) capability further enhances flight operations by enabling the specification of a flight path vertically for the lateral flight path. VNAV ensures that for at least 99.7% of the time the navigational performance in the vertical plane, or the total vertical system error, is less than a specified altitude deviation measure based on the airspace being flown in (below 5000 feet MSL, 5000-10000 feet MSL, above 10000 feet MSL) and the type of flight operation (level flight/climb/descent or flight along specified vertical profile) being performed.39 FTE computations (which are one component of RNP calculations) were made from the recorded quantitative path error data for the Sparks East approaches. These data were analyzed over the entire approach segment using histogram analyses. The lateral and vertical RNP bins are defined in Table 2 and Table 3. The bin values were selected to range across current-generation aircraft RNP values (≥ 0.1 nmi) with finer gradation below these values in case the advanced tunnel/guidance concepts provided measurable improvement in FTE. The number of occurrences in each bin was totaled and this total bin value was divided by the total number of occurrences over the entire approach to determine the percentage of occurrences for each bin to form the histograms.

18
Table 2. Lateral Navigation Performance Bin Definitions
Bin Number
Lateral Navigation Performance Range Window, x
(nmi) 1 x>2.0 2 2.0≥x>1.5 3 1.5≥x>1.0 4 1.0≥x>5 5 .5≥x>.45 6 .45≥x>.4 7 .4≥x>.35 8 .35≥x>.3 9 .3≥x>.25 10 .25≥x>.2 11 .2≥x>.15 12 .15≥x>.1 13 .1≥x>.05 14 .05≥x>-.05 15 -0.05≥x>-0.1 16 -0.1≥x>-0.15 17 -0.15≥x>-0.2 18 -.2≥x>-.25 19 -.25≥x>-.3 20 -.3≥x>-.35 21 -.35≥x>-.4 22 -.4≥x>-.45 23 -.45≥x>-.5 24 -.5≥x>-1.0 25 -1.0≥x>-1.5 26 -1.5≥x>-2.0 27 -2.0≥x
Table 3. Vertical Navigation Performance Bin Definitions
Bin Number
Vertical Navigation Performance Altitude Window, x
feet) 1 x>300 2 300≥x>250 3 250≥x>200 4 200≥x>150 5 150≥x>100 6 100≥x>50 7 50≥x>-50 8 -50≥x>-100 9 -100≥x>-150 10 -150≥x>-200 11 -200≥x>-250 12 -250≥x>-300 13 -300≥x

19
Dependent Measures for the Subjective Data Analyses
Qualitative pilot ratings and comments were collected both during the data collection and in post-test interviews. After each run, the pilots completed 3 questionnaires: 1) the Air Force Flight Technical Center (AFFTC) Revised Workload Estimation Scale36, 2) Situation Awareness Rating Technique (SART)37, and 3) six Likert-type (7-point) questions specific to tunnel and guidance symbology evaluation (see Figures in Appendix C). The AFFTC technique allows a statistical analysis of the pilot’s subjective assessment of mental workload. The SART measures the pilot’s knowledge in three areas: 1) demands on attention resources, 2) supply of attention resources, and 3) understanding of the situation. The response to the three SART statements were used to create a single SA score based on the formula that SA = (Understanding - (Demand – Supply)). After the 15 data collection runs were done, pilots completed two separate Situation Awareness – Subjective Workload Dominance (SA-SWORD)38 and Subjective Workload Dominance (SWORD)37 tests: one for tunnel concept (Baseline, Minimal, Dynamic) comparisons and another for tunnel and guidance cue comparisons. By using a paired-comparisons technique, SA-SWORD allows a statistical analysis of the pilot’s subjective assessment of the situation awareness and SWORD allows a statistical analysis of the pilot’s subjective assessment of mental workload. The pilots also participated in a semi-structured interview to elicit comments on the tunnel and guidance concepts. Separate ANOVAs were performed on the mean rankings for the AFFTC workload rating, SART SA rating, SA-SWORD SA rating, and SWORD workload rating with tunnel/guidance concept and pilot as the independent variables. ANOVAS were also performed on the SA-SWORD SA ratings and SWORD workload ratings with tunnel concept and pilot as the independent variables. For statistically significant factors revealed by the ANOVAs, SNK tests (at a 5-percent significance level) of individual means were performed at appropriate stages in the analyses. Procedure
The subjects were given a 1-hour briefing to explain the SVS concept and the expected evaluation tasks. After the briefing, a 1-hour training session in the IFD was conducted to familiarize the subjects with the aircraft handling qualities, display symbologies and controls. The ‘rare-event’ scenario was not discussed, although the pilot’s responsibility for maintaining traffic surveillance at all times was stressed. Data collection lasted approximately 3 hours followed by a 1-hour semi structured interview. The entire session including lunch and breaks lasted approximately 6 hours.
Results
Objective data results are presented from ANOVAs and histogram analyses and subjective data results are presented from ANOVAs and pilot comments. Objective Results
Path Performance
Separate ANOVAs were performed on the RMS lateral and vertical path error with tunnel concept (no tunnel, minimal, dynamic), guidance symbology (tadpole, ghost) and pilot as the independent variables (see Fig. 9). No significant differences (p>.05) were found for tunnel concept, guidance symbology, or the interaction between these two main factors for either the RMS lateral or RMS vertical path error measure. Separate ANOVAs were also performed on the RMS lateral path error and the RMS vertical path error with tunnel/guidance concept (No tunnel/tadpole, Minimal/tadpole, Minimal/ghost, Dynamic/tadpole, Dynamic/ghost) and pilot as the independent variables. No significant differences (p>.05) were found for the tunnel/guidance concept for either the RMS lateral

20
or RMS vertical path error measure. Across all pilots and all concepts, the mean RMS lateral path error was 69 feet (standard deviation of 12 feet) and the mean RMS vertical error was 38 feet (standard deviation of 2 feet).
88
68
61
70
56
42
37 36 37 37
0
20
40
60
80
100
No Tunnelw/ Tadpole
Minimal Tunnelw/ Tadpole
Minimal Tunnelw/ Ghost
Dynamic Tunnelw/ Tadpole
Dynamic Tunnelw/ Ghost
RM
S P
ath
Err
or, f
eet
RMS Lateral Path ErrorRMS Vertical Path Error
Figure 9. RMS lateral and verical path error for tunnel/guidance concepts tested. RNP Performance
Lateral Navigation Analyses. Lateral path FTE histograms were generated on the nominal Sparks 16R Approach runs for the five tunnel/guidance concepts (Baseline with tadpole, Minimal with tadpole or ghost, and Dynamic with tadpole or ghost). Since the initial starting position for each run was outside the tunnel, the histogram analyses were not initiated until the pilot had entered the tunnel for the first time. The path steering error component of the RNP calculation includes both FTE and display error. For this analysis, it was assumed that display error was negligible, so FTE was the only component of path steering error. It was also assumed that the other two components (path definition error and position estimation error) of the RNP calculation would be equivalent across the display concepts evaluated. With these assumptions, all tunnel/guidance concepts yielded a horizontal FTE navigational accuracy of 0.05 nmi at least 95% of the time. These results are consistent with other NASA studies4,29 that showed advanced pathway guidance concepts utilizing flight path-centered symbology can enable manual RNP operations with lateral FTE of 0.05 nmi. Manual flight using traditional flight directors has been shown to yield a lateral FTE of 0.25 nmi.5 Vertical Navigation Analyses. Vertical path FTE histograms were generated on the nominal Sparks 16R Approach runs for the five tunnel/guidance concepts (Baseline with tadpole, Minimal with tadpole or ghost, and Dynamic with tadpole or ghost). Since the initial starting position for each run was outside the tunnel, the histogram analyses were not initiated until the pilot had entered the tunnel for the first time. The vertical path steering error component of the VNAV performance calculation includes both FTE and display error. For this analysis, it was assumed that display error was negligible so FTE was the only component of vertical path steering error. It was also assumed that the other three components (altimetry system error, vertical path definition error, and horizontal coupling error) of the VNAV performance calculation would be equivalent across the display concepts evaluated. In addition, it was assumed that the pilot was flying a specified vertical profile so that the required vertical navigation performance accuracy was 300 feet.39 With these assumptions, all tunnel/guidance concepts yielded a vertical FTE navigational accuracy of 300 feet at least 99.7% of the time.

21
These lateral and vertical FTE navigational accuracies are consistent with previous research results using SVS-enhanced displays with advanced pathway guidance concepts.4,29
Subjective Results
Situation Awareness
Two techniques, SART and SA-SWORD were used to evaluate the pilot’s situation awareness with the five different tunnel/guidance concepts tested in this experiment. In addition, the SA-SWORD technique was also used to evaluate the pilot’s SA with the tunnel concepts tested in this experiment.
SART Ratings After each run, pilots completed the SART for the tunnel/guidance concept they had just flown. The SART measures the pilot’s knowledge in three areas: 1) demands on attention resources, 2) supply of attention resources, and 3) understanding of the situation. The response to the three SART statements were used to create a single SA score based on the formula that SA = (Understanding - (Demand – Supply)). The overall rank order of the mean ratings from greatest to least SA was: Dynamic tunnel/ghost, Minimal tunnel/ghost, Minimal tunnel/tadpole, Dynamic tunnel/tadpole, and No tunnel/tadpole. An ANOVA was performed on the mean rankings with tunnel/guidance concept and pilot as the independent variables. Tunnel/guidance concept (F(4,122)=3.701, p=.007) was highly significant for this measure. Post-hoc tests (using SNK with α=.05) showed two overlapping subsets (see Fig. 10): 1) Dynamic tunnel/ghost, Minimal tunnel/ghost, Minimal tunnel/tadpole, Dynamic tunnel/tadpole and 2) Dynamic tunnel/tadpole, No tunnel/tadpole (Baseline condition).
Figure 10. SART ratings for the tunnel/guidance concept tested.
No Tunnel/Tadpole (Lowest SA)
Minimal/Tadpole
Dynamic/Tadpole
Dynamic/Ghost (Highest SA)
Minimal/Ghost
Subset 1
Subset 2
Increasing SA
Dynamic/Tadpole
Increasing SA

22
SA-SWORD Ratings Pilots completed one paired-comparison SA-SWORD38 for tunnel/guidance concepts and one for tunnel concept following the completion of testing. SA-SWORD allows a statistical analysis of the pilot’s subjective assessment of situation awareness. For this exercise, SA was defined as: The pilot’s awareness and understanding of all factors that will contribute to the safe flying of their aircraft under normal and non-normal conditions. Tunnel/guidance concepts. The SA-SWORD responses for tunnel/guidance concepts were averaged and the overall rank order from greatest to least SA was: Dynamic tunnel/ghost, Minimal tunnel/ghost, Dynamic tunnel/tadpole, Minimal tunnel/tadpole, and No tunnel/tadpole. An ANOVA was performed on the mean rankings with tunnel/guidance concept and pilot as the independent variables. Tunnel/guidance concept (F(4,32)=7.481, p<.001) was highly significant for this measure. Post-hoc tests (using Student-Newman-Keuls, SNK, with α=.05) showed that the Dynamic tunnel/ghost concept had significantly higher SA-SWORD ratings than all other tunnel/guidance concepts tested (see Fig. 11).
Figure 11. SA-SWORD rankings for the tunnel/guidance concepts tested. Tunnel concept. The SA-SWORD responses for tunnel concept only were averaged and the overall rank order from greatest to least SA was: Dynamic tunnel, Minimal tunnel, and Baseline (no tunnel). An ANOVA was performed on the mean rankings with tunnel concept and pilot as the independent variables. Tunnel concept (F(2,16)=17.821, p<.001) was highly significant for this measure. Post-hoc tests (using SNK with α=.05) showed 3 unique subsets: 1) Dynamic tunnel, 2) Minimal tunnel, and 3) No tunnel. The Dynamic tunnel provided significantly higher SA compared to the other two tunnel concepts (minimal and baseline) and the Minimal tunnel provided significantly higher SA than the Baseline concept with no tunnel (see Fig. 12).
No Tunnel/Tadpole (Lowest SA)
Minimal/Tadpole Dynamic/Tadpole
Dynamic/Ghost (Highest SA)
Minimal/Ghost
Subset 1
Subset 2
Increasing SA

23
Figure 12. SA-SWORD rankings for the tunel concepts tested. Mental Workload
Two techniques, AFFTC workload estimate and SWORD were used to evaluate the pilot’s mental workload with the five different tunnel/guidance concepts tested in this experiment. In addition, the SWORD technique was also used to evaluate the pilot’s mental workload with the tunnel concepts tested in this experiment.
AFFTC Workload Estimate Ratings After each run, pilots were asked to provide a workload rating on the tunnel/guidance concept they had just flown by using the AFFTC Workload Estimate Scale. An ANOVA was performed on the mean rankings with tunnel/guidance concept and pilot as the independent variables. No significant differences (p>.05) were found for this workload rating among the tunnel/guidance concepts tested. Overall, the pilots rated the Baseline concept (3.0/7.0) to be slightly higher in workload than the four concepts employing a tunnel: Minimal tunnel/tadpole (2.9/7.0), Minimal tunnel/ghost (2.6/7.0), Dynamic tunnel/tadpole (2.9/7.0) and Dynamic tunnel/ghost (2.8/7.0)/ A rating of “3.0” reflects “moderate activity” that is “easily managed”.
SWORD Ratings Pilots completed one paired-comparison for workload assessment (SWORD37) for tunnel/guidance concepts and one for tunnel concept. SWORD allows a statistical analysis of the pilot’s subjective assessment of mental workload. For this exercise, mental workload was defined as: The amount of cognitive resources available to perform a task and the difficulty of that task. Tunnel/guidance concepts. The SWORD responses for the tunnel/guidance concepts were averaged and the overall rank order from least to greatest workload was: Dynamic tunnel/ghost, Minimal tunnel/ghost, Dynamic tunnel/tadpole, Minimal tunnel/tadpole, and No tunnel/tadpole. An ANOVA was performed on the mean rankings with tunnel/guidance concept and pilot as the independent variables. Tunnel/guidance concept (F(4,32)=30.456, p<.001) was highly significant for this measure. Post-hoc tests (SNK with α=.05) showed that the Baseline concept had significantly higher SWORD ratings than all the other tunnel/guidance concepts tested (see Fig. 13). There were no appreciable differences between the four concepts that employed a tunnel.
No Tunnel (Lowest SA)
Minimal Tunnel Dynamic Tunnel (Highest SA)
Subset 1 Subset 2 Subset 3
Increasing SA

24
Figure 13. SWORD rankings for the tunnel/guidance concepts tested. Tunnel type. The SWORD responses for tunnel concept only were averaged and the overall rank order from least to greatest workload was: Minimal tunnel, Dynamic tunnel, and Baseline (no tunnel). An ANOVA was performed on the mean rankings with tunnel concept and pilot as the independent variables. Tunnel concept (F(2,16)=24.599, p<.001) was highly significant for this measure. Post-hoc tests (using SNK with α=.05) showed that the Baseline concept was rated as having significantly more workload than either the Dynamic or Minimal tunnel formats. There were no appreciable differences between the Minimal and Dynamic tunnel types (see Fig. 14).
Figure 14. SWORD rankings for the tunnel concepts tested. Post-run Questionnaire Results
Six post-run questions (see Fig. 15) were asked of each pilot to help assess specific subjects of interest while flying the approaches with the tunnel/guidance concepts. An ANOVA was performed on the mean rating (1 = “high”; 7 = “low”) for each of those post-run questions with tunnel/guidance concept (five levels: Baseline/Tadpole; Minimal/Tadpole; Minimal/Ghost; Dynamic/Tadpole; Dynamic/Ghost) and pilot as the independent variables. Only Questions 2 and 5 of the six post-run questions (Fig. C3) had significant differences among the tunnel/guidance concepts evaluated. As such, only the results from these two questions will be discussed.
No Tunnel (Highest Workload)
Minimal Tunnel (Lowest Workload)
Dynamic Tunnel
Subset 1 Subset 2
Decreasing Workload
No Tunnel/Tadpole (Highest Workload)
Minimal/Tadpole Dynamic/Tadpole Dynamic/Ghost (Lowest Workload)
Minimal/Ghost
Subset 1
Subset 2
Decreasing Workload

25
Post-run question #2: As I performed the task, my awareness of upcoming turns using the tunnel was ___ Since this question focused specifically on the tunnel, pilot ratings were not collected for the Baseline (no tunnel) concept. Tunnel/guidance concept (F(3,95)=2.774, p=.047) was significant for this rating. Post-hoc tests (using SNK with α=.05) showed that the pilots were least aware of upcoming turns with the minimal tunnel/tadpole guidance symbol concept. Two overlapping subsets were found: 1) Minimal/tadpole (6.0/7.0), Dynamic/tadpole (6.2/7.0), Minimal/ghost (6.2/7.0) and 2) Dynamic/tadpole, Minimal/ghost, Dynamic/ghost (6.4/7.0). The pilots rated the Dynamic tunnel/ghost guidance symbol concept as providing them significantly more awareness of upcoming turns compared to the Minimal tunnel/tadpole guidance symbol concept (see Fig. 15).
Post-Run Question 2: Upcoming Turn Awarness Using the Tunnel
1
2
3
4
5
6
7
Minimum Tunnelw/ Tadpole
Dynamic Tunnelw/ Tadpole
Minimum Tunnelw/ Ghost
Dynamic Tunnelw/ Ghost
Low
High
Subset 1
Subset 2
Figure 15. Rating of pilots’ response to post run question two. Post-run question #5: As I performed the task, my ability to anticipate flight path changes using the guidance symbol was ____ Tunnel/guidance concept (F(4,122)=8.479, p<.001) was highly significant for this rating. Post-hoc tests (using SNK with α=.05) showed two unique subsets: 1) No tunnel/tadpole (5.2/7.0) and 2) Minimal/ghost (5.9/7.0), Minimal/tadpole (5.9/7.0), Dynamic/tadpole (6.0/7.0), Dynamic/ghost (6.1/7.0). These subsets appear to indicate that the presence of the tunnel, rather than the guidance symbology, affected the pilot’s ability to anticipate flight path changes (see Fig. 16).

26
Post-Run Question 5: Flight Path Change Anticipation Using Guidance Symbol
1
2
3
4
5
6
7
No Tunnelw/ Tadpole
Minimal Tunnelw/ Ghost
Minimal Tunnelw/ Tadpole
Dynamic Tunnelw/ Tadpole
Dynamic Tunnelw/ Ghost
Low
High
Figure 16. Rating of pilots’ response to post run question five. Semi-structured Interview Results
A semi-structured interview was conducted after the final experimental run. A number of Likert-type (1 to 7) questions were administered to assess: 1) the effectiveness of the different tunnel (minimal, dynamic) and guidance (tadpole and ghost) concepts; and, 2) the workload associated with leaving the tunnel and reentering the tunnel at the MCRAN waypoint. Figures 17 and 18 illustrate the scales used for the “effectiveness” questions and for the “workload” questions.
1 2 3 4 5 6 7| -------| -------| -------| -------| -------| -------|
CompletelyIneffective
Borderline CompletelyEffective
1 2 3 4 5 6 7| -------| -------| -------| -------| -------| -------|
CompletelyIneffective
Borderline CompletelyEffective
| -------| -------| -------| -------| -------| -------|
CompletelyIneffective
Borderline CompletelyEffective
Figure 17. Likert scale used for rating the effectiveness of the tunnel or guidance concepts.
1 2 3 4 5 6 7| -------| -------| -------| -------| -------| -------|
VeryLow
Moderate VeryHigh
1 2 3 4 5 6 7| -------| -------| -------| -------| -------| -------|
VeryLow
Moderate VeryHigh
| -------| -------| -------| -------| -------| -------|
VeryLow
Moderate VeryHigh
Figure 18. Likert scale used for rating of workload of the tunnel concepts.

27
The results showed that there was no significant difference in rating for effectiveness of tunnels for straight or curved tunnel segments. The trend was that the Dynamic tunnel concept (6.6/7.0 for straight segments & 6.1/7.0 on curved segments) was always rated more effective than the minimal tunnel concept (6.0/7.0 for straight segments & 5.8/7.0 on curved segments). These effectiveness ratings of 6 or greater for both tunnel concepts indicated that both were very effective for depicting flight path for both straight and curved tunnel segments. Pilots commented that they preferred the dynamic tunnel to the minimal tunnel because it provided intuitive path error by giving constant visual feedback. Pilots commented that the crow’s feet of the minimal tunnel were difficult to interpret in turns. An ANOVA was performed on pilot responses to the effectiveness of guidance symbology (tadpole, ghost) to anticipate flight path changes for both straight and curved path segments. A highly significant result was found only for the curved/banked flight path segments, F(1,8)=19.360, p=.002. Pilots rated the tadpole (5.0/7.0) significantly worse than the ghost (6.2/7.0) for SA of future flight path on curved tunnel segments. Another interesting finding was that pilots rated the Baseline concept (4.1/7.0) to have significantly more workload to intercept the path during the “cut-the-corner” scenario, F(4,32)=8.995, p<.001, compared to the four tunnel concepts. For the baseline concept, the pilots did not have a path reference other than a waypoint display on the ND. For the tunnel concepts, when approaching the MCRAN waypoint, the pilots could see the tunnel appear giving a visual reference of the intended path. The Dynamic/ghost concept (2.2/7.0) was also rated as having significantly less workload than the Minimal/tadpole concept (4.1/7.0), but it had no appreciable differences with the Minimal/ghost (2.6/7.0) or Dynamic/tadpole (2.7/7.0) concepts. A workload rating of 2 indicates low workload while a workload rating of 4 indicates moderate workload. During the semi-structured interview, pilots offered the following comments: � The raster terrain on the HUD should be decluttered at a height greater than 200 feet AFL. Opinions varied
on the specific AFL altitude that the terrain should automatically be removed (decluttered) but most thought it should be between 500 and 1000 feet. The reasoning behind this comment is that by decision height (which is typically around 200 feet) a pilot needs to know if they can continue the landing or if they have to perform a go-around. It takes a few seconds for the pilot’s eyes to accommodate from having raster on the HUD to not having it. By increasing the terrain declutter height, the pilot is given adequate time for his eyes to accommodate so that he can begin looking for the visual cues necessary to continue a landing beyond the decision height.
� Although the dynamic tunnel concept added more clutter to the HUD than the minimal tunnel concept, the path awareness benefits afforded by it outweighed the clutter disadvantages.
Runway Incursion Detection
During testing, the principal investigator observed that only one (1/9) of the pilots failed to notice the B-737 aircraft that had crossed over the hold short line onto the active runway. During the post-experimental interview, this pilot acknowledged seeing the aircraft but felt it was too late to initiate the go-around and hence decided to land. The pilot felt that the situation did not pose any danger since he could land the aircraft further down the runway well beyond the incursion aircraft. It should be noted for this experiment by 200 feet AFL the tunnel and the raster terrain had been automatically removed (decluttered) from the HUD. The guidance cue and other flight symbology were still present on the HUD. These results support that the NASA SVS HUD concept does not significantly decrease unexpected event detection. However, to further safeguard against incursions, NASA’s AvSSP is developing technology to create a runway incursion prevention system (RIPS).35

28
Discussion
The objectives of this experiment were to:
1) Compare SVS concepts to a baseline concept in terms of path performance, workload, and situation awareness;
2) Evaluate the efficacy of tunnel/pathway concepts for an SVS head-up display; 3) Evaluate different guidance cues and assess their influence on the tunnel format evaluations; and 4) Evaluate “attention capture” issues associated with an SVS HUD.
Comparing SVS Concepts to Baseline:
The quantitative results of this experiment showed that there was no performance advantage, as measured by Flight Technical Error, to having a tunnel presentation on the HUD. The primary reason was that the display concepts all employed guidance symbology and each pilot in this study had previous experience and training on how to fly with respect to this type of HUD guidance. However, for the no tunnel case, it was more difficult to anticipate the guidance especially for complex approaches. The pilot had to continually monitor the HUD guidance for a change in the guidance cue. As a result, the pilot’s SA was reduced and workload increased compared to configurations that used pathway information. For the tunnel concept display configurations, pilots could intuitively anticipate the guidance change since the intended path was visible via the tunnel. This effect from the tunnel was embedded in the pilots’ reporting a significant decrease in workload, a significant increase in SA, and significant differences in answers to post-run questions compared to the baseline. These advantages of the tunnel allow the pilots to be more proactive in the detection and avoidance of potentially fatal problems or errors. This type of proactive display concept is superior to the current cockpit design paradigm which uses a “caution and warn” system. In the “caution and warn” scenario, the inherent problem is when a pilot receives a caution or warning, SA has already been lost. The system is telling the pilot of a problem he is not already aware of and now must interpret the warning and determine the appropriate response. SVS concepts are being developed to ensure that pilots are always “in-the-loop” and ahead of any pending situation through proactive displays which yield lower workload and higher SA. Efficacy of tunnel/pathway concepts for an SVS head-up display
The data indicated a clear pilot preference and showed statistically significant improvements in SA and workload in using tunnel concepts with SVS HUD concepts. The dynamic tunnel appears viable and consistently provided improved SA. Most of the pilots felt that the growth rate of the dynamic tunnel in response to path error was acceptable but one of the pilots thought the sensitivity of the tunnel may need to be tuned (i.e., make it less sensitive to path error changes). It was hypothesized that the increased path precision provided by the SVS pathway and pursuit guidance presentation would enable pilots to make manual approaches within required navigation performance (RNP) accuracies that normally require area navigation (RNAV) capabilities. The lateral navigation analyses confirmed that FTE for all the SVS display concepts (including baseline) achieved an accuracy of 0.05 nmi for at least 95% of the approach. Similarly, the vertical navigation analyses confirmed that vertical FTE for all SVS display concepts achieved an accuracy of 300 feet for at least 99.7% of the time. Based on these results, it appears that the pursuit guidance symbology (tadpole or ghost) used in conjunction with the flight path marker, rather than the presence of a tunnel itself, was what enabled the pilots to achieve such superior FTE performance. These lateral and vertical FTE navigational accuracies are consistent with previous research results with SVS enhanced displays.4,29
Using the AFFTC workload rating scale, the pilots rated the tunnel (average rating of 2.85) concepts to require less mental workload than the baseline concept, where a rating of 2 equates to “Light Activity; Minimum Demands” and a rating of 3 equates to “Moderate Activity – Easily Managed; Considerable Spare Time”. These results correlated

29
well with the SWORD workload responses in that the Baseline concept was given significantly higher workload ratings than the tunnel concepts tested. These workload ratings clearly indicate that the SVS HUD and advanced pathway guidance concepts support new operational capabilities. These results demonstrate that this equipage can allow VFR-type maneuvers to be performed in IMC conditions. The statistically significant results have shown that the advanced pathway (tunnel) concepts were efficient, required minimal workload to use, and improved SA. Just as important, the results indicate that the tunnel concepts do not degrade, by the addition of display clutter, the basic tenet of a SVS HUD format; that is, the terrain and obstacle awareness. In a post-run question, each pilot assessed the level of their terrain and obstacle awareness. The results were not statistically-different for the advanced pathway concepts or the baseline condition; hence, the addition of advanced pathway information does not degrade the fundamental terrain and obstacle information on the SVS HUD. Evaluate different guidance cues and assess their influence on the tunnel format evaluations
Improved SA and workload was generally associated with the ghost guidance symbol compared to the tadpole. However, the improvements were not overwhelming. The tadpole cue was also shown to be an effective guidance symbol. Previous work5 highlighted some potential drawbacks to the ghost aircraft concept such as large size and potential, particularly initial, confusion in understanding its role as a guidance symbol. These issues were overcome by reducing the symbol size and training the pilots more thoroughly. Evaluate Attention Capture
Results from the rare event (i.e., runway incursion) run suggested that an SVS HUD with terrain and pathway guidance does not lead to decreased unexpected event detection. In other words, the SVS HUD concept flown here did not appear to increase attention capture.
A critically important aspect of this evaluation was the use of a real HUD. The collimated optics design and separate display surfaces between the out-the-window and HUD images are vital visual effects that must be included in any evaluation of HUD attention capture. The positive results shown here for attention capture are even more encouraging considering that this simulation evaluation is still not completely representative of real-world effects. Each pilot gave a post-test rating to represent their subjective assessment of the fidelity of the simulation to real-world operations. Particular consideration was to be given to whether the out-the-window visuals realistically depicted actual traffic on taxiways and runways during CAT IIIa approaches. Using a scale of 1 (completely unrealistic) to 7 (completely realistic), a mean rating of 5.4 (out of 7.0) was given. The simulation fidelity was generally excellent but the luminance and contrast of the out-the-window visuals are still not quite comparable to the real-world. Of particular interest in HUD evaluations, for instance, there was no burn-through effect where real-world objects and light sources can be seen through nominal levels of HUD raster imagery. Without faithful replication of real-world contrast and lighting characteristics, a diminished capacity for attention capture and target recognition should be expected.
Conclusions
Two tunnel formats (dynamic, minimal), which were found to be effective in a Synthetic Vision Systems (SVS) head-down display application, were evaluated on a Synthetic Vision head-up display (HUD) against a baseline condition (no tunnel) during approaches to Reno-Tahoe International airport (RNO) using the 16R Sparks Visual Arrival under simulated instrument meteorological conditions (IMC). These tunnel formats were chosen for the present experiment as they represented the best candidates for SVS HUD applications due to clutter concerns. In addition, two guidance cues (tadpole, follow-me (ghost) aircraft) that were found to be equally effective in an SVS head-down application were evaluated to assess their influence on the tunnel format evaluations.

30
Pilots reported greater situation awareness (SA) and reduced pilot workload with the HUD tunnel/guidance concepts compared to the Baseline concept without a tunnel. The dynamic tunnel concept with the follow-me aircraft guidance symbol produced the lowest workload and provided the highest SA among the tunnel/guidance concepts evaluated. In addition, the follow-me aircraft symbol was rated as being the most effective guidance cue for SA of future flight path for both straight and curved path segments. From the rare event scenarios, it was found that the pathway guidance does not significantly decrease unexpected event detection. These results confirmed findings from an SVS head-down experiment that also found the dynamic tunnel and follow-me aircraft guidance concept to be the best candidate for SVS primary flight display applications.
Future Research
Based on these results, research is currently being conducted at NASA Langley to enhance the dynamic tunnel concept with tactical and strategic display information to help realize 4D RNP capability. In addition, results from this study directly influenced the choice to use the dynamic tunnel concept on the HUD in a flight test evaluation conducted in July/August 2004 by the NASA/Langley Research Center under NASA’s Aviation Safety, Synthetic Vision System Project.40,41 The purpose of this flight test was to examine a synthetic vision system that integrates the enabling technologies (Runway Incursion Prevention System, Synthetic Vision Sensors, and Database Integrity Monitoring Equipment) of SVS. The research objectives focused on the integration of runway incursion prevention technologies, surface map displays, integrity monitoring, enhanced vision sensors, SVS navigation displays, and enhanced synthetic vision primary flight and HUD displays. Together, such a synthetic vision system may considerably help meet national aeronautic goals to “reduce the fatal accident rate by a factor of 5” and to “double the capacity of the aviation system”, both within 10 years.42

31
References
1. Boeing (1998). Statistical summary of commercial jet aircraft accidents, Worldwide Operations, 1959-1997. Seattle, WA: Airplane Safety Engineering, Boeing Commercial Airplane Group.
2. Williams, D., Waller, M., Koelling, J., Burdette, D., Doyle, T., Capron, W., Barry, J., & Gifford, R. (2001). Concept of operations for commercial and business aircraft synthetic vision systems. NASA Langley Research Center: NASA Technical Memorandum TM-2001-211058.
3. Glaab, L.J., Kramer, L.J., Arthur, T., & Barry, J.S. (2003). Flight test comparison of synthetic vision display concepts at Dallas/Fort Worth International airport. NASA Langley Research Center: NASA Technical Paper TP-2003-212177.
4. Kramer, L.J., Prinzel, L.J., Bailey, R.E., & Arthur, J.J. (2003). Synthetic vision enhances situation awareness and RNP capabilities for terrain-challenged approaches. Proceedings of the American Institute of Aeronautics and Astronautics Third Aviation Technology, Integration, and Operations Technical Forum, AIAA 2003-6814, 1-11.
5. Kramer, L.J., Prinzel III, L.J., Bailey, R.E., Arthur III, J.J., & Parrish, R.V. (2004). Flight test evaluation of synthetic vision concepts at a terrain challenged airport. NASA Langley Research Center: NASA Technical Paper TP-2004-212997.
6. Dorighi, N.S., Ellis, S.R., & Grunwald, A.J. (1991). Evaluation of perspective displays on pilot spatial awareness in low visibility curved approaches. In AIAA Computing in Aerospace Conference, AIAA paper 91-3727. Washington, D.C: American Institute of Aeronautics and Astronautics.
7. Parrish, R.V., Busquets, A.M., Williams, S.P., & Nold, D.E. (1994). Spatial awareness comparisons between large-screen, integrated pictorial displays and conventional EFIS displays during simulated landing approaches (NASA Technical Publication No. TP-1994-3467). Washington, D.C.: NASA
8. Regal, D., & Whittington, D. (1995, April). Guidance symbology for curved flight paths. Paper presented at the Eight International Symposium on Aviation Psychology. Columbus, OH.
9. Grunwald, A.J. (1984). Tunnel display for four-dimensional fixed-wing aircraft approaches. Journal of Guidance and Control, 7, 369-377.
10. Grunwald, A.J., Robertson, J.B., & Hatfield, J.J. (1981). Experimental evaluation of a perspective tunnel display for three-dimensional helicopter approaches. Journal of Guidance and Control, 4, 623-631.
11. Below, C., von Viebahn, H., & Hammer, M. (1995). 4D flight guidance displays – An approach to flight safety enhancement. In Proceedings of the SPIE technical conference synthetic vision for vehicle guidance and control, 2463, 137-145. Bellingham, VA: Society for Optical Engineering.
12. Mulder, M. (2003a). An information-centered analysis of the tunnel-in-the-sky display, part one: Straight tunnel trajectories. International Journal of Aviation Psychology, 13, 49-72.
13. Mulder, M. (2003b). An information-centered analysis of the tunnel-in-the-sky display, part two: Curved tunnel trajectories. International Journal of Aviation Psychology, 13, 131-151.
14. Theunissen, E. (1997). Integrated design of a man-machine interface for 4-D navigation. Netherlands: Delft University Press.
15. Bennet, K. B., & Flach, J. M. (1994). When automation fails …. In M. Mouloua & R. Parasuraman (Eds.), Human performance in automated systems: Current research and trends (pp. 229–234). Mahwah, NJ: Lawrence Erlbaum Associates, Inc.
16. Warner, D.A. (1979). Flight Path Displays. AFFDL-TR-79-3075, Wright Patterson AFB, OH.
17. Klopfstein, G. (1976). Rational study of aircraft piloting. Proceedings 03rd Advanced Aircrew Display Symposium, 3, 231-248. Patuxent River, MD: NAVAIR.
18. Cross, K.D., & Cavallero, F.R. (1971). Utility of the vertical contact analog display for carrier landings - A diagnostic evaluation,” Guidance and Control Displays, AGARD CP-96, October 1971, paper 21.
19. Bersome, B. (1967). Interpretability studies of electronic flight instruments. SAAB TN-61. Sweden: SAAB.
20. DeCelles, J.L., Burke, E.J., & Burroughs, K. (1973). A real world situation display for all weather landing. In K.D. Cross & J.J. McGrath (Eds)., Crew System Design (pp. 255-263). Santa Barbara, CA: Anacapa Sciences.
21. Wilckens, V. (1973, June). Improvements in pilot/aircraft integration by advanced contact analog displays. Paper
32
presented at the Proceedings of the 9th Annual Conference on Manual Control. Cambridge, Mass: MIT.
22. Carel, W.L. (1977). Advanced contact analog symbology. Culver City, CA: Hughes Aircraft Co.
23. Gallaher, P.D., Hunt, R.A., & Williges, R.C. (1976). A regression analysis to generate aircraft predictor information. NASA TM-73170. Washington, D.C.: NASA
24. Haskell, I.D. and Christopher D. Wickens. Two and Three-Dimensional Displays for Aviation: A Theoretical and Empirical Comparison. International Journal of Aviation Psychology 3, 2 (1993), 87-109.
25. Williams, K.W. (2002). Impact of aviation highway-in-the-sky displays on pilot situation awareness. Human Factors, 44, 18-27.
26. Schnell, T., Kown, Y., Merchant, S., & Etherington, T. (2004). Improved flight technical performance in flight decks equipped with synthetic vision information system displays. International Journal of Aviation Psychology, 14, 79-102.
27. Merrick, V.K. & Jeske, J.A. (1995). Flightpath synthesis and HUD scaling for V/STOL terminal area operations. NASA Langley Research Center: NASA Technical Memorandum TM-1995-110348.
28. Snow, Michael P. & French, Guy A. (2002). Effects of primary flight display symbology on workload and situation awareness in a head-up synthetic vision display. Air Force Research Laboratory, 29 August.
29. Arthur, J.J., Prinzel, L.J., Kramer, L.J., Bailey, R.E., & Parrish, R.V. (2003). CFIT Prevention Using Synthetic Vision. In Proceedings of SPIE, Enhanced and Synthetic Vision 2003. Volume 5018 paper 16 Apr.
30. Prinzel, L.J., Arthur, J.J., Kramer, L.J., & Bailey, R.E. (2004). Pathway concepts experiment for head-down synthetic vision displays. In Proceedings of SPIE, Enhanced and Synthetic Vision 2004, Paper 5424-02.
31. Wickens, C. D., & Long, J. (1995). Object vs. space-based models of visual attention: Implications for the design of head-up displays. Journal of Experimental Psychology: Applied, 1, 179-194.
32. Hofer, E.F., Braune, R.J., Boucek, G.P., & Pfaff, T.A. (1999). Attention switching between near and far display domains: An exploratory study of pilots’ attention switching with head-up and head-down tactical displays in simulated flight operations. Seattle, WA: Boeing Commercial Airplane Group.
33. Prinzel III, Lawrence J. (2003). Head-up displays and attention capture. NASA Langley Research Center: NASA Technical Paper TM- 2003-213000.
34. Chung, Victoria I.; & Hutchinson, Brian K. (2001). A Unique Software System for Simulation-to-Flight Research. Modeling and Simulation Technologies Conference and Exhibit, AIAA-2001-4057.
35. Jones D.R., Quach, S.D., & Young, S.D. (October 14, 2001). Runway Incursion Prevention System – Demonstration and testing at Dallas/Fort Worth International Airport. 20th Annual Digital Avionics Systems Conference (DASC). Daytona Beach, FL.
36. Ames, Lawrence L. & George, Edward J. (1993). Revision and verification of a seven-point workload estimation scale. Air Force Flight Technical Center: AFFTC-TIM-93-01.
37. AIAA (1993). Guide to Human Performance Measurement. Washington D.C.: American Institute of Aeronautics and Astronautics.
38. Vidulich, M.A. & Hughes, E.R. (1991). Testing a subjective metric of situation awareness. Proceedings of the Human Factors & Ergonomics Society, 35, 1307-1311.
39. RTCA (2000). Minimum Aviation System Performance Standards: Required Navigation Performance for Area Navigation (RTCA DO-236A). Washington, D.C.: RTCA, Incorporated. 40. Kramer, L.J., Arthur, J.J. III, Bailey, R.E., & Prinzel, L.J. III (2005). Flight Testing an Integrated Synthetic Vision System. SPIE. In Proceedings of SPIE, Enhanced and Synthetic Vision 2005, Editor: Jacques G. Verly, Volume 5802-01.
41. Arthur, J.J. III, Kramer, L.J., & Bailey, R.E. (2005). Flight Test Comparison Between Enhanced Vision (FLIR) And Synthetic Vision Systems. SPIE. In Proceedings of SPIE, Enhanced and Synthetic Vision 2005, Editor: Jacques G. Verly, Volume 5802-03.
42. National Aeronautics and Space Administration (2001). Aerospace Technology Enterprise. Washington, D.C.: NASA.

33
Appendix A: Pathway Concepts Experiment For Head-Down Synthetic Vision Displays
1. RESEARCH OBJECTIVE The objective of the head-down synthetic vision pathway concepts experiment was to examine the efficacy of four tunnel and three guidance symbology concepts for head-down synthetic vision displays. Two new pathways were conceptualized and evaluated that theoretically represented the best combination of current tunnel formats. Together, four tunnel (box tunnel, minimal “crows feet”, dynamic “crows feet”, dynamic pathway) concepts and a baseline concept (i.e., no tunnel) were evaluated using a “ball” guidance symbology. In addition, three guidance symbologies (ball, tadpole, follow-me-aircraft) were evaluated using the dynamic “crows feet” tunnel concept. Eight B-757 current airline Captains flew the Sparks 16R visual arrival, curved approach under Category I instrument meteorological conditions (IMC); an approach of significant workload and difficulty, which is prohibited with today’s equipage under such weather conditions. The scenarios were chosen to best evaluate the concepts under situations posited for a future commercial concept of operation for synthetic vision. Presented below are the results from the head-down pathway experiment. The purpose of Appendix A is to relate the finding of this experiment as background for pathway concepts chosen for the head-up pathway synthetic vision system experiment. 2. RESULTS After each run, pilots were administered a run questionnaire consisting of the USAF Revised Workload Estimation Scale, Situation Awareness Rating Technique (SART), and six Likert-type (7-point) questions specific to tunnel evaluation. After the final experimental run, the Subjective Workload Dominance (SWORD) and Situation Awareness - SWORD (SA-SWORD) scales were administered. Simple ANOVAs and Student-Newman-Keuls (SNK) post-hoc tests were performed. Alpha was set at .05. 2.1 USAF Workload Estimation Scale Results There was a significant effect found for tunnel with respect to mental workload, F(4,28) = 43.40. The baseline condition (4.2.7/0) was rated significantly higher in workload than the four tunnel concepts. The minimal tunnel (3.2/7.0) was also rated significantly higher in workload than the box (2.6/7.0), dynamic pathway (2.5/7.0), and dynamic “crow’s feet” (2.4/7.0), which did not differ from each other (Figure A1). No significant differences were found for workload between the guidance concepts (p > .05). 2.2 Situation Awareness Rating Technique Results There was a significant effect found for tunnel with respect to the combined SART ratings, F(4,28) = 11.41. The baseline (no tunnel) condition (3.4) was rated significantly lower in situation awareness (SA) than the four tunnel conditions. In addition, the minimal tunnel concept (5.1) was rated significantly lower than the box (7.2), dynamic pathway (7.5), and dynamic “crows feet” (7.5) which did not differ from each other (Figure A1).
For guidance symbology, an ANOVA found a significant main effect for SART, F(2,14) = 5.33. The ball was rated significantly lower in SA than either the tadpole or follow-me-aircraft, which were not significantly different from one another. 2.3 SWORD Results An ANOVA found a significant main effect for Tunnel Type that for the SWORD measure, F(4,28) = 340.519. The SNK Post-hoc test showed 3 distinct subgroups formed: 1) Dynamic and Pathway; 2) Full and Minimal; and 3) Baseline. The Dynamic and pathway tunnel concepts ranked as having the lowest workload and Baseline (no tunnel) as having the highest workload. The ranking from lowest workload to highest was: Dynamic “crow’s feet”, dynamic pathway, box tunnel, minimal tunnel, and baseline (no tunnel). No significant differences were found for guidance symbology for the SWORD measure, p < .05.
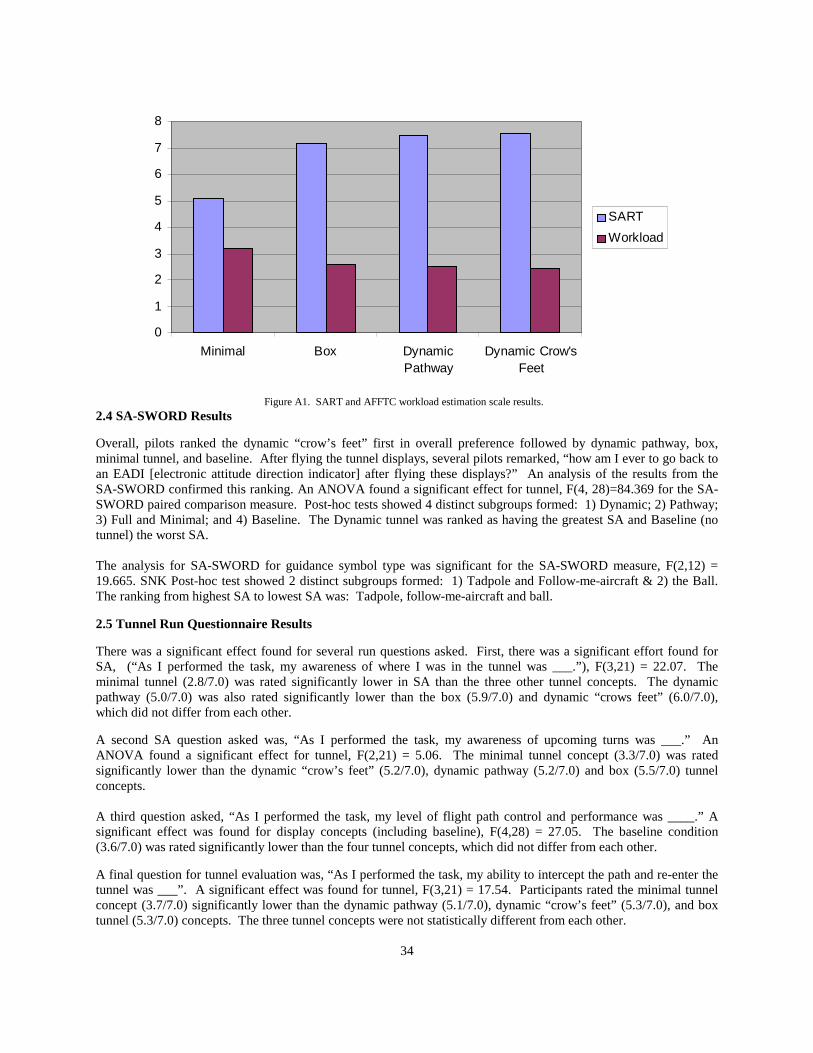
34
0
1
2
3
4
5
6
7
8
Minimal Box DynamicPathway
Dynamic Crow'sFeet
SART
Workload
Figure A1. SART and AFFTC workload estimation scale results.
2.4 SA-SWORD Results Overall, pilots ranked the dynamic “crow’s feet” first in overall preference followed by dynamic pathway, box, minimal tunnel, and baseline. After flying the tunnel displays, several pilots remarked, “how am I ever to go back to an EADI [electronic attitude direction indicator] after flying these displays?” An analysis of the results from the SA-SWORD confirmed this ranking. An ANOVA found a significant effect for tunnel, F(4, 28)=84.369 for the SA-SWORD paired comparison measure. Post-hoc tests showed 4 distinct subgroups formed: 1) Dynamic; 2) Pathway; 3) Full and Minimal; and 4) Baseline. The Dynamic tunnel was ranked as having the greatest SA and Baseline (no tunnel) the worst SA. The analysis for SA-SWORD for guidance symbol type was significant for the SA-SWORD measure, F(2,12) = 19.665. SNK Post-hoc test showed 2 distinct subgroups formed: 1) Tadpole and Follow-me-aircraft & 2) the Ball. The ranking from highest SA to lowest SA was: Tadpole, follow-me-aircraft and ball.
2.5 Tunnel Run Questionnaire Results There was a significant effect found for several run questions asked. First, there was a significant effort found for SA, (“As I performed the task, my awareness of where I was in the tunnel was ___.”), F(3,21) = 22.07. The minimal tunnel (2.8/7.0) was rated significantly lower in SA than the three other tunnel concepts. The dynamic pathway (5.0/7.0) was also rated significantly lower than the box (5.9/7.0) and dynamic “crows feet” (6.0/7.0), which did not differ from each other. A second SA question asked was, “As I performed the task, my awareness of upcoming turns was ___.” An ANOVA found a significant effect for tunnel, F(2,21) = 5.06. The minimal tunnel concept (3.3/7.0) was rated significantly lower than the dynamic “crow’s feet” (5.2/7.0), dynamic pathway (5.2/7.0) and box (5.5/7.0) tunnel concepts. A third question asked, “As I performed the task, my level of flight path control and performance was ____.” A significant effect was found for display concepts (including baseline), F(4,28) = 27.05. The baseline condition (3.6/7.0) was rated significantly lower than the four tunnel concepts, which did not differ from each other. A final question for tunnel evaluation was, “As I performed the task, my ability to intercept the path and re-enter the tunnel was ___”. A significant effect was found for tunnel, F(3,21) = 17.54. Participants rated the minimal tunnel concept (3.7/7.0) significantly lower than the dynamic pathway (5.1/7.0), dynamic “crow’s feet” (5.3/7.0), and box tunnel (5.3/7.0) concepts. The three tunnel concepts were not statistically different from each other.

35
2.6 Guidance Symbology Run Questionnaire Results One of the Likert-type run questions asked of each evaluation pilot was, “As I performed the task, my ability to anticipate flight path changes using the guidance symbology was ____.” An ANOVA found a main effect for guidance symbology, F(2, 14) = 5.68, p < .01. Based on the SNK post-hoc test, pilots rated the ball (4.0/7.0) significantly lower that both the tadpole (5.3/7.0) and follow-me-aircraft (5.3/7.0) guidance symbologies for anticipating flight path changes. As was done for the tunnel concepts, subjective ratings of flight path control were evaluated for guidance symbology (“As I performed the task, my level of flight path control and performance was ____.”). An ANOVA found a significant effect for guidance symbology type, F (2, 14) = 4.56, p < .05. The SNK post-hoc test showed that pilots rated the ball (3.9/7.0) significantly lower than the tadpole (5.3/7.0) and follow-me-aircraft (5.3/7.0) for flight path control performance.
2.7 Flight Path Control Flight path control was analyzed for the nominal task run by root-mean-squared tracking error (RMSE). Because guidance symbology may confound flight path accuracy, the results were analyzed as symbology-tunnel combinations yielding six display concepts plus the baseline (i.e., no tunnel, ball symbology). An ANOVA found a significant effect for lateral RMSE across guidance symbology-tunnel combinations, F(6,42) = 6.839 (Figure A2). The baseline condition was found to be significantly worse for lateral flight path control (133 feet). No statistical differences were found for lateral RMSE between the three tunnel concepts regardless of the guidance symbology. No significant differences were found for vertical path error across the display concepts including the baseline condition (p >.05). Finally, no differences were found between the three guidance symbologies for either lateral or vertical RMSE.
Approach RMS Path Error
0
20
40
60
80
100
120
140
Bas
elin
e
Min
inum
Tun
nel
w/ B
all
Ful
l Tun
nel
w /B
all
Pat
hway
Tun
nel
w/ B
all
Dyn
amic
Tun
nel
w/ B
all
Dyn
amic
Tun
nel
w/ T
adpo
le
Dyn
amic
Tun
nel
w/ G
host
Concept
RM
S P
ath
Err
or,
fee
t
RMS Lateral Path Error
RMS Vertical Path Error
Figure A2. Approach RMS path error.

36
2.8 Tunnel Semi-Structured Interview Results A semi-structured interview was conducted after the final experimental run. A number of Likert (1 to 7) questions were asked but space does not allow a detailed summary of the results. However, several interesting results were found. For example, although there was no significant difference in rating for effectiveness of tunnels for straight path segments, pilots rated the minimal tunnel concept (4.0/7.0) significantly less effective for curved path segments than the box (5.4/7.0), dynamic pathway (6.2/7.0), and dynamic “crows feet” (6.4/7.0), F(3,28) = 10.09, p < .05 (Figure A3). Another interesting finding was that pilots rated the baseline (5.6/7.0) and minimal tunnel (4.5/7.0) concepts to have significantly more workload to intercept the path during the “cut-the-corner” scenario, F(3,35) = 43.56, p < .001. There were no statistical differences between the box (3.0/7.0), dynamic pathway (1.9/7.0) and dynamic “crows feet” (1.8/7.0) concepts.
0
1
2
3
4
5
6
7
Minimal Box DynamicPathway
Dynamic "Crow'sFeet"
Straight
Curved
Figure A3. Effectiveness of tunnel concepts for flight path segments.
Overall, pilots preference rankings (from most liked to least liked ) for the tunnel concepts were: dynamic “crow’s feet”, dynamic pathway, box, minimal, and baseline (no-tunnel). Although most pilots stated that the preference between the dynamic tunnel concepts was minor, several thought that the presence of the tunnel floor in the dynamic pathway concept generated too much clutter compared to the dynamic “crow’s feet”. The minimal tunnel concept was reported to provide too little information but many pilots felt that their opinion would change if the task required them to use a head-up display. The box tunnel concept was also reported to be poor compared to the dynamic tunnel concepts mostly because of concerns of clutter. This was particularly acute on final approach when the box tunnel obscured the synthetic runway even at unity minification. 2. 9 Guidance Symbology Semi-Structured Interview Results An ANOVA was performed on pilot responses to the effectiveness of guidance symbology for situation awareness and flight path control for both straight and curved path segments (Figure A4). A significant result was found only for the curved / banked flight path segments, F (2,21) = 36.56, p < .001. Pilots rated the ball (3.5/7.0) significantly worse than either the tadpole (6.1/7.0) or follow-me-aircraft (6.3/7.0) for situation awareness and flight path control. However, no significant differences were found between the ball (5.7/7.0), tadpole (6.1/7.0) and follow-me-aircraft (6.1/7.0) for the straight path segments, F(2,21) = 2.49, p > .05.

37
0
1
2
3
4
5
6
7
Ball Tadpole Follow-Me-Aircraft
Straight
Curved
Figure A4. Effectiveness of guidance symbology for flight path segments.
Another interesting finding was the percentage of situation awareness enhancement that the tunnel provides compared to just flying with one of the three guidance symbologies. Overall, pilots rated the ball to provide only 20% of their situation awareness, but 70% for the tadpole and follow-me-aircraft guidance symbologies. Said another way, the dynamic “crow’s feet” tunnel provides an additional 80% situation awareness enhancement when paired with a ball compared to only 30% when paired with tadpole or follow-me-aircraft guidance symbology.
3. DISCUSSION The head-down synthetic vision system pathway experiment was conducted to examine the efficacy of different tunnel and guidance symbology concepts for head-down synthetic vision displays. The results indicated that the presence of a tunnel had a marginal effect on enhancing path control performance for the head-down display compared to the baseline (no tunnel w/ ball guidance). Further, no significant differences were found for path control performance between the four tunnel concepts. Despite this, statistically significant differences were found for pilot ratings for situation awareness and workload. Overall, pilots rated the tunnel concepts to be significantly better in terms of workload and situation awareness compared to not having a tunnel present. When just the tunnel concepts are considered, the minimal tunnel concept was consistently rated poorer followed by the box tunnel concept compared to the dynamic tunnel concepts. The reasons are different for the two tunnel concepts. The minimal tunnel was found to be poor for situation awareness because it was difficult to accurately determine where you were in the tunnel. However, pilots did note that the presence of the guidance symbology and path deviation indicators significantly reduced this problem. Furthermore, all pilots remarked that the minimal tunnel might be optimal for a HUD where issues of clutter are of particular concern compared to the PFD. The box tunnel, in contrast, was rated poorer because of concerns of clutter especially on final approach. Although it was fairly easy to determine where they were in the tunnel, the advantage was negated because the tunnel obscured the synthetic terrain. For these reasons, the evaluation pilots preferred the dynamic tunnel concepts for a head-down synthetic vision display.
Overall, the dynamic pathway was rated very high for situation awareness, but several pilots reported that the presence of the tunnel floor (“railroad track”) was unnecessary when compared to the dynamic “crow’s feet” tunnel. Therefore, in addition to being preferred to the minimal and box tunnel concepts, the dynamic “crow’s feet” was reported to provide all the advantages of the dynamic pathway with less clutter. All pilots remarked that the dynamic quality of the tunnel was useful to determine exact position within the tunnel and the “trough” effect when outside the tunnel made it very easy to re-enter the tunnel. However, most pilots thought that the tunnel might have been too dynamic and somewhat distracting. Therefore, the algorithm for controlling the dynamic “crow’s feet” tunnel growth was optimized for the head-up synthetic vision system experiment.

38
For guidance symbology, the ball was found to be adequate but the tadpole provided more information than the ball without an increase in clutter. The follow-me-aircraft, on the other hand, was rated best overall for SA and workload because it gave yaw, pitch, and roll information compared to just track change information provided by the tadpole. When comparisons were made when paired with the dynamic “crow’s feet” tunnel concept, the differences between the guidance symbology concepts were more apparent. Pilots reported that the tunnel enhanced their situation awareness by 80% when paired with the ball compared to only 30% for the tadpole and follow-me-aircraft. Pilots did note that the ball coupled with a dynamic “crow’s feet” tunnel was very acceptable for flight path control and situation awareness. However, the tadpole and follow-me-aircraft conveyed important preview information not provided by the tunnel concepts.

39
Appendix B: Required Navigation Performance
Required Navigation Performance (RNP) is a statement of the navigation performance accuracy necessary for operation within a defined airspace.39 RNP type is a designator according to navigational performance accuracy in the horizontal plane (lateral and longitudinal position fixing). This designator invokes all of the navigation performance requirements associated with the applicable RNP number, which is a containment value. For example, RNP-1 means that for at least 95% of the time the navigational performance in the horizontal plane, or the total horizontal system error, is less than 1.0 nmi. In addition to requiring 95% positioning accuracy for RNP operations, these types of procedures also require integrity of the positioning accuracy at 99.999% at 2 x RNP number. In our example above with an RNP-1, the position accuracy within 2.0 nmi of the ownship (2 x RNP value of 1.0 nmi) would have to be guaranteed to be correct 99.999% of the time to enable RNP-1 operations. There are three lateral components of navigation error: path definition error, path steering error, and position estimation error.39 These errors, defined in the following, represent the total horizontal system error of the airplane and are the difference between the aircraft’s true position and desired position: � The path definition error is the difference between the defined path and the desired path at a specific point. � The path steering error is the distance from the estimated position to the defined path. It includes both the
flight technical error (FTE) and display error. FTE is the accuracy with which the aircraft is controlled as measured by the indicated aircraft position with respect to the indicated command or desired position.
� The position estimation error, also referred to as the ship’s actual navigation performance (ANP), is the difference between the true position and the estimated position.
Vertical navigation (VNAV) capability further enhances flight operations by enabling the specification of a flight path vertically for the lateral flight path. VNAV ensures that for at least 99.7% of the time the navigational performance in the vertical plane, or the total vertical system error, is less than a specified altitude deviation measure based on the airspace being flown in (below 5000 feet MSL, 5000-10000 feet MSL, above 10000 feet MSL) and the type of flight operation (level flight/climb/descent or flight along specified vertical profile) being performed.39 There are four vertical components of navigation error: altimetry system error, vertical path steering error, vertical path definition error, and horizontal coupling error.39 These errors, defined in the following, represent the total vertical system error of the airplane and are the difference between the aircraft’s true vertical position and desired vertical position at the true lateral position: � Altimetry system error is the error attributable to the aircraft altimetry installation including position effects
resulting from normal aircraft flight attitudes. � The vertical path steering error is the distance from the estimated vertical position to the defined path. It
includes both FTE and display error. � The vertical path definition error is the vertical difference between the defined path and the desired path at
the estimated lateral position. � The horizontal coupling error is the vertical error resulting from horizontal along track position estimation
error coupling through the desired path.

40
Appendix C: Post run questionnaires
Workload Estimate
1 Nothing To Do; No System Demands 2 Light Activity; Minimum Demands 3 Moderate Activity – Easily Managed; Considerable Spare Time 4 Busy – Challenging but Manageable; Adequate Time Available 5 Very Busy – Demanding To Manage; Adequate Time Available 6 Extremely Busy – Very Difficult; Non-Essential Tasks Postponed 7 Overloaded – System Unmanageable; Essential Tasks Undone; Unsafe
Figure C1. Air Force Flight Technical Center workload estimate scale
Situation Awareness Ratings Low High 1 2 3 4 5 6 7 SART #1 – Demand of Attentional Resources How Much Demand Was Placed On Attention Due To Complexity And Variability Of The Task?
SART #2 – Supply of Attentional Resources How Much Spare Attention And Mental Ability Was Available To Accomplish The Task?
SART #3 – Understanding What Was The Level Of Understanding Of Information And Familiarity Of The Situation?
Figure C2. SART scale.
Q1. As I performed the task, my awareness of where I was in the tunnel was __.Q2. As I performed the task, my awareness of upcoming turns using the tunnel was __.Q3. As I performed the task, my level of flight path control and performance was __.Q4. As I performed the task, my ability to intercept the path and re-enter the tunnel was __.Q5. As I performed the task, my ability to anticipate flight path changes using the guidance
symbol was __.Q6. As I performed the task, my awareness of terrain features and obstacles was __.
Low ................................ High
2 3 4 5 6 71
ScaleLow ................................ High
2 3 4 5 6 71
ScaleLow ................................ High
2 3 4 5 6 71
Scale
Figure C3. Post-run questionnaire.

REPORT DOCUMENTATION PAGE Form ApprovedOMB No. 0704-0188
2. REPORT TYPE
Technical Publication 4. TITLE AND SUBTITLE
Advanced Pathway Guidance Evaluations on a Synthetic Vision Head-Up Display
5a. CONTRACT NUMBER
6. AUTHOR(S)
Kramer, Lynda J.; Prinzel, Lawrence J. III; Arthur, Jarvis J. III; andBailey, Randall E.
7. PERFORMING ORGANIZATION NAME(S) AND ADDRESS(ES)
NASA Langley Research CenterHampton, VA 23681-2199
9. SPONSORING/MONITORING AGENCY NAME(S) AND ADDRESS(ES)
National Aeronautics and Space AdministrationWashington, DC 20546-0001
8. PERFORMING ORGANIZATION REPORT NUMBER
L-19146
10. SPONSOR/MONITOR'S ACRONYM(S)
NASA
13. SUPPLEMENTARY NOTESAn electronic version can be found at http://ntrs.nasa.gov
12. DISTRIBUTION/AVAILABILITY STATEMENTUnclassified - UnlimitedSubject Category 03Availability: NASA CASI (301) 621-0390
19a. NAME OF RESPONSIBLE PERSON
STI Help Desk (email: [email protected])
14. ABSTRACT
NASA’s Synthetic Vision Systems (SVS) project is developing technologies with practical applications to potentially eliminate low visibility conditions as a causal factor to civil aircraft accidents while replicating the operational benefits of clear day flight operations, regardless of the actual outside visibility condition. A major thrust of the SVS project involves the development/demonstration of affordable, certifiable display configurations that provide intuitive out-the-window terrain and obstacle information with advanced guidance for commercial and business aircraft. This experiment evaluated the influence of different pathway and guidance display concepts upon pilot situation awareness (SA), mental workload, and flight path tracking performance for Synthetic Vision display concepts using a Head-Up Display (HUD). Two pathway formats (dynamic and minimal tunnel presentations) were evaluated against a baseline condition (no tunnel) during simulated instrument meteorological conditions approaches to Reno-Tahoe International airport. Two guidance cues (tadpole, follow-me aircraft) were also evaluated to assess their influence. Results indicated that the presence of a tunnel on an SVS HUD had no effect on flight path performance but that it did have significant effects on pilot SA and mental workload. The dynamic tunnel concept with the follow-me aircraft guidance symbol produced the lowest workload and provided the highest SA among the tunnel concepts evaluated.
15. SUBJECT TERMS
Synthetic Vision Systems; Head-up display; Pathway; Pathway guidance concepts; Tunnel
18. NUMBER OF PAGES
49
19b. TELEPHONE NUMBER (Include area code)
(301) 621-0390
a. REPORT
U
c. THIS PAGE
U
b. ABSTRACT
U
17. LIMITATION OF ABSTRACT
UU
Prescribed by ANSI Std. Z39.18Standard Form 298 (Rev. 8-98)
3. DATES COVERED (From - To)
5b. GRANT NUMBER
5c. PROGRAM ELEMENT NUMBER
5d. PROJECT NUMBER
5e. TASK NUMBER
5f. WORK UNIT NUMBER
23-079-60-10
11. SPONSOR/MONITOR'S REPORT NUMBER(S)
NASA/TP-2005-213782
16. SECURITY CLASSIFICATION OF:
The public reporting burden for this collection of information is estimated to average 1 hour per response, including the time for reviewing instructions, searching existing data sources, gathering and maintaining the data needed, and completing and reviewing the collection of information. Send comments regarding this burden estimate or any other aspect of this collection of information, including suggestions for reducing this burden, to Department of Defense, Washington Headquarters Services, Directorate for Information Operations and Reports (0704-0188), 1215 Jefferson Davis Highway, Suite 1204, Arlington, VA 22202-4302. Respondents should be aware that notwithstanding any other provision of law, no person shall be subject to any penalty for failing to comply with a collection of information if it does not display a currently valid OMB control number.PLEASE DO NOT RETURN YOUR FORM TO THE ABOVE ADDRESS.
1. REPORT DATE (DD-MM-YYYY)
07 - 200501-