Embed Size (px)
Citation preview
1
DISTRIBUTION STATEMENT A. Approved for public release; distribution is unlimited.
Advanced Multi-Moment Microphysics for Precipitation and Tropical Cyclone Forecast Improvement within COAMPS
PI: Ming Xue
Center for Analysis and Prediction of Storms, University of Oklahoma National Weather Center, Suite 2500
120 David Boren Blvd Norman OK 73072, USA
Phone: (405) 325 6037 Fax: (405) 3257614 email: [email protected]
Award Number: N00014-10-1-0775 Co-PI: Fanyou Kong
LONG-TERM GOALS The first major focus of this project is to implement and test a microphysics scheme capable of predicting up to three moments of hydrometeor particle size distributions (PSDs) inside the Navy’s Coupled Ocean/Atmosphere Mesoscale Prediction System (COAMPS). The scheme will then be applied to tropical cyclone (TC) and continental-scale severe weather predictions. The results will be verified against detailed in-situ and remote-sensing observations. The second major focus is to develop software to bring COAMPS into the multi-model multi-physics storm-scale ensemble prediction framework of CAPS (Xue et al. 2010), so that it can be run in realtime, at 1 to 4 km resolutions, for continental-US (CONUS) sized domains, side by side with three other state-of-the-art mesoscale models (WRF-ARW, WRF-NMM and ARPS). By using a common set of initial and boundary conditions, we will be able to identify the strengths, weaknesses and potential systematic biases of individual models, and understand the differences and commonalities of physics packages within these models and their performance. The findings will be used to guide the improvement to the COAMPS model. The framework will also be used to systematically test the performance of the multi-moment schemes implemented within COAMPS. OBJECTIVES The research efforts to be carried out in this project are synergistic with a CAPS project funded by ONR through the Defense EPSCOR program. The latter focuses on the prediction and predictability of TCs through advanced ensemble-based data assimilation. This project complements the DEPSCOR project to together address the initial data (data assimilation), model improvement, model verification, ensemble/probabilistic forecasting issues, and the understanding of TC predictability. All of these aspects are of great interest to the Navy’s research, development and operations.
The research efforts serve to fill a number of R&D gaps of the Navy, DoD as well as NOAA’s weather forecasting needs. In fact, it addresses our nation’s priority need for significantly improved hurricane intensity forecast (NSB 2007). The research in general will accelerate our nation’s capability in more accurately predicting highly-variable hurricane intensity, thereby potentially reducing hurricane-related
2
losses through better preparedness and response, and reduction in the uncertainty in track and intensity forecasts that could directly translate into huge economic savings. The project will directly contribute to Navy's goal of reducing TC structure and intensity prediction error by 50% within a decade. The software developed within this project has a direct path of transition to Navy’s operations. APPROACH Being part of CAPS’s multi-model ensemble system, COAMPS will be run initially during the Hazardous Weather Testbed (HWT, Weiss et al. 2010) Spring Experiment period, over the continental US domain, so as to take advantage of the vast volume of observational data that can provide accurate initial conditions and information for detailed verification. It will also allow us to leverage the NOAA-supported realtime storm-scale ensemble forecast experiments conducted by CAPS. Later on, we also plan to apply the multi-model ensemble system to selected TC cases, and evaluate the value and benefit of the multi-model ensemble system for improving the reliability and sharpness of TC probabilistic forecasting. Cases will be selected from Tropical Cyclone Structure-2008 (TCS-08, Elsberry et al. 2008) field campaign, the tropical storm season of 2010 (e.g., from PREDICT , Majumdar and Torn 2011), and from a future TCS field campaign. WORK COMPLETED 1. Development of the interface between ARPS and COAMPS: Interface softwware has been developed to bring COAMPS into the CAPS multi-model ensemble system. CAPS code manager, Dr. Yunheng Wang, visited NRL for one week and consulted about the interface issues for the code development. 2. COAMPS in HWT 2011 Spring Experiment COAMPS was included as a member in the 51-member CAPS realtime storm-scale ensemble forecasting (SSEF) system along with WRF-ARW, WRF-NMM, and ARPS in the later part of the HWT 2011 Spring Experiment. 3. Verification of CAPS 2010 real-time Atlantic and west Pacific TC forecast Synergistic to the primary goals of our project, and taking advantage of the global EnKF (ensemble Kalman filter) realtime analyses available from Dr. Jeffrey Whitaker of ESRL (Hamill et al. 2010), the CAPS team carried out twice daily TC forecasts over central and western Atlantic using a single large 4-km resolution grid, using the WRF model, during the 2010 hurricane season (which continues in 2011). The forecasts were initialized using the NCEP operational GFS and ESRL experimental EnKF global analyses. Systematic track and intensity forecast verifications have been performed against best track data. The verification allows us to evaluate the performance of the TC forecasts at a cloud-resolving resolution using experimental initial conditions, and provides us guidance for COAMPS TC forecasts. In post realtime, similar forecasts were performed for typhoons of 2010 over north central and western Pacific.
3
4. Sensitivity experiments with single- and double-moment microphysics schemes for Hurricane
Earl 2010: To evaluate the sensitivity of TC intensity and track forecast to microphysics parameterization (MP) schemes, we re-ran the Atlantic region forecasts for Hurricane Earl (2010), using a variety of MP schemes available in WRF. From the GFS analysis, 60 hours forecasts were produced with 7 MP schemes when Earl intensified rapidly. 5. A diagnostic study of Typhoon Morakot (2009) and the roles of vortex Rossby waves (VRWs) Taking advantage of high-resolution simulations produced in a related project for Typhoon Morakot (2009), detailed diagnostic analyses were performed to understand the dynamics of this large typhoon that produced historic amounts of rainfall over Taiwan Island. The study helps us to better understand the mechanism of TC intensification and weakening, and hence provides guidance for improving TC forecasts in the future. RESULTS:
1. Development of the interface between ARPS and COAMPS: To use the same IC and LBC as other ensemble members, an interface program called ARPS2COAMPS was completed during the 2011 CAPS Spring Experiment period. A companion interface, COAMPS2ARPS, was also developed to convert COAMPS forecast output to the ARPS format. With ARPS2COAMPS, background fields can come from a wide range of data sources (e.g., NAM, GFS, RUC, NARR, WRF, ECMWF). COAMPS2ARPS allows for the use of all post-processing facilities within the ARPS software system; including parallel graphics tools, ensemble post-processing and verification packages. Fig. 1 shows the interface workflow. MPI parallelization is supported.

4
Fig. 1. Workflow for the ARPS-COAMPS interface programs arps2coamps and coamps2arps. 2. COAMPS in HWT 2011 Spring Experiment In the later part of the HWT 2011 Spring Experiment, COAMPS was included as one of the 51-members of the CAPS multi-model SSEF system. The SSEF produced 36 h forecasts every weekday initiated at 00 UTC over the CONUS domain with a 4-km horizontal grid spacing. As in other members, the COAMPS forecasts included data from over 140 WSR-88D radars, analyzed using the ARPS 3DVAR and cloud analysis package. The COAMPS forecasts were run in realtime from 28 May through 10 June 2011, as well as on 22 May 2011, the day of Joplin Missouri EF5 tornado case (but without radar data). Forecast product images were posted on the CAPS Spring Experiment web page for internal evaluation by CAPS and NRL scientists (under a special code name). As an example, Fig. 2 shows the 1-h accumulated precipitation forecast at 24 hours, from COAMPS and the WRF-ARW control member, along with the observation (NSSL QPE product) for the 10 June forecast. Post-season evaluation is ongoing to compare the relative performance of the models and identify potential areas of improvement. We plan to run COAMPS during the entire 2012 HWT Spring Experiment. 3. Verification of CAPS fall 2010 Atlantic and west Pacific TC forecasts
As described earlier, CAPS produced 48 h high-resolution WRF-ARW forecasts for 2010 Atlantic tropical storms Igor through Otto in realtime, as well as 72-hour forecasts for Typhoons in the western Pacific in post realtime (some of the forecasts are still being completed). Verification of these forecasts was conducted to gauge the impact of a high resolution grid and different initial conditions on tropical cyclone forecasts. All statistics are based on the National Hurricane Center’s best track data. For Atlantic TC track forecasts, the high-resolution WRF performed better than the global models in the 48-hour long forecasts (Fig. 3). Breaking down the results further by intensity, track forecasts are

5
improved the most for weak tropical cyclones below hurricane strength by the high spatial resolution, but the track forecasts for strong hurricanes are improved very little. In these cases, choosing EnKF initial conditions over GFS produces the best track forecasts, regardless of grid resolution.
Fig. 2. 24 h forecast 1-h accumulated precipitation from (a) COAMPS and (b) WRF-ARW control members, valid at 00 UTC 11 June 2011. The NSSL QPE for the same time is also shown.

6
Fig. 3. Absolute track error for Atlantic hurricane forecasts. Error bars represent the 90% confidence interval from bootstrap resampling. The number of forecasts is n. The error of National
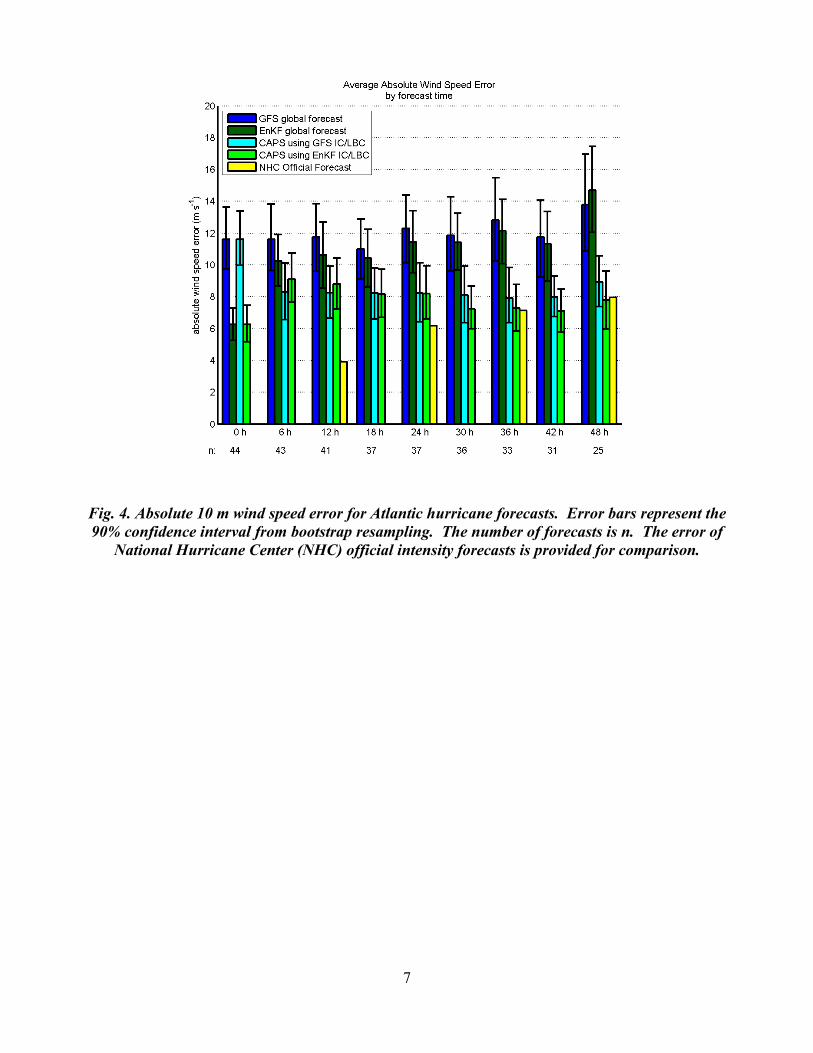
Hurricane Center (NHC) official track forecasts is provided for comparison. The high-resolution WRF model performed much better than the global models in 10-meter wind speed forecast (Fig. 4). The smaller wind speed error in the EnKF initial conditions are due to the assimilation of TCVitals data, but such benefit appear short-lived as error peaks at around 6 hours. Operational models have a tendency to significantly underestimate the wind speed. In these Atlantic cases, the global models’ bias is upwards of 13 m s-1. The high-resolution WRF runs significantly reduce this bias to under 5 m s-1 for both GFS and EnKF initial conditions. Forecasts of mean sea level pressure (MSLP) fare similarly as surface wind speed (not shown). The GFS and EnKF global models have a high bias of 13 hPa, while the high-resolution WRF runs reduce this bias to 3 hPa or less.
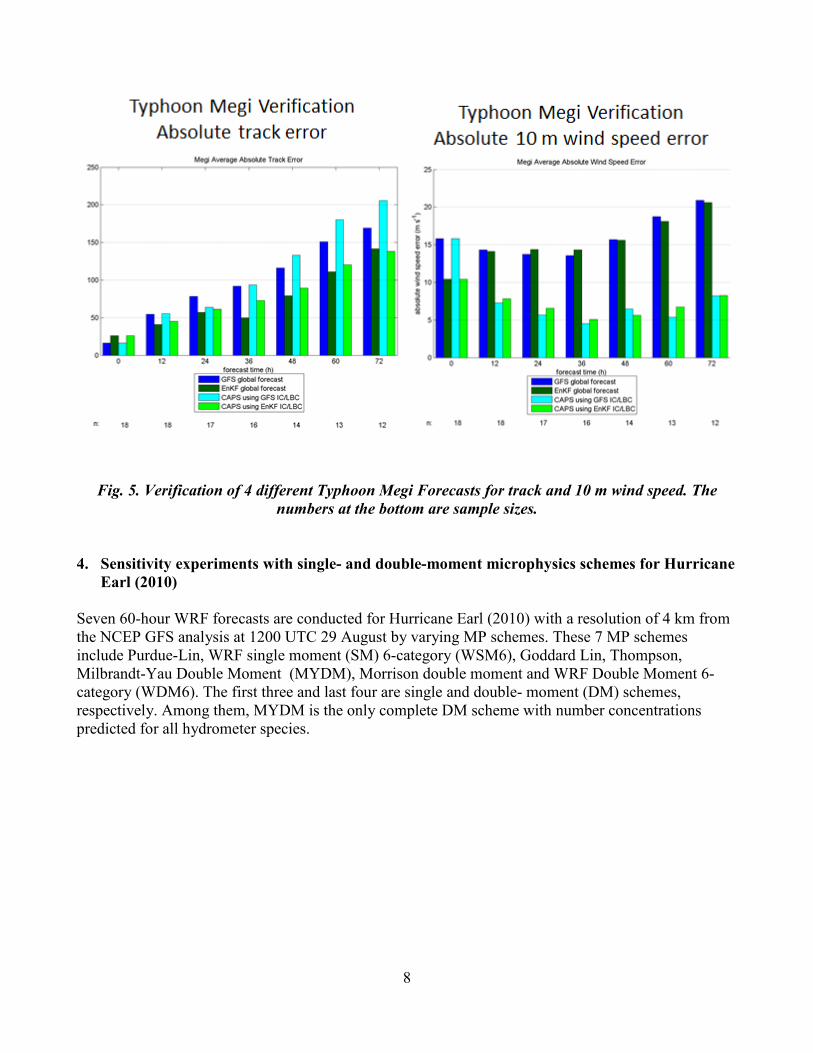
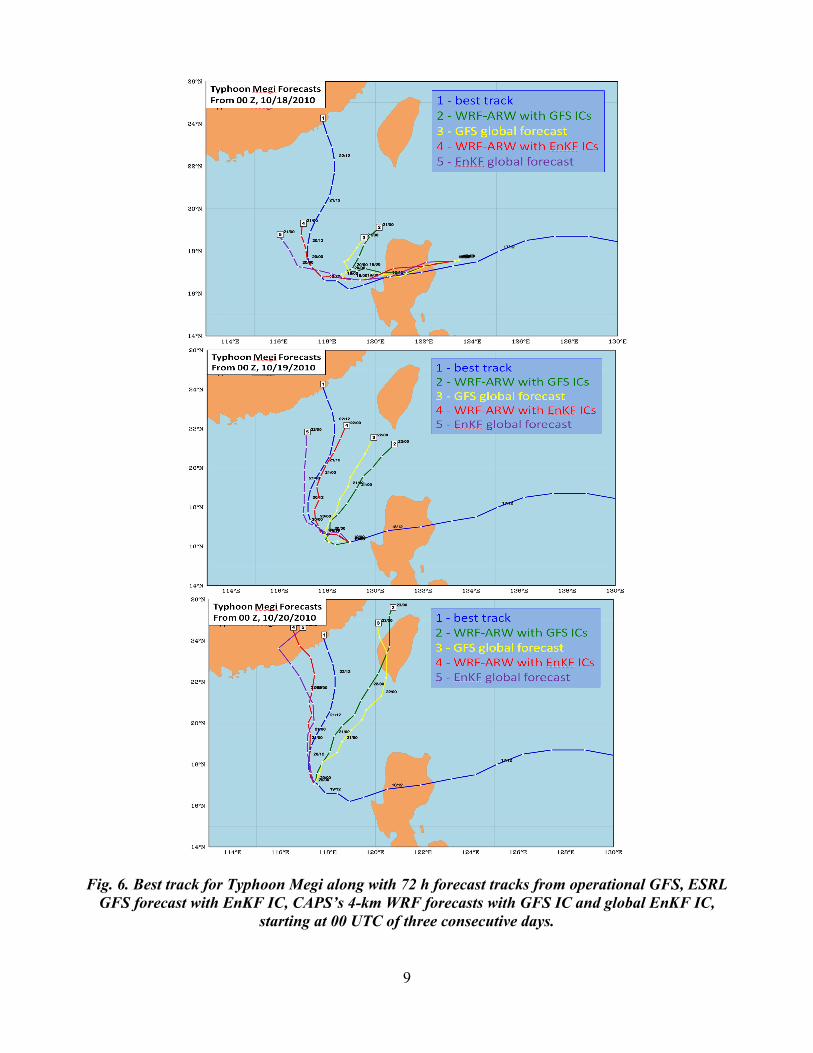
Seventy-two hour forecasts for Typhoon Megi in the western Pacific, one of the most difficult cases of the 2010 season, exhibited some of the same patterns as Atlantic forecasts. Forecast wind speeds and MSLP in the 4-km WRF forecasts are significantly improved over the global forecasts (Fig. 5). However, as was the case with Atlantic tropical cyclones, the track forecast for a powerful typhoon like Megi did not show improvement using the high-resolution model. Typhoon Megi’s track turned to the north shortly after striking the island of Luzon in the Philippines (Fig. 6). Operational models handled this recurvature poorly. While the use of a high-resolution model did little to improve the track forecast, the model initial conditions appeared to have a larger impact on the track forecast. In Fig. 6, EnKF initial conditions appeared to handle the steering of Megi better than GFS initial conditions, regardless of the model resolution.
7
Fig. 4. Absolute 10 m wind speed error for Atlantic hurricane forecasts. Error bars represent the 90% confidence interval from bootstrap resampling. The number of forecasts is n. The error of
National Hurricane Center (NHC) official intensity forecasts is provided for comparison.
8
Fig. 5. Verification of 4 different Typhoon Megi Forecasts for track and 10 m wind speed. The numbers at the bottom are sample sizes.
4. Sensitivity experiments with single- and double-moment microphysics schemes for Hurricane
Earl (2010) Seven 60-hour WRF forecasts are conducted for Hurricane Earl (2010) with a resolution of 4 km from the NCEP GFS analysis at 1200 UTC 29 August by varying MP schemes. These 7 MP schemes include Purdue-Lin, WRF single moment (SM) 6-category (WSM6), Goddard Lin, Thompson, Milbrandt-Yau Double Moment (MYDM), Morrison double moment and WRF Double Moment 6-category (WDM6). The first three and last four are single and double- moment (DM) schemes, respectively. Among them, MYDM is the only complete DM scheme with number concentrations predicted for all hydrometer species.
9
Fig. 6. Best track for Typhoon Megi along with 72 h forecast tracks from operational GFS, ESRL GFS forecast with EnKF IC, CAPS’s 4-km WRF forecasts with GFS IC and global EnKF IC,
starting at 00 UTC of three consecutive days.

10
The first 12 hours of forecast represents the spinup stage therefore only the last 48 hours are shown in Fig. 7, focusing on the intensification stage of Earl. During the 18 hours from 1200 UTC August 30 to 0600 UTC August 31 (corresponding to 24-48 hours forecast), the observed minimum seal level pressure (MSLP) decreased by 34 hPa (Fig. 7a), indicating fast intensification of Earl. The spread of MSLPs using different MP schemes grows quickly during the intensification, suggesting the growth of forecast uncertainty associated with the model MP schemes for this particular case. The forecasts using Goddard and MYDM capture this intensification the best among all the MP schemes while the forecasts using other schemes are too weak. At 0600 UTC August 31, the observed MSLP of Earl is the lowest during the 60-hour forecast period. The predicted MSLP of 934 hPa using MYDM is the closest to the observed best track of 931 hPa among all the schemes. From 0000 UTC August 30 to 1800 UTC August 30, the observed maximum 10-m wind increased by 30 knots in 18 hours (Fig. 7b). The forecast using MYDM predicts a similar temporal variation in the maximum wind compared to the best track but is still weaker than the observation. At 0600 UTC August 31, the predicted maximum wind using MYDM scheme is 113 knots, very close to the observed 115 knots and much stronger than other MP schemes. Generally, the forecast using MYDM performs the best with the smallest error among all MP schemes from 1800 UTC August 30 to 1800 UTC August 31 when Earl reaches to Category 4 with the observed maximum wind of 115 knots sustaining for 24 hours. The track forecasts, though, are not very good for all MP schemes, with northward track biases (not shown). It is hoped that the track forecasts can be improved by using EnKF IC.
Fig. 7. The last 48-hour forecasts of Hurricane Earl’s (a) MSLP and (b) maximum wind using 7 MP schemes, in comparison of the observed best track.
11
5. A modeling and diagnostic study of Typhoon Morakot (2009) and the roles of vortex Rossby waves (VRWs)
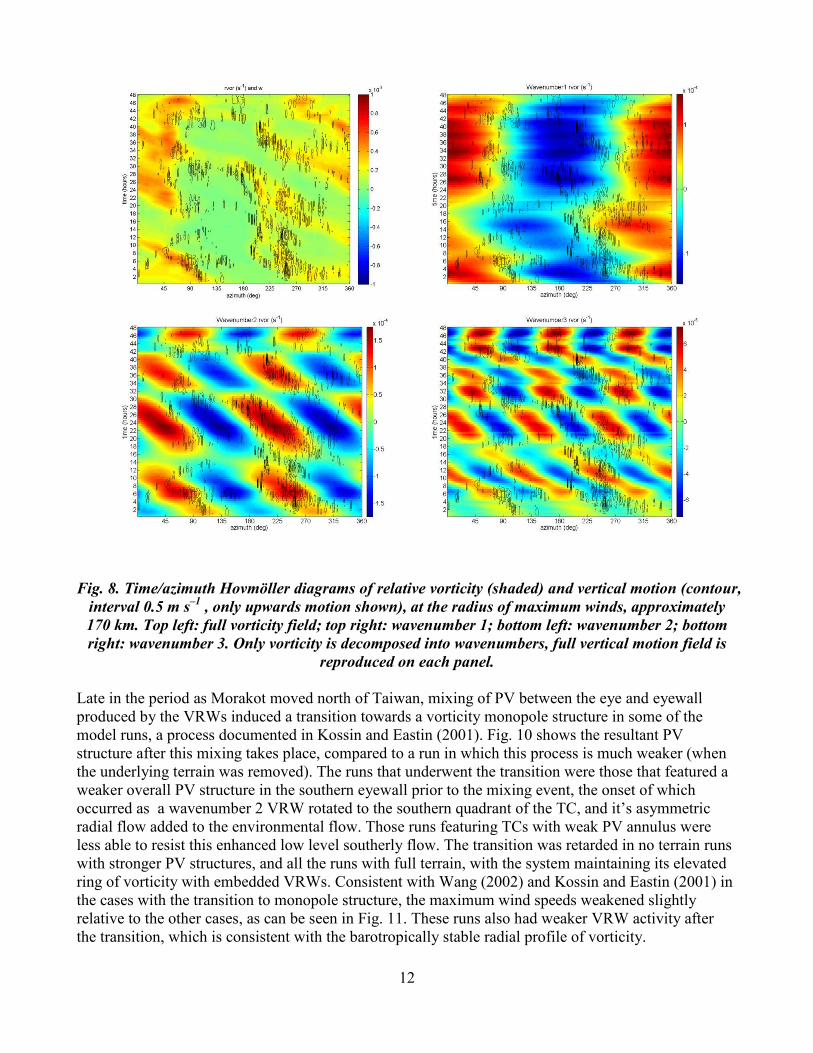
Previous studies (e.g., Chen and Yau 2001; Corbosiero 2006; Wang 2002) have emphasized the importance of Vortex Rossby Waves (VRWs) to the evolution of the structure and intensity of TCs. Following these earlier studies, the low-level vorticity field and model reflectivity for the simulations of Morakot at 3 km resolution using the ARPS model were decomposed into azimuthal wavenumbers using a Fast Fourier Transform, in order to identify low wavenumber asymmetries in the low level flow. Wavenumber one, two and three asymmetries were clearly evident in the vorticity field, as shown in the time/azimuth Hovmöller diagrams in Fig. 9, where the total vorticity and low wavenumber asymmetries near the radius of maximum winds are overlaid with vertical motion. These waves were identified as VRWs following the reasoning of Wang (2002), and based particularly on their vertical structure and phase speed properties. Wang (2002) applied a local potential vorticity (PV) and eddy kinetic energy budget analysis to his simulated TC, to show that diabatic heating in deep convection is the primary PV source for the VRWs, and further that nonlinear processes associated with the wavenumber one waves are a significant source of PV for waves of wavenumber 2 and higher. A similar PV budget analysis for Morakot was performed, and the results were broadly consistent, with the term associated with the radial gradient of PV (the so-called vortex beta term) being particularly prominent. The diabatic heating terms in this case were generally weaker relative to the advection and nonlinear terms, indicating that barotropic instability of the wind structure associated with the large vorticity annulus was likely to be the dominant process in the formation of the waves. As found in previous numerical studies of tropical cyclones in a vertically sheared environment (e.g., Braun et al. 2006), upward motion and convective development were suppressed while the VRWs were in the upshear part of the cyclone, while upward motion and convection were enhanced as they rotated towards the downshear part of the system. This can be seen in Fig. 8, particularly in the first 24 hours, where upward motion is associated with wave activity in southern azimuths, but absent in the north, consistent with the moderate north-northeasterly shear over the system at this time.
12
Fig. 8. Time/azimuth Hovmöller diagrams of relative vorticity (shaded) and vertical motion (contour, interval 0.5 m s–1 , only upwards motion shown), at the radius of maximum winds, approximately 170 km. Top left: full vorticity field; top right: wavenumber 1; bottom left: wavenumber 2; bottom right: wavenumber 3. Only vorticity is decomposed into wavenumbers, full vertical motion field is
reproduced on each panel. Late in the period as Morakot moved north of Taiwan, mixing of PV between the eye and eyewall produced by the VRWs induced a transition towards a vorticity monopole structure in some of the model runs, a process documented in Kossin and Eastin (2001). Fig. 10 shows the resultant PV structure after this mixing takes place, compared to a run in which this process is much weaker (when the underlying terrain was removed). The runs that underwent the transition were those that featured a weaker overall PV structure in the southern eyewall prior to the mixing event, the onset of which occurred as a wavenumber 2 VRW rotated to the southern quadrant of the TC, and it’s asymmetric radial flow added to the environmental flow. Those runs featuring TCs with weak PV annulus were less able to resist this enhanced low level southerly flow. The transition was retarded in no terrain runs with stronger PV structures, and all the runs with full terrain, with the system maintaining its elevated ring of vorticity with embedded VRWs. Consistent with Wang (2002) and Kossin and Eastin (2001) in the cases with the transition to monopole structure, the maximum wind speeds weakened slightly relative to the other cases, as can be seen in Fig. 11. These runs also had weaker VRW activity after the transition, which is consistent with the barotropically stable radial profile of vorticity.

13
Fig. 9. Potential vorticity (shaded) and vertical motion (contour, interval 0.5 m s–1), and asymmetric
winds (vectors, maximum vector 20 m s–1) at 2000 UTC 8 August 2009, for two separate 3 km resolution runs with no terrain. Top panel is from a 3km run initialized at 06UTC 7 August with no
terrain (0706NT); bottom panel is the same run with terrain (0706Trn).
Fig. 10. Intensity time series of the two model runs shown in Fig. 10.
REFERENCES
Braun, S. A., M. T. Montgomery, and Z. Pu, 2006: High-Resolution Simulation of Hurricane Bonnie (1998). Part I: The Organization of Eyewall Vertical Motion. J. Atmos. Sci., 63, 19-42.

14
Chen, Y. and M. K. Yau, 2001: Spiral bands in a simulated hurricane. Part I: Vortex Rossby Wave verification. J. Atmos. Sci., 58, 2128 - 2145.
Corbosiero, K. L., J. Molinari, A. R. Aiyyer, and M. L. Black, 2006: The structure and evolution of Hurricane Elena (1985). Part II: Convective asymmetries and evidence for vortex Rossby waves. . Mon. Wea. Rev., 134, 3073-3091.
Elsberry, R. L., R. Ferek, and S. Chang, 2008: Tropical cyclone structure (TCS08) field experiment in the western north Pacific during 2008. 28th Conf. Hurricanes Tropical Meteor., Orlando, FL, Amer. Meteor. Soc., 7C.6.
Hamill, T. M., M. J. Brennan, B. Brown, M. DeMaria, E. N. Rappaport, and Z. Toth, 2010: Future of ensemble-based hurricane forecast products. Bull. Amer. Meteor. Soc., Submitted.
Kossin, J. P. and M. D. Eastin, 2001: Two distinct regimes in the kinematic and thermodynamic structure of the hurricane eye and eyewall. J. Atmos. Sci., 58, 1079-1090.
Majumdar, S. J. and R. Torn, 2011: Ensemble-based prediction and diagnostics during the PREDICT field experiment Paper 4A.3.
NSB, 2007: Hurriance Warning: The Critical Need for a National Hurricane Research InitiativeNational Science Board Report NSB-06-115, 36 pp.
Wang, Y., 2002: Vortex Rossby Waves in a Numerically Simulated Tropical Cyclone. Part I: Overall Structure, Potential Vorticity, and Kinetic Energy Budgets. J. Atmos. Sci., 59, 1213-1238.
Weiss, S. J., A. J. Clark, I. L. Jirak, C. J. Melick, C. W. Siewert, R. Sobash, P. T. Marsh, A. R. Dean, M. Xue, F. Kong, K. W. Thomas, J. Du, D. R. Novak, F. E. Barthold, M. J. Bodner, J. J. Levit, C. B. Entwistle, T. Jensen, J. S. Kain, M. C. Coniglio, and R. S. Schneider, 2010: An overview of the 2010 NOAA Hazardous Weather Testbed spring forecasting experiment. 25th Conf. Severe Local Storms, Amer. Meteor. Soc., Paper 7B.1.
Xue, M., F. Kong, K. W. Thomas, Y. Wang, K. Brewster, J. Gao, X. Wang, S. Weiss, A. Clark, J. Kain, M. Coniglio, J. Du, T. Jensen, and Y.-H. Kuo, 2010: CAPS Realtime Storm Scale Ensemble and High Resolution Forecasts for the NOAA Hazardous Weather Testbed 2010 Spring Experiment. 25th Conf. Severe Local Storms, Amer. Meteor. Soc., Paper 7B.3.