Embed Size (px)
Citation preview

Copyright 2004 Electric Power Research Institute, Inc. All right reserved. 1
Advanced Monitoring to Improve Combustion Turbine/Combined Cycle
CT/(CC) Reliability, Availability and Maintainability
(RAM)
Semi-Annual Report
Reporting Period Start Date: October 1, 2003
Reporting Period End Date: March 31, 2004
Agreement Number – DE-FC26-01NT41233
Submitted by:
EPRI 3412 Hillview Avenue
Palo Alto, CA 94304-1395
EPRI Principal Investigator: Leonard Angello Phone: 650-855-7939 E-mail: [email protected]

DOE/EPRI Combustion Turbine Diagnostic Heath Monitoring Project – Semiannual Report Report Period – October 1, 2003 to March 31, 2004 Contract Number – DE-FC26-01NT41233
Copyright 2004 Electric Power Research Institute, Inc. All right reserved.
Disclaimer This report was prepared as an account of work sponsored by an agency of the United States Government. Neither the United States Government nor any agency thereof, nor any of their employees, makes any warranty, express or implied, or assumes any legal liability or responsibility for the accuracy, completeness, or usefulness of any information, apparatus, product, or process disclosed, or represents that its use would not infringe privately owned rights. Reference herein to any specific commercial product, process, or service by trade name, trademark, manufacturer, or otherwise does not necessarily constitute or imply its endorsement, recommendation, or favoring by the United States Government or any agency thereof. The views and the opinions of the authors expressed herein do not necessarily state or reflect those of the United States Government or any agency thereof.

Copyright 2004 Electric Power Research Institute, Inc. All right reserved. 3
Table of Contents Abstract ............................................................................................................................... 2 Executive Summary ............................................................................................................ 3
Introduction..................................................................................................................... 3 Project Objective............................................................................................................. 3 Conferences and Publications ......................................................................................... 4 Status............................................................................................................................... 4
Approach............................................................................................................................. 6 Introduction..................................................................................................................... 6 Program Goals, Research Objectives and Project Objectives ........................................ 6 Methodology................................................................................................................... 6 Description of the Technology........................................................................................ 7 Anticipated Benefits........................................................................................................ 8
Discussion........................................................................................................................... 9 Combustion Turbine Performance and Fault Diagnostic Module ................................ 10
Background............................................................................................................... 10 CTPFDM Development Philosophy......................................................................... 11 Program Overview.................................................................................................... 12 CTPFDM File Structure............................................................................................ 13
Main CTPFDM Directory..................................................................................... 14 Files for Monitoring Multiple Combustion Turbines ........................................... 14 CT Reference Model Files .................................................................................... 15 Users Manual ........................................................................................................ 15 File Directory Diagram......................................................................................... 15 Monitoring Multiple Combustion Turbines Simultaneously................................ 16
Using the Spreadsheet............................................................................................... 17 Main Menu Worksheet ......................................................................................... 17 Default Data Worksheet........................................................................................ 17 Diag. Thresh. Data Worksheet.............................................................................. 18 Fuel Properties Worksheet.................................................................................... 18 Gtmodel Worksheet .............................................................................................. 18 Inputs Worksheet .................................................................................................. 19 Report Worksheet ................................................................................................. 19 Diagnostics Worksheet ......................................................................................... 22 Chart Worksheets.................................................................................................. 23
Combined Cycle Performance and Fault Diagnostic Module ...................................... 23 Background............................................................................................................... 24 Program Overview.................................................................................................... 25 CCPFDM File Structure ........................................................................................... 26
Files for Monitoring Multiple Combined Cycle Plants ........................................ 26 CC Reference Model Files.................................................................................... 27
Using the Spreadsheet............................................................................................... 27 Main Menu Worksheet ......................................................................................... 27 Default Data Worksheet........................................................................................ 27
DOE/EPRI Combustion Turbine Diagnostic Heath Monitoring Project – Semiannual Report Report Period – October 1, 2003 to March 31, 2004 Contract Number – DE-FC26-01NT41233
Copyright 2004 Electric Power Research Institute, Inc. All right reserved.
Diag. Thresh. Data Worksheet.............................................................................. 28 Inputs Worksheet .................................................................................................. 28 Report Worksheet ................................................................................................. 30 Chart Worksheets.................................................................................................. 33
Remaining Life Module................................................................................................ 33 Program Overview.................................................................................................... 34 Theory and Module Development ............................................................................ 34
GER-3620J Algorithms ........................................................................................ 34 Creep-Fatigue Interaction ..................................................................................... 36 EPRI’s Hot Section Life Management Platform .................................................. 39 Module Development............................................................................................ 42
Future Work ...................................................................................................................... 43 References......................................................................................................................... 43

DOE/EPRI Combustion Turbine Diagnostic Heath Monitoring Project – Semiannual Report Report Period – October 1, 2003 to March 31, 2004 Contract Number – DE-FC26-01NT41233
Copyright 2004 Electric Power Research Institute, Inc. All right reserved.
List of Figures Figure 1 – CTPFDM Software Functional Flowchart Showing Interaction Between the CTPFDM
DLL, the CTPFDM.xls Excel Spreadsheet, and the Combustion Turbine Instrumentation. 13 Figure 2 – Schematic Diagram of the File Directory of CTPFDM .............................................. 16 Figure 3 – Schematic Diagram of a Combustion Turbine Showing Some of the Instruments Used
as Inputs to CTPFDM ........................................................................................................... 19 Figure 4 – Example Diagnostics Worksheet................................................................................. 23 Figure 5 – CCPFDM Software Functional Flowchart Showing Interaction Between the
CCPFDM DLL, the CCPFDM.xls Excel Spreadsheet, and the Plant Instrumentation ........ 26 Figure 6 – Hot Gas Path Maintenance Interval Criteria for a GE “F” Class Turbines based on
GER-3620J............................................................................................................................ 35 Figure 7 – Bi-Linear Creep-Fatigue Interaction Curve for Alloy 800H Compared to ASME
Section II Code Case N-47 Linearity Rule. .......................................................................... 37 Figure 8 – GE PGT-10 Transition Piece “Maintenance Line” Based on the Failure History of
Multiple Engines Surveyed by GE. ...................................................................................... 38 Figure 9 – “Conservative” Simplification of Creep-Fatigue Linearity Rule. ............................... 39 Figure 10 – Formulation of Life Consumption for Start-Based Criterion. ................................... 40 Figure 11 – Formulation of Life Consumption for Hours-Based Criterion.................................. 41 List of Tables Table 1 -- List of Files in Each CT Unit Sub-Directory ............................................................... 14 Table 2 -- List of CT Model Files Pre-Installed with CTPFDM.xls............................................. 15 Table 3 -- Measured Input Data List............................................................................................. 29
Copyright 2004 Electric Power Research Institute, Inc. All right reserved. 2
Abstract Power generators are concerned with the maintenance costs associated with the advanced turbines that they are purchasing. Since these machines do not have fully established operation and maintenance (O&M) track records, power generators face financial risk due to uncertain future maintenance costs. This risk is of particular concern, as the electricity industry transitions to a competitive business environment in which unexpected O&M costs cannot be passed through to consumers. These concerns have accelerated the need for intelligent software-based diagnostic systems that can monitor the health of a combustion turbine in real time and provide valuable information on the machine’s performance to its owner/operators. EPRI, Impact Technologies, Boyce Engineering, and Progress Energy have teamed to develop a suite of intelligent software tools integrated with a diagnostic monitoring platform that will, in real time, interpret data to assess the “total health” of combustion turbines. The Combustion Turbine Health Management System (CTHM) will consist of a series of dynamic link library (DLL) programs residing on a diagnostic monitoring platform that accepts turbine health data from existing monitoring instrumentation. The CTHM system will be a significant improvement over currently available techniques for turbine monitoring and diagnostics. CTHM will interpret sensor and instrument outputs, correlate them to a machine's condition, provide interpretative analyses, project servicing intervals, and estimate remaining component life. In addition, it will enable real-time anomaly detection and diagnostics of performance and mechanical faults, enabling power producers to more accurately predict critical component remaining useful life and turbine degradation.

DOE/EPRI Combustion Turbine Diagnostic Heath Monitoring Project – Semiannual Report Report Period – October 1, 2003 to March 31, 2004 Contract Number – DE-FC26-01NT41233
Copyright 2004 Electric Power Research Institute, Inc. All right reserved 3
Executive Summary Introduction Power producers are justifiably concerned with the maintenance costs associated with the advanced combustion turbines (CTs) they are purchasing today. While more efficient and environmentally clean than previous models, some advanced CT models do not have fully established operation and maintenance (O&M) track records. And without accurate information upon which to base maintenance decisions, optimizing system life while minimizing costs can be extremely difficult for operators. As a result, power producers face financial risk due to uncertain future maintenance costs and turbine life. This risk is of particular concern in today’s increasingly competitive business environment in which reserve margins are shrinking and unexpected O&M costs usually cannot be passed through to consumers. These concerns have accelerated the need for intelligent software-based diagnostic systems that can monitor the health of a CT in real time and provide owners and operators with valuable information on machine performance. While commercial systems—ranging from time-history database/display systems to model-specific operation/performance monitoring systems—are available, they have limited diagnostic capability and their results typically require expert interpretation. To date, neither CT manufacturers nor owners have developed a comprehensive diagnostic monitoring system, primarily because of the cost and the need for historical data from many units operating over the entire commercial operating spectrum. To meet this need, the Department of Energy selected EPRI to lead the development of a comprehensive suite of intelligent diagnostic tools for assessing the total health of CTs. The resulting Combustion Turbine Health Management (CTHM) system will improve the RAM of CTs in simple-cycle and combined-cycle configurations. The CTHM system will be a significant improvement over currently available techniques for turbine monitoring and diagnostics. CTHM will interpret sensor and instrument outputs, correlate them to a machine's condition, provide interpretative analyses, project servicing intervals, and estimate remaining component life. In addition, it will enable real-time anomaly detection and diagnostics of performance and mechanical faults, enabling power producers to more accurately predict critical component remaining useful life and turbine degradation.
Project Objective The objective of the proposed project is to develop new monitoring techniques for CT power generation in simple or combined-cycle configurations aimed at improving reliability, availability and maintainability (RAM) and overall performance/capacity factor. The project team will develop advanced, probabilistic and artificially intelligent
DOE/EPRI Combustion Turbine Diagnostic Heath Monitoring Project – Semiannual Report Report Period – October 1, 2003 to March 31, 2004 Contract Number – DE-FC26-01NT41233
Copyright 2004 Electric Power Research Institute, Inc. All right reserved 4
performance and mechanical fault diagnostics algorithms, sensor validation and recovery modules, as well as prognostics for maintenance-intensive CT areas. The objective stated above will be achieved via the following tasks:
Task 1: Sensor validation, recovery virtual sensor module Task 2: CT/CC performance diagnosis and prognostics Task 3: CT/CC combustion process diagnostics. Task 4: CT/CC stall detection and surge margin risk assessment Task 5: CT/CC mechanical anomaly detection and fault pattern diagnostics Task 6: CT/CC life limiting component prognostics Task 7: CT/CC database management and health management integration Task 8: Field validation Task 9: Project management and reporting
Conferences and Publications
• EPRI Interim Report 1004969, Combustion Turbine Diagnostic Health Monitoring: Sensor Validation and Recovery Module was published in December 2003.
• A draft technical paper has been prepared for submission to the International Gas Turbine Institute for presentation at the ASME Turbo Expo in June 2004. The paper outlines the technologies developed under the CT Diagnostic Health Monitoring program for application in an automated health monitoring system.
• The development work on the Performance Degradation and Fault Diagnostics Modules was presented to the Combustion Turbine and Combined Cycle O&M Program attendees at the Generation Advisory meeting in Scottsdale, Arizona.
• EPRI Technical Report 1004970, Combustion Turbine Health Monitoring: Combustion Turbine Performance and Fault Diagnostic Module, and EPRI Technical Report 1009491, Combustion Turbine Health Monitoring: Combined Cycle Performance and Fault Diagnostic Module were both published in March 2004.
Status Activities during the current period of performance focused on the development and completion of the following three software modules:
• Combustion Turbine Performance and Fault Diagnostic Module (CTPFDM). • Combined Cycle Performance and Fault Diagnostic Module (CCPFDM). • Remaining Life Module (RLM).
Both the CTPFDM and CCPFDM modules are Microsoft Excel spreadsheet-based performance-monitoring programs, where each program is capable of being linked real-time to plant operating data via third-party data historian software and can be set up to run automatically at user-specified intervals to create a continuous record of key performance indicators. These indicators include both actual and expected performance

DOE/EPRI Combustion Turbine Diagnostic Heath Monitoring Project – Semiannual Report Report Period – October 1, 2003 to March 31, 2004 Contract Number – DE-FC26-01NT41233
Copyright 2004 Electric Power Research Institute, Inc. All right reserved 5
parameters such as compressor efficiency and overall plant or gas turbine power output. These parameters are trended using pre-configured graphs in Excel to allow the user to quickly identify areas of degradation. The programs are capable of monitoring performance over the full range of plant operation including part-load and can also monitor gas turbines running on syngas for IGCC operation. The performance and fault diagnostic modules have been separated into two separate applications (CTPFDM for simple cycle units and CCPFDM for combined cycle units) to reflect the significant change in the capabilities and purpose of the applications. Both modules initially began as the performance degradation modules, but it was later discovered that the addition of the fault diagnostic capability made a very good fit with performance degradation prognostics. Alpha versions of both modules were sent to Progress Energy in November 2003, and the comments received from the alpha testing have been incorporated in the development of the beta version. Development was concluded on CTPFDM and CCPFDM in preparation for delivery on December 31, 2003 and on-site beta testing at Progress Energy’s simple cycle and combined cycle plant locations. Progress Energy has tested CTPFDM in on-line historical mode and identified several bugs that were corrected in the most recent update of CTPFDM (version 3.3) that was reissued to Progress Energy in March 2004. During this period, Progress Energy has not yet been able to test CCPFDM. However, both modules have been undergoing field-testing at the Arthur von Rosenberg power plant owned by City Public Service (CPS) of San Antonio, Texas. Test results on CTPFDM at CPS appear to be quite accurate and have been used as the basis for the technical paper that has been accepted for the ASME gas turbine conference in Austria. Test results on CCPFDM at CPS have not been as meaningful as they could be because CCPFDM requires % CT load as an input, and % CT load is not normally available in PI. Until changes to PI can be made, the default value for % CT load that is being used is the measured CT power divided by the CT’s ISO power rating. The final focus of effort during this period of development has centered on completing the Remaining Life Module (RLM). RLM is a spreadsheet that predicts the remaining hot section life of a GE heavy-duty gas turbine via two methods: EPRI’s Hot Section Life Management Platform algorithms and GE’s standard algorithms described in GER-3620J. The HSLMP algorithms are currently only applicable to the first stage rotating blade of the GE 7FA+ (MS7231) combustion turbine. The GER-3620J algorithms can be used for all of GE’s heavy-duty combustion turbines. Development was concluded on the RLM in preparation for delivery on March 31, 2004 and on-site beta testing at Progress Energy’s Asheville plant where the GE 7FA+ machines are used.
DOE/EPRI Combustion Turbine Diagnostic Heath Monitoring Project – Semiannual Report Report Period – October 1, 2003 to March 31, 2004 Contract Number – DE-FC26-01NT41233
Copyright 2004 Electric Power Research Institute, Inc. All right reserved 6
Approach Introduction Power generators are concerned with the maintenance costs associated with the advanced turbines that they are purchasing. Since these machines do not have fully established operation and maintenance (O&M) track records, power generators face financial risk due to uncertain future maintenance costs. This risk is of particular concern, as the electricity industry transitions to a competitive business environment in which unexpected O&M costs cannot be passed through to consumers. These concerns have accelerated the need for intelligent software-based diagnostic systems that can monitor the health of a combustion turbine in real time and provide valuable information on the machine’s performance to its owner/operators. Such systems would interpret sensor and instrument outputs, correlate them to the machine's condition, provide interpretative analyses, forward projections of servicing intervals, estimate remaining component life, and identify faults. EPRI, Impact Technologies, Boyce Engineering, and Progress Energy have teamed to develop a suite of intelligent software tools integrated with a diagnostic monitoring platform that will, in real time, interpret data to assess the “total health” of combustion turbines. The Combustion Turbine Health Management System (CTHM) will consist of a series of dynamic link library (DLL) programs residing on a diagnostic monitoring platform that accepts turbine health data from existing monitoring instrumentation. The CTHM system will be a significant improvement over currently available techniques for turbine monitoring and diagnostics. CTHM will interpret sensor and instrument outputs, correlate them to a machine's condition, provide interpretative analyses, project servicing intervals, and estimate remaining component life. In addition, it will enable real-time anomaly detection and diagnostics of performance and mechanical faults, enabling power producers to more accurately predict critical component remaining useful life and turbine degradation.
Program Goals, Research Objectives and Project Objectives The goal of this proposed project is to improve the reliability, availability and maintainability (RAM) and overall performance/capacity factor of combustion turbines by developing advanced health monitoring and management techniques. The objective is to develop a suite of intelligent software tools integrated with a diagnostic monitoring platform that will, in real time, interpret data to assess the “total health” of combustion turbines.
Methodology The project team will apply and adapt know-how developed under prior DOD/Navy/NASA programs aimed at advanced health monitoring of aviation gas

DOE/EPRI Combustion Turbine Diagnostic Heath Monitoring Project – Semiannual Report Report Period – October 1, 2003 to March 31, 2004 Contract Number – DE-FC26-01NT41233
Copyright 2004 Electric Power Research Institute, Inc. All right reserved 7
turbines. The project team will develop advanced probabilistic and artificially intelligent performance and mechanical fault diagnostics algorithms, sensory validation and recovery modules, and prognostics for maintenance-intensive CT areas.
Description of the Technology The Combustion Turbine Health Management System (CTHM) will consist of a series of dynamic link library (DLL) programs residing on a diagnostic monitoring platform that accepts turbine health data from existing monitoring instrumentation. The real-time CTHM application algorithms proposed are intended to produce a comprehensive array of intelligent tools for assessing the “total health” of a combustion turbine, both mechanically and thermodynamically. CTHM includes the integration of real-time anomaly detection and diagnostics of performance and mechanical faults in addition to the prediction of critical component remaining useful life and turbine degradation. Advanced signal processing algorithms utilizing correlation and coherence detection are combined with artificial intelligence and model-based algorithms to provide comprehensive coverage of the critical CT failure modes of interest. Prognostic algorithms have also been developed that accept diagnostic system results, model-based remaining useful life predictions, operating/maintenance histories and historical RAM data to provide real-time predictions on reliability and degraded performance of key CT components. Through proper utilization of these health management technologies, timely decisions can be made regarding unit operation and maintenance practices. The neural network algorithm operates by comparing the physical relationships between signals as determined from either a baseline empirical model or computer model of the turbine’s performance parameters. The fuzzy logic based sensor validation continuously checks the “normal” bands (membership functions) associated with each sensor signal at the current operating condition. When a signal goes outside these membership functions, while others remain within, an anomaly is detected associated with those specific sensors. Finally, signal correlation and special digital filters are used to determine if even small levels of noise are present on a particular signal. These approaches are implemented in parallel and then combined in a probabilistic data fusion process that determines the final confidence levels that a particular sensor has either failed or has suspect operation. The integration of prognostic technologies within existing diagnostic systems begins with validated sensor information on the engine being fed directly into the diagnostic algorithms for fault detection/isolation and classification. The ability of an enhanced diagnostic system to fuse information from multiple diagnostic sources together to provide a more confident diagnosis is emphasized along with a system's ability to estimate confidence and severity levels associated with a particular diagnosis. In a parallel mode, the validated sensor data and real-time current/past diagnostic information is utilized by the prognostic modules to predict future time-to-failure, failure rates and/or degraded engine condition (i.e., vibration alarm limits, performance margins, etc.). The prognostic modules will utilize physics-based, stochastic models taking into account

DOE/EPRI Combustion Turbine Diagnostic Heath Monitoring Project – Semiannual Report Report Period – October 1, 2003 to March 31, 2004 Contract Number – DE-FC26-01NT41233
Copyright 2004 Electric Power Research Institute, Inc. All right reserved 8
randomness in operation profiles, extreme operating events and component forcing. In addition, the diagnostic results will be combined with past history information to train real-time algorithms (such as neural networks or real-time probabilistic models) to continuously update the projections on remaining life. Once predictions of time-to-failure or degraded condition are determined with associated confidence bounds, the prognostic failure distribution projections can be used in a risk-based analysis to optimize the time for performing specific maintenance tasks. A process that examines the expected value between performing maintenance on an engine or component at the next opportunity (therefore reducing risk but at a cost of doing the maintenance) versus delaying maintenance action (potential continued increased risk but delaying maintenance cost) can be used for this purpose. The difference in risk between the two maintenance or operating scenarios and associated consequential and fixed costs can then be used to optimize the maintenance intervals or alter operational plans. As key aspect of the proposed technical approach, this project will tap a unique resource of engine fault data developed under the Navy and Air Force with its resulting diagnostic knowledge base. This test cell engine fault data is unavailable for heavy frame machines and will require many machine-operating years to duplicate. The project substantially reduces its development costs and subsequent field validation by using experts and limited land-based CT data to modify the existing flight engine diagnostic database.
Anticipated Benefits There is a great opportunity for power generation combustion turbines to become more reliable, operationally available and economically maintained through the use of enhanced diagnostic and prognostic strategies such as those presented in this proposal. The development and integration of enhanced diagnostic and prognostic algorithms that can predict, within a specified confidence bound, time-to-failure of critical engine components can provide many benefits including:
• Reduced overall life cycle costs of engines from installation to retirement • Ability to optimize maintenance intervals for specific engines or fleets of engines
and prioritization of tasks to be performed during the planned maintenance events • Increased up-time/availability of all engines within a fleet • Provides engineering justification for scheduling maintenance actions with
corresponding economic benefits clearly identifiable • Improved safety associated with operating and maintaining combustion turbine
engines The maintenance outage factors for the F/FA frame and the mature frame technology are significantly divergent, with CT core systems being the primary drivers with outage factors of 10.074% and 5.080%, respectively. The core combustion turbine system problems can be attributed to new-design introduction centered on inherent design flaws,
DOE/EPRI Combustion Turbine Diagnostic Heath Monitoring Project – Semiannual Report Report Period – October 1, 2003 to March 31, 2004 Contract Number – DE-FC26-01NT41233
Copyright 2004 Electric Power Research Institute, Inc. All right reserved 9
manufacturing/assembly problems, and the combustion system. These design break-in issues will eventually be supplanted by service-imposed mechanical/electrical degradation and outage assembly problems. Diagnostic monitoring as an integral component of a proactive maintenance program should certainly meet mature fleet RAM performance. By avoidance of serious damage and improved maintenance scheduling, 2% availability points are achievable. For each 500 MW combined cycle, this improvement represents 72,000 MWhr valued at $3M per year. For a 100 unit combined cycle fleet, or approximately half of the 30 GW new generation projected, a $300M per year cost-avoidance savings appears achievable. DOE has long played an essential role in bringing high performance CTs with its enabling metallurgy into the U.S. generation mix. The higher performance and fuel savings certainly offset the higher maintenance costs when compared to conventional CTs. Yet concerns exist about the overall RAM capability of the fleet in light of shrinking reserve margins and higher gas prices. With DOE and EPRI, important maintenance engineering and management tools can be delivered on a timely basis that would otherwise take an additional 5 years to deliver. These tools would be made available to all CT operators regardless of their EPRI membership status and direct contributions. Since all operators routinely calculate life consumption and perform hot section NDE, the introduction of new and improved validated methods will readily find acceptance with plant engineers and maintenance planners. Training courses and software maintenance fees would further support the expanded application and periodic necessary updating.
Discussion The prior semi-annual report reviewed the completion of the integrated Sensor Validation and Recovery Module and both the Combustion Turbine Performance Degradation Module and the Combined Cycle Performance Degradation Module.
During this report period, the Combustion Turbine Performance and Fault Diagnostic Module and the Combined Cycle Performance and Fault Diagnostic Module were delivered on December 31, 2003 for on-site beta testing at Progress Energy’s simple cycle and combined cycle plant locations. Also, development was concluded on Remaining Life Module in preparation for delivery on March 31, 2004 and on-site beta testing at Progress Energy’s Asheville CT location. The final focus of effort during this period of development has centered on the platform for the remaining project deliverables.

DOE/EPRI Combustion Turbine Diagnostic Heath Monitoring Project – Semiannual Report Report Period – October 1, 2003 to March 31, 2004 Contract Number – DE-FC26-01NT41233
Copyright 2004 Electric Power Research Institute, Inc. All right reserved 10
Combustion Turbine Performance and Fault Diagnostic Module CTPFDM is a spreadsheet that provides combustion turbine (CT) operators with a low-cost, easy-to-install, easy-to-use program for monitoring CT performance both on an overall basis and on a component-by-component basis. It can be used to diagnose the condition of a CT and to determine the benefits of maintenance actions such as an off-line compressor wash. The CTPFDM spreadsheet can be used in either an "off-line" fashion through manual entry of data or "on-line" through automatic real-time data input using links to the PI data historian supplied by OSI Software, Inc. Important features of the CTPFDM spreadsheet include:
• Capable of monitoring multiple combustion turbines simultaneously • Capable of monitoring combustion turbines of multiple makes and models • Capable of detecting fault conditions in critical components of the combustion
turbine
Background Monitoring the performance of the components of a CT allows a user to determine which portion of the engine may be responsible for an observed decrease in output or efficiency. Through regular monitoring, an operator will know when to execute maintenance actions, such as an off-line wash that can serve to restore machine performance back to its baseline. Monitoring the condition of the axial compressor in a CT is an essential task in improving the overall performance of the engine. Fouling of the axial compressor of a CT will result in a decrease in both compressor efficiency and air flow. As noted in the Axial Compressor Performance and Maintenance Guide (EPRI TR-111038), a decrease in compressor efficiency of one percentage point will typically cause a drop in CT power of 1 to 1.5% and an increase in CT heat rate of 1 to 1.5%. Similarly, a 1% decrease in inlet air flow will typically result in a 1.1% drop in power output and a 0.2% increase in heat rate. CTPFDM calculates both the actual and expected values of compressor efficiency and air flow to provide an indication of how well the compressor is performing. Built-in charts allow the user to trend these values over time, which facilitates rapid evaluation the compressor condition and of the effectiveness of on-line and off-line washes. Compressor fouling also causes the compressor discharge temperature to increase due to the lower compressor efficiency. Most modern CTs use compressor discharge air to cool the combustor liner, transition pieces, and the first several rows of nozzles and blades in the expander section. Consequently, increased compressor fouling means hotter air is

DOE/EPRI Combustion Turbine Diagnostic Heath Monitoring Project – Semiannual Report Report Period – October 1, 2003 to March 31, 2004 Contract Number – DE-FC26-01NT41233
Copyright 2004 Electric Power Research Institute, Inc. All right reserved 11
used to cool the hot section parts, which results in hotter metal temperatures and reduced parts life. CTPFDM calculates the actual CT firing temperature (also know as first turbine rotor inlet temperature). By keeping a log of the amount of time spent at a given firing temperature, a CT operator can track the service history of an engine. In addition, EPRI envisions integrating CTPFDM with EPRI's hot section lifing software in the future to provide an automatic evaluation of remaining life of the hot section parts. The turbine or expander section of a CT is another critical component in determining the overall performance of the engine. CTPFDM calculates both the actual and expected turbine section efficiency and trends it over time. While techniques for quick recovery of turbine section efficiency do not exist, knowing how much degradation has occurred can help a CT owner decide when a major overhaul needs to be scheduled. The CTPFDM performance calculation output includes parameters, which indicate the magnitude of degradation of critical CT components such as the compressor, combustion system, and turbine section. These diagnostic parameters are displayed in an easy-to-read table that allows the user to see at a glance potential problems, or faults, in critical CT components as they develop.
CTPFDM Development Philosophy Several software packages are already commercially available for the on-line monitoring of CT performance. In fact, EPRI sponsored the development of the initial version of one of the first on-line CT performance monitoring packages, EfficiencyMap. Rights to EfficiencyMap were later obtained by a commercial software firm and EfficiencyMap has subsequently been installed on more than 100 power plants. While commercially available on-line monitoring programs provide in-depth analysis of CT performance on a component-by-component basis, they are expensive to buy and expensive to implement in the field. For many CT operators, such an investment cannot be justified, particularly if their turbines are being used for peak-load operation only. One of the goals for CT Performance Degradation Module was to produce a package that would be both easy to set up and inexpensive. To achieve these goals, several compromises or cost-benefit trade-offs were made during the initial design phase of CTPFDM. These included:
• Display of the results would be limited to a series of Excel charts and a one-page report screen. The ability to export results to PI will allow users to develop customized reports and displays.
• The mathematical model of CT performance would simply be based on a curve-fit of the manufacturer's expected performance rather than aero-thermal model of the physical behavior of the machine.

DOE/EPRI Combustion Turbine Diagnostic Heath Monitoring Project – Semiannual Report Report Period – October 1, 2003 to March 31, 2004 Contract Number – DE-FC26-01NT41233
Copyright 2004 Electric Power Research Institute, Inc. All right reserved 12
Program Overview CTPFDM carries out six main functions when it is called by another program: data checking, measured (or actual) performance, expected performance, transpose (or corrected) performance, evaporative cooling performance, and fault diagnostics. The data checking function entails an evaluation of whether a complete set of input data is available and, if so, whether the data values make physical sense. (For example, if the compressor discharge temperature is colder than the compressor inlet temperature, an error message is issued and the calculation is not carried out.) The actual performance calculations are based on key measurements from the plant instrumentation. Standard thermodynamic engineering formulas are used to derive key performance parameters such as heat rate and compressor isentropic efficiency. Curve fits to the thermodynamic properties of nitrogen, oxygen, argon, carbon dioxide and water vapor are used to account for mixtures of dry air, water vapor and combustion products. The expected performance calculations are based on the manufacturer's expected performance data that has been entered by the user (or from the two built-in CT models). The corrected performance calculations transpose the actual performance results to "Standard Day" results by factoring out the effects of ambient conditions on CT performance. If the program detects that some form of inlet cooling system is in operation, CTPFDM calculates what the actual performance of the CT would be if the cooling system were not in operation. In this way, the user can see the benefits that are obtained by using inlet cooling. Fault diagnostics are based on rules developed by Dr. Meherwan Boyce. The diagnostic calculations result in logical "flags," which are evaluated for several combustion turbine parameters and used to alert the user to potentially excessive CT performance degradation. The CTPFDM DLL requires two types of inputs: CT model data files and measured data files. The CT model data define the expected performance of the machine including the impact of changes in ambient conditions. The files containing these data are termed "static data files", as they will be changed infrequently, if ever. The files containing the measured data are called "dynamic data files" as they are updated each time performance calculations are requested and describe the operating condition of the machine at one moment in time. All of the data files, static and dynamic, are accessed by the CTPFDM spreadsheet and displayed in the various worksheets of the spreadsheet.

DOE/EPRI Combustion Turbine Diagnostic Heath Monitoring Project – Semiannual Report Report Period – October 1, 2003 to March 31, 2004 Contract Number – DE-FC26-01NT41233
Copyright 2004 Electric Power Research Institute, Inc. All right reserved 13
The flowchart shown in Figure 1 depicts the interactions of the CTPFDM DLL with the CTPFDM spreadsheet (CTPFDM.xls). Measurements from the plant instrumentation are sent to the DCS (arrow 1). The user takes the data from the DCS and enters it in CTPFDM.xls (arrow 2). Then the user starts the calculation macro and the CTPFDM.xls writes the input data to ASCII files (arrow 3), and then calls the CTPFDM DLL (arrow 4). The CTPFDM DLL reads the ASCII input files (arrow 5), performs the calculations, and then writes the results to ASCII output files (arrow 6). The CTPFDM.xls then reads the output files and stores the data for display and trending (arrow 7).
CTPDM Input Data Files
DCS
CTPDM.XLS
CTPDM DLLCTPDM
Output Data Files
1
2
3
5 6
7
4
Field Instruments
Figure 1 – CTPFDM Software Functional Flowchart Showing Interaction Between the CTPFDM DLL, the CTPFDM.xls Excel Spreadsheet, and the Combustion
Turbine Instrumentation
CTPFDM File Structure The CTPFDM.xls spreadsheet is automatically installed in the directory (folder) specified by the user during the installation routine (the default directory is C:\Program Files\CTPFDM). In addition to the spreadsheet file, the installation program creates several other files and sub-directories.
DOE/EPRI Combustion Turbine Diagnostic Heath Monitoring Project – Semiannual Report Report Period – October 1, 2003 to March 31, 2004 Contract Number – DE-FC26-01NT41233
Copyright 2004 Electric Power Research Institute, Inc. All right reserved 14
Main CTPFDM Directory The files installed in the main CTPFDM directory (i.e., "C:\Program Files\CTPFDM" or the user-specified replacement) are:
• CTPFDM.xls, the CTPFDM Excel spreadsheet • CTPFDM.dll, the CTPFDM dynamic link library • Perfunit.dat, a text file containing the path of the data files for the CT unit to be
monitored • README.TXT, a text file directing the user to find help in either the CTPFDM
Quick Guide to Getting Started or the CTPFDM Spreadsheet User's Manual. • Status.sys, a text file containing basic technical information for the DLL • Uninst.isu, a reference file used if CTPFDM is uninstalled via the Windows
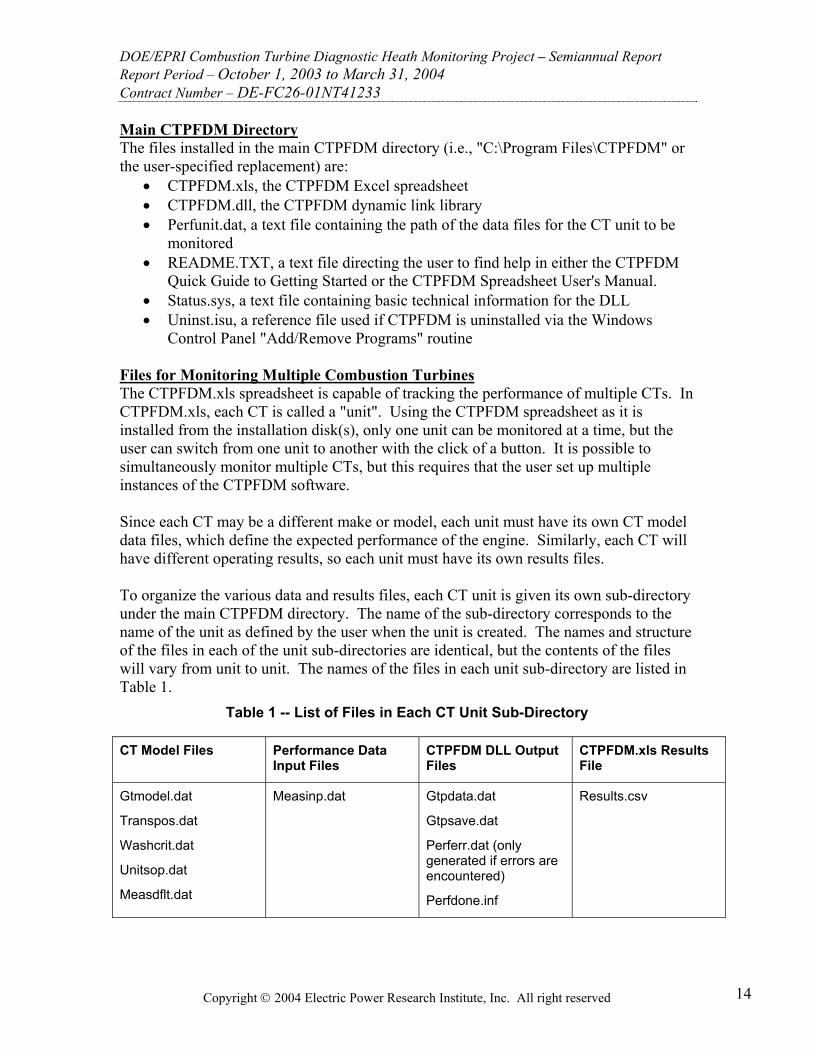
Control Panel "Add/Remove Programs" routine Files for Monitoring Multiple Combustion Turbines The CTPFDM.xls spreadsheet is capable of tracking the performance of multiple CTs. In CTPFDM.xls, each CT is called a "unit". Using the CTPFDM spreadsheet as it is installed from the installation disk(s), only one unit can be monitored at a time, but the user can switch from one unit to another with the click of a button. It is possible to simultaneously monitor multiple CTs, but this requires that the user set up multiple instances of the CTPFDM software. Since each CT may be a different make or model, each unit must have its own CT model data files, which define the expected performance of the engine. Similarly, each CT will have different operating results, so each unit must have its own results files. To organize the various data and results files, each CT unit is given its own sub-directory under the main CTPFDM directory. The name of the sub-directory corresponds to the name of the unit as defined by the user when the unit is created. The names and structure of the files in each of the unit sub-directories are identical, but the contents of the files will vary from unit to unit. The names of the files in each unit sub-directory are listed in Table 1.
Table 1 -- List of Files in Each CT Unit Sub-Directory
CT Model Files Performance Data Input Files
CTPFDM DLL Output Files
CTPFDM.xls Results File
Gtmodel.dat
Transpos.dat
Washcrit.dat
Unitsop.dat
Measdflt.dat
Measinp.dat Gtpdata.dat
Gtpsave.dat
Perferr.dat (only generated if errors are encountered)
Perfdone.inf
Results.csv
DOE/EPRI Combustion Turbine Diagnostic Heath Monitoring Project – Semiannual Report Report Period – October 1, 2003 to March 31, 2004 Contract Number – DE-FC26-01NT41233
Copyright 2004 Electric Power Research Institute, Inc. All right reserved 15
CT Model Files Performance Data Input Files
CTPFDM DLL Output Files
CTPFDM.xls Results File
Massfrac.dat
Molepct.dat
Perfops.dat
Missinp.dat
Partload.dat
Turbine.dat
Dpthresh.dat
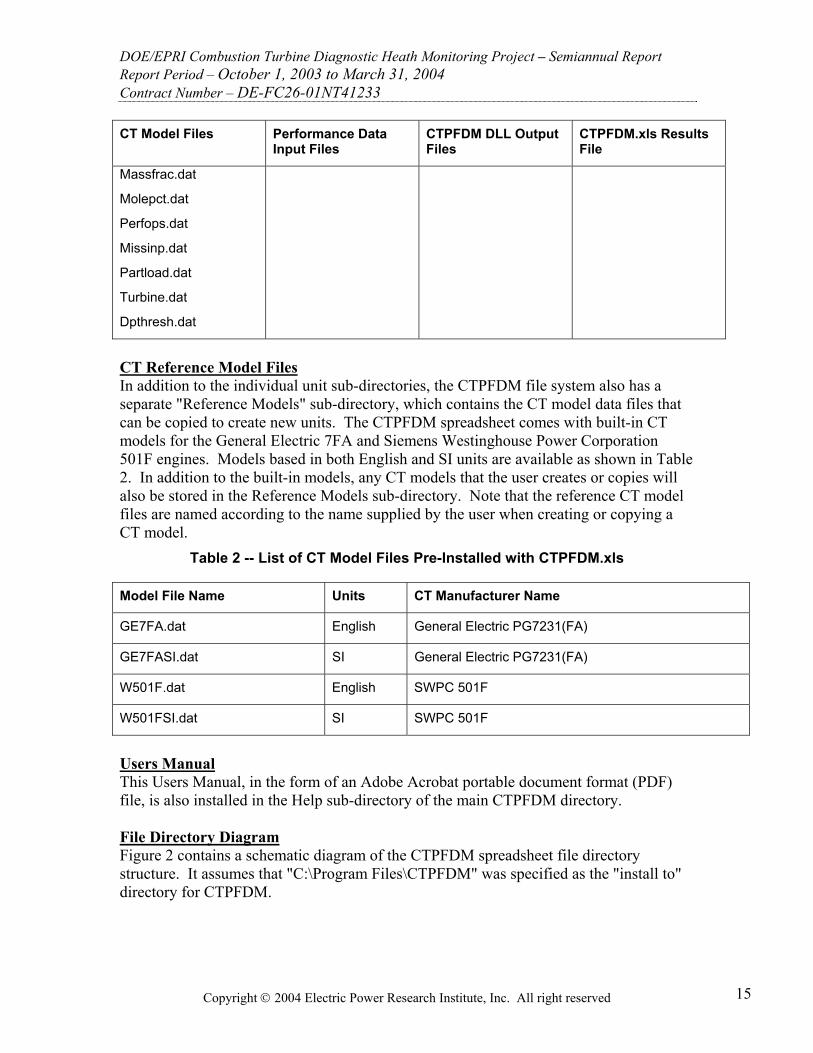
CT Reference Model Files In addition to the individual unit sub-directories, the CTPFDM file system also has a separate "Reference Models" sub-directory, which contains the CT model data files that can be copied to create new units. The CTPFDM spreadsheet comes with built-in CT models for the General Electric 7FA and Siemens Westinghouse Power Corporation 501F engines. Models based in both English and SI units are available as shown in Table 2. In addition to the built-in models, any CT models that the user creates or copies will also be stored in the Reference Models sub-directory. Note that the reference CT model files are named according to the name supplied by the user when creating or copying a CT model.
Table 2 -- List of CT Model Files Pre-Installed with CTPFDM.xls
Model File Name Units CT Manufacturer Name
GE7FA.dat English General Electric PG7231(FA)
GE7FASI.dat SI General Electric PG7231(FA)
W501F.dat English SWPC 501F
W501FSI.dat SI SWPC 501F
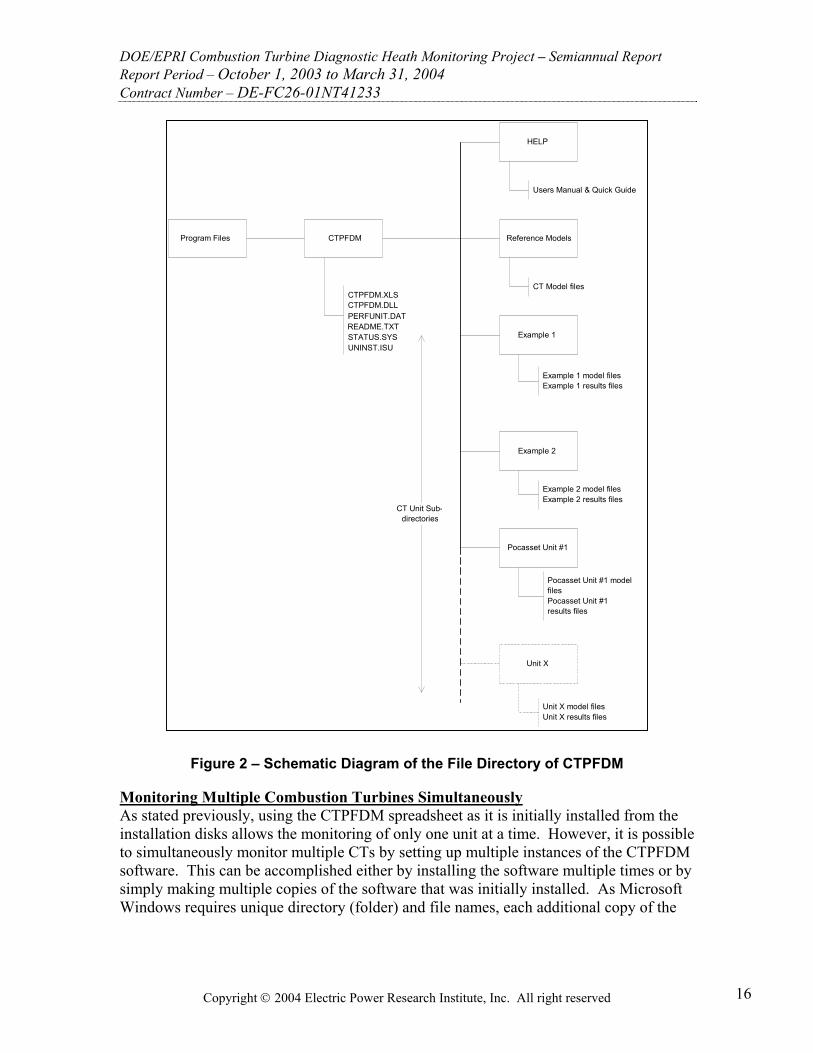
Users Manual This Users Manual, in the form of an Adobe Acrobat portable document format (PDF) file, is also installed in the Help sub-directory of the main CTPFDM directory. File Directory Diagram Figure 2 contains a schematic diagram of the CTPFDM spreadsheet file directory structure. It assumes that "C:\Program Files\CTPFDM" was specified as the "install to" directory for CTPFDM.
DOE/EPRI Combustion Turbine Diagnostic Heath Monitoring Project – Semiannual Report Report Period – October 1, 2003 to March 31, 2004 Contract Number – DE-FC26-01NT41233
Copyright 2004 Electric Power Research Institute, Inc. All right reserved 16
Figure 2 – Schematic Diagram of the File Directory of CTPFDM
Monitoring Multiple Combustion Turbines Simultaneously As stated previously, using the CTPFDM spreadsheet as it is initially installed from the installation disks allows the monitoring of only one unit at a time. However, it is possible to simultaneously monitor multiple CTs by setting up multiple instances of the CTPFDM software. This can be accomplished either by installing the software multiple times or by simply making multiple copies of the software that was initially installed. As Microsoft Windows requires unique directory (folder) and file names, each additional copy of the
CTPFDMProgram Files
CTPFDM.XLSCTPFDM.DLLPERFUNIT.DAT
STATUS.SYSUNINST.ISU
CT Unit Sub-directories
HELP
Users Manual & Quick Guide
Reference Models
CT Model files
Unit X model filesUnit X results files
Unit X
Pocasset Unit #1
Pocasset Unit #1 modelfilesPocasset Unit #1results files
Example 2
Example 2 model filesExample 2 results files
Example 1
Example 1 model filesExample 1 results files
README.TXT
DOE/EPRI Combustion Turbine Diagnostic Heath Monitoring Project – Semiannual Report Report Period – October 1, 2003 to March 31, 2004 Contract Number – DE-FC26-01NT41233
Copyright 2004 Electric Power Research Institute, Inc. All right reserved 17
software requires a different name. For example, there could be two copies of the software, one installed to a "C:\Program Files\CTPFDM Unit 1" directory and another copied to a "C:\Program Files\CTPFDM Unit 2" directory.
Using the Spreadsheet The CTPFDM.xls spreadsheet consists of a series of worksheets that the user can access by clicking on the tabs located at the bottom of the Excel screen. Whenever a CTPFDM spreadsheet is launched, the menus containing the gas turbine units and combustion turbine models will be updated if the workbook was not saved after creating or removing units or models. In addition, the spin button for the "Display Previous CTPFDM Results" feature will be updated to include any new results that were saved into the Results.csv file if the workbook was not saved after saving new results in Result.csv. Whenever a CTPFDM spreadsheet is launched, the menus containing the gas turbine units and combustion turbine models will be updated if the workbook was not saved after creating or removing units or models. In addition, the spin button for the "Display Previous CTPFDM Results" feature explained below will be updated to include any new results that were saved into the Results.csv file if the workbook was not saved after saving new results in Result.csv. If the spreadsheet data is different from the saved data (this could occur if a unit is deleted without saving the spreadsheet), there will be a message box asking the user if they want to import saved data or leave the spreadsheet data as it is. Normally, the user should choose to import the saved data. Main Menu Worksheet In this worksheet, the user can create a new unit, switch to another unit, remove a unit, or add/delete GT models. The currently existing units and models, and their respective units of measurement, are displayed at the right-hand side of the spreadsheet. It is important to remember that all units referred to and operated on in the Main Menu worksheet can only be monitored one at a time in the active workbook (i.e., the currently-displayed CTPFDM spreadsheet). Dealing with multiple units simultaneously requires that multiple instances of the CTPFDM spreadsheet are installed and running. Default Data Worksheet This worksheet contains the data for measured defaults, standard day conditions, and wash criteria. Default data can be used if measured data is unavailable from the plant. To import the data from the measured defaults file, click the button labeled "Get Defaults". The data and the units of measurement of the data (depending on the units used, English or SI) will be displayed in the respective cells and pull-down menus.

DOE/EPRI Combustion Turbine Diagnostic Heath Monitoring Project – Semiannual Report Report Period – October 1, 2003 to March 31, 2004 Contract Number – DE-FC26-01NT41233
Copyright 2004 Electric Power Research Institute, Inc. All right reserved 18
Diag. Thresh. Data Worksheet This worksheet contains the data for the diagnostic parameter threshold values (Dpthresh.dat). The diagnostic threshold data is used to make comparisons to the calculated degradation parameters to determine the current state of the inlet filter, compressor, combustion system, and turbine section, that is, whether the equipment is operating within normal parameters or whether action should be taken to correct an impending fault condition in the equipment. In determining fault conditions, some calculated degradation parameters must be greater than their threshold values to indicate a problem, while others must be less than their threshold values. Fuel Properties Worksheet The user can specify the composition of the natural gas by entering the mole percentage for each of the twenty-one components commonly found in natural gas. The sum of the values must equal 100%. The composition is used to determine the composition of the exhaust gas, which in turn is used in the firing temperature and energy balance calculations. In addition, if the LHV for natural gas has been set to zero in the Defaults worksheet, the composition will be used to calculate the LHV of the natural gas. The user can specify the composition of the liquid fuel by entering the mass fraction for each of the seven components commonly found in liquid fuel. The sum of the values must equal 1. The composition is used to determine the composition of the exhaust gas, which in turn is used in the firing temperature and energy balance calculations. In addition, if the LHV for liquid fuel has been set to zero in the Defaults worksheet, the composition along with the liquid fuel specific gravity will be used to calculate the LHV of the fuel. Gtmodel Worksheet The combustion turbine model data are supplied by the turbine manufacturer or owner. The purpose of the data is to provide a model to be used in calculating expected performance at either base- or peak-load over the anticipated range of ambient conditions. The CT model data include the design rating, the rated conditions, and the compressor inlet temperature effects. The rated conditions are the operating conditions cited by the manufacturer as the basis for the manufacturer's design rating. This is often ISO conditions, but in some cases may be the average expected site conditions or some other standard. The design rating data are the power, heat rate, and inlet air or exhaust flow that is expected at the rated conditions. Design rating data can be input for each operating mode (base and peak) and each fuel type (natural gas and liquid) accommodated by CTPFDM.

DOE/EPRI Combustion Turbine Diagnostic Heath Monitoring Project – Semiannual Report Report Period – October 1, 2003 to March 31, 2004 Contract Number – DE-FC26-01NT41233
Copyright 2004 Electric Power Research Institute, Inc. All right reserved 19
Inputs Worksheet The measured inputs to CTPFDM include up to 43 instrument signals, plus two signals from the control system indicating the firing mode (base or peak) and fuel type (gas or liquid), and three inputs generated by the user which specify the name of the CT unit and the date and time that the instrument data was captured. CTPFDM can handle a variety of SI and English units for the inputs, but if the units of measurement do not match the "standard" CTPFDM units, they will be converted internally when the CTPFDM DLL is called. All results will be reported in the standard CTPFDM units. Figure 3 shows the locations of some of the 43 instruments on a schematic diagram of a combustion turbine. It should be noted that not all 43 instruments are required in order to obtain results from CTPFDM.
Figure 3 – Schematic Diagram of a Combustion Turbine Showing Some of the Instruments Used as Inputs to CTPFDM
Report Worksheet This worksheet displays all of the results calculated by running the CTPFDM DLL, with the exception of fault diagnostics, which are shown on a separate worksheet. If there are error messages, these will be displayed at the bottom of this worksheet. Depending on
Exhaust
Generator
Nat. Gasor
Distillate
F
BellmouthStatic dP
Filter dP
T
P T
F F
Power
MW
RH RelativeHumidity
dP
dP
P
BarometricPressure
Water orSteam
T
AmbientTemperature
dP
Total InletdP
dP
DOE/EPRI Combustion Turbine Diagnostic Heath Monitoring Project – Semiannual Report Report Period – October 1, 2003 to March 31, 2004 Contract Number – DE-FC26-01NT41233
Copyright 2004 Electric Power Research Institute, Inc. All right reserved 20
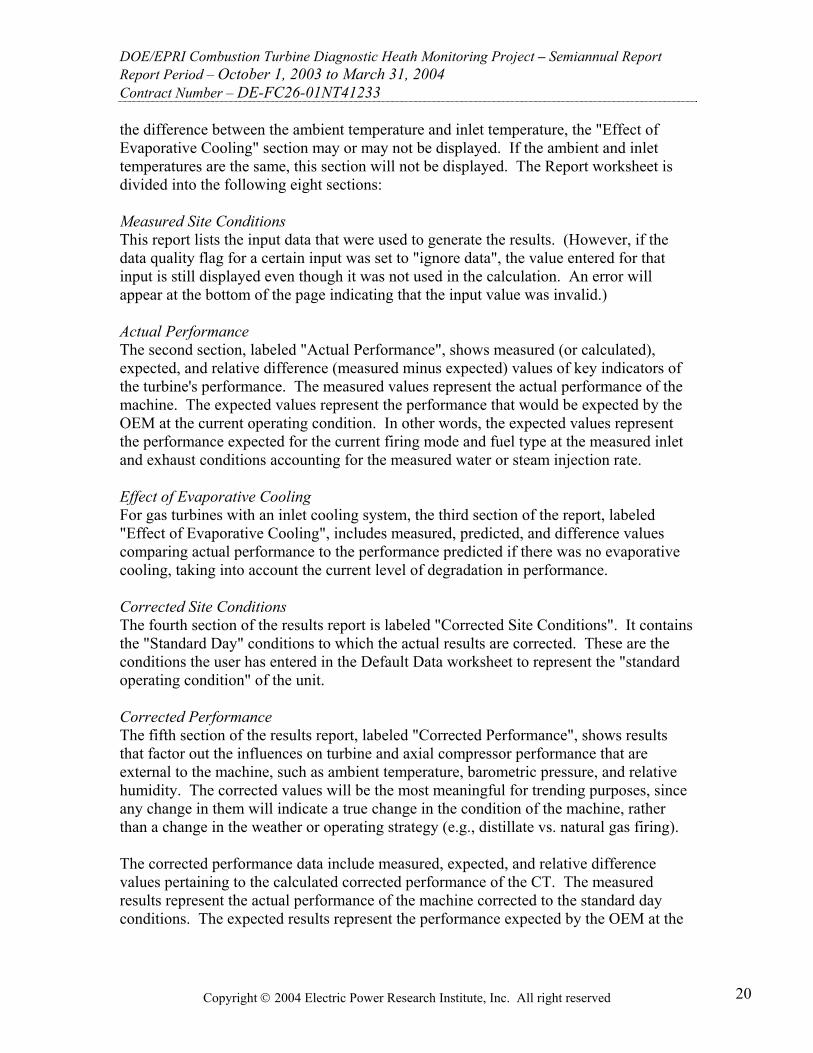
the difference between the ambient temperature and inlet temperature, the "Effect of Evaporative Cooling" section may or may not be displayed. If the ambient and inlet temperatures are the same, this section will not be displayed. The Report worksheet is divided into the following eight sections: Measured Site Conditions This report lists the input data that were used to generate the results. (However, if the data quality flag for a certain input was set to "ignore data", the value entered for that input is still displayed even though it was not used in the calculation. An error will appear at the bottom of the page indicating that the input value was invalid.) Actual Performance The second section, labeled "Actual Performance", shows measured (or calculated), expected, and relative difference (measured minus expected) values of key indicators of the turbine's performance. The measured values represent the actual performance of the machine. The expected values represent the performance that would be expected by the OEM at the current operating condition. In other words, the expected values represent the performance expected for the current firing mode and fuel type at the measured inlet and exhaust conditions accounting for the measured water or steam injection rate. Effect of Evaporative Cooling For gas turbines with an inlet cooling system, the third section of the report, labeled "Effect of Evaporative Cooling", includes measured, predicted, and difference values comparing actual performance to the performance predicted if there was no evaporative cooling, taking into account the current level of degradation in performance. Corrected Site Conditions The fourth section of the results report is labeled "Corrected Site Conditions". It contains the "Standard Day" conditions to which the actual results are corrected. These are the conditions the user has entered in the Default Data worksheet to represent the "standard operating condition" of the unit. Corrected Performance The fifth section of the results report, labeled "Corrected Performance", shows results that factor out the influences on turbine and axial compressor performance that are external to the machine, such as ambient temperature, barometric pressure, and relative humidity. The corrected values will be the most meaningful for trending purposes, since any change in them will indicate a true change in the condition of the machine, rather than a change in the weather or operating strategy (e.g., distillate vs. natural gas firing). The corrected performance data include measured, expected, and relative difference values pertaining to the calculated corrected performance of the CT. The measured results represent the actual performance of the machine corrected to the standard day conditions. The expected results represent the performance expected by the OEM at the
DOE/EPRI Combustion Turbine Diagnostic Heath Monitoring Project – Semiannual Report Report Period – October 1, 2003 to March 31, 2004 Contract Number – DE-FC26-01NT41233
Copyright 2004 Electric Power Research Institute, Inc. All right reserved 21
standard day conditions. The expected values should not change over time, as long as the standard day conditions are not changed. Axial Compressor Wash Indicator The sixth section of the results report is the axial compressor wash indicator. CTPFDM compares the calculated degradation (measured minus expected) in power and inlet air flow to the input values of the corresponding wash criteria data. If either of the calculated differences exceeds the corresponding input value, the software sets the wash indicator to "yes" to indicate the need to wash the axial compressor. When the calculated differences in power and inlet air flow are both below their corresponding wash criteria values, the wash indicator is set to "no". If air flow is not measured directly or calculated from the bellmouth static pressure drop, then the wash indicator is based only on the degradation in power. While compressor isentropic efficiency is also a key indicator of compressor efficiency, the difference between actual and expected compressor efficiency is not used as a wash criteria. This is because the expected value of compressor efficiency is normally not readily available to the CT operator. In addition, the absolute accuracy of the calculated efficiency is subject to errors due to inherent biases in the measurement of the compressor discharge temperature and pressure. Mission Heat Rate Results The seventh section of the results report is labeled "Mission Heat Rate Results". "Mission heat rate" is defined as the total fuel consumed by the turbine divided by the total power output of the turbine over the course of one "mission" (i.e., a complete operating run of a turbine from start-up to shutdown). Therefore, the mission heat rate takes into account the fuel needed to bring the turbine to its "full-speed, no-load" condition, as well as the fuel used during lower efficiency part-load operation as the turbine comes up to full output. Mission heat rate should provide the user with a more accurate indication of a turbine's variable operating cost than simply looking at the heat rate at full load. Mission heat rate results include the following parameters:
• Fuel Consumption • Power Production • Heat Rate
Note that the mission heat rate calculations are optional. The user can configure the calculations by editing the Missinp.dat file (located in each unit sub-directory) using any text editor such as Microsoft's Notepad. Missinp.dat contains an option flag that specifies whether or not the mission heat rate calculations are to be performed. Also included in this file is an option flag which specifies whether or not the mission heat rate values are

DOE/EPRI Combustion Turbine Diagnostic Heath Monitoring Project – Semiannual Report Report Period – October 1, 2003 to March 31, 2004 Contract Number – DE-FC26-01NT41233
Copyright 2004 Electric Power Research Institute, Inc. All right reserved 22
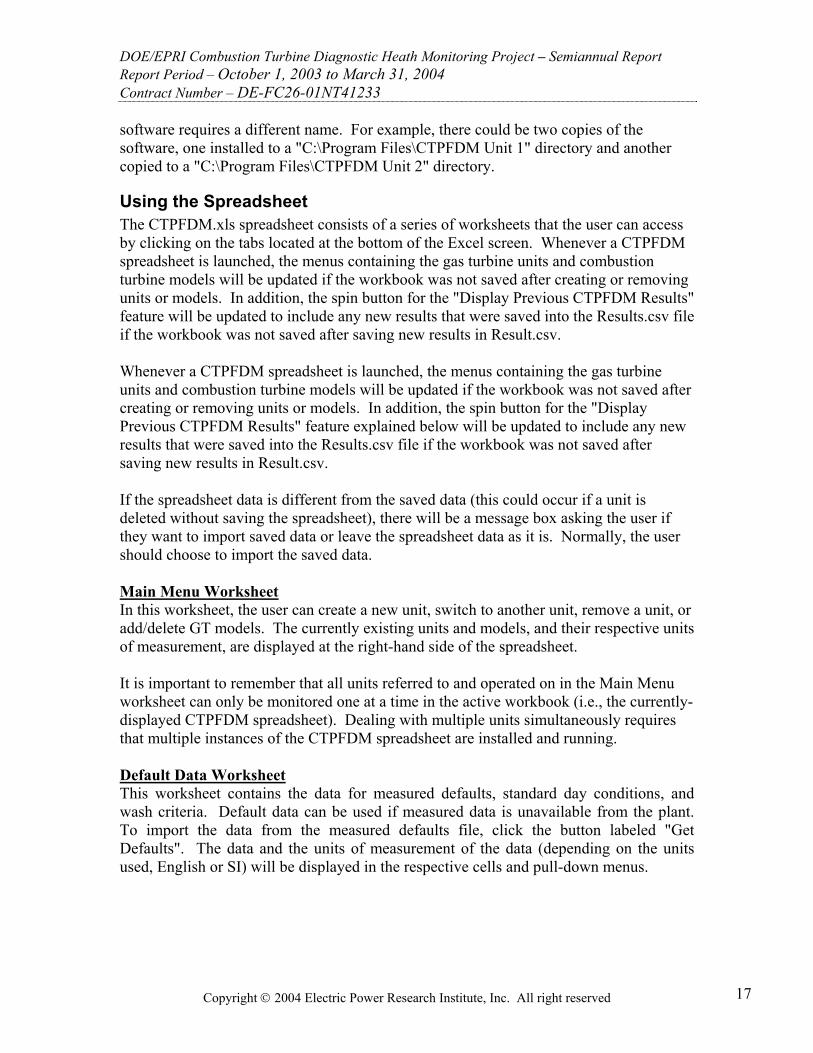
to be reset, as well as the update interval to be used in the calculations (i.e., the time (in seconds) elapsed since the last mission heat rate calculations were performed). Error Messages The eighth and final section of the report lists any error messages that were generated during the execution of the CTPFDM DLL. Diagnostics Worksheet The Diagnostics worksheet contains a table, or "matrix", showing the status of nine potential CT fault conditions. The following fault condition parameters are included:
• Clogged Inlet Filter • Compressor Fouling • Compressor Blade Damage • Clogged Fuel Nozzles • Cracked Combustor Liner • Crossover Tube Failure • Bowed Nozzle • Turbine Blade Damage • High Turbine Blade Temperature • Turbine Section Fouling
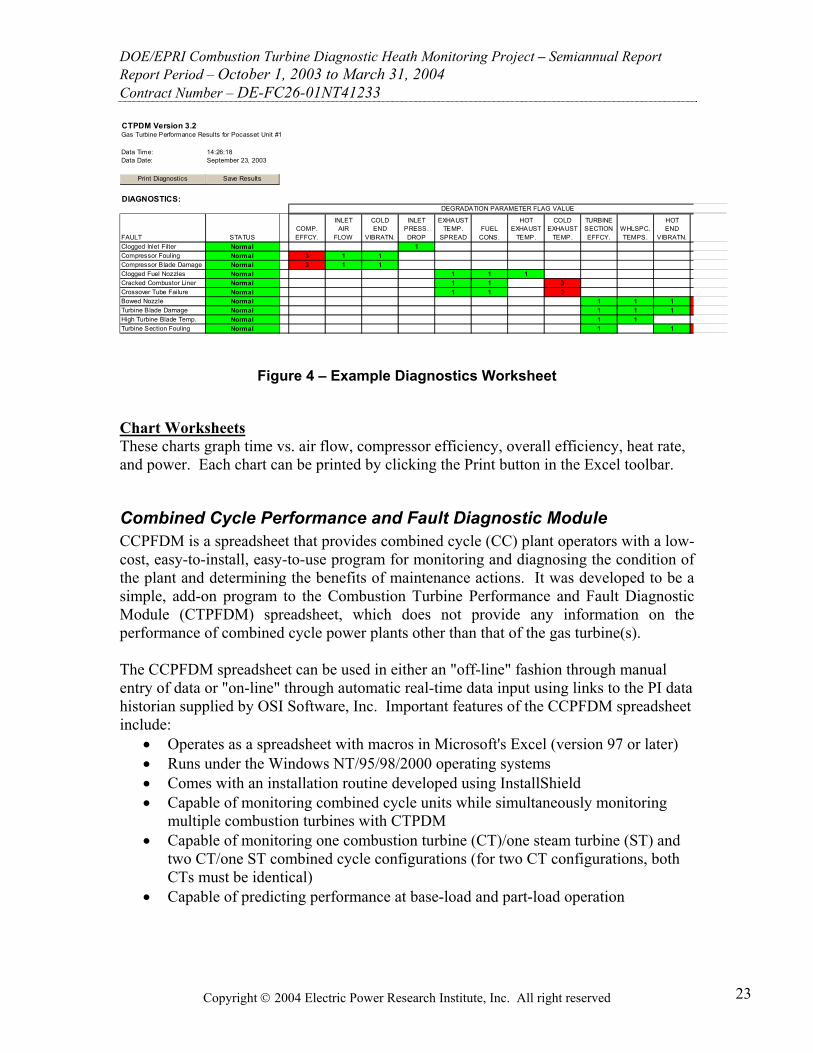
The nine faults are listed in the left-most column of the diagnostics table, followed on the right by the status of each fault and the twelve individual degradation parameter flag values used to determine each fault condition. The individual degradation parameter flags can have values of 0, 1, 2, or 3. A value of zero (0) represents an "Undetermined" condition caused by a lack of valid input data. A value of one (1) represents a "Normal", or no-fault, condition. A value of two (2) represents an "Alert" condition in which the operator should be prepared to take action or seek collaborating evidence. A value of three (3) represents an "Action Required", or fault, condition that should be immediately investigated. Similarly, each fault is assigned a status of "Undetermined", "Normal", "Alert", or "Action Required" based on an evaluation of the highlighted individual degradation parameter flags in the right-hand columns of the table. Cells containing status and degradation parameter flags are highlighted using the following color scheme: 0 or "Undetermined" - gray, 1 or "Normal" - green, 2 or "Alert" - yellow, 3 or "Action Required" - red. An example Diagnostics worksheet is shown in Figure 4.
DOE/EPRI Combustion Turbine Diagnostic Heath Monitoring Project – Semiannual Report Report Period – October 1, 2003 to March 31, 2004 Contract Number – DE-FC26-01NT41233
Copyright 2004 Electric Power Research Institute, Inc. All right reserved 23
Figure 4 – Example Diagnostics Worksheet
Chart Worksheets These charts graph time vs. air flow, compressor efficiency, overall efficiency, heat rate, and power. Each chart can be printed by clicking the Print button in the Excel toolbar.
Combined Cycle Performance and Fault Diagnostic Module CCPFDM is a spreadsheet that provides combined cycle (CC) plant operators with a low-cost, easy-to-install, easy-to-use program for monitoring and diagnosing the condition of the plant and determining the benefits of maintenance actions. It was developed to be a simple, add-on program to the Combustion Turbine Performance and Fault Diagnostic Module (CTPFDM) spreadsheet, which does not provide any information on the performance of combined cycle power plants other than that of the gas turbine(s). The CCPFDM spreadsheet can be used in either an "off-line" fashion through manual entry of data or "on-line" through automatic real-time data input using links to the PI data historian supplied by OSI Software, Inc. Important features of the CCPFDM spreadsheet include:
• Operates as a spreadsheet with macros in Microsoft's Excel (version 97 or later) • Runs under the Windows NT/95/98/2000 operating systems • Comes with an installation routine developed using InstallShield • Capable of monitoring combined cycle units while simultaneously monitoring
multiple combustion turbines with CTPDM • Capable of monitoring one combustion turbine (CT)/one steam turbine (ST) and
two CT/one ST combined cycle configurations (for two CT configurations, both CTs must be identical)
• Capable of predicting performance at base-load and part-load operation
CTPDM Version 3.2Gas Turbine Performance Results for Pocasset Unit #1
Data Time: 14:26:18Data Date: September 23, 2003
DIAGNOSTICS:
FAULT STATUSCOMP.EFFCY.
INLETAIR
FLOW
COLDEND
VIBRATN.
INLETPRESS.DROP
EXHAUSTTEMP.
SPREADFUEL
CONS.
HOTEXHAUST
TEMP.
COLDEXHAUST
TEMP.
TURBINESECTIONEFFCY.
WHLSPC.TEMPS.
HOTEND
VIBRATN.Clogged Inlet Filter Normal 1Compressor Fouling Normal 3 1 1Compressor Blade Damage Normal 3 1 1Clogged Fuel Nozzles Normal 1 1 1Cracked Combustor Liner Normal 1 1 3Crossover Tube Failure Normal 1 1 3Bowed Nozzle Normal 1 1 1Turbine Blade Damage Normal 1 1 1High Turbine Blade Temp. Normal 1 1Turbine Section Fouling Normal 1 1
DEGRADATION PARAMETER FLAG VALUE
Print Diagnostics Save Results

DOE/EPRI Combustion Turbine Diagnostic Heath Monitoring Project – Semiannual Report Report Period – October 1, 2003 to March 31, 2004 Contract Number – DE-FC26-01NT41233
Copyright 2004 Electric Power Research Institute, Inc. All right reserved 24
• Capable of detecting fault conditions in critical components of a combined cycle plant
• Capable of handling English or metric (SI) units • Capable of importing CC data from and results to a PI database via OSI's PI
DataLink Excel Add-In
Background When examining the performance of a combined cycle, there are four major pieces of the plant that could impact performance: the combustion turbine (CT), the heat recovery steam generator (HRSG), the steam turbine (ST), and the condenser/cooling water system (COND). Degradation in the performance of any one of these pieces will result in a decrease in the output of the steam turbine. Consequently, a drop in the expected output of the ST may not indicate a problem with the physical condition of the steam turbine. A comprehensive performance monitoring program for a combined cycle would be able to determine the ultimate source of the decrease in steam turbine output, whether it be due to HRSG or condenser fouling or CT compressor performance, or damage to the ST blades. This is the type of information one can obtain from GE’s EfficiencyMap™ or one of its competitors. On the other hand, the performance of a combined cycle is also influenced by factors external to the equipment, such as the ambient temperature and the condenser cooling water temperature. If an operator could compare actual plant performance to the plant performance expected for the current set of external conditions, he or she would then at least know whether the plant was operating near its expected performance on an overall basis (i.e., overall output and overall heat rate). If it was not, then more detailed analysis could be performed off-line to determine the source of the degradation. This is the approach EPRI has used for CCPFDM. To obtain the overall expected performance, CCPFDM uses the approach used by Siemens Westinghouse for predicting the expected performance of a combined cycle power plant (Ref. 1). In general, Siemens Westinghouse uses a series of correction curves to account for the change in total plant output, heat rate, and steam turbine exhaust flow. The latter is then used to determine what the steam turbine exhaust pressure should be for the measured dry bulb or wet bulb conditions. A final correction is then made for any deviation between the calculated expected steam turbine exhaust pressure and the design assumption (typically, 2" Hga). If correction curves from the OEM similar to those in Ref. 1 are not available, the plant owner (or others) could derive the correction curves by creating a model of the plant using combined cycle simulation software such as GE’s GateCycle™ and executing a series of runs to simulate the impact of changes in ambient conditions. Development of such a model could cost $10,000 to $20,000, depending on the complexity of the plant.
DOE/EPRI Combustion Turbine Diagnostic Heath Monitoring Project – Semiannual Report Report Period – October 1, 2003 to March 31, 2004 Contract Number – DE-FC26-01NT41233
Copyright 2004 Electric Power Research Institute, Inc. All right reserved 25
The CCPFDM performance calculation output includes parameters that indicate the magnitude of degradation of the CT(s), HRSG, ST, and COND components of the plant. These diagnostic parameters are displayed in an easy-to-read table that allows the user to see at a glance potential problems, or faults, in critical CC components as they develop.
Program Overview CCPFDM carries out four main functions when a performance calculation is requested: data checking, measured performance, expected performance, and fault diagnostics. The data checking function entails an evaluation of whether a complete set of input data is available and, if so, whether the data values make physical sense. The actual performance calculations are based on key measurements from the plant instrumentation. Standard thermodynamic engineering formulas are used to derive key performance parameters such as heat rate. The expected performance calculations are based on the manufacturer's expected performance data. Fault diagnostics are based on rules developed by Dr. Meherwan Boyce. The diagnostic calculations result in logical "flags" which are evaluated for the four major pieces of the plant and used to alert the user to potentially excessive CC performance degradation. The CCPFDM DLL requires two types of inputs: CC model data files and measured data files. The CC model data define the expected performance of the plant including the impact of changes in ambient conditions. The files containing these data are termed "static data files", as they will be changed infrequently, if ever. The files containing the measured data are called "dynamic data files" as they are updated each time performance calculations are requested and describe the operating condition of the plant at one moment in time. All of the dynamic data files and some of the static files are accessed by the CCPFDM spreadsheet and displayed in the various worksheets of the spreadsheet. The flowchart shown in Figure 5 depicts the interactions of the CCPFDM DLL with the CCPFDM spreadsheet (CCPFDM.xls). Measurements from the plant instrumentation are sent to the DCS (arrow 1). The user takes the data from the DCS and enters it in CCPFDM.xls (arrow 2). Then the user starts the calculation macro and the CCPFDM.xls writes the input data to ASCII files (arrow 3), and then calls the CCPFDM DLL (arrow 4). The CCPFDM DLL reads the ASCII input files (arrow 5), performs the calculations, and then writes the results to ASCII output files (arrow 6). The CCPFDM.xls then reads the output files and stores the data for display and trending (arrow 7).

DOE/EPRI Combustion Turbine Diagnostic Heath Monitoring Project – Semiannual Report Report Period – October 1, 2003 to March 31, 2004 Contract Number – DE-FC26-01NT41233
Copyright 2004 Electric Power Research Institute, Inc. All right reserved 26
Figure 5 – CCPFDM Software Functional Flowchart Showing Interaction Between the CCPFDM DLL, the CCPFDM.xls Excel Spreadsheet, and the Plant
Instrumentation
CCPFDM File Structure The CCPFDM file structure is similar to the CTPFDM structure. Some of the main differences are described below. Files for Monitoring Multiple Combined Cycle Plants The CCPFDM.xls spreadsheet is capable of tracking the performance of multiple combined cycle (CC) plants. In CCPFDM.xls, each CC is called a "unit". Using the CCPFDM spreadsheet as it is installed from the installation disks, only one unit can be monitored at a time, but the user can switch from one unit to another with the click of a button. It is possible to simultaneously monitor multiple CCs, but this requires that the user set up multiple instances of the CCPFDM software. Since each CC may be a different make or model, each unit must have its own CC model data files, which define the expected performance of the engine. Similarly, each CC will have different operating results, so each unit must have its own results files.
DCS
CCPFDM.XLS
CCPFDM DLLCCPFDM
Output Data Files
1
2
3
5 6
7
4
FieldInstruments
CCPFDM Input Data
Files

DOE/EPRI Combustion Turbine Diagnostic Heath Monitoring Project – Semiannual Report Report Period – October 1, 2003 to March 31, 2004 Contract Number – DE-FC26-01NT41233
Copyright 2004 Electric Power Research Institute, Inc. All right reserved 27
To organize the various data and results files, each CC unit is given its own sub-directory under the main CCPFDM directory. The name of the sub-directory corresponds to the name of the unit as defined by the user when the unit is created. The names and structure of the files in each of the unit sub-directories are identical, but the contents of the files will vary from unit to unit. CC Reference Model Files In addition to the individual unit sub-directories, the CCPFDM file system also has a separate "Reference Models" sub-directory, which contains CC model data files that can be copied to create new units. The CCPFDM spreadsheet comes with a built-in CC model for a "2-on-1" combined cycle plant with two Siemens Westinghouse Power Corp. (SWPC) 501F engines. In addition to the built-in model, any CC models that the user copies will also be stored in the Reference Models sub-directory. Note that the reference CC model files are named according to the name supplied by the user when copying a CC model.
Using the Spreadsheet Like CTPPFDM, the CCPFDM.xls spreadsheet consists of a series of worksheets that the user can access by clicking on the tabs located at the bottom of the Excel screen. Whenever a CCPFDM spreadsheet is launched, the menus containing the combined cycle units and reference models will be updated if the workbook was not saved before creating or removing units or models. In addition, the spin button for the "Display Previous CCPFDM Results" feature will be updated to include any new results that were saved into the Results.csv file if the workbook was not saved after saving new results. Main Menu Worksheet In this worksheet, the user can create a new unit, switch to another unit, remove a unit, or copy/delete CC models. The currently existing units and models, and their respective units of measurement, are displayed at the right-hand side of the spreadsheet. It is important to remember that all units referred to and operated on in the Main Menu worksheet can only be monitored one at a time in the active workbook (i.e., the currently-displayed CCPFDM spreadsheet). Dealing with multiple units simultaneously requires that multiple instances of the CCPFDM spreadsheet are installed and running. Default Data Worksheet For some inputs, CCPFDM allows the substitution of "default" values in case on-line measurements are not available. Default values can be entered for the following measurements:
• Barometric Pressure • Ambient Relative Humidity

DOE/EPRI Combustion Turbine Diagnostic Heath Monitoring Project – Semiannual Report Report Period – October 1, 2003 to March 31, 2004 Contract Number – DE-FC26-01NT41233
Copyright 2004 Electric Power Research Institute, Inc. All right reserved 28
• CT Inlet Pressure Drop • CT Exhaust Pressure Drop • Steam Turbine Exhaust Quality • Measured Plant Auxiliary Load
Diag. Thresh. Data Worksheet The diagnostic threshold data is used to make comparisons to the calculated degradation parameters to determine the current state of the CT(s), HRSG, condenser, and steam turbine, that is, whether the equipment is operating within normal parameters or whether action should be taken to correct an impending fault condition in the equipment. "Alert" and "Action Required" threshold values should be specified for each of the following:
• Combustion Turbine #1 • Combustion Turbine #2 (if applicable) • Heat Recovery Steam Generator (HRSG) • Condenser • Steam Turbine
The diagnostic threshold data values on this worksheet are input as percents. The more negative the value of the calculated parameter, the greater the indicated degradation of the particular piece of equipment. That is, the calculated degradation parameters must be less than or equal to their threshold values to indicate a problem. Logic used in the comparison of user-specified threshold values to calculated values is shown below.
Normal Calc. Value > User-Spec. "Alert" Thresh. Value
Alert Calc. Value <= User-Spec. "Alert" Thresh. Value but > User-Spec. "Action Req." Thresh. Value
Action Req. Calc. Value <= User-Spec. "Action Req." Thresh. Value
Inputs Worksheet The measured inputs to CCPFDM include up to 35 instrument signals (24 for one CT), plus four signals (two for one CT) from the control system indicating the CT and duct burner fuel type (gas or liquid), and three inputs generated by the user which specify the name of the CT unit and the date and time that the instrument data was captured. Table 3 contains a complete list of the measured input data including the "standard" CCPFDM units of measurement. CCPFDM can handle a variety of SI and English units for the inputs, but if the units of measurement do not match the "standard" CCPFDM units, they will be converted internally when the CCPFDM DLL is called. All results will be reported in the standard CCPFDM units.

DOE/EPRI Combustion Turbine Diagnostic Heath Monitoring Project – Semiannual Report Report Period – October 1, 2003 to March 31, 2004 Contract Number – DE-FC26-01NT41233
Copyright 2004 Electric Power Research Institute, Inc. All right reserved 29
Table 3 -- Measured Input Data List
Inputs Row #
Description English Units
SI Units Comments
3 Unit Name N/A N/A Maximum of 40 characters
4 Date of Data Capture N/A N/A MM-DD-YYYY
5 Time of Data Capture N/A N/A HH:MM:SS
6 Barometric Pressure " Hga bara Default value available
7 Ambient Temperature °F °C
8 Net Plant Power MW MW Optional1
9 Steam Turbine Generator Power MW MW Optional2
10 Steam Turbine Exhaust Flow Lb/sec kg/sec
11 Steam Turbine Exhaust Pressure “ Hga mbara
12 ST Extract. Steam Flow Rate Lb/sec kg/sec Required only for extraction STs
13 ST Extraction Steam Pressure psig barg Required only for extraction STs
14 Steam Turbine Exhaust Quality fraction fraction Default value available
15 Measured Plant Auxiliary Load MW MW Optional3
16 CT #1 Compressor Inlet Temp. °F °C
17 CT #1 Inlet Pressure Drop " H2O mbar Default value available
18 CT #1 Exhaust Pressure Drop " H2O mbar Default value available
19 CT #1 Meas. Generator Power MW MW
20 CT #1 Fuel Type Option N/A N/A 0 = natural gas fuel, 1 = liquid fuel
21 CT #1 Duct Burn. Fuel Type Op. N/A N/A 0 = natural gas fuel, 1 = liquid fuel
22 CT #1 Part-Load Level % % Percent of full load
23 CT #1 Natural Gas Fuel Flow Lb/sec kg/sec
24 CT #1 Liquid Fuel Flow Lb/sec kg/sec
25 CT #1 NOx Steam Inj. Flow Rate Lb/sec kg/sec Required only if steam inj. used

DOE/EPRI Combustion Turbine Diagnostic Heath Monitoring Project – Semiannual Report Report Period – October 1, 2003 to March 31, 2004 Contract Number – DE-FC26-01NT41233
Copyright 2004 Electric Power Research Institute, Inc. All right reserved 30
Inputs Row #
Description English Units
SI Units Comments
26 CT #1 Duct Burn. N.G. Fuel Flow Lb/sec kg/sec
27 CT #1 Duct Burn. Liq. Fuel Flow Lb/sec kg/sec
28 CT #1 Expected Generator Power MW MW
29 Condenser Cooling Water Temp. °F °C Requirement depends on condenser cooling option4
30 Ambient Wet Bulb Temperature °F °C Requirement depends on condenser cooling option4
31 Relative Humidity % % Default value available5
32 CT #2 Compressor Inlet Temp. °F °C
33 CT #2 Inlet Pressure Drop " H2O mbar Default value available
34 CT #2 Exhaust Pressure Drop " H2O mbar Default value available
35 CT #2 Meas. Generator Power MW MW
36 CT #2 Fuel Type Option N/A N/A 0 = natural gas fuel, 1 = liquid fuel
37 CT #2 Duct Burn. Fuel Type Op. N/A N/A 0 = natural gas fuel, 1 = liquid fuel
38 CT #2 Part-Load Level % % Percent of full load
39 CT #2 Natural Gas Fuel Flow lb/sec kg/sec
40 CT #2 Liquid Fuel Flow lb/sec kg/sec
41 CT #2 NOx Steam Inj. Flow Rate lb/sec kg/sec
42 CT #2 Duct Burn. N.G. Fuel Flow lb/sec kg/sec
43 CT #2 Duct Burn. Liq. Fuel Flow lb/sec kg/sec
44 CT #2 Expected Generator Power MW MW
Report Worksheet This worksheet displays all of the results calculated by running the CCPFDM DLL. If there are error messages, these will be displayed at the bottom of the worksheet. If the current unit is modeled for two combustion turbines, the Report worksheet will contain two "Conditions" sections (one for each CT) and performance results for both CTs.

DOE/EPRI Combustion Turbine Diagnostic Heath Monitoring Project – Semiannual Report Report Period – October 1, 2003 to March 31, 2004 Contract Number – DE-FC26-01NT41233
Copyright 2004 Electric Power Research Institute, Inc. All right reserved 31
Otherwise, the report will display only data for a single CT. The available report sections that are displayed are as follows: Ambient Conditions The first section, labeled "Ambient Conditions" shows the measured input data values for the following ambient parameters: Wet Bulb Temperature, Ambient Temperature, Relative Humidity, and Barometric Pressure. Combustion Turbine #1 Conditions The second section, labeled "Combustion Turbine #1 Conditions" shows the measured input data for the first CT that was used in the CCPFDM DLL calculations. The parameters displayed in this section include:
• Compressor Inlet Temperature • Inlet Pressure Drop • Exhaust Pressure Drop • Part-Load Level • NOx Steam Injection Flow Rate • CT Fuel Type • CT Fuel Flow • CT Fuel LHV • Duct Burner Fuel Type • Duct Burner Fuel Flow • Duct Burner Fuel LHV
Note that the LHV values displayed are default values. Combustion Turbine #2 Conditions The third section, labeled "Combustion Turbine #2 Conditions" shows the measured input data for the second CT (if applicable) that was used in the CCPFDM DLL calculations. If the current unit has only a single CT, this section will not be displayed. When applicable, the parameters displayed in this section include the same parameters shown above for the first CT. Steam Turbine Conditions The next section, labeled "Steam Turbine Conditions" shows the measured input data for the steam turbine that was used in the CCPFDM DLL calculations. If the current unit has only a single CT, this section will not be displayed. The parameters displayed in this section include:
• Extraction Steam Flow • Extraction Steam Pressure • Exhaust Quality • Condenser Cooling Water Temperature

DOE/EPRI Combustion Turbine Diagnostic Heath Monitoring Project – Semiannual Report Report Period – October 1, 2003 to March 31, 2004 Contract Number – DE-FC26-01NT41233
Copyright 2004 Electric Power Research Institute, Inc. All right reserved 32
Performance The next section, labeled "Performance", shows measured (or calculated), expected, and relative difference (measured minus expected) values of key indicators of the combine cycle plant's performance. The measured values represent actual performance. The expected values represent the performance that would be expected by the OEM at the current operating condition. In other words, the expected values represent the performance expected for the current fuel type at the measured inlet and exhaust conditions accounting for the measured steam injection rate. Measured, expected, and difference values for the following parameters are included in the output:
• Net Plant Power • Combustion Turbine #1 Power • Combustion Turbine #2 Power (if applicable) • Steam Turbine Power • Auxiliary Load Power • Net Plant Heat Rate • Thermal Efficiency • Steam Turbine Exhaust Flow • Condenser Pressure
Correction Factors The next section, labeled "Correction Factors", shows the correction factors for various parameters which were interpolated by the CCPFDM DLL and used to calculate expected power, heat rate, and steam turbine exhaust flow. Correction factors for the following parameters are displayed:
• Compressor Inlet Temperature • Barometric Pressure • CT Inlet Pressure Drop • CT Exhaust Pressure Drop • Part-Load • CT Steam Injection • Duct Burner • Steam Extraction • Condenser Pressure
In addition, the steam extraction power loss and condenser pressure power loss are shown (expressed as kW) in this section. Diagnostics The next-to-last section of the report, labeled "Diagnostics", shows the status of either four or five potential CC fault conditions, depending on the plant configuration. The following fault condition parameters are included:
• Combustion Turbine #1 • Combustion Turbine #2 (if applicable)

DOE/EPRI Combustion Turbine Diagnostic Heath Monitoring Project – Semiannual Report Report Period – October 1, 2003 to March 31, 2004 Contract Number – DE-FC26-01NT41233
Copyright 2004 Electric Power Research Institute, Inc. All right reserved 33
• Heat Recovery Steam Generator (HRSG) • Condenser • Steam Turbine
Each fault is listed with its status and the degradation parameter value used to determine each fault condition. The status conditions of "Undetermined", "Normal", "Alert", or "Action Required" are the result of a comparison of the degradation parameter values to the user-specified diagnostic threshold data values. An "Undetermined" status indicates a condition caused by a lack of valid data, that is, there is insufficient data to determine the fault status. A "Normal" status indicates that the particular piece of equipment is operating normally, that is, in a no-fault condition. An "Alert" status indicates a condition that should prompt the operator to be prepared to take action or seek collaborating evidence. An "Action Required" status indicates a condition, which should be immediately investigated by the operator. The following color scheme is used to highlight the status of each fault: "Undetermined" - gray, "Normal" - green, "Alert" - yellow, "Action Required" - red. Error Messages The final section of the report lists any error messages that were generated during the execution of the CCPFDM DLL. Chart Worksheets These charts graph time vs. net plant power, net plant heat rate, steam turbine power, steam turbine exhaust flow, and condenser pressure. Each chart can be printed by clicking the Print button in the Excel toolbar. The following charts are available for reference:
• Net Plant Power • Net Plant Heat Rate • Steam Turbine Power • Steam Turbine Exhaust Flow • Condenser Pressure
Remaining Life Module The EPRI Remaining Life Module (RLM) is a spreadsheet that predicts the remaining hot section life of a GE heavy-duty gas turbine via two methods: EPRI’s Hot Section Life Management Platform (HSLMP) algorithms and GE’s standard algorithms described in GER-3620J. The HSLMP algorithms are currently only applicable to the first stage rotating blade of the GE 7FA+ (MS7231) combustion turbine. The GER-3620J algorithms can be used for all of GE’s heavy-duty combustion turbines. Important features of the RLM spreadsheet include:
• Operates as a spreadsheet with macros in Microsoft's Excel (version 97 or later)

DOE/EPRI Combustion Turbine Diagnostic Heath Monitoring Project – Semiannual Report Report Period – October 1, 2003 to March 31, 2004 Contract Number – DE-FC26-01NT41233
Copyright 2004 Electric Power Research Institute, Inc. All right reserved 34
• Runs under the Windows NT/98/2000 operating systems • Comes with an installation routine developed using InstallShield • Uses data calculated by EPRI’s CTPFDM spreadsheet for performance
monitoring of combustion turbines • The familiar Excel "Chart" feature can be used to trend the RLM output • Capable of predicting the remaining hot section life of GE heavy-duty gas
turbines using GE’s GER-3620J algorithms • Capable of predicting the remaining hot section life of GE 7FA+ gas turbines
using EPRI’s HSLMP algorithms
Program Overview The RLM calculations can be carried out in two different modes: initialization and run-by-run. In the initialization mode, the user manually enters the current operating history of an engine in terms of fired hours, number of starts, number of trips, etc. Where necessary, the user will input estimates to characterize the nature of the operating history (e.g., percentage of total hours operated in part-load, base-load and peak-load). The GER-3620J calculations are carried out to define the current equivalent (a.k.a. factored) run hours and starts for the hot section, the rotor, and the combustor. This will then form the basis for future calculations on a run-by-run basis using either the 3620J algorithms or the EPRI algorithms. The run-by-run mode can be used after the initialization calculations have been executed. When a run (i.e., a complete start-stop cycle) has ended, the user can enter the approximate start and stop times and a macro will extract the specified data from a PI data historian supplied by OSI Software, Inc. The macro then "marches" through the run data on an hour-by-hour basis to calculate the equivalent operating hours and starts incurred during the run. If the run-by-run calculations are carried out on a GE 7FA+, the HSLMP algorithms will also be calculated. Note that it is possible for a user to forego the initialization calculation if an on-line PI database contains information on each run that the turbine has executed. In such a case, the user can enter the start and stop times for each run, one-by-one, and calculate the contribution of each run to the cumulative factored hours and starts total.
Theory and Module Development GER-3620J Algorithms The GER-3620J algorithms provide an hours-based maintenance interval and a starts-based maintenance interval for inspection and replacement of the hot section parts of a CT. Typically starts may be related to the accumulated damage caused from thermal

DOE/EPRI Combustion Turbine Diagnostic Heath Monitoring Project – Semiannual Report Report Period – October 1, 2003 to March 31, 2004 Contract Number – DE-FC26-01NT41233
Copyright 2004 Electric Power Research Institute, Inc. All right reserved 35
mechanical fatigue (TMF) cycles, and hours may be related to coating degradation and/or creep damage accumulated over time. The 3620J algorithms assume there is no interaction between the starts-based and hours-based intervals. The maintenance action should be carried out if either interval is exceeded. This philosophy is shown visually in Figure 6.
Figure 6 – Hot Gas Path Maintenance Interval Criteria for a GE “F” Class Turbines based on GER-3620J.
The term “factored starts” used in the figure means that actual starts are referenced to a baseline start referred to as a normal base load start or NB in the starts-based portion of the GER-3620J formula. To account for damage accumulated for different types of starts or trips, factors are applied to the normal base-load start-stop cycle (NB), reflecting GE’s opinion of their relative severity. For example, a “fast load start” is given a severity factor of two, meaning one fast load start counts as two factored starts. Similarly, the term “factored hours” means actual operating hours are referenced to a baseline of base-load operation with natural gas and no water or steam injection. Note that based on the GE criteria, an F class CT could have 899 normal starts and 23,999 base load fired hours
GER-3620J Maintenance Guideline
0
100
200
300
400
500
600
700
800
900
1000
0 5000 10000 15000 20000 25000 30000
Factored Hours
Fact
ored
Sta
rts
GE Starts Limit GE Hours Limit ASME Code Linearity Rule

DOE/EPRI Combustion Turbine Diagnostic Heath Monitoring Project – Semiannual Report Report Period – October 1, 2003 to March 31, 2004 Contract Number – DE-FC26-01NT41233
Copyright 2004 Electric Power Research Institute, Inc. All right reserved 36
and not need a hot section overhaul, but if it had 1 normal start and 24,001 baseload fired hours it would need a hot section overhaul. Creep-Fatigue Interaction The assumption that there is no interaction between starts (fatigue) and operating hours (creep) is not supported by experts outside of GE. There is a large body of evidence which shows creep induced damage will reduce the fatigue life of a metal and that fatigue-induced damage will reduce the metal’s creep life. The ASME Boiler and Pressure Vessel Code Section III, Case N-47 addresses the interaction between fatigue and creep. It recommends using a linear combination of remaining creep life and remaining fatigue life to determine a materials remaining life. The least conservative assumption is that: % Remaining Life = (% Remaining Fatigue + % Remaining Creep Life) – 100% This is known as the “linearity rule.” It is also shown in Figure 6. Actual tests on different metals have shown that the interaction between fatigue and creep is often stronger than that described by the linearity rule. An example of a stronger creep-fatigue interaction is shown in the “bi-linear” curve of Figure 7 that was derived from experimental data for Alloy 800H. It shows that when 10% of the creep life of 800H has been consumed, the material will fail if more than 10% of its fatigue life is expended. Even GE’s own published data indicate there is a strong interaction between starts and hours, at least for the combustion liner and transition piece of the PGT10. An example of that data is shown in Figure 8, which shows the “maintenance line” for the transition piece. The maintenance line represents the locus of points at which 2/3rds of the engines surveyed had experienced transition piece failures. The data in Figure 8 strongly suggest a linear relationship between fatigue and creep. This directly contradicts the assertion made in GER-3620J.

DOE/EPRI Combustion Turbine Diagnostic Heath Monitoring Project – Semiannual Report Report Period – October 1, 2003 to March 31, 2004 Contract Number – DE-FC26-01NT41233
Copyright 2004 Electric Power Research Institute, Inc. All right reserved 37
Figure 7 – Bi-Linear Creep-Fatigue Interaction Curve for Alloy 800H Compared to ASME Section II Code Case N-47 Linearity Rule.
Alloy 800H Creep - Fatigue Interaction
0
0.1
0.2
0.3
0.4
0.5
0.6
0.7
0.8
0.9
1
0 0.1 0.2 0.3 0.4 0.5 0.6 0.7 0.8 0.9 1
Creep Life Consumed
Fatig
ue L
ife C
onsu
med
Bi-Linear Curve Linearity Rule

DOE/EPRI Combustion Turbine Diagnostic Heath Monitoring Project – Semiannual Report Report Period – October 1, 2003 to March 31, 2004 Contract Number – DE-FC26-01NT41233
Copyright 2004 Electric Power Research Institute, Inc. All right reserved 38
Figure 8 – GE PGT-10 Transition Piece “Maintenance Line” Based on the Failure History of Multiple Engines Surveyed by GE.
Without additional data, it is not known if the maintenance intervals recommended for an F class CT in GER-3620J represent a conservative simplification of the creep-fatigue linearity rule or an unconservative simplification. The unconservative possibility is represented by Figure 6. It would suggest that hot section failures could occur in CTs that accumulate a combination of hours and start cycles which fall within GE’s 24,000 hour and 900 starts limit. The conservative possibility is represented by Figure 9. If that figure represents the actual situation, then it implies that CTs that operate many hours with few cycles could go far beyond GE’s 24,000 factored hour limit. Also, turbines that experience many cycles but few hours could withstand more than 900 factored starts before encountering hot section failures. Whether the GE criteria are conservative or unconservative, either scenario represents a potential for unnecessary maintenance expenses. If the criteria are overly conservative, CT owners will be replacing parts too soon and therefore spending too much money on hot section spares. In addition, the units will be shutdown for overhauls more frequently than necessary which represents a loss in revenue.
PGT-10 Transition Piece Failure History
0
50
100
150
200
250
300
350
0 2000 4000 6000 8000 10000 12000 14000 16000 18000
Fired Hours
Fire
d St
arts

DOE/EPRI Combustion Turbine Diagnostic Heath Monitoring Project – Semiannual Report Report Period – October 1, 2003 to March 31, 2004 Contract Number – DE-FC26-01NT41233
Copyright 2004 Electric Power Research Institute, Inc. All right reserved 39
If the GE criteria are unconservative, CT owners will experience hot section failures that could cause additional damage to downstream parts. In addition the unplanned outages caused by the failures may mean that replacement parts will not be available right away, which will extend the length of the outage and cause additional revenue loss. Clearly there is an incentive to improve upon the GER-3620J remaining life algorithms. That was the motivation for the EPRI Hot Section Life Management Platform.
Figure 9 – “Conservative” Simplification of Creep-Fatigue Linearity Rule.
EPRI’s Hot Section Life Management Platform Unlike the GER-3620J approach, EPRI’s Hot Section Life Management Platform (HSLMP) algorithms do assume there is interaction between the various damage mechanisms that occur in a CT hot section. The algorithms consolidate the damage caused for different types of events as a basis to establish when the equivalent maintenance interval is reached. The algorithms are based on aerothermal modeling and tests carried out to estimate the strain induced at specific locations by specific operating
GER-3620J Maintenance Guideline
0
200
400
600
800
1000
1200
1400
1600
1800
2000
0 10000 20000 30000 40000 50000 60000
Factored Hours
Fact
ored
Sta
rts
GE Starts Limit GE Hours Limit ASME Code Linearity Rule

DOE/EPRI Combustion Turbine Diagnostic Heath Monitoring Project – Semiannual Report Report Period – October 1, 2003 to March 31, 2004 Contract Number – DE-FC26-01NT41233
Copyright 2004 Electric Power Research Institute, Inc. All right reserved 40
conditions such as an emergency trip from full-load. This information is then used to calculate a severity factor for each condition or event. In the initial version of RLM, HSLMP algorithms for only the GE 7FA+ series 1st stage bucket (i.e., rotating airfoils) are incorporated. The current OEM inspection limits for the 7FA+ 1st stage bucket are set at 900 starts maximum and/or 24,000 hours, whichever comes first. Replacement limits are 1800 factored starts and 48,000 factored hours. Results of a hypothetical calculation of an interval using both the OEM approach (GER-3620J) and the HSLMP approach are presented in Figure 10. In the example, on a 7FA+ 1st stage bucket, a trip at 40% load is considered by GER-3620J to be 4.2 times as damaging as a normal base load start-stop cycle. As reflected in the figure, the HSLMP factor would produce 50% less life consumption (2.1 times an NB start-stop cycle). It should be noted that the actual factors used in HSLMP are different from those shown in Figure 10.
Figure 10 – Formulation of Life Consumption for Start-Based Criterion.
As reflected in Figure 10, the HSLMP provides an opportunity to independently compare and assess the OEM interval estimates. In the calculation using the OEM factors, the starts are reflected as a portion of the total life consumed to date, and proportion of life remaining. From the hypothetical record of 131 factored starts, it infers that nearly 14.5% of the total life has been consumed. The independent calculation produced from factors that are adjusted to reflect proportional damage accumulation for each of referenced events provided by the HSLMP reflects a life consumption of 12.3%. However, this is based on the damage caused to a specific location on the 1st stage bucket, attributable to TMF only.

DOE/EPRI Combustion Turbine Diagnostic Heath Monitoring Project – Semiannual Report Report Period – October 1, 2003 to March 31, 2004 Contract Number – DE-FC26-01NT41233
Copyright 2004 Electric Power Research Institute, Inc. All right reserved 41
The treatment of life consumption due to creep and/or coating life in the HSLMP is treated in a similar fashion, as shown in Figure 11. Note that in this example a different baseline interval assumed in the HSLMP calculations (30000 vs. 24000 hours). The linear damage rule is used to take into account the interaction between creep and fatigue damage and the result is reported as a “combined” remaining life parameter.
Figure 11 – Formulation of Life Consumption for Hours-Based Criterion.
The principal distinction between the HSLMP results and the OEM approach is that the HSLMP derives its estimates of proportional damage directly for each of the respective locations where maximum temperatures, stresses and strains are predicted to occur. Rate of damage for each principal mechanism is based on the properties obtained by controlled tests of materials and coating samples independently performed by EPRI. This means that the final result is specific to:
• the part (and/or the particular design iteration that is installed), • the operating conditions of the unit (whether in a heat recovery scheme or as a
stand alone unit), • the location on the part (where it is most susceptible to a particular type of
damage) and • the operating record (reflected in measurements by the units’ automated data
tracking system). Comparisons made with factors obtained from the HSLMP have indicated in certain situations that the OEM life formulation produced a more conservative interval for inspection and replacement because it lacks the specificity provided by the HSLMP. Conversely, damage caused by certain modes of operation is apparently being
DOE/EPRI Combustion Turbine Diagnostic Heath Monitoring Project – Semiannual Report Report Period – October 1, 2003 to March 31, 2004 Contract Number – DE-FC26-01NT41233
Copyright 2004 Electric Power Research Institute, Inc. All right reserved 42
underestimated by the OEM’s formulas. In this regard, the appearance of cracks in regions such as the trailing edge cooling hole of the 1st stage bucket was predicted by HSLMP for start intervals below the OEM factored allowable, based on the stresses and temperatures that were being calculated in this region. These predictions were subsequently confirmed by examples obtained from the field. A recent TIL (1186-2r1) has reduced the inspection interval for 7FA+ parts to 350 starts, with guidance as to what maximum crack sizes are allowable. Module Development EPRI’s contractor for the development of the HSLMP was Turbine Technology, Inc. (TTI) of Rochester, NY. As part of the RLM project, TTI created a Dynamic Link Library (DLL) that contained the HSLMP algorithms for the 7FA+ 1st stage buckets. A DLL can be thought of as a compiled sub-routine that can be called by a Windows-based program. It was determined that the best way to implement the HSLMP calculation was in a “batch-wise” fashion at the end of each CT run (start-stop cycle). The HSLMP algorithms account for events that occur over the complete course of a start-stop cycle and therefore are not conducive to being used in a real-time mode during a CT run. Instead the DLL was designed to be called at the end of each CT run. Input parameters to the DLL included the three % remaining life values (TMF-based, Creep-based, and combined) before the run started and various parameters that describe the severity of the run such as fuel type, peak firing temperature, and whether an emergency trip occurred. The outputs from the DLL were the three remaining life parameters updated to reflect the impact of the run. A simple Excel spreadsheet was initially developed to allow testing of the HSLMP DLL. The spreadsheet required all of the DLL inputs to be manually entered in cells of the spreadsheet. The DLL was called by a macro that was invoked by clicking a button in the spreadsheet. TTI tested this simple spreadsheet and confirmed that the DLL was operating correctly. This simple spreadsheet was then expanded to include the GER-3620J calculations and automatic retrieval of CT operating data to support both the 3620J calculations and the HSLMP calculations. In addition, the macro that called the HSLMP DLL was automatically linked to the macro, which implemented the run-by-run 3620J calculations. As described previously, the RLM calculations can be carried out in either an initialization mode or a run-by-run mode. The initialization calculations use only the GER-3620J calculations to determine the remaining life of the hot section. The run-by-run calculations always follow the GER-3620J algorithms and also use the HSLMP DLL if the CT type is a 7FA+.

DOE/EPRI Combustion Turbine Diagnostic Heath Monitoring Project – Semiannual Report Report Period – October 1, 2003 to March 31, 2004 Contract Number – DE-FC26-01NT41233
Copyright 2004 Electric Power Research Institute, Inc. All right reserved 43
Future Work Over the next report period, results from the beta testing of CCPFDM and RLM should be available to enhance the features of both these modules. Topical reports based on the module development will also be developed as the module approaches “commercial” status. The CTPFDM module has been heavily tested at both Progress Energy and City Public Service of San Antonio, and preliminary steps will be taken to submit the module for EPRI Software Quality Assurance testing. Future activity will also focus on developing the implementation of the final two deliverables of the project—the start-up/combustion diagnostics module and the rotor dynamic/mechanical anomaly module.
References 1. Anon., "Correction Curves Overview and Instructions", Combined Cycle 60Hz
Application Handbook, Westinghouse Electric Corp., 1996.