Embed Size (px)
Citation preview
Advanced Moderator Material Handbook
Prepared for U.S. Department of Energy
Microreactor Research, Deployment, and Development
Program A.P. Shivprasad, T.E. Cutler, J.K. Jewell (INL), V.K. Mehta,
S.W. Paisner, C.A. Taylor, C.N. Taylor (INL), H.R. Trellue, D.W.
Wootan (PNNL), E.P. Luther Los Alamos National Laboratory
09/30/2020 LA-UR-20-27683


DISCLAIMER This information was prepared as an account of work sponsored by an agency of the U.S. Government. Neither the U.S. Government nor any agency thereof, nor any of their employees, makes any warranty, expressed or implied, or assumes any legal liability or responsibility for the accuracy, completeness, or usefulness, of any information, apparatus, product, or process disclosed, or represents that its use would not infringe privately owned rights. References herein to any specific commercial product, process, or service by trade name, trade mark, manufacturer, or otherwise, does not necessarily constitute or imply its endorsement, recommendation, or favoring by the U.S. Government or any agency thereof. The views and opinions of authors expressed herein do not necessarily state or reflect those of the U.S. Government or any agency thereof.

Advanced Moderator Material Handbook 09/30/2020 iii
SUMMARY High hydrogen density moderators such as metal hydrides are an important research topic within the DOE NE Microreactor Research, Development, and Deployment (RD&D) Program due to their ability to retain hydrogen to much higher temperatures than other hydrogenous media. This class of moderators, which includes yttrium dihydride (YH2), thermalizes neutrons in the system such that the overall fuel mass or the required uranium enrichment in the system can be significantly reduced. Knowledge of material properties, both in the as-fabricated and irradiated state, are important to understanding moderator performance during steady-state and transient reactor operation. Provided in this document is the Advanced Moderator Material Handbook, which provides a detailed summary of the literature data on yttrium dihydride, thermomechanical and other property data, and a critical evaluation of that data. This handbook also provides a description of ongoing experiments to understand in-reactor performance, such as irradiations in ATR, as well as nuclear data from an integral critical experiment at NCERC. The majority of this report focuses on measured values but also includes some modeling results for comparison where applicable.
From the evaluation of the available literature data, it is apparent that further work is necessary to better develop yttrium dihydride and thus enable its deployment as a moderator for microreactors. Although property data is relatively extensive, degradation information is lacking. In particular, literature information on hydrogen concentrations at a given pressures and temperature exhibits significant variation. In addition, the knowledge base for hydrogen redistribution in yttrium dihydride under temperature gradients, as well as moderator reactivity during accident scenarios, such as a reactor breach, is not well developed. To that end, understanding the degradation of this material during normal and off-normal conditions is imperative to its use as a nuclear reactor moderator.

Advanced Moderator Material Handbook iv 09/30/2020
THIS PAGE INTENTIONALLY LEFT BLANK

Advanced Moderator Material Handbook 09/30/2020 v
CONTENTS
SUMMARY ................................................................................................................................................. iii
ACRONYMS .............................................................................................................................................. xii
1. Introduction ......................................................................................................................................... 1 1.1 Moderators for microreactor applications ................................................................................ 1 1.2 Conversion constants and useful equations .............................................................................. 1 1.3 Summary of measurement techniques ...................................................................................... 2
2. Properties of un-irradiated yttrium dihydride ..................................................................................... 3 2.1 Introduction to yttrium dihydride ............................................................................................. 3
2.1.1 Yttrium dihydride for nuclear applications ................................................................. 3 2.1.2 Specifications .............................................................................................................. 5 2.1.3 Summary of needs ....................................................................................................... 5 2.1.4 Future research needs and considerations ................................................................... 5
2.2 Phases, phase transitions, and phase diagrams ......................................................................... 5 2.2.1 Phases .......................................................................................................................... 6 2.2.2 Phase diagrams ............................................................................................................ 7 2.2.3 Structural data ........................................................................................................... 11
2.3 Properties of un-irradiated yttrium dihydride ......................................................................... 12 2.3.1 Phase formation thermodynamics ............................................................................. 12 2.3.2 Phase-formation kinetics ........................................................................................... 16 2.3.3 Heat capacity ............................................................................................................. 16 2.3.4 Thermal expansion and density ................................................................................. 17 2.3.5 Thermal conductivity ................................................................................................ 19 2.3.6 Emissivity .................................................................................................................. 20 2.3.7 Electrical properties ................................................................................................... 20 2.3.8 Magnetic properties ................................................................................................... 21 2.3.9 Mechanical properties ............................................................................................... 21
2.4 Hydrogen self-diffusion in yttrium hydrides .......................................................................... 24 2.5 Degradation of un-irradiated yttrium dihydride ..................................................................... 27 2.6 Neutronic considerations of yttrium dihydride ...................................................................... 27
2.6.1 Lethargy and moderating power ............................................................................... 27 2.6.2. Moderating ratio ........................................................................................................ 30
3. Casting and fabrication techniques for yttrium dihydride ................................................................ 33 3.1 Preparation of high-purity yttrium ......................................................................................... 33
3.1.1 Reduction of yttrium halide with calcium ................................................................. 34 3.1.2 Yttrium-magnesium intermediate alloy process ....................................................... 34
3.2 Direct hydriding of yttrium metal .......................................................................................... 34 3.3 Powder metallurgy of yttrium dihydride ................................................................................ 34
4. Historical Irradiation of yttrium dihydride in FFTF ......................................................................... 35
5. Post-irradiation examination of yttrium dihydride irradiated in the ATR ........................................ 35 5.1 Introduction to the irradiation experiment ............................................................................. 35
Advanced Moderator Material Handbook vi 09/30/2020
5.2 Materials and Methods ........................................................................................................... 39 5.3 PIE results .............................................................................................................................. 41
6. Integral critical experiment at NCERC ............................................................................................. 41 6.1 Introduction to the critical experiment ................................................................................... 41 6.2 Materials and methods ........................................................................................................... 41 6.3 Integral critical experiment results ......................................................................................... 43
References ................................................................................................................................................... 44

Advanced Moderator Material Handbook 09/30/2020 vii
THIS PAGE INTENTIONALLY LEFT BLANK

Advanced Moderator Material Handbook viii 09/30/2020
FIGURES Figure 2.1: Hydrogen atom density as a function of temperature for water various metal hydrides
in equilibrium with 1 atm of hydrogen gas for temperatures between 25 and 1400 °C (taken from [20]). .......................................................................................................................... 4
Figure 2.2: Compilation of PCT curves for the Y-H system up to a hydrogen-to-yttrium ratio of 2.0. Data replotted from [9], [32], [33], [37], [38]. ....................................................................... 8
Figure 2.3: Redrawing of the Y-H phase diagram based on CALPHAD analysis by Peng, et al. [40]. Phase regions are labeled and phase regions have been modified from the original source as a function of H/Y atom ratio. .................................................................................................. 11
Figure 2.4: Partial molar enthalpy of formation for YHx as a function of hydrogen content in H/Y units. Data taken from [9], [32], [37], [38], [47]. ....................................................................... 14
Figure 2.5: Partial molar non-configurational entropy of YHx as a function of hydrogen content in H/Y units. Data taken from [9], [32], [37], [38]. ........................................................................ 15
Figure 2.6: Molar heat capacity of yttrium dihydride as a function of temperature. Data from [13]–[16]. ............................................................................................................................................. 17
Figure 2.7: (a) Thermal strain and (b) thermal expansion coefficient for yttrium dihydride. Thermal expansion coefficient was fit to functions of temperature, the fitting parameters for which are summarized in Table 2.4. Figure adapted from [14]. ............................................................ 18
Figure 2.8: (a) Thermal conductivity and (b) thermal resistivity for yttrium dihydride as a function of temperature. Data from [13], [14], [16]. ................................................................................. 20
Figure 2.9: Shear, bulk, and Young's moduli as a function of hydrogen content for yttrium dihydride. Data from [11], [20], [23], [63]. Young’s moduli are plotted in circles, bulk moduli are plotted in triangles, and shear moduli are plotted in squares. ................................... 22
Figure 2.10: (a) Shear, (b) bulk, and (c)Young’s moduli of yttrium dihydride as a function of porosity. Data from [11], [20], [23], [63]. .................................................................................. 23
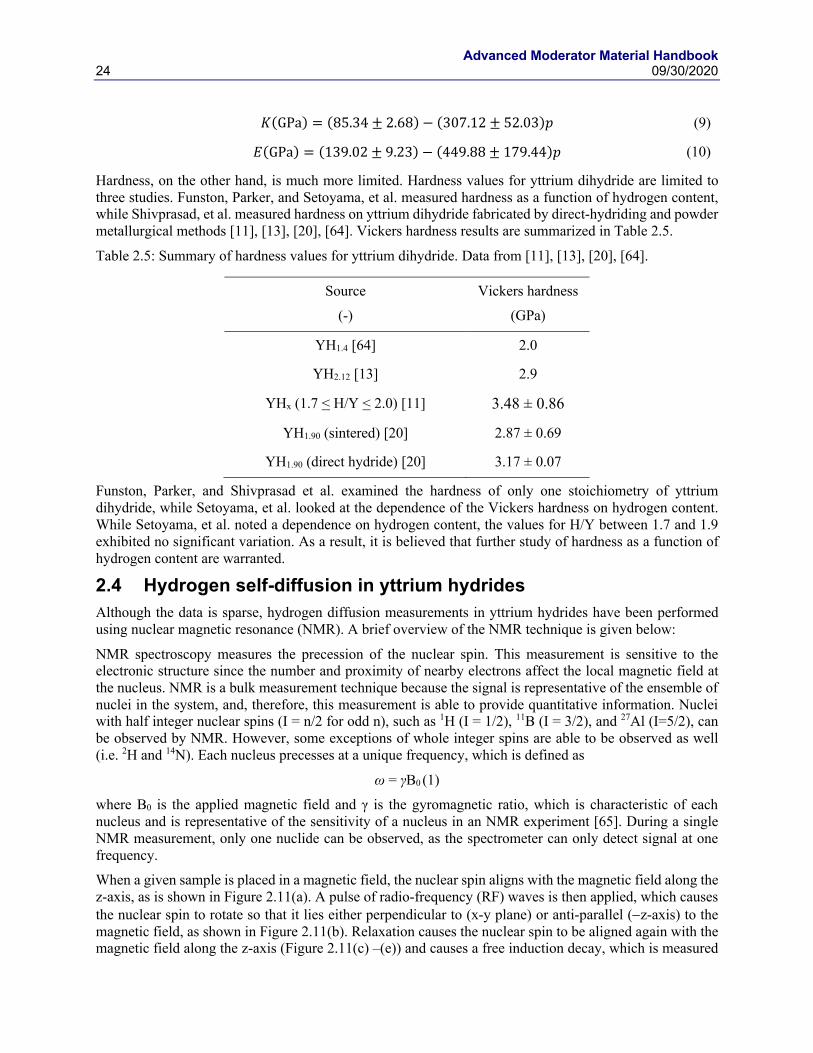
Figure 2.11: Magnetization evolution before and after a pulse of RF radiation is applied. The applied magnetic field is in the direction of the z-axis. .............................................................. 25
Figure 2.12: Loss of coherence of magnetization in the x-y plane after an RF pulse is applied. ............... 25 Figure 2.13: Moderating power as a function of temperature for various candidate moderator
materials. All data points are taken from literature for materials at 1 atm pressure [9]–[11], [30], [32], [78]–[90]. Data for metal hydrides were determined for those materials under 1 atm of pure hydrogen. .................................................................................................... 29
Figure 2.14: Hydrogen migration under the influence of temperature gradient. ........................................ 32 Figure 5.1: ATR core showing LANL-MOD-1 in the B2 position. ............................................................ 37 Figure 5.2. Elevation stack up of the TZM capsules in the ATR B2 position. ........................................... 38 Figure 5.3. Hydride specimens located in a single ATR fixture basket. Two TZM inner capsules
containing the hydride fit within a single ATR fixture, along with passive temperature and fluence monitors. .................................................................................................................. 40
Figure 6.1. Critical experiment design overview. ....................................................................................... 42 Figure 6.2. C-Disc (HEU Unalloyed Metal). .............................................................................................. 42 Figure 6.3. Alumina and graphite heater to be used in integral critical experiments at NCERC. .............. 43

Advanced Moderator Material Handbook 09/30/2020 ix
THIS PAGE INTENTIONALLY LEFT BLANK
Advanced Moderator Material Handbook x 09/30/2020
TABLES Table 2.1: Summary of hydrogen contents for yttrium and its hydrides that are relevant to nuclear
reactor moderator applications at room temperature and ambient pressure. ................................ 7 Table 2.2: Summary of equilibrium hydrogen pressures from literature PCT data [9], [32], [33],
[37], [38]. Underlined values were extrapolated from low-temperature data. No data exists for H/Y = 2.0 due to the difficulty in achieving full stoichiometry at these temperatures. ............................................................................................................................... 10
Table 2.3: Experimentally-determined lattice parameters for Y, YH2, and YH3 at ambient temperature and pressure. *Setoyama et al. measured lattice parameter of YH2-x as a function of hydrogen content to be 𝑎𝑛𝑚 = 0.5215 − 4.127 × 10 − 4𝑐𝐻(𝐻/𝑌). ................. 12
Table 2.4: Empirical fitting parameters for thermal expansion coefficient as a function of temperature. Fitting parameters are given with 95% confidence intervals. Fitting parameters from [14]. .................................................................................................................. 19
Table 2.5: Summary of hardness values for yttrium dihydride. Data from [11], [13], [20], [64]. .............. 24 Table 2.6: Available diffusion parameters for the Y-H system. Do values were calculated as
described in the text when not provided in the reference. .......................................................... 26 Table 2.7: Lethargy and average number of collisions required to thermalize 1 MeV neutrons for
various nuclei of interest for nuclear reactor moderator applications. ........................................ 28 Table 2.8: Moderating lethargy, powers and ratios for various candidate moderator materials at
room temperature and ambient pressure. .................................................................................... 31 Table 2.9: Summary of the effect of hydrogen content on material and neutronic properties. ................... 33 Table 5.1. Specimen test matrix showing the three target temperatures, fabrication methods, and
characterization techniques for PIE analysis. ............................................................................. 36 Table 5.2. Yttrium hydride physical properties. .......................................................................................... 39 Table 5.3. Total quantities of yttrium hydride for ATR PIE. ...................................................................... 40

Advanced Moderator Material Handbook 09/30/2020 xi
THIS PAGE INTENTIONALLY LEFT BLANK

Advanced Moderator Material Handbook xii 09/30/2020
ACRONYMS ATR Advanced Test Reactor CTE Coefficient of thermal expansion DFT Density functional theory EFPD Effective full power days FFTF Fast Flux Test Facility HEU High enriched uranium HFEF Hot Fuel Examination Facility INL Idaho National Laboratory LANL Los Alamos National Laboratory LANSCE Los Alamos Neutron Science CEnter LEU Low enriched uranium LWR Light water reactor NASA National Aeronautics and Space Administration NCERC National Criticality Experiments Research Center NMR Nuclear magnetic resonance NNSS Nevada National Security Site PCT Pressure-composition-temperature PIE Post-irradiation examination QA Quality assurance SEM Scanning electron microscopy SNM Special nuclear material TEM Transmission electron microscopy XRD X-ray diffraction
Advanced Moderator Material Handbook 09/30/2020 1
ADVANCED MODERATOR MATERIALS HANDBOOK 1. INTRODUCTION 1.1 Moderators for microreactor applications Advanced reactors such as small modular and/or microreactors are becoming an emerging new nuclear technology around the world. With their small size, power output, and cost, microreactors could be designed to meet localized power generation needs; these could include integration into microgrids to provide power to remote locations and disaster-prone regions, space nuclear applications such as space nuclear propulsion and fission surface power, and military forward bases. One subset of microreactor designs uses a high-temperature moderator to reduce the overall fuel mass or necessary enrichment of the fuel, and decrease the overall mass of the core by increasing the fuel utilization. High-temperature moderator candidates include metal hydrides, graphite, and beryllium-containing compounds. Of these materials, metal hydrides are able to have higher moderating efficiencies due to their high hydrogen densities. Of the metal hydrides, those of zirconium, cerium, and yttrium are able to maintain high hydrogen densities to temperatures in excess of 500 ; of these compounds, hydrogen density is maintained to the highest temperatures for yttrium hydrides. Due to the historical use of graphite, beryllium, and zirconium hydride as nuclear reactor moderators, there exists a wealth of property and neutronic data for these materials. A specific example is hydrided zirconium (ZrH2-x), which has been used in reactor systems as either a separate moderator or as part of the fuel system (examples include the Russian Topaz reactors or the U.S. TRIGA reactors) for decades. However, such data for yttrium hydrides are sparse and varied. To that end, this handbook seeks to consolidate relevant information from the extant literature and provide context for current research based on the renewed interest in yttrium dihydride.
Kilopower Reactor Using Stirling TechnologY (KRUSTY) was a recent nuclear demonstration performed in the United States at the National Criticality Experiments Research Center (NCERC) in March 2018 [1]. Its ambitious, self-regulating features made it highly attractive for terrestrial and space power and propulsion applications. However, KRUSTY utilized highly enriched or weapons grade uranium to achieve criticality for a small, compact reactor system. The previous generation of microreactors, such as KRUSTY, are typically very compact in their design and thus employ high-enriched fuel in order to sustain a critical system. Reducing the enrichment level (weapons grade to civilian grade) and thus, the overall fissile content generally results in decreasing the reactivity of the system. High-density moderator material will soften the neutron spectrum such that a smaller fissile content or enrichment is required.
This handbook presents the phase stability, thermodynamic, thermophysical, mechanical, and diffusion properties of yttrium dihydride, which has gained new importance for the development of microreactor technology due to its unmatched thermal stability. Additionally, brief summaries of other physical properties and neutronic considerations are presented. Property evaluations are presented in terms of the validity of the literature results. Finally, various upcoming and in-process nuclear tests of yttrium dihydride will be introduced. These nuclear tests include current and planned in-reactor irradiations at various test reactors including the Advanced Test Reactor (ATR), as well as an integral critical experiment at the National Criticality Experiments Research Center (NCERC) at the Nevada National Security Site (NNSS).
1.2 Conversion constants and useful equations Gas constant: R = 8.314 J mol-1 K-1
Avogadro’s number: NA = 6.022 × 10²³ mol-1
Pressure (Pa) = Pressure (torr) × 101325/760
Macroscopic cross section: Σi = σiNA

Advanced Moderator Material Handbook 2 09/30/2020
Thermal conductivity: λ = ρCpDt
1.3 Summary of measurement techniques This section details the various techniques used to measure the experimental data presented in the rest of this document.
Metal hydrides have historically been produced using a Sievert’s apparatus, which is a gas manifold attached to a reaction vessel maintained at a temperature of interest [2]. A metal sample is placed in the reaction vessel and hydrogen is titrated into the vessel in very well-defined aliquots. The analysis of the gas-solid reaction is termed “Sievert’s gas absorption”. From this analysis, one may determine the hydrogen content of the resultant metal hydride, the pressure-composition-temperature (PCT) relationships, and, thus, the thermodynamics of the gas-solid reaction.
Hydrogen content may also be evaluated via other methods, such as gravimetry – measuring the mass before and after a hydrogen absorption reaction. Inert gas fusion and vacuum hot extraction represent destructive methods of measuring the hydrogen content where the sample is heated to release the absorbed hydrogen, which is then quantified using various analytical techniques [3]. Neutron radiography is another technique that is able to probe the hydrogen content of a material by using the ability of hydrogen to attenuate neutrons effectively [4], [5]; this may be quantitative if appropriate standards are used for calibration. A technique to measure hydrogen content that has seen use more recently is cold neutron prompt gamma activation analysis, where a sample is exposed to a flux of cold neutrons. Because hydrogen has a well-defined prompt gamma decay after absorbing a neutron, the intensity of this prompt gamma line may be correlated to the overall hydrogen content of the material [6], [7].
Other methods of determining the phase formation thermodynamics include calorimetry where heat evolution/absorption is measured at particular temperatures and related to values at a reference temperature. The phase formation thermodynamics, determined via Sievert’s gas absorption or calorimetric methods, are used to calculate the phase diagrams. One well-established technique to do this is using the Computer Coupling of Phase Diagrams and Thermochemistry (CALPHAD) method, where thermodynamic parameters for the relevant phases are summarized in a database and a computer program is used to calculate the respective Gibb’s Free Energies [8]. The computer programs perform Gibb’s energy minimization calculations to determine the equilibrium phase diagrams given the input thermodynamic parameters. Thus, the resultant phase diagrams depend heavily on the reliability of the input thermodynamic data.
Techniques that probe the material structure provide supplementary information for phase diagram evaluation. Structural parameters have traditionally been determined using X-ray diffraction (XRD) and neutron diffraction [9]–[11]. In these techniques, the incident particles (X-rays or neutrons) scatter off the probed material. The scattering angles depend on the incident particle energies and the crystal structure of the material. If the former is known, then the structure parameters may be accurately calculated. In the case of metal hydrides, neutrons scatter very well off of hydrogen nuclei where the scattering cross-sections for X-rays off of hydrogen are much lower. As a result, neutron diffraction is the preferred method of probing the structure of metal hydrides.
The thermophysical properties of metal hydrides have been measured using a variety of techniques. Thermal expansion and the coefficient of thermal expansion (CTE) have been measured using dilatometric methods, as well as XRD and neutron diffraction [11]–[14]. With the current ability to obtain high-quality neutron diffraction data, this technique is also preferred for thermal expansion measurements of metal hydrides. Like the phase formation thermodynamics, heat capacity is also traditionally measured using calorimetric methods [13], [15], [16]. Thermal diffusivity may be measured using laser flash analysis, where the sample is exposed to a laser and the measured heat rise across the sample is an indication of the material thermal diffusivity [16], [14]. Finally, thermal conductivity may be either measured via a thermal
Advanced Moderator Material Handbook 09/30/2020 3
conductivity probe or from the product of the density calculated from the CTE, the heat capacity, and the thermal diffusivity, all as a function of temperature.
The magnetic properties and the hydrogen self-diffusion properties have been measured using nuclear magnetic resonance (NMR) in the literature [17], [18]. This technique applies a magnetic field to a sample to probe the local magnetic fields about the nucleus of interest. Radio-frequency pulses are used to excite the nuclei, which relax from the excited state. The relaxation times are dependent on experimental parameters and material properties. Thus, if the experimental parameters are kept constant, the material properties, such as mobility and structure, may be determined. This technique is able to probe the electronic structure of various nuclei and is a bulk measurement technique since the signal is representative of the ensemble of nuclei in the system.
The mechanical properties of metal hydrides may be determined using traditional methods, as well as sound speed measurements and resonant ultrasound spectroscopy. In these techniques, ultrasound frequencies are applied to a material and the resonance frequencies are determined. Using material properties, the elastic moduli may be calculated to a high degree of accuracy and precision using appropriate sample geometries and densities. Uniaxial tensile testing and creep testing have also been performed to determine mechanical properties of metal hydrides. However, sample testing using these methods and analysis of the results is challenging due to the difficulty in producing pure metal hydrides in the geometries required for these types of mechanical tests. This might include hydriding dogbone samples, which is not straightforward due to the potentially anisotropic volume expansion from hydriding.
Electrical properties of metal hydrides have been measured using magnetoresistance methods, where the material is subjected to a magnetic field and the potential difference across the sample is correlated to the sample geometry and the electrical resistivity [19].
The response of yttrium dihydride to in-reactor irradiations will also be determined. For these studies, the properties of the un-irradiated material will be determined using the aforementioned methods. After this, samples will be irradiated under well-defined conditions to pre-specified times. Following a cooling period where the irradiated material is allowed to undergo approximately ten half-lives of the primary decay mode, the samples will again be tested for material properties. In this way, the effect of irradiation may be tied directly to physical properties.
In addition to characterization of the material properties, nuclear cross section data to predict performance of the material is important to understand. Modeling of material performance such as interatomic forces and crystal lattice parameters can occur using DFT codes [14], [20]–[24]. Validation of results from DFT codes has occurred using neutron time-of-flight powder diffraction and other measurements. Of particular interest for hydride material performance in a nuclear system is the generation of thermal scattering laws that contribute to inelastic scatter cross sections such as S(α, β) in Monte Carlo transport codes such as MCNP [25]. Once the thermal scatter laws are generated, they can be processed by codes such as NJOY to generate data for MCNP [26].
2. PROPERTIES OF UN-IRRADIATED YTTRIUM DIHYDRIDE 2.1 Introduction to yttrium dihydride 2.1.1 Yttrium dihydride for nuclear applications Moderators are used in nuclear reactors to thermalize, or slow down, neutrons so they may more efficiently participate in fission reactions in isotopes such as uranium-235, due to its high fission cross-section in the thermal energy range [27]. To that end, hydrogen is of interest for moderator materials because the mass of its nucleus is nearly equal to that of a neutron, which allows for significant energy transfer during elastic collisions between the two particles. Water is traditionally used for moderator applications, as seen in LWRs, due to its high hydrogen density, wide availability, and low cost. However, high temperature water
Advanced Moderator Material Handbook 4 09/30/2020
and steam pose significant issues for corrosion and the total hydrogen density in steam and supercritical water is much lower than in liquid water. Due to their higher thermal stability, as compared with water, metal hydrides are of interest for use as reactor moderator materials.
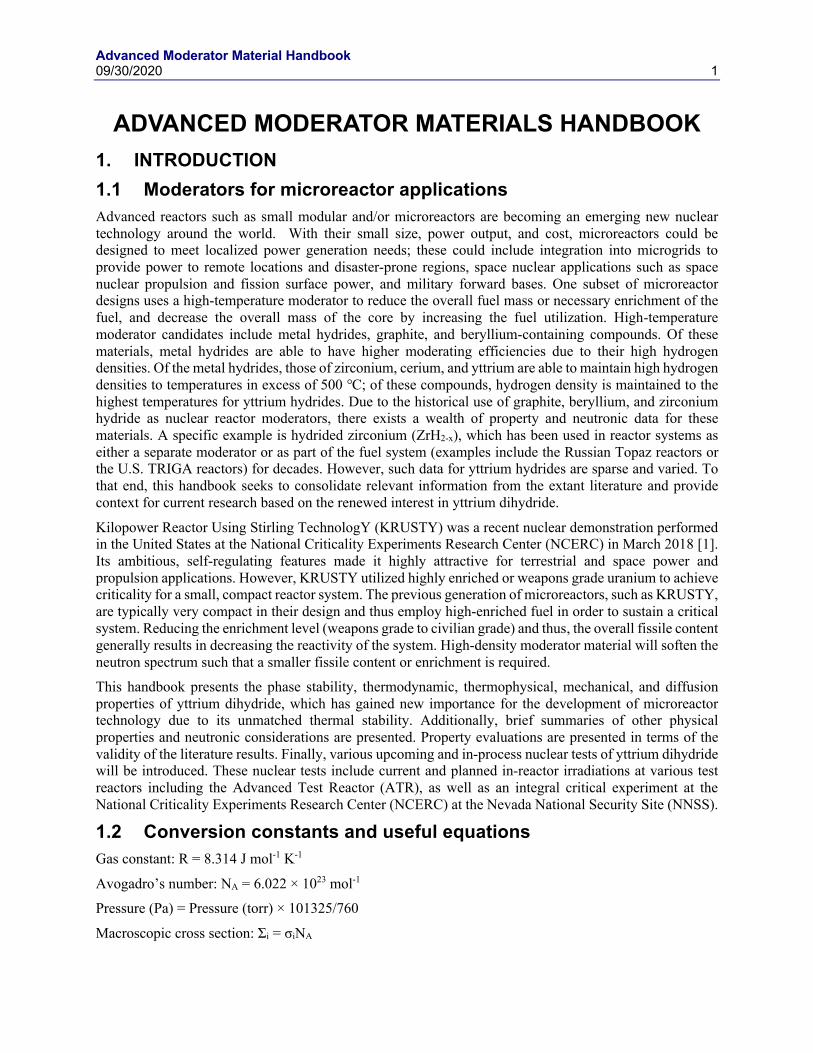
Zirconium hydride has traditionally been considered for this application, due to the excellent neutronic properties of zirconium and the wide availability of nuclear-grade zirconium: a result of its ubiquitous nature in the nuclear industry. Zirconium hydride is able to be operated to temperatures of approximately 650 °C while maintaining similar moderation levels as water. However, at further elevated temperatures, zirconium exhibits a significant decrease in hydrogen density. This is a characteristic of all metal hydrides, though the temperature at which these metals desorb hydrogen is different for each metal hydride. Figure 2.1 plots equilibrium hydrogen atom density as a function of temperature in 1 atm of hydrogen gas for various materials considered for nuclear reactor moderator applications, including water and several metal hydrides.
Figure 2.1: Hydrogen atom density as a function of temperature for water various metal hydrides in equilibrium with 1 atm of hydrogen gas for temperatures between 25 and 1400 °C (taken from [20]).
It is observed in Figure 2.1 that the hydrogen density of zirconium in equilibrium with 1 atm of hydrogen gas significantly decreases at approximately 850 °C. Yttrium hydrides, on the other hand, are able to maintain high hydrogen densities to much higher temperatures and only exhibit significant reduction in hydrogen density at approximately 1350 °C. However, 1 atm is optimistic and in most realistic scenarios, hydrogen dissociation will occur at lower temperatures.
It should be noted that yttrium, which is mono-isotopic as yttrium-89, has a thermal neutron absorption cross-section that is approximately two orders of magnitude greater than that of natural zirconium [27]. Thus, it may decrease neutronic efficiency in the system. However, the ability to achieve much higher temperatures will enable higher thermal efficiencies for power generation and, thus, reduce the mass of the power conversion and heat rejection systems [28]. The greater thermal stability of yttrium hydrides,
200 400 600 800 1000 1200 14000
1
2
3
4
5
6
7
8
9
Temperature (C)
Hydrogenatom
density(1022H
atoms/cm
3)
Water
Lithium
Yttrium
Zirconium
Cerium
Thorium
Uranium

Advanced Moderator Material Handbook 09/30/2020 5
particularly yttrium dihydride, over zirconium hydride, promotes an interest in this material for nuclear reactor moderator applications.
2.1.2 Specifications Commercial uses for pure yttrium are limited. Because of this, a low-cost large-scale, continuous process to produce high-purity yttrium metal has not been developed. As a result, pure yttrium metal for the preparation of hydrides is relatively difficult to obtain. To that end, only a few commercial vendors have been identified that can supply pure yttrium, while very high-purity yttrium (oxygen content below 1000 wt. ppm) may only be obtained from US Department of Energy labs such as The Ames Laboratory.
2.1.3 Summary of needs The first studies of the yttrium-hydrogen system examined the thermodynamics of hydride formation and produced reaction enthalpies and entropies, as well as X-ray and neutron diffraction studies to characterize the crystal structure of both hydride phases. The properties of unirradiated yttrium dihydride are well-characterized and there have been a number of studies measuring each with significant overlap across studies. However, phase transition kinetics are not well-characterized: that is, hydrogen absorption/desorption kinetics have not been studied for the formation of yttrium dihydride from yttrium metal. Neither have the kinetics of the formation of yttrium trihydride been studied.
The properties of unirradiated yttrium trihydride are not well-characterized. This is due to the fact that synthesis of monoliths of yttrium trihydride is difficult. On a per mass basis, the formation of the trihydride from yttrium metal is accompanied by a 13.7% volume increase and the formation of the trihydride from the dihydride is accompanied by an 8.9% volume increase. This results in significant structural degradation of the material and subsequent pulverization of monoliths. This will be discussed in the context of reactor design and operation.
Yttrium dihydride has been used as a moderator in previous reactors, as will be discussed in Section 4. However, Post-Irradiation Examination (PIE) has not been reported on yttrium hydrides. As such, irradiation effects on microstructure, thermophysical and mechanical properties, dimensional instability, and any potential moderator-cladding interactions have not been evaluated. This appears to be the biggest gap in the currently-available set of data from a materials performance perspective. However, upcoming irradiations of yttrium dihydride are scheduled to fill these gaps in knowledge.
An integral critical experiment has been planned at the National Criticality Experiments Research Center (NCERC) at the Nevada National Security Site (NNSS) in order to study neutron flux as a function of temperature.
2.1.4 Future research needs and considerations The biggest need for the deployment of yttrium dihydride as a nuclear reactor moderator is in-reactor performance. That is, it is necessary to understand the modes of degradation that may occur under normal reactor operating conditions. To that end, PIE of neutron-irradiated yttrium dihydride will satisfy this need.
Once PIE has been performed and degradation modes identified, separate effects testing of these modes under out-of-pile conditions can be used to understand the mechanisms by which they occur and potential methods to mitigate their effects.
2.2 Phases, phase transitions, and phase diagrams Reviews of the Y-H system have been performed in the past, such as by Mueller, et al. and Khatamian, et al. [10], [29, p. 10]. In this section, we combine some of the data given in these reviews with recently-reported results to compile as complete a picture of the current understanding of this system as possible.
Advanced Moderator Material Handbook 6 09/30/2020
2.2.1 Phases 2.2.1.1 Stable phases For nuclear reactor moderator applications, the relevant phases within the Y-H system can be down-selected to those stable at ambient pressure and temperatures between 25 and 1000 °C. There are three principal phases of interest: hcp yttrium metal (α-Y), yttrium dihydride (δ-YH2), and yttrium trihydride (ε-YH3) [10], [29], [30]. There also exists a high-pressure yttrium trihydride, which maintains the same crystal structure as the ambient-pressure dihydride [31].
α-yttrium is the stable phase of yttrium metal at ambient pressure up to approximately 1480 °C, at which point it transforms to the bcc β-yttrium. The melting point of yttrium metal is approximately 1530 °C. The hydrides of yttrium are formed upon exposure of α-yttrium to hydrogen gas at pressures up to 1 atm and temperatures up to approximately 1350 °C [9], [32], [33]. Hydride formation may be possible at higher temperatures. However, investigations of hydriding have not been performed to temperatures above 1350 .
2.2.1.2 Other phases Compression techniques yielded yttrium superhydrides at pressures exceeding 200 GPa and temperatures exceeding 400 °C [34], [35]. However, these superhydride phases have not been shown to be stable at ambient pressures or temperatures.
2.2.1.3 Measure of composition The hydrogen content of metal hydrides for moderator applications has been denoted by four principal units: (1) the hydrogen-to-metal atom ratio, or H/M; (2) the hydrogen atom fraction/percent; (3) the hydrogen weight fraction/percent; and (4) the hydrogen atom density in atom/cm3. For neutronics calculations, the hydrogen atom density is the preferred unit, as it can readily be used to calculate macroscopic cross-sections.
The hydrogen-to-metal atom ratio is calculated as the moles/atoms of hydrogen absorbed by the hydride to the moles/atoms of yttrium metal in the original sample. Both of these forms of hydrogen-to-metal atom ratios are typically calculated through mass balance measurements, but the moles of hydrogen absorbed can also be measured by hydrogen pressure drops during Sievert’s gas absorption.
The hydrogen atom fraction or percent is calculated quite simply from the H/M ratio, 𝑥. In one molecule of YHx, the hydrogen atom fraction is given as:
𝑐! =𝑥
1 + 𝑥
Hydrogen weight fraction, or percent, are similarly determined. If 𝑥 is the H/M ratio, then the hydrogen weight fraction, 𝑤!, is calculated as:
𝑤! =𝑀!𝑥
𝑀" +𝑀!𝑥
where 𝑀! is the molar mass of hydrogen (approximately 1.01 g/mol) and 𝑀" is the molar mass of yttrium (approximately 88.91 g/mol).
The hydrogen atom density, 𝑁!, is calculated from the mass density of the material (either the metal with hydrogen in solid-solution or the metal hydride), 𝜌, and the H/M ratio, 𝑥, as follows:
𝑁! ;𝑎𝑡𝑜𝑚𝑠𝐻𝑐𝑚# ? =
𝜌 @ 𝑔𝑐𝑚#B 𝑥𝑁$
88.91 + 1.01𝑥
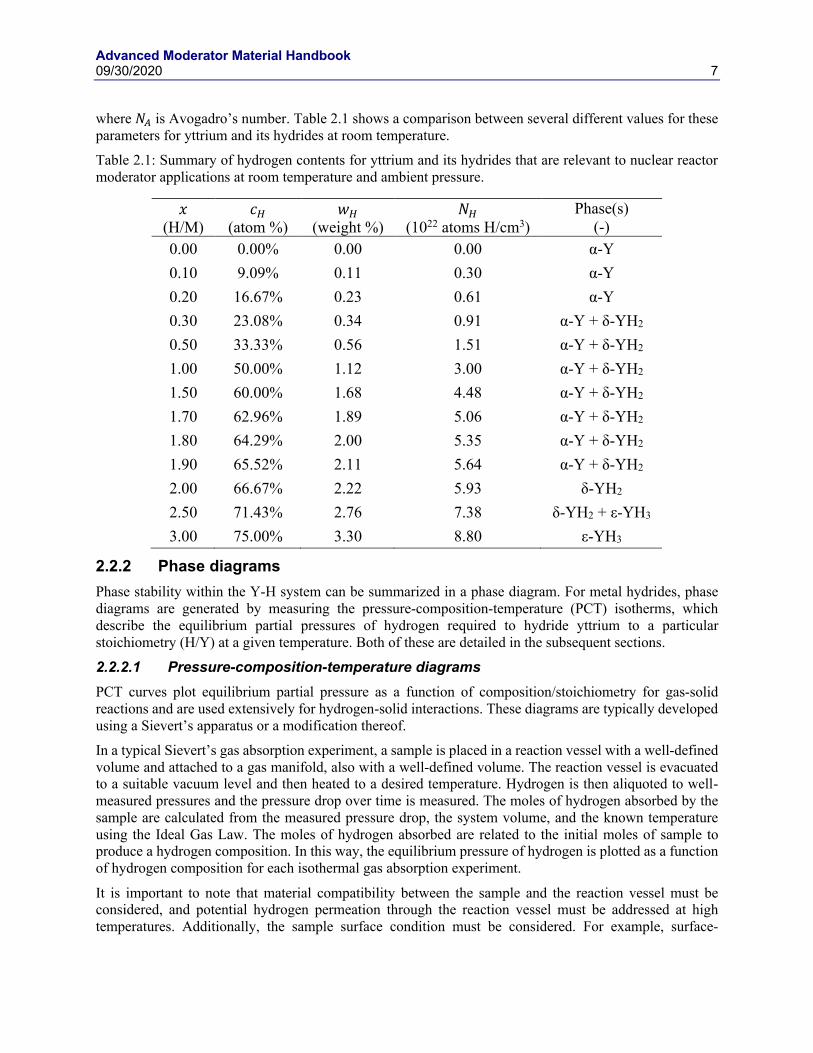
Advanced Moderator Material Handbook 09/30/2020 7
where 𝑁$ is Avogadro’s number. Table 2.1 shows a comparison between several different values for these parameters for yttrium and its hydrides at room temperature.
Table 2.1: Summary of hydrogen contents for yttrium and its hydrides that are relevant to nuclear reactor moderator applications at room temperature and ambient pressure.
𝑥 (H/M)
𝑐! (atom %)
𝑤! (weight %)
𝑁! (1022 atoms H/cm3)
Phase(s) (-)
0.00 0.00% 0.00 0.00 α-Y 0.10 9.09% 0.11 0.30 α-Y 0.20 16.67% 0.23 0.61 α-Y 0.30 23.08% 0.34 0.91 α-Y + δ-YH2 0.50 33.33% 0.56 1.51 α-Y + δ-YH2 1.00 50.00% 1.12 3.00 α-Y + δ-YH2 1.50 60.00% 1.68 4.48 α-Y + δ-YH2 1.70 62.96% 1.89 5.06 α-Y + δ-YH2 1.80 64.29% 2.00 5.35 α-Y + δ-YH2 1.90 65.52% 2.11 5.64 α-Y + δ-YH2 2.00 66.67% 2.22 5.93 δ-YH2 2.50 71.43% 2.76 7.38 δ-YH2 + ε-YH3 3.00 75.00% 3.30 8.80 ε-YH3
2.2.2 Phase diagrams Phase stability within the Y-H system can be summarized in a phase diagram. For metal hydrides, phase diagrams are generated by measuring the pressure-composition-temperature (PCT) isotherms, which describe the equilibrium partial pressures of hydrogen required to hydride yttrium to a particular stoichiometry (H/Y) at a given temperature. Both of these are detailed in the subsequent sections.
2.2.2.1 Pressure-composition-temperature diagrams PCT curves plot equilibrium partial pressure as a function of composition/stoichiometry for gas-solid reactions and are used extensively for hydrogen-solid interactions. These diagrams are typically developed using a Sievert’s apparatus or a modification thereof.
In a typical Sievert’s gas absorption experiment, a sample is placed in a reaction vessel with a well-defined volume and attached to a gas manifold, also with a well-defined volume. The reaction vessel is evacuated to a suitable vacuum level and then heated to a desired temperature. Hydrogen is then aliquoted to well-measured pressures and the pressure drop over time is measured. The moles of hydrogen absorbed by the sample are calculated from the measured pressure drop, the system volume, and the known temperature using the Ideal Gas Law. The moles of hydrogen absorbed are related to the initial moles of sample to produce a hydrogen composition. In this way, the equilibrium pressure of hydrogen is plotted as a function of hydrogen composition for each isothermal gas absorption experiment.
It is important to note that material compatibility between the sample and the reaction vessel must be considered, and potential hydrogen permeation through the reaction vessel must be addressed at high temperatures. Additionally, the sample surface condition must be considered. For example, surface-

Advanced Moderator Material Handbook 8 09/30/2020
adsorbed species, chemical treatment of the surface, ball-milling, and the presence of a surface oxide have been shown to impact hydriding [36].
A compilation of the PCT curves in the literature for the Y-H system is plotted in Figure 2.2. Results are plotted as equilibrium pressure of hydrogen (on a logarithmic scale) as a function of hydrogen-to-yttrium atom ratio. Each curve represents data collected at a particular temperature.
Figure 2.2: Compilation of PCT curves for the Y-H system up to a hydrogen-to-yttrium ratio of 2.0. Data replotted from [9], [32], [33], [37], [38].
From Figure 2.2, it is observed that, for low hydrogen contents, up to H/Y = 0.3-0.4, the PCT data follow an approximate Sievert’s law dependence, which is characteristic of hydrogen solubility in the base yttrium metal, as will be discussed in Section 2.3.1.1. For hydrogen contents between approximately 0.3 – 0.6 and 1.0 – 1.6 H/Y units, depending on the temperature, the hydrogen partial pressure remains constant as a function of hydrogen content, which is due to the formation of the dihydride from hydrogen-saturated yttrium metal and hydrogen gas. This regime is called the ‘plateau region’ and represents two-phase equilibrium between the hydrogen-saturated metal and the dihydride. Finally, at higher hydrogen contents, the hydrogen partial pressure rapidly increases as a function of hydrogen content. At this point, the system
499
518 546
593
601.1
~650
~700 ~750
~800 ~850
~900 950 1000 1050 1100 1150 1200 1250 1300
1350
Advanced Moderator Material Handbook 09/30/2020 9
is single-phase dihydride that is nearly stoichiometric and the accommodation of further hydrogen becomes increasingly difficult (thermodynamically decreasingly favorable).
Across the literature data, it is observed that the plateau partial pressures are very consistent. As a result, it is believed that these values may be trusted. However, the pressure-composition relationships in the single-phase regions (hydrogen in solution in yttrium metal or the single-phase dihydride) are quite inconsistent. For example, the terminal stoichiometries reached in the various studies are not consistent; in the study by Lundin, et al. and Begun, et al., the terminal hydrogen content is H/Y = 2.0, while for Yannopoulos, et al. this value was closer to H/Y = 1.90, and for the study by Tanase, et al., this value was approximately H/Y = 1.70. In the single-phase region with low hydrogen contents (yttrium metal with hydrogen in solid solution), the relationships between the hydrogen partial pressure and hydrogen-to-yttrium atom ratio are also not consistent across the various studies, though they are consistent within each single study.
It is not currently known why these inconsistencies are present in the literature data, though starting metal purity is a likely cause. Lundin, et al. noted that the principal impurities in their yttrium metal were 0.57% zirconium and 0.32% oxygen. Yannopoulos, on the other hand, only noted low-Z impurities of 0.179% oxygen and 0.0033% nitrogen, by mass. The yttrium metal used by Begun, et al. showed approximately 0.1% dysprosium, cerium, and zirconium, as well as 0.45% oxygen and 0.05% nitrogen, hydrogen, and other rare earths, by mass, with impurities totaling approximately 0.85% by mass. Tanase, et al. measured oxygen and nitrogen impurities to be 0.083% and 0.12%, by mass, respectively. Fu, et al. noted that the metal used in their work was vacuum distilled and provided a maximum purity (lowest impurity content of the group) of 0.0155% oxygen and 0.0030% nitrogen, by mass.
Small differences in gas purities could also affect these values. Lundin et al. obtained hydrogen by thermal decomposition of uranium hydride, while the studies by Yannopoulos, et al. and Begun, et al. used high-purity hydrogen gas cylinders with impurities of approximately 60 and 10 ppm, respectively, though Yannopoulos, et al. further purified the gas using a liquid nitrogen trap and by passing the gas over zirconium turnings. Tanase, et al. used gas with a purity of 99.9999%, while Fu, et al. did not mention the purity of the hydrogen gas used to develop the PCT curves.
Another possible source of the discrepancies could arise from the differences in the Sievert’s apparatuses used in the various studies. Lundin, et al. Yannopoulos, et al., Begun, et al., and Tanase, et al. used ceramic reaction vessels, such as mullite and quartz, due to the low permeability of hydrogen through these materials [39]. However, Fu, et al. used a stainless-steel reaction vessel, which is noted to have high permeability of hydrogen at elevated temperatures [39]. As a result of the inconsistencies across datasets and the potential impact of gas and metal starting purities, it is believed that more work is necessary to further characterize the PCT relationships in the single-phase regions.
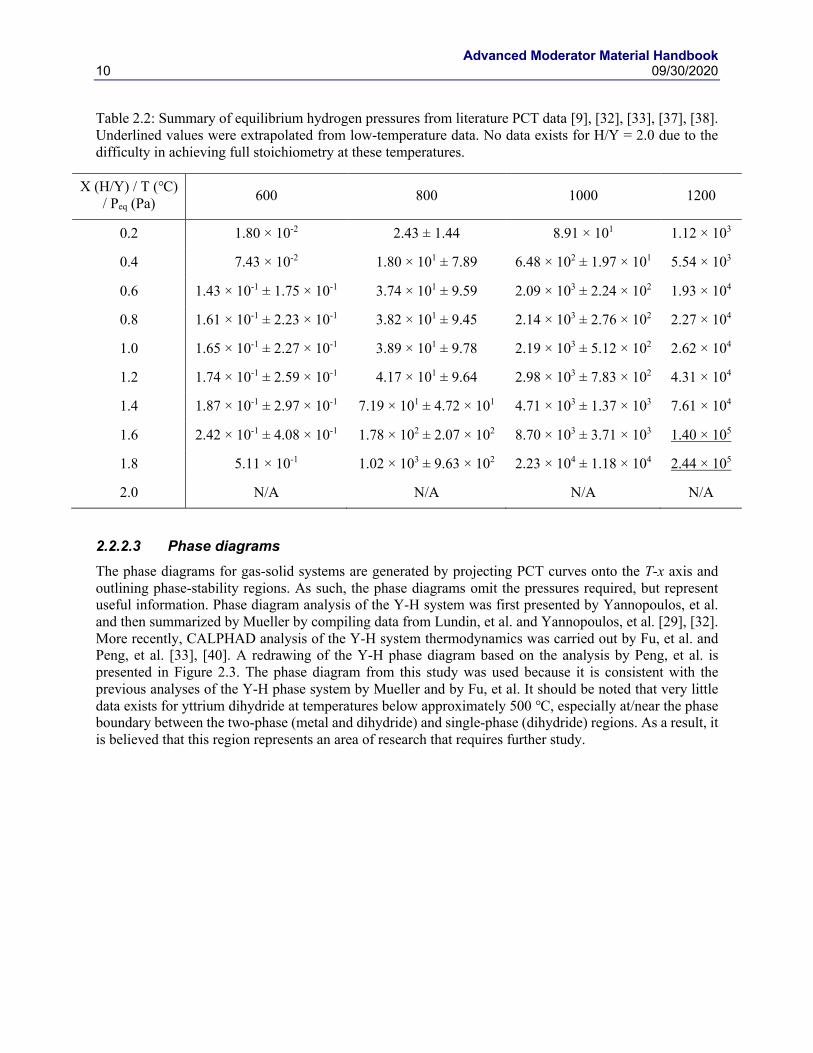
2.2.2.2 Hydrogen partial pressures As mentioned in Section 2.2.2.1, the PCT data for the Y-H system exhibit consistency in the two-phase region (metal and dihydride in equilibrium), but show significant differences in the single-phase regions. However, a summary of the equilibrium partial pressures, along with the associated data spread from averaging over the various literature sources, is helpful. A summary of this data is shown in Table 2.2. Data is presented as equilibrium hydrogen pressure (in Pa) as a function of hydrogen-to-yttrium atom ratio and temperature (in ).
Advanced Moderator Material Handbook 10 09/30/2020
Table 2.2: Summary of equilibrium hydrogen pressures from literature PCT data [9], [32], [33], [37], [38]. Underlined values were extrapolated from low-temperature data. No data exists for H/Y = 2.0 due to the difficulty in achieving full stoichiometry at these temperatures.
X (H/Y) / T () / Peq (Pa) 600 800 1000 1200
0.2 1.80 × 10⁻² 2.43 ± 1.44 8.91 × 101 1.12 × 10³
0.4 7.43 × 10⁻² 1.80 × 101 ± 7.89 6.48 × 10² ± 1.97 × 101 5.54 × 10³
0.6 1.43 × 10⁻¹ ± 1.75 × 10⁻¹ 3.74 × 101 ± 9.59 2.09 × 10³ ± 2.24 × 10² 1.93 × 10⁴
0.8 1.61 × 10⁻¹ ± 2.23 × 10⁻¹ 3.82 × 101 ± 9.45 2.14 × 10³ ± 2.76 × 10² 2.27 × 10⁴
1.0 1.65 × 10⁻¹ ± 2.27 × 10⁻¹ 3.89 × 101 ± 9.78 2.19 × 10³ ± 5.12 × 10² 2.62 × 10⁴
1.2 1.74 × 10⁻¹ ± 2.59 × 10⁻¹ 4.17 × 101 ± 9.64 2.98 × 10³ ± 7.83 × 10² 4.31 × 10⁴
1.4 1.87 × 10⁻¹ ± 2.97 × 10⁻¹ 7.19 × 101 ± 4.72 × 101 4.71 × 10³ ± 1.37 × 10³ 7.61 × 10⁴
1.6 2.42 × 10⁻¹ ± 4.08 × 10⁻¹ 1.78 × 10² ± 2.07 × 10² 8.70 × 10³ ± 3.71 × 10³ 1.40 × 10⁵
1.8 5.11 × 10⁻¹ 1.02 × 10³ ± 9.63 × 10² 2.23 × 10⁴ ± 1.18 × 10⁴ 2.44 × 10⁵
2.0 N/A N/A N/A N/A
2.2.2.3 Phase diagrams The phase diagrams for gas-solid systems are generated by projecting PCT curves onto the T-x axis and outlining phase-stability regions. As such, the phase diagrams omit the pressures required, but represent useful information. Phase diagram analysis of the Y-H system was first presented by Yannopoulos, et al. and then summarized by Mueller by compiling data from Lundin, et al. and Yannopoulos, et al. [29], [32]. More recently, CALPHAD analysis of the Y-H system thermodynamics was carried out by Fu, et al. and Peng, et al. [33], [40]. A redrawing of the Y-H phase diagram based on the analysis by Peng, et al. is presented in Figure 2.3. The phase diagram from this study was used because it is consistent with the previous analyses of the Y-H phase system by Mueller and by Fu, et al. It should be noted that very little data exists for yttrium dihydride at temperatures below approximately 500 , especially at/near the phase boundary between the two-phase (metal and dihydride) and single-phase (dihydride) regions. As a result, it is believed that this region represents an area of research that requires further study.

Advanced Moderator Material Handbook 09/30/2020 11
Figure 2.3: Redrawing of the Y-H phase diagram based on CALPHAD analysis by Peng, et al. [40]. Phase regions are labeled and phase regions have been modified from the original source as a function of H/Y atom ratio.
2.2.3 Structural data Key structural parameters for the relevant phases of the Y-H system are given in Table 2.3, which notes the chemical compound, the hydrogen-to-yttrium atom ratio, the measured lattice parameters, and the techniques used to determine the lattice parameters. The data summarized in Table 2.3 show that the lattice parameters of each phase are very consistent across all studies, with discrepancies only principally arising on the order of approximately one-hundredth or one-thousandth of an angstrom. However, these differences could also mainly be due to differences in hydrogen content. While a more detailed study may be of interest, the data in the literature are thought to be sufficient due to the consistency across multiple studies and techniques.

Advanced Moderator Material Handbook 12 09/30/2020
Table 2.3: Experimentally-determined lattice parameters for Y, YH2, and YH3 at ambient temperature and pressure. *Setoyama et al. measured lattice parameter of YH2-x as a function of hydrogen content to be 𝑎(𝑛𝑚) = 0.5215 − 4.127 × 10%&𝑐!(𝐻/𝑌).
Compound H/Y a (Å) c (Å) Technique. Ref.
α-Y 0 3.6474 ± 0.0007 5.7306 ± 0.0008 X-ray diffraction [41]
0 3.654 5.7501 X-ray diffraction [9]
0.23 3.6636 ± 0.0009 5.7900 ± 0.0013 X-ray diffraction [42]
δ-YH2 2.00 5.201 - X-ray diffraction [9]
1.96 5.205 ± 0.002 - Neutron diffraction [10]
1.7 – 2.0 * - [11]
ε-YH3 3.00 3.674 6.599 X-ray diffraction [9]
2.90 – 3.00 3.672 6.659 X-ray diffraction [43]
N/A 3.67 ± 0.02 6.62 ± 0.02 X-ray diffraction [44]
2.3 Properties of un-irradiated yttrium dihydride 2.3.1 Phase formation thermodynamics An analysis of the PCT curves allows for calculation of the phase formation thermodynamics for yttrium or yttrium hydrides at a particular stoichiometry.
2.3.1.1 Hydrogen in yttrium metal For low values of H/Y, hydrogen absorbs into the yttrium metal by the process of adsorption, dissociation, and dissolution [45]. The chemical equation for this reaction is given as:
𝐻' 2𝐻( (1)
where 𝐻( is hydrogen adsorbed onto the yttrium metal surface. At equilibrium, the chemical potential of the gas is equal to the chemical potential of the hydrogen in the metal. The equilibrium constant, called the Sievert’s constant, is given as follows:
𝐾) = 𝑐!G𝑝!! (2)
Advanced Moderator Material Handbook 09/30/2020 13
where 𝐾) is the Sievert’s Law constant, 𝑐! is the concentration of hydrogen in solution, and 𝑝!! is the equilibrium partial pressure of hydrogen. 𝐾) is related to thermodynamic properties through the Gibb’s Free Energy as follows:
𝐾) = 𝐾)* exp ;−Δ𝐻)𝑅𝑇
+Δ𝑆)𝑅 ? (3)
where 𝐾)* is the pre-exponential factor for the Sievert’s constant and Δ𝐻) and Δ𝑆) are the enthalpy and non-configurational entropy of solution, respectively. Combining equations (2) and (3) enables calculation of the standard enthalpy and entropy of formation for a given H/M value given knowledge of 𝐾)* [46]. The result is that Gibb’s Free Energy and, thus, the enthalpy and non-configurational entropy of solution, is a linear function of the hydrogen concentration.
2.3.1.2 Two-phase region At intermediate values of H/Y, the hydrogen reacts with saturated yttrium metal to form the dihydride. This is represented in the PCT curves as the plateau region and consists of two-phase saturated α-Y and δ-YH2‑z at the equilibrium stoichiometry given by the composition at the phase boundary. For example, at 600 °C, at an overall stoichiometry of 1.0 H/Y units, the material will consist of α-Y with an approximate composition of 0.45 H/Y units and δ-YH2-z with a composition of 1.5 H/Y units.
In this two-phase region, the hydrogen absorption reaction can be written as: 2
2 − 𝑦 − 𝑧𝛼 − 𝑌𝐻+ +𝐻'(𝑔)
22 − 𝑦 − 𝑧
𝑌𝐻'%,
where 𝑦 is the maximum solubility of hydrogen in yttrium metal and 𝑧 is the sub-stoichiometry in hydrogen sublattice of yttrium dihydride [47].
In the two-phase region, the enthalpy and entropy of the reaction do not vary with hydrogen concentration, as required by chemical equilibrium [48].
2.3.1.3 Single-phase yttrium dihydride The general reaction between yttrium metal and hydrogen gas to form the single-phase dihydride is given as follows:
𝑌(𝑠) +2 − x2
𝐻'(𝑔) 𝑌𝐻'%-(𝑠)
For a reversible reaction, the equilibrium constant for this equation is given as follows:
𝐾./ =𝑎(𝑌𝐻'%0)
𝑎(𝑌)𝑎(𝐻')'%0'
where 𝑎(𝑖) is the activity of species 𝑖. Assuming that the activities of the solid, pure phases are unity, and that the concentrations of gases are equal to their equilibrium partial pressures T𝑝1 = 𝑝.//𝑝*U, then
𝐾./ = 𝑝!!%2'%0' 3
Combining the definitions of the Gibb’s free energy yields:
lnT𝐾./U = −Δ𝐻⊖
𝑅𝑇+Δ𝑆⊖
𝑅
Advanced Moderator Material Handbook 14 09/30/2020
2 − 𝑥2
lnT𝑃!!U =Δ𝐻⊖
𝑅𝑇−Δ𝑆⊖
𝑅
where Δ𝐻⊖ is the standard enthalpy of reaction and Δ𝑆⊖ is the standard entropy of reaction.
From this analysis, the natural log of the equilibrium constant and the natural log of the hydrogen partial pressure are both linear functions of 1/𝑇. The enthalpy of formation is obtained from the slope of the curve, while the entropy of formation is obtained from its intercept.
For exothermic reactions, the enthalpy of formation is negative, which yields a negative slope for plots of lnT𝑝!!U vs. 1/𝑇 and a positive slope for plots of lnT𝐾./U vs. 1/𝑇.
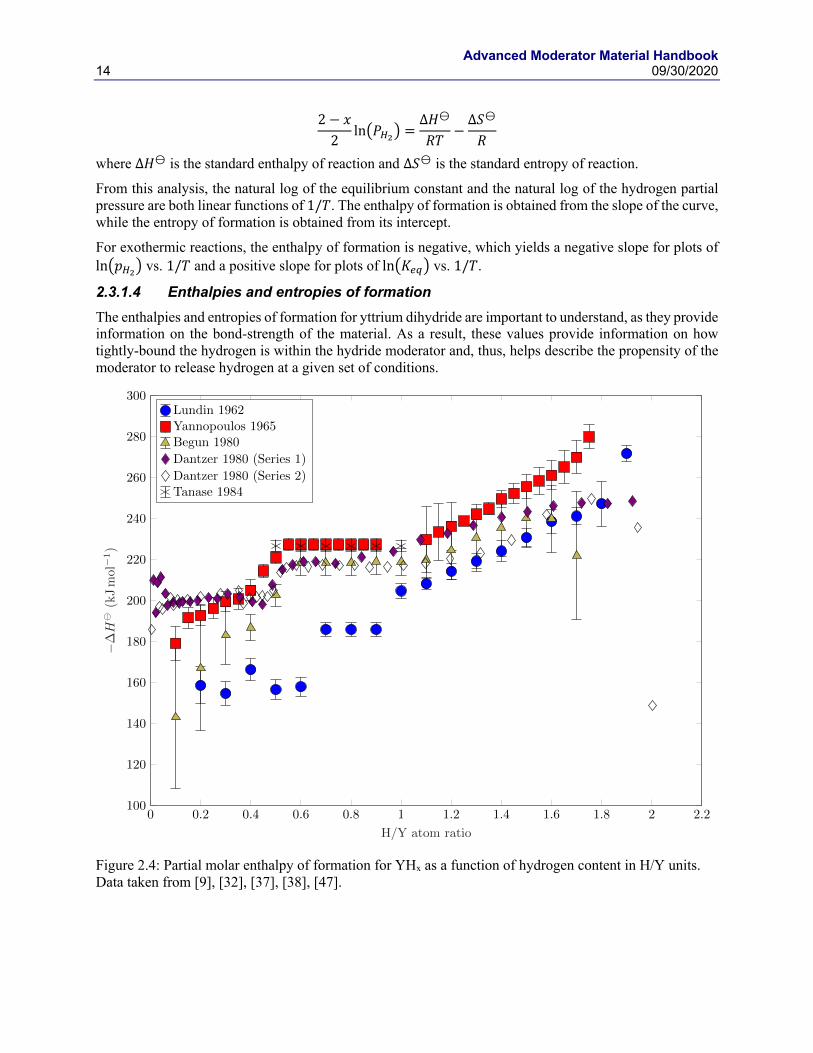
2.3.1.4 Enthalpies and entropies of formation The enthalpies and entropies of formation for yttrium dihydride are important to understand, as they provide information on the bond-strength of the material. As a result, these values provide information on how tightly-bound the hydrogen is within the hydride moderator and, thus, helps describe the propensity of the moderator to release hydrogen at a given set of conditions.
Figure 2.4: Partial molar enthalpy of formation for YHx as a function of hydrogen content in H/Y units. Data taken from [9], [32], [37], [38], [47].
0 0.2 0.4 0.6 0.8 1 1.2 1.4 1.6 1.8 2 2.2100
120
140
160
180
200
220
240
260
280
300
H/Y atom ratio
H
(kJmol
1)
Lundin 1962
Yannopoulos 1965
Begun 1980
Dantzer 1980 (Series 1)
Dantzer 1980 (Series 2)
Tanase 1984

Advanced Moderator Material Handbook 09/30/2020 15
Figure 2.5: Partial molar non-configurational entropy of YHx as a function of hydrogen content in H/Y units. Data taken from [9], [32], [37], [38].
The partial molar enthalpies of formation in the literature are plotted in Figure 2.4, while the partial molar entropies of formation are plotted in Figure 2.5. It should be noted that all results except those from Dantzer, et al. were calculated using the above methods from the PCT curves, while Dantzer, et al. measured the partial molar enthalpies of formation using calorimetric methods. Another available dataset by Fadeyev, et al. was not included, due to a lack of access, as it is a foreign publication not available in English [49].
From Figure 2.4, it is observed that many of the data sets exhibit a significant degree of overlap. The only dataset that appears to disagree is the one by Lundin, et al., for which the data appear to be consistently lower, as compared with the other literature. The temperature range examined in the study by Lundin et al. was higher than for all other studies, which could have impacted the analysis. In all studies, the enthalpies of formation are essentially constant in the two-phase equilibrium region of α-Y + δ-YH2 for hydrogen contents between approximately 0.5 and 1.0 H/Y units. In the δ-YH2 single-phase region, the enthalpy of formation consistently increases with hydrogen content, though Dantzer, et al. measured a significantly lower value at 2.0 H/Y units. However, in the α-Y single-phase region, the relationship between enthalpy of formation and hydrogen content is not as clear. The data by Dantzer, et al. show a nearly constant enthalpy of formation in this region, while the values determined from other studies, calculated using the PCT curves, show increasing formation enthalpy with hydrogen content. It should be noted from Section 2.2.2.1 that there exists a significant degree of scatter in the PCT data for the α-Y single-phase region across all datasets.
0 0.2 0.4 0.6 0.8 1 1.2 1.4 1.6 1.8 2 2.20
20
40
60
80
100
120
140
160
180
200
220
240
H/Y atom ratio
S
(Jmol
1K1)
Lundin 1962
Yannopoulos 1965
Begun 1980
Tanase 1984

Advanced Moderator Material Handbook 16 09/30/2020
As was the case for Figure 2.4, in Figure 2.5, it is observed that the datasets exhibit a significant degree of overlap, with only the data from Lundin, et al. deviating from the others. Again, this is believed to be due to the higher temperature at which hydrogen absorption experiments were performed. However, this is only the case for the α-Y single phase and α-Y + δ-YH2 two-phase regions. In the δ-YH2 single-phase regions, all datasets exhibit consistency. The non-configurational entropy of formation is observed to increase with hydrogen content up to approximately 0.5 H/Y units, which demarcates the α-Y and α-Y + δ-YH2 regions. In the two-phase region, the entropy of formation is constant. Finally, in the δ-YH2 single-phase region, the non-configurational entropy increases with hydrogen content.
2.3.2 Phase-formation kinetics While hydriding kinetics have been measured for many materials such as titanium, zirconium, and intermetallic compounds for hydrogen storage applications, the formation kinetics of yttrium dihydride have not been explicitly measured [36], [50]. One study in the literature examined the emissivity of a sample of yttrium metal as a function of time when exposed to 0.49 MPa (4.8 atm) of hydrogen at 528 K (250 °C), though the result was unclear due to the formation of yttrium trihydride before complete reaction of yttrium metal to form the dihydride [51]. The application of methods described in literature may be used to characterize the formation of yttrium dihydride from yttrium metal at various temperatures and pressures.
In general, the pure metals that form hydrides are highly electropositive and readily form surface oxide layers. These surface oxides act as barriers for hydrogen diffusion from the gaseous phase to the metal. As hydrogen diffuses to the metal, it reacts with the metal to form the metal hydride, which is accompanied by the characteristic volume expansion associated with metal hydride formation as the hydride ingresses into the metal in a film-like manner [36].
At low temperatures, the solubility of hydrogen in the metal is low, which results in a large hydrogen concentration gradient across the surface [36]. Under these conditions, hydrogen accumulates below the surface oxide layer and, thus, the hydrides nucleate just below the surface oxide layer and grow into the metal. The solubility of hydrogen in the metal increases exponentially with temperature. Thus, at high temperatures, the hydrogen concentration gradient is shallower and, thus, allows for hydrogen to diffuse further within the metal due to a slower approach to supersaturation at the surface. As a result, other nucleation sites beside the oxide/metal interface become possible such as pathways for fast diffusion like grain boundaries. This results in bulk nucleation of hydrides.
The observed effect of temperature and diffusion pathways on hydriding kinetics makes it clear that surface condition, the presence of impurity phases, heat treatment, and physical form (powder vs. monolith) may affect hydriding kinetics significantly. Thus, future investigations into the hydriding kinetics of yttrium to form yttrium dihydride must account for these types of effects.
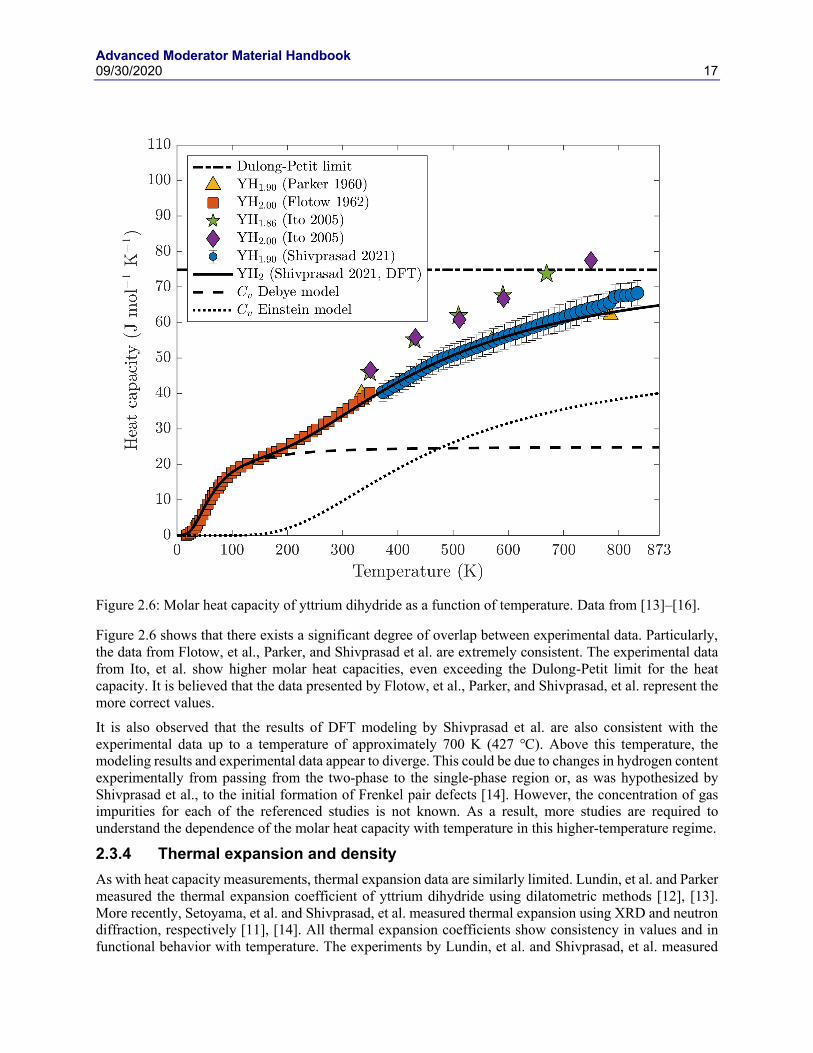
2.3.3 Heat capacity Experimental measurements of the thermophysical properties of yttrium dihydride are limited. Heat capacity has been measured experimentally and new, DFT-based methods allow for simulation of this property. Flotow, et al. measured the heat capacity at low temperatures (5 – 350 K) using an adiabatic calorimeter and cryostat [15]. Parker also reported heat capacity, as measured using an ice calorimeter, in the temperature range of 273 to 1081 K [13]. More recently, Ito, et al. and Shivprasad, et al. measured the heat capacity of yttrium dihydride using DSC [14], [16]. Ito et al. measured heat capacity for various stoichiometries of yttrium dihydride, while Shivprasad, et al. measured the heat capacity of sintered samples and compared experimental results with those calculated using DFT. A summary of these measurements and calculations is shown in Figure 2.6.
Advanced Moderator Material Handbook 09/30/2020 17
Figure 2.6: Molar heat capacity of yttrium dihydride as a function of temperature. Data from [13]–[16].
Figure 2.6 shows that there exists a significant degree of overlap between experimental data. Particularly, the data from Flotow, et al., Parker, and Shivprasad et al. are extremely consistent. The experimental data from Ito, et al. show higher molar heat capacities, even exceeding the Dulong-Petit limit for the heat capacity. It is believed that the data presented by Flotow, et al., Parker, and Shivprasad, et al. represent the more correct values.
It is also observed that the results of DFT modeling by Shivprasad et al. are also consistent with the experimental data up to a temperature of approximately 700 K (427 ). Above this temperature, the modeling results and experimental data appear to diverge. This could be due to changes in hydrogen content experimentally from passing from the two-phase to the single-phase region or, as was hypothesized by Shivprasad et al., to the initial formation of Frenkel pair defects [14]. However, the concentration of gas impurities for each of the referenced studies is not known. As a result, more studies are required to understand the dependence of the molar heat capacity with temperature in this higher-temperature regime.
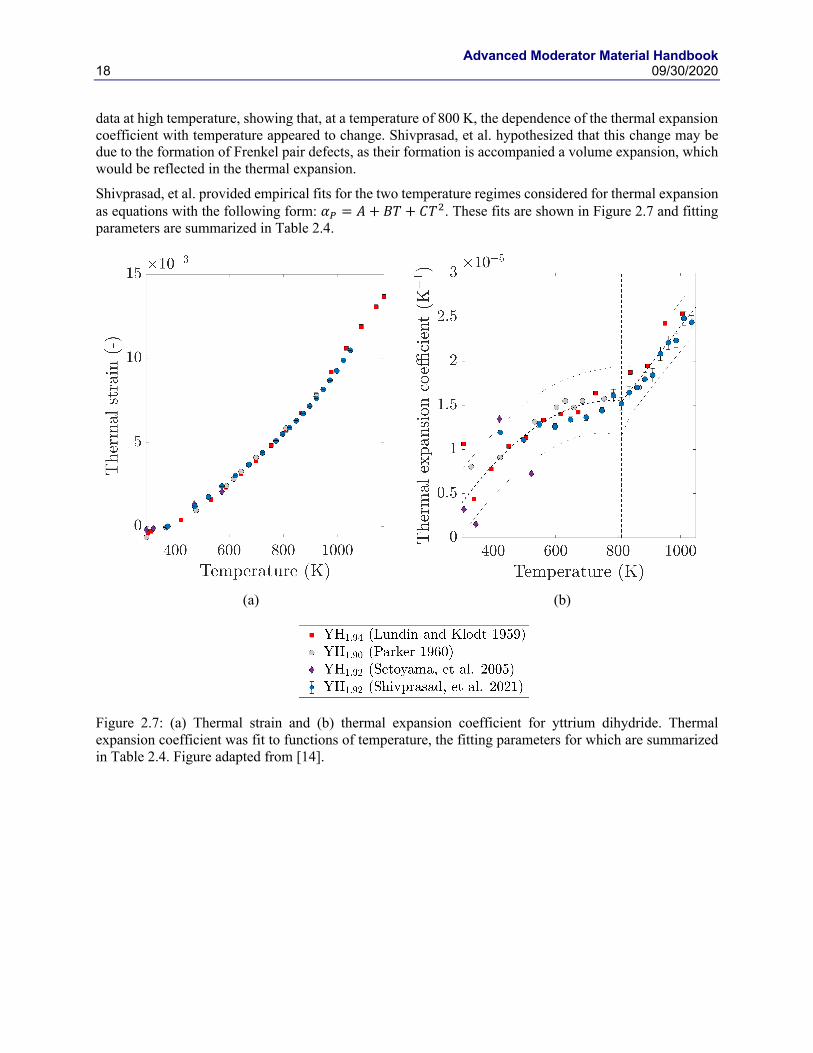
2.3.4 Thermal expansion and density As with heat capacity measurements, thermal expansion data are similarly limited. Lundin, et al. and Parker measured the thermal expansion coefficient of yttrium dihydride using dilatometric methods [12], [13]. More recently, Setoyama, et al. and Shivprasad, et al. measured thermal expansion using XRD and neutron diffraction, respectively [11], [14]. All thermal expansion coefficients show consistency in values and in functional behavior with temperature. The experiments by Lundin, et al. and Shivprasad, et al. measured
Advanced Moderator Material Handbook 18 09/30/2020
data at high temperature, showing that, at a temperature of 800 K, the dependence of the thermal expansion coefficient with temperature appeared to change. Shivprasad, et al. hypothesized that this change may be due to the formation of Frenkel pair defects, as their formation is accompanied a volume expansion, which would be reflected in the thermal expansion.
Shivprasad, et al. provided empirical fits for the two temperature regimes considered for thermal expansion as equations with the following form: 𝛼5 = 𝐴 + 𝐵𝑇 + 𝐶𝑇'. These fits are shown in Figure 2.7 and fitting parameters are summarized in Table 2.4.
(a)
(b)
Figure 2.7: (a) Thermal strain and (b) thermal expansion coefficient for yttrium dihydride. Thermal expansion coefficient was fit to functions of temperature, the fitting parameters for which are summarized in Table 2.4. Figure adapted from [14].

Advanced Moderator Material Handbook 09/30/2020 19
Table 2.4: Empirical fitting parameters for thermal expansion coefficient as a function of temperature. Fitting parameters are given with 95% confidence intervals. Fitting parameters from [14].
Temperature range
(K)
A
(10-6 K-1)
B
(10-9 K-2)
C
(10-11 K-3)
298 – 810 -15.01 ± 8.87 78.20 ± 34.37 -5.00 ± 3.15
810 – 1048 -21.23 ± 9.13 45.18 ± 9.91 -
From Figure 2.7(a), it is observed that the thermal strain is consistent across all the literature studies. Similarly, the thermal expansion coefficients are also consistent, with differences arising from the sensitivity of the relative techniques.
Shivprasad, et al. fit the literature thermal expansion coefficients to two functions of temperature with an observed change in slope at approximately 800 K. This also appeared to correspond to a peak in the heat capacity data, though the temperatures were slightly different. The authors provided possible explanations including crossing a phase boundary and the formation of Frenkel pair defects, both of which would change the molar volume and, thus, present as changes to the thermal strain and the coefficient of thermal expansion.
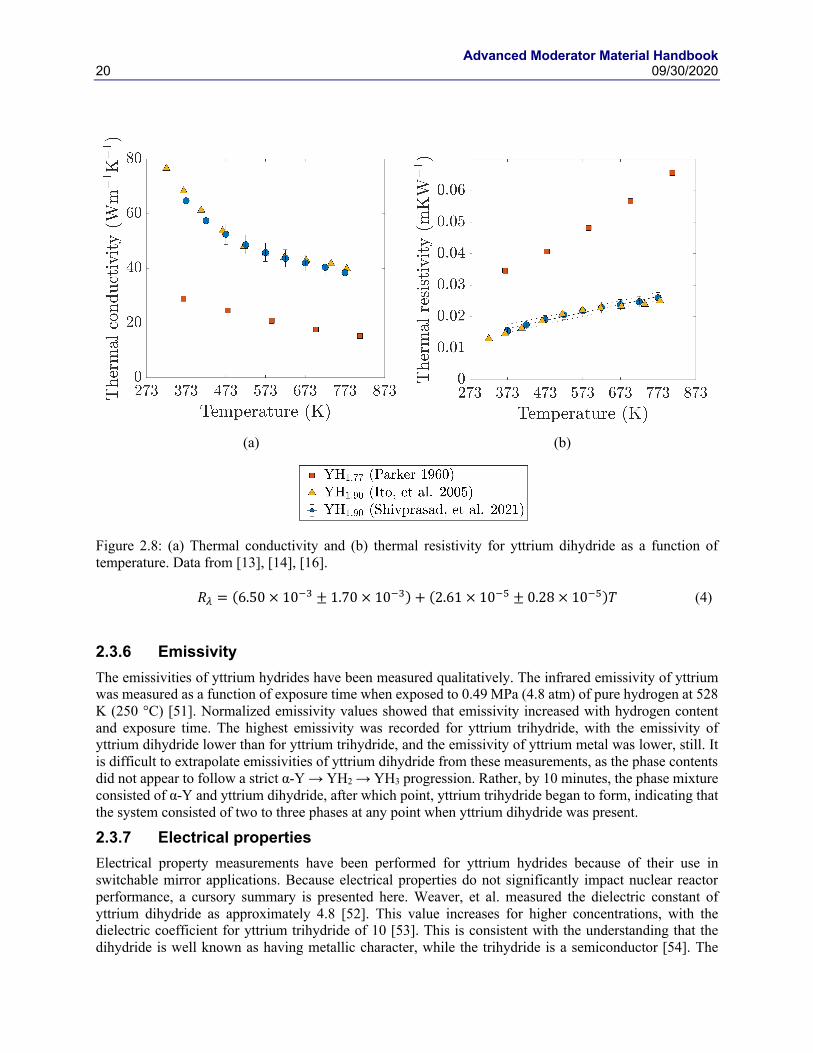
2.3.5 Thermal conductivity Three experimental measurements of the thermal conductivity of yttrium dihydride exist. Parker measured this property as a function of temperature for YH1.77 using a heat flow method and apparatus [13]. Ito et al. and Shivprasad, et al. calculated thermal conductivity from experimentally-measured thermal expansion coefficient, thermal diffusivity, and heat capacity [14], [16]. Reported values from these studies are plotted in Figure 2.8, along with the calculated thermal resistivities. The results from Ito, et al. and Shivprasad, et al. appear to be consistent, while the values from Parker are much lower. Indeed, the values provided by Parker are closer to values expected for yttrium metal than yttrium dihydride. As a result, it is believed that the values by Ito, et al. and Shivprasad, et al. are the correct thermal conductivities.
Shivprasad, et al. provided an empirical fit for the temperature range considered for thermal resistivity values; this is given in Equation (4). This fit also encompasses the data from Ito, et al., due to the consistency of the experimental data between the two studies.
Advanced Moderator Material Handbook 20 09/30/2020
(a)
(b)
Figure 2.8: (a) Thermal conductivity and (b) thermal resistivity for yttrium dihydride as a function of temperature. Data from [13], [14], [16].
𝑅6 = (6.50 × 10%# ± 1.70 × 10%#) + (2.61 × 10%7 ± 0.28 × 10%7)𝑇 (4)
2.3.6 Emissivity The emissivities of yttrium hydrides have been measured qualitatively. The infrared emissivity of yttrium was measured as a function of exposure time when exposed to 0.49 MPa (4.8 atm) of pure hydrogen at 528 K (250 °C) [51]. Normalized emissivity values showed that emissivity increased with hydrogen content and exposure time. The highest emissivity was recorded for yttrium trihydride, with the emissivity of yttrium dihydride lower than for yttrium trihydride, and the emissivity of yttrium metal was lower, still. It is difficult to extrapolate emissivities of yttrium dihydride from these measurements, as the phase contents did not appear to follow a strict α-Y → YH2 → YH3 progression. Rather, by 10 minutes, the phase mixture consisted of α-Y and yttrium dihydride, after which point, yttrium trihydride began to form, indicating that the system consisted of two to three phases at any point when yttrium dihydride was present.
2.3.7 Electrical properties Electrical property measurements have been performed for yttrium hydrides because of their use in switchable mirror applications. Because electrical properties do not significantly impact nuclear reactor performance, a cursory summary is presented here. Weaver, et al. measured the dielectric constant of yttrium dihydride as approximately 4.8 [52]. This value increases for higher concentrations, with the dielectric coefficient for yttrium trihydride of 10 [53]. This is consistent with the understanding that the dihydride is well known as having metallic character, while the trihydride is a semiconductor [54]. The

Advanced Moderator Material Handbook 09/30/2020 21
charge carrier concentration of yttrium dihydride was measured by Sakai, et al. as between 1.1 and 1.4 × 1027 m-3 [19]. Sakai, et al. also measured the electrical resistivity of yttrium dihydride as approximately 8.4 ×10⁻¹² Ωm. With higher stoichiometries in the two-phase region (YH2+YH3), Vajda, et al. measured a significant increase in electrical resistivity. For H/Y=2.065, the electrical resistivity was measured as 8.4 ×10⁻⁷ Ωm at 283 K and for H/Y=2.07, the electrical resistivity was measured as approximately 1.85 × 10⁻⁶ Ωm at 256 K [55]. For stoichiometries close to (but above) H/Y = 2.00, the hydride was found to be a metal at low temperatures, but still transitioned to a semiconductor at temperatures below room temperature [56], [57]. This transition temperature was found to decrease as a function of increased hydrogen content. These data have been evaluated for validity by other sources [58]–[61].
2.3.8 Magnetic properties Magnetic property measurements of yttrium dihydride have been summarized more thoroughly in other reviews [62]. Since they do not significantly impact nuclear reactor operation, a qualitative summary is presented here. Arons summarized that, in general, the rare earth dihydrides exhibit an antiferrite structure, but that this structure changes ordering with hydrogen stoichiometry [62]. Additionally, because measured hydrogen contents are relatively inaccurate, true dependence of the magnetic properties with hydrogen content are difficult. Magnetic properties, including proton spin relaxation times were found to depend on the impurity content with even 100 ppm of rare earth additions significantly impacting these values [18]. It was also observed that different additions affected the relaxation times to differing degrees, with the purest yttrium having the longest relaxation time and relaxation time decreased with additions in this order: cerium, dysprosium, erbium, neodymium, gadolinium. Because the proton spin relaxation time measurement is used to determine hydrogen self-diffusion coefficients, it is believed that diffusion measurements of hydrogen in yttrium dihydride may have been significantly impacted by impurities. A more detailed description of the NMR technique and the different relaxation times is given in Section 2.4, as it relates to the determination of hydrogen self-diffusion parameters through yttrium dihydride.
2.3.9 Mechanical properties Mechanical testing data of yttrium dihydride is relatively limited, though more prolific than the other property measurements.
The elastic moduli of yttrium dihydride have predominantly been determined using sound speed or RUS measurements of yttrium dihydride. Beattie, et al. measured the elastic moduli of yttrium dihydride using sound speed measurements, as did Setoyama, et al., who measured the moduli as a function of hydrogen content [11], [63]. Shivprasad, et al. measured the moduli of sintered yttrium dihydride monoliths as a function of density [20]. There also exists a significant body of work calculating the elastic moduli using DFT, as well, with modeled results in significant agreement with experimental values for fully-dense material [20]–[23]. The results of various elastic modulus measurements are plotted in Figure 2.9 as a function of stoichiometry and in Figure 2.10 as a function of porosity.
Results for elastic moduli as a function of hydrogen content were fit to linear functions of hydrogen-to-yttrium atom ratio and are summarized as follows with 95% confidence intervals for the fitting parameters:
𝐺(GPa) = (21.0 ± 26.1) + (17.5 ± 13.7)𝑐! (5)
𝐾(GPa) = (18.5 ± 75.4) + (35.4 ± 39.5)𝑐! (6)
𝐸(GPa) = (50.1 ± 54.1) + (44.2 ± 28.4)𝑐! (7)
It should be noted that the confidence intervals for the bulk and Young’s moduli are significantly larger than for the shear modulus. This is largely because the data over the majority of the stoichiometry range comes from one study and, as Shivprasad, et al. showed, many of the resonances required to measure the elastic moduli have predominantly shear characteristics [20]. That is, material resonances from which the

Advanced Moderator Material Handbook 22 09/30/2020
elastic moduli are calculated predominantly depend on shear modes. As a result, further characterization of the elastic moduli to stoichiometries lower than H/Y = 1.90 are required to better characterize the dependence of these moduli on hydrogen content.
Figure 2.9: Shear, bulk, and Young's moduli as a function of hydrogen content for yttrium dihydride. Data from [11], [20], [23], [63]. Young’s moduli are plotted in circles, bulk moduli are plotted in triangles, and shear moduli are plotted in squares.

Advanced Moderator Material Handbook 09/30/2020 23
(a)
(b)
(c)
Figure 2.10: (a) Shear, (b) bulk, and (c)Young’s moduli of yttrium dihydride as a function of porosity. Data from [11], [20], [23], [63].
From Figure 2.10, it is observed that the elastic moduli of yttrium dihydride decrease with increasing porosity. It is also observed that the dependence on porosity extrapolates to elastic moduli values very close to values obtained from fully-dense yttrium dihydride. As a result, it is believed that these values and fits are valid. These results have been fit as functions of porosity. The fits for these moduli as a function of porosity are given as follows with 95% confidence intervals for the fitting parameters:
𝐺(GPa) = (56.60 ± 3.64) − (180.34 ± 70.81)𝑝 (8)
Advanced Moderator Material Handbook 24 09/30/2020
𝐾(GPa) = (85.34 ± 2.68) − (307.12 ± 52.03)𝑝 (9)
𝐸(GPa) = (139.02 ± 9.23) − (449.88 ± 179.44)𝑝 (10)
Hardness, on the other hand, is much more limited. Hardness values for yttrium dihydride are limited to three studies. Funston, Parker, and Setoyama, et al. measured hardness as a function of hydrogen content, while Shivprasad, et al. measured hardness on yttrium dihydride fabricated by direct-hydriding and powder metallurgical methods [11], [13], [20], [64]. Vickers hardness results are summarized in Table 2.5.
Table 2.5: Summary of hardness values for yttrium dihydride. Data from [11], [13], [20], [64].
Source
(-)
Vickers hardness
(GPa)
YH1.4 [64] 2.0
YH2.12 [13] 2.9
YHx (1.7 < H/Y < 2.0) [11] 3.48 ± 0.86
YH1.90 (sintered) [20] 2.87 ± 0.69
YH1.90 (direct hydride) [20] 3.17 ± 0.07
Funston, Parker, and Shivprasad et al. examined the hardness of only one stoichiometry of yttrium dihydride, while Setoyama, et al. looked at the dependence of the Vickers hardness on hydrogen content. While Setoyama, et al. noted a dependence on hydrogen content, the values for H/Y between 1.7 and 1.9 exhibited no significant variation. As a result, it is believed that further study of hardness as a function of hydrogen content are warranted.
2.4 Hydrogen self-diffusion in yttrium hydrides Although the data is sparse, hydrogen diffusion measurements in yttrium hydrides have been performed using nuclear magnetic resonance (NMR). A brief overview of the NMR technique is given below:
NMR spectroscopy measures the precession of the nuclear spin. This measurement is sensitive to the electronic structure since the number and proximity of nearby electrons affect the local magnetic field at the nucleus. NMR is a bulk measurement technique because the signal is representative of the ensemble of nuclei in the system, and, therefore, this measurement is able to provide quantitative information. Nuclei with half integer nuclear spins (I = n/2 for odd n), such as 1H (I = 1/2), 11B (I = 3/2), and 27Al (I=5/2), can be observed by NMR. However, some exceptions of whole integer spins are able to be observed as well (i.e. 2H and 14N). Each nucleus precesses at a unique frequency, which is defined as
ω = γB0 (1)
where B0 is the applied magnetic field and γ is the gyromagnetic ratio, which is characteristic of each nucleus and is representative of the sensitivity of a nucleus in an NMR experiment [65]. During a single NMR measurement, only one nuclide can be observed, as the spectrometer can only detect signal at one frequency.
When a given sample is placed in a magnetic field, the nuclear spin aligns with the magnetic field along the z-axis, as is shown in Figure 2.11(a). A pulse of radio-frequency (RF) waves is then applied, which causes the nuclear spin to rotate so that it lies either perpendicular to (x-y plane) or anti-parallel (-z-axis) to the magnetic field, as shown in Figure 2.11(b). Relaxation causes the nuclear spin to be aligned again with the magnetic field along the z-axis (Figure 2.11(c) –(e)) and causes a free induction decay, which is measured
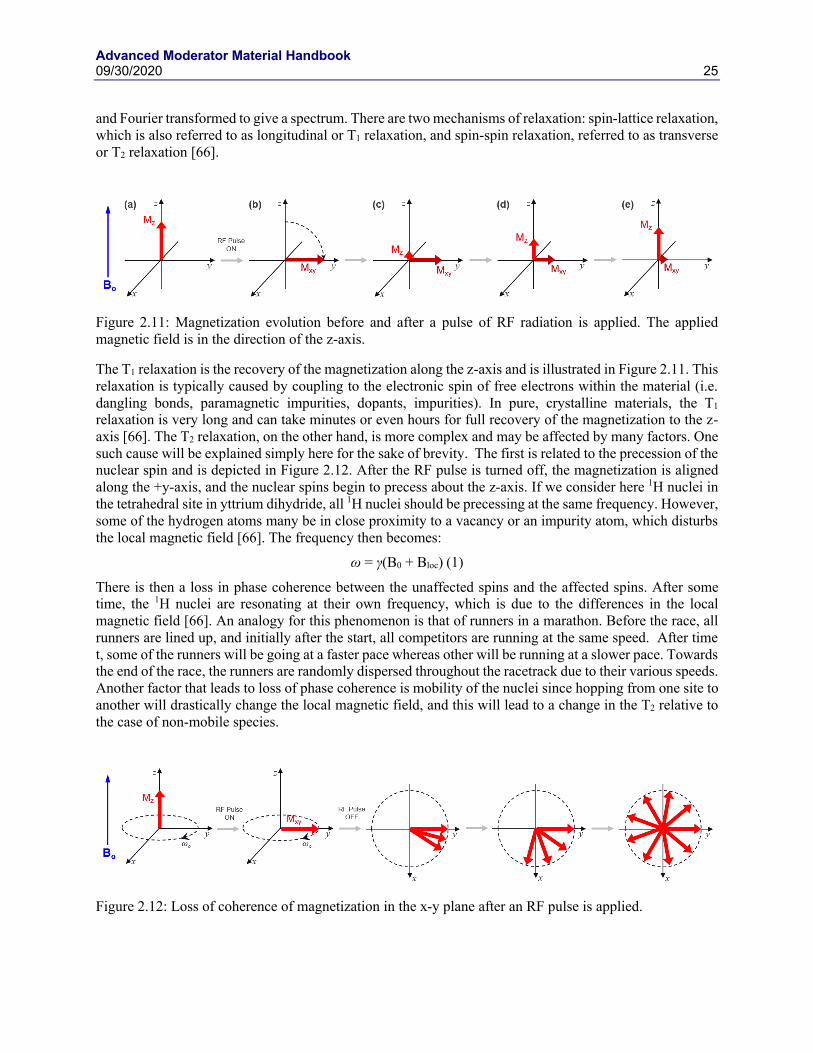
Advanced Moderator Material Handbook 09/30/2020 25
and Fourier transformed to give a spectrum. There are two mechanisms of relaxation: spin-lattice relaxation, which is also referred to as longitudinal or T1 relaxation, and spin-spin relaxation, referred to as transverse or T2 relaxation [66].
Figure 2.11: Magnetization evolution before and after a pulse of RF radiation is applied. The applied magnetic field is in the direction of the z-axis.
The T1 relaxation is the recovery of the magnetization along the z-axis and is illustrated in Figure 2.11. This relaxation is typically caused by coupling to the electronic spin of free electrons within the material (i.e. dangling bonds, paramagnetic impurities, dopants, impurities). In pure, crystalline materials, the T1 relaxation is very long and can take minutes or even hours for full recovery of the magnetization to the z-axis [66]. The T2 relaxation, on the other hand, is more complex and may be affected by many factors. One such cause will be explained simply here for the sake of brevity. The first is related to the precession of the nuclear spin and is depicted in Figure 2.12. After the RF pulse is turned off, the magnetization is aligned along the +y-axis, and the nuclear spins begin to precess about the z-axis. If we consider here 1H nuclei in the tetrahedral site in yttrium dihydride, all 1H nuclei should be precessing at the same frequency. However, some of the hydrogen atoms many be in close proximity to a vacancy or an impurity atom, which disturbs the local magnetic field [66]. The frequency then becomes:
ω = γ(B0 + Bloc) (1)
There is then a loss in phase coherence between the unaffected spins and the affected spins. After some time, the 1H nuclei are resonating at their own frequency, which is due to the differences in the local magnetic field [66]. An analogy for this phenomenon is that of runners in a marathon. Before the race, all runners are lined up, and initially after the start, all competitors are running at the same speed. After time t, some of the runners will be going at a faster pace whereas other will be running at a slower pace. Towards the end of the race, the runners are randomly dispersed throughout the racetrack due to their various speeds. Another factor that leads to loss of phase coherence is mobility of the nuclei since hopping from one site to another will drastically change the local magnetic field, and this will lead to a change in the T2 relative to the case of non-mobile species.
Figure 2.12: Loss of coherence of magnetization in the x-y plane after an RF pulse is applied.

Advanced Moderator Material Handbook 26 09/30/2020
The T2 relaxation time can be approximated as the inverse of the width of the spectral peak. Therefore, if the nuclei in yttrium dihydride become mobile, the T2 will be affected, thus changing the peak width of the observed signal. This allows the study of material dynamics since the mobility of a species can be related to the T2. The dynamics can be studied by solid-state, variable temperature (VT) NMR and has been applied broadly to determine the rotational dynamics in ionic liquids and glasses [67], [68], the glass transition temperature of glasses and hopping transport in ionic conductors and cathode materials [69], [70].
Hydrogen diffusion in the hydrogen sublattice of the 𝛿-phase hydride is believed to proceed via three mechanisms: (1) tetrahedral-tetrahedral (T-T) jumps, tetrahedral-octahedral (T-O) jumps, and octahedral-octahedral (O-O) jumps. As mentioned above, the 𝛿-phase hydride forms when the tetrahedral sites of the crystal fill with hydrogen, while the 𝜀-phase hydride forms upon accommodation of further hydrogen into the octahedral sites. However, as noted above, octahedral site occupation has been observed even at room temperature [17], [71].
The mechanism for hydrogen diffusion in yttrium hydrides have been observed to depend on hydrogen content and temperature [17]. At low hydrogen contents, the hydrogen diffusion mechanism is hypothesized to be predominantly due to T-T jumps. As the hydrogen content increases, the tetrahedral sites become increasingly occupied, which allows contributions from T-O and O-O jumps to the diffusion mechanism. It is hypothesized that the T-O and O-O jumps have lower activation energies, as the overall diffusion activation energy has been observed to decrease with increasing hydrogen content.
Table 2.6 summarizes key hydrogen diffusion data, including activation energy (𝐸$) and pre-exponential factor (𝐷*), for yttrium hydrides as a function of hydrogen content. For stoichiometries where pre-exponential factors were not available in the literature, they were approximated using the Einstein equation for diffusion:
𝐷* =16𝑧𝑓𝜈𝜆'
where 𝑧 is the number of nearest-neighbor diffusion sites (6 for T-T jumps), 𝜆 is the distance to the nearest-neighbor site (half the lattice parameter for T-T jumps), and 𝑓 is a correction factor of approximately 0.74 [72].
Table 2.6: Available diffusion parameters for the Y-H system. Do values were calculated as described in the text when not provided in the reference.
H/Y Ea (eV)
Do
(cm2/s)
1.63 [17] 1.1 5.3 x 10⁻¹
1.80 [71] 0.3 n/a
1.91 [73] 0.53 4.8 x 10⁻⁴
1.92 [17] 0.438 7.9 x 10⁻⁵
1.95 [73] 0.4 9.0 x 10⁻⁵
1.98 [17] 0.417 7.9 x 10⁻⁵
2.03 [73] 0.38 1.0 x 10⁻⁴

Advanced Moderator Material Handbook 09/30/2020 27
2.5 Degradation of un-irradiated yttrium dihydride This section represents a significant gap in our current knowledge regarding yttrium dihydride performance as a moderator. It is currently hypothesized that the material will degrade under the thermal cycling that will occur during startup/shutdown cycles for a nuclear reactor. Phase stability will be affected by significant temperature changes under hydrogen partial pressures such that yttrium trihydride may be stable at low temperature, which could result in the degradation of thermophysical and mechanical properties, as well as pulverization of the moderator. Fast temperature changes could result in thermal shock of the moderator. Additionally, operation of the moderator at high temperatures (e.g. above 500 ) could allow for hydrogen loss through a moderator cladding, reactor monolith, or pressure vessel. However, the relevant testing parameters have not been critically evaluated. As such, thermo-mechanical testing for this type of behavior has not been done.
In the event of a reactor breach, the ingress of air will enable degradation of the moderator via reactions with nitrogen and oxygen. The ability of yttrium compounds to readily react with oxygen is well-documented in the literature, as yttrium is found at the bottom of the Ellingham diagrams for oxide formation [74]. However, yttrium dihydride has also been observed to react at room temperature with nitrogen to form surface layers of yttrium nitride. Nitrogen rot of yttrium dihydride has also been observed in the past, though no details of this phenomenon have been provided in the literature other than the fact that it may be impeded by grinding off the surface oxide/nitride and re-oxidizing the surface [75].
2.6 Neutronic considerations of yttrium dihydride The figures of merit for the neutronic performance of moderators are the moderating power and the moderating ratio [76]. The moderating power is defined as the logarithmic energy decrement per collision (also called lethargy), 𝜉, multiplied by the macroscopic neutron scattering cross-section, Σ). The moderating ratio is defined as the ratio of the moderating power to the macroscopic neutron absorption cross-section, Σ8. Both of these two parameters are necessary for moderator qualification, as the former describes the efficiency with which neutrons are slowed down, while the latter describes the ability to moderate with minimal neutron absorption.
It should be noted that materials with very high moderating power may have low moderating ratios due to high absorption cross-sections. For example, gadolinium dihydride, GdH2, has a very high hydrogen density at room temperature (7.43×10²² atoms/cm3 [30]), but a very low moderating ratio because it also has a very high neutron absorption cross-section [27]. Conversely, some materials may have a very low moderating power but a very high moderating ratio. For example, beryllium metal, Be, has a very low moderating power because it is relatively massive for a moderator material, but has a very high moderating ratio because it has a very low neutron absorption cross-section.
2.6.1 Lethargy and moderating power The lethargy is defined as the average effectiveness of a substance in slowing down neutrons for all collisions based on an assumption of equal probability for all collision angles between 0° and 180° [76]. For a neutron colliding with a nucleus of mass, 𝐴, then the equation for the lethargy is:
𝜉 = 1 +
(𝐴 − 1)'
2𝐴ln𝐴 − 1𝐴 + 1
(11)
For example, the lethargy for a beryllium-moderated system would be:
𝜉9. = 1 +(9 − 1)'
2 × 9ln9 − 19 + 1
≈ 0.2066
Equation (11) may also be approximated as

Advanced Moderator Material Handbook 28 09/30/2020
𝜉 =2
𝐴 + 2/3 (12)
The approximation in Equation (12) is good for values of 𝐴 greater than 10, but is still quite accurate for low values of 𝐴. For 𝐴 = 1 (H-1 nucleus), 𝜉 = 1.
Lethargy may also be used to calculate the average number of collisions required to slow down a neutron from one energy to another, 𝑛m, which is defined as:
𝑛m =ln(𝐸* 𝐸⁄ )
𝜉 (13)
For example, the average number of collisions required to thermalize 1 MeV neutrons using beryllium metal would be
𝑛m9. =ln(𝐸* 𝐸:;⁄ )
𝜉9.=ln o1 × 10
<
0.025 p
0.2066= 84.66 ≈ 85
Thus, beryllium metal requires, on average, 85 collisions to thermalize a neutron.
Values of 𝜉 and 𝑛m for various nuclei relevant to moderator materials are summarized in Table 2.7.
Table 2.7: Lethargy and average number of collisions required to thermalize 1 MeV neutrons for various nuclei of interest for nuclear reactor moderator applications.
Nucleus Mass number 𝜉 𝑛m for 1MeV to 0.0253 eV
H-1 1 1.0000 17
H-2 2 0.7253 24
He-4 4 0.4253 41
Be-9 9 0.2066 85
C-12 12 0.1578 111
O-16 16 0.1199 146
Table 2.7 shows that H-1 nuclei are the most efficient at thermalizing neutrons, with approximately 17 collisions required to thermalize 1 MeV neutrons, on average. As the mass number of a nucleus increases, the number of collisions drastically increases.
The moderating power, 𝑃, of a material is defined as:
𝑃 =q𝜉=Σ),==
=q𝜉=𝑁=σ),==
(14)
where 𝑁= and 𝜎),= are the atomic density and scattering cross-section of nucleus, 𝑖, respectively. Because of the dependence of Equation (14) on lethargy and scattering terms, only, moderating power may be thought of as a moderating efficiency. That is, neutrons will slow down faster (with fewer collisions) using moderators with higher 𝑃-values.

Advanced Moderator Material Handbook 09/30/2020 29
The purpose of slowing neutrons is to obtain thermal neutrons from fast neutrons. Thus, the appropriate scattering cross-sections to use are in the epithermal regime [76]. In general, elastic scattering is considered as the primary mechanism for energy loss via collisions except for nuclei with very high atomic numbers.
The atomic density, 𝑁=, may be calculated readily from the mass density and the stoichiometry. For all materials, the mass density changes as a function of temperature. Given a reference density, 𝜌=*, at a reference temperature, 𝑇*, and a known coefficient of thermal expansion, 𝛼=, the mass density as a function of temperature, 𝜌=(𝑇), is calculated as [77]:
𝜌=(𝑇) =𝜌=*
[1 + 𝛼=(𝑇 − 𝑇*)]# (15)
For metal hydrides, the equilibrium hydrogen composition also changes as a function of temperature [20]. Metal hydrides also have lattice parameter changes with stoichiometry [11]. However, the lattice parameter changes with H/M atom ratio contribute much less to overall atom density than does the stoichiometry change with temperature.
Moderating power as a function of temperature in 1 atm of pure hydrogen for some materials considered for nuclear reactor moderator applications is presented in Figure 2.13.
Figure 2.13: Moderating power as a function of temperature for various candidate moderator materials. All data points are taken from literature for materials at 1 atm pressure [9]–[11], [30], [32], [78]–[90]. Data for metal hydrides were determined for those materials under 1 atm of pure hydrogen.

Advanced Moderator Material Handbook 30 09/30/2020
Figure 2.13 plots the moderating power as a function of temperature for various candidate moderator materials including water, metal hydrides, beryllium compounds, and graphite. It is observed that the moderating power of water and the metal hydrides is significantly higher than for the beryllium compounds and graphite. This makes sense, as the primary moderating nucleus in water and metal hydrides is hydrogen, which is much more efficient at slowing down neutrons than any other nucleus. As a result, metal hydrides and water are more efficient at thermalizing neutrons than are the beryllium-based compounds and graphite. However, one advantage of beryllium-containing compounds and graphite is that their moderating power is nearly constant over temperature with only small changes due to thermal expansion. Conversely, metal hydrides may have large changes in moderating power with temperature due to changes in equilibrium hydrogen content as a function of temperature. It is for this reason that yttrium dihydride is attractive as a metal hydride moderator, as its hydrogen content is relatively constant from approximately 350 °C to 900 °C in 1 atm of pure hydrogen, where zirconium hydride and cerium hydride lose hydrogen with temperature in this regime. However, maintaining a 1 atm hydrogen pressure is optimistic. In most realistic scenarios, hydrogen dissociation will occur.
2.6.2. Moderating ratio From Equation (14), it is observed that the moderating power does not account for the loss of neutrons due to neutron absorption. A simple parameter to account for neutron absorption is the macroscopic neutron absorption cross-section, Σ8. Combining the moderating power with the macroscopic absorption cross-section results in the moderating ratio, 𝑅, as follows:
𝑅 =𝑃Σ8
=∑ 𝜉=𝑁=σ),==∑ 𝑁=σ8,==
(16)
where 𝜎8,= is the microscopic absorption cross-section of nucleus, 𝑖.
For a moderator with the chemical formula: 𝐴8𝐵?𝐶@ …𝑍,, the density of each atomic specie, 𝐾, is given as follows:
𝑁A = 𝜂A𝜌:𝑁$𝑀:
where 𝜂A is the number of atoms of specie 𝐾 in the chemical compound for the moderator material, 𝜌: is the total mass density of the compound, 𝑀: is the total molar mass of the compound, and 𝑁$ is Avogadro’s number.
Thus:
𝑃 =𝜌:𝑁$𝑀:
q𝜉=𝜂=σ),==
Σ8 =𝜌:𝑁$𝑀:
q𝜂=σ8,==
𝑅 =∑ 𝜉=𝜂=σ),==∑ 𝜂=σ8,==
(17)
As seen in Equation (17), because the macroscopic cross-sections are present in the numerator and denominator of the moderating ratio, the dependence of the moderating ratio on the atomic density disappears. This means that the moderating ratio provides information on the moderating ability of a chemical compound and ignores density. For example, the moderating ratio of liquid water and steam are
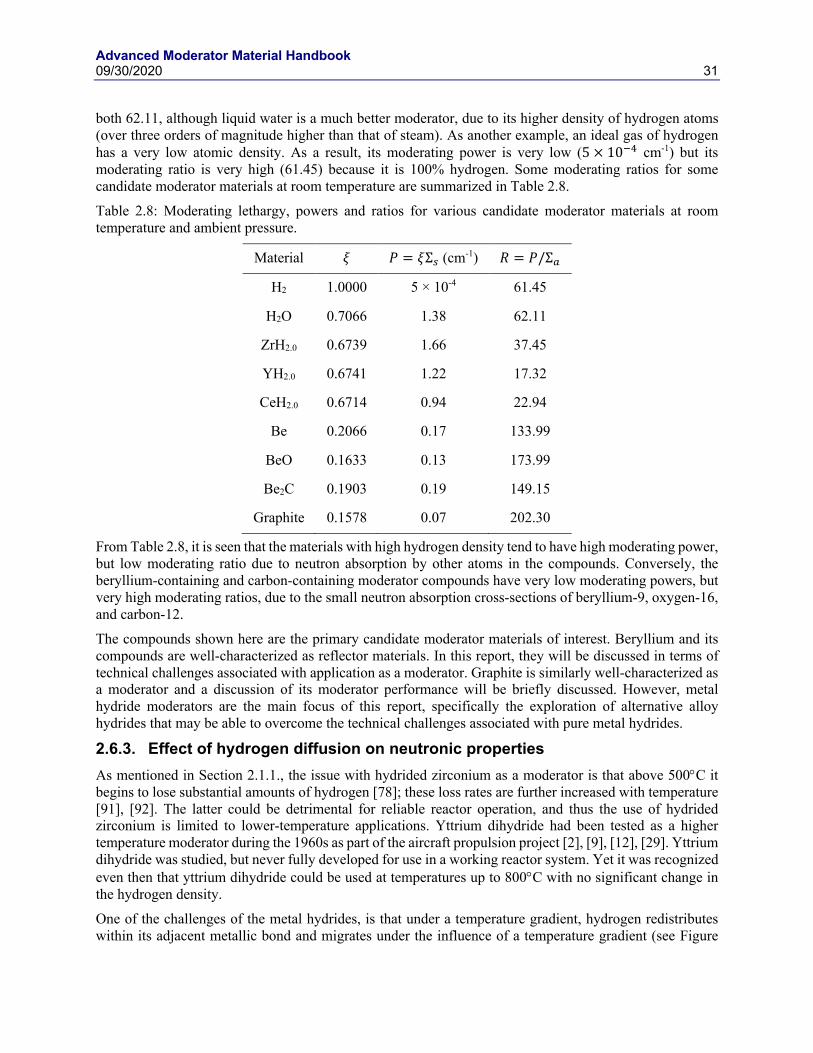
Advanced Moderator Material Handbook 09/30/2020 31
both 62.11, although liquid water is a much better moderator, due to its higher density of hydrogen atoms (over three orders of magnitude higher than that of steam). As another example, an ideal gas of hydrogen has a very low atomic density. As a result, its moderating power is very low (5 × 10%& cm-1) but its moderating ratio is very high (61.45) because it is 100% hydrogen. Some moderating ratios for some candidate moderator materials at room temperature are summarized in Table 2.8.
Table 2.8: Moderating lethargy, powers and ratios for various candidate moderator materials at room temperature and ambient pressure.
Material 𝜉 𝑃 = 𝜉Σ) (cm-1) 𝑅 = 𝑃/Σ8
H2 1.0000 5 × 10⁻⁴ 61.45
H2O 0.7066 1.38 62.11
ZrH2.0 0.6739 1.66 37.45
YH2.0 0.6741 1.22 17.32
CeH2.0 0.6714 0.94 22.94
Be 0.2066 0.17 133.99
BeO 0.1633 0.13 173.99
Be2C 0.1903 0.19 149.15
Graphite 0.1578 0.07 202.30
From Table 2.8, it is seen that the materials with high hydrogen density tend to have high moderating power, but low moderating ratio due to neutron absorption by other atoms in the compounds. Conversely, the beryllium-containing and carbon-containing moderator compounds have very low moderating powers, but very high moderating ratios, due to the small neutron absorption cross-sections of beryllium-9, oxygen-16, and carbon-12.
The compounds shown here are the primary candidate moderator materials of interest. Beryllium and its compounds are well-characterized as reflector materials. In this report, they will be discussed in terms of technical challenges associated with application as a moderator. Graphite is similarly well-characterized as a moderator and a discussion of its moderator performance will be briefly discussed. However, metal hydride moderators are the main focus of this report, specifically the exploration of alternative alloy hydrides that may be able to overcome the technical challenges associated with pure metal hydrides.
2.6.3. Effect of hydrogen diffusion on neutronic properties As mentioned in Section 2.1.1., the issue with hydrided zirconium as a moderator is that above 500°C it begins to lose substantial amounts of hydrogen [78]; these loss rates are further increased with temperature [91], [92]. The latter could be detrimental for reliable reactor operation, and thus the use of hydrided zirconium is limited to lower-temperature applications. Yttrium dihydride had been tested as a higher temperature moderator during the 1960s as part of the aircraft propulsion project [2], [9], [12], [29]. Yttrium dihydride was studied, but never fully developed for use in a working reactor system. Yet it was recognized even then that yttrium dihydride could be used at temperatures up to 800°C with no significant change in the hydrogen density.
One of the challenges of the metal hydrides, is that under a temperature gradient, hydrogen redistributes within its adjacent metallic bond and migrates under the influence of a temperature gradient (see Figure
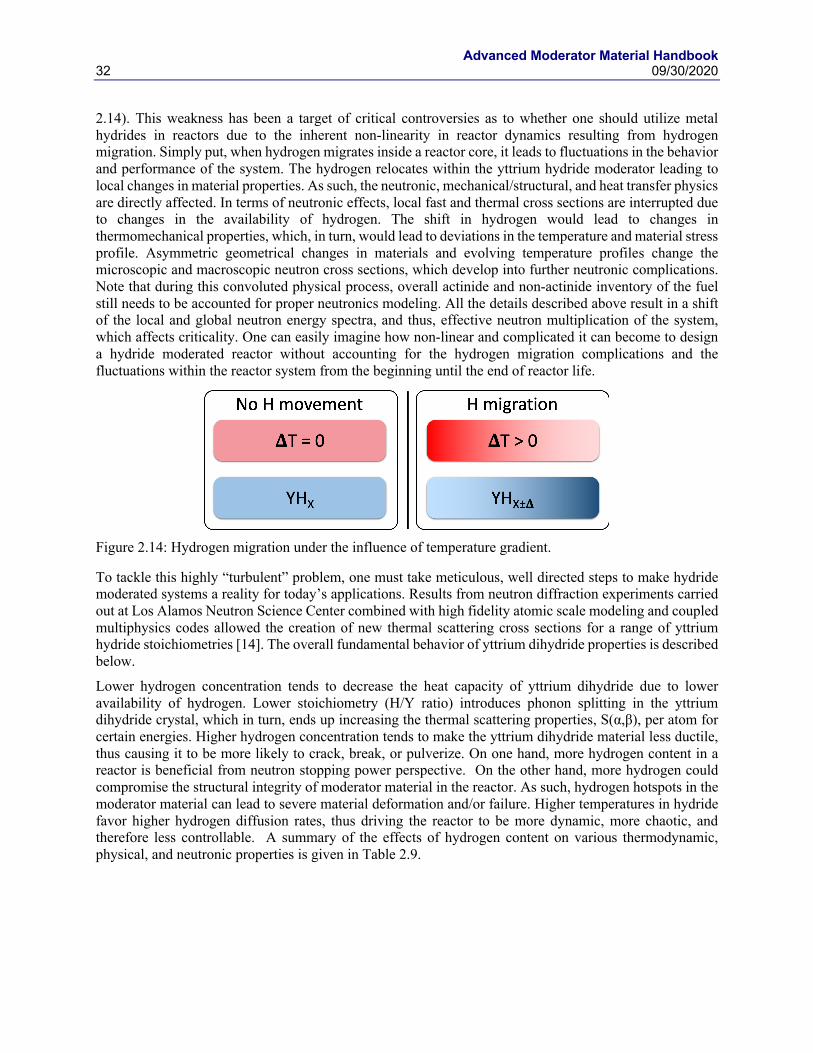
Advanced Moderator Material Handbook 32 09/30/2020
2.14). This weakness has been a target of critical controversies as to whether one should utilize metal hydrides in reactors due to the inherent non-linearity in reactor dynamics resulting from hydrogen migration. Simply put, when hydrogen migrates inside a reactor core, it leads to fluctuations in the behavior and performance of the system. The hydrogen relocates within the yttrium hydride moderator leading to local changes in material properties. As such, the neutronic, mechanical/structural, and heat transfer physics are directly affected. In terms of neutronic effects, local fast and thermal cross sections are interrupted due to changes in the availability of hydrogen. The shift in hydrogen would lead to changes in thermomechanical properties, which, in turn, would lead to deviations in the temperature and material stress profile. Asymmetric geometrical changes in materials and evolving temperature profiles change the microscopic and macroscopic neutron cross sections, which develop into further neutronic complications. Note that during this convoluted physical process, overall actinide and non-actinide inventory of the fuel still needs to be accounted for proper neutronics modeling. All the details described above result in a shift of the local and global neutron energy spectra, and thus, effective neutron multiplication of the system, which affects criticality. One can easily imagine how non-linear and complicated it can become to design a hydride moderated reactor without accounting for the hydrogen migration complications and the fluctuations within the reactor system from the beginning until the end of reactor life.
Figure 2.14: Hydrogen migration under the influence of temperature gradient.
To tackle this highly “turbulent” problem, one must take meticulous, well directed steps to make hydride moderated systems a reality for today’s applications. Results from neutron diffraction experiments carried out at Los Alamos Neutron Science Center combined with high fidelity atomic scale modeling and coupled multiphysics codes allowed the creation of new thermal scattering cross sections for a range of yttrium hydride stoichiometries [14]. The overall fundamental behavior of yttrium dihydride properties is described below.
Lower hydrogen concentration tends to decrease the heat capacity of yttrium dihydride due to lower availability of hydrogen. Lower stoichiometry (H/Y ratio) introduces phonon splitting in the yttrium dihydride crystal, which in turn, ends up increasing the thermal scattering properties, S(α,β), per atom for certain energies. Higher hydrogen concentration tends to make the yttrium dihydride material less ductile, thus causing it to be more likely to crack, break, or pulverize. On one hand, more hydrogen content in a reactor is beneficial from neutron stopping power perspective. On the other hand, more hydrogen could compromise the structural integrity of moderator material in the reactor. As such, hydrogen hotspots in the moderator material can lead to severe material deformation and/or failure. Higher temperatures in hydride favor higher hydrogen diffusion rates, thus driving the reactor to be more dynamic, more chaotic, and therefore less controllable. A summary of the effects of hydrogen content on various thermodynamic, physical, and neutronic properties is given in Table 2.9.

Advanced Moderator Material Handbook 09/30/2020 33
Table 2.9: Summary of the effect of hydrogen content on material and neutronic properties.
Less hydrogen Property More hydrogen
Higher Mass density Lower
Lower Hydrogen density Higher
Higher Resistance to dehydriding Lower
Lower Heat capacity Higher
Lower Thermal conductivity Higher
Lower Elastic moduli Higher
Higher Ductility Lower
Lower S(α,β) Higher
Lower Moderating power Higher
Lower Moderating Ratio Higher
3. CASTING AND FABRICATION TECHNIQUES FOR YTTRIUM DIHYDRIDE 3.1 Preparation of high-purity yttrium The first preparation of yttrium metal was by the reduction of yttrium chloride by potassium metal in 1828 by Wohler [93]. Since then, all subsequent methods of preparing yttrium metal have been variations of the metallothermic reduction of yttrium halides. The Ames Laboratory led the production of yttrium metal based on demand from the US Atomic Energy Commission as part of the Air Force Nuclear Propulsion Program. Researchers at Ames Lab developed several methods of preparing yttrium metal from yttrium halides. Detailed descriptions of these methods may be found elsewhere [94], but some of these methods are briefly summarized here.
The starting material for yttrium metal production is yttrium(III) oxide. High-purity rare-earth (including yttrium) oxides are prepared using ion-exchange methods. The oxide is then converted to a rare-earth halide, such as yttrium fluoride (YF3) or yttrium chloride (YCl3). High-purity yttrium fluoride is prepared by Ames Lab by direct reaction of yttrium(III) oxide with high-purity anhydrous hydrogen fluoride (HF) gas. Commercially, yttrium fluoride may be prepared by the reaction of yttrium(III) oxide with ammonium bifluoride (NH4F∙HF). Yttrium metal resulting from yttrium fluoride produced via ammonium bifluoride has been shown to have a higher oxygen content, as compared with material produced via the gaseous hydrogen fluoride route [94]. Yttrium chloride may be prepared by the reaction between yttrium(III) oxide and either chlorine gas (Cl2) or carbon tetrachloride (CCl4).
The high-purity yttrium halides are further purified. Yttrium fluoride may be purified using a molten-salt method, where the fluoride is mixed with a fluxing salt and then exposed to anhydrous hydrogen fluoride gas. Yttrium chloride, on the other hand, may be vacuum distilled or may be melted and then filtered under an argon atmosphere.

Advanced Moderator Material Handbook 34 09/30/2020
3.1.1 Reduction of yttrium halide with calcium The primary method of producing high-purity yttrium metal is reduction of yttrium fluoride or yttrium chloride using calcium or lithium metal [94]. In this method, a charge of compacted yttrium fluoride and calcium is placed in a tantalum crucible and heated to approximately 1600 . All processing is done in an inert environment, due to the ability of calcium to oxidize rapidly. At Ames Lab, calcium metal is distilled under helium and stored in a glovebox for further processing. Tantalum crucibles generally adhere to ASTM B708 – 12 (current standard) [95, p. 10].
After the charge is cooled, the slag may be removed and the yttrium remelted under vacuum and cast as an ingot.
3.1.2 Yttrium-magnesium intermediate alloy process Another method of producing high-purity yttrium metal is through the formation of an yttrium-magnesium alloy. In this process, a charge of high-purity yttrium fluoride, calcium chloride (CaCl2), calcium metal, and magnesium metal, is heated in a zirconium crucible at 1000 . At this temperature, an yttrium-magnesium alloy forms and separates from the slag. Heating to 1200 enabled further separation of magnesium and unreacted calcium. Heating cycles were employed to further separate the magnesium and calcium. The use of a calcium-lithium alloy as a co-reductant has also shown promising results due to the formation of a low melt-point mixture of calcium fluoride and lithium fluoride. The resultant yttrium metal may be cast or extruded into desired shapes.
3.2 Direct hydriding of yttrium metal Direct, or massive, hydriding of high-purity yttrium metal is well-documented in the literature. Mueller, et al., showed high-quality, directly-hydrided yttrium metal produced as part of the Air Force Nuclear Propulsion Program [2, p. 13], [29, p. 14]. More recently, Setoyama, et al., Ito, et al., Shivprasad, et al., and Hu, et al. have shown the ability to make high-quality yttrium dihydride by the direct hydride method [11], [16], [20], [96].
In the method detailed by Hu, et al., crack-free yttrium dihydride was able to be fabricated by exposing high-purity yttrium to ultra-high purity hydrogen gas at low flowrates and tuning the hydrogen partial pressure to the temperature in order to maintain a PCT relationship as per the PCT diagrams. As a result, the material is cooled on the relevant isochore. The full details of the hydriding procedure may be found in [96].
3.3 Powder metallurgy of yttrium dihydride Shivprasad, et al. have shown that powder metallurgy processes to produce yttrium dihydride are possible [20]. Mechanical and thermophysical property measurements of the sintered monoliths showed results consistent with those obtained from directly-hydrided yttrium, indicating the feasibility of the powder metallurgy process to produce high-quality yttrium dihydride. Further details of these methods may be found in [20].
Powder metallurgical methods for the production of yttrium dihydride have several advantages:
• Yttrium castings tend to have large, directionally-solidified grains. Direct hydriding leads to a phase change accompanied by a large, anisotropic volume expansion. This may result in cracks and large residual stresses in the final component.
• The anisotropic volume expansion results in final parts with unpredictable sizes, which necessitates post-hydriding machining that has the potential for safety incidents due the pyrophoricity of yttrium dihydride powders.
• Processing of castings is required to refine the grain size and improve homogeneity.

Advanced Moderator Material Handbook 09/30/2020 35
• Powder processing of yttrium dihydride results in final products that are independent of pre-existing yttrium metal microstructure and physical form. Therefore, yttrium dihydride of irregular sizes and geometries may be used in lieu of large castings.
4. HISTORICAL IRRADIATION OF YTTRIUM DIHYDRIDE IN FFTF Due to its properties, yttrium dihydride was selected as the high temperature moderator for the Fast Flux Test Facility (FFTF) for various anticipated missions related to the production of beneficial isotopes. Yttrium dihydride moderator was irradiated in the FFTF for ~138 EFPD during Cycle 9A (September 1986) in the Cobalt Test [97] , for ~10 EFPD during Cycle 11A (May 1989) for the Multiple Isotope Irradiation (MIP) Test [98], for ~185 EFPD in the Materials Open Test Assembly (MOTA)-1D (August 1985) [99] and for ~203 EFPD in the fusion MOTA-2B (May 1991) [100]. In addition, yttrium dihydride was selected for the high temperature moderator for the Space Isotope Production (SIP) core in FFTF for producing 238Pu with low 236Pu for NASA from the irradiation of 237Np. In preparing for these various missions, in-reactor and out-of-reactor tests were completed that assessed the properties of yttrium dihydride, such as the hydrogen to yttrium ratio, the hydrogen diffusion and permeation rates, the effect of microstructure on hydriding, the effect of impurities on performance, and the effects of the hydriding procedure on the material properties. These were integral performance tests of specific configurations rather than basic materials properties tests.
The QA of the FFTF tests was equivalent to NQA-1. For FFTF irradiations and laboratory tests, the hydrogen content in yttrium dihydride pellets was measured by a scale that determined the weight change from the hydriding process. The requirements were that the weight had to change by the amount expected from the hydriding process, and the yttrium dihydride had to pass through a go-no go diameter gage. Bowing of the ~5 cm long pellets was checked by the gage, and some machining of the pellets was allowed so that the pellet could fit through the gage. The cladding was exposed to the sodium and was relied on for structural integrity. The temperature of the yttrium dihydride was calculated for the proposed configuration and materials, and as long as the calculated yttrium dihydride temperature was below the value that would result in high hydrogen partial pressure, then the test could proceed, as the hydrogen pressure would not be exceeded. Coatings to reduce hydrogen permeation from free hydrogen were used on the inside and outside of the steel cladding tubes for the Cobalt Test and some MOTA tests, but later tests (such as the MIP test) did not have these coatings, and no coatings were proposed for the SIP project.
No post irradiation information for yttrium dihydride from these FFTF tests (such as phase diagrams) was located.
5. POST-IRRADIATION EXAMINATION OF YTTRIUM DIHYDRIDE IRRADIATED IN THE ATR 5.1 Introduction to the irradiation experiment Identifying a suitable moderator material is one of the primary challenges in the current small, high-temperature microreactor designs. Metal hydrides have large equilibrium hydrogen concentrations which make them particularly suitable for reactor moderator applications. However, the hydrogen retention at elevated temperatures is a challenge for the microreactor designs. Yttrium dihydride is particularly attractive for high temperature reactors because it offers a hydrogen containment capability exceeding that of other metal hydrides. Initial research into the possibility of using metal hydrides as reflector and moderator materials can be traced back to the 1950s era nuclear aircraft programs. From the well-known phase behavior, yttrium dihydride has considerably better hydrogen retention than the zirconium hydrides at elevated temperatures suitable for microreactor applications. The hydrogen retention under irradiation conditions, however, is not well studied. Additionally, the physical integrity of the yttrium dihydride under irradiation has not been adequately investigated. Further, optimization of the yttrium dihydride fabrication

Advanced Moderator Material Handbook 36 09/30/2020
method (whether direct hydriding or powder metallurgy) requires a relative comparison of the resultant thermophysical properties between the two methods. To investigate these areas, an ATR irradiation experiment (LANL-MOD-1) has been designed and fabricated to provide data on thermal and mechanical material properties, material stability and physical degradation, and hydrogen retention and diffusion as it relates to moderator worth in microreactor designs. LANL-MOD-1 is a non-fueled drop-in experiment in support of investigating yttrium hydride as a high temperature moderator material for microreactors.
LANL-MOD-1 will be irradiated in early 2021 in the ATR Northeast lobe, small B2 position, its relative position in ATR shown in Figure 5.1. The test train is vertically stacked with six titanium-zirconium-molybdenum (TZM) inner capsules containing the yttrium dihydride specimens. Three separate ATR fixture baskets are used with different gas mixtures to obtain three target material temperatures of 600, 700, and 800 , as shown in Table 5.1.
Table 5.1. Specimen test matrix showing the three target temperatures, fabrication methods, and characterization techniques for PIE analysis.
Sample Type
(-)
Nominal Temp
(°C)
RUS
(-)
LFA
(-)
DSC
(-)
TEM
(-)
GDOES
(-)
Direct 600 3 2 6 1 4
PM 600 3 2 6 1 4
Direct 700 3 2 6 1 4
PM 700 3 2 6 1 4
Direct ≤800 3 2 6 1 4
PM ≤800 3 2 6 1 4
Total - 18 12 36 6 24
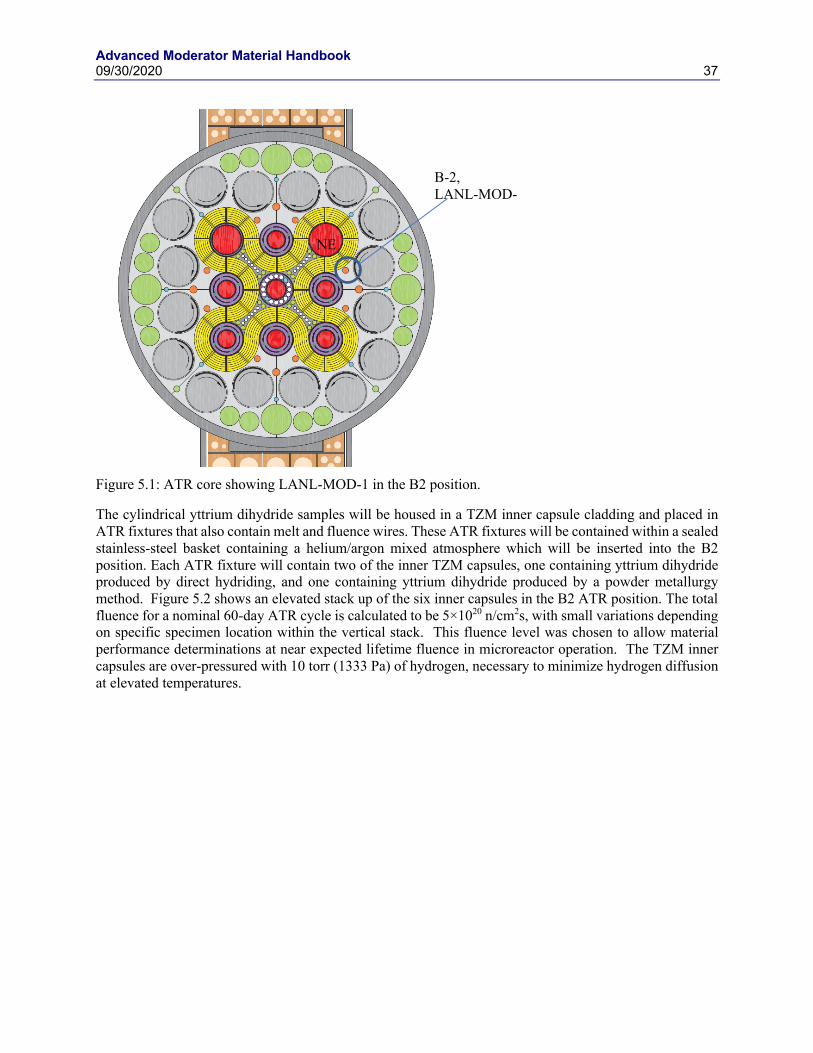
Advanced Moderator Material Handbook 09/30/2020 37
Figure 5.1: ATR core showing LANL-MOD-1 in the B2 position.
The cylindrical yttrium dihydride samples will be housed in a TZM inner capsule cladding and placed in ATR fixtures that also contain melt and fluence wires. These ATR fixtures will be contained within a sealed stainless-steel basket containing a helium/argon mixed atmosphere which will be inserted into the B2 position. Each ATR fixture will contain two of the inner TZM capsules, one containing yttrium dihydride produced by direct hydriding, and one containing yttrium dihydride produced by a powder metallurgy method. Figure 5.2 shows an elevated stack up of the six inner capsules in the B2 ATR position. The total fluence for a nominal 60-day ATR cycle is calculated to be 5×10²⁰ n/cm2s, with small variations depending on specific specimen location within the vertical stack. This fluence level was chosen to allow material performance determinations at near expected lifetime fluence in microreactor operation. The TZM inner capsules are over-pressured with 10 torr (1333 Pa) of hydrogen, necessary to minimize hydrogen diffusion at elevated temperatures.
B-2, LANL-MOD-1
NE

Advanced Moderator Material Handbook 38 09/30/2020
Figure 5.2. Elevation stack up of the TZM capsules in the ATR B2 position.

Advanced Moderator Material Handbook 09/30/2020 39
5.2 Materials and Methods As stated in the previous section, two types of yttrium dihydride are being evaluated in this irradiation experiment, a material produced by direct hydriding of bulk yttrium, and material produced by a powder metallurgy technique. The direct hydride method uses a standard Sievert’s apparatus to slowly add hydrogen at temperature as described in Section 3.2. The hydride produced by powder metallurgy started from raw yttrium dihydride material that was ball-milled into fine powder before being compressed and sintered into green pellets as described previously. For both types of fabrication, the following cylindrical specimens were produced and identified by their intended PIE use:
RUS – Resonant ultrasonic spectroscopy (12.5mm diameter x 10mm thick)
LFA – Laser flash analysis (12.5mm diameter x 2mm thick)
DSC – Differential scanning calorimetry (5mm diameter x 1.5mm thick)
TEM – Transmission electron microscopy (12.5mm diameter x 2mm thick)
GDOES – Glow discharge optical emission spectroscopy (12.5mm diameter x 2mm thick)
Additionally, thin TZM sheets were placed between the yttrium dihydride specimens to investigate clad-material interactions and hydrogen diffusion into the TZM. Again, the complete specimen test matrix is given in Table 5.1.
All of the yttrium hydride material was produced with a YH1.8 +/- 0.1 stoichiometry with the following physical and material properties:
Table 5.2. Yttrium hydride physical properties.
Property Unit Value CTE µm/ m·K 10.0
Thermal Conductivity W/m·K 15.0 Hardness GPa 3.0 Density gm/cm3 4.26

Advanced Moderator Material Handbook 40 09/30/2020
Table 5.3. Total quantities of yttrium hydride for ATR PIE.
Sample ID (-)
Density (g/cm3)
Volume (cm3)
Mass per sample (g)
# of Samples (-)
Volume (cm3)
Mass (g)
RUS 4.26 1.2272 5.2279 18 22.089 94.10 LFA 4.26 0.2454 1.0454 12 2.9448 12.545 DSC 4.26 0.0295 0.12567 36 1.062 4.524
GDOES 4.26 0.2454 1.0454 24 5.8896 25.10 TEM 4.26 0.2454 1.0454 6 1.4724 6.272
Total - - - 96 33.5078 142.54*(*)
A single TZM inner capsule contains a complete set of experiment specimens. The TZM inner capsule is over pressured with 10 torr of hydrogen to minimize diffusion at higher temperatures. Two TZM inner capsules fir into a single ATR fixture basket, which also contains the passive fluence and temperature monitors, shown in Figure 5.3.
Figure 5.3. Hydride specimens located in a single ATR fixture basket. Two TZM inner capsules containing the hydride fit within a single ATR fixture, along with passive temperature and fluence monitors.

Advanced Moderator Material Handbook 09/30/2020 41
5.3 PIE results Results of the post irradiation measurements will not be available until the irradiated capsules are removed and disassembled in the HFEF hot cell. Following irradiation, the capsules will be punctured to capture and analyze the gas spectrum to determine the extent of hydrogen loss from the yttrium dihydride. Any hydrogen loss from the yttrium dihydride would have a negative impact on the moderating worth of the material for use in micro reactor application. Since hydrogen diffusion is so important to the material use, a number of confirmatory and different measurements are planned to accurately assess and understand the hydrogen retention.
Detailed mass balance and dimensional inspection will be performed on the yttrium dihydride specimens. Although a very simplistic technique, mass balance has been used with high reliability and accuracy in past hydride moderator studies. Dimensional analysis will indicate the overall physical integrity of the specimens, and indicate any irradiation induced swelling or cracking.
Specific specimen sizes and geometry were selected with the end state PIE in mind. Upon disassembly and obtaining the gas analysis, mass balance, and physical dilatometry for the specimens, they will be removed from the hot cell and distributed to the applicable measurement laboratories. RUS specimens will be used for resonant ultrasound spectroscopy to measure the bulk elastic tensor for the material. This allows a direct comparison with the RUS performed on the unirradiated material. The LFA and DSC specimens will be used to measure the thermal diffusivity and thermal conductivity in a laser flash analysis. DSC samples will be used for differential scanning calorimetry to detect any potential phase change behavior in the specimens. The glow discharge optical emission spectroscopy will be used to look at hydrogen permeation and diffusion through the sample bulk. Additionally, microstructure of the specimens will be characterized to understand that diffusion in more detail.
6. INTEGRAL CRITICAL EXPERIMENT AT NCERC 6.1 Introduction to the critical experiment As discussed above, a significant effort is being put forward to determine the material properties and differential cross sections for yttrium dihydride. This work also includes the determination of S(α,β) cross sections for yttrium dihydride in ENDF/B-VIII.0. The nuclear data pipeline does not end with the evaluation of the differential measurements – integral experiments are needed to ensure the nuclear data evaluations based on physics and differential measurements agree with reality; that is, they predict an accurate result of real systems. Thus, an integral experiment was designed to validate the cross-section behavior in a critical system. This includes not only absolute keff values, but also the reactivity feedback associated with non-nuclear heating. The designed experiment meets these purposes.
6.2 Materials and methods Most materials used in this experiment come from existing inventory at NCERC, highlighting its importance as a proof of concept and feasibility study. The existing materials include the radial reflector, the SNM (HEU), the axial reflectors, and most structural materials including the critical assembly machine, Planet. All aspects were held to standard QA procedures and level of rigor associated with other integral experiments at NCERC. A benchmark evaluation was not planned for these measurements, so a graded approach was taken for uncertainty minimization with a goal of balancing time and cost without compromising the most important aspects of the experiment. The design met all required criteria for any experiment performed at NCERC, including procurement of components which could affect the Planet shutdown mechanisms.
The overall layout is shown in Figure 6.1 below.

Advanced Moderator Material Handbook 42 09/30/2020
Figure 6.1. Critical experiment design overview.
Planet is a general-purpose critical assembly machine, which dates back to the 1950s. It has undergone several upgrades since that time, including moving from LANL to Nevada in the 2000s. Most recently, Planet had upgrades to level all portions for perfect alignment.
The SNM is HEU metal discs, known as the C-discs. The discs are unclad. There are six, total, with an average mass of 3920 g and average enrichment of 93.1 wt.% 235U. These discs are 5.94 inches in diameter and 0.465 inches tall. A picture of one is shown in Figure 6.2.
Figure 6.2. C-Disc (HEU Unalloyed Metal).
The axial reflectors included Be and DU discs, with diameters and height of 5.93 and 0.92 inches each, respectively.
Electric heaters were procured from NASA. These electric heaters allowed for only a central region to be heated (which included HEU and yttrium dihydride), thus minimizing competing effects. These heaters were manufactured to be slim and using materials without the potential to complicate the results. The heaters were a graphite coil with alumina shells on top and bottom. A diagram is shown in Figure 6.3.
Be
DU
Graphite Be
Graphite HEU YH2
HEU
HEU
HEU
HEU
HEU
YH2
YH2
YH2
Graphite
Graphite
Graphite
Graphite Be
Alumina Spacer
Alumina Spacer
Heater
Heater

Advanced Moderator Material Handbook 09/30/2020 43
Figure 6.3. Alumina and graphite heater to be used in integral critical experiments at NCERC.
The actual experiments will take place as two series. The first will setup exactly as defined above. The second will be similar, but without the yttrium dihydride in the central heated region. Both series will be performed in the same manner. The experimental results will be defined in terms of reactor kinetics parameters. The reactor period, τ, will be measured. This parameter defines the time it takes for the neutron population to increase by a factor e. At NCERC, it is measured by He-3 pulse counting tubes at low power, and by compensated ion chambers at medium power. The reactor period is converted into reactivity in terms of how close the system is to super prompt critical. The resulting value, excess reactivity, lies between 0 and 100. At NCERC, we aim for 60 cents or less of excess reactivity, and are regulated to less than 80 cents of excess reactivity.
1. A critical configuration, with 40-60 cents excess reactivity, will be obtained at room temperature by varying alumina spacer thickness and radial Be reflector height.
2. The core will be removed from the reflector and the temperature of the central heated region increased by 20-50 °C.
3. The core will be reinserted into the reflector and reactivity measured.
4. The process of Steps 2 and 3 will be repeated until either the maximum temperature (330 °C) is reached, or the system becomes subcritical.
6.3 Integral critical experiment results The experiments will give the reactivity changes that occur in two similar systems with increasing temperature. The resulting changes will be compared with the predicted values from simulations with MCNP. The temperature is increased via electrical heaters to remove competing effects from nuclear heating. The systems, as discussed in Section 6.2 above, differ in that one does not have yttrium dihydride discs in the central heated region. A critical configuration, with approximately 40-60 cents excess reactivity, will be found for each configuration by varying radial beryllium height and alumina spacer height. The temperature will be increased in 20-50 °C increments from room temperature to 330 °C. At each point, the core will be inserted into the reflector and the excess reactivity measured. The change in reactivity with increasing temperature is the most important part of these series. The comparison between the changes with temperature for the two configurations is also essential. These experiments stand independent of all other experiments in the yttrium hydride measurement data set because they are the only ones that explicitly model the integral properties, which is an essential part of the nuclear data pipeline.

Advanced Moderator Material Handbook 44 09/30/2020
REFERENCES [1] D. I. Poston, M. A. Gibson, P. McClure, T. Godfroy, and R. Sanchez, “Results of the KRUSTY nuclear
system test,” presented at the Nuclear and Emerging Technologies for Space, American Nuclear Society Topical Meeting, Richland, WA, Feb. 2019.
[2] C. L. Huffine, “CHAPTER 13 - Fabrication of Hydrides,” in Metal Hydrides, W. M. Mueller, J. P. Blackledge, and G. G. Libowitz, Eds. Academic Press, 1968, pp. 675–747.
[3] “ASTM E1447 - 09, Standard Test Method for Determination of Hydrogen in Titanium and Titanium Alloys by Inert Gas Fusion Thermal Conductivity/Infrared Detection Method,” ASTM International, West Conshohocken, PA, 2016, doi: 10.1520/e1447-09r16.
[4] M. Grosse, G. Kuehne, M. Steinbrueck, E. Lehmann, J. Stuckert, and P. Vontobel, “Quantification of hydrogen uptake of steam-oxidized zirconium alloys by means of neutron radiography,” J. Phys.: Condens. Matter, vol. 20, no. 10, p. 104263, Feb. 2008, doi: 10.1088/0953-8984/20/10/104263.
[5] H. Sakaguchi et al., “Visualization of hydrogen in hydrogen storage alloys using neutron radiography,” International Journal of Hydrogen Energy, vol. 25, no. 12, pp. 1205–1208, Dec. 2000, doi: 10.1016/S0360-3199(00)00031-8.
[6] R. L. Paul, “Hydrogen Measurement by Prompt Gamma-ray Activation Analysis: A Review,” Analyst, vol. 122, no. 3, pp. 35R-41R, Jan. 1997, doi: 10.1039/A606419A.
[7] A. Couet, A. T. Motta, R. J. Comstock, and R. L. Paul, “Cold neutron prompt gamma activation analysis, a non-destructive technique for hydrogen level assessment in zirconium alloys,” Journal of Nuclear Materials, vol. 425, no. 1, pp. 211–217, Jun. 2012, doi: 10.1016/j.jnucmat.2011.06.044.
[8] Z.-K. Liu, “First-Principles Calculations and CALPHAD Modeling of Thermodynamics,” J. Phase Equilib. Diffus., vol. 30, no. 5, p. 517, Sep. 2009, doi: 10.1007/s11669-009-9570-6.
[9] C. E. Lundin and J. P. Blackledge, “Pressure‐Temperature‐Composition Relationships of the Yttrium‐Hydrogen System,” J. Electrochem. Soc., vol. 109, no. 9, pp. 838–842, Sep. 1962, doi: 10.1149/1.2425565.
[10] D. Khatamian, W. A. Kamitakahara, R. G. Barnes, and D. T. Peterson, “Crystal structure of YD1.96 and YH1.98 by neutron diffraction,” Phys. Rev. B, vol. 21, no. 6, pp. 2622–2624, Mar. 1980, doi: 10.1103/PhysRevB.21.2622.
[11] D. Setoyama, M. Ito, J. Matsunaga, H. Muta, M. Uno, and S. Yamanaka, “Mechanical properties of yttrium hydride,” Journal of Alloys and Compounds, vol. 394, no. 1, pp. 207–210, May 2005, doi: 10.1016/j.jallcom.2004.10.035.
[12] C. E. Lundin and D. T. Klodt, “FUNDAMENTAL ALLOY DEVELOPMENT. Quarterly Progress Report, August 1, 1959- October 31, 1959,” Denver. Univ. Denver Research Inst., TID-6728; XDC-60-9-72, Nov. 1959. Accessed: May 14, 2018. [Online]. Available: https://www.osti.gov/biblio/4674996.
[13] D. S. Parker, “Properties of hydrided yttrium,” General Electric Company, USAEC Report APEX-558, May 1960.
[14] A. P. Shivprasad et al., “Thermophysical properties of high-density, sintered monoliths of yttrium dihydride in the range 373–773 K,” Journal of Alloys and Compounds, p. 156303, Aug. 2020, doi: 10.1016/j.jallcom.2020.156303.
[15] H. E. Flotow, D. W. Osborne, and K. Otto, “Heat Capacities and Thermodynamic Functions of YH2 and YD2 from 5° to 350°K and the Hydrogen Vibration Frequencies,” The Journal of Chemical Physics, vol. 36, no. 4, pp. 866–872, Feb. 1962, doi: 10.1063/1.1732681.
Advanced Moderator Material Handbook 09/30/2020 45
[16] M. Ito et al., “Thermal properties of yttrium hydride,” Journal of Nuclear Materials, vol. 344, no. 1, pp. 295–297, Sep. 2005, doi: 10.1016/j.jnucmat.2005.04.058.
[17] D. L. Anderson, R. G. Barnes, T. Y. Hwang, D. T. Peterson, and D. R. Torgeson, “Hydrogen locations, diffusion and the electronic density of states in yttrium dihydrides: A nuclear magnetic resonance investigation,” Journal of the Less Common Metals, vol. 73, no. 2, pp. 243–251, Sep. 1980, doi: 10.1016/0022-5088(80)90309-4.
[18] T.-T. Phua et al., “Paramagnetic impurity effects in nuclear magnetic resonance determinations of hydrogen diffusion and electronic structure in metal hydrides: Cerium in YH2,” Journal of the Less Common Metals, vol. 104, no. 1, pp. 105–112, Dec. 1984, doi: 10.1016/0022-5088(84)90443-0.
[19] M. Sakai, T. Nanbo, O. Nakamura, H. Tajima, and Y. Uwatoko, “Magnetotransport properties in near-stoichiometric hydride films of YH2+δ under weak fields,” Journal of Applied Physics, vol. 101, no. 10, p. 103713, May 2007, doi: 10.1063/1.2733602.
[20] A. P. Shivprasad et al., “Elastic moduli of high-density, sintered monoliths of yttrium dihydride,” Journal of Alloys and Compounds, vol. 826, p. 153955, Jun. 2020, doi: 10.1016/j.jallcom.2020.153955.
[21] W. Wolf and P. Herzig, “First-principles investigations of transition metal dihydrides, TH2: T = Sc, Ti, V, Y, Zr, Nb: energetics and chemical bonding,” J. Phys.: Condens. Matter, vol. 12, no. 21, pp. 4535–4551, May 2000, doi: 10.1088/0953-8984/12/21/301.
[22] J. W. Yang, T. Gao, and L. Y. Guo, “Ab initio study of the structural, mechanical, and dynamical properties of the rare-earth dihydrides XH2 (X=Sc, Y, and La),” Physica B: Condensed Matter, vol. 429, pp. 119–126, Nov. 2013, doi: 10.1016/j.physb.2013.08.008.
[23] P. A. Schultz and C. S. Snow, “Mechanical properties of metal dihydrides,” Modelling Simul. Mater. Sci. Eng., vol. 24, no. 3, p. 035005, Feb. 2016, doi: 10.1088/0965-0393/24/3/035005.
[24] M. Zerkle and J. Holmes, “A thermal neutron scattering law for yttrium hydride,” EPJ Web Conf., vol. 146, p. 13005, 2017, doi: 10.1051/epjconf/201714613005.
[25] T. Goorley et al., “Initial MCNP6 Release Overview,” Nuclear Technology, vol. 180, no. 3, pp. 298–315, Dec. 2012, doi: 10.13182/NT11-135.
[26] J. L. Conlin, A. P. McCartney, W. Haeck, A. J. Trainer, and N. C. Sly, “NJOY Status in 2018,” presented at the Radiation Protection and Shielding Division Topical Meeting, Santa Fe, NM, Aug. 2018.
[27] J. Chang, “Table of Nuclides, KAERI (Korea Atomic Energy Research Institute).” Accessed: Apr. 25, 2019. [Online]. Available: Available at: http://atom.kaeri.re.kr/ton.
[28] D. I. Poston and P. McClure, “White paper - Use of LEU for a space reactor,” Los Alamos National Laboratory, LA-UR-17-27226, Aug. 2017.
[29] J. P. Blackledge, “CHAPTER 10 - Yttrium and Scandium Hydrides,” in Metal Hydrides, Academic Press, 1968, pp. 441–489.
[30] M. Mansmann and W. E. Wallace, “The structure of HoD3,” J. Phys. France, vol. 25, no. 5, pp. 454–459, May 1964, doi: 10.1051/jphys:01964002505045400.
[31] A. Machida et al., “X-ray diffraction investigation of the hexagonal–fcc structural transition in yttrium trihydride under hydrostatic pressure,” Solid State Communications, vol. 138, no. 9, pp. 436–440, Jun. 2006, doi: 10.1016/j.ssc.2006.04.011.

Advanced Moderator Material Handbook 46 09/30/2020
[32] L. N. Yannopoulos, R. K. Edwards, and P. G. Wahlbeck, “The Thermodynamics of the Yttrium-Hydrogen System,” J. Phys. Chem., vol. 69, no. 8, pp. 2510–2515, Aug. 1965, doi: 10.1021/j100892a004.
[33] K. Fu et al., “Experimental investigation and thermodynamic assessment of the yttrium-hydrogen binary system,” Progress in Natural Science: Materials International, vol. 28, no. 3, pp. 332–336, Jun. 2018, doi: 10.1016/j.pnsc.2018.04.001.
[34] P. P. Kong et al., “Superconductivity up to 243 K in yttrium hydrides under high pressure,” arXiv:1909.10482 [cond-mat], Sep. 2019, Accessed: Aug. 18, 2020. [Online]. Available: http://arxiv.org/abs/1909.10482.
[35] I. A. Troyan et al., “Anomalous high-temperature superconductivity in YH6,” arXiv:1908.01534 [cond-mat], Jun. 2020, Accessed: Aug. 18, 2020. [Online]. Available: http://arxiv.org/abs/1908.01534.
[36] J. Bloch and M. H. Mintz, “Kinetics and mechanisms of metal hydrides formation—a review,” Journal of Alloys and Compounds, vol. 253–254, pp. 529–541, May 1997, doi: 10.1016/S0925-8388(96)03070-8.
[37] G. M. Begun, J. F. Land, and J. T. Bell, “High temperature equilibrium measurements of the yttrium–hydrogen isotope (H2, D2, T2) systems.,” The Journal of Chemical Physics, vol. 72, no. 5, pp. 2959–2966, Mar. 1980, doi: 10.1063/1.439496.
[38] M. Tanase and P. W. Fisher, “Isothermal equilibrium pressures of Y-Th alloy-H2 system,” Journal of the Less Common Metals, vol. 109, no. 2, pp. 233–240, Jul. 1985, doi: 10.1016/0022-5088(85)90055-4.
[39] V. Nemanič, “Hydrogen permeation barriers: Basic requirements, materials selection, deposition methods, and quality evaluation,” Nuclear Materials and Energy, vol. 19, pp. 451–457, May 2019, doi: 10.1016/j.nme.2019.04.001.
[40] J. Peng et al., “Thermodynamic modelling of Y–H and Y–Zr–H system aided by first-principles and its application in bulk hydride moderator fabrication,” Journal of Nuclear Materials, vol. 531, p. 152035, Apr. 2020, doi: 10.1016/j.jnucmat.2020.152035.
[41] F. H. Spedding, A. H. Daane, and K. W. Herrmann, “The crystal structures and lattice parameters of high-purity scandium, yttrium and the rare earth metals,” Acta Cryst, vol. 9, no. 7, pp. 559–563, Jul. 1956, doi: 10.1107/S0365110X5600156X.
[42] B. J. Beaudry and F. H. Spedding, “The solubility of RH2−xin Gd, Er, Tm, Lu and Y from ambient to 850°C,” MTB, vol. 6, no. 3, p. 419, Sep. 1975, doi: 10.1007/BF02913827.
[43] A. Pebler and W. E. Wallace, “CRYSTAL STRUCTURES OF SOME LANTHANIDE HYDRIDES,” J. Phys. Chem., vol. 66, no. 1, pp. 148–151, Jan. 1962, doi: 10.1021/j100807a033.
[44] T. Palasyuk and M. Tkacz, “Hexagonal to cubic phase transition in YH3 under high pressure,” Solid State Communications, vol. 133, no. 7, pp. 477–480, Feb. 2005, doi: 10.1016/j.ssc.2004.11.035.
[45] Y. Fukai, The Metal-Hydrogen System: Basic Bulk Properties. Springer Science & Business Media, 2006.
[46] S. Richmond, J. S. Bridgewater, J. W. Ward, and T. H. Allen, “The solubility of hydrogen and deuterium in alloyed, unalloyed and impure plutonium metal,” IOP Conf. Ser.: Mater. Sci. Eng., vol. 9, p. 012036, Mar. 2010, doi: 10.1088/1757-899X/9/1/012036.
[47] P. G. Dantzer and O. J. Kleppa, “High temperature thermodynamics of the yttrium–hydrogen systems,” The Journal of Chemical Physics, vol. 73, no. 10, pp. 5259–5263, Nov. 1980, doi: 10.1063/1.439954.

Advanced Moderator Material Handbook 09/30/2020 47
[48] M. Hillert, Phase Equilibria, Phase Diagrams and Phase Transformations: Their Thermodynamic Basis. Cambridge University Press, 2007.
[49] V. FADEYEV, “DISSOCIATION PRESSURES IN YTTRIUM-HYDROGEN SYSTEM,” RUSSIAN METALLURGY, no. 5, pp. 148–150, 1972.
[50] D. Sarussi, I. Jacob, J. Bloch, N. Shamir, and M. H. Mintz, “The kinetics and mechanism of cerium hydride formation,” Journal of Alloys and Compounds, vol. 191, no. 1, pp. 91–99, Jan. 1993, doi: 10.1016/0925-8388(93)90277-T.
[51] J. R. Hattrick-Simpers et al., “Observation of phase transitions in hydrogenated Yttrium films via normalized infrared emissivity,” Journal of Alloys and Compounds, vol. 490, no. 1, pp. 42–46, Feb. 2010, doi: 10.1016/j.jallcom.2009.10.054.
[52] J. H. Weaver, R. Rosei, and D. T. Peterson, “Electronic structure of metal hydrides. I. Optical studies of ScH2, YH2, and LuH2,” Phys. Rev. B, vol. 19, no. 10, pp. 4855–4866, May 1979, doi: 10.1103/PhysRevB.19.4855.
[53] Y. Wang and M. Y. Chou, “Structural and electronic properties of hexagonal yttrium trihydride,” Phys. Rev. B, vol. 51, no. 12, pp. 7500–7507, Mar. 1995, doi: 10.1103/PhysRevB.51.7500.
[54] P. Vajda, “Hydrogen in rare earths: a wealth of structural and electronic phenomena,” Solid State Ionics, vol. 168, no. 3, pp. 271–279, Mar. 2004, doi: 10.1016/j.ssi.2002.11.001.
[55] P. Vajda, “Hydrogen in rare-earth metals, including RH2+x phases,” in Handbook on the Physics and Chemistry of Rare Earths, vol. 20, Elsevier, 1995, pp. 207–291.
[56] P. Vajda and J. N. Daou, “Semiconductor-metal-semiconductor transitions in the superstoichiometric dihydride YH2.10,” Phys. Rev. Lett., vol. 66, no. 24, pp. 3176–3178, Jun. 1991, doi: 10.1103/PhysRevLett.66.3176.
[57] J. N. Daou and P. Vajda, “Hydrogen ordering and metal-semiconductor transitions in the system YH2+x,” Phys. Rev. B, vol. 45, no. 19, pp. 10907–10913, May 1992, doi: 10.1103/PhysRevB.45.10907.
[58] P. Villars and F. Hulliger, YH2 permittivity (dielectric constant): Datasheet from “PAULING FILE Multinaries Edition – 2012” in SpringerMaterials (https://materials.springer.com/isp/physical-property/docs/ppp_0a021c0b47f55ab175d102aee03629b0). Springer-Verlag Berlin Heidelberg & Material Phases Data System (MPDS), Switzerland & National Institute for Materials Science (NIMS), Japan.
[59] P. Villars and F. Hulliger, YH2 charge carrier concentration: Datasheet from “PAULING FILE Multinaries Edition – 2012” in SpringerMaterials (https://materials.springer.com/isp/physical-property/docs/ppp_c0566a127ed023216a77f8d46e049133). Springer-Verlag Berlin Heidelberg & Material Phases Data System (MPDS), Switzerland & National Institute for Materials Science (NIMS), Japan.
[60] P. Villars and F. Hulliger, YH3 rt permittivity (dielectric constant): Datasheet from “PAULING FILE Multinaries Edition – 2012” in SpringerMaterials (https://materials.springer.com/isp/physical-property/docs/ppp_8f0042dbf6c3237619b6b1c293b1f392). Springer-Verlag Berlin Heidelberg & Material Phases Data System (MPDS), Switzerland & National Institute for Materials Science (NIMS), Japan.
[61] P. Villars and F. Hulliger, YH2 conductivity/resistivity: Datasheet from “PAULING FILE Multinaries Edition – 2012” in SpringerMaterials (https://materials.springer.com/isp/physical-property/docs/ppp_e9c3df5efd481075c2be74ce36264382). Springer-Verlag Berlin Heidelberg &

Advanced Moderator Material Handbook 48 09/30/2020
Material Phases Data System (MPDS), Switzerland & National Institute for Materials Science (NIMS), Japan.
[62] R. R. Arons and H. P. J. Wijn, 2.3.8 Nuclear spin resonance: Datasheet from Landolt-Börnstein - Group III Condensed Matter · Volume 19D1: “Rare Earth Elements, Hydrides and Mutual Alloys” in SpringerMaterials (https://doi.org/10.1007/10013330_71). Springer-Verlag Berlin Heidelberg.
[63] A. g. Beattie, “Acoustic Velocity Measurements in the Metal Hydrides, ScH1.99, YH1.93, and ErH1.81,” Journal of Applied Physics, vol. 43, no. 7, pp. 3219–3221, Jul. 1972, doi: 10.1063/1.1661692.
[64] E. S. Funston, “PHYSICAL PROPERTIES OF YTTRIUM HYDRIDE,” Met. Soc. Am. Inst. Mining, Met. Petrol. Engrs., Inst. Metals Div., vol. Vol: Spec. Rept. Ser. No. 10, Jan. 1960, Accessed: Apr. 25, 2019. [Online]. Available: https://www.osti.gov/biblio/4020288.
[65] A. Abragam, The Principles of Nuclear Magnetism. Clarendon Press, 1961.
[66] M. H. Levitt, “Spin dynamics: Basics of Nuclear Magnetic Resonance John Wiley & Sons,” New York-London-Sydney, 2008.
[67] T. Endo, S. Widgeon, P. Yu, S. Sen, and K. Nishikawa, “Cation and anion dynamics in supercooled and glassy states of the ionic liquid 1-butyl-3-methylimidazolium hexafluorophosphate: Results from 13C, 31P, and 19F NMR spectroscopy,” Phys. Rev. B, vol. 85, no. 5, p. 054307, Feb. 2012, doi: 10.1103/PhysRevB.85.054307.
[68] E. L. Gjersing, S. Sen, P. Yu, and B. G. Aitken, “Anomalously large decoupling of rotational and shear relaxation in a molecular glass,” Phys. Rev. B, vol. 76, no. 21, p. 214202, Dec. 2007, doi: 10.1103/PhysRevB.76.214202.
[69] M. A. T. Marple, B. G. Aitken, S. Kim, and S. Sen, “Observation of a Phonon Softening Effect on Li Ion Conduction in Mixed-Anion Chalcogenide Glasses,” Chem. Mater., vol. 30, no. 17, pp. 5896–5903, Sep. 2018, doi: 10.1021/acs.chemmater.8b01830.
[70] Y. J. Lee, C. Eng, and C. P. Grey, “6Li Magic Angle Spinning NMR Study of the Cathode Material LiNixMn2−xO4 : The Effect of Ni Doping on the Local Structure during Charging,” J. Electrochem. Soc., vol. 148, no. 3, p. A249, Mar. 2001, doi: 10.1149/1.1350658.
[71] U. Stuhr, D. Steinbinder, H. Wipf, and B. Frick, “Hydrogen Diffusion in f.c.c. TiHx and YHx : Two Distinct Examples for Diffusion in a Concentrated Lattice Gas,” EPL, vol. 20, no. 2, pp. 117–123, Sep. 1992, doi: 10.1209/0295-5075/20/2/005.
[72] P. A. Fedders and O. F. Sankey, “Correlation functions for simple hopping in a simple cubic lattice,” Phys. Rev. B, vol. 18, no. 11, pp. 5938–5947, Dec. 1978, doi: 10.1103/PhysRevB.18.5938.
[73] G. Majer, J. Gottwald, D. T. Peterson, and R. G. Barnes, “Model-independent measurements of hydrogen diffusivity in the yttrium dihydrides,” Journal of Alloys and Compounds, vol. 330–332, pp. 438–442, Jan. 2002, doi: 10.1016/S0925-8388(01)01452-9.
[74] Y. Guo, L. Jia, H. Zhang, F. Zhang, and H. Zhang, “Enhancing the oxidation resistance of Nb-Si based alloys by yttrium addition,” Intermetallics, vol. 101, pp. 165–172, Oct. 2018, doi: 10.1016/j.intermet.2018.08.004.
[75] R. Van Houten, “Selected engineering and fabrication aspects of nuclear metal hydrides (Li, Ti, Zr, and Y),” Nuclear Engineering and Design, vol. 31, no. 3, pp. 434–448, Jan. 1974, doi: 10.1016/0029-5493(75)90178-8.
[76] W. M. Mueller, J. P. Blackledge, and G. G. Libowitz, Metal Hydrides. Elsevier, 1968.
Advanced Moderator Material Handbook 09/30/2020 49
[77] J. T. White, A. T. Nelson, J. T. Dunwoody, D. D. Byler, D. J. Safarik, and K. J. McClellan, “Thermophysical properties of U3Si2 to 1773K,” Journal of Nuclear Materials, vol. 464, pp. 275–280, Sep. 2015, doi: 10.1016/j.jnucmat.2015.04.031.
[78] E. Zuzek, J. P. Abriata, A. San-Martin, and F. D. Manchester, “The H-Zr (hydrogen-zirconium) system,” Bulletin of Alloy Phase Diagrams, vol. 11, no. 4, pp. 385–395, Aug. 1990, doi: 10.1007/BF02843318.
[79] R. C. Bowman, B. D. Craft, J. S. Cantrell, and E. L. Venturini, “Effects of thermal treatments on the lattice properties and electronic structure of ZrHx,” Phys. Rev. B, vol. 31, no. 9, pp. 5604–5615, May 1985, doi: 10.1103/PhysRevB.31.5604.
[80] R. J. Gambino and P. E. Seiden, “Correlation of the Superconducting Transition Temperature with an Empirical Pseudopotential Determined from Atomic Spectra,” Phys. Rev. B, vol. 2, no. 9, pp. 3571–3577, Nov. 1970, doi: 10.1103/PhysRevB.2.3571.
[81] M. N. Cinbiz, X. Hu, and K. Terrani, “Thermal expansion behavior of δ-zirconium hydrides: Comparison of δ hydride powder and platelets,” Journal of Nuclear Materials, vol. 509, pp. 566–576, Oct. 2018, doi: 10.1016/j.jnucmat.2018.07.026.
[82] W. L. Korst and J. C. Warf, “Rare Earth-Hydrogen Systems. I. Structural and Thermodynamic Properties,” Inorg. Chem., vol. 5, no. 10, pp. 1719–1726, Oct. 1966, doi: 10.1021/ic50044a018.
[83] F. D. Manchester and J. M. Pitre, “The Ce-H (Cerium-Hydrogen) system,” JPE, vol. 18, no. 1, p. 63, Feb. 1997, doi: 10.1007/BF02646759.
[84] F. Aldinger and S. Joensson, “The phase diagram beryllium-cobalt,” Zeitschrift fuer Metallkunde, vol. 68, no. 5, pp. 362–367, 1977.
[85] T. Spittel, M. Spittel, and H. Warlimont, “Non-Ferrous Alloys—Light Metals,” Landolt-Börnstein-Group VIII Advanced Materials and Technologies, H. Warlimont, ed., Springer-Verlag, Berlin Heidelberg, 2011.
[86] P. J. Baldock, W. E. Spindler, and T. W. Baker, “An X-ray diffraction study of the variation of the lattice parameters and their ratio for beryllium oxide at temperatures up to 2000° C,” Journal of Nuclear Materials, vol. 19, no. 2, pp. 169–172, May 1966, doi: 10.1016/0022-3115(66)90107-3.
[87] Yu. M. Kozlovskii and S. V. Stankus, “Thermal expansion of beryllium oxide in the temperature interval 20–1550°C,” High Temp, vol. 52, no. 4, pp. 536–540, Jul. 2014, doi: 10.1134/S0018151X1403016X.
[88] E. Staritzky, “Crystallographic Data. 120. Diberyllium Carbide, Be2C,” Analytical Chemistry, vol. 28, no. 5, pp. 915–915, 1956.
[89] A. M. Saul and W. J. Smith, “Available Information on Be2C,” Atomics International-A Division of North American Aviation, 1956.
[90] A. A. Campbell, Y. Katoh, M. A. Snead, and K. Takizawa, “Property changes of G347A graphite due to neutron irradiation,” Carbon, vol. 109, pp. 860–873, 2016, doi: https://doi.org/10.1016/j.carbon.2016.08.042.
[91] K. A. Terrani, M. Balooch, D. Wongsawaeng, S. Jaiyen, and D. R. Olander, “The kinetics of hydrogen desorption from and adsorption on zirconium hydride,” Journal of Nuclear Materials, vol. 397, no. 1, pp. 61–68, Feb. 2010, doi: 10.1016/j.jnucmat.2009.12.008.
[92] X. Hu, K. A. Terrani, and B. D. Wirth, “Hydrogen desorption kinetics from zirconium hydride and zirconium metal in vacuum,” Journal of Nuclear Materials, vol. 448, no. 1, pp. 87–95, May 2014, doi: 10.1016/j.jnucmat.2014.01.028.
Advanced Moderator Material Handbook 50 09/30/2020
[93] F. Wöhler, “Ueber das Beryllium und Yttrium,” Annalen der Physik, vol. 89, no. 8, pp. 577–582, 1828.
[94] F. H. Spedding, “The Rare-Earth Metals,” Metallurgical Reviews, vol. 5, no. 1, pp. 297–348, Jan. 1960, doi: 10.1179/mtlr.1960.5.1.297.
[95] B10 Committee, “Specification for Tantalum and Tantalum Alloy Plate, Sheet, and Strip,” ASTM International. doi: 10.1520/B0708-12R19.
[96] X. Hu, D. Schappel, C. M. Silva, and K. A. Terrani, “Fabrication of yttrium hydride for high-temperature moderator application,” Journal of Nuclear Materials, vol. 539, p. 152335, Oct. 2020, doi: 10.1016/j.jnucmat.2020.152335.
[97] D. W. Wootan, J. A. Rawlins, L. L. Carter, H. R. Brager, and R. E. Schenter, “Analysis and Results of a Hydrogen-Moderated Isotope Production Assembly in the Fast Flux Test Facility,” Nuclear Science and Engineering, vol. 103, no. 2, pp. 150–156, Oct. 1989, doi: 10.13182/NSE89-A28503.
[98] D. W. Wootan et al., “Isotope production test in the Fast Flux Test Facility,” in Proceedings of LMR: A Decade of LMR Progress and Promise, United States, 1990, p. 11, [Online]. Available: http://inis.iaea.org/search/search.aspx?orig_q=RN:22023601.
[99] R. E. Bauer, “Materials Open Test Assembly in the Fast Flux Test Facility,” Hanford Engineering Department Laboratory, United States, HEDL-SA-2590, Mar. 1982. [Online]. Available: http://inis.iaea.org/search/search.aspx?orig_q=RN:14725072.
[100] D. L. Greenslade, R. J. Puigh, G. W. Hollenberg, and J. M. Grover, “FFTF as an irradiation test bed for fusion materials and components,” Journal of Nuclear Materials, vol. 141–143, pp. 1032–1038, Nov. 1986, doi: 10.1016/0022-3115(86)90137-6.


![[eBook].[Material].Handbook of Polymer Synthesis](https://img.pdfslide.us/doc/110x75/5525dd88550346ca3b8b4698/ebookmaterialhandbook-of-polymer-synthesis.jpg)