Embed Size (px)
Citation preview
copy 3
WAR DEPARTMENT FIELD MANUAL
ADVANCED MAPAND AERIAL
PHOTOGRAPH READING
WAR DEPARTMENT DECEMBER 1944

WAR DEPARTMENT FIELD MANUAL
FM 21-26
This manual supersedes FM 21- 26, 17 September 1941, including CI, 15 May1942, TB 21 - 25 - 1, 2 March 1944; TB 21-26-1, 23 February 1944; andTraining Circular No. 66, War Department, 1944.
ADVANCED MAP
AND AERIAL
PHOTOGRAPH READING
WAR DEPARTMENT * DECEMBER 1944
United States Government Printing Office, Washington: 1944
For sale by the Superintendent of Documnents, U. S. Government Printing Office,Washington 25, D. C.
WAR DEPARTMENT
Washington 25, D. C., 23 December 1944
FM 21-26, Advanced Map and Aerial Photograph
Reading, is published for the information and guidance
of all concerned.[AG 300.7 (15 Sep 44)1
BY ORDER OF THE SECRETARY OF WAR:
OFFICIAL: G. C. MARSHALL
J. A. ULIO Chief of StaffMajor GeneralThe Adjutant General
DISTRIBUTION:
AAF(10); AGF(10); ASF(10) ;Tof Opns(5) ;T of Opn(Eng, SOS Base Sec) (5); Arm & Sv Bd(2) exceptEng Bd(100); Def C(5); Tech Sv(2) except OCE(250); SvC(10); HD(5); PC&S(1); AGF Dep(100);Gen & Sp Sv Sch(50) except Eng Sch(2000), InfSch(11000), FA Sch(1600), AAA Sch(300), ArmdSch(850), CA Sch(150); TD Sch(100), Cav Sch(150), Parachute Sch(250); USMA(2); ROTC(1);AGF Repl Tng C, ea 25 men (1); A'(10); A(EngSec) (10); CHQ(10); CHQ(Eng Sec) (5); D(5); B(5);R(5); SBn(5); Bn(5); C 2, 4-7, 17, 18, 44(5); C 3,8-11, 19, 55 (3); AF(5); W(3); G(3); S(3); F(3)
For explanation of symbols, see FM 21-6.
ii

CONTENTSPara.SECTION I. INTRODUCTION. graph Page
Purpose ............................... 1 1Scope of Training ...................... 2 1
SECTION II. MAPS.Definition ............................. 3 2Classification . .......................... 4 2Care in the Field ...................... 5 2
SECTION III CONVENTIONAL SIGNS AND MILITARY SYMBOLS.Conventional Signs ...................... 6 4Military Symbols ....................... 7 4
SECTION IV. MAP MEASUREMENTS.Scale .................................. 8 5Measuring Devices ...................... 9 5Conversion Factors ...................... 10 8Determination of Map Scale .............. 11 8To Construct a Graphic Scale ............. 12 11Time and Distance ...................... 13 12Time-distance Scales ..................... 14 13
SECTION V. DIRECTION AND AZIMUTH.General .................. ............. 15 15Units of Angular Measurement ........... 16 15Base Direction ......................... 17 17Declination ............. 1............... 18 18Declination Diagrams .................... 19 20Azimuth ............................... 20 22Bearing ................................ 21 24Protractor ............................. 22 25To Measure Azimuth of Any Line on a Map 23 26To Plot an Azimuth on a Map ............ 24 28Compasses ............................. 25 29Traverse .............................. 26 34
SECTION VI. GRIDS AND COORDINATES.Military Grid .......................... 27 36Coordinate Scale ......................-. 28 36Using Engineer Scale .................... 29 38Polar Coordinates ....................... 30 41
11i
Para-Section VI. Continued graph Page
Rectangular Coordinates ................. 31 42Thrust Line ............................ 32 43Map Templates Ml and M2.............. 33 44Geographic Coordinates .................. 34 47Geographic Coordinates on Foreign Maps.. 35 52U. S. Domestic Grid System .............. 36 55World Polyconic Grid .................... 37 58British Grid System ..................... 38 59Air Defense Grid ........................ 39 64Fire-control Grid ....................... 40 64Point-Designation Grid ... ........... 41 65
SECTION VII. ELEVATION AND RELIEF.General ................................ 42 66Contours ............................. , 43 66Hachures ............................. 44 67Layer-Tint System ...................... 45 68Ridge and Stream Lines .................. 46 70Slopes ................................. 47 72Profile ................................. 48 79Visibility .............................. 49 82
SECTION VIII. ORIENTATION.General ................................ 50 87Expedient Methods of Determining True
North .............................. 51 87Location of Distant Point by Intersection.. 52 89Resection .............................. 53 91
SECTION IX. AERIAL PHOTOGRAPHS.General ............................. , 54 95Types ................................. 55 95Pin Points ............................. 56 100Strips ................................. 57 102Mosaics ............................ 58 103Marginal Data ......................... 59 104Fiducial Marks ......................... 60 107Source of Error ......................... 61 107
iv

Para-graph Page
SECTION X. AERIAL PHOTOGRAPHS AS MAP SUBSTITUTES.Comparison of Aerial Photographs withLine Maps ............................. 62 108Identification ........................... 63 109Scales ................................ 64 109Graphic Scale ........................... 65 114Distance ............................... 66 114Direction .............................. 67 114Orientation .................. ......... 68 117Point-designation Grid ................... 69 118Emphasizing and Clarifying Detail ........ 70 120To Index and Plot Aerial Photographs..... 71 121
SECTION XI. PHOTOMAPS.Types of Photomaps .................... 72 123Marginal Data .................. ....... 73 123Military Grid .......................... 74 123
SECTION XII. STEREOVISION.General .................. ......... , 75 125Learning to Use a Stereoscope ............ 76 125Stereoscopes ............................ 77 127Study of Stereo-pairs .................... 78 127The Floating Line ....................... 79 129
APPENDIX. PROJECTIONS ............................. 133
This manual supersedes FM 21 - 26, 17 September 1941, including C!, 15May 1942; TB 21 - 25 - 1, 2 March 1944; TB 21 - 26 - 1, 23 February 1944'and Training Circular No. 66, War Department, 1944.
SECTION I
INTRODUCTION
1. PURPOSE. The purpose of this manual is to providea text on advanced map and aerial photograph readingfor military personnel who thoroughly understand thebasic material in FM 21-25.
2. SCOPE OF TRAINING. a. Need for training.All arms and services use maps and map substitutes.Personnel of all units must be able to read maps andaerial photographs accurately and easily. The ability tovisualize the ground from a map is gained only bythorough practical training.
b. Types of maps used in training. Equipment usedin training should be identical with that used in combat.Large-scale, colored maps with contour lines may notbe available to small units in actual operations; train-ing, therefore, must also cover small-scale maps, photo-maps, and air photographs.
c. Training program. Training in the use of mapsand aerial photographs must include both classroomand field work. The training program must include con-ventional signs and military symbols, distances andmap scales, directions and azimuths, proper use of thecompass, orientation without the compass, location ofpoints by coordinates, visualization of terrain, use ofmarginal data, and interpretation of aerial photographs.Frequent practical tests should be given throughout thecourse of instruction to ascertain that students aremaking proper progress.
1
SECTION II
MAPS
3. DEFINITION. A map is a line drawing, to scale, of anarea of the earth's surface. It shows objects and featuresby conventional signs. Although drawn to scale, it is notabsolutely accurate because it is flat while the earth'ssurface is curved. The map's accuracy depends on themethod used in making it (see appendix). A discussionof the various map-making methods is given in TM5-230.
4. CLASSIFICATION. AR 300-15 prescribes the classi-fication of maps and the specifications for their prepara-tion. Military maps are classified according to scale astactical, strategic, and general. Scale is discussed inparagraph 8.
a. Tactical. Maps of scale 1:125,000 and larger con-tain a great deal of detail and are intended to meet thetactical, technical, and administrative needs of fieldunits. The scale of these maps normally is not largerthan 1:20,000.
b. Strategic. Maps ranging in scale from 1:125,000exclusive to 1:1,000,000 inclusive are required forplanning operations, including movements and concen-trations of troops and supplies.
c. General. Maps of smaller scale than 1:1,000,000are needed for general planning and for strategicalstudies by commanders of large units.
5. CARE IN THE FIELD. Since the supply of maps islimited, they must be treated with care. If possible theyare mounted on map boards and covered with a sheet
2

of transparent material such as cellulose acetate. Thisaffords some protection from moisture and permitsmarking with grease pencils. If carried by personnelin the field, maps should be folded in accordion fashion,as illustrated in FM 21-25, and placed in the pocketfor protection from sun and moisture. Marks should bemade lightly with pencil so they may be easily erased.For added protection the map may be covered with anissue transparent covering which is coated with an ad-hesive on one surface. This material adheres readily tothe map, does not prevent folding, gives protection frommoisture, and allows marking with graphite or greasepencil. Unmounted aerial photographs should be filedflat in some moisture-proof container; they should neverbe rolled. Photographs must not be placed near heatingdevices and should be mounted on stiff backing whenexposed to changes in temperature.
3

SECTION III
CONVENTIONAL SIGNSAND MILITARY SYMBOLS
6. CONVENTIONAL SIGNS. a. Signs. Conventionalsigns are used on maps to indicate objects on theground. Usually, they are simple drawings recognizableas the objects they represent. The meaning of somesigns, however, is not obvious and must be learned.Complete lists of conventional signs authorized for useon United States military maps are found in FM 21-30;foreign conventional signs are shown in FM 30-22.When foreign maps are adapted and issued to troopsconventional signs which differ from signs used onUnited States maps are explained in the map margin.
b. Colors. Colors are used on some maps to helpidentify terrain features. These colors are black, blue,brown, green, and red:
Black for works of man.Blue for water and swamps.Brown for contours, cuts and fills, and some cul-
tivated fields on large-scale maps.Green for woods and other vegetation.Red for certain good roads.
7. MILITARY SYMBOLS. Military symbols have beendeveloped to represent various types of military or-ganizations, activities, and installations. These symbolsare used to indicate size and identity of various unitsand installations, type and location of supportingweapons, and necessary lines and boundaries for anoperation. Friendly installations are usually shown inblue, enemy installations in red. FM 21-30 lists thestandard military symbols.
4

SECTION IV
MAP MEASUREMENTS
8. SCALE. Ground distance can be determined from amap by the map scale. Scale is the relation betweendistance on the map and actual distance on the ground.It is expressed in one or more of the following ways:
a. Words and figures. Scale may be expressed by asimple statement like "3 inches equals 1 mile," meaning3 inches on the map equals 1 mile on the ground.Similarly, "1 inch equals 200 feet" means that 1 inchon the map equals 200 feet on the ground.
b. Representative fraction. Scale may be shown bya fraction, called the representative fraction, abbrevi-ated RF. The representative-fraction formula is:
Map distance (MD)Ground distance (GD)
in which the numerator and denominator are expressedin the same unit, as inches, feet, yards, meters, or miles.
1The RF appears in the margin as 1:20,000 or 20,000'
which means 1 unit of distance on the map equals 20,000such units on the ground. The larger the denominatorof the RF, the smaller the scale of the map. Thus, a1:1,000,000 map is a small-scale map and a 1:20,000map is a large scale map. (See FM 21-25.)
c. Graphic scale. Distances may also be measuredby the graphic scale-a special ruler for the particularmap, printed in the margin. (See FM 21-25.)
9. MEASURING DEVICES. a. Map measurer (fig. 1).The map measurer is an instrument designed for quickmeasurement of distances or lines on a map. It consists
5
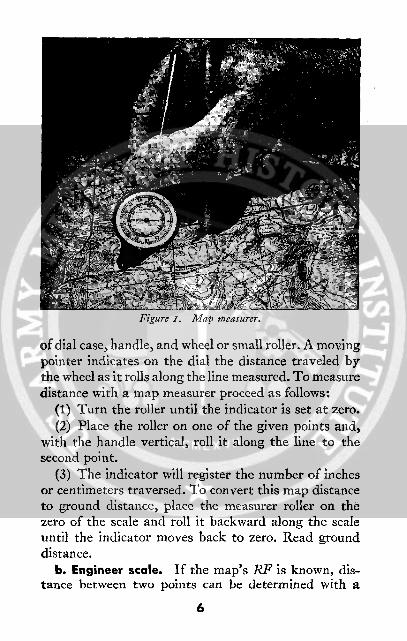
Pigure I. Map measurer.
of dial case, handle, and wheel or small roller. A movingpointer indicates on the dial the distance traveled bythe wheel as it rolls along the line measured. To measuredistance with a map measurer proceed as follows:
(1) Turn the roller until the indicator is set at zero.(2) Place the roller on one of the given points and,
with the handle vertical, roll it along the line to thesecond point.
(3) The indicator will register the number of inchesor centimeters traversed. To convert this map distanceto ground distance, place the measurer roller on thezero of the scale and roll it backward along the scaleuntil the indicator moves back to zero. Read grounddistance.
b. Engineer scale. If the map's RF is known, dis-tance between two points can be determined with a
6

11770 2 0
?76
145 350
Figure 2. Measuring distance on a map with engineer's scale.
scale divided into inches. An engineer scale divided intotenths of an inch is best. To obtain the number of incheson the ground, measure the distance in inches betweenthe two points on the map and multiply it by the de-nominator of the RF. Convert into feet by dividing by12, into yards by dividing by 36, or into miles by divid-ing by 63,360. For example, figure 2 shows a portion ofa map whose scale is 1:62,500. To find the distance onthe ground between Missouri Mill and the road junctionat Triangle proceed as follows: the engineer scale showsthat the map distance between the points is 3.07 inches.
1 MD (map distance)62,500 GD (ground distance)
7
FM�W�

GD = MD X 62,500GD = 3.07 X 62,500 = 191,875 inches
To convert this distance into yards divide by 36:191,875
1 736 - 5,330 yards36
10. CONVERSION FACTORS. Distances may be ex-pressed in either the English or the metric system andit may be necessary to convert measurements of onesystem into those of another. Common units of metriclinear measure and their English equivalents are:
1 mile = 1,760 yards = 1.609 kilometers =1,609 meters1 kilometer = 1,000 meters = 1,094 yards =0.62 mile.1 meter = 1.094 yards = 39.37 inches.1 yard = 0.91 meter = 36 inches.
11. DETERMINATION OF MAP SCALE. If the scaledata are missing from the margin of a map, the RF ofthe map can be determined from a ground measurementor from a measurement on a map of known scale.
a. By measurement of distance between two pointson the ground. The scale of a map may be determinedby comparing the distance between two points on theground with the distance between the same two pointson the map. For example, in figure 3, the bridge andthe crossroads are 3 inches apart on the map. Theground distance between the two points may bemeasured by tape, by striding, or by any other reason-ably accurate method. Suppose the points are foundto be 1,650 yards or 59,400 inches apart on the ground.Now substitute in the formula:
3 1RF = 59,400 19,800
8

Figure 3. Scale of map may be determined when ground distance is known.
Map is apparently 1:20,000.b. By measurement between two points on map of
known scale. To determine the RFof a map with theaid of a map of known scale, select two points that
9

appear on both maps and measure the distance betweenthe two points. Then the ground distance between thetwo points can be figured from the map of known scale,and the scale of the other map may be determined by
MAP A RF= 1:20,000
MAP BRF= ?
Figare 4. Comparing scale of two maps representing identical area.
10
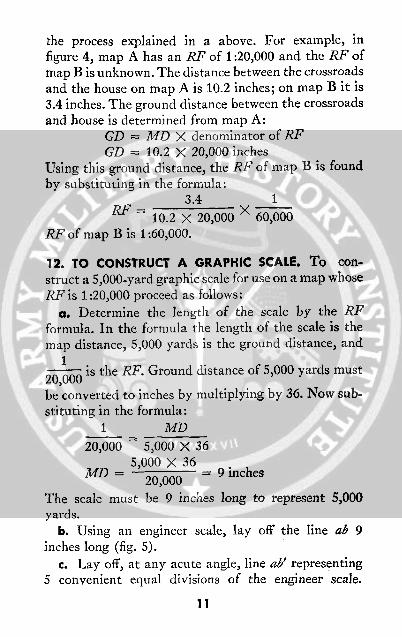
the process explained in a above. For example, infigure 4, map A has an RF of 1:20,000 and the RF ofmap B is unknown. The distance between the crossroadsand the house on map A is 10.2 inches; on map B it is3.4 inches. The ground distance between the crossroadsand house is determined from map A:
GD = MD X denominator of RFGD = 10.2 X 20,000 inches
Using this ground distance, the RF of map B is foundby substituting in the formula:
3.4 1RF = X
10.2 X 20,000 60,000RF of map B is 1:60,000.
12. TO CONSTRUCT A GRAPHIC SCALE. To con-struct a 5,000-yard graphic scale for use on a map whoseRF is 1:20,000 proceed as follows:
a. Determine the length of the scale by the RFformula. In the formula the length of the scale is themap distance, 5,000 yards is the ground distance, and
120,000 is the RF. Ground distance of 5,000 yards must
be converted to inches by multiplying by 36. Now sub-stituting in the formula:
1 MD
20,000 5,000 X 365,000 X 36
MD - = 9 inches20,000
The scale must be 9 inches long to represent 5,000yards.
b. Using an engineer scale, lay off the line ab 9inches long (fig. 5).
c. Lay off, at any acute angle, line ab' representing5 convenient equal divisions of the engineer scale.
11
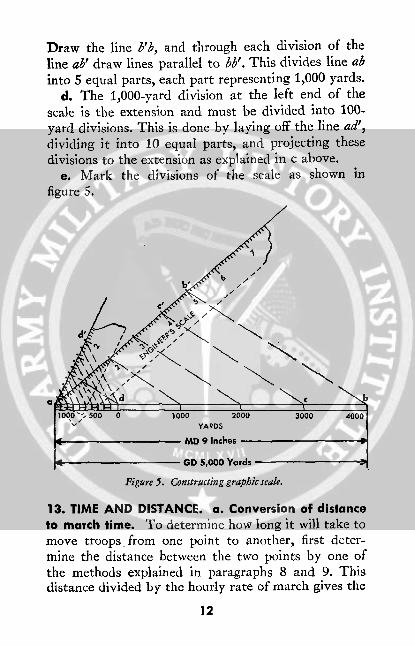
Draw the line b'b, and through each division of theline ab' draw lines parallel to bb'. This divides line abinto 5 equal parts, each part representing 1,000 yards.
d. The 1,000-yard division at the left end of thescale is the extension and must be divided into 100-yard divisions. This is done by laying off the line ad',dividing it into 10 equal parts, and projecting thesedivisions to the extension as explained in c above.
e. Mark the divisions of the scale as shown infigure 5.
100o0o 500 0 1000 2000 3000 4000YARDS
.* v , NMD 9 Inches
*~ GD 5,000 Yards
Figure 5. Constructing graphic scale.
13. TIME AND DISTANCE. a. Conversion of distanceto march time. To determine how long it will take tomove troops from one point to another, first deter-mine the distance between the two points by one ofthe methods explained in paragraphs 8 and 9. Thisdistance divided by the hourly rate of march gives the
12
time required to move the troops. The average day-time rate of march for foot troops, making allowancefor customary halts, is 2/2 mph.
b. Conversion of march time to distance. It is oftennecessary to determine the distance a column canmarch in a given time. The distance is the product ofthe time in hours and the hourly rate of march orD = T X R. For example, a motorized unit averaging25 mph can cover 4 X 25 or 100 miles in 4 hours.This distance is measured along the road to locate thehead of the column at the end of 4 hours. Thus theposition of the head of the column at the end of anygiven time can be determined.
c. Rate of march. By substituting values of distanceand time in the formula D = T X R and solving forR, the rate of march is determined.
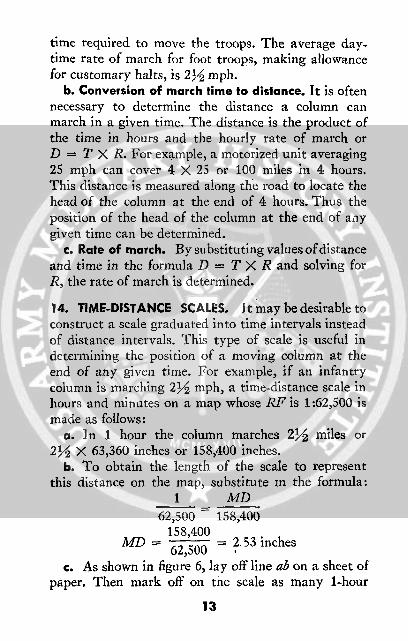
14. TIME-DISTANCE SCALES. It may be desirable toconstruct a scale graduated into time intervals insteadof distance intervals. This type of scale is useful indetermining the position of a moving column at theend of any given time. For example, if an infantrycolumn is marching 212 mph, a time-distance scale inhours and minutes on a map whose RF is 1:62,500 ismade as follows:
a. In 1 hour the column marches 2/2 miles or2'2 X 63,360 inches or 158,400 inches.
b. To obtain the length of the scale to representthis distance on the map, substitute in the formula:
1 MD62,500 158,400
158,400MD = = 2 53 inches
62,500c. As shown in figure 6, lay off line ab on a sheet of
paper. Then mark off on tne scale as many 1-hour
13
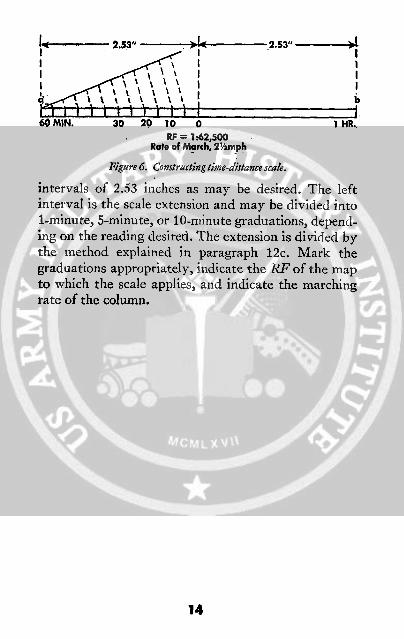
RF = 1.62,500Rate of March, 2%Ymph
Figure 6. Constructingtime-distancescale.
intervals of 2.53 inches as may be desired. The leftinterval is the scale extension and may be divided into1-minute, 5-minute, or 10-minute graduations, depend-ing on the reading desired. The extension is divided bythe method explained in paragraph 12c. Mark thegraduations appropriately, indicate the RF of the mapto which the scale applies, and indicate the marchingrate of the column.
14
SECTION V
DIRECTION AND AZIMUTH
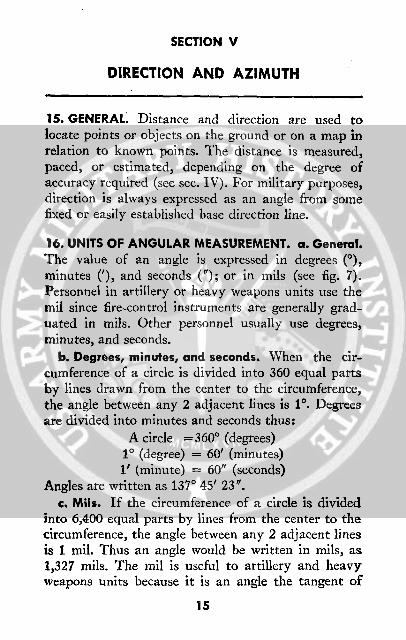
15. GENERAL Distance and direction are used tolocate points or objects on the ground or on a map inrelation to known points. The distance is measured,paced, or estimated, depending on the degree ofaccuracy required (see sec. IV). For military purposes,direction is always expressed as an angle from somefixed or easily established base direction line.
16. UNITS OF ANGULAR MEASUREMENT. a. General.The value of an angle is expressed in degrees (o),minutes ('), and seconds ("); or in mils (see fig. 7).Personnel in artillery or heavy weapons units use themil since fire-control instruments are generally grad-uated in mils. Other personnel usually use degrees,minutes, and seconds.
b. Degrees, minutes, and seconds. When the cir-cumference of a circle is divided into 360 equal partsby lines drawn from the center to the circumference,the angle between any 2 adjacent lines is 1°. Degreesare divided into minutes and seconds thus:
A circle =360° (degrees)1° (degree) = 60' (minutes)1' (minute) = 60" (seconds)
Angles are written as 137 ° 45' 23".c. Mils. If the circumference of a circle is divided
into 6,400 equal parts by lines from the center to thecircumference, the angle between any 2 adjacent linesis 1 mil. Thus an angle would be written in mils, as1,327 mils. The mil is useful to artillery and heavyweapons units because it is an angle the tangent of
15
30 l 4
* 1SO
* 0
70A 480~~,
REES
R80o·GRE'
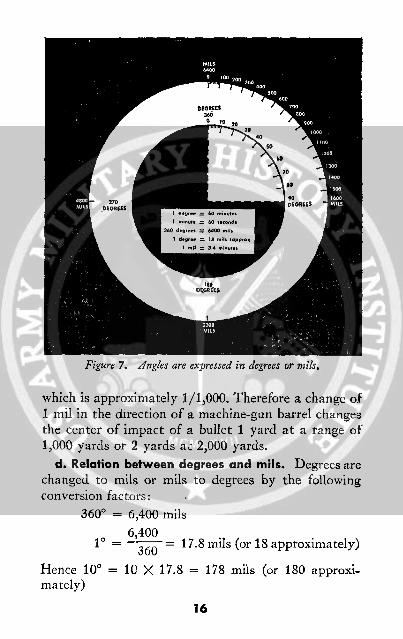
Figure 7. Angles are expressed in degrees or mils.
which is approximately 1/1,000. Therefore a change of1 mil in the direction of a machine-gun barrel changesthe center of impact of a bullet 1 yard at a range of1,000 yards or 2 yards at 2,000 yards.
d. Relation between degrees and mils. Degrees arechanged to mils or mils to degrees by the followingconversion factors:
360 ° = 6,400 mils
6,4001° = 60 = 17.8 mils (or 18 approximately)360
Hence 100 = 10 X 17.8 = 178 mils (or 180 approxi-mately)
16
270DEGREES
3601 mil =- 6,400 = .0560 (or 3.4' approximately)
Hence 100 mils = 100 X .056 = 5.6° or 50 36'
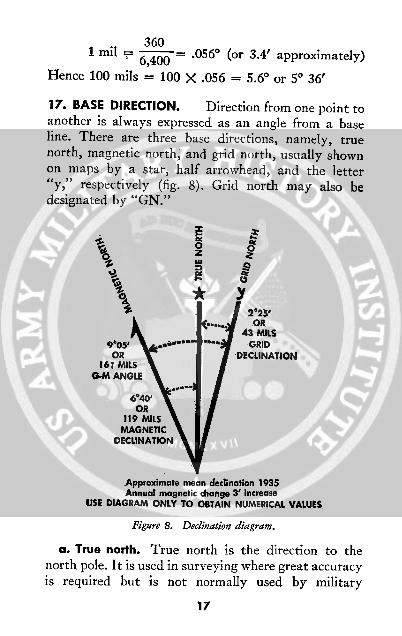
17. BASE DIRECTION. Direction from one point toanother is always expressed as an angle from a baseline. There are three base directions, namely, truenorth, magnetic north, and grid north, usually shownon maps by a star, half arrowhead, and the letter"y," respectively (fig. 8). Grid north may also bedesignated by "GN."
%)
9 05' i,'
OR161 MILS
G-M ANGLE
640'OR
119 MILSMAGNETIC
DECLINATION
zI-0zU'
.-X
0o
I
2025'.OR
r43 MISLGRID
DECLINATION
Approximate mean declination 1935Annual magnetic change 3' increase
USE DIAGRAM ONLY TO OBTAIN NUMERICAL VALUES
Figure 8. Declination diagram.
a. True north. True north is the direction to thenorth pole. It is used in surveying where great accuracyis required but is not normally used by military
17

personnel in the field. Meridian or longitude lines on amap represent true north and south directions.
b. Magnetic north. Magnetic north is the directionof the north magnetic pole. It is indicated by the N(northseeking) end of the compass needle. It is ordin-arily used for field work because it can be founddirectly with the common compass.
c. Grid north. Grid north is the direction of thevertical grid lines usually found on military maps (seepar. 27). Determination of direction by grid north isconvenient because grid lines are located at frequentintervals on maps.
18. DECLINATION. a. General. Declination is thedifference in direction between true north and magneticnorth or between true north and grid north. There aretherefore two declinations, magnetic and grid. Infigure 8, magnetic declination is 60 40' west and griddeclination is 2° 25' east.
b. Magnetic. Magnetic declination is the anglebetween true north and magnetic north. In localitieswhere a compass needle points east of true north,magnetic declination is east. Where a compass needlepoints west of true north, magnetic declination iswest. Where true north and magnetic north are thesame, magnetic declination is zero. Lines joiningpoints on the surface of the earth where magneticdeclination is zero are called agonic lines. Lines joiningpoints having the same magnetic declination arecalled isogonic lines. The magnetic declination in theUnited States varies from 250 east in WashingtonState to 22° west in Maine. Isogonic lines run generallynorth and south in the United States but are irregularbecause of local conditions. The magnetic declinationat any one locality is subject to a gradual change, the
18
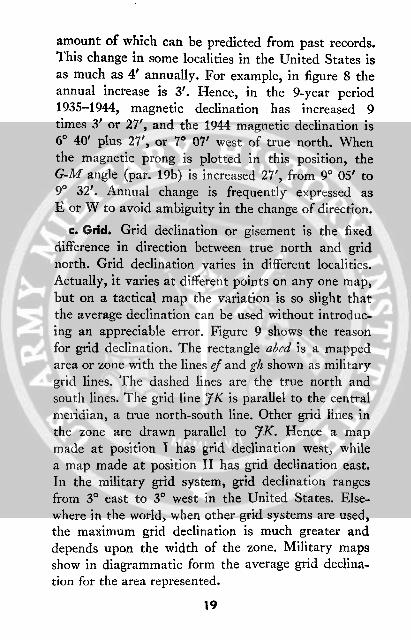
amount of which can be predicted from past records.This change in some localities in the United States isas much as 4' annually. For example, in figure 8 theannual increase is 3'. Hence, in the 9-year period1935-1944, magnetic declination has increased 9times 3' or 27', and the 1944 magnetic declination is6° 40' plus 27', or 70 07' west of true north. Whenthe magnetic prong is plotted in this position, theG-M angle (par. 19b) is increased 27', from 90 05' to9° 32'. Annual change is frequently expressed asE or W to avoid ambiguity in the change of direction.
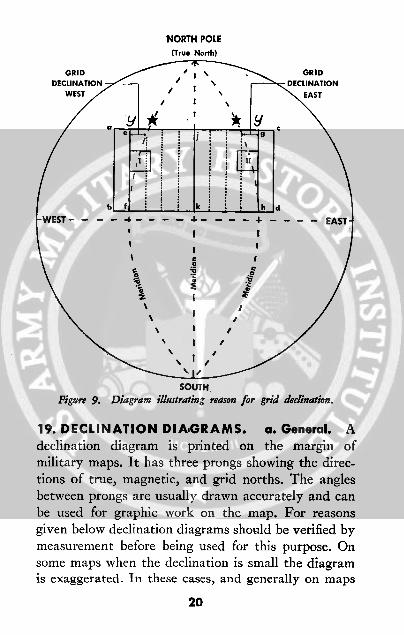
c. Grid. Grid declination or gisement is the fixeddifference in direction between true north and gridnorth. Grid declination varies in different localities.Actually, it varies at different points on any one map,but on a tactical map the variation is so slight thatthe average declination can be used without introduc-ing an appreciable error. Figure 9 shows the reasonfor grid declination. The rectangle abcd is a mappedarea or zone with the lines ef and gh shown as militarygrid lines. The dashed lines are the true north andsouth lines. The grid line 7K is parallel to the centralmeridian, a true north-south line. Other grid lines inthe zone are drawn parallel to )K. Hence a mapmade at position I has grid declination west, whilea map made at position II has grid declination east.In the military grid system, grid declination rangesfrom 30 east to 30 west in the United States. Else-where in the world, when other grid systems are used,the maximum grid declination is much greater anddepends upon the width of the zone. Military mapsshow in diagrammatic form the average grid declina-tion for the area represented.
19
NORTH POLE(True North)
WEST | -- - - -4- -… - -…I - -- - EAST
SOUTHFigure 9. Diagram illustrating reason for grid declination.
19. DECLINATION DIAGRAMS. a. General. A
declination diagram is printed on the margin of
military maps. It has three prongs showing the direc-
tions of true, magnetic, and grid norths. The angles
between prongs are usually drawn accurately and can
be used for graphic work on the map. For reasons
given below declination diagrams should be verified by
measurement before being used for this purpose. On
some maps when the declination is small the diagram
is exaggerated. In these cases, and generally on maps
2020
printed since 1943 the following note appears underthe diagram:
USE DIAGRAM ONLY TO OBTAIN
NUMERICAL VALUESDiagrams so marked will not be used for graphical
purposes. See figure 8.b. G-M angle. (1) The angle between grid north
and magnetic north is commonly called the G-M angle.The angle is west when magnetic north is west of gridnorth; east when magnetic north is east of grid north.It is used frequently in field map reading and itsexact value is given in degrees on the declinationdiagram of new maps. However, its value may not belisted on older maps. In such cases, the G-M angle iscomputed by adding magnetic and grid declinationswhen magnetic and grid prongs are on opposite sidesof the true-north prong and by subtracting whenthey are on the same side. Once the G-M angle hasbeen computed, it vshould be written on the map foreasy reference.
(2) An increase in annual magnetic change mayincrease or decrease the G-M angle. If the magneticprong moves toward the grid prong, the G-M angle isdecreased; if it moves away, the G-M angle is increased.
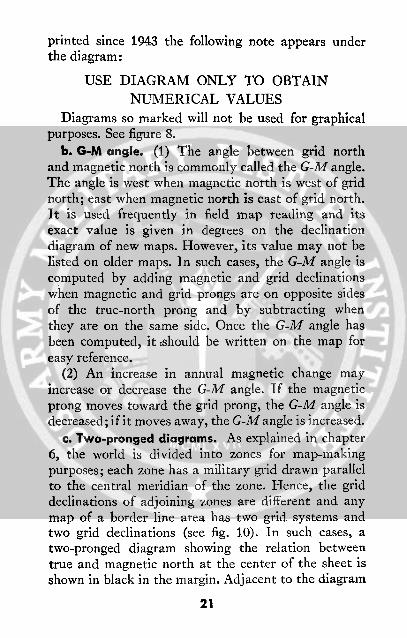
c. Two-pronged diagrams. As explained in chapter6, the world is divided into zones for map-makingpurposes; each zone has a military grid drawn parallelto the central meridian of the zone. Hence, the griddeclinations of adjoining zones are different and anymap of a border line area has two grid systems andtwo grid declinations (see fig. 10). In such cases, atwo-pronged diagram showing the relation betweentrue and magnetic north at the center of the sheet isshown in black in the margin. Adjacent to the diagram
21
11015'Grid Dec. for the center ORof the N. W; Africa Zone 200 MILSArea= 324' W or 60 mils 0
Grid Dec. for the center Zof the N. Sahara Zone JOArea = 1'47'W or 32 mils
Figure 10. Declination diagram for map on which two zones appear.
are notes giving the grid declination for the center ofeach gridded area. These notes are usually in thecolor of the grid to which they refer.
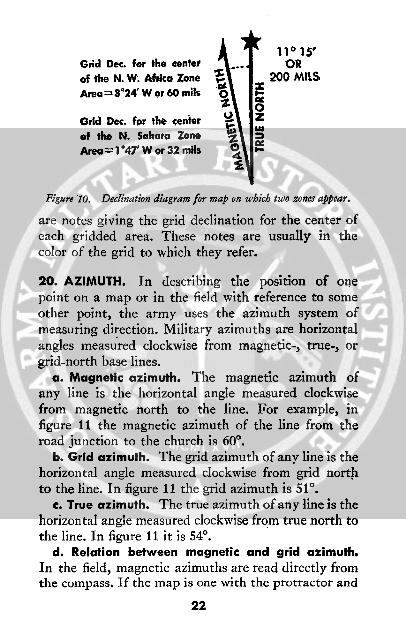
20. AZIMUTH. In describing the position of onepoint on a map or in the field with reference to someother point, the army uses the azimuth system ofmeasuring direction. Military azimuths are horizontalangles measured clockwise from magnetic-, true-, orgrid-north base lines.
a. Magnetic azimuth. The magnetic azimuth ofany line is the horizontal angle measured clockwisefrom magnetic north to the line. For example, infigure 11 the magnetic azimuth of the line from theroad junction to the church is 60° .
b. Grid azimuth. The grid azimuth of any line is thehorizontal angle measured clockwise from grid northto the line. In figure 11 the grid azimuth is 51° .
c. True azimuth. The true azimuth of any line is thehorizontal angle measured clockwise from true north tothe line. In figure 11 it is 54°.
d. Relation between magnetic and grid azimuth.In the field, magnetic azimuths are read directly fromthe compass. If the map is one with the protractor and
22
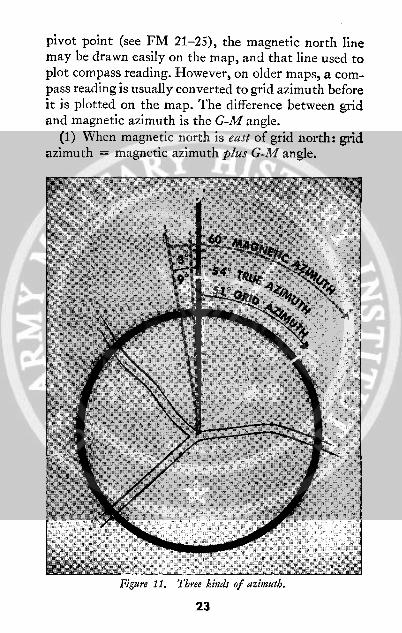
pivot point (see FM 21-25), the magnetic north linemay be drawn easily on the map, and that line used toplot compass reading. However, on older maps, a com-pass reading is usually converted to grid azimuth beforeit is plotted on the map. The difference between gridand magnetic azimuth is the G-M angle.
(1) When magnetic north is east of grid north: gridazimuth = magnetic azimuth plus G-M angle.
Figure 11. lhbree kinds of azimuth.
23
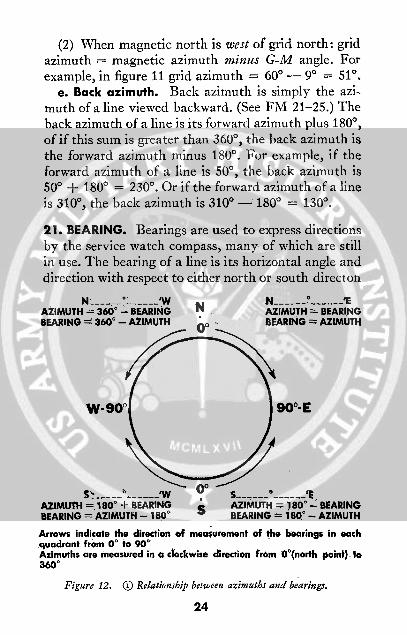
(2) When magnetic north is west of grid north: gridazimuth = magnetic azimuth minus G-M angle. Forexample, in figure 11 grid azimuth = 600 - 90 = 51° .
e. Back azimuth. Back azimuth is simply the azi-muth of a line viewed backward. (See FM 21-25.) Theback azimuth of a line is its forward azimuth plus 180° ,of if this sum is greater than 360 °, the back azimuth isthe forward azimuth minus 1800. For example, if theforward azimuth of a line is 50° , the back azimuth is500 + 1800 = 2300. Or if the forward azimuth of a lineis 310° , the back azimuth is 310 °-- 180 ° = 130 ° .
21. BEARING. Bearings are used to express directionsby the service watch compass, many of which are stillin use. The bearing of a line is its horizontal angle anddirection with respect to either north or south directon
N____ -... W N------------ 'EAZIMUTH = 360° - BEARING N AZIMUTH = BEARINGBEARING 360° - AZIMUTH - BEARING= AZIMUTH
00
W-90 90°0-E
Se_ .......... W S °.------- ---. 'AZIMUTH = 180 ° + BEARING AZIMUTH = 180° - BEARINGBEARING = AZIMUTH - 180 ° BEARING = 180 °-AZIMUTH
Arrows indicate the direction of measurement of the bearings in eachquadrant from 0° to 90°
Azimuths are measured in a clockwise direction from O0(north point). to360°
Figure 12. ( Relationship between azimuths and bearings.
24

) Direction expressed in azimuths and bearings.Figure 12. - Continued.
line and never exceeds 900. Figure 12 ( shows how bear-ings are measured and indicates the relationship be-tween bearings and azimuths. If bearings are magneticthe azimuths likewise are magnetic. Figure 12 0 illus-trates how to express a typical direction in each quad-rant both as an azimuth and as a bearing.
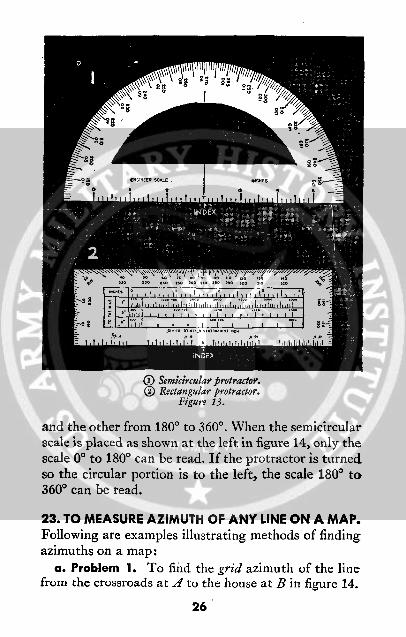
22. PROTRACTOR. A protractor is an anstrument formeasuring or laying off angles on a map. Figure 13 (Dand ( illustrate two types; the semicircular type isthe more common. The protractor represents half anazimuth circle but is graduated in two scales to repre-sent a complete circle, one scale reading from 0° to 1800
25
· e I~~~'mr0 0.olba O'?s . I I ..
I° o
[
C-i 1
() Semicircular protractor.() Rectangular protractor.
Figure 13.
and the other from 180° to 3600. When the semicircularscale is placed as shown at the left in figure 14, only thescale 0° to 180° can be read. If the protractor is turnedso the circular portion is to the left, the scale 1800 to3600 can be read.
23. TO MEASURE AZIMUTH OF ANY LINE ON A MAP.Following are examples illustrating methods of findingazimuths on a map:
a. Problem 1. To find the grid azimuth of the linefrom the crossroads at A to the house at B in figure 14.
26
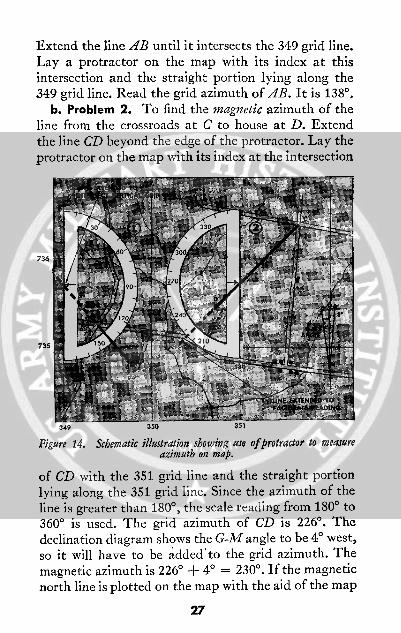
Extend the line AB until it intersects the 349 grid line.Lay a protractor on the map with its index at thisintersection and the straight portion lying along the349 grid line. Read the grid azimuth of AB. It is 138° .
b. Problem 2. To find the magnetic azimuth of theline from the crossroads at C to house at D. Extendthe line CD beyond the edge of the protractor. Lay theprotractor on the map with its index at the intersection
736
735
Figure 14. Schematic illustration showing use ofprotractor to measureazimuth on map.
of CD with the 351 grid line and the straight portionlying along the 351 grid line. Since the azimuth of theline is greater than 1800, the scale reading from 1800 to360° is used. The grid azimuth of CD is 226° . Thedeclination diagram shows the G-M angle to be 40 west,so it will have to be added'to the grid azimuth. Themagnetic azimuth is 226 ° + 40 = 2300. If the magneticnorth line is plotted on the map with the aid of the map
27

pivot point and partial protractor scale, the magneticazimuth may be measured directly from this line.
24. TO PLOT AN AZIMUTH ON A MAP. a. Gridazimuth. Problem: To plot from CR 685 on figure 15a line with a grid azimuth of 75 ° . Construct a line
736
7355
349 350 351 352
Figure 15. Schematic illustration showing use of protractor to plot a givenazimuth on a map.
through the crossroads parallel to the north-south grid.Place a protractor on the map with its base on the lineand its index at the crossroads. Plot the point P at the750 reading on the protractor. Remove the protractorand draw a line from the crossroads through P.
b. Magnetic azimuth. To plot the magnetic azimuthof a line, follow the same procedure as in a above butconstruct the line through the crossroads parallel tomagnetic north, rather than to the north-south grid or
28
convert magnetic azimuth to grid azimuth and plot asdirected in a above.
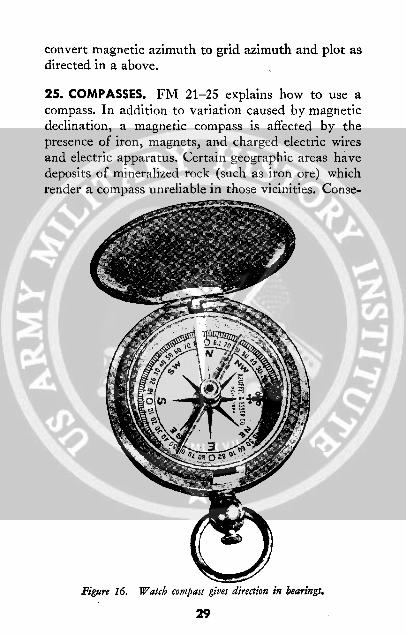
25. COMPASSES. FM 21-25 explains how to use acompass. In addition to variation caused by magneticdeclination, a magnetic compass is affected by thepresence of iron, magnets, and charged electric wiresand electric apparatus. Certain geographic areas havedeposits of mineralized rock (such as iron ore) whichrender a compass unreliable in those vicinities. Conse-
Figure 16. Watch compass gives direction in bearings.
29
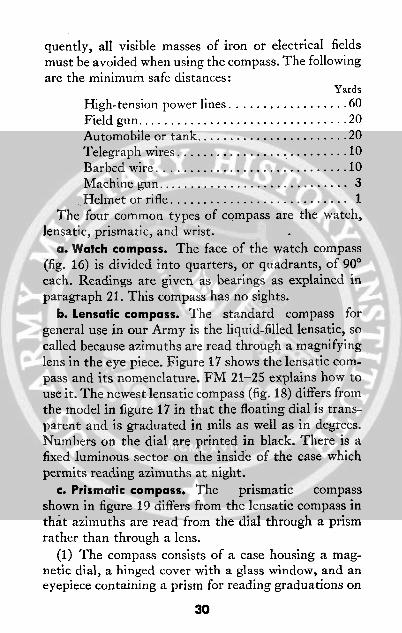
quently, all visible masses of iron or electrical fieldsmust be avoided when using the compass. The followingare the minimum safe distances:
YardsHigh-tension power lines .................. 60Field gun ................................ 20Automobile or tank ...................... 20Telegraph wires .......................... 10Barbed wire ............................. 10Machine gun ............................ 3Helmet or rifle ........................... 1
The four common types of compass are the watch,lensatic, prismatic, and wrist.
a. Watch compass. The face of the watch compass(fig. 16) is divided into quarters, or quadrants, of 90°
each. Readings are given as bearings as explained inparagraph 21. This compass has no sights.
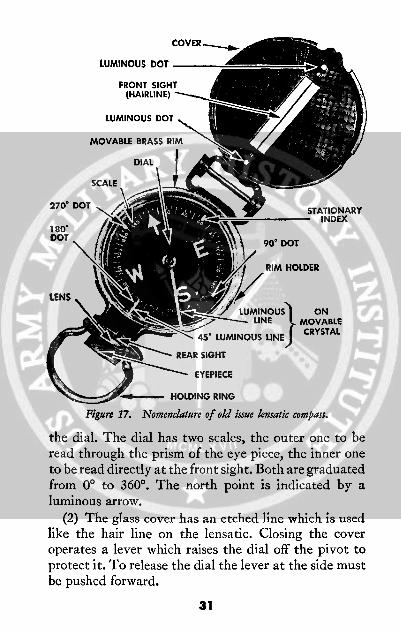
b. Lensatic compass. The standard compass forgeneral use in our Army is the liquid-filled lensatic, socalled because azimuths are read through a magnifyinglens in the eye piece. Figure 17 shows the lensatic com-pass and its nomenclature. FM 21-25 explains how touse it. The newest lensatic compass (fig. 18) differs fromthe model in figure 17 in that the floating dial is trans-parent and is graduated in mils as well as in degrees.Numbers on the dial are printed in black. There is afixed luminous sector on the inside of the case whichpermits reading azimuths at night.
c. Prismatic compass. The prismatic compassshown in figure 19 differs from the lensatic compass inthat azimuths are read from the dial through a prismrather than through a lens.
(1) The compass consists of a case housing a mag-netic dial, a hinged cover with a glass window, and aneyepiece containing a prism for reading graduations on
30
COVER
LUMINOUS DOT
FRONT SIGHT .(HAIRLINE)
LUMINOUS DOT
MOVABLE BRASS RIM
DIAL
SCALE
270' DOT
180°
/ c
__V STATIONARYINDEXrmr
DOT j I a l a 10 90' DOT
a RIM HOLDER
tENS
\ _'LU/ LUMINOUS' ON; LINE MOVABLE
45' LUMINOUS LINEJ CRYSTAL
REAR SIGHT
EYEPIECE
~--- HOLDING RING
Figure 17. Nomenclature of old issue lensatic compass.
the dial. The dial has two scales, the outer one to beread through the prism of the eye piece, the inner oneto be read directly at the front sight. Both are graduatedfrom 0° to 3600. The north point is indicated by aluminous arrow.
(2) The glass cover has an etched line which is usedlike the hair line on the lensatic. Closing the coveroperates a lever which raises the dial off the pivot toprotect it. To release the dial the lever at the side mustbe pushed forward.
31

Figure 18. New issue lensatic compass.
(3) When the cover of the compass is raised, a glassdisk protects the dial. The luminous index line used insetting azimuths at night is painted on this disk. Theindex line can be set at any desired angle simply byloosening the setscrew on the side and revolving thecorrugated brass ring which houses the glass disk.
(4) The outside of the compass case is graduated indegrees, counterclockwise. For night use the luminousindex line is set opposite the desired azimuth indicatedon the outside of the case. The compass is rotated untilthe luminous arrow on the dial points to the luminousindex line. Now the two luminous markers on the hinged
32
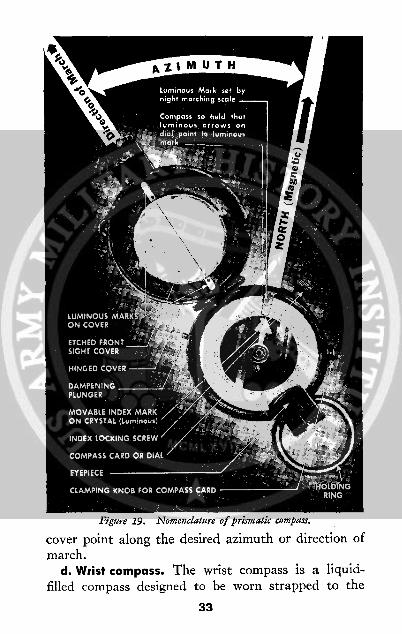
Xigure IY. 1iomencea;ure oI przsmacw compass.
cover point along the desired azimuth or direction ofmarch.
d. Wrist compass. The wrist compass is a liquid-filled compass designed to be worn strapped to the
33
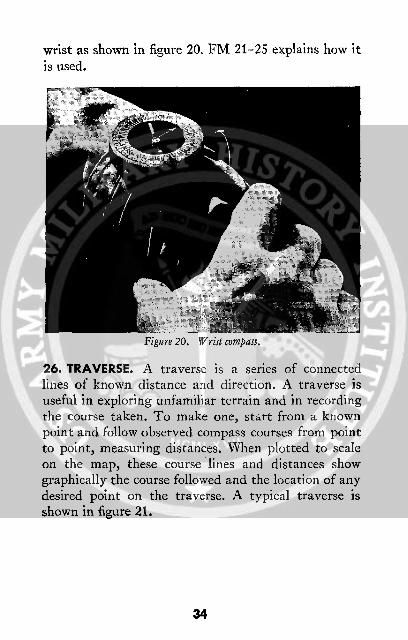
wrist as shown in figure 20. FM 21-25 explains how itis used.
Figure 20. Wrist compass.
26. TRAVERSE. A traverse is a series of connectedlines of known distance and direction. A traverse isuseful in exploring unfamiliar terrain and in recordingthe course taken. To make one, start from a knownpoint and follow observed compass courses from pointto point, measuring distances. When plotted to scaleon the map, these course lines and distances showgraphically the course followed and the location of anydesired point on the traverse. A typical traverse isshown in figure 21.
34
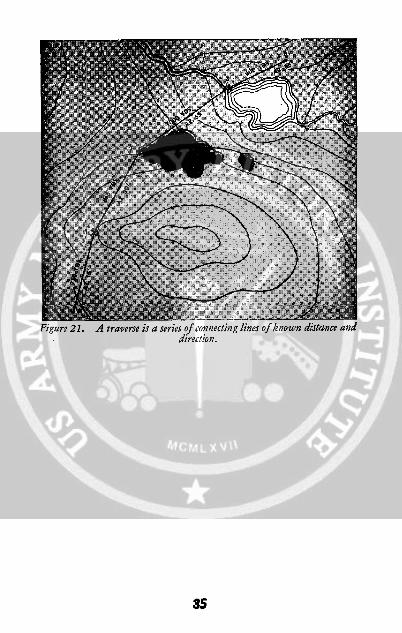
urg 21. A traverse is a series of connecting tines of known acscance anadirection.
35
SECTION VI
GRIDS AND COORDINATES
27. MILITARY GRID. A military grid is a network ofsquares made up of north-south lines showing distanceeast of an arbitrary origin, and east-west lines showingdistances north of the same reference point. The dis-tance between grid lines is 1,000, 5,000, or 10,000 yards(or meters), depending on the scale of the map. Thisdistance is called the grid interval. See FM 21-25 for:a discussion and explanation of grid coordinates.
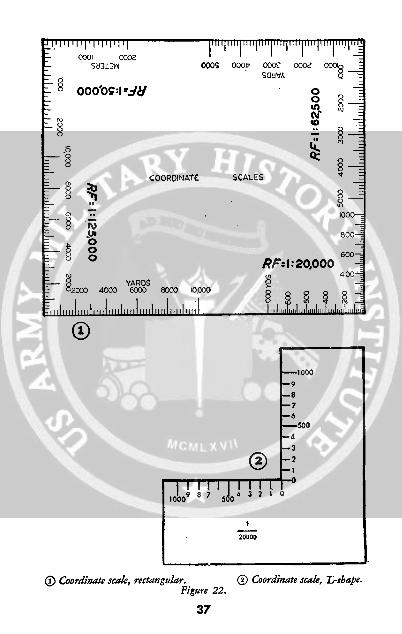
28. COORDINATE SCALE. a. General. The sides ofgrid squares may be divided with a reasonable accuracyby estimation, but it is easier and more accurate to usea coordinate scale. Two types are shown in figure 22 ®(and ®. Either may be made by laying off the lengthof one side of a grid square and dividing it into tenths.
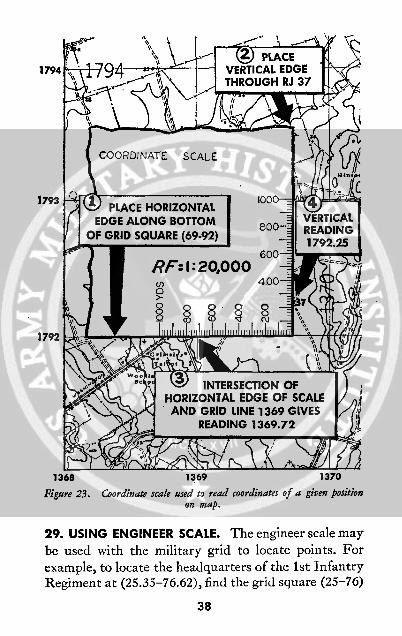
b. To read coordinates. To locate RJ 37 in figure 23,place the coordinate scale as shown. The marked hori-zontal edge is along the bottom of the grid square inwhich the road junction is located and the markedvertical edge passes through RJ 37. The horizontaledge of the scale gives the 100-yard and 20-yard pointsto the right of grid line 1369. The vertical edge of thescale gives the distance from grid line 1792 to the roadjunction. The coordinates of RJ 37 are (69.72-92.25).
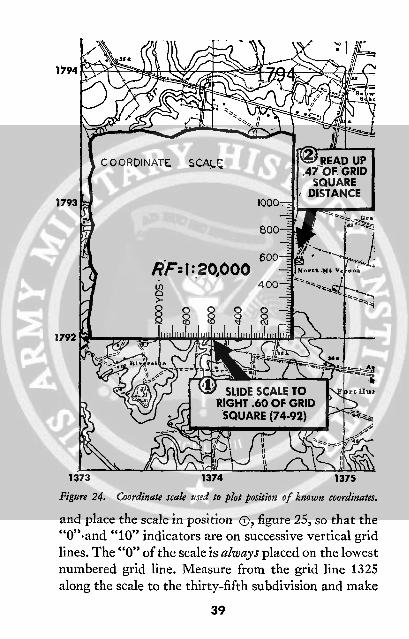
c. To plot a point. To locate the command post ofthe 1st Infantry Regiment at (74.60-92.47) place thecoordinate scale as shown in figure 24 and mark theCP with a pencil.
36
00o01 0002S8313W
-OO'Og:I :J
-§
0
20 4000 00YARDS 8000 10
I I... .... ...........
000S 000t 0000 0002 000§
O
.n
t --
SCALES
001000-
Boo
600RF::20,000
,,~, ~400").000
L~ ~ ~[I
(i) Coordinate scale, rectangular.Figure 22.
37
() Coordinate scale, I;-shape.
...................
I I I I I I I I I fI I I I I I I I I II I I I I I I I I II I I I I I I I I II I I I F
\V PLACE HORIZONTALEDGE ALONG BOTTOM
OF GRID SQUARE (69-92)
RF:1:20,000()0
\! INTERSECTION OFHORIZONTAL EDGE OF SCALEAND GRID LINE 1369 GIVES
READING 1369.72
1369 1370
Figure 23. Coordinate scale used to read coordinates of a given positionon map.
29. USING ENGINEER SCALE. The engineer scale maybe used with the military grid to locate points. Forexample, to locate the headquarters of the 1st InfantryRegiment at (25.35-76.62), find the grid square (25-76)
38
1794
1793
COORDINATE SCALE
RF: I :20,000>.
1375
Figure 24. Coordinate scale used to plot position of known coordinates.
and place the scale in position 0, figure 25, so that the"O".and "10" indicators are on successive vertical gridlines. The "0" of the scale is always placed on the lowestnumbered grid line. Measure from the grid line 1325along the scale to the thirty-fifth subdivision and make
39
1792
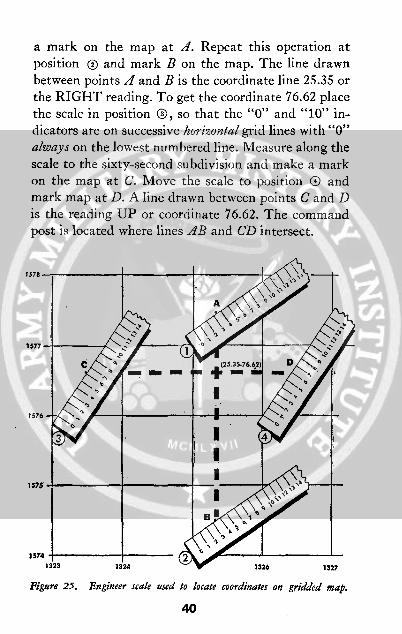
a mark on the map at A. Repeat this operation atposition () and mark B on the map. The line drawnbetween points A and B is the coordinate line 25.35 orthe RIGHT reading. To get the coordinate 76.62 placethe scale in position ®, so that the "0" and "10" in-dicators are on successive horizontal grid lines with "0"always on the lowest numbered line. Measure along thescale to the sixty-second subdivision and make a markon the map at C. Move the scale to position 0 andmark map at D. A line drawn between points C and Dis the reading UP or coordinate 76.62. The commandpost is located where lines AB and CD intersect.
Figure 25. Engineer scale used to locate coordinates on gridded map.
40
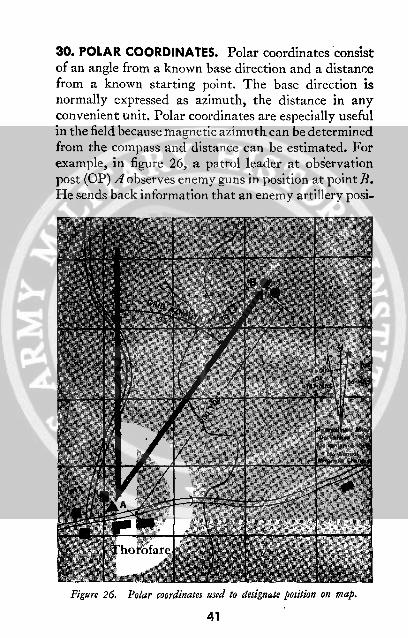
30. POLAR COORDINATES. Polar coordinates consistof an angle from a known base direction and a distancefrom a known starting point. The base direction isnormally expressed as azimuth, the distance in anyconvenient unit. Polar coordinates are especially usefulin the field because magnetic azimuth can be determinedfrom the compass and distance can be estimated. Forexample, in figure 26, a patrol leader at observationpost (OP) A observes enemy guns in position at point B.He sends back information that an enemy artillery posi-
Figure 26. Polar coordinates used to designate position on map.
41

tion is located 900 yards on a magnetic azimuth of 43°
from OP A in Thorofare Village. On receiving themessage the company commander. converts magneticazimuth 430 to grid azimuth 35 ° . He plots the directionline from OP X and scales off 900 yards to the enemyposition at point B.
31. RECTANGULAR COORDINATES. a. To plot mapposition by rectangular coordinates on ungriddedmaps. Rectangular coordinates consist of two dis-tances measured at right angles from a base position.For example, the problem in figure 27 ( is to locatepoint P, 1,500 yards east (magnetic) and 1,100 yardsnorth (magnetic) of bench mark (BM) 38 at Accotink.From BM 38 draw an east line 1,500 yards long andmeasure off 1,100 yards to the north. This locatespoint P. The coordinate is written as BM 38, Accotink(village), 1,500 yards east (magnetic), 1,100 yardsnorth (magnetic).
b. To find rectangular coordinates of a point withrespect to a given base position and direction. Fromthe base point, draw a guide line parallel to the basedirection and a guide line perpendicular to the basedirection. From the point whose rectangular coordinatesare desired, drop perpendiculars to each of these lines.Scale the distance along the perpendiculars to therespec-tive guide lines; these distances are the rectangularcoordinates. For example, in figure 27 ® the problemis to find the rectangular coordinates of point Z, giventhe base position CR 265 and base direction magneticnorth: Draw the base direction line ab and at rightangles to it draw line cd. From Z draw the perpen-diculars ef and ga. Measure along the lines ef and ga toderive the rectangular coordinates of point Z: 1,200yards east (magnetic) and 800 yards north (magnetic).
42
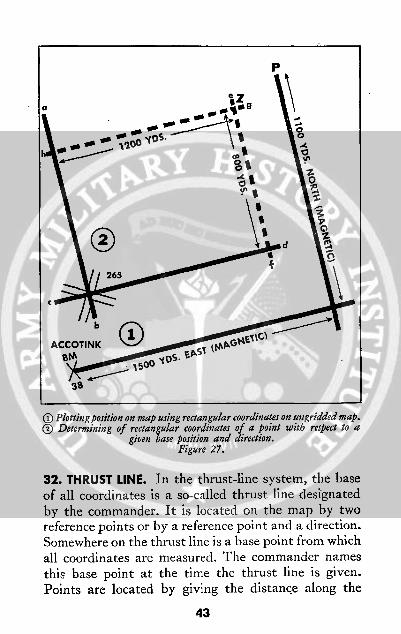
O Plottingposition on map using rectangular coordinates on ungridded map.() Determining of rectangular coordinates of a point with respect to a
given base position and direction.Figure 27.
32. THRUST LINE. In the thrust-line system, the baseof all coordinates is a so-called thrust line designatedby the commander. It is located on the map by tworeference points or by a reference point and a direction.Somewhere on the thrust line is a base point from whichall coordinates are measured. The commander namesthis base point at the time the thrust line is given.Points are located by giving the distance along the
43
thrust line forward or back of the base point, F forforward and B for back; and, the distance at rightangles from the thrust line, R for right and L for left.In determining whether a point is to the right or leftof the thrust line, the map reader must assume that heis standing at the base point and facing forward alongthe line. The distance forward or back and right or leftis given in miles, kilometers, yards, or meters; the scaleof the map determines the accuracy of measurement.When the unit of measure is miles, the measurementis in tenths with the decimal point omitted. Whenyards or meters are used, the unit of measure is desig-nated by the commander; no decimal point is involvedin this case. See 'FM 21-25 for a detailed descriptionof the thrust line.
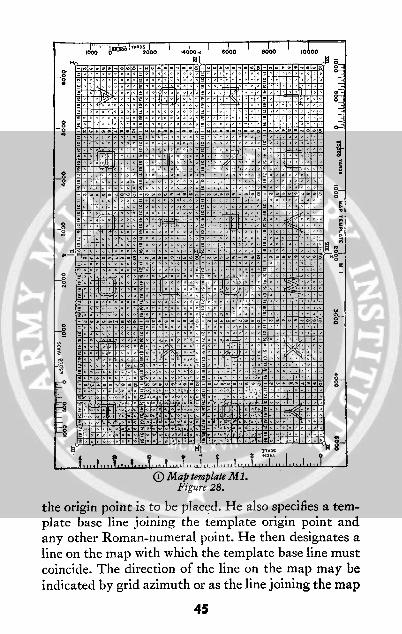
33. MAP TEMPLATES M1 AND M2. a. General.A map template is a device for locating points by co-ordinates on gridded or ungridded maps and aerialphotographs. The template is a transparent sheet about8/2 by 12 inches, having 24 large squares 1.8 inches ona side. Squares are lettered from "A" to "Y" omitting"O". Each lettered square of the M1 template is dividedinto 100 small squares, 0.18 inches on a side; each squareis marked either by a numeral or punched hole as shownin figure 28. On the M2 template the lettered squaresare not subdivided into smaller squares, but the holesare provided. In addition, both templates have ninelarger holes marked by Roman numerals I to IX. Theseholes are located at each corner, at the middle of eachside, and at the center of the template. They are originpoints for orienting the template on the map.
b. Orientation of the template. To use the templatesystem, the commander specifies an origin point on thetemplate and a reference point on the map over which
44
I ..i) i 0 0 0.. I I .i00 400
°lilolol-"l~l~l°'M-"fo 0
... .. ,-_7 l o -u,-=M op
Z5
0 7
..... .o__ ._i . .oo . .1.1 -l - ' I 1
- I - - - - --- n - ,- - --
the origin point is to be placed. He als- o specifies a tem-
plate base line joining the template origin point and
any other Roman-numeral point. He the n ' 1 designates a
c oincide. The direction of the line on the map may beI
indicated by grid azimuth or as the line joining the map
q~qloloIIol~oll~
~ . ~ .... ......,lolololololot~lold ool T Il1"11.1'11ll ol• ',.L~ I° ~ ~ ~ ~ IR ° f I°Ih
°
~IoI I~ool·
~ o~1 oo , i ~ h I 733 [,.. ~~ ~
:[o,4 [ ~1l ~:I o!i ~ ' ff -' IqHTI, l
, ,[ !o7 ioili _[f1 l~o ~ ' .tI.,l -/Iddq, I
., . HIolllootll
45
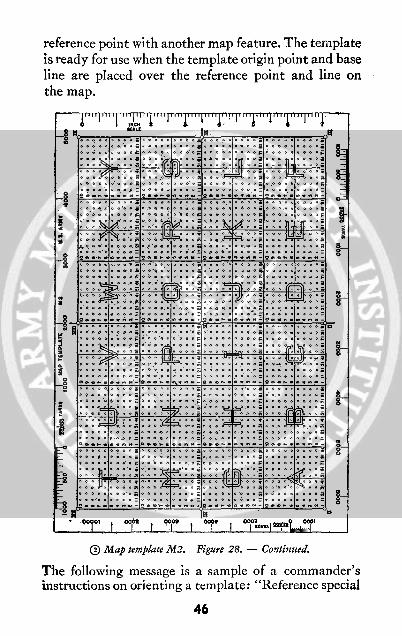
reference point with another map feature. The templateis ready for use when the template origin point and baseline are placed over the reference point and line onthe map.
. ;.'. .. l .. lT.m.l . .ll. l .. ..
........ ........ I.. I o; 1o......... ' -- .. IO * ' In. _ ° '. . ._° ° °° _ooA ,:1. 1 .- :!: :::::,. 4 ::.:: :-I
O °°°t< . t~··1~1 1 · i1V· · ·I· ~ · · *4· . ., o Zoo o'o Q s i , ·o o n 4 o o g D D _-b D o aD ' DO e e ' a rvl '' i DI fi I -I o o e '1 ' D 'r1 Pf o ol D a o i e«
o ¢ ¢ ' " oDP ~ <o c a o ro o o= o t o v v I uI o, ~o ' ao o D 401 o=oo ro_ nal ''I n_ nnI' s _ i" .I °o w D D nwnz - o '' eI n"
o a o o1 O 9 p R v < o Q 9 01 o O o Fo i " O *I ,( D D FI o ' D s o a a o Co o e e olp o D v I z ' t <zo to O a o 1 D o P o n R o o o o D o PI vD o o i
o'e. o r g 6~41 o e oi D 'lO lo o o *i · o ~W'nl " O s 1· 1 ·g osoo
ooo olo' c o o a .O : -.a . ., 7 Oa
cL o e a o. e9 r o~ D o4o e oe o lo h 'o e·o ova ...... O ..
o ~o l o- o D o I' D o 01 = o"( o O e o/ a o o: I a = o Io o n =Ioo~ D nn n-1~ II o r_ n o e_ n ii. nol 12r e_ w nn >-·Ion a 9 oI· a os o F; o i - OD ..sq .. 4 . c.o o. HP Co Z o o o! o
ioto,: e: i .c::.:o.: o o-o,. iiiii.ii D a q o ¢ .I o '
o * to ' o o A A D I A. I oGM .o . .o g . .7 t . .-.... .....6 ¢¢o 9P 6 eAvvbv4 · O Io v e v;
bob Q i*& rn ro nv ossoo *oooR=oQe n qore 1 nt T. .o . 1. . . . .n n 9n_ ne _
. ..........
iS * ,s0'o ... . . oo. Oo'. . .o
...... .... :- oo.....o e -1-. .: ::: .. ;
o - . n _ * w 9 _ _w n" ?o_ r t N oo Zr Z <
Q Map template M2. Figure 28. - Continued.
The following message is a sample of a commander'sinstructions on orienting a template: "Reference special
46
oo. ,*. Y .ooog .. o ooo;. o. ooo o I . . . . 7-
_O
i
-a
a
2
tI-071
0,
s_Os
8
5_1
----
1-
I N I
-, "t"9· I T -1-7` I 0010 - I - '10'hpl6 I
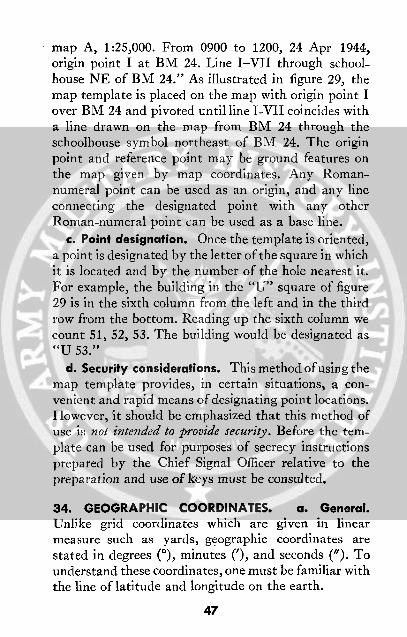
map A, 1:25,000. From 0900 to 1200, 24 Apr 1944,origin point I at BM 24. Line I-VII through school-house NE of BM 24." As illustrated in figure 29, themap template is placed on the map with origin point Iover BM 24 and pivoted until line I-VII coincides witha line drawn on the map from BM 24 through theschoolhouse symbol northeast of BM 24. The originpoint and reference point may be ground features onthe map given by map coordinates. Any Roman-numeral point can be used as an origin, and any lineconnecting the designated point with any otherRoman-numeral point can be used as a base line.
c. Point designation. Once the template is oriented,a point is designated by the letter of the square in whichit is located and by the number of the hole nearest it.For example, the building in the "U" square of figure29 is in the sixth column from the left and in the thirdrow from the bottom. Reading up the sixth column wecount 51, 52, 53. The building would be designated as"U 53."
d. Security considerations. This method of using themap template provides, in certain situations, a con-venient and rapid means of designating point locations.However, it should be emphasized that this method ofuse is; not intended to provide security. Before the tem-plate can be used for purposes of secrecy instructionsprepared by the Chief Signal Officer relative to thepreparation and use of keys must be consulted.
34. GEOGRAPHIC COORDINATES. a. General.Unlike grid coordinates which are given in linearmeasure such as yards, geographic coordinates arestated in degrees (°), minutes ('), and seconds ("). Tounderstand these coordinates, one must be familiar withthe line of latitude and longitude on the earth.
47

0000 0 2Il t5I 0 I ROAD'[~~~~~~ .00 JUNCTION
RJ00 .ATI9
9 o
Figure 29. Use of map tempiate Ml.
(1) The equator is an imaginary line round the earth
halfway between the North and South Poles (fig. 30).
48
0 00000 0
20 00
00ur29 4000 oo0ptmpatM
(1) The equao06
00a mgnr in on h at
(1)wa Tewe he equto i a iagnar lineh round the earth
48

Crossing the equator at regular intervals are north andsouth lines which pass through the poles. These areknown as meridians of longitude or simply meridians.One is marked zero and is called the prime meridian.From this prime meridian, longitude is measured botheast and west around the world. Lines east of the primemeridian are numbered from 0° to 1800, and are calledeast longitude. Lines west of the prime meridian arenumbered from 0° to 1800 and are called west longitude.The prime meridian on American and British maps isa line through Greenwich, England.
(2) Crossing the meridians in an east-west directionbetween the equator and both poles are the parallels of
7?,.o 75°
Figure 30. Geographic coordinates. Point A is latitude 40°00'00" N,longitude 15°00'00" E; point B is latitude 15°00'00" S, longitude30°00'00o E; point C is latitude 15°00'00" N, longitude 15°00'00" W.
49
latitude, called simply parallels. Starting at the equator,these are numbered from 0° to 900. Thus, the parallelhalfway between the equator and the North Pole is 450north latitude.
30' 38' 57' 122- 36'
2806
47' or
280
2800
l 804 7-04
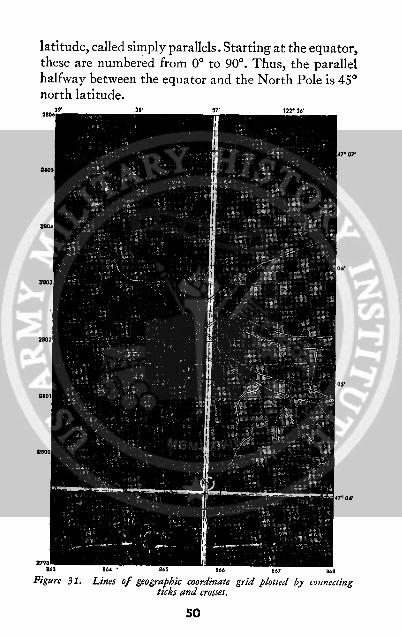
- oo ...... oo u/ 3h8Figure 31. Lines of geographic coordinate grid plotted by connecting
ticks and crosses.
50

b. Placing geographic coordinate grid on a map.(1) On most maps in common use, lines of latitude andlongitude curve so little they appear to be straightlines. American military maps usually locate lines oflatitude and longitude by ticks at the margins andcrosses within the map. For example, in grid square(67-99) on figure 31 there is a marginal tick marked47° 04'. Across the map horizontally to the left arethree crosses. A line drawn through the tick and thecrosses is parallel of latitude 470 04' N. Similar para-llels north of this one are indicated by ticks at 1'intervals. These ticks and crosses connected form theeast-west lines of a geographic grid system.
(2) Lines of longitude are indicated on the top marginof figure 31. In the grid square (67-05) there is a ticknumbered 122° 36' W. Vertically below this tick arefour crosses and another tick at the bottom margin.The vertical line through these is a meridian of longitude122° 36' W. Similar meridians west of this one are in-dicated by ticks at 1' intervals. If these ticks andcrosses are connected, the lines formed will completethe north-south geographic grid lines.
(3) On British maps the term "graticule" is usedinstead of "geographic grid."
c. Writing and reading geographic coordinates.Some American and British maps have parallels andmeridians printed as full lines. These are readily dis-tinguished from grid lines by their numbering. Linesof latitude and longitude are always numbered indegrees and minutes, and, if necessary, in seconds. Inlocating a point by latitude and longitude, N or Srepresents latitude, and E or W represents longitude,for example 47° 04' N, 122° 36' W. The general worldlocation of the area covered by a map is indicated bythe numbers on latitude and longitude lines. If the
51
latitude numbers increase from bottom to top on amap, the area is north of the equator; if they decrease,it is south. If the longitude numbers increase from leftto right, it is east of the prime meridian; if they de-crease, it is west. Applying these rules to figure 31, thearea covered by the map is north of the equator andwest of the prime meridian. In writing geographic co-ordinates, latitude is given first and parentheses areomitted. To illustrate, refer to RJ "A", grid coordinates(65.75-99.45), figure 31. The geographic coordinatesof this point are: latitude 470 04' 05" N, longitude 122037' 00" W.
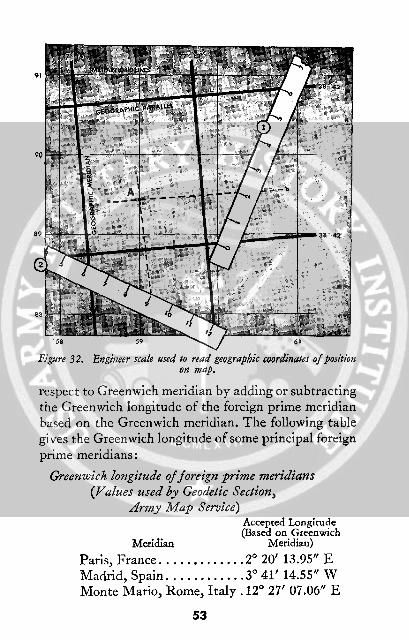
d. To find geographic coordinates of a point.Problem: to find the geographic coordinates of point Aon figure 32. The geographic grid interval is 1', andsince there are 60" to a minute the sides of the gridquadrangle must be divided into 60 equal parts. Tofind the latitude of point A, the engineer scale is placedacross the latitude lines so that 60 convenient divisionsspan the distance, position (. Each of the 60 divisionsrepresents 1" of latitude. Longitude is found with theengineer scale in position ®. The complete geographiccoordinates of point A are latitude 38° 42' 20" N.,longitude 770 13' 30" W. If the geographic grid intervalis 5', the sides of the quadrangle must be divided into300 equal parts.
35. GEOGRAPHIC COORDINATES ON FOREIGN MAPSa. Prime meridian. Many foreign maps do not use
the Greenwich meridian as a prime meridian. Forexample, French maps use the Paris meridian, andItalian maps the Rome meridian. Marginal data offoreign maps must be examined to determine the primemeridian used. Longitude measured from a foreignprime meridian may be converted to longitude with
52
89
'58 59 61)
Figure 32. Engineer scale used to read geographic coordinates of positionon map.
respect to Greenwich meridian by adding or subtractingthe Greenwich longitude of the foreign prime meridianbased on the Greenwich meridian. The following tablegives the Greenwich longitude of some principal foreignprime meridians:
Greenwich longitude of foreign prime meridians(Values used by Geodetic Section,
Army Map Service)Accepted Longitude(Based on Greenwich
Meridian Meridian)
Paris, France ............. 2 20' 13.95" EMadrid, Spain ............ 30 41' 14.55" WMonte Mario, Rome, Italy. 12° 27' 07.06" E
53

Batavia, Netherland EastIndies ................. 1060 48' 27.79" E
Padang, Sumatra, Nether-land East Indies ......... 1000 22' 01.42" E
Midden Meridian of SouthSumatra, Netherland EastIndies ................. 1030 33' 27.79" E
Ferro, Canary Islands ...... 17° 39' 46" E(170 40' 00" Eused by Germins)
Amsterdam, Netherlands...40 53' 05.45" ELisbon (Observatory of
Castelo de S. Jorge),Portugal ............... 9° 07' 54.806" W
Naval Observatory atGenoa, Italy ............ 8° 55' 15.929" E
Copenhagen, Denmark ..... 12 34' 40.35" EAthens, Greece ............ 230 42' 58.5" EHelsinki, Finland .......... 240 57' 16.5" EPulkovo (near Leningrad),
U.S.S.R ................ 300 19' 38.49" ESan Fernando, Spain ....... 6° 12' 17.43" WSingkawang, Borneo ....... 108 ° 59' 41" EIstanbul, Turkey .......... 280 58' 45.5" E
b. Grad. On most maps latitude and longitude aremeasured in degrees, minutes, and seconds, but theunit of measure on French maps is the grad. There are400 grads in a circle as compared to 360 degrees in a
360circle so a grad is 430 or .9 of a degree. The grad is
based on a decimal system, that is:1 grad = 100 minutes (')1 minute = 100 seconds (")
The angle 9.628 grads would be written 9%62'80"; sym-
54
bols for minutes and seconds, in this system, inclinefrom left to right.
c. Converting French geographic coordinates tostandard coordinates. Using a French map the mapreader locates a point, for example, latitude 3 9G 71' N,
longitude 03G 36' W. To convert to coordinates basedon the Greenwich meridian, proceed as follows:
First, grads are converted to degrees:39G 71' = 39.71G = (39.71 X .9) degrees
= 35.739003G 36' = 03.36G = (03.36 X .9) degrees
3.024 °
Second, decimals of degrees are converted tominutes and seconds:
35.739° = 350 44' 20.4", found as follows:
.7390 X 60 = 44.34'
.34' X 60 = 20.4"Similarly, 3.0240 = 3° 01' 26.4"
Based on Paris meridian, the coordinates of the point
are latitude 350 44' 20.4" N, longitude 30 01' 26.4" W.In this case the Paris meridian of 2° 20' 14" E must be
subtracted from 30 01' 26.4", to obtain longitude basedon Greenwich. Complete Greenwich coordinates arewritten latitude 350 44' 20.4" N, longitude 0° 41'12.4" W.
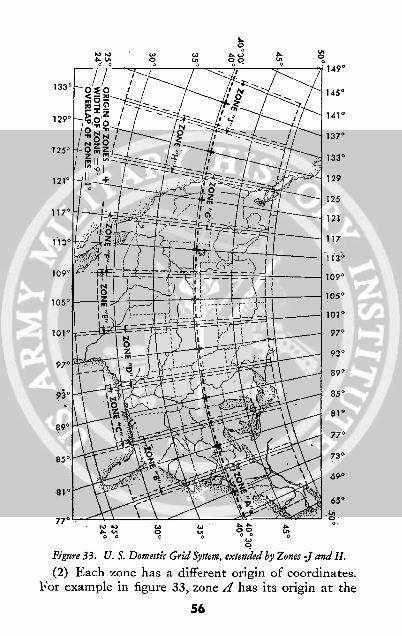
36. U. S. DOMESTIC GRID SYSTEM. a. General.(1) The grid system covering the United States is
called the "U. S. Domestic Grid." The country is
divided into seven lettered zones, A through G (fig. 33);zones H and 7 were added when the system was ex-panded to form the World Polyconic Grid. Each zone
extends through 90 of longitude which includes a 1°
overlap of adjacent zones (o20 on each side); the net
width of a zone is therefore 8° .
55
b.0
s0
1250°
. 0 00( C.,o
Figure 33. U. S. Domestic Grid System, extended by Zones -J and H.
(2) Each zone has a different origin of coordinates.For example in figure 33, zone A has its origin at the
56
intersection of central meridian 730 W with parallel400 30' N while zone B has its origin at the intersectionof central meridian 81° W and parallel 40° 30' N. At theorigin of each zone the north-south or vertical grid line(frequently called "Northing") is given an arbitraryvalue (frequently callec "false coordinate") of 1,000,000yards, and the east-west or horizontal grid line (fre.quently called "Easting") a value of 2,000,000 yards.This is done to avoid negative coordinates. A similargrid system covers Hawaii, Panama and the Philippines.
(3) The complete numerical value of the.horizontaland vertical grid lines whose ends are nearest the south-west corner of the map is written in the margin on anymap using this system. The last three ciphers are com-monly omitted from other grid-line values shown inthe margin, but occasionally where the 100- or 500-yardinterval is used complete numbers are shown on allgrid lines.
b. Identification. The U. S. Domestic Grid is identi-fied by a grid note printed in the map margin. Its formis .................... THO USAND YARD GRIDCOMPUTED FROM "Grid System for ProgressiveMaps in the U. S." ZONE..........U. S. C. & G. S.SPECIAL PUBLICATION NO. 59.Grid lines for this system are printed in black. OtherAmerican systems printed in black cover Hawaii,Panama, and the Philippines.
c. Map of area in overlap of two zones. On mapsof scale 1:125,000 and larger that lie in two zones, thegrid of one zone is shown in solid black lines, and thegrid of the other zone is indicated by ticks 0.3 inch longalong the border of the map. To use the grid of thesecond zone on these maps, draw in the grid lines byconnecting the ticks with dotted lines as shown infigure 34.
57

1650001970 000
Figure 34. Grid lines on a map where two zones overlap (ticks connectedby dotted lines).
d. Use. United States grid systems are used in thesame general way as explained in paragraph 34. Carefulattention to marginal notes on each map is essential.
37. WORLD POLYCONIC GRID. The World PolyconicGrid is an extension of the U. S. Domestic Grid Systemto cover parts of the world not gridded by the Britishand areas not previously gridded by the United States.The world is divided into five north-south divisionscalled "bands." Each band is made up of nine zones.The seven zones A to G in the U. S. Domestic GridSystem and the extension zones H and 7 comprise thetotal width of band I, from longitude 68° 30' W to1410 30' W. Band I, however, also takes in all the areabetween latitude 72° N and 72 ° S. Each band is divided
58

at the equator and designated, for example, as bandI-N for the north half and band I-S for the south half.Band II is west of band I and takes in the area fromlongitude 1400 30' W to 1460 30' E. Bands III, IV, andV are the next succeeding bands in a westerly direction.Each band is divided into nine standard size zoneslettered from A to 7 in the same way as band I. Figure35 shows an outline of the bands throughout the world.The blank portions are sections of the world coveredby some other type of grid and for most of which griddedmaps are available. World polyconic grid lines appearin purple on maps of scales smaller than 1:125,000;numbers and other pertinent detail are purple at allscales.
38. BRITISH GRID SYSTEM. a. General. Troops oper-ating in Europe, Africa, Australia, India, China, andmany islands of the South Pacific will use maps bearingBritish military grids. British grid systems subdividethe world into zones or belts identified by name andcolor, as: Northern European Zone III (Blue), EgyptPurple Belt, Egypt Red Belt, etc. Each of these gridshas a specific origin and the grid lines are usuallyprinted in the same color as the color designation of thearea on maps of scales 1:250,000 and 1:500,000; thus,grid lines on maps covering the Northern EuropeanZone III (Blue) appear in blue. The significance ofcolor, however, no longer applies always to grid designa-tion, but rather to grid differentiation on sheets carryingmore than one system.
b. Grid squares. (1) A grid zone is ordinarily di-vided into squares 500,000 meters on a side. This basicsquare is assigned a letter, the letters being alphabeticaland reading from left to right and down within a zone(fig. 36). Each 500,000-meter square is further divided
59
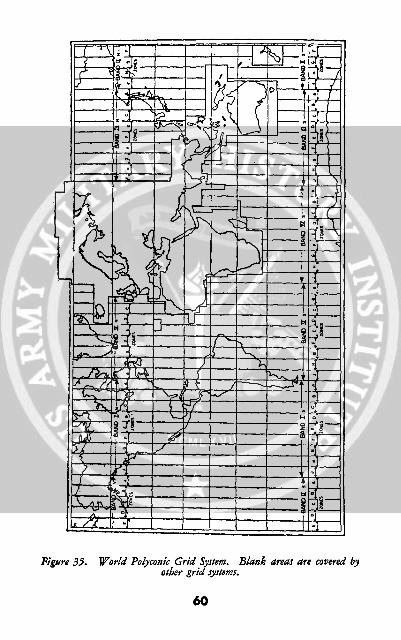
Figure 35. World Polyconic Grid System. Blank areas are covered byother grid systems.
60

into 100,000-meter squares each of which is also desig-nated by a letter. Thus a 100,000-meter square of azone may be identified by two letters. (See fig. 36.)However, some zones are so long that more than one500,000-meter square is assigned the same letter, whilein a few zones no letters are used.
(2) On maps of scales of 1:250,000 to 1:500,000, theletter indentifying the 500,000-meter square and the100,000-meter square letter are both shown on the faceof the map. Ordinarily on maps of scales larger than1:250,000, only the 100,000-meter square letters areshown, although the letter identifying the 500,000-metersquare may be indicated by a grid index diagram inthe margin.
(3) The frequency of the grid lines is controlled bythe scale of the map as follows:
Scales Interval
Larger than 1:5,000. .. .100 meters (or yards)1:5,000 to 1:100,000
inclusive ........... 1,000 meters (or yards)Smaller than 1:100,000
to 1:500,000 ........ 10,000 meters (or yards)
c. Reading grid coordinates. Point identificationby grid reference indicates, in order, the 500,000-metersquare, the 100,000-meter square, the abbreviated east-west (easting) coordinate, and the abbreviated north-south (northing) coordinate. The procedure is asfollows:
(1) Indicate the letter identifying the 500,000-metersquare, as shown directly on the face of the map or asindicated by the grid index diagram.
(2) Indicate the 100,000-meter square as shown onthe face of the map, normally by a large open blockletter printed in the same color as the grid lines.
61

500,000 meters
ABC D EF _R iK
Arrangement of500,000 meter squares s
10,000 meters
6-
3 PointdesignatedHV74 1
V0 1 2, 3 4 5 6 7 8 9 0
Enlargement of Square HVshowing 10,000 meter squares
100,000 meters
A B C D E
F C H J K
L M NJ-~ P
Q R. I T U
W XYZEnlargement of Square H
showing 100,000 meter squares
Figure 36. British Military Grid System.
62
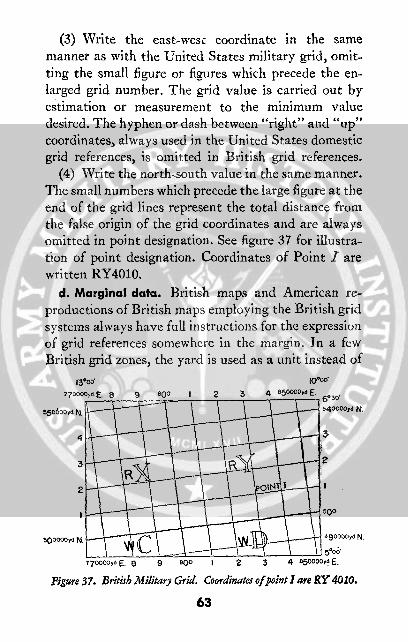
(3) Write the east-wesc coordinate in the samemanner as with the United States military grid, omit-ting the small figure or figures which precede the en-larged grid number. The grid value is carried out byestimation or measurement to the minimum valuedesired. The hyphen or dash between "right" and "up"coordinates, always used in the United States domesticgrid references, is omitted in British grid references.
(4) Write the north-south value in the same manner.The small numbers which precede the large figure at theend of the grid lines represent the total distance fromthe false origin of the grid coordinates and are alwaysomitted in point designation. See figure 37 for illustra-tion of point designation. Coordinates of Point I arewritten RY4010.
d. Marginal data. British maps and American re-productions of British maps employing the British gridsystems always have full instructions for the expressionof grid references somewhere in the margin. In a fewBritish grid zones, the yard is used as a unit instead of
I0°oo'
13oo'
770000yd E. 8
5500ooyd. N.
toooOyd N. \ - ¢ 490000yd N,
77ooo00yd E. 9 00o I 2 3 4 850ooo00yE.
Figure 37. British Military Grid. Coordinates of/point I are RY 4010.
63
the meter. The entire procedure in grid reference, how-ever, is identical in either case.
39. AIR DEFENSE GRID. The Air Defense Grid is design-ed to satisfy the requirements of world-wide air defenseand to permit easy transmission of accurate positionalinformation. The Air Defense Grid is based entirely onlines of longitude and latitude, and divides and sub-divides all the earth's surface from latitude 80 ° N and80° S in such a way as to keep the grid divisions andsubdivisions approximately square. This is accom-plished by changing the size of the grids in degrees andminutes of longitude several times between the equatorand the poles. The only large variations in shape occurbetween latitudes 72° and 80° N and S where the topof the grid lines converge considerably toward thepoles. Figure 38 illustrates the converging meridiansand successive changes in grid lengths. Complete in-formation on the Air Defense Grid can be found inTM 44-225.
40. FIRE-CONTROL GRID. A fire-control grid is a rec-tangular grid superimposed on a military map; onlarge-scale maps, the military grid serves as the fire-control grid. Grid interval is normally 1,000 yards.Fire-control grids must be accurate as to scale andazimuth. Fire-control maps are 1:25,000, but maps of.1:50,000 or larger are considered usable substitutes.Photographs or photomaps used for fire control requirethe same scales as for maps. The battle maps of theUnited States conform to the standard military gridsystem of the United States. Other military maps maybe provided with a standard grid for the particulartheater of operations or with an arbitrary grid used fora single map or for a limited area. When an arbitrary
64
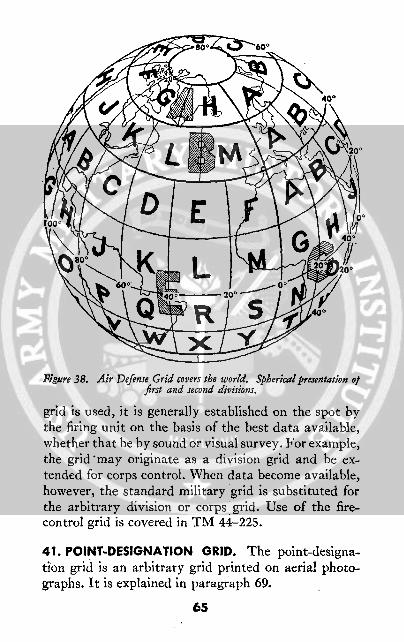
Figure 38. Air Defense Grid covers the world. Spherical presentation offirst and second divisions.
grid is used, it is generally established on the spot bythe firing unit on the basis of the best data available,whether that be by sound or visual survey. For example,the grid'may originate as a division grid and be ex-tended for corps control. When data become available,however, the standard military grid is substituted forthe arbitrary division or corps grid. Use of the fire-control grid is covered in TM 44-225.
41. POINT-DESIGNATION GRID. The point-designa-tion grid is an arbitrary grid printed on aerial photo-graphs. It is explained in paragraph 69.
65
SECTION VII
ELEVATION AND RELIEF
42. GENERAL. a. Most of the earth's geographicfeatures are the result of erosion, the wearing away byfreezing, thawing, and draining of water from high tolow ground. Relief is the variations in the elevations orheights of these features, such as ridges and valleys,hills and hollows, which divide terrain into two inter-locking systems. Small streams join to form largerstreams, and these join to make rivers, the whole net-work of water courses being known as a drainagesystem. Between the streams is high ground, the nosesand hills of which form a system of their own calledridge lines. Points of abrupt change in elevation orimportant change in direction of ridges or streams arecalled critical points.
b. Ground forms, then, must be measured verticallyas well as horizontally. The vertical distance is calledelevation and is usually measured in feet or metersabove mean sea level (plus elevation) or below sealevel (minus elevation). (See FM 21-25.)
c. There are three main systems by which mapsshow the rise and fall of the earth's surface. In order oftheir importance, these methods are contours, hachures,and the layer-tint system. Other methods include ap-proximate contours, form lines, or hill shading.
43. CONTOURS. a. General. Contour lines are drawnon maps to represent ground elevations. Each contourline passes through points which are exactly the sameheight above sea level. See FM 21-25 for a discussion of
66
contours. Contours have certain characteristics. Con-tours-
(1) Are smooth curves.(2) Are approximately V-shaped in narrow valleys
with the "V" pointing upstream.(3) Are generally shaped as "U's" pointing down
ridges.(4) Are shaped as an "M" just above stream junc-
tions.(5) Tend to parallel streams.(6) Tend to parallel each other, each approximating
the shape of the ones above and below it. This reflectsthe fact that changes in ground form are usuallygradual.
(7) Never cross or touch, except at overhanging orvertical cliffs and at waterfalls.
(8) Never fork.(9) Always close, on or off the map as indicated at
"f," hill 305, and "g," hill 430 in figure 39 (). Thecontour 400 leaves the map at O and returns to mapat ().
b. Depth curves. A contour showing points of equalelevation below the level of any body of water is calleda depth curve. These curves indicate depths below acertain point, usually mean-low-water level for thebody of water concerned. The vertical interval is fre-quently expressed in fathoms. One fathom is 6 feet.
44. HACHURES (fig. 40). The hachure method of re-presenting relief is used on the Strategic Map of theUnited States (scale 1:500,000) when relief data areinadequate to draw contours, and is frequently foundon large- as well as small-scale foreign maps. Hachuresare short parallel or slightly divergent lines drawn inthe direction of slopes. They are closely spaced on
67

O Perspective view with schematic position of contours.Figure 39.
steep slopes, wide apart on gentle slopes, and convergetoward the tops of ridges and hills.45. LAYER-TINT SYSTEM. In addition to contours andhachures, relief is shown on some maps by the layer-
68
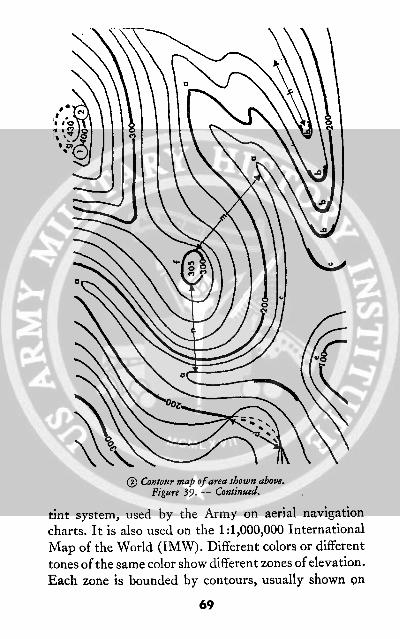
® Contour map of area shown above.Figure 39. - Continued.
tint system, used by the Army on aerial navigation
charts. It is also used on the 1:1,000,000 International
Map of the World (IMW). Different colors or different
tones of the same color show different zones of elevation.
Each zone is bounded by contours, usually shown on
69

the map; contours within the zones are sometimesshown. The map margin carries a key showing theelevation of zones according to color.
Figure 40. Hachure map.
46. RIDGE AND STREAM LINES. a. Purpose. To em-phasize high and low ground, a system known as ridgelining and stream lining is often used. On ridge-lined orstream-lined maps or aerial photographs, the mapreader neglects the great mass of detail to study keyfeatures. Three steps are followed in this process.
b. Stream lines. Study the map or aerial photo-graph and select the main streams and their tributaries.
70

Draw over them in blue; this makes the drainage sys-tem stand out. In figure 41, the streams are markedwith solid lines.
¥ I I_ ...
Figure 41. Contoured map with stream. and ridge-lining.
c. Ridge lines. Between the streams there must behigher ground or ridges. To emphasize this, draw lineson the map along the main ridges. These should be inbrown so as not to obscure underlying features. Thenselect the minor ridges and trace their ridge lines. The
number of minor ridges to be included depends on theemphasis desired. Do not carry the ridge lines all theway to the streams. Stop at the beginning of the floodplain as shown by the increase in space between con-tours. Ridge lines join in a systematic branchingstructure. In figure 41, ridge lines are marked withdotted lines.
71
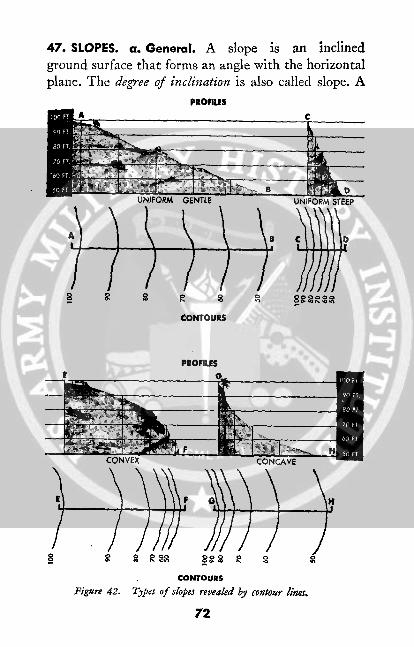
47. SLOPES. a. General. A slope is an inclinedground surface that forms an angle with the horizontalplane. The degree of inclination is also called slope. A
PROFILIS
MEA C
UNIFORM GENTLE UNIFORM STEEP
/ C.)-) 2 i.8 a 8 R S R asROoC
CONTOURS
PROFILES
_ _ L -_ ,
8
.CONVXA CONCAVE
0 a RSS 898 R 5S
CONTOURS
Figure 42. Types of slopes revealed by contour lines.
72
- Fd' --~~~~~_

knowledge of slope is important in selecting routes forthe movement of units, in siting CP's and OP's and inchoosing good fields of fire and areas defiladed fromenemy fire. The trained map reader can visualize theslope of the ground by referring to contour lines onthe map.
b. Types (fig. 42). There are three types of slopes:uniform, concave, and convex.
(1) Uniform slope. A uniform slope is a smooth slopewith equally spaced contours. On a steep, uniform slopethe contours are equally and closely spaced; on a gentle,uniform slope the contours are equally spaced but farapart.
(2) Concave slope. This slope is caved-in; contoursare close together at the top and far apart at the bottom.
(3) Convex slope. This slope is humped up; contoursare spaced far apart at the top of the slope and closetogether at the bottom.
c. Slope in percent. The most common way to ex-press slope is in percent. A 1% slope rises or descends1 unit in a horizontal distance of 100 units; a slope of10% rises or descends 10 feet in a 100 feet. Thus, infigure 43, line XY represents a slope. If the horizontaldistance from X to Y is 100 feet and the vertical dis-
tance at Y is 10 feet, the slope of XY = -o or .1. To
change .1 to percent multiply by 100 = 10%. Thus theformula for slope in percent is:
Vertical distance X 100 - slope in percentHorizontal distance
The horizontal distance is scaled from the face of a map;the vertical distance is the difference in elevation of thetwo points and may be interpolated from a contour map.A rising slope is plus and a descending slope is minus;
73

Y
Figr 4. xpresion DA s oeFT.
-- 100 FT.HORIZONTAL DISTANCE - 4
Figure 43. Expression of slope.
that is, the slope from X to Y is + 10%, but from Y toX is - 10%. For example, in figure 44, the problem isto find the slope between A and B. First measure thehorizontal distance, 220 feet. Determine the verticaldistance by subtracting the elevation of X from B. Therise is 559 minus 530 or 29 feet. The slope is:
Line ofI average
I slope 29 ftI ground I in elevation
Al____ surface
i$-rn-rn:r- 220 ft -,I Horizontal distance I
Figirea 44. Slope interpreted from contour map
74
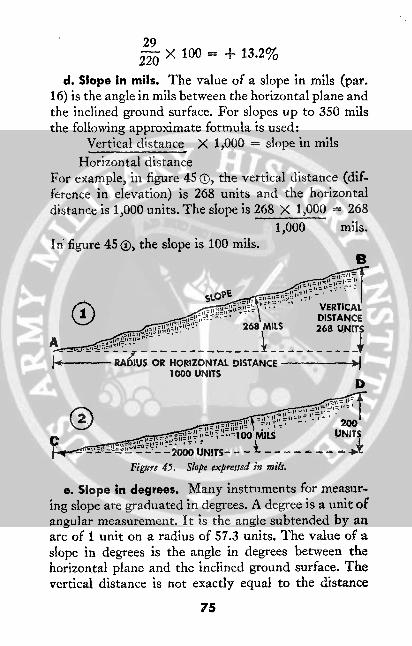
29220 X 100 = + 13.2%
d. Slope in mils. The value of a slope in mils (par.16) is the angle in mils between the horizontal plane andthe inclined ground surface. For slopes up to 350 milsthe following approximate formula is used:
Vertical distance X 1,000 = slope in mils
Horizontal distanceFor example, in figure 45 (, the vertical distance (dif-ference in elevation) is 268 units and the horizontaldistance is 1,000 units. The slope is 268 X 1,000 = 268
1,000 mils.In figure 45 ®, the slope is 100 mils.
B
- -- RADIUS OR HORIZONTAL DISTANCE ->1000 UNITS
D
Figure 45. Slope expressed Sn mils.
eignre 45. Slope expressed in mils.
e. Slope in degrees. Many instruments for measur-ing slope are graduated in degrees. A degree is a unit ofangular measurement. It is the angle subtended by anarc of 1 unit on a radius of 57.3 units. The value of aslope in degrees is the angle in degrees between thehorizontal plane and the inclined ground surface. Thevertical distance is not exactly equal to the distance
75

along the arc, but for slopes up to 200 the variations arenegligible and may be disregarded. The formula forslope in degrees is:
Vertical distance X 57.3 = slope in degrees
Horizontal distanceFor example, in figure 46 0, the vertical distance is 16units and the horizontal distance is 76.4 units. Slopein degrees is:
1676.4 X 57.3 = 12°
In figure 460(, the slope in degrees is:15 X 57.3
_ 7.5°114.6
F
12' WSTANCE 016 UNITS
|H*-- RADIUS OR HORIZONTAL DISTANCE76.4 UNITS
H
7UNITS
.... ' ~ -- 14.6 UNITS J- --- -- --....
Figure 46. Slope expressed in degrees.
f. Grade. The elevation of the surface of roads andrailroad lines is referred to as grade. The degree of in-clination as compared with the horizontal is also calledgrade; it is usually given as percent slope and is cal-culated as described in c above.
g. Gradient. The rate of inclination from the hori-zontal is called gradient. It is expressed either as the
76

Kit~) K1 ~rl'~~~1.
i.,, HORIZONTAL DISTANCE --5000 FT.
N
15FT,
}j~ , 15 FTl - i
Figure 47. Slope expressed as gradient.
ratio of vertical to horizontal or horizontal to verticaldistance. Hydraulic gradient is usually expressed as:
VerticalHorizontal
For example, a stream in figure 47 ( has a vertical fallof 1 foot in a horizontal distance of 5,000 feet and has a
1gradient of 1 to 5,000 sometimes written as 5,0-O or
1:5,000, or 1 in 5,000. The side slopes of earth fills orexcavations are usually expressed as:
Horizontal
VerticalFor example, the face of an earth fill in figure 47 ® rises5 feet in a horizontal distance of 15 feet. Its slope usuallyis expressed as 3 to 1, 3:1, or 3/1. To avoid misunder-standing when expressing slopes by rates, it is advisablealways to state whether the slope is expressed as vertical
77
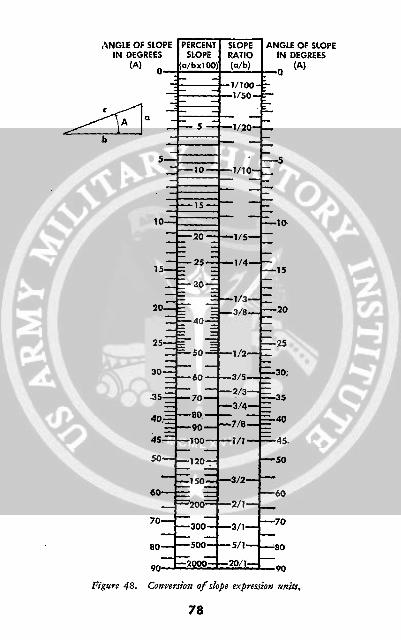
ANGLE OF SLOPEIN DEGREES
(A)
a -
.b
5-
to-Z10-
25-
-4
40,
60
70
80
90
PERCENTSLOPE
(a/bxl 00
-5-
10-
15-
20-
25-
30 -
40 _
50-=
60-
70-
80-90-1 00-
120
1 50
=200=
-300
-500
-2000
SLOPERATIO(a/b)
-1/100--1/50-
-1/20-
-1/10-
-1/4-
-1/3-
-3/8-
-1/2-
-3/5-
-2/3-
-3/4-
-7/8-
-1/1 -
-3/2-
-2/1-
-3/1-
-5/1-
-20/1-
ANGLE OF SLOPEIN DEGREES
_0 (A)
..-
5
10
15
20
25
30;
35
40
45.
50
-60
-70
-80
-90
Figure 48. Conversion of slope expression units.,
78
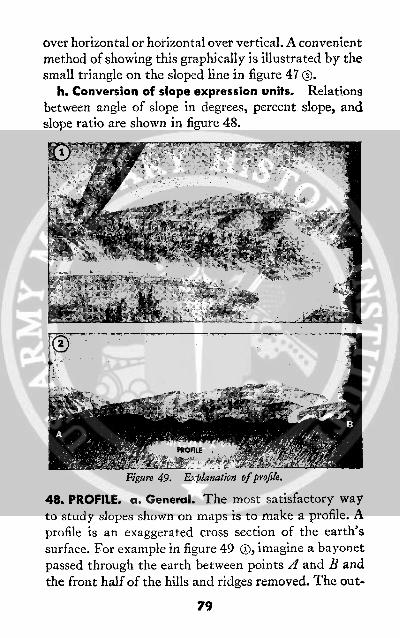
over horizontal or horizontal over vertical. A convenientmethod of showing this graphically is illustrated by thesmall triangle on the sloped line in figure 47 ®.
h. Conversion of slope expression units. Relationsbetween angle of slope in degrees, percent slope, andslope ratio are shown in figure 48.
uplanation of profite.
48. PROFILE. a. General. The most satisfactory wayto study slopes shown on maps is to make a profile. Aprofile is an exaggerated cross section of the earth'ssurface. For example in figure 49 Q, imagine a bayonetpassed through the earth between points .4 and B andthe front half of the hills and ridges removed. The out-
79
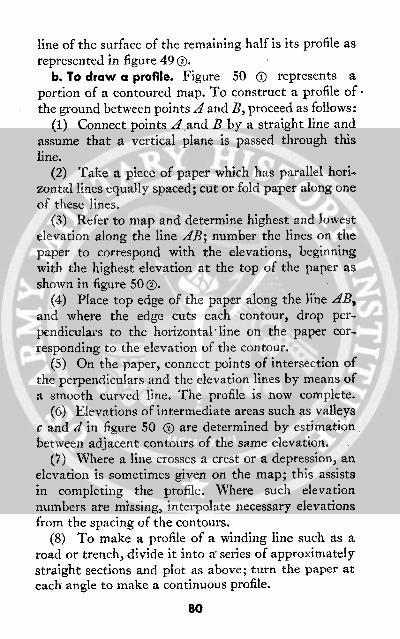
line of the surface of the remaining half is its profile asrepresented in figure 49 ®.
b. To draw a profile. Figure 50 O represents aportion of a contoured map. To construct a profile of-the ground between points A and B, proceed as follows:
(1) Connect points A and B by a straight line andassume that a vertical plane is passed through thisline.
(2) Take a piece of paper which has parallel hori-zontal lines equally spaced; cut or fold paper along oneof these lines.
(3) Refer to map and determine highest and lowestelevation along the line .B; number the lines on thepaper to correspond with the elevations, beginningwith the highest elevation at the top of the paper asshown in figure 50 (.
(4) Place top edge of the paper along the line AB,and where the edge cuts each contour, drop per-pendiculars to the horizontal line on the paper cor-responding to the elevation of the contour.
(5) On the paper, connect points of intersection ofthe perpendiculars and the elevation lines by means ofa smooth curved line. The profile is now complete.
(6) Elevations of intermediate areas such as valleysc and d in figure 50 ® are determined by estimationbetween adjacent contours of the same elevation.
(7) Where a line crosses a crest or a depression, anelevation is sometimes given on the map; this assistsin completing the profile. Where such elevationnumbers are missing, interpolate necessary elevationsfrom the spacing of the contours.
(8) To make a profile of a winding line such as aroad or trench, divide it into a"series of approximatelystraight sections and plot as above; turn the paper ateach angle to make a continuous profile.
80
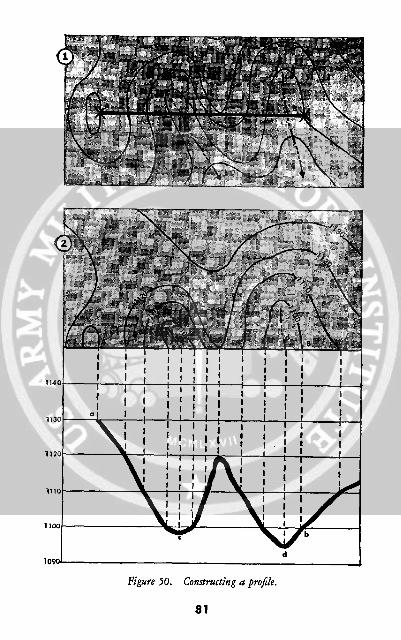
II
Figure 50. Constructing a profile.
81
(
I i II I
l I
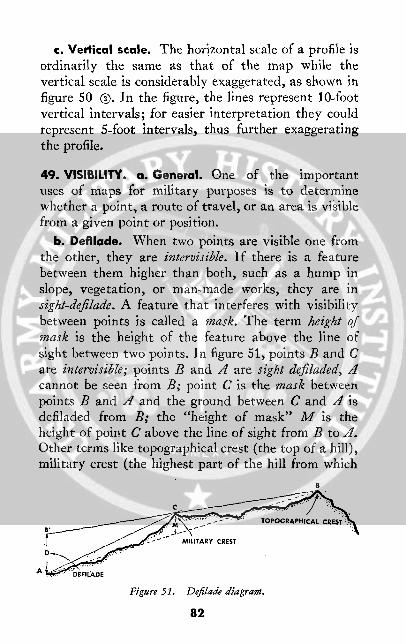
c. Vertical scale. The horizontal scale of a profile isordinarily the same as that of the map while thevertical scale is considerably exaggerated, as shown infigure 50 ®. In the figure, the lines represent 10-footvertical intervals; for easier interpretation they couldrepresent 5-foot intervals, thus further exaggeratingthe profile.
49. VISIBILITY. a. General. One of the importantuses of maps for military purposes is to determinewhether a point, a route of travel, or an area is visiblefrom a given point or position.
b. Defilade. When two points are visible one fromthe other, they are intervisible. If there is a featurebetween them higher than both, such as a hump inslope, vegetation, or man-made works, they are insight-defilade. A feature that interferes with visibilitybetween points is called a mask. The term height ofmask is the height of the feature above the line ofsight between two points. In figure 51, points B and Care intervisible; points B and A are sight defiladed, Acannot be seen from B; point C is the mask betweenpoints B and A and the ground between C and A isdefiladed from B; the "height of mask" M is theheight of point C above the line of sight from B to A.Other terms like topographical crest (the top of a hill),military crest (the highest part of the hill from which
R
MILITARY CREST
Figure 51. Defilade diagram.
82
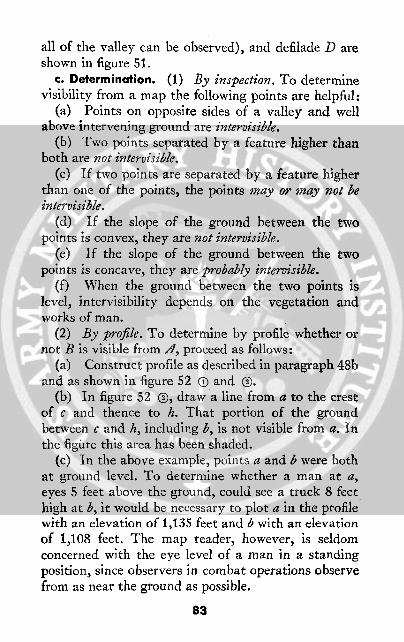
all of the valley can be observed), and defilade D areshown in figure 51.
c. Determination. (1) By inspection. To determinevisibility from a map the following points are helpful:
(a) Points on opposite sides of a valley and wellabove intervening ground are intervisible.
(b) Two points separated by a feature higher thanboth are not intervisible.
(c) If two points are separated by a feature higherthan one of the points, the points may or may not beintervisible.
(d) If the slope of the ground between the twopoints is convex, they are not intervisible.
(e) If the slope of the ground between the twopoints is concave, they are probably intervisible.
(f) When the ground between the two points islevel, intervisibility depends on the vegetation andworks of man.
(2) By profile. To determine by profile whether ornot B is visible from A, proceed as follows:
(a) Construct profile as described in paragraph 48band as shown in figure 52 (i) and ®.
(b) In figure 52 ®, draw a line from a to the crestof c and thence to h. That portion of the groundbetween c and h, including b, is not visible from a. Inthe figure this area has been shaded.
(c) In the above example, points a and b were bothat ground level. To determine whether a man at a,eyes 5 feet above the ground, could see a truck 8 feethigh at b, it would be necessary to plot a in the profilewith an elevation of 1,135 feet and b with an elevationof 1,108 feet. The map reader, however, is seldomconcerned with the eye level of a man in a standingposition, since observers in combat operations observefrom as near the ground as possible.
83
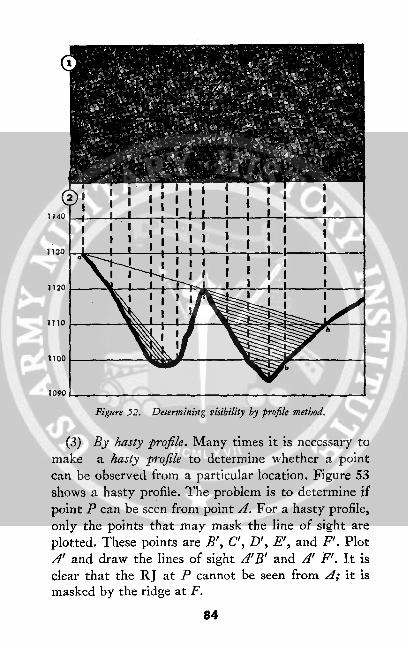
1140 : - -
I !1130 I I I
1120
1100
1090
Figure 52. Determining visibility by profile method.
(3) By hasty profile. Many times it is necessary tomake a hasty profile to determine whether a pointcan be observed from a particular location. Figure 53shows a hasty profile. The problem is to determine ifpoint P can be seen from point A. For a hasty profile,only the points that may mask the line of sight areplotted. These points are B', C', D', E', and F'. PlotA' and draw the lines of sight A'B' and A' F'. It isclear that the RJ at P cannot be seen from A; it ismasked by the ridge at F.
84
I;
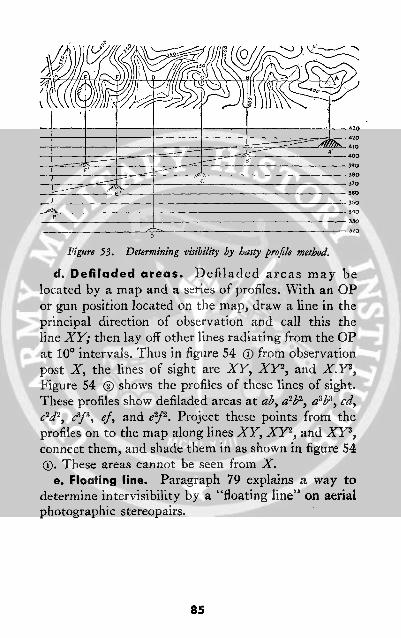
Figure 53. Determining visibility by hasty profile method.
d. Defiladed areas. Defiladed areas may belocated by a map and a series of profiles. With an OPor gun position located on the map, draw a line in theprincipal direction of observation and call this theline XY; then lay off other lines radiating from the OPat 100 intervals. Thus in figure 54 O from observationpost X, the lines of sight are XY, XY2, and X.Y3,Figure 54 () shows the profiles of these lines of sight.These profiles show defiladed areas at ab, a2b2, a3b3, cd,c2d2, c3f3, ef, and e2f2. Project these points from theprofiles on to the map along lines XY, XY2, and XY3,connect them, and shade them in as shown in figure 54®. These areas cannot be seen from X.
e. Floating line. Paragraph 79 explains a way todetermine intervisibility by a "floating line" on aerialphotographic stereopairs.
85
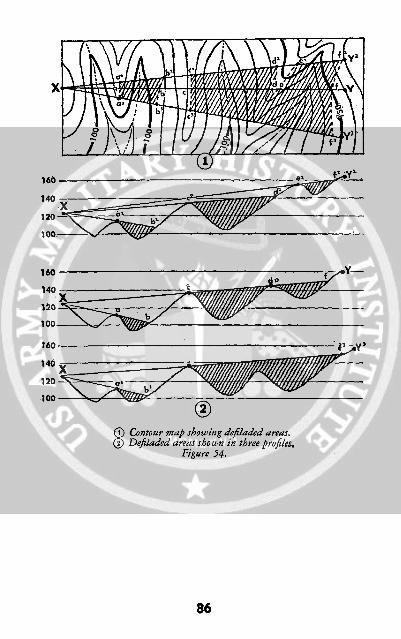
160
140-
~..'110
100 'W"
160 .
140
120 A100~~~6
) Contour map showing deftladed areas.Q() Defiladed areas shown in three profiles.
Figure 54.
86
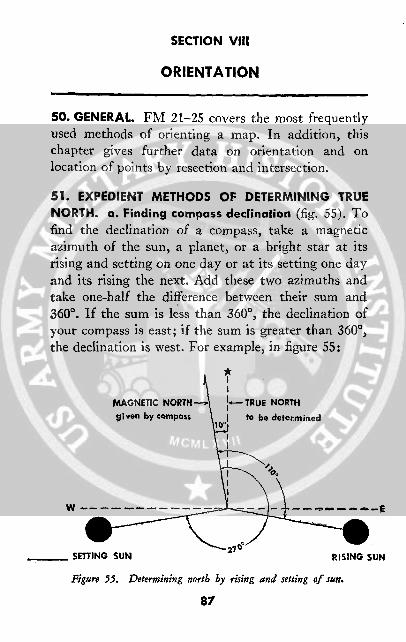
SECTION VIII
ORIENTATION
50. GENERAL. FM 21-25 covers the most frequentlyused methods of orienting a map. In addition, thischapter gives further data on orientation and onlocation of points by resection and intersection.
51. EXPEDIENT METHODS OF DETERMINING TRUENORTH. a. Finding compass declination (fig. 55). Tofind the declination of a compass, take a magneticazimuth of the sun, a planet, or a bright star at itsrising and setting on one day or at its setting one dayand its rising the next. Add these two azimuths andtake one-half the difference between their sum and360°. If the sum is less than 3600, the declination ofyour compass is east; if the sum is greater than 360°,the declination is west. For example, in figure 55:
MAGNETIC NORTH -- TRUE NORTHgiven by compass to be determined
SETTING SUN ISINGSETTING SUN RISING $
Figure 55. Determining north by rising and setting of sun.
87
UN

Magnetic azimuth of rising sun ..... 1100Magnetic azimuth of setting sun... .270 °
The sum ................... 380°
The difference between this sum(3800) and 3600 is ................. 20 °
Take half of this difference, whichis ................. ......... 10°
Magnetic declination is 10° and it is a west declinationbecause the sum of the azimuths is greater than 360° .
Compass readings should be taken when the celestialbody is just above the horizon or at a gradient ofzero. If this cannot be done, obtain both the risingand setting reading at the same gradient. The gradientmay be determined by a clinometer. When a star isused, choose one which rises nearly east of the pointof observation. Points from which observations aretaken must be within 10 miles of each other.
b. Sun and plumb line method. In the north tem-perate zone, true north can be found by the followingmethod. On level ground, lean a pole in the generaldirection of north as shown in figure 56. Suspend aweight from the end of the pole so it nearly touchesthe ground. Drive a peg a in the ground under theweight. About one hour before noon, attach a piece ofstring to the peg, and attach a sharpened stick to theother end of the string. The length of the string ab isthe distance from the peg a under the weight to theshadow of the tip of the pole b. Drive a peg under theshadow of the tip of the pole at b; with the sharpenedstick, draw an arc bcd on the ground. About 1 hourafter noon the shadow of the tip of the pole will againcross the arc at d. Drive a peg at this point and tie astring between the two pegs bd on the arc. Drive a pegdt e halfway between b and d or divide the arc bed
88

Figure 56. Determining north by sun and plumb line.
into two equal parts at f. For practical purposes, truenorth is in the direction of the line aef. In the southtemperate zone the same procedure is used but theline aef points south.
52. LOCATION OF DISTANT POINT BY INTERSECTION.a. With compass and protractor. Distant or inac-
cessible objects can be located on a map by inter-secting lines from two points of known position. Forexample, to find the enemy gun position shown infigure 57 O, compass readings are taken from CR 685and RJ 573. The readings of 46° and 3330 are con-verted to grid azimuth and plotted on the map witha protractor. The intersection of the plotted linesmarks the location of the enemy's piece, as shown infigure 57 0.
b. Graphic method. The gun can also be locatedgraphically, as shown in figure 58. AT RJ 573, theobserver orients his map by compass or by inspection,
89
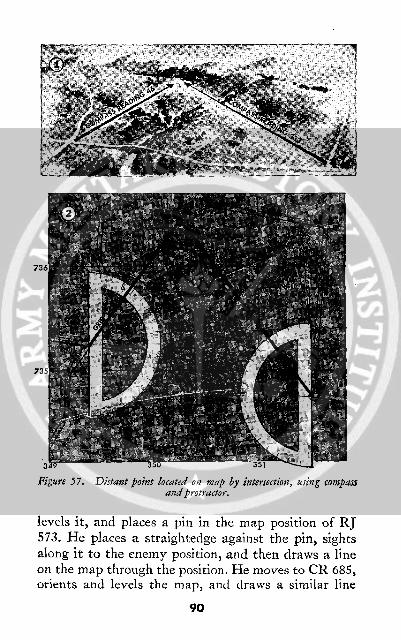
736
Figure 57. Distant point located on map by intersection, using compassand protractor.
levels it, and places a pin in the map position of RJ573. He places a straightedge against the pin, sightsalong it to the enemy position, and then draws a lineon the map through the position. He moves to CR 685,orients and levels the map, and draws a similar line
90

Figure 58. Distant point located on map by intersection (graphic method).
from CR 685. The intersection of the two lines locatesthe enemy position on the map.
53. RESECTION. Resection is a method to locate one'sown position on the map.
a. Resection with compass. In figure 59 0, theproblem is for the men in the forward OP to locatethemselves on the map in figure 59 0. Compassreadings are taken from the OP to RJ 171 (323 °) andto CR 162 (340), which can be identified and located onthe map. To plot this on the map the compass readingsmust be converted to back azimuth and then to gridazimuth. The forward magnetic azimuth of line "OP-RJ 171" is 332° , and the back magnetic azimuth is332 ° minus 180°, or 1520. To find the grid azimuth theG-M angle 90 is subtracted; the answer is 143 ° gridazimuth. This procedure is repeated for line "OP-CR 162." The intersection of these lines is the locationof the observation post. Location of the position isdetermined by reading two angles and plotting twolines.
b. Resection with map. Another method is to stickpins in the map positions of RJ 171 and CR 162 (fig.
91
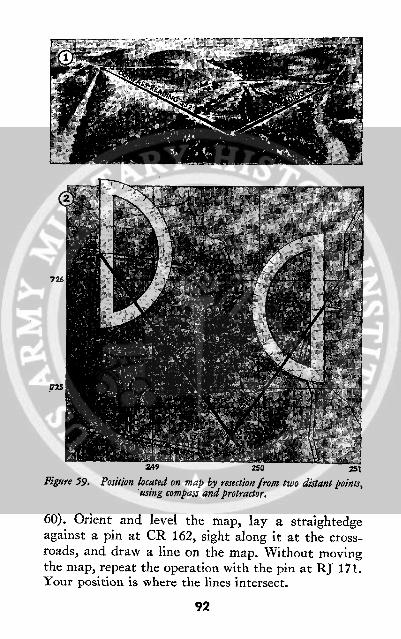
Figure 59. Position located on map by resection from two distant points,using compass and protractor.
60). Orient and level the map, lay a straightedgeagainst a pin at CR 162, sight along it at the cross-roads, and draw a line on the map. Without movingthe map, repeat the operation with the pin at RJ 171.Your position is where the lines intersect.
92
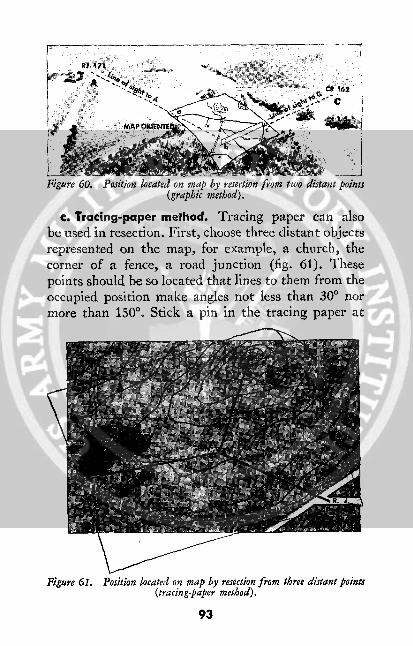
7
Figure 60. Position located on map by resection from two distant points(graphic method).
c. Tracing-paper method. Tracing paper can alsobe used in resection. First, choose three distant objectsrepresented on the map, for example, a church, thecorner of a fence, a road junction (fig. 61). Thesepoints should be so located that lines to them from theoccupied position make angles not less than 30° normore than 150°o Stick a pin in the tracing paper at
Figure 61. Position located on map by resection from three distant points(tracing-paper method).
93
any convenient assumed position of the observer,place a straightedge against the pin, sight at each ofthe three objects in turn without moving the tracingpaper, and draw a line toward each object from thepin. Lay the tracing paper on your map and move itaround until each line passes through the conventionalsight representing the object toward which it wassighted. Now, the pinhole in the paper is directly overyour position on the map. The three-point resectionshould, if possible, be made on points which form atriangle containing the position sought.
94
SECTION IX
AERIAL PHOTOGRAPHS
54. GENERAL. Aerial photographs are used for manydifferent purposes in military operations. In thismanual they are considered principally in conjunctionwith or as substitutes for topographic maps. The idealsituation is to have an accurate topographic map anda recent aerial photograph or accurate photomap of thesame area. A topographic map even a few years oldcan give a false picture of terrain because it showsconditions which existed when the surveys were made.Moreover on topographic maps, forest and woods arerepresented by their conventional signs regardless oftheir density; cultivated fields cannot be interpretedor recognized; and newly constructed roads, highwaysand bridges, and changes in features of the terrain dueto storms, floods, and military operations are notindicated. A properly interpreted recent aerial photo-graph, however, shows all the above information andmore. In fact, aerial photographs usually supply theonly up-to-date map information available during thefirst few weeks of an operation in enemy territory.Photographs are used to determine distances anddirections and to select routes in much the samemanner as ordinary topographic maps are used. SeeFM 21-25 and TM 5-246 for interpretation of aerialphotographs.
55. TYPES. The three general types of aerial photo-graphs are vertical, oblique, and composite.
a. Vertical. Vertical photographs are taken withthe axis of the camera perpendicular to the earth.
95
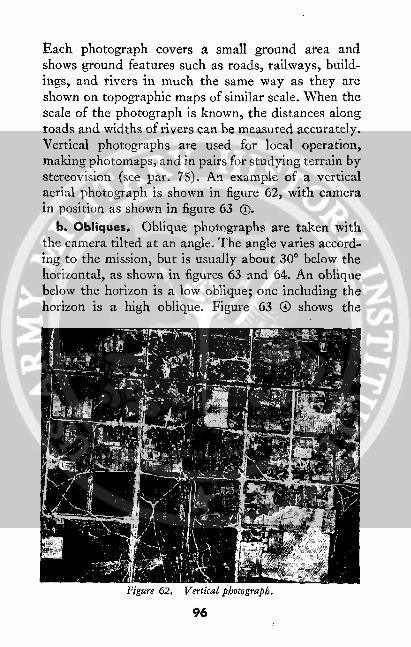
Each photograph covers a small ground area andshows ground features such as roads, railways, build-ings, and rivers in much the same way as they areshown on topographic maps of similar scale. When thescale of the photograph is known, the distances alongroads and widths of rivers can be measured accurately.Vertical photographs are used for local operation,making photomaps, and in pairs for studying terrain bystereovision (see par. 75). An example of a verticalaerial photograph is shown in figure 62, with camerain position as shown in figure 63 (D.
b. Obliques. Oblique photographs are taken withthe camera tilted at an angle. The angle varies accord-ing to the mission, but is usually about 300 below thehorizontal, as shown in figures 63 and 64. An obliquebelow the horizon is a low oblique; one including thehorizon is a high oblique. Figure 63 ® shows the
Figure 62. Vertical photograph.
96
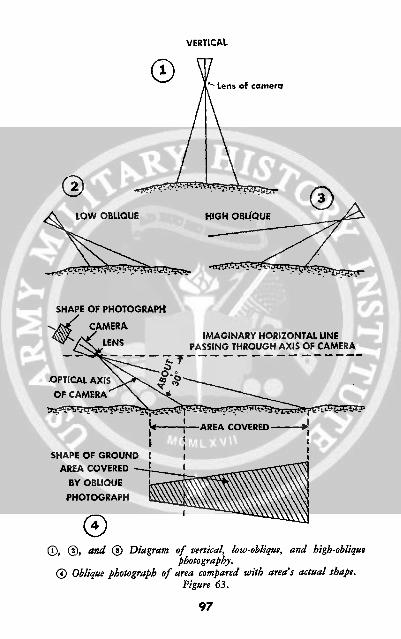
0VERTICAL
Lens of camera
LOW OBLIQUE HIGH OBLIQUE
SHAPE OF PHOTOGRAPH
CAMERAIMAGINARY HORIZONTAL LINE
LENS PASSING THROUGH AXIS OF CAMERA
--. .......----- …........OPTICAL AXIS ;OF CAMERA
,Ir- , - AREA COVERED
I IISHAPE OF GROUND I I
AREA COVERED I ;<BY OBLIQUE
PHOTOGRAPH \\\\\\\\\\\\\\\\\\\\
(0, 0, and ( Diagram of vertical, low-oblique, and high-obliquephotography.
( Oblique photograph of area compared with area's actual shape.Figure 63.
97
4
98
99
relationship between the trapezoid ground areacovered by an oblique photograph and the rectangularshape of the photograph itself. Distances on obliquephotographs cannot be accurately scaled, but sinceobliques are taken from a view point similar to thatof an observer on a high hill, terrain features have amore normal appearance than they do in a verticalpicture. This makes obliques useful for studying terrain,vegetation, buildings, and other features indentifiedby their elevations. Obliques may accompany opera-tions or field orders. As in figure 66, the line of de-parture, routes from bivouac to assault positions,assembly positions, objectives, boundaries betweenunits, and information of the enemy, can be shown.
c. Composites. Composite aerial photographs aremade with cameras having one principal lens and twoor more surrounding and oblique lenses. The photo-graphs resulting from these cameras are combinationsof two, four, or eight obliques surrounding one vertical.These oblique photographs are corrected or trans-formed in plotting so as to permit assembly as verticalswith the same scale. The air corps type T-3A five-lenscamera may be used, but this system is being supersededby the new trimetrogon system which comprises threecameras operated simultaneously. For further informa-tion, see paragraph 25, TM 5-230.
56. PIN POINTS. Pin-point photographs are single ver-tical photographs, usually of large scale. Such featuresas airdromes, supply depots, dumps, road crossings,bridges, or bottlenecks on lines of communication aresuitable objects for pin-point photographs. Adjacentpin-point photographs having proper overlap com-prise a stereopair (see par. 75).
100
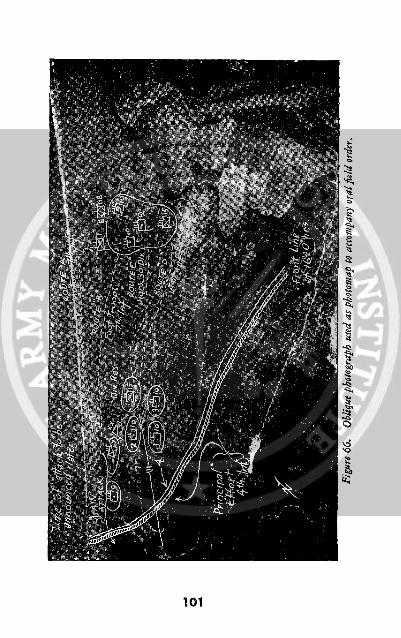
B
Aa'I
21a
p
X
Xa
zz181D~E
-Q
101
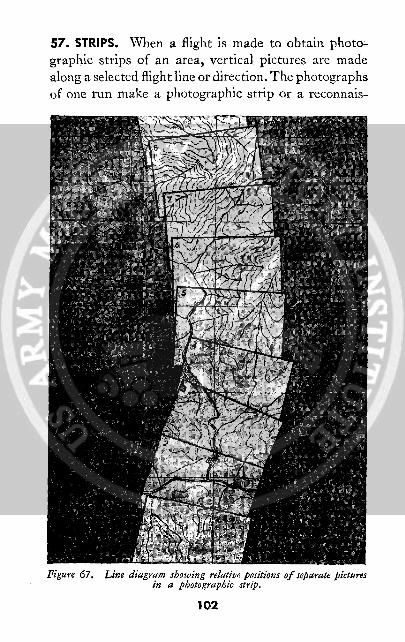
57. STRIPS. When a flight is made to obtain photo-graphic strips of an area, vertical pictures are madealong a selected flight line or direction. The photographsof one run make a photographic strip or a reconnais-
Figure 67. Line diagram showing relative positions of separate picturesin a photographic strip.
102
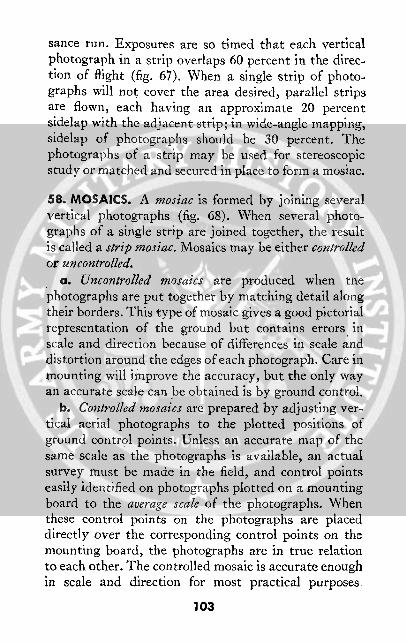
sance run. Exposures are so timed that each verticalphotograph in a strip overlaps 60 percent in the direc-tion of flight (fig. 67). When a single strip of photo-graphs will not cover the area desired, parallel stripsare flown, each having an approximate 20 percentsidelap with the adjacent strip; in wide-angle mapping,sidelap of photographs should be 30 percent. Thephotographs of a strip may be used for stereoscopicstudy or matched and secured in place to form a mosiac.
58. MOSAICS. A mosiac is formed by joining severalvertical photographs (fig. 68). When several photo-graphs of a single strip are joined together, the resultis called a strip mosiac. Mosaics may be either controlledor uncontrolled.
a. Uncontrolled mosaics are produced when tlephotographs are put together by matching detail alongtheir borders. This type of mosaic gives a good pictorialrepresentation of the ground but contains errors inscale and direction because of differences in scale anddistortion around the edges of each photograph. Care inmounting will improve the accuracy, but the only wayan accurate scale can be obtained is by ground control.
b. Controlled mosaics are prepared by adjusting ver-tical aerial photographs to the plotted positions ofground control points. Unless an accurate map of thesame scale as the photographs is available, an actualsurvey must be made in the field, and control pointseasily identified on photographs plotted on a mountingboard to the average scale of the photographs. Whenthese control points on the photographs are placeddirectly over the corresponding control points on themounting board, the photographs are in true relationto each other. The controlled mosaic is accurate enoughin scale and direction for most practical purposes,
103
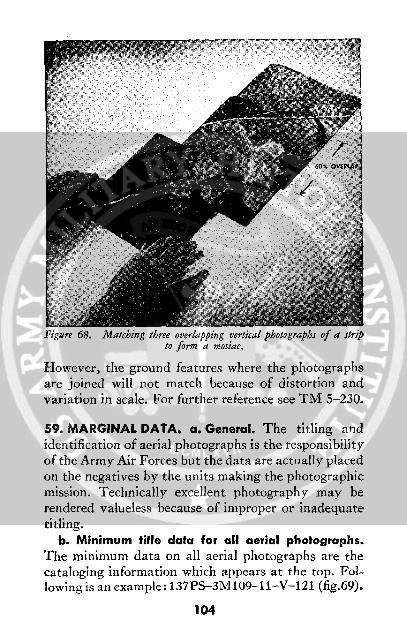
Matching three overlapping vertical photographs of a stripto form a mosiac.
However, the ground features where the photographsare joined will not match because of distortion andvariation in scale. For further reference see TM 5-230.
59. MARGINAL DATA. a. General. The titling andidentification of aerial photographs is the responsibilityof the Army Air Forces but the data are actually placedon the negatives by the units making the photographicmission. Technically excellent photography may berendered valueless because of improper or inadequatetitling.
b. Minimum title data for all aerial photographs.The minimum data on all aerial photographs are thecataloging information which appears at the top. Fol-lowing is an example: 137PS-3M109-11-V-121 (fig.69).
104

(1) 137PS. Photograph made by 137th Photo Recon-naissance Squadron USAAF.
(2) 3M109. The year is 1943, indicated by the fourthdigit of the calendar year, that is, 3 for 1943. The letterM stands for mission, 109 for the mission number.
(3) 11-V. Eleven (11) is the roll number; V meansthe camera was in a vertical position. Negatives fromcameras used in the trimetrogon assembly indicate thepositions of the cameras by having in their marginaldata, the letters L for left camera, V for vertical camera,and R for the right camera. Negatives from the five-lens camera are numbered as follows with D closest tothe front of the airplane:
DABC
E
Letters A, C, D, and E are obliques, while B is avertical.
(4) 121. The negative number is 121. Negatives arenumbered consecutively starting with 1.
c. Additional title data to be placed on photographsused for intelligence and interpretation purposes.The following data are added to the cataloging infor-mation and are the minimum data required on photo-graphs used for intelligence and interpretation purposes.Thus immediately following 137PS-3M109-11V-121are the data, 12:28:1330-12:20000-V-842S14826E-Buna New Guinea-Confidential. The explanation isas follows:
(1) 12:28:1330. Date and hour, 28 December at 1330.(2) 12:20000. Focal length of the camera, 12 inches,
and altimeter reading, 20,000 feet. If possible, altimeterreading should be adjusted to give height of plane aboveterrain photographed.
105

(3) V. V for vertical. If, however, the photographwere an oblique made with the camera tilted 45° fromthe vertical, it would read 0-45°.
(4) 842S14826E. Geographic coordinates of thecenter of the photograph to the nearest minute: 80 42'south latitude, 148° 26' east longitude.
(5) Buna, New Guinea. Descriptive title, includingthe locality and country or island group.
(6) Confidential. Security classification; only con-fidential and secret classifications are shown.
d. Further titling data for continuous strip mapping,charting and reconnaissance photography. In addi-tion to the minimum titling that appears on all photo-graphs, other data are added to the key negatives atthe beginning and end of each strip of mapping, chart-ing, and reconnaissance photography. Thus, im-mediately following 137PS-3M109-11-V-121 are the
Figure 69. Aerial photograph with titling data.
106

data 12:28:1330-6.03 :20000-842S14826E/816A14745E.The explanation is as follows:
(1) 12:28:1330. Date and hour, 28 December at 1330.(2) 6.03:20000. Focal length of camera in inches to
nearest hundredth (6.03 inches) and altimeter reading20,000 feet.
(3) 842S14826E/816S14745E. Geographic coordi-nates of the beginning and end of each continuous stripof photography to the nearest minute; beginning ofstrip is at 80 42' south latitude, 1480 26' east longitude;end of strip at 8° 16' south latitude, 1470 45' eastlongitude.
60. FIDUCIAL MARKS. Fiducial marks appear onnearly all aerial photographs. These are ticks, notches,lines, or half arrows, at the middle of each of the foursides of the negative. They are registered during ex-posure by a template in the camera. The use of fiducialmarks to place a grid on the photograph is discussed inparagraph 69b.
61. SOURCE OF ERROR. All aerial photographs con-tain some error resulting from the tilt of the airplanein flight and from variations in ground elevations. Theamount of error in any photograph is less at the centerand increases toward the edges. These unavoidableerrors may be disregarded for ordinary field use.However, photographs taken when the airplane wasobviously badly tilted should be discarded.
107

SECTION X
AERIAL PHOTOGRAPHSAS MAP SUBSTITUTES
62. COMPARISON OF AERIAL PHOTOGRAPHS WITHLINE MAPS. A topographic map is a line drawing ofthe land, showing objects and features by exaggeratedconventional signs. An aerial photograph is an actualpicture of the earth's surface which shows terrainfeatures as they appear from the air.
a. An aerial photograph has the following advan-tages over a topographic map:
(1) It has a wealth of detail which no map can equal.(2) It has accuracy of form.(3) It can be obtained and developed in a short time.(4) If may be made of areas otherwise inaccessible
for physical or military reasons.(5) It is up to date.(6) Unobscured military features can be studied and
interpreted.b. The vertical photograph is inferior to a topo-
graphic map in the following ways:(1) Important military features emphasized on a
map are sometimes obscured or hidden by other detail.(2) Neither absolute position nor absolute elevation
can be obtained.(3) Relative relief is not readily apparent.(4) Displacement of position caused by relief and
camera tilt usually do not permit the accurate deter-mination of either distance or direction.
(5) Because of a lack of contrast in tone, it isdifficult to read in poor light.
108
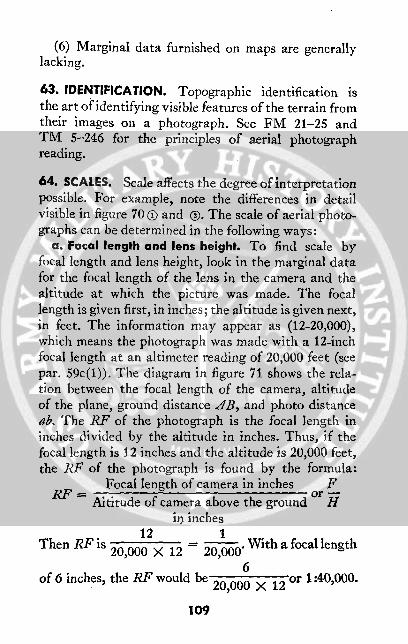
(6) Marginal data furnished on maps are generallylacking.
63. IDENTIFICATION. Topographic identification isthe art of identifying visible features of the terrain fromtheir images on a photograph. See FM 21-25 andTM 5-246 for the principles of aerial photographreading.
64. SCALES. Scale affects the degree of interpretationpossible. For example, note the differences in detailvisible in figure 70 O and 0. The scale of aerial photo-graphs can be determined in the following ways:
a. Focal length and lens height. To find scale byfocal length and lens height, look in the marginal datafor the focal length of the lens in the camera and thealtitude at which the picture was made. The focallength is given first, in inches; the altitude is given next,in feet. The information may appear as (12-20,000),which means the photograph was made with a 12-inchfocal length at an altimeter reading of 20,000 feet (seepar. 59c(1)). The diagram in figure 71 shows the rela-tion between the focal length of the camera, altitudeof the plane, ground distance AB, and photo distanceab. The RF of the photograph is the focal length ininches divided by the altitude in inches. Thus, if thefocal length is 12 inches and the altitude is 20,000 feet,the RF of the photograph is found by the formula:
Focal length of camera in inches FRF = Altitude of camera above the ground H
in inches12 1
Then RF is 20,000 X 12 20o With a focal length20,000 X 12 20,000W
6of 6 inches, the RF would be ,or 1:40,000.
20,000 X 12
109
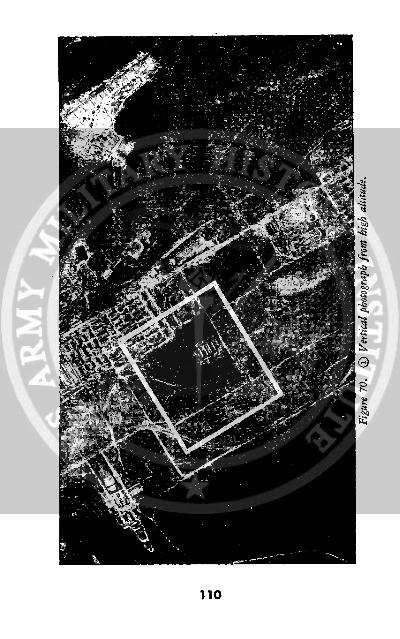
I"i
.a
wSI
--
110
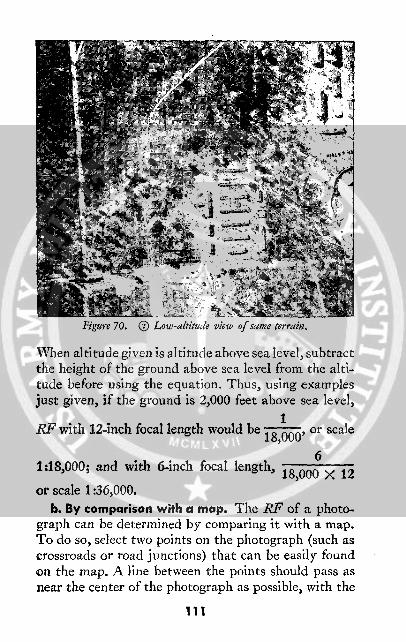
Figure 70. () Low-altitude view of same terrain.
When altitude given is altitude above sea level, subtractthe height of the ground above sea level from the alti-tude before using the equation. Thus, using examplesjust given, if the ground is 2,000 feet above sea level,
RF with 12-inch focal length would be 18 or scale
61:18,000; and with 6-inch focal length, 18,000 X 12
or scale 1:36,000.b. By comparison with a map. The RF of a photo-
graph can be determined by comparing it with a map.To do so, select two points on the photograph (such ascrossroads or road junctions) that can be easily foundon the map. A line between the points should pass asnear the center of the photograph as possible, with the
111
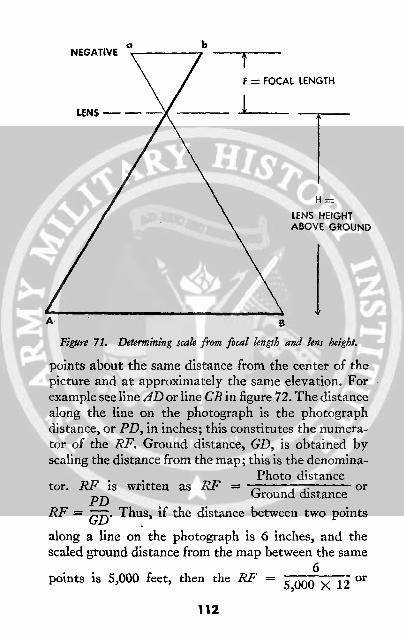
NNEGATIVE 'b
F = FOCAL LENGTH
LENS 1
H=
LENS HEIGHTABOVE GROUND
A B
Figure 71. Determining scale from focal length and lens height.
points about the same distance from the center of thepicture and at approximately the same elevation. Forexample see line AD or line CB in figure 72. The distancealong the line on the photograph is the photographdistance, or PD, in inches; this constitutes the numera-tor of the RF. Ground distance, GD, is obtained byscaling the distance from the map; this is the denomina-
Photo distancetor. RF is written as RF = or
RE isD written RE Ground distancePDRF= G'. Thus, if the distance between two points
along a line on the photograph is 6 inches, and thescaled ground distance from the map between the same
6points is 5,000 feet, then the RF 0 X or5,000 X 12
112
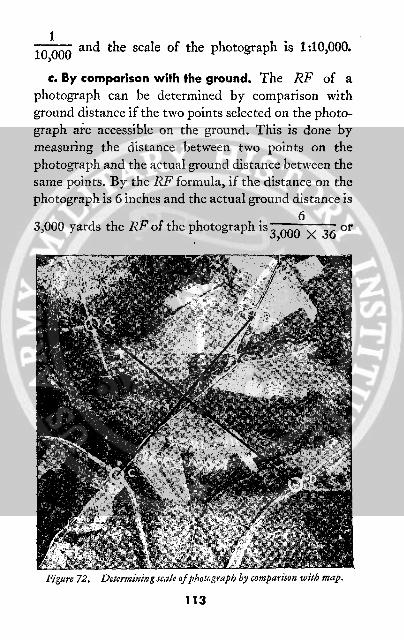
1and the scale of the photograph is 1:10,000.
c. By comparison with the ground. The RF of aphotograph can be determined by comparison withground distance if the two points selected on the photo-graph are accessible on the ground. This is done bymeasuring the distance between two points on thephotograph and the actual ground distance between thesame points. By the RF formula, if the distance on thephotograph is 6 inches and the actual ground distance is
3,000 yards the RF of the photograph is X 36 or3,000 X 36
Figure 72. Determiningscale oJ photograph by comparison witi map.
113
1
18,000'd. Average RF. A more accurate scale is found by
figuring the RF from several different scale lines, thentaking the average of all the denominators. Thus, if
1the RF's of two different scale lines were 19,000 and
1 12 ,000 the average scale would be 2021,000' 20,000
65. GRAPHIC SCALE. Preparing a photograph as amap substitute may include constructing a graphicscale in yards or other appropriate units. If the RF ofthe photograph is known, the graphic scale is construct-ed by the methods employed in constructing graphicscales for maps (see par. 12). On mounted photographsplace the scale on the lower margin of the mount. Onunmounted photographs place it on the back of thephotograph where it will not obscure valuable detail.
66. DISTANCE. After the RF of a photograph is deter-mined and a graphic scale is constructed, the map readeris ready to scale distances. The paper-strip method ofmeasuring distances, discussed in FM 21-25, is theeasiest method. The map measurer and the engineerscale may also be used.
67. DIRECTION. a. General. (1) For normal militaryuses, direction angles and azimuths on a photographhave the same significance as on a map and may bemeasured and laid out with the protractor in exactlythe same manner. However, angles measured from theprincipal center point of the photograph more closelyapproximate their values as measured on the ground,
114

since errors in position on a near vertical photo areradial from points falling near the center.
(2) To lay out or to measure directions on a photo-graph, magnetic, true, or grid north may be indicatedon the photograph. Magnetic north is the most suitablebase direction for photographs of unmapped country.
b. Finding north by shadows. (1) The shadow castby objects in a photograph can be used to find truenorth on the photo. In the north temperate zone,shadows fall true north at noon, northwest in themorning, and northeast in the afternoon. If the notein the margin indicates the picture was made between1000 and 1200, the shadows will be west of north. Ifmade between 1200 and 1400, the shadows will be eastof north. In the south temperate zone the directionsare reversed.
(2) In any particular locality, an hourly angularshadow variation may be obtained by measuring theangle through which a shadow moves in 1 hour, as infigure 73 0. This value in degrees can then be appliedas an adjustment to find true north on a photographtaken at any time.
(3) For example, assume that the position is northof the equator and that in 1 hour the sun moves theshadow through 130. Then if the aerial photograph ofthat area shown in figure 73 ® was made at 0900, theshadows would point 13S X 3 (hours) or S90 west ofnorth. Therefore, the approximate true north-south linewould be 39° to the right of the line of shadows. Draw aline on the photograph in the direction of the shadowsand measure 39° to the right with a protractor. Thedashed line in figure 73 ® is approximately true north.If this same photograph had been made at 1500, truenorth would point 390 to the left of the line of shadows.
115
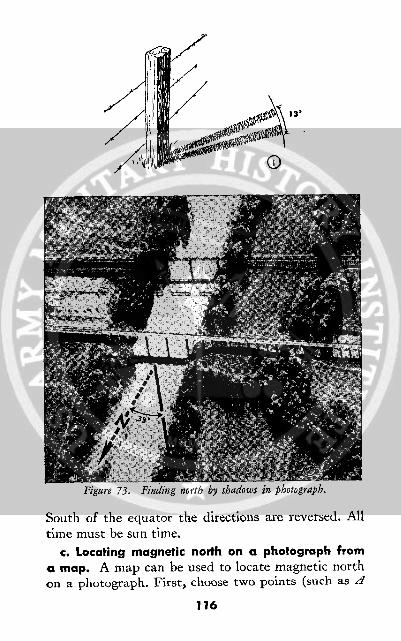
13°
g north by shadows in photograph.
South of the equator the directions are reversed. Alltime must be sun time.
c. Locating magnetic north on a photograph froma map. A map can be used to locate magnetic northon a photograph. First, choose two points (such as A
116
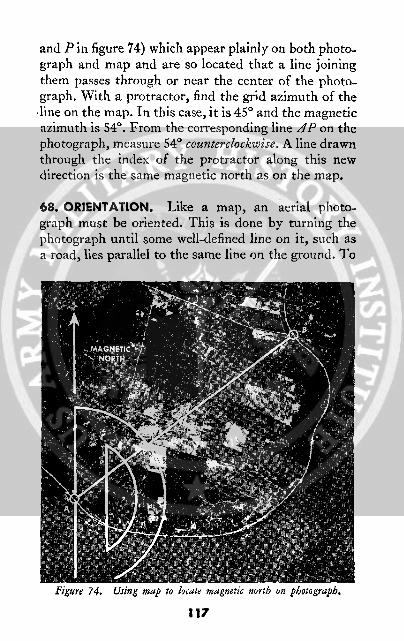
and P in figure 74) which appear plainly on both photo-graph and map and are so located that a line joiningthem passes through or near the center of the photo-graph. With a protractor, find the grid azimuth of theline on the map. In this case, it is 45° and the magneticazimuth is 54 ° . From the corresponding line AP on thephotograph, measure 540 counterclockwise. A line drawnthrough the index of the protractor along this newdirection is the same magnetic north as on the map.
68. ORIENTATION. Like a map, an aerial photo-graph must be oriented. This is done by turning thephotograph until some well-defined line on it, such asa road, lies parallel to the same line on the ground. To
Figaur 74. Using map to locate magnetic north on photograph.
117

check the orientation, place the compass on the mag-netic line, found by methods used in paragraph 67, androtate the photograph horizontally until the compassneedle points along the line. Other methods of orientingphotographs are covered in FM 21-25.
69. POINT-DESIGNATION GRID. a. Printing accur-ate grids on photographs is impracticable because ofscale distortion. A special grid, known as the point-designation grid, may be used. This grid has no relationto the actual scale or orientation of the photograph; itserves only for point or target designations and nor-mally is not suitable for measuring distance or azimuth.For convenience, the dimension of the grid square is1.44 inches. The 1:25,000 scale then can be used fordetermining and plotting the coordinates of points.
b. A point-designation grid may be printed on aphoto or it may be printed on a transparent sheet-thepoint-designation grid template-for use on photo-graphs not gridded. It is essential that all concernedplace the grid or template on a photograph in exactlythe same manner. For vertical photographs the pro-cedure is, first, to turn the photograph so the marginalinformation, whether at the top or bottom, is in thenormal reading position. Then draw grid line A throughthe fiducial marks at the top and bottom of the photo-graph and grid line M through the fiducial marks onthe sides of the photograph (fig. 75). Additional gridlines are drawn parallel to grid lines A and M at 1.44-inch spacing. Those parallel to and above M are letteredfrom M to the top of the photograph N, O, P, 9, andso on. Those below M are lettered from M towardbottom of photograph in the order Z, Y, X, W, andso on. Lines to the right of A are lettered B, C, D, etcetera, and those to the left L, K, 7, I, et cetera. When
118
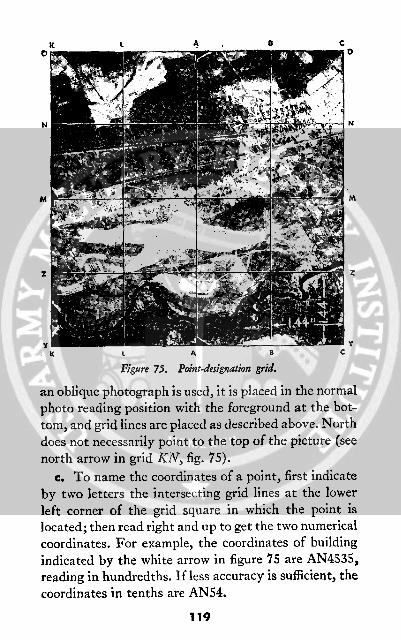
0
y Y. K L A B C
Figure 75. Point-designation grid.
an oblique photograph is used, it is placed in the normalphoto reading position with the foreground at the bot-tom, and grid lines are placed as described above. Northdoes not necessarily point to the top of the picture (seenorth arrow in grid KN, fig. 75).
c. To name the coordinates of a point, first indicateby two letters the intersecting grid lines at the lower
left corner of the grid square in which the point islocated; then read right and up to get the two numericalcoordinates. For example, the coordinates of buildingindicated by the white arrow in figure 75 are AN4535,reading in hundredths. If less accuracy is sufficient, thecoordinates in tenths are AN54.
119
A
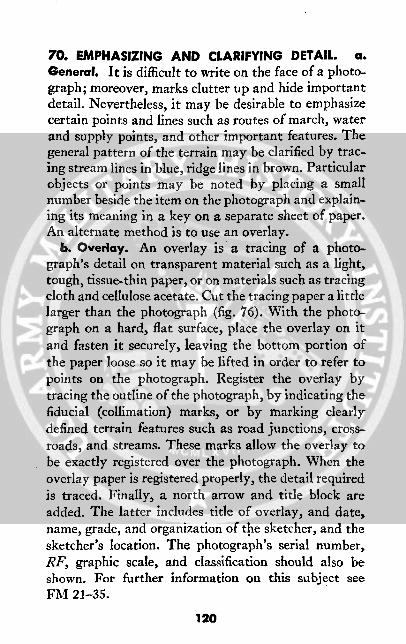
70. EMPHASIZING AND CLARIFYING DETAIL. a.General. It is difficult to write on the face of a photo-graph; moreover, marks clutter up and hide importantdetail. Nevertheless, it may be desirable to emphasizecertain points and lines such as routes of march, waterand supply points, and other important features. Thegeneral pattern of the terrain may be clarified by trac-ing stream lines in blue, ridge lines in brown. Particularobjects or points may be noted by placing a smallnumber beside the item on the photograph and explain-ing its meaning in a key on a separate sheet of paper.An alternate method is to use an overlay.
b. Overlay. An overlay is a tracing of a photo-graph's detail on transparent material such as a light,tough, tissue-thin paper, or on materials such as tracingcloth and cellulose acetate. Cut the tracing paper a littlelarger than the photograph (fig. 76). With the photo-graph on a hard, flat surface, place the overlay on itand fasten it securely, leaving the bottom portion ofthe paper loose so it may be lifted in order to refer topoints on the photograph. Register the overlay bytracing the outline of the photograph, by indicating thefiducial (collimation) marks, or by marking clearlydefined terrain features such as road junctions, cross-roads, and streams. These marks allow the overlay tobe exactly registered over the photograph. When theoverlay paper is registered properly, the detail requiredis traced. Finally, a north arrow and title block areadded. The latter includes title of overlay, and date,name, grade, and organization of the sketcher, and thesketcher's location. The photograph's serial number,RF, graphic scale, and classification should also beshown. For further information on this subject seeFMr 21-35.
120

Il: \
:Ad
5 : sJ >e E
XI, I.I,j~~~~~~
I,i E
Figure 76. Use of overlay on a photograph.
71. TO INDEX AND PLOT AERIAL PHOTOGRAPHS.Examination and study of photographs is facilitated byfirst outlining on a map the area or areas covered by thephotograph or photographs as indicated in figure 77.This is done by constructing templates or tracing paperwhich represent the area of the photograph at the scaleof the map. For example, if the map has an RF of1:20,000, and the ground area represented by a photo-graph is 7,000 by 9,000 feet, the template wouldmeasure:
7,000 X 12 9,000 X 1220,000 by 20,000 or 4.2 by 5.4 inches
The template is placed on the map and shifted aboutuntil its outline includes the details shown on thephotograph. The area then is outlined on the map bymarking around the template, and the serial number
121
t

of the photograph is entered in the outline. The processis repeated for any number of photographs. The resultis an index sheet of the photographs (sometimes called"sortie plot") showing the relation of the photographsone to another and to the area on the map.
'I0 7----N > .
Pigire 77. Method ofindexing and platting aerial photographs.Figure77. AMetbod of indxing andpllotting aerial pbotographs.
122
SECTION XI
PHOTOMAPS
72. TYPES OF PHOTOMAPS. A photomap is a repro-duction of a photograph or mosaic on which grid lines,marginal data, and place names are added (fig. 78).While a photomap usually is a reproduction of a mosaic,either controlled or uncontrolled, it may be the repro-duction of a single photograph of any type. Verticalphotographs are usually reproduced with a point-desig-nation grid (see par. 69). A photomap made from anuncontrolled mosaic gives a good picture of the terrainand can be prepared quickly, although it will have errorsin scale and direction. A photomap made from a con-trolled mosaic takes much longer to prepare, but canbe scaled accurately.
73. MARGINAL DATA. Marginal data for the repro-duced individual photograph are given in paragraph 59,with the addition of the point-designation grid system.Photomaps which are made from mosaics and wide-coverage photographs may have, in addition, thefollowing information:
a. Marginal information similar to that shown onmaps, such as graphic scale, declination diagram, datemade, and locality.
b. Name of towns, streams, mountains, highways,and other important features.
74. MILITARY GRID. While the military grid is notused on single photographs or on uncontrolled mosaics,it is highly desirable on controlled mosaics and photo-
123
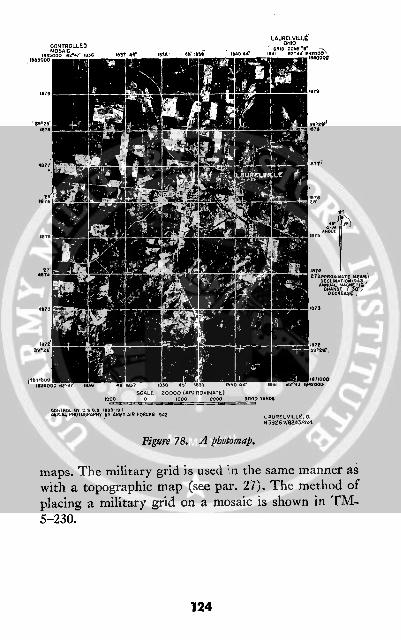
000 0 1.000 000 0000 *0..
N 3926 Wi243/4.4
Figure 78. A photomap.
maps. The military grid is used in the same manner aswith a topographic map (see par. 27). The method ofplacing a military grid on a mosaic is shown in TM-5-230.
124

SECTION Xll
STEREOVISION
75. GENERAL. Stereovisipn is the three-dimensionaleffect seen by blending into one image two pictures ofthe same object taken from different points. It is usedwhen making a thorough study of terrain. Aerialphotographs for stereovision are obtained by makingtwo successive overlapping exposures with the axis ofthe camera lens vertical and the aircraft at the samealtitude. The area that overlaps is suitable for stereo-scopic study. The two pictures are called a stereo-pair.Trees, buildings, hills, and other terrain features in theoverlap area rise in exaggerated relief when viewedstereoscopically. This enables the map reader to seethrough thin foliage of wooded areas; to detect camou-flage; to study terrain to be fought over; to identifyplanes, ships, and important military installationsbehind the enemy's lines; and to determine the results ofmilitary action. Normally, stereo-pairs are examinedwith the aid of issue stereoscopes, but the naked eyesmay be used if the individual has trained himself to seestereoscopically.
76. LEARNING TO USE A STEREOSCOPE. a. General.In teaching an individual to see stereoscopically it isoften helpful to precede actual use of the stereoscopewith preliminary eye exercises. The exercises and aidsdescribed in b and c below are included for this purpose.
b. Preliminary exercises. (1) Finger exercise. Fin-ger exercises such as the "sausage" exercise shown infigure 79 , ®, and ® are an aid in learning stereo-vision. To practice this exercise, focus the eyes on a
125
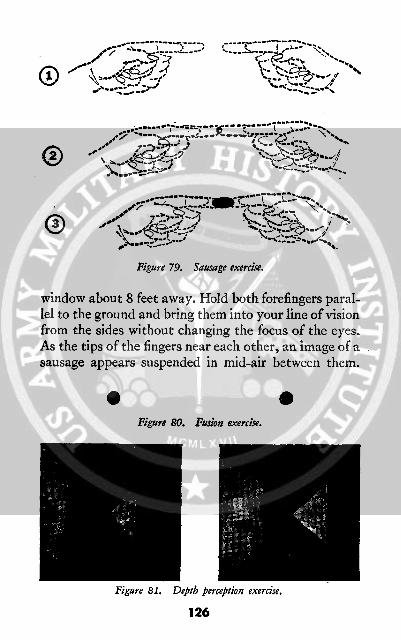
,..- -:--.--. --- - - i-a.i.-- ,, ,
Figure 79. Sausage exercise.
window about 8 feet away. Hold both forefingers paral-lel to the ground and bring them into your line of visionfrom the sides without changing the focus of the eyes.As the tips of the fingers near each other, an image of asausage appears suspended in mid-air between them.
Figure 80. Fusion exercise.
Figure 81. Depth perception exercise.
126

(2) Fusion exercise. The next exercise is to learn tofuse two drawings. Focus the eyes on a distant objectand move the two dots in figure 80 into the line of sight,approximately 8 to 10 inches from the eyes. If fourdots appear, move the manual away from or closer tothe eyes until there are three dots. The center dot is instereovision. If the field manual is turned slowly, thecenter dot appears to separate into two dots, one jump-ing out of the top of the other.
(3) Exercise to see relief. In figure 81, use the samemethod described above. The fused image in figure 81is a pyramid protruding from the bottom of a squarepit. In other words, instead of a flat line drawing, thereader sees the third dimension or relief.
c. Aids. Anaglyphs and vectographs may be used tohelp an individual to get the effect of stereovision forthe first time. An anaglyph is two nearly superimposedaerial photographs each printed in a different color, redand blue-green, and is viewed through glasses with redand blue-green lenses. TM 5-230 gives a detaileddiscussion of anaglyphs. A vectograph uses the prin-ciple of polarized light to present a three-dimensionalview.
77. STEREOSCOPES. The stereoscope consists of apair of lenses set in a frame. The stereoscope gives asmall amount of magnification. There are a number ofdifferent types but all are used similarly. The instru-ment is placed on overlapped photographs, as in figure82.
78. STUDY OF STEREO-PAIRS. a. General. To seephotographs stereoscopically, they must be placed inthe same relative positions as when they were taken.Any pair of overlapping vertical photographs taken at
127

Figure 82. Lens stereoscope set up over a stereo-pair.
approximately the same elevation, can be viewedstereoscopically if arranged properly.
b. Arrangement of stereo-pairs. (1) Place onephotograph on top of the other so the detail common toboth roughly matches.
(2) Turn the photographs as a unit until your eyesare parallel to an imaginary line which runs across theapproximate centers of the photographs.
(3) Place the stereoscope over the photographs sothe left photograph is under the left lens and the rightphotograph is under the right lens.
(4) Now separate the photographs along the linejoining the centers, moving the right one toward theright and left toward the left. The photographs can bekept in proper relation by keeping parallel the detailswhich appear in the overlap area, such as roads orstreams. The two objects in the overlap area which areto be studied should be separated so each is directly
128

under the left and right lens respectively. By slightmovements the photographs can be adjusted so thecenter images fuse and the effect of relief or depth isobtained. For a detailed discussion see TM 5-230.
(5) The stereo-pair in figure 83 ( and ® shows theoverlapping portions of two vertical photographs. Theyare placed in the proper position for stereovision tobe obtained.
79. THE FLOATING LINE. a. The special applicationof stereovision described below is useful in determiningif a line of sight is free of obstructions. In figure 83 thereare three black lines. If these lines are viewed stereo-scopically, the relative elevation of terrain on eitherside may be clearly seen. The short line that runs fromthe roof of the house up to the left and across the roadto a tree seems to float in the air; moreover, the end ofthe line at the tree is lower than at the roof df the house.This line is lower than the tops of the trees around thehouse but is well above the ground. Therefore an ob-server at the house can see the tree across the road.Long lines run from the roof of the house in the centerof the photograph to the roofs of houses above, andbelow it. These lines seem to float everywhere exceptwhere they move across wooded areas. The lines seemto cut furrows through the tops of the trees. This meansthat an observer sighting along these lines from thefirst house cannot see the roofs of the other houses.
b. To use this method, draw a fine ink line betweenthe same two points on both the right and left picturesof a stereo-pair. The ends of the line appear to assumethe elevation at their starting and stopping points.When stereo-pairs are reversed, moving the left photo-graph to the right of the right photograph, houses andtrees will be depressed rather than in relief and that
129

() Left half of stereo-pair.Figure 83.
portion of a line which did not float in the originalposition will float freely. This checks the line of sightfor obstructions.
c. To avoid drawing numerous lines on the stereo-pair, narrow strips of acetate on which lines have been
130
d) Right half of stereo-pair.Figure 83. - Continued.
scratched and inked in may be used. The strips arepivoted around pins stuck through the strips andfastened to the photographs at points from which linesof sight are being determined. By placing the otherends of the lines on the points in question on both
131
photographs and viewing the pair stereoscopically, thepresence or absence of obstructions to vision can bedetermined.
d. This method can not be used when the floatingline is parallel, or nearly parallel to the line betweencenters of the photographs.
132
APPENDIX
PROJECTIONS
1. GENERAL. a. The geographic system of parallels andmeridians can be easily drawn on a globe, but the sur-face of the globe cannot be stripped and flattened intoa map without distortion. A perfect map representation,therefore, is impossible although there are many waysof getting approximate representations on a flat sheet.The simplest of these is to envelop the globe with acylinder or cone or to lay a tangent plane against it, andto project upon the cylinder, cone, or plane a part ofthe geographic coordinate system of the globe. Thecylinder or cone is then cut open and laid out flat. Thesystem of parallels and meridians on the flattenedpaper is then the framework, or projection, upon whichthe map is constructed. A projection, then, is anyorderly system of parallels and meridians on which amap is drawn.
b. Many kinds of projections have been devised.Some are particularly good for one purpose and somefor another; no one projection is best suited for allshaped areas. Military maps of the United States arebased on a series of seven polyconic projections; eachone being 90 in width. This system has been extendedto cover the earth between latitudes 72 ° N to 720 Sand is known as the World Polyconic. It is used for allthose areas not covered by the British grid system.
c. The British employ three systems of grid projec-tion: Lambert Conical Orthomorphic, Transverse Mer-cator, and the Cassini projections. The type useddepends upon the shape of the area to be mapped. Al-though British grids are based on these three map
133

projections, practically all quadrangle projections forlarge-scale operational maps are plotted from polyconictables. Ease of construction and existing tables dictatethis practice. This is possible, since for small areas,differences between the polyconic projection and anyof the other grid projections is unplottable. The gridof the area is then superimposed on the quadrangle.
d. Following are brief explanations of these projec-tions. For more detailed information see TM 5-230 orany textbook on cartography.
2. MERCATOR PROJECTION. a. This is a cylin-drical projection in which parallels and meridians areprojected onto a cylinder tangent to the earth at theequator (fig. 84). When the cylinder is laid out flat themeridians appear as vertical straight lines, evenlyspaced, and true to scale on the equator (fig. 85), buttrue scale may be established at any latitude. Theparallels are horizontal straight lines spaced so that forand small area the relation of scale along the meridiansand along the parallels is the same as on the globe. Forexample, at latitude 60° the parallels are twice as farapart as at the equator. Therefore, since the meridianson the map are the same distance from each other atevery latitude, the scale of the map is doubly exagger-ated at 600. At 80° the exaggeration is sixfold. It isobvious that the poles cannot be shown in this projec-tion, because the expansion would be infinite. There-fore, maps on Mercator projections seldom are extendedmuch beyond 800 of latitude.
b. The advantages of the Mercator projection areease of plotting or reading geographic coordinatesbecause the parallels and meridians form a rectangulargrid; and, ease of plotting and reading navigationcourses of ships or aircraft. A compass course between
134
A-
ace '~~~~~~~~~~~~~z z~~~~~~~~~~~~~~
I ,D
Figure 84. Cylindrical proiection explains Mercator projection.
any two points (such as Capetown and Bombay infig. 85) can be shown by a straight line connecting them.Thus, the path of a ship or plane following a constant
135
A c
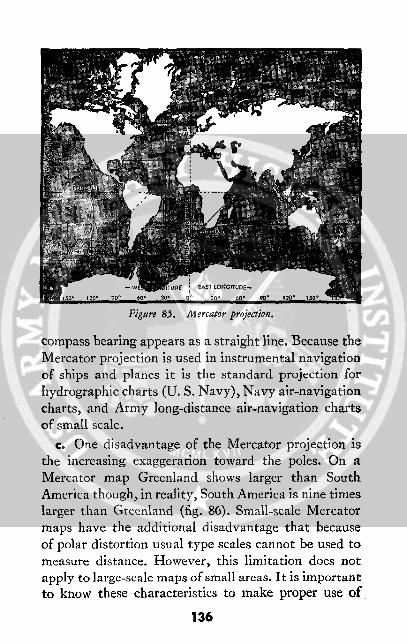
rl- -WL TUPE EdS LONGITUDE-
250' O 90-o 60 ? 30 0. 320 60 90·
120O 150-
Figure 85. Mviercator projection.
compass bearing appears as a straight line. Because theMercator projection is used in instrumental navigationof ships and planes it is the standard projection forhydrographic charts (U. S. Navy), Navy air-navigationcharts, and Army long-distance air-navigation chartsof small scale.
c. One disadvantage of the Mercator projection isthe increasing exaggeration toward the poles. On aMercator map Greenland shows larger than SouthAmerica though, in reality, South America is nine timeslarger than Greenland (fig. 86). Small-scale Mercatormaps have the additional disadvantage that becauseof polar distortion usual type scales cannot be used tomeasure distance. However, this limitation does notapply to large-scale maps of small areas. It is importantto know these characteristics to make proper use of
136
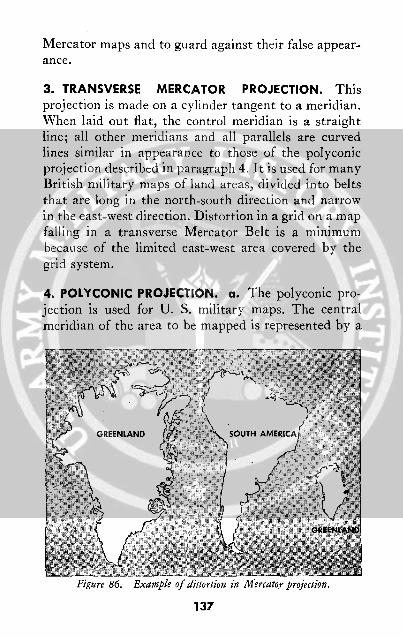
Mercator maps and to guard against their false appear-ance.
3. TRANSVERSE MERCATOR PROJECTION. Thisprojection is made on a cylinder tangent to a meridian.When laid out flat, the control meridian is a straightline; all other meridians and all parallels are curvedlines similar in appearance to those of the polyconicprojection described in paragraph 4. It is used for manyBritish military maps of land areas, divided into beltsthat are long in the north-south direction and narrowin the east-west direction. Distortion in a grid on a mapfalling in a transverse Mercator Belt is a minimumbecause of the limited east-west area covered by thegrid system.
4. POLYCONIC PROJECTION. a. The polyconic pro-jection is used for U. S. military maps. The centralmeridian of the area to be mapped is represented by a
Distortion in
137

Figure 87. Development of polyconic projection.
straight line, and the parallels are represented by arcsof circles that are not concentric but the centers ofwhich all lie in the extension of the central meridian(fig. 87). The distances between the parallels along thecentral meridian are proportional to the true distancesbetween the parallels of the earth. The radius of eachparallel is determined by an element of the cone tangentto the earth along the given parallel. Distances betweenmeridians are laid off on the parallels proportional to thetrue distances between meridians. Smooth curves drawnthrough the points thus determined give the respectivemeridians. Figure 87 shows the nature of the exaggera-tion introduced by this method of projection. The north-south distortion increases rapidly on polyconic mapsof areas with large east-west dimension. Because of this,it is customary to limit the width of projection and to
138

use the central meridian of the area to be mapped asthe central meridian of the projection.
b. The characteristics of the polyconic projectionare true distance along its parallels of latitude, truedistance along its central meridian, and exaggerateddistance along all other longitude lines, with the greatestexaggeration at the east and west edges. Within a pro-jection the width of the United States the distortionalong the Pacific Coast would be around 7 percent in anorth-south direction. The width of projection used forU. S. military maps is limited to 90 of longitude, andthe maximum scale error in this width is only aboutone-fifth of 1 percent and therefore is negligible.
5. LAMBERT CONICAL ORTHOMORPHIC PROJECTION.a. The Lambert conical orthomorphic projection
(Lambert conformal conic) employs a simple conetangent to the earth along a single parallel or inter-secting the earth at two parallels known as the standardparallels for the area to be mapped (fig. 88). Allmeridians are converging straight lines that meet ina common point beyond the limits of the map. Allparallels are concentric circles whose center is at thepoint of intersection of the meridians. Parallels andmeridians intersect at right angles, and the anglesformed by any two lines on the earth's surface arecorrectly represented on this projection.
b. To distribute scale error when two standard paral-lels are used, the standard parallels are chosen at one-sixth and five-sixths of the length of the central meridianto be represented. Between these parallels the scale willbe too small, and beyond them too large. On militarymaps maximum scale error ordinarily does not exceedone-half of 1 percent.
139
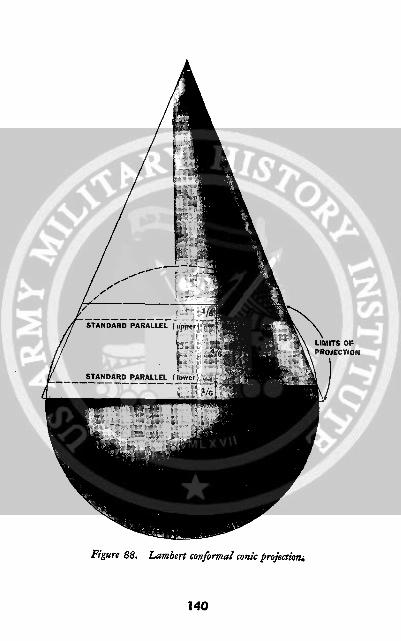
A
STANDARD PARALLEL (
LIMITS OFPROJIECTION
Figure 88. Lambert conformal conic projection.
140
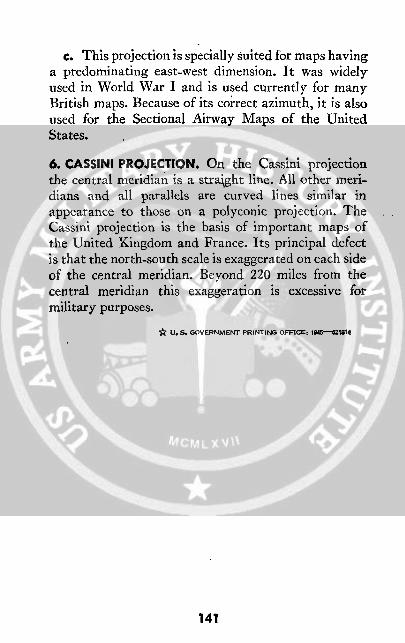
c. This projection is specially suited for maps havinga predominating east-west dimension. It was widelyused in World War I and is used currently for manyBritish maps. Because of its correct azimuth, it is alsoused for the Sectional Airway Maps of the UnitedStates.
6. CASSINI PROJECTION. On the Cassini projectionthe central meridian is a straight line. All other meri-dians and all parallels are curved lines similar inappearance to those on a polyconic projection. TheCassini projection is the basis of important maps ofthe United Kingdom and France. Its principal defectis that the north-south scale is exaggerated on each sideof the central meridian. Beyond 220 miles from thecentral meridian this exaggeration is excessive formilitary purposes.
* U.S. GOVERNMENT PRINTING OFFICE: 19452184
141