Embed Size (px)
Citation preview
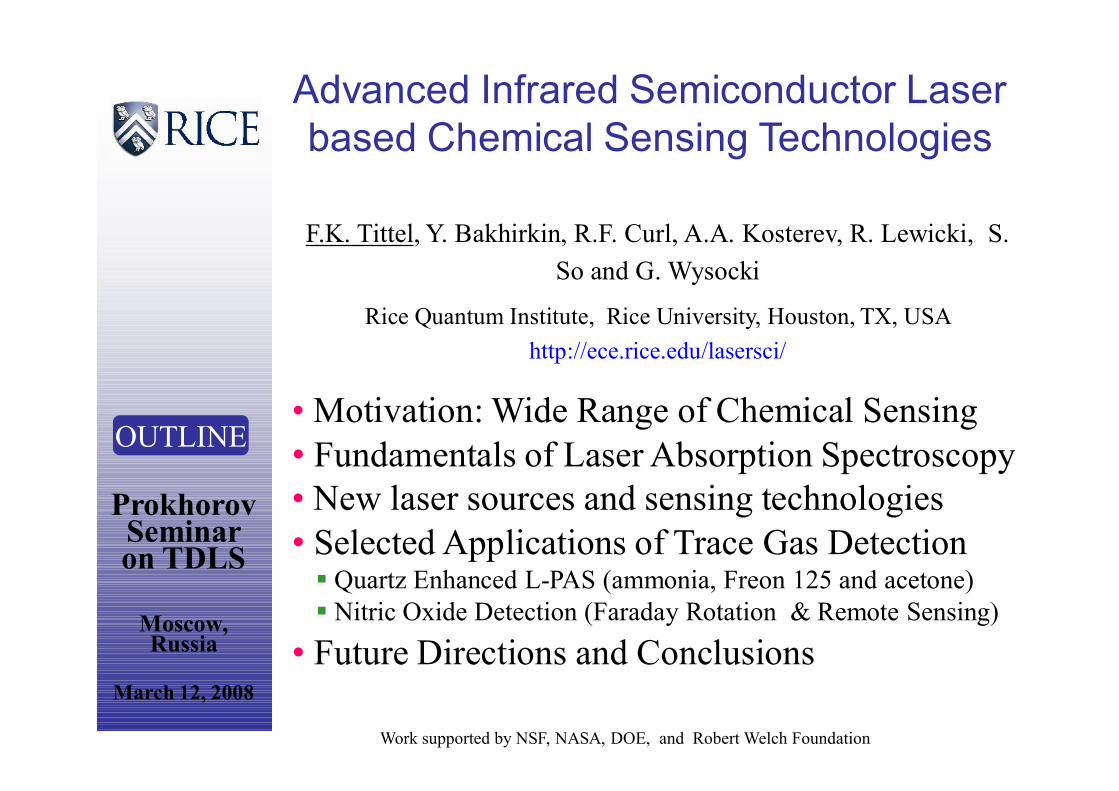
Advanced Infrared Semiconductor Laserbased Chemical Sensing Technologies
OUTLINE
ProkhorovSeminaron TDLS
Moscow,Russia
March 12, 2008
F.K. Tittel, Y. Bakhirkin, R.F. Curl, A.A. Kosterev, R. Lewicki, S.So and G. Wysocki
Rice Quantum Institute, Rice University, Houston, TX, USAhttp://ece.rice.edu/lasersci/
Work supported by NSF, NASA, DOE, and Robert Welch Foundation
• Motivation: Wide Range of Chemical Sensing• Fundamentals of Laser Absorption Spectroscopy• New laser sources and sensing technologies• Selected Applications of Trace Gas Detection§ Quartz Enhanced L-PAS (ammonia, Freon 125 and acetone)§ Nitric Oxide Detection (Faraday Rotation & Remote Sensing)
• Future Directions and Conclusions
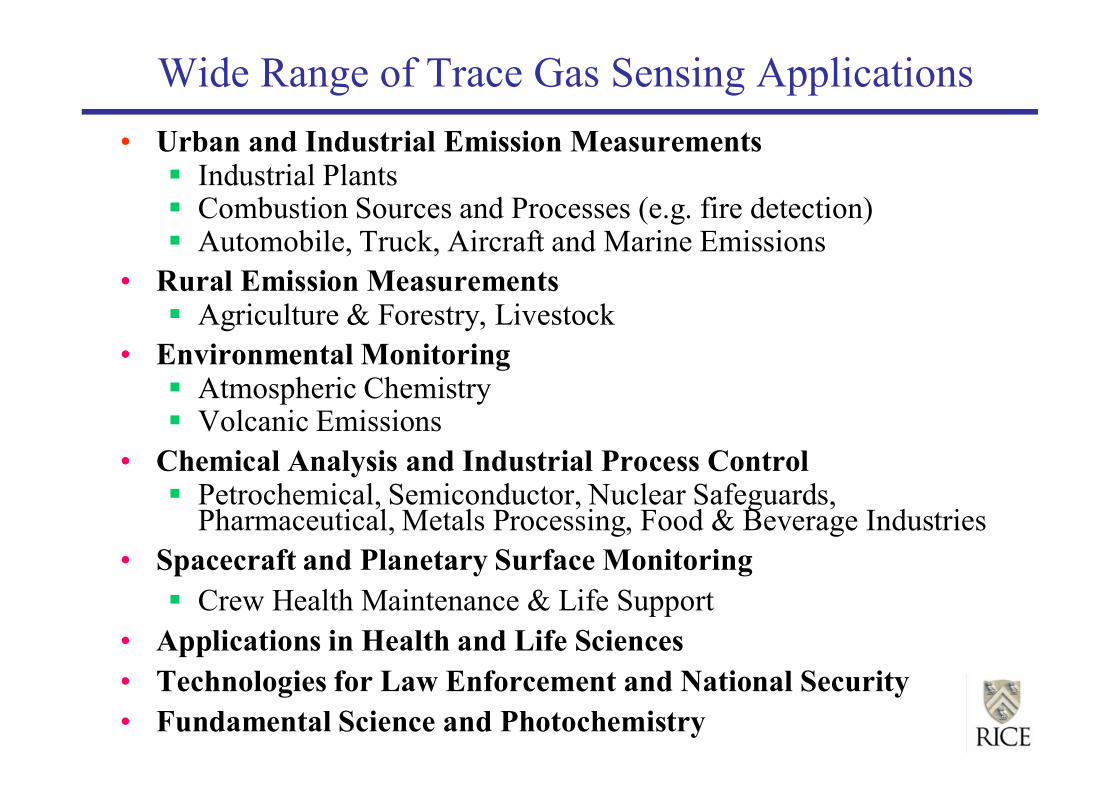
Wide Range of Trace Gas Sensing Applications• Urban and Industrial Emission Measurements§ Industrial Plants§ Combustion Sources and Processes (e.g. fire detection)§ Automobile, Truck, Aircraft and Marine Emissions
• Rural Emission Measurements§ Agriculture & Forestry, Livestock
• Environmental Monitoring§ Atmospheric Chemistry§ Volcanic Emissions
• Chemical Analysis and Industrial Process Control§ Petrochemical, Semiconductor, Nuclear Safeguards,
Pharmaceutical, Metals Processing, Food & Beverage Industries• Spacecraft and Planetary Surface Monitoring§ Crew Health Maintenance & Life Support
• Applications in Health and Life Sciences• Technologies for Law Enforcement and National Security• Fundamental Science and Photochemistry
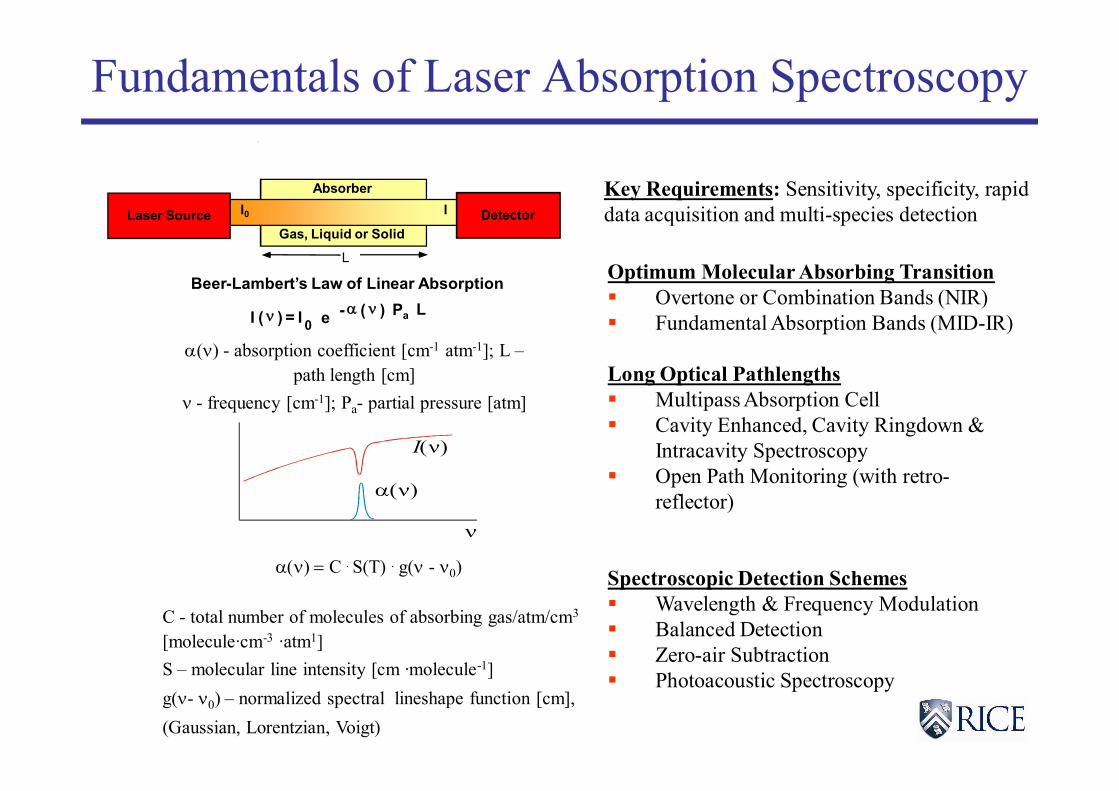
Optimum Molecular Absorbing Transition§ Overtone or Combination Bands (NIR)§ Fundamental Absorption Bands (MID-IR)
Long Optical Pathlengths§ Multipass Absorption Cell§ Cavity Enhanced, Cavity Ringdown &
Intracavity Spectroscopy§ Open Path Monitoring (with retro-
reflector)
Spectroscopic Detection Schemes§ Wavelength & Frequency Modulation§ Balanced Detection§ Zero-air Subtraction§ Photoacoustic Spectroscopy
Fundamentals of Laser Absorption Spectroscopy
Beer-Lambert’s Law of Linear Absorption
I ( n ) = I 0 e - a ( n ) Pa L
L
a(n) - absorption coefficient [cm-1 atm-1]; L –path length [cm]
n - frequency [cm-1]; Pa- partial pressure [atm]
Absorber
Gas, Liquid or SolidLaser Source DetectorI0 I
C - total number of molecules of absorbing gas/atm/cm3
[molecule·cm-3 ·atm1]S – molecular line intensity [cm ·molecule-1]g(n- n0) – normalized spectral lineshape function [cm],(Gaussian, Lorentzian, Voigt)
I(n)
a(n)
n
a(n) = C . S(T) . g(n - n0)
Key Requirements: Sensitivity, specificity, rapiddata acquisition and multi-species detection
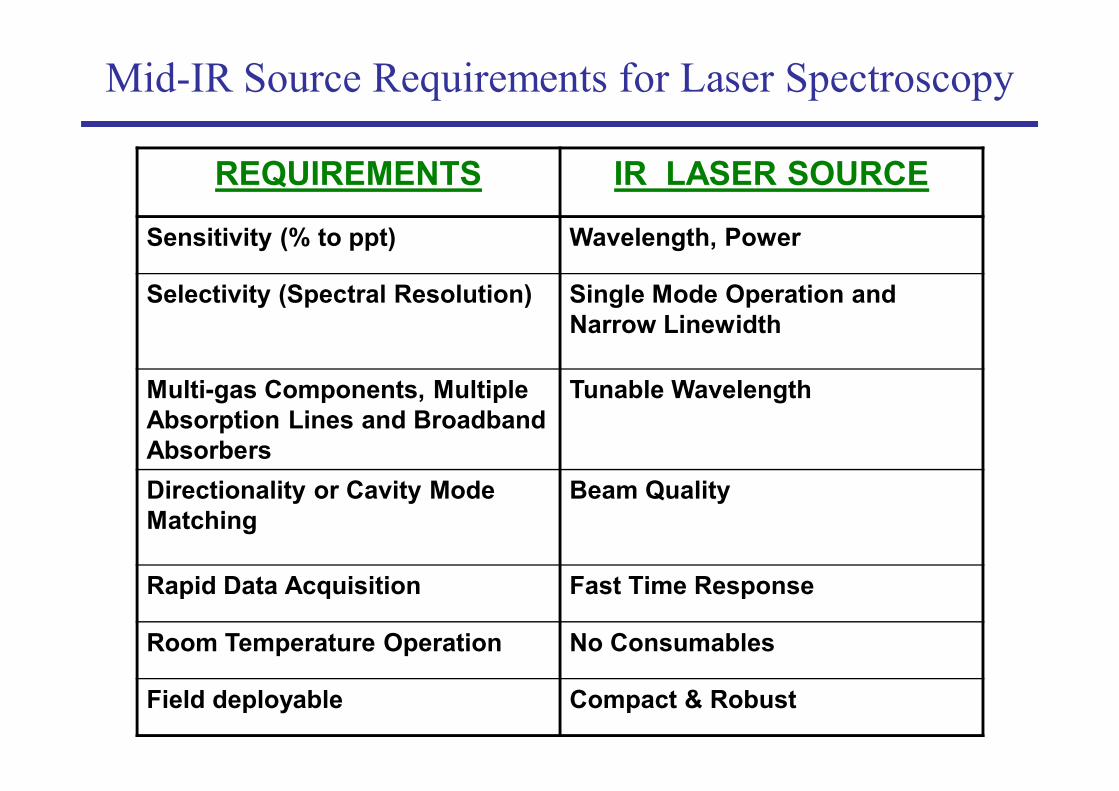
Mid-IR Source Requirements for Laser Spectroscopy
REQUIREMENTS IR LASER SOURCE
Sensitivity (% to ppt) Wavelength, Power
Selectivity (Spectral Resolution) Single Mode Operation andNarrow Linewidth
Multi-gas Components, MultipleAbsorption Lines and BroadbandAbsorbers
Tunable Wavelength
Directionality or Cavity ModeMatching
Beam Quality
Rapid Data Acquisition Fast Time Response
Room Temperature Operation No Consumables
Field deployable Compact & Robust
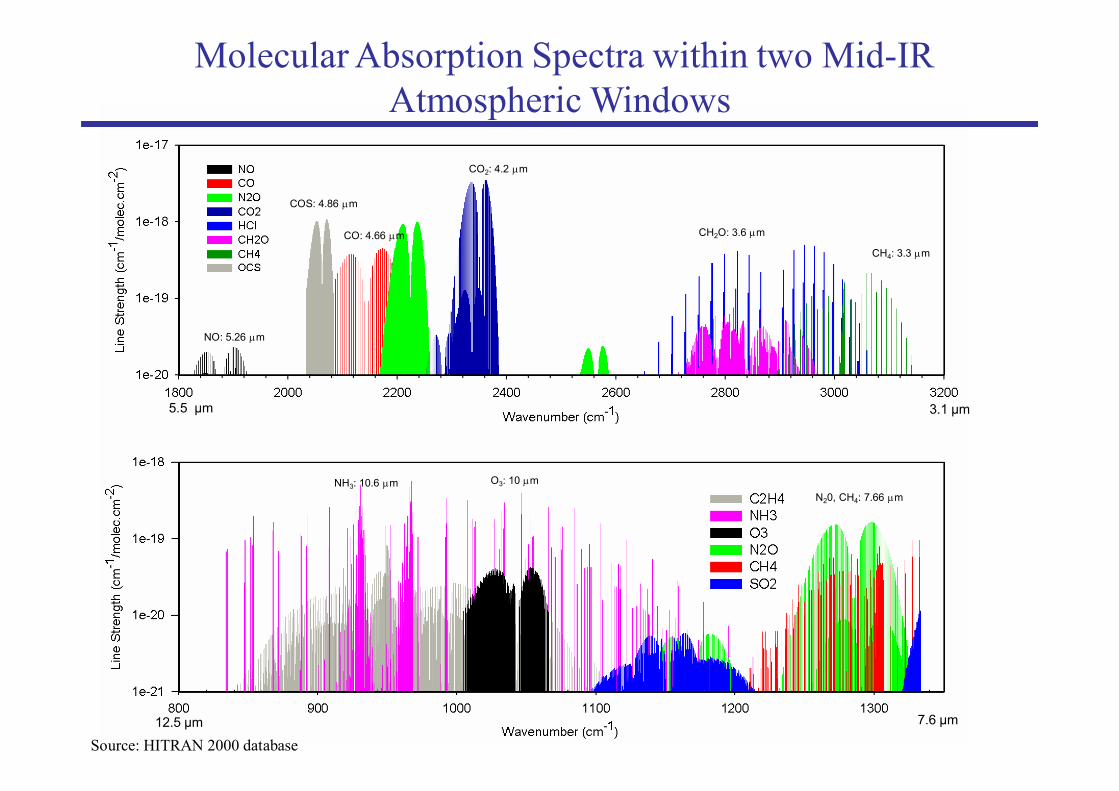
NO: 5.26 mm
CO: 4.66 mm CH2O: 3.6 mm
NH3: 10.6 mm O3: 10 mmN20, CH4: 7.66 mm
CO2: 4.2 mm
CH4: 3.3 mm
COS: 4.86 mm
12.5 μm 7.6 μm
3.1 μm5.5 μm
Molecular Absorption Spectra within two Mid-IRAtmospheric Windows
Source: HITRAN 2000 database
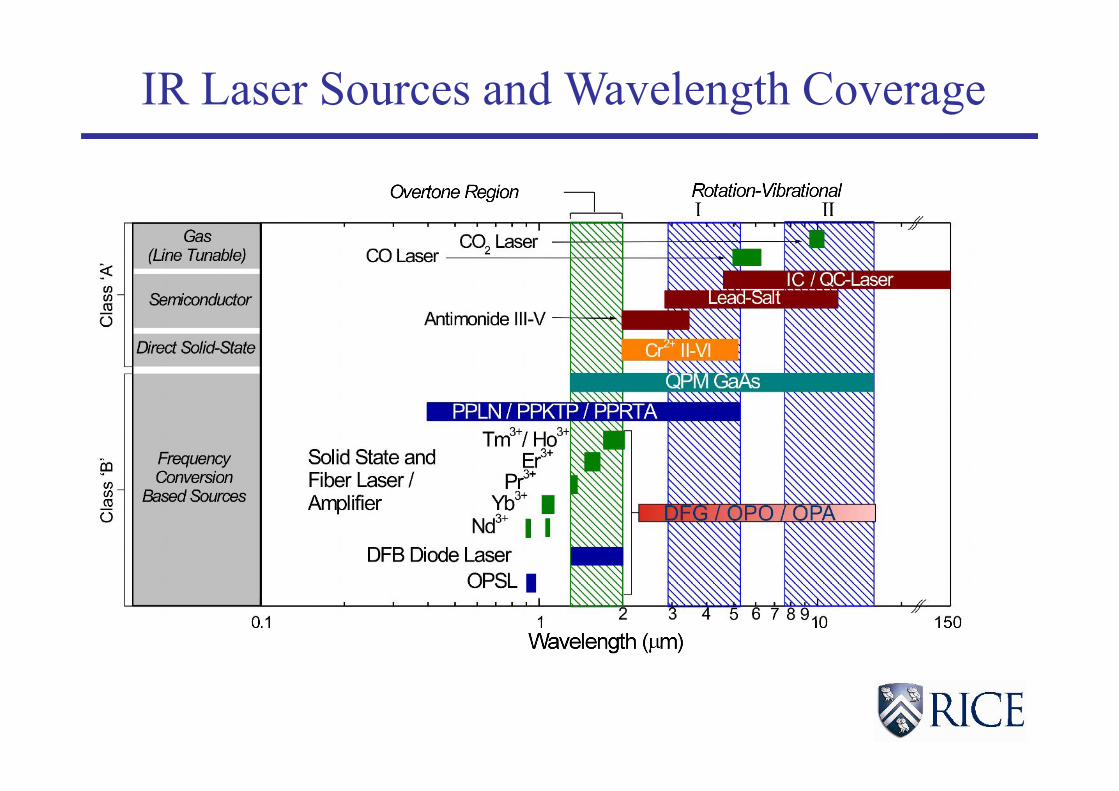
IR Laser Sources and Wavelength Coverage
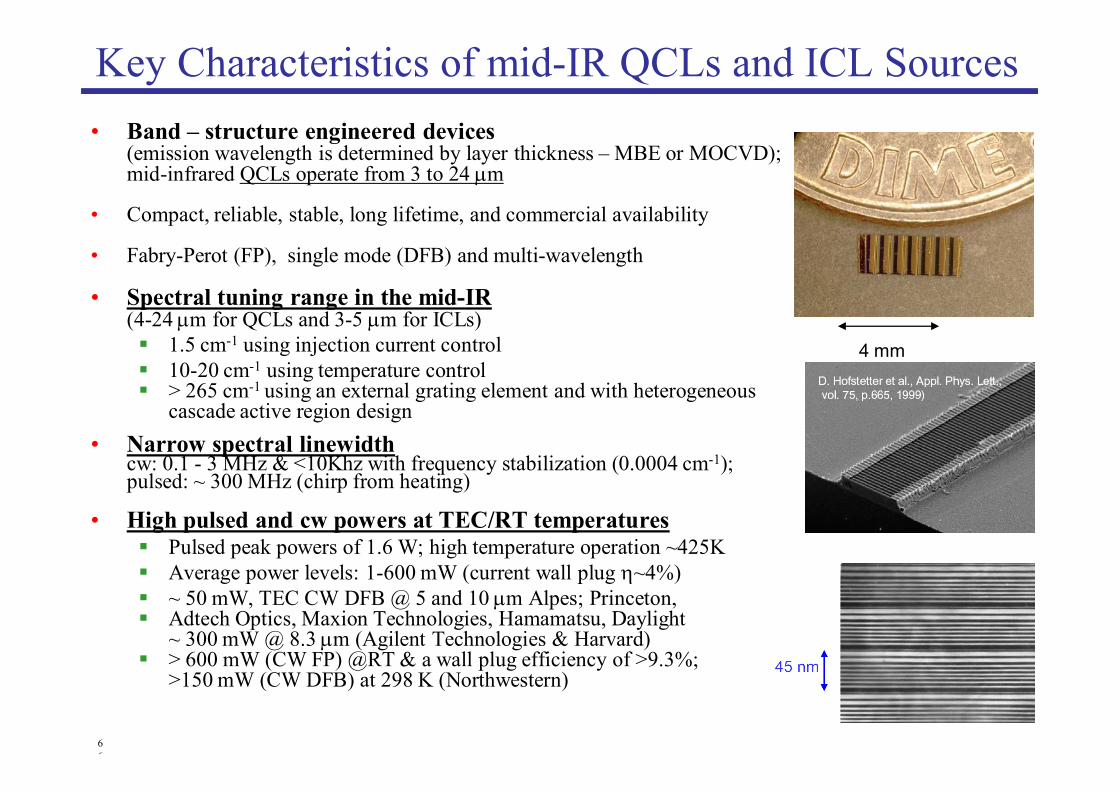
Key Characteristics of mid-IR QCLs and ICL Sources• Band – structure engineered devices
(emission wavelength is determined by layer thickness – MBE or MOCVD);mid-infrared QCLs operate from 3 to 24 mm
• Compact, reliable, stable, long lifetime, and commercial availability
• Fabry-Perot (FP), single mode (DFB) and multi-wavelength
• Spectral tuning range in the mid-IR(4-24 mm for QCLs and 3-5 mm for ICLs)§ 1.5 cm-1 using injection current control§ 10-20 cm-1 using temperature control§ > 265 cm-1 using an external grating element and with heterogeneous
cascade active region design• Narrow spectral linewidth
cw: 0.1 - 3 MHz & <10Khz with frequency stabilization (0.0004 cm-1);pulsed: ~ 300 MHz (chirp from heating)
• High pulsed and cw powers at TEC/RT temperatures§ Pulsed peak powers of 1.6 W; high temperature operation ~425K§ Average power levels: 1-600 mW (current wall plug h~4%)§ ~ 50 mW, TEC CW DFB @ 5 and 10 mm Alpes; Princeton,§ Adtech Optics, Maxion Technologies, Hamamatsu, Daylight
~ 300 mW @ 8.3 mm (Agilent Technologies & Harvard)§ > 600 mW (CW FP) @RT & a wall plug efficiency of >9.3%;
>150 mW (CW DFB) at 298 K (Northwestern)
4 mm
66
Widely Tunable, CW, TECQuantum Cascade Lasers
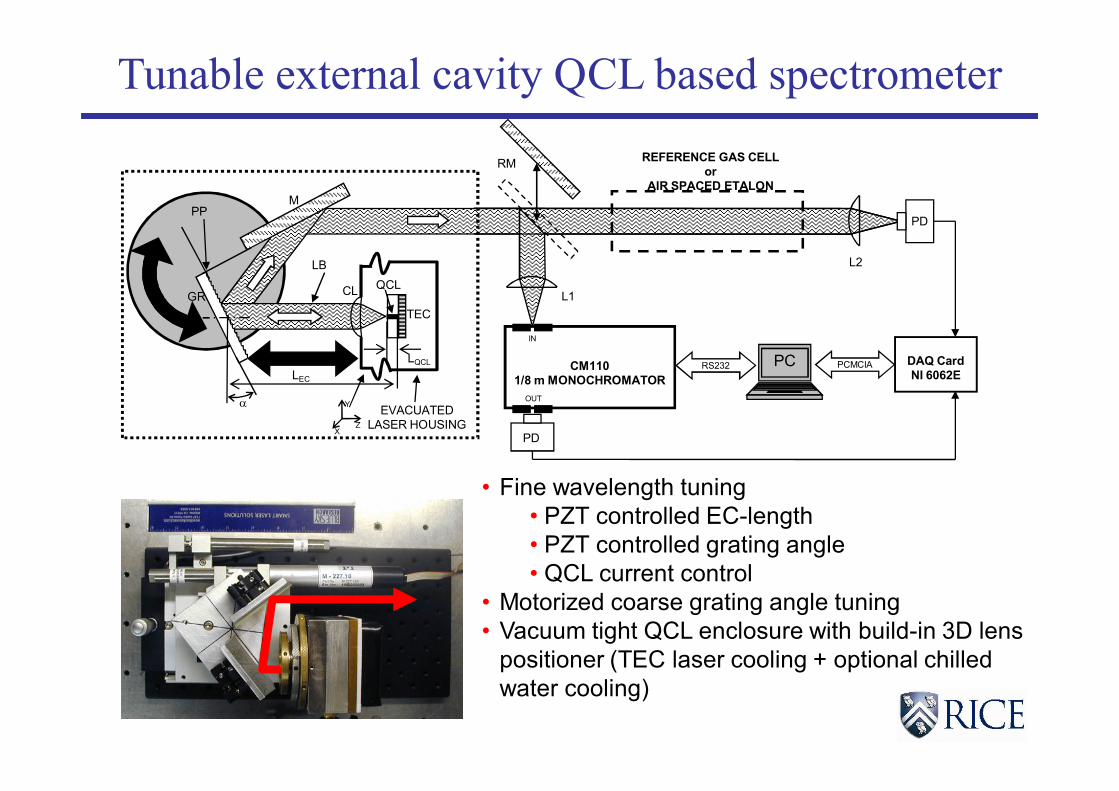
Tunable external cavity QCL based spectrometer
• Fine wavelength tuning• PZT controlled EC-length• PZT controlled grating angle• QCL current control
• Motorized coarse grating angle tuning• Vacuum tight QCL enclosure with build-in 3D lens
positioner (TEC laser cooling + optional chilledwater cooling)
IN
CM1101/8 m MONOCHROMATOR
OUT
REFERENCE GAS CELLor
AIR SPACED ETALON
RM
L1
L2
PD
DAQ CardNI 6062E
PCMCIAPCRS232
PD
TEC
QCLCL
MPP
EVACUATEDLASER HOUSING
GR
LB
Y
ZX
LEC
LQCL
a
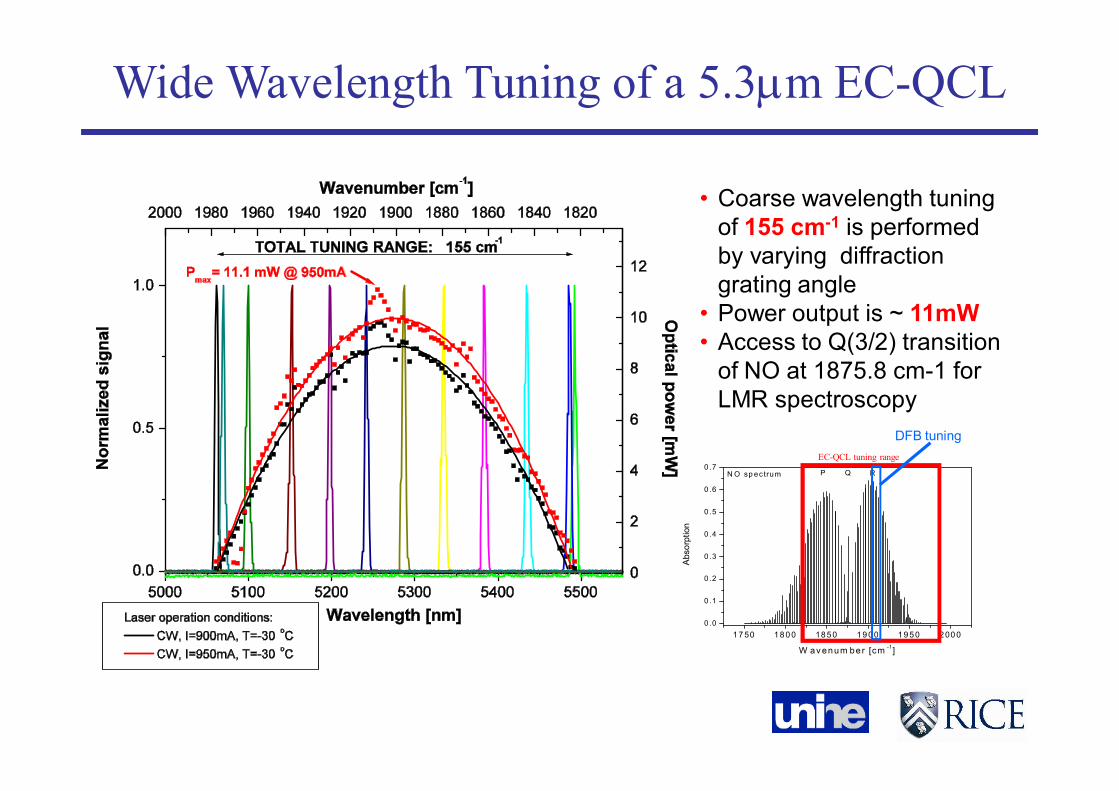
Wide Wavelength Tuning of a 5.3mm EC-QCL
• Coarse wavelength tuningof 155 cm-1 is performedby varying diffractiongrating angle
• Power output is ~ 11mW• Access to Q(3/2) transition
of NO at 1875.8 cm-1 forLMR spectroscopy
1 7 50 1 8 0 0 18 5 0 1 9 0 0 1 9 5 0 2 00 00 .0
0 .1
0 .2
0 .3
0 .4
0 .5
0 .6
0 .7RQPN O sp ec trum
Abs
orpt
ion
W av enum ber [cm -1]
EC-QCL tuning range
DFB tuning
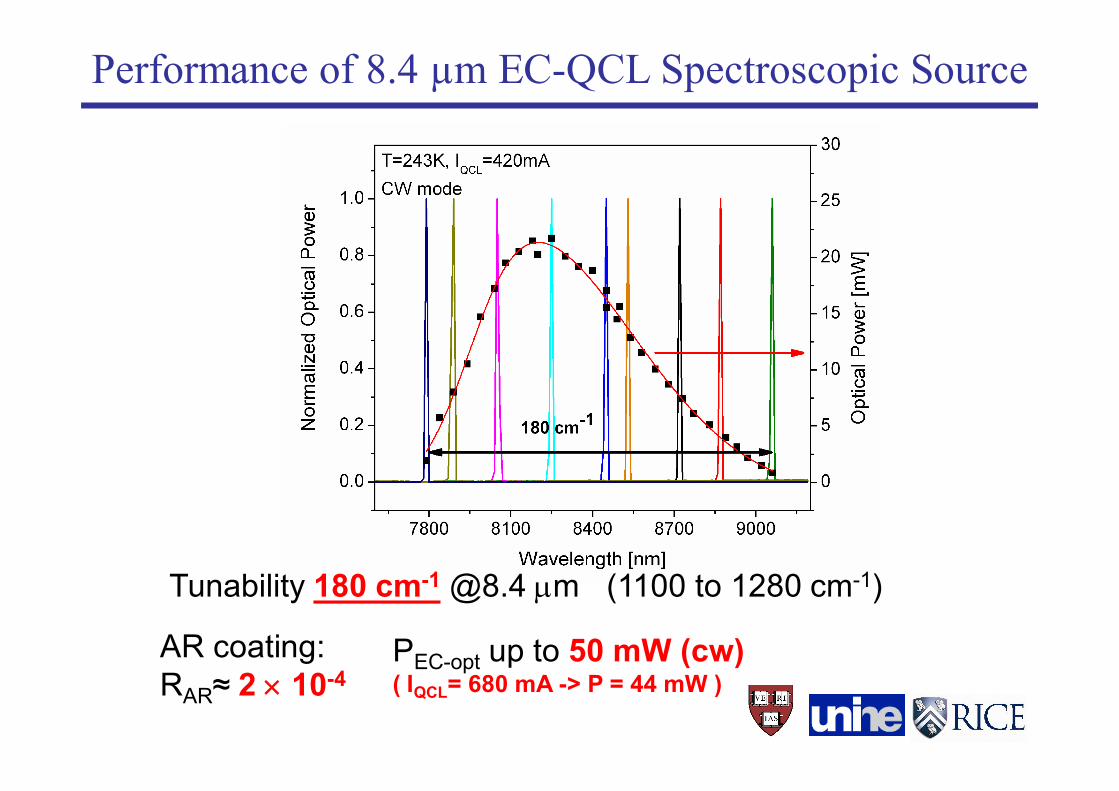
PEC-opt up to 50 mW (cw)( IQCL= 680 mA -> P = 44 mW )
Performance of 8.4 µm EC-QCL Spectroscopic Source
AR coating:RAR≈ 2 ´ 10-4
Tunability 180 cm-1 @8.4 mm (1100 to 1280 cm-1)
Quartz EnhancedPhotoacoustic Spectroscopy
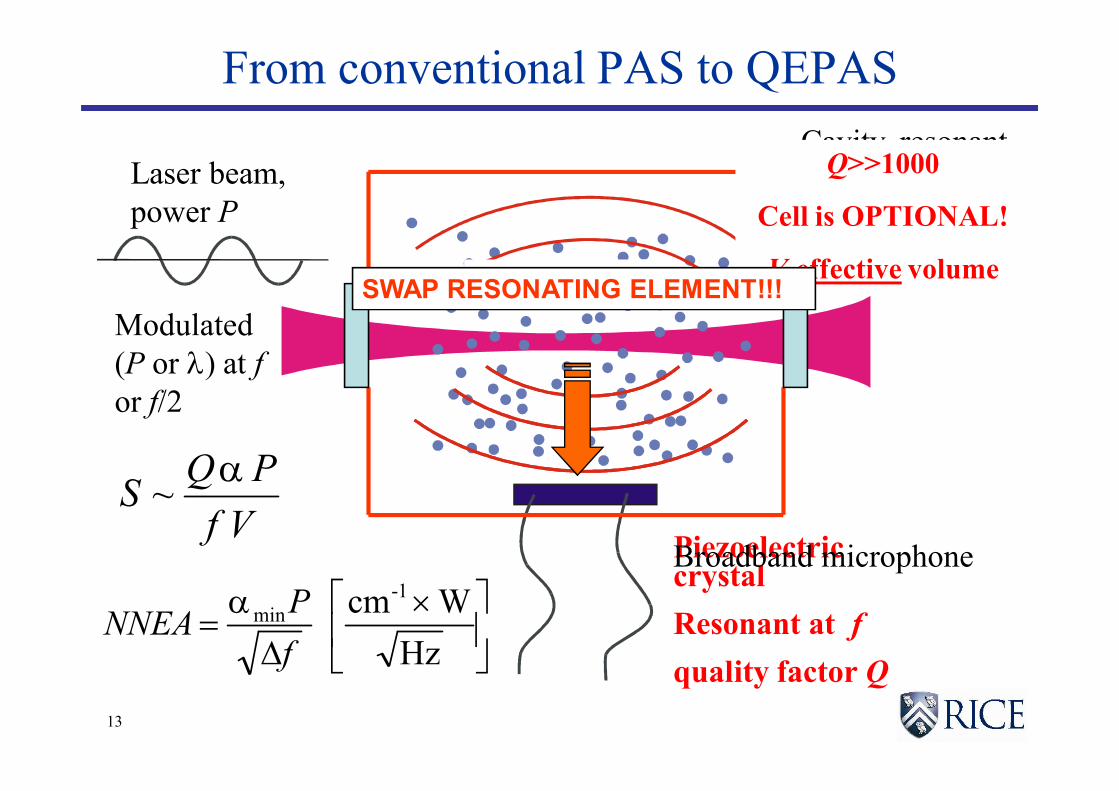
PiezoelectriccrystalResonant at fquality factor Q
Broadband microphone
From conventional PAS to QEPAS
13
Cavity, resonantat f, volume V,quality factorQ~20-200
Laser beam,power P
Absorption a
VfPQS a~
Modulated(P or l) at for f/2
Q>>1000
Cell is OPTIONAL!
V-effective volumeSWAP RESONATING ELEMENT!!!
úû
ùêë
é ´D
a=
HzWcm-1
min
fPNNEA
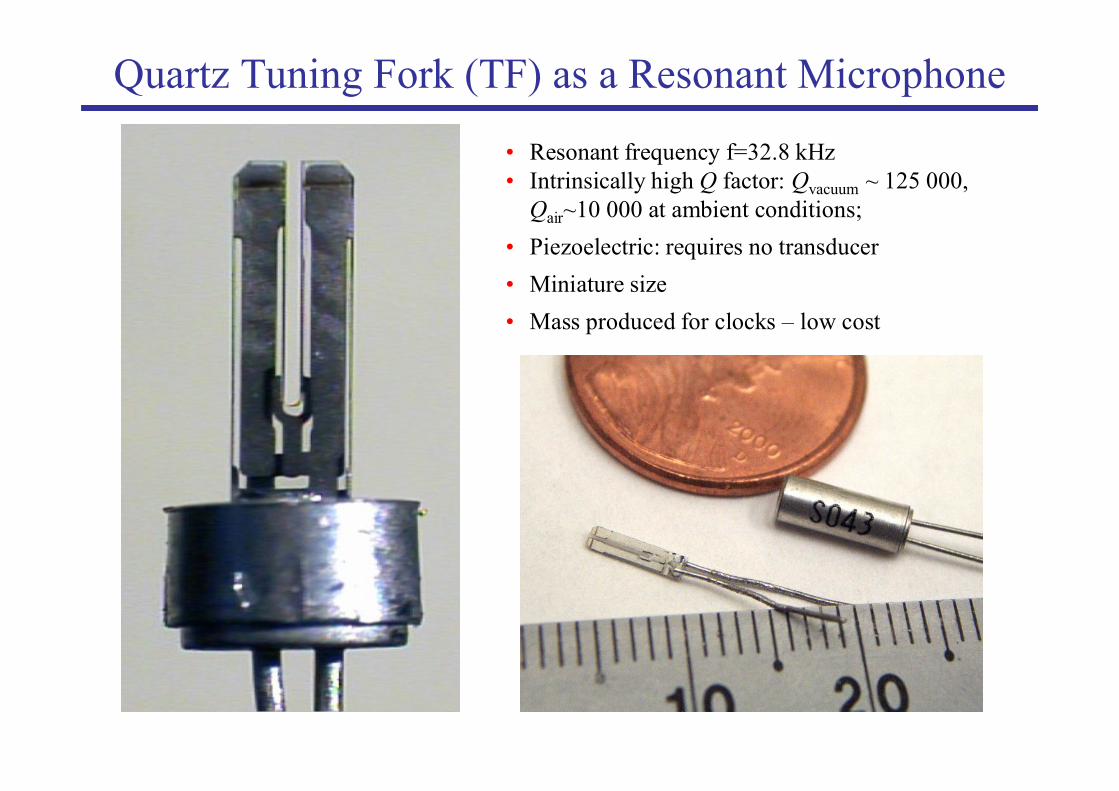
Quartz Tuning Fork (TF) as a Resonant Microphone
• Resonant frequency f=32.8 kHz• Intrinsically high Q factor: Qvacuum ~ 125 000,
Qair~10 000 at ambient conditions;• Piezoelectric: requires no transducer• Miniature size• Mass produced for clocks – low cost
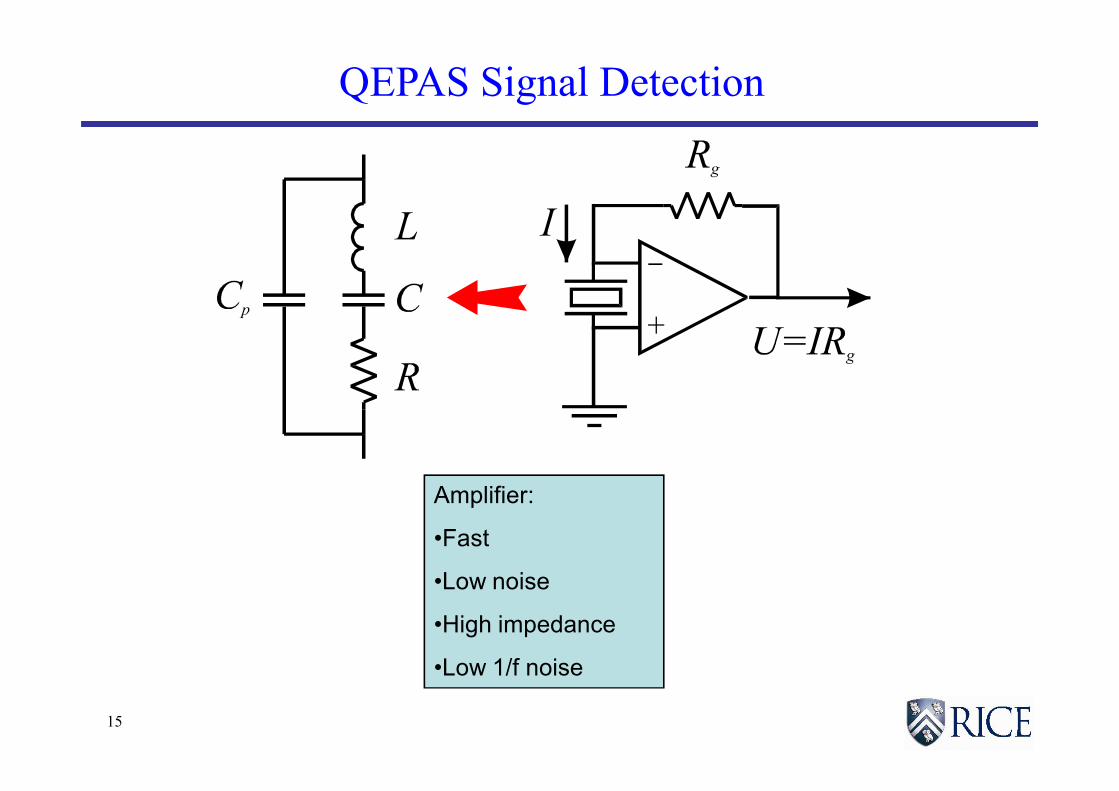
QEPAS Signal Detection
15
Amplifier:
•Fast
•Low noise
•High impedance
•Low 1/f noise
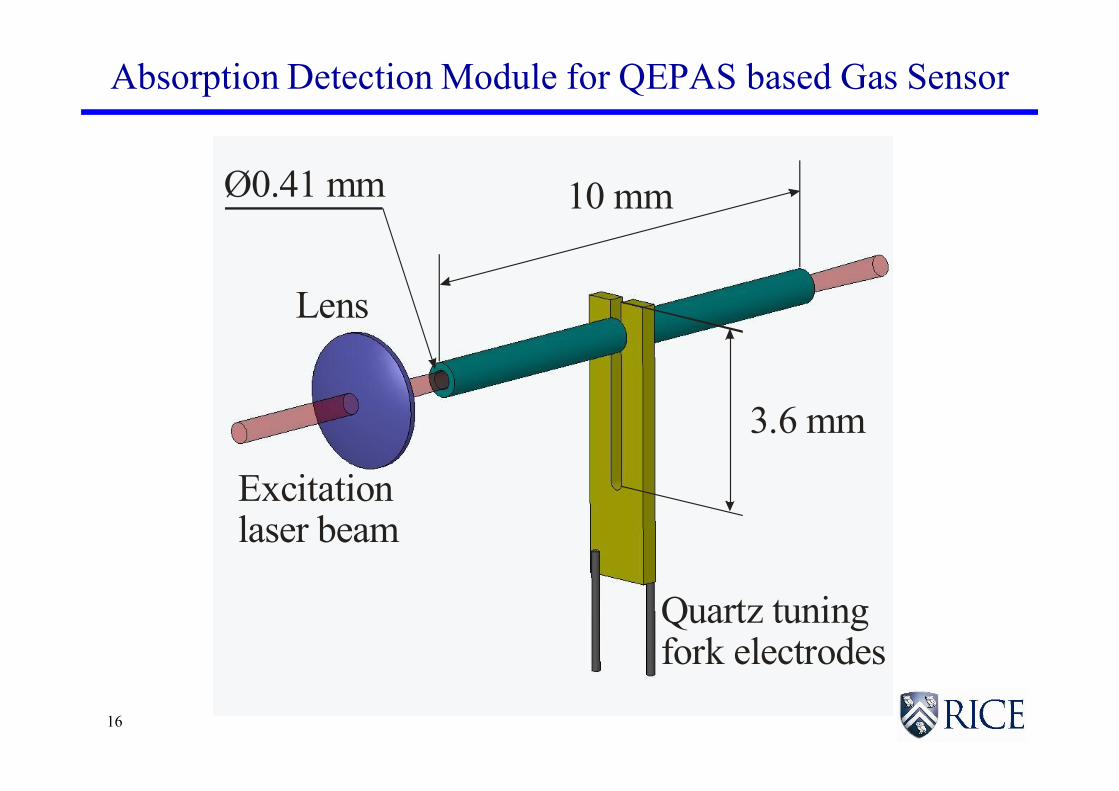
Absorption Detection Module for QEPAS based Gas Sensor
16
Ø0.41 mm 10 mm
3.6 mm
Lens
Quartz tuningfork electrodes
Excitationlaser beam
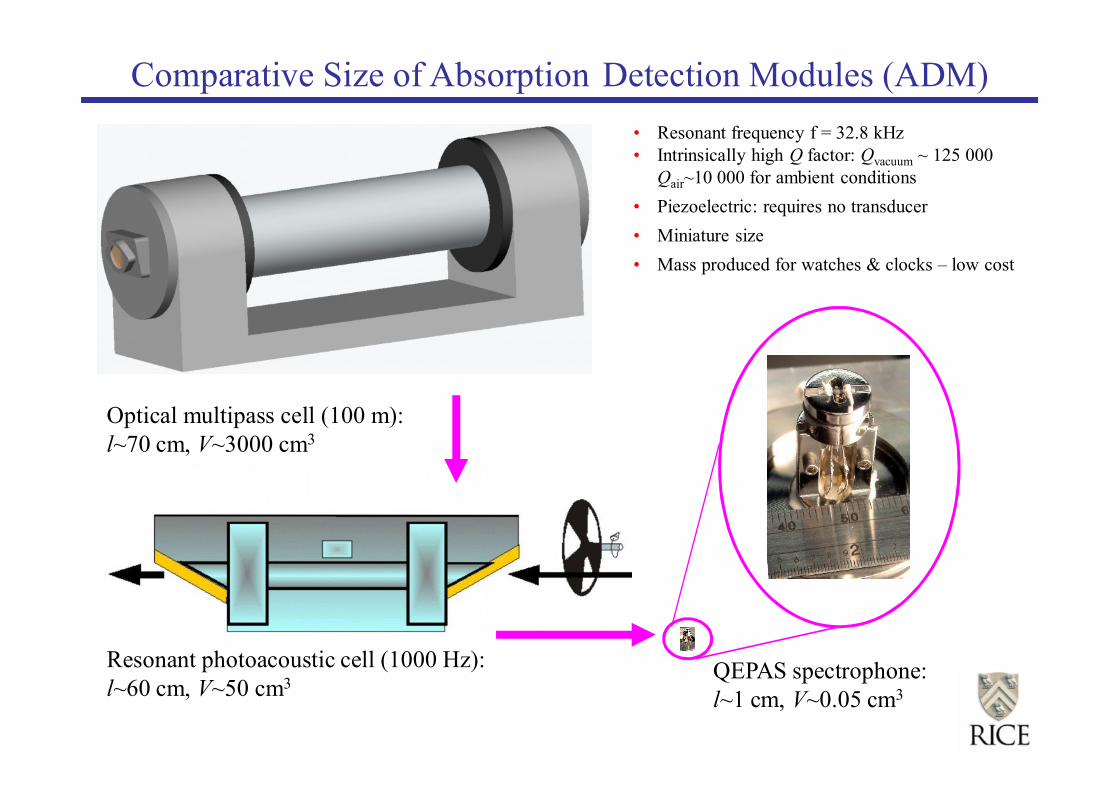
Comparative Size of Absorption Detection Modules (ADM)
Optical multipass cell (100 m):l~70 cm, V~3000 cm3
Resonant photoacoustic cell (1000 Hz):l~60 cm, V~50 cm3 QEPAS spectrophone:
l~1 cm, V~0.05 cm3
• Resonant frequency f = 32.8 kHz• Intrinsically high Q factor: Qvacuum ~ 125 000
Qair~10 000 for ambient conditions• Piezoelectric: requires no transducer• Miniature size• Mass produced for watches & clocks – low cost
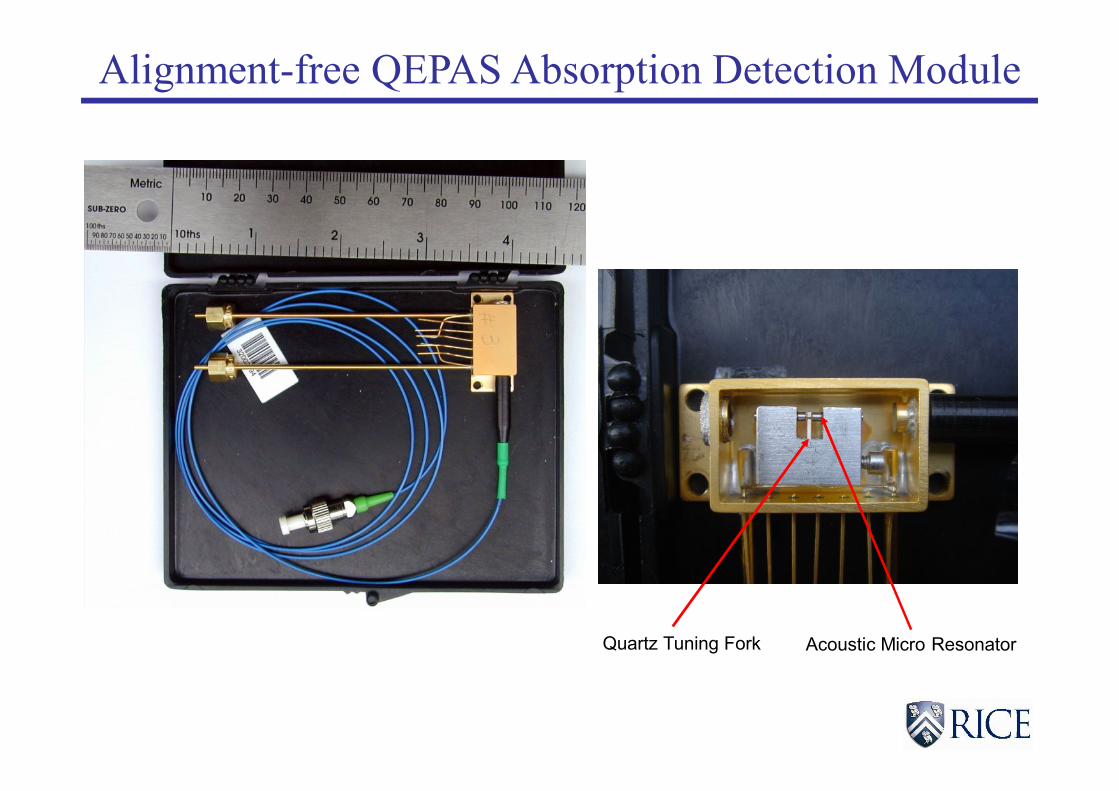
Alignment-free QEPAS Absorption Detection Module
Quartz Tuning Fork Acoustic Micro Resonator
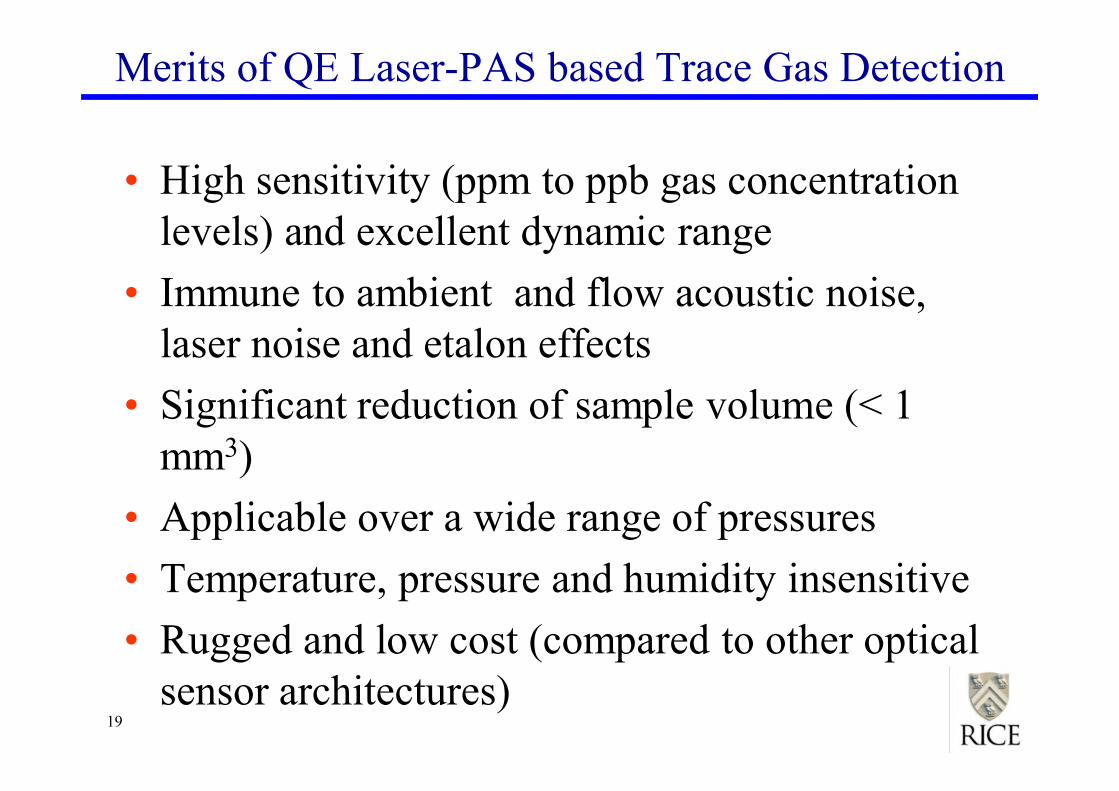
Merits of QE Laser-PAS based Trace Gas Detection
• High sensitivity (ppm to ppb gas concentrationlevels) and excellent dynamic range
• Immune to ambient and flow acoustic noise,laser noise and etalon effects
• Significant reduction of sample volume (< 1mm3)
• Applicable over a wide range of pressures• Temperature, pressure and humidity insensitive• Rugged and low cost (compared to other optical
sensor architectures)19
Trace Gas Sensing Examples
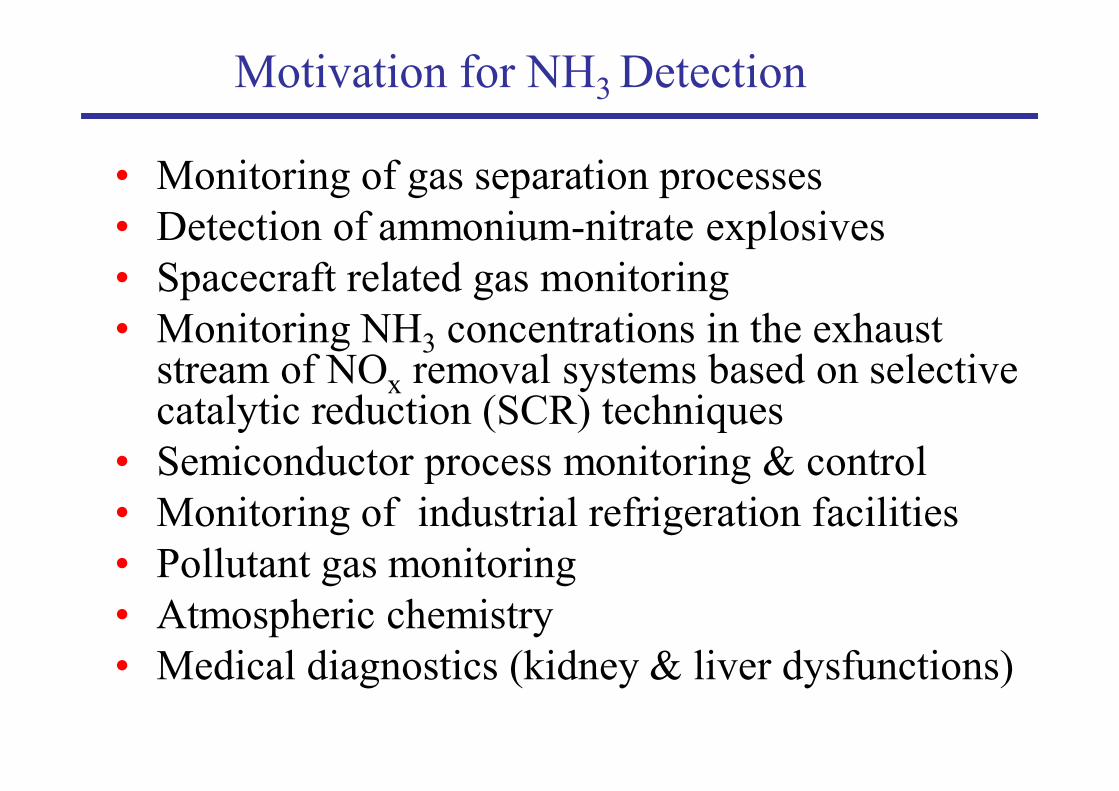
Motivation for NH3 Detection
• Monitoring of gas separation processes• Detection of ammonium-nitrate explosives• Spacecraft related gas monitoring• Monitoring NH3 concentrations in the exhaust
stream of NOx removal systems based on selectivecatalytic reduction (SCR) techniques
• Semiconductor process monitoring & control• Monitoring of industrial refrigeration facilities• Pollutant gas monitoring• Atmospheric chemistry• Medical diagnostics (kidney & liver dysfunctions)
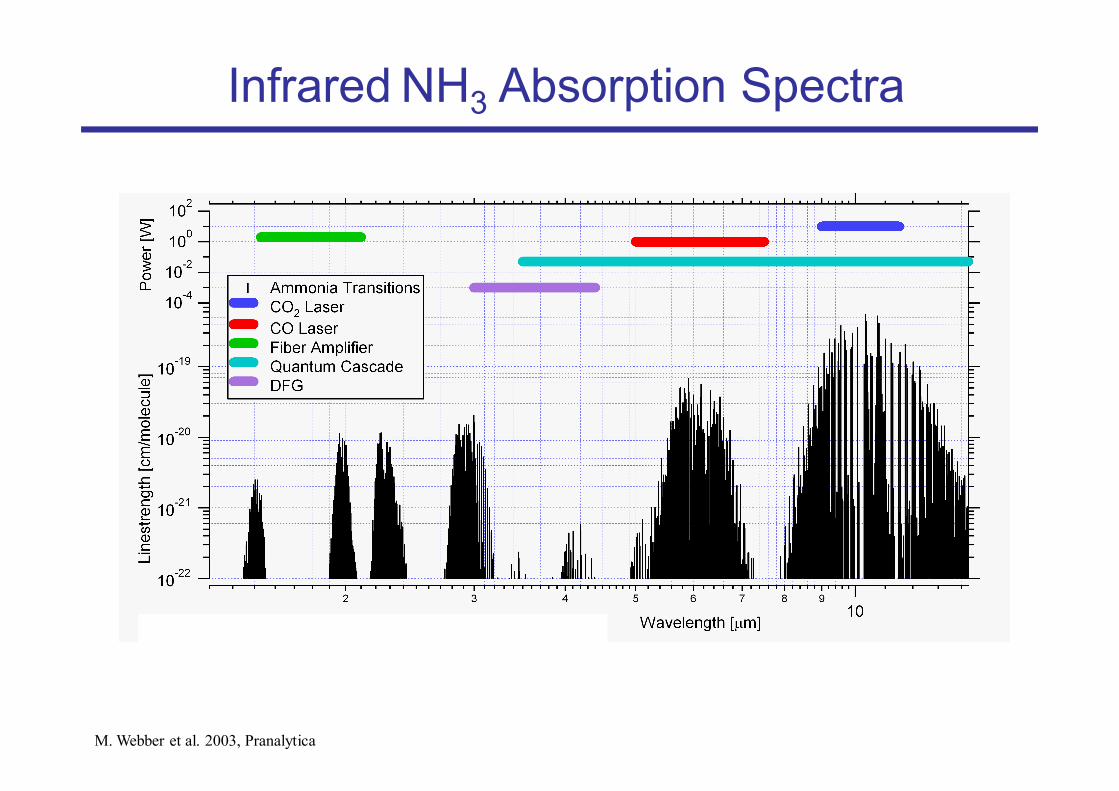
Infrared NH3 Absorption Spectra
M. Webber et al. 2003, Pranalytica
DC
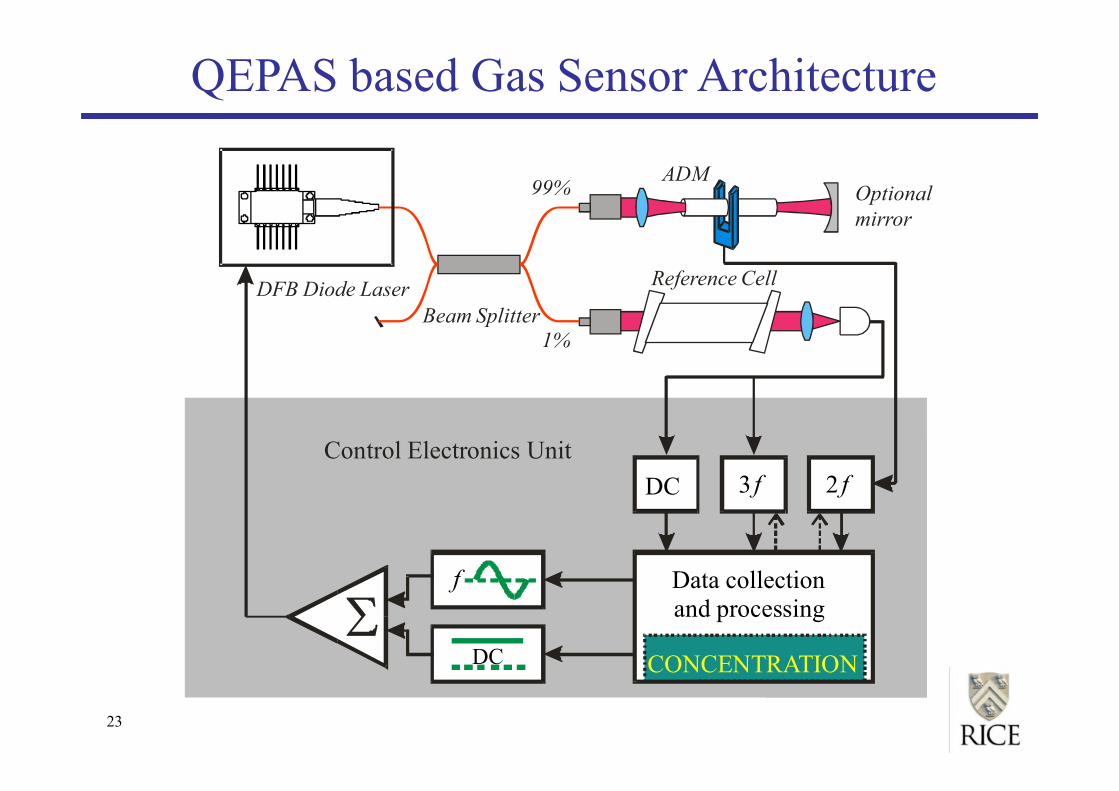
QEPAS based Gas Sensor Architecture
23
2 f3 fDC
Data collectionand processing
f
CONCENTRATION
Beam Splitter
99%
1%
ADM
Reference Cell
Control Electronics Unit
DFB Diode Laser
Optionalmirror
0
2
4
6
8
10
12
0 20 40 60 80 100 120
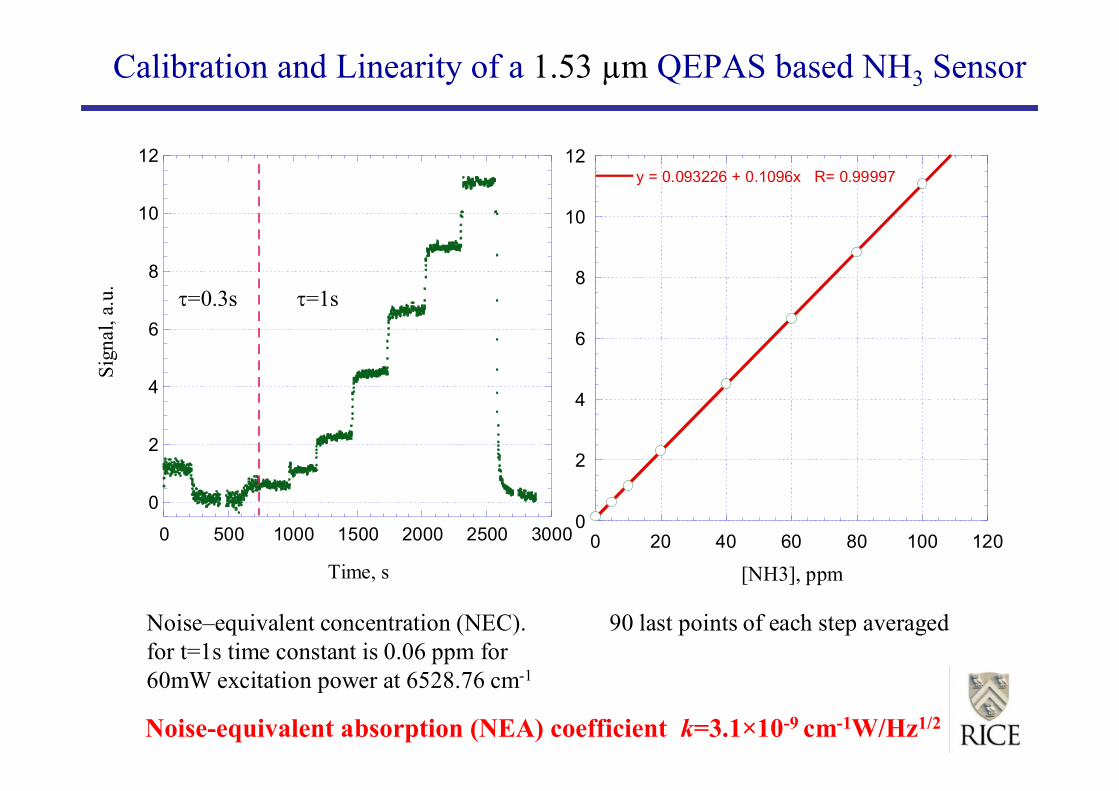
y = 0.093226 + 0.1096x R= 0.99997
Sign
al, a
.u.
[NH3], ppm
Calibration and Linearity of a 1.53 µm QEPAS based NH3 Sensor
0
2
4
6
8
10
12
0 500 1000 1500 2000 2500 3000
Sign
al, a
.u.
Time, s
t=0.3s t=1s
90 last points of each step averagedNoise–equivalent concentration (NEC).for t=1s time constant is 0.06 ppm for60mW excitation power at 6528.76 cm-1
Noise-equivalent absorption (NEA) coefficient k=3.1×10⁻⁹ cm-1W/Hz1/2
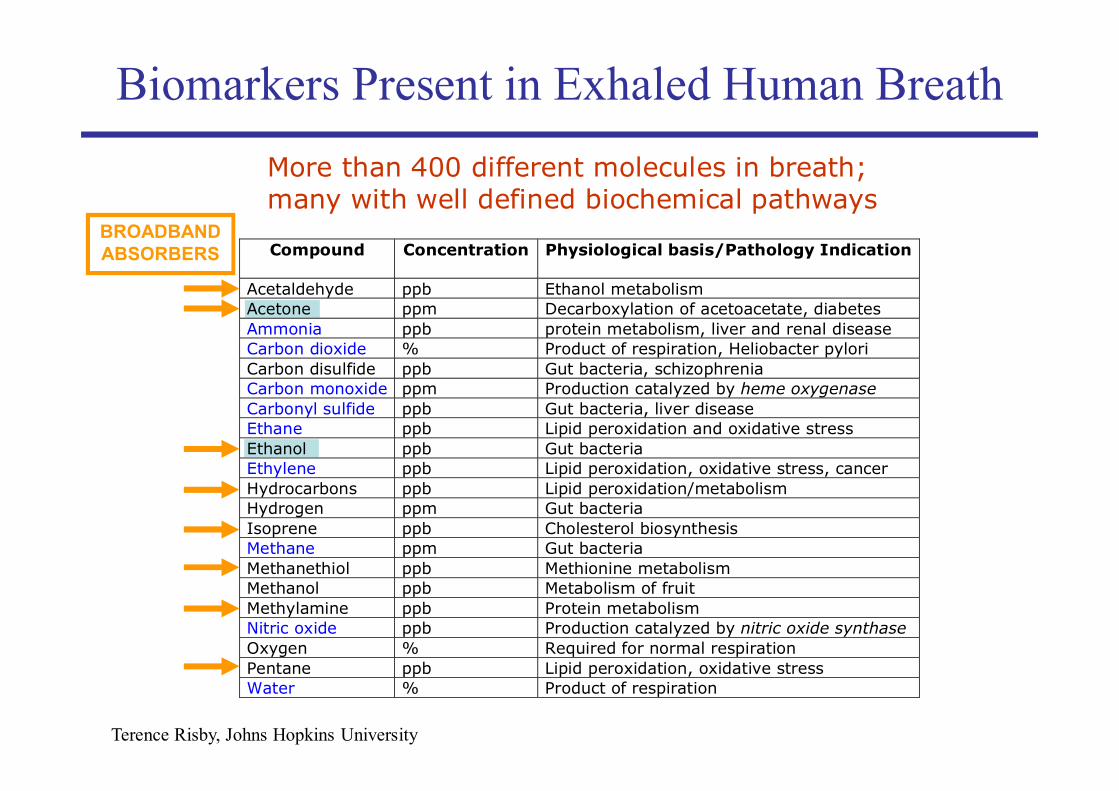
Compound Concentration Physiological basis/Pathology Indication
Acetaldehyde ppb Ethanol metabolismAcetone ppm Decarboxylation of acetoacetate, diabetesAmmonia ppb protein metabolism, liver and renal diseaseCarbon dioxide % Product of respiration, Heliobacter pyloriCarbon disulfide ppb Gut bacteria, schizophreniaCarbon monoxide ppm Production catalyzed by heme oxygenaseCarbonyl sulfide ppb Gut bacteria, liver diseaseEthane ppb Lipid peroxidation and oxidative stressEthanol ppb Gut bacteriaEthylene ppb Lipid peroxidation, oxidative stress, cancerHydrocarbons ppb Lipid peroxidation/metabolismHydrogen ppm Gut bacteriaIsoprene ppb Cholesterol biosynthesisMethane ppm Gut bacteriaMethanethiol ppb Methionine metabolismMethanol ppb Metabolism of fruitMethylamine ppb Protein metabolismNitric oxide ppb Production catalyzed by nitric oxide synthaseOxygen % Required for normal respirationPentane ppb Lipid peroxidation, oxidative stressWater % Product of respiration
More than 400 different molecules in breath;many with well defined biochemical pathways
Terence Risby, Johns Hopkins University
BROADBANDABSORBERS
Biomarkers Present in Exhaled Human Breath
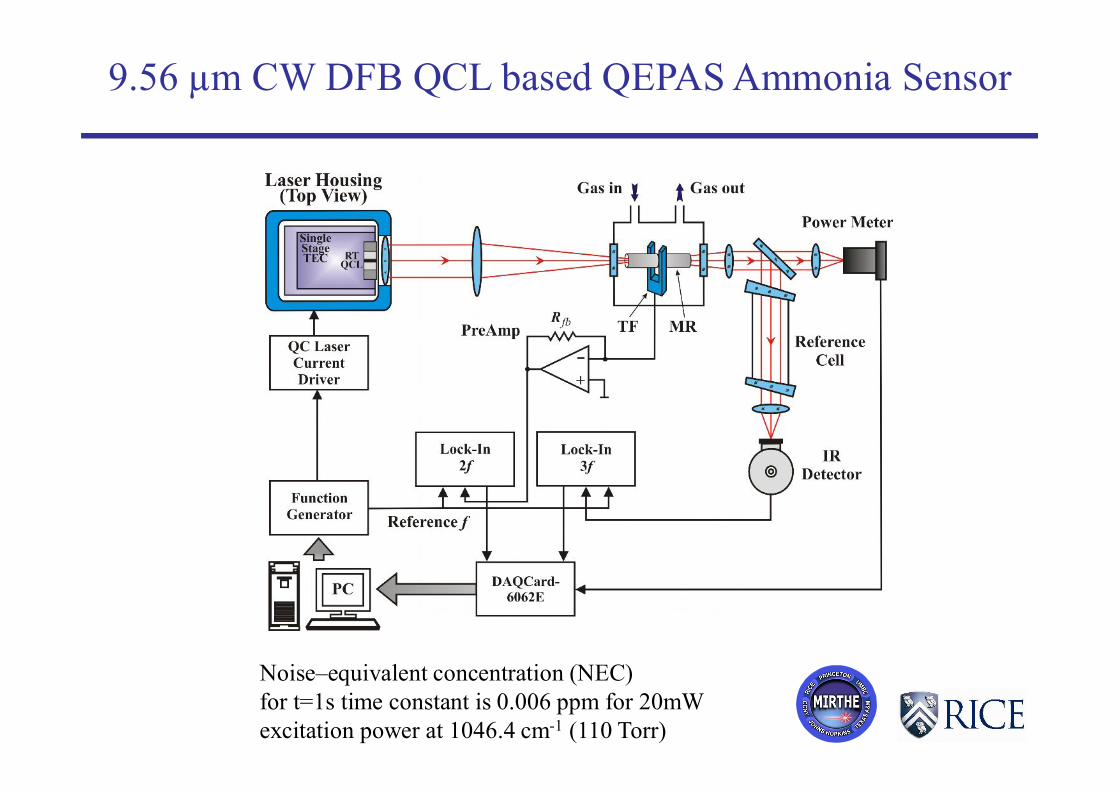
9.56 µm CW DFB QCL based QEPAS Ammonia Sensor
Noise–equivalent concentration (NEC)for t=1s time constant is 0.006 ppm for 20mWexcitation power at 1046.4 cm-1 (110 Torr)
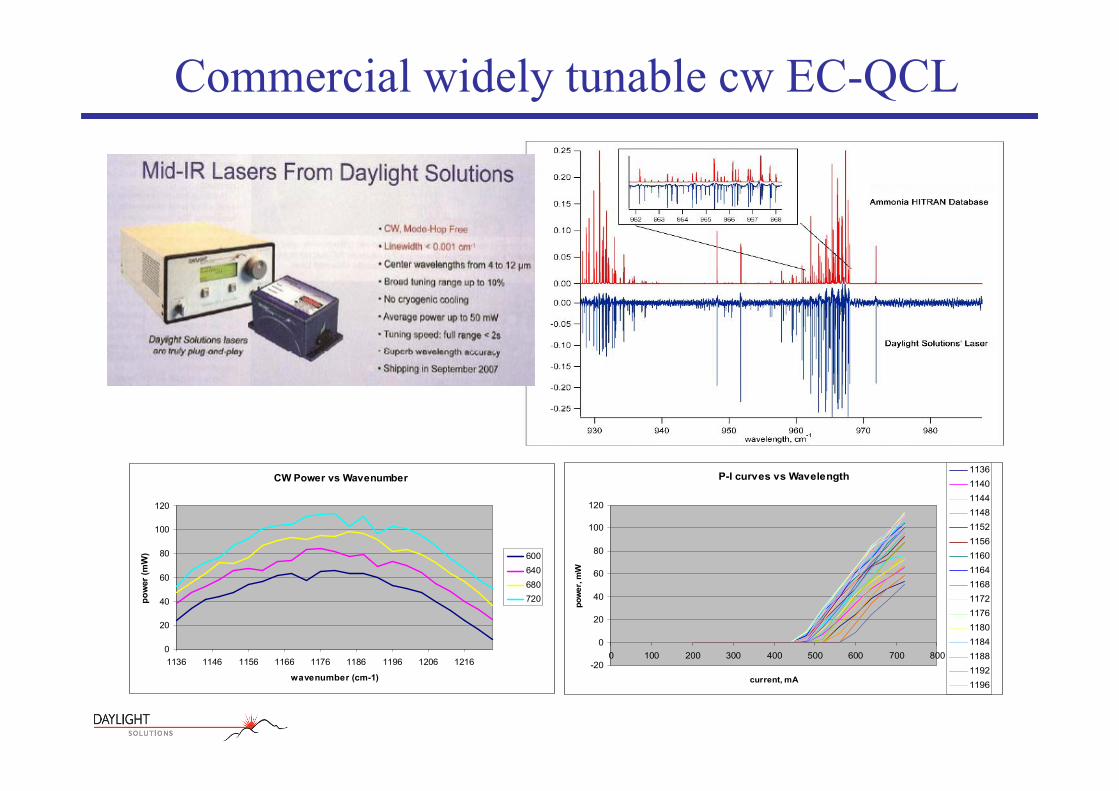
Commercial widely tunable cw EC-QCL
P-I curves vs Wavelength
-20
0
20
40
60
80
100
120
0 100 200 300 400 500 600 700 800
current, mA
pow
er, m
W
1136114011441148115211561160116411681172117611801184118811921196
CW Power vs Wavenumber
0
20
40
60
80
100
120
1136 1146 1156 1166 1176 1186 1196 1206 1216
wavenumber (cm-1)
pow
er (m
W) 600
640680720
Motivation for Nitric Oxide Detection
• Atmospheric Chemistry• Environmental pollutant gas monitoring
§ NOX monitoring from automobile exhaust andpower plant emissions§ Precursor of smog and acid rain
• Industrial process control§ Formation of oxynitride gates in CMOS Devices
• NO in medicine and biology§ Important signaling molecule in physiological
processes in humans and mammals (1998 NobelPrize in Physiology/Medicine)§ Treatment of asthma, COPD, acute lung rejection

• Mode hop free scan of up to ~2.5 cm-1 with a resolution <0.001cm-1
(30MHz) can be performed anywhere within the tuning range
High resolution spectroscopy with a 5.3mm EC-QCL
1874.7 1875.0 1875.3 1875.6 1875.9 1876.20.00
0.05
0.10
0.15
0.20
0.25
0.30
0.35
0.40
0.45
Abs
orpt
ion
Wavenumber [cm-1]
measured data
5% NO in N2 at 5 Torr (10 cm path)
HITRAN simulation
0
4
8
12
16
20
24
28
32
FTIR Res=0.125cm-1
Abs
orba
nce
x 10
-3
1820 1840 1860 1880 1900 1920 1940 1960 19800.0
0.2
0.4
0.6
0.8
1.0EC-QCL tuning range
Abs
orpt
ion
Wavenumber [cm-1]
1902.4 1903.2 1904.00
20
40
60
80
0.0
0.1
0.2
0.3
0.4
Nor
mal
ized
QE
PA
SA
mpl
itude
[mV
/mW
]
Wavenumber [cm-1]
QEPAS measurement
4.2% NO in N2 at 600 Torr Absorbance (H
ITRA
N)
HITRAN 2005 (1cm path)
In collaboration with:
Access to NO Q(3/2)transition at 1875.8 cm-1
for Faraday rotationspectroscopy
1875.7 1875.8 1875.9
0.0
0.2
0.4Q(3/2)
Q(5/2)
10ppm NO in N2Iqcl=860 mA, P=35 TorrMDL=5.5ppb @ t=1 sfmod=950 Hz, B=110 Gauss
Am
plitu
de [m
V]
Wavenumber [cm-1]
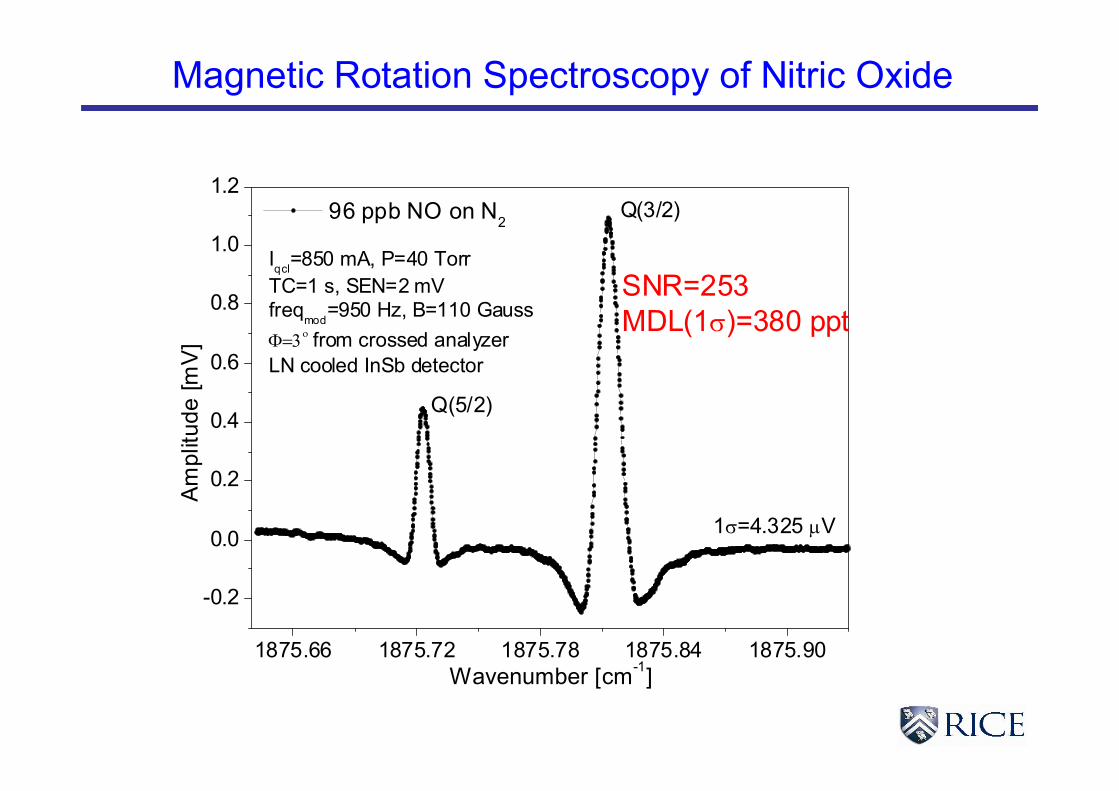
Magnetic Rotation Spectroscopy of Nitric Oxide
1875.66 1875.72 1875.78 1875.84 1875.90
-0.2
0.0
0.2
0.4
0.6
0.8
1.0
1.2
1s=4.325 mV
SNR=253MDL(1s)=380 ppt
Iqcl=850 mA, P=40 TorrTC=1 s, SEN=2 mVfreqmod=950 Hz, B=110 GaussF=3o from crossed analyzerLN cooled InSb detector
Q(3/2)
Q(5/2)
Am
plitu
de [m
V]
Wavenumber [cm-1]
96 ppb NO on N2
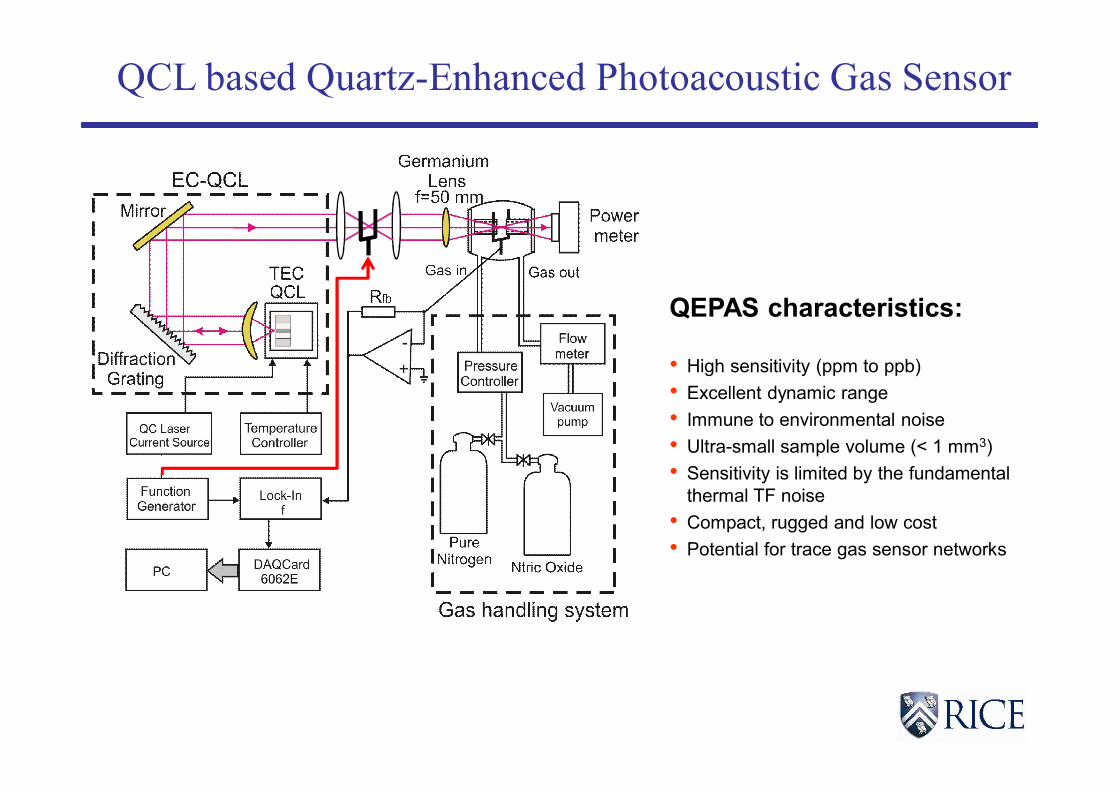
QCL based Quartz-Enhanced Photoacoustic Gas Sensor
QEPAS characteristics:
• High sensitivity (ppm to ppb)• Excellent dynamic range• Immune to environmental noise• Ultra-small sample volume (< 1 mm3)• Sensitivity is limited by the fundamental
thermal TF noise• Compact, rugged and low cost• Potential for trace gas sensor networks
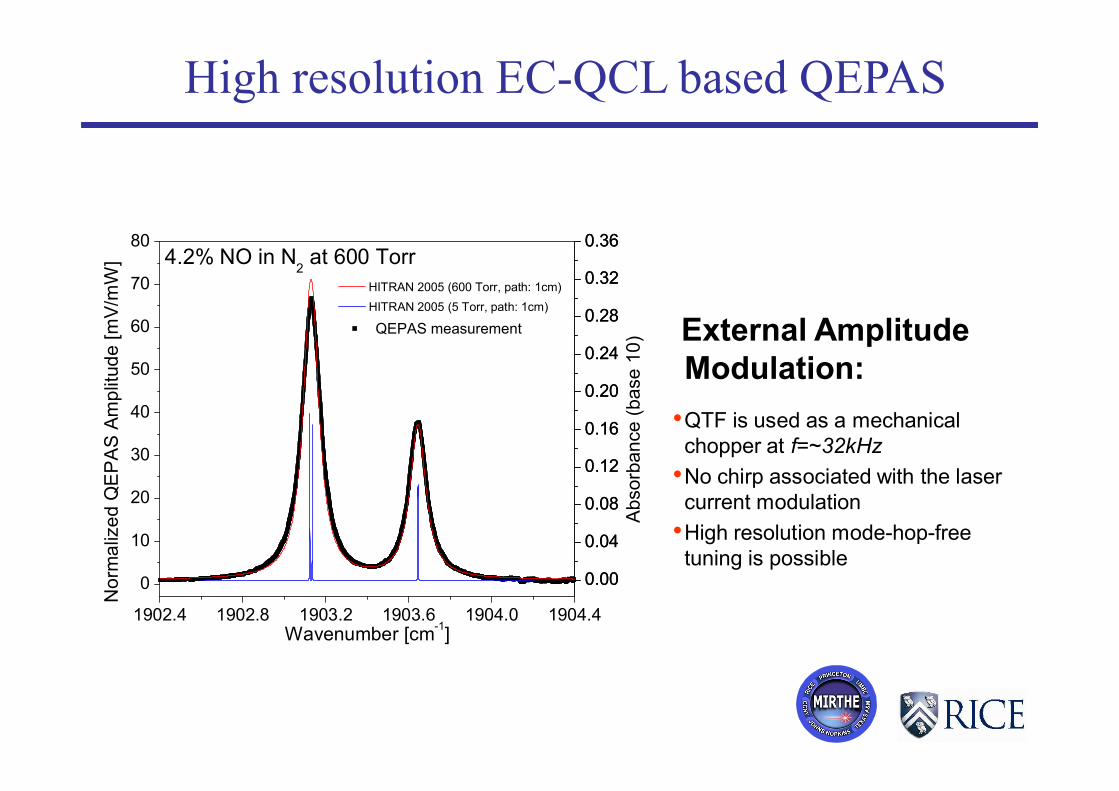
1902.4 1902.8 1903.2 1903.6 1904.0 1904.4
0
10
20
30
40
50
60
70
80
0.00
0.04
0.08
0.12
0.16
0.20
0.24
0.28
0.32
0.36
0.00
0.04
0.08
0.12
0.16
0.20
0.24
0.28
0.32
0.36
Nor
mal
ized
QE
PA
S A
mpl
itude
[mV/
mW
]
Wavenumber [cm-1]
QEPAS measurement
4.2% NO in N2 at 600 Torr
HITRAN 2005 (5 Torr, path: 1cm)
Abs
orba
nce
(bas
e 10
)
HITRAN 2005 (600 Torr, path: 1cm)
High resolution EC-QCL based QEPAS
External AmplitudeModulation:
•QTF is used as a mechanicalchopper at f=~32kHz
•No chirp associated with the lasercurrent modulation
•High resolution mode-hop-freetuning is possible
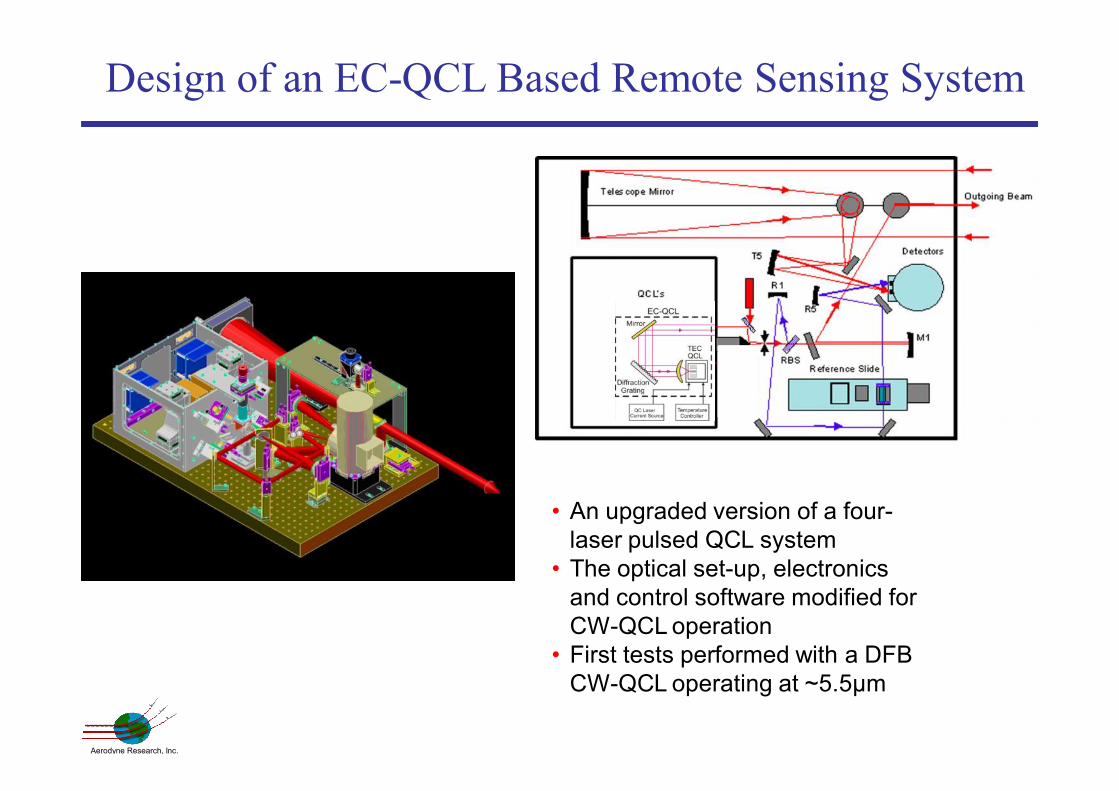
Design of an EC-QCL Based Remote Sensing System
• An upgraded version of a four-laser pulsed QCL system
• The optical set-up, electronicsand control software modified forCW-QCL operation
• First tests performed with a DFBCW-QCL operating at ~5.5µm
Aerodyne Research, Inc.
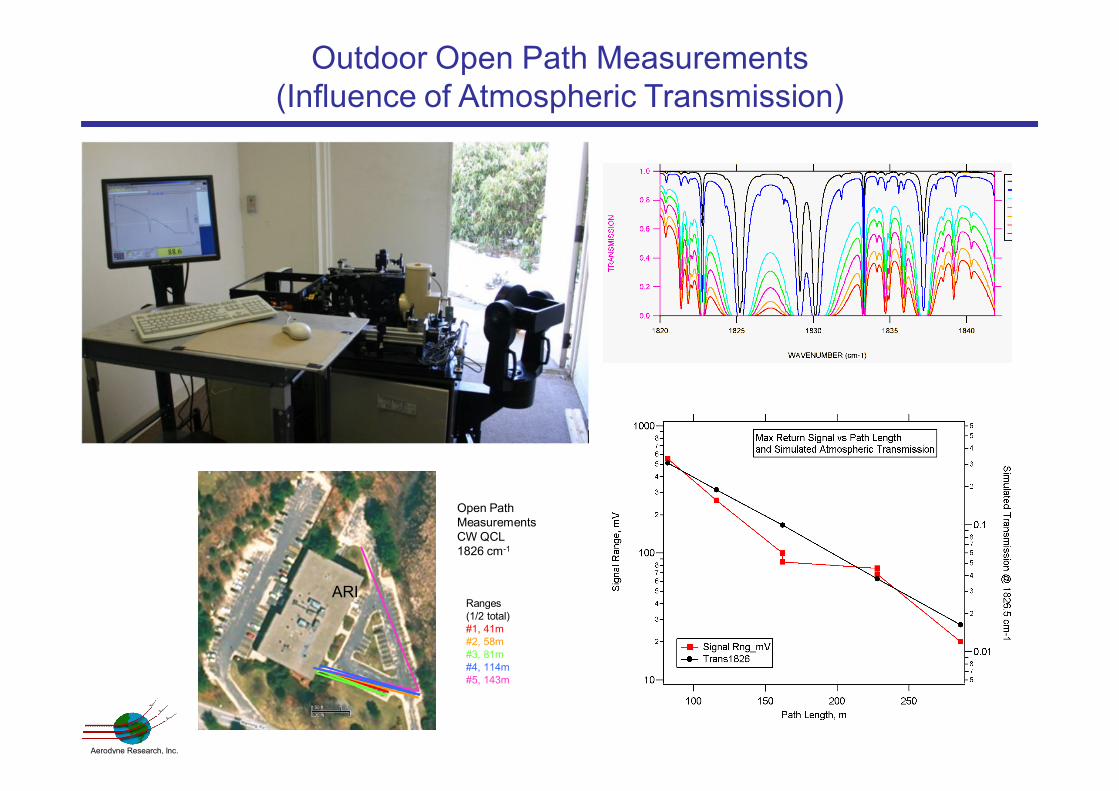
Outdoor Open Path Measurements(Influence of Atmospheric Transmission)
Ranges(1/2 total)#1, 41m#2, 58m#3, 81m#4, 114m#5, 143m
ARI
Open PathMeasurementsCW QCL1826 cm-1
Aerodyne Research, Inc.
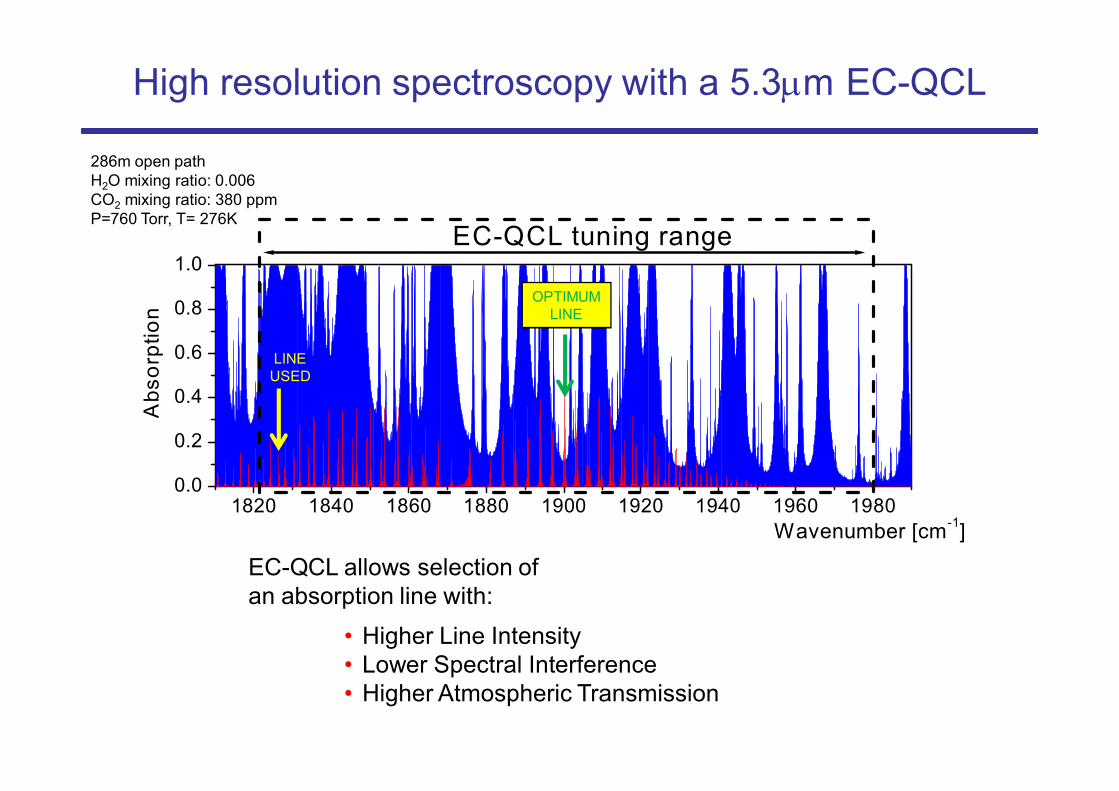
High resolution spectroscopy with a 5.3mm EC-QCL
1820 1840 1860 1880 1900 1920 1940 1960 19800.0
0.2
0.4
0.6
0.8
1.0EC-QCL tuning range
Abs
orpt
ion
Wavenumber [cm-1]
LINEUSED
OPTIMUMLINE
EC-QCL allows selection ofan absorption line with:
• Higher Line Intensity• Lower Spectral Interference• Higher Atmospheric Transmission
286m open pathH2O mixing ratio: 0.006CO2 mixing ratio: 380 ppmP=760 Torr, T= 276K
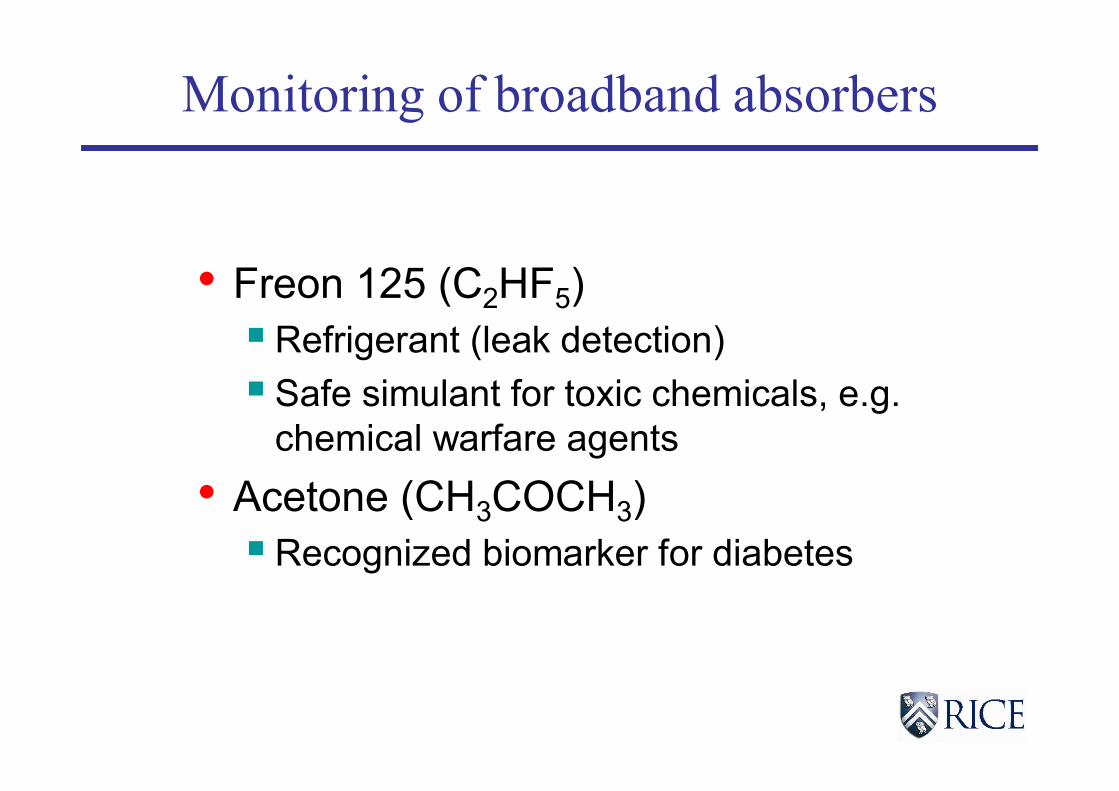
• Freon 125 (C2HF5)§Refrigerant (leak detection)§ Safe simulant for toxic chemicals, e.g.
chemical warfare agents• Acetone (CH3COCH3)§Recognized biomarker for diabetes
Monitoring of broadband absorbers
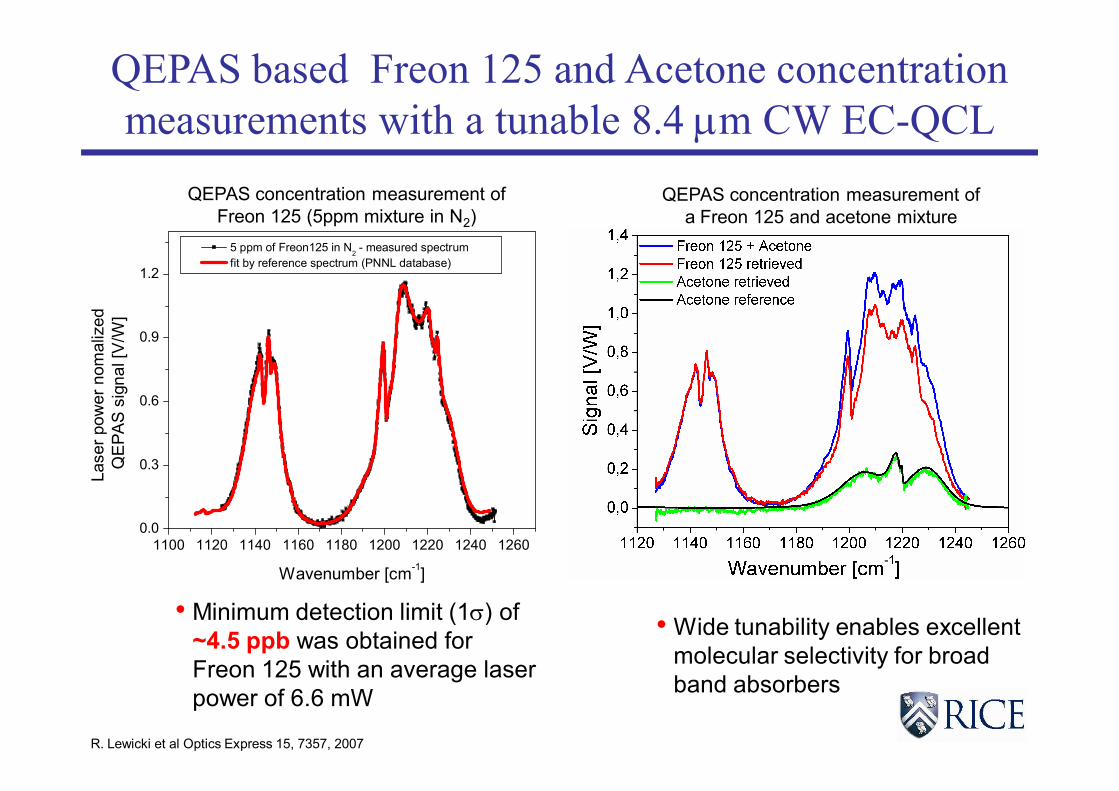
QEPAS concentration measurement ofFreon 125 (5ppm mixture in N2)
QEPAS based Freon 125 and Acetone concentrationmeasurements with a tunable 8.4 mm CW EC-QCL
• Minimum detection limit (1s) of~4.5 ppb was obtained forFreon 125 with an average laserpower of 6.6 mW
1100 1120 1140 1160 1180 1200 1220 1240 12600.0
0.3
0.6
0.9
1.2
Lase
r pow
er n
omal
ized
QE
PAS
sig
nal [
V/W
]
Wavenumber [cm-1]
5 ppm of Freon125 in N2 - measured spectrum fit by reference spectrum (PNNL database)
• Wide tunability enables excellentmolecular selectivity for broadband absorbers
QEPAS concentration measurement ofa Freon 125 and acetone mixture
R. Lewicki et al Optics Express 15, 7357, 2007
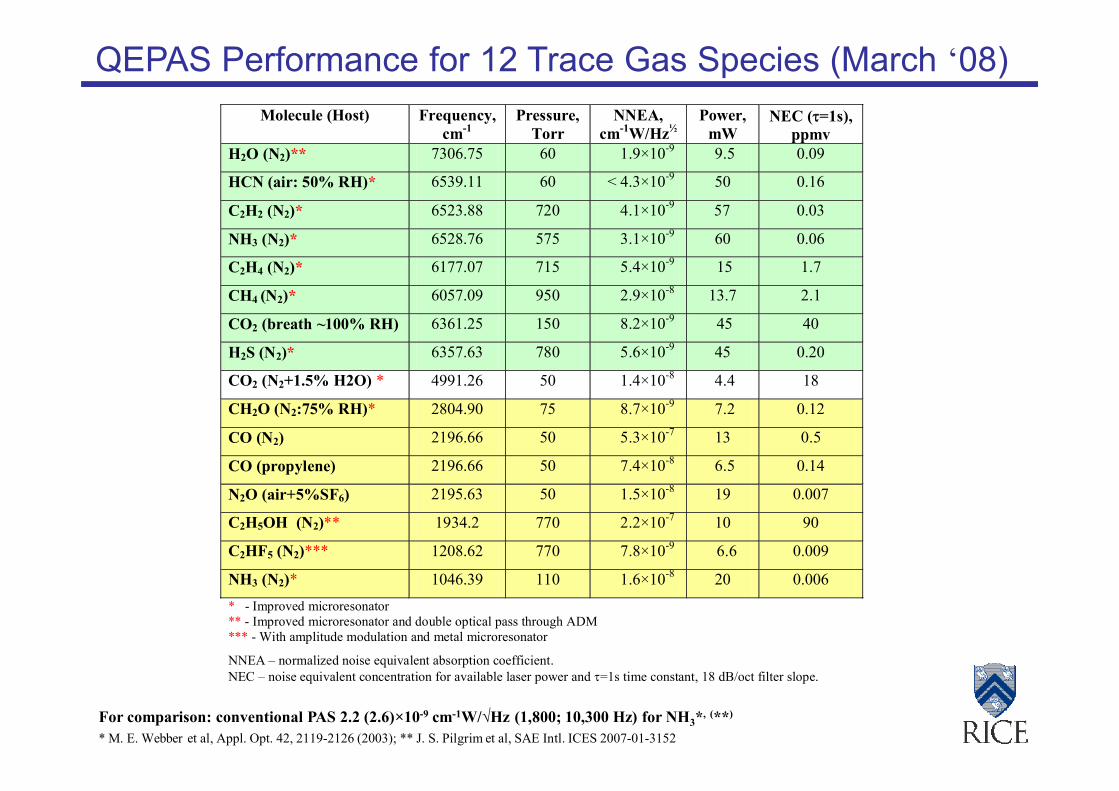
QEPAS Performance for 12 Trace Gas Species (March ‘08)
* - Improved microresonator** - Improved microresonator and double optical pass through ADM*** - With amplitude modulation and metal microresonator
NNEA – normalized noise equivalent absorption coefficient.NEC – noise equivalent concentration for available laser power and t=1s time constant, 18 dB/oct filter slope.
Molecule (Host) Frequency,cm-1
Pressure,Torr
NNEA,cm-1W/Hz½
Power,mW
NEC (t=1s),ppmv
H2O (N2)** 7306.75 60 1.9×10⁻⁹ 9.5 0.09
HCN (air: 50% RH)* 6539.11 60 < 4.3×10⁻⁹ 50 0.16
C2H2 (N2)* 6523.88 720 4.1×10⁻⁹ 57 0.03
NH3 (N2)* 6528.76 575 3.1×10⁻⁹ 60 0.06
C2H4 (N2)* 6177.07 715 5.4×10⁻⁹ 15 1.7
CH4 (N2)* 6057.09 950 2.9×10⁻⁸ 13.7 2.1
CO2 (breath ~100% RH) 6361.25 150 8.2×10⁻⁹ 45 40
H2S (N2)* 6357.63 780 5.6×10⁻⁹ 45 0.20
CO2 (N2+1.5% H2O) * 4991.26 50 1.4×10⁻⁸ 4.4 18
CH2O (N2:75% RH)* 2804.90 75 8.7×10⁻⁹ 7.2 0.12
CO (N2) 2196.66 50 5.3×10⁻⁷ 13 0.5
CO (propylene) 2196.66 50 7.4×10⁻⁸ 6.5 0.14
N2O (air+5%SF6) 2195.63 50 1.5×10⁻⁸ 19 0.007
C2H5OH (N2)** 1934.2 770 2.2×10⁻⁷ 10 90
C2HF5 (N2)*** 1208.62 770 7.8×10⁻⁹ 6.6 0.009
NH3 (N2)* 1046.39 110 1.6×10⁻⁸ 20 0.006
For comparison: conventional PAS 2.2 (2.6)×10-9 cm-1W/√Hz (1,800; 10,300 Hz) for NH3*, (**)
* M. E. Webber et al, Appl. Opt. 42, 2119-2126 (2003); ** J. S. Pilgrim et al, SAE Intl. ICES 2007-01-3152
Future of Chemical Trace Gas Sensing
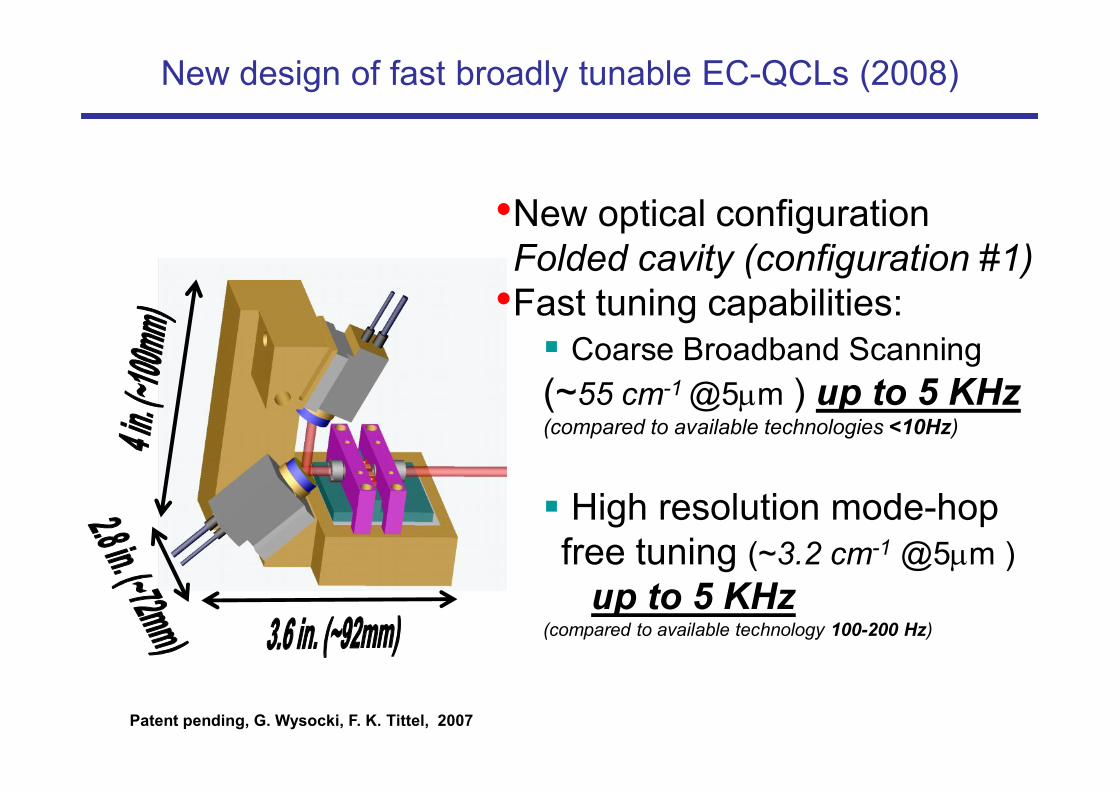
New design of fast broadly tunable EC-QCLs (2008)
•New optical configurationFolded cavity (configuration #1)
•Fast tuning capabilities:§ Coarse Broadband Scanning(~55 cm-1 @5mm ) up to 5 KHz(compared to available technologies <10Hz)
§ High resolution mode-hopfree tuning (~3.2 cm-1 @5mm )
up to 5 KHz(compared to available technology 100-200 Hz)
Patent pending, G. Wysocki, F. K. Tittel, 2007
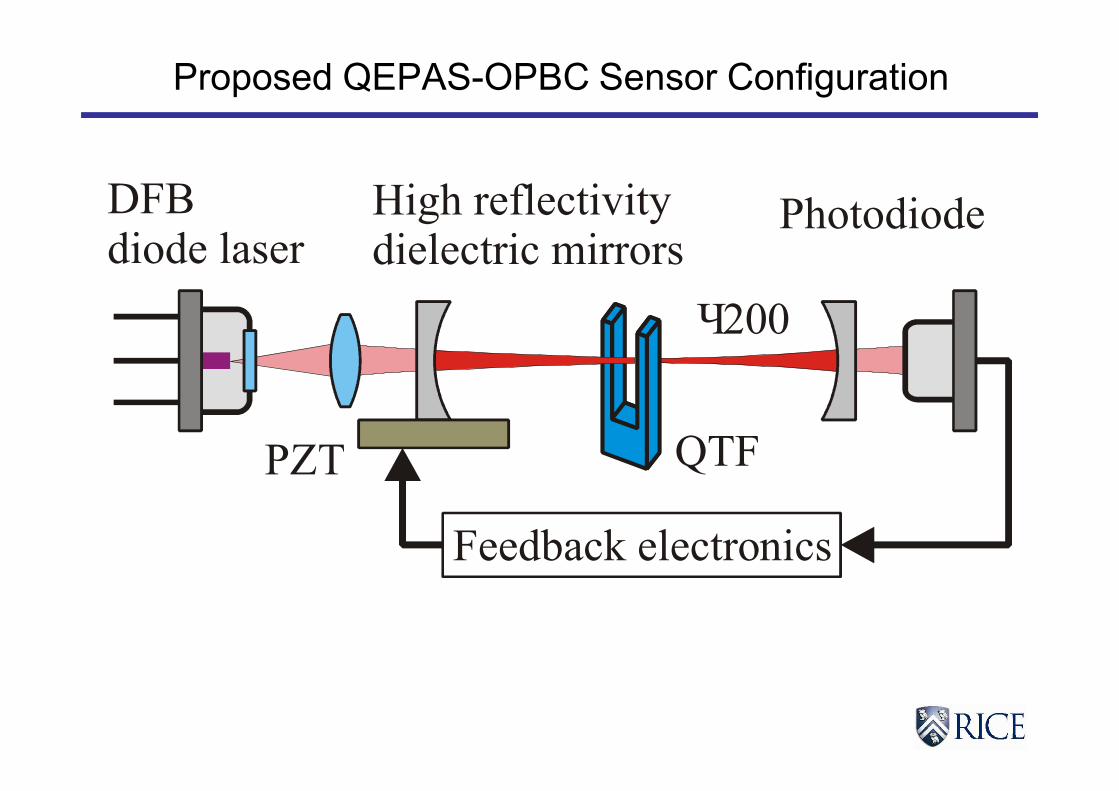
Proposed QEPAS-OPBC Sensor Configuration
Ч200
DFBdiode laser
High reflectivitydielectric mirrors
QTFPZT
Feedback electronics
Photodiode

Wireless Sensor Networks for Gas Sensing
• Each point called “mote”• Advantages?§ Spatial resolution§ Measure fluxes
• What is needed?§ Low power§ Low cost§ Ultra miniature§ Replicable§ Autonomy
To Internet viaBase-station
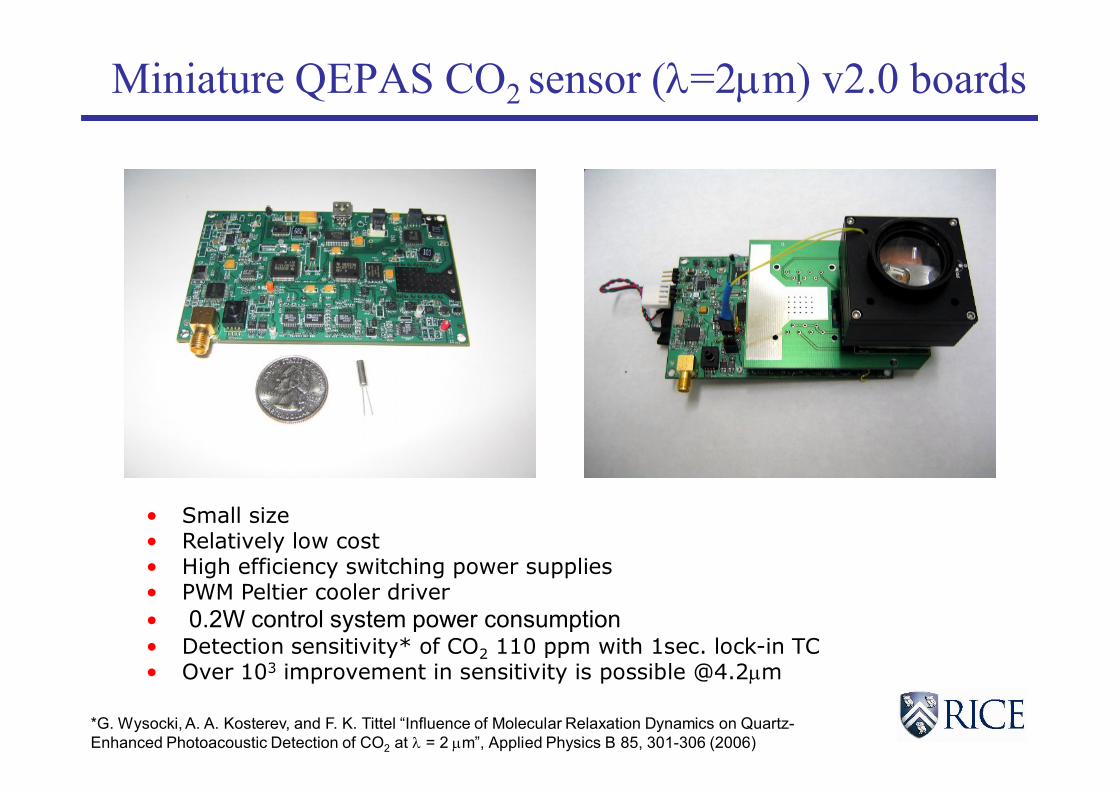
Miniature QEPAS CO2 sensor (l=2mm) v2.0 boards
• Small size• Relatively low cost• High efficiency switching power supplies• PWM Peltier cooler driver• 0.2W control system power consumption• Detection sensitivity* of CO2 110 ppm with 1sec. lock-in TC• Over 103 improvement in sensitivity is possible @4.2mm
*G. Wysocki, A. A. Kosterev, and F. K. Tittel “Influence of Molecular Relaxation Dynamics on Quartz-Enhanced Photoacoustic Detection of CO2 at l = 2 mm”, Applied Physics B 85, 301-306 (2006)
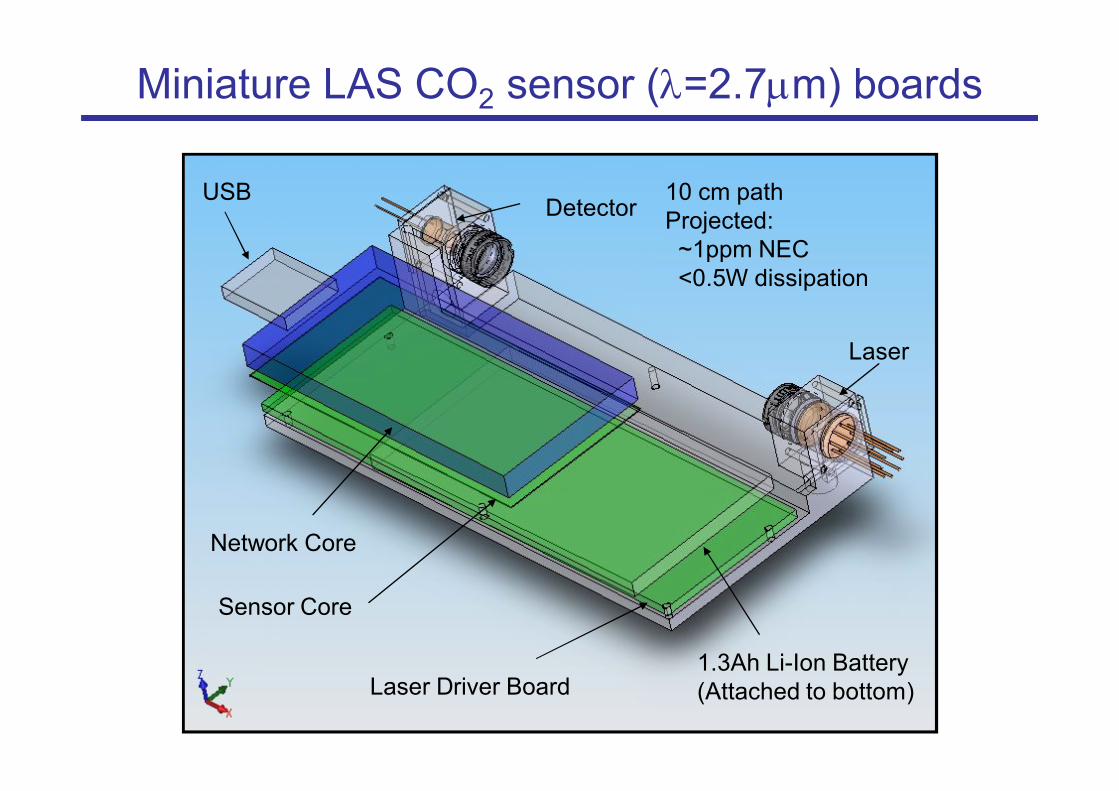
1.3Ah Li-Ion Battery(Attached to bottom)Laser Driver Board
Sensor Core
Network Core
Laser
Detector10 cm pathProjected:~1ppm NEC<0.5W dissipation
USB
Miniature LAS CO2 sensor (l=2.7mm) boards
Summary & Future Directions of QCL based Gas Sensor Technology
• Quantum and Interband Cascade Laser based Trace Gas Sensors§ Compact, tunable, and robust§ High sensitivity (<10-4) and selectivity (3 to 500 MHz)§ Capable of fast data acquisition and analysis§ Detected 13 trace gases to date: NH3, CH4, N2O, CO2, CO, NO, H2O, COS, C2H4,
H2CO, SO2, C2H5OH, C2HF5 and several isotopic species of C, O, N and H.• New Applications of Trace Gas Detection
§ Environmental Monitoring (urban quality - H2CO and, isotopic ratio measurementsof CO2 and CH4, fire detection and quantification of engine exhausts)
§ Industrial process control and chemical analysis ( NO, NH3, H2O, and H2S)§ Medical & biomedical diagnostics (NO, NH3, N2O, H2CO and CH3COCH3)§ Hand-held sensors and sensor network technologies (CO2)
• Future Directions and Collaborations§ Improvements of the existing sensing technologies using novel, thermoelectrically
cooled, cw, high power, and broadly wavelength tunable mid-IR interband andintersubband quantum cascade lasers
§ New applications enabled by novel broadly wavelength tunable quantum cascadelasers based on heterogeneous EC-QCL (i.e sensitive concentration measurementsof broadband absorbers, in particular VOCs, HCs and multi-species detection)
§ Development of optically gas sensor networks based on QEPAS and LAS