Embed Size (px)
Citation preview

Advanced Gasification of Biomass/Waste for Substitution of Fossil Fuels in Steel Industry
Heat Treatment Furnaces
Duleeka Sandamali Gunarathne
Doctoral Dissertation
2016
KTH Royal Institute of Technology School of Industrial Engineering and Management Department of Materials Science and Engineering
Unit of Processes SE-100 44 Stockholm, Sweden
___________________________________________________________________________
Akademisk avhandling som med tillstånd av Kungliga Tekniska Högskolan i Stockholm framlägges
för offentlig granskning för avläggande av teknologie doktorsexamen, Tisdag den 27 September
2016, kl. 10:00 i Sal F3, Lindstedtvägen 26, Kungliga Tekniska Högskolan, Stockholm.
ISBN 978-91-7729-053-7

Duleeka Sandamali Gunarathne. Advanced Gasification of Biomass/Waste for
Substitution of Fossil Fuels in Steel Industry Heat Treatment Furnaces
KTH Royal Institute of Technology School of Industrial Engineering and Management Department of Materials Science and Engineering Unit of Processes SE-100 44 Stockholm, Sweden ISBN 978-91-7729-053-7
Copyright Duleeka Sandamali Gunarathne

i
Abstract
With the current trend of CO2 mitigation in process industries, the primary goal of this thesis is to
promote biomass as an energy and reduction agent source to substitute fossil sources in the steel
industry. The criteria for this substitution are that the steel process retains the same function and
the integrated energy efficiency is as high as possible.
This work focuses on advanced gasification of biomass and waste for substitution of fossil fuels in
steel industry heat treatment furnaces. To achieve this, two approaches are included in this work.
The first investigates the gasification performance of pretreated biomass and waste experimentally
using thermogravimetric analysis (TGA) and a pilot plant gasifier. The second assesses the
integration of the advanced gasification system with a steel heat treatment furnace.
First, the pyrolysis and char gasification characteristics of several pretreated biomass and waste
types (unpretreated biomass, steam-exploded biomass, and hydrothermal carbonized biomass)
were analyzed with TGA. The important aspects of pyrolysis and char gasification of pretreated
biomass were identified.
Then, with the objective of studying the gasification performance of pretreated biomass,
unpretreated biomass pellets (gray pellets), steam-exploded biomass pellets (black pellets), and two
types of hydrothermal carbonized biomass pellets (spent grain biocoal and horse manure biocoal)
were gasified in a fixed bed updraft gasifier with high-temperature air/steam as the gasifying agent.
The gasification performance was analyzed in terms of syngas composition, lower heating value
(LHV), gas yield, cold gas efficiency (CGE), tar content and composition, and particle content and
size distribution. Moreover, the effects on the reactions occurring in the gasifier were identified
with the aid of temperature profiles and gas ratios.
Further, the interaction between fuel residence time in the bed (bed height), conversion, conversion
rate/specific gasification rate, and superficial velocity (hearth load) was revealed. Due to the effect
of bed height on the gasification performance, the bed pressure drop is an important parameter
related to the operation of a fixed bed gasifier. Considering the limited studies on this relationship,
an available pressure drop prediction correlation for turbulent flow in a bed with cylindrical pellets
was extended to a gasifier bed with shrinking cylindrical pellets under any flow condition. Moreover,
simplified graphical representations based on the developed correlation, which could be used as an
effective guide for selecting a suitable pellet size and designing a grate, were introduced.
Then, with the identified positive effects of pretreated biomass on the gasification performance,
the possibility of fuel switching in a steel industry heat treatment furnace was evaluated by effective

ii
integration with a multi-stage gasification system. The performance was evaluated in terms of
gasifier system efficiency, furnace efficiency, and overall system efficiency with various heat
integration options. The heat integration performance was identified based on pinch analysis.
Finally, the efficiency of the co-production of bio-coke and bio-H2 was analyzed to increase the
added value of the whole process.
It was found that 1) the steam gasification of pretreated biomass is more beneficial in terms of the
energy value of the syngas, 2) diluting the gasifying agent and/or lowering the agent temperature
compensates for the ash slagging problem in biocoal gasification, 3) the furnace efficiency can be
improved by switching the fuel from natural gas (NG) to syngas, 4) the gasifier system efficiency
can be improved by recovering the furnace flue gas heat for the pretreatment, and 5) the co-
production of bio-coke and bio-H2 significantly improves the system efficiency.
Keywords: Biomass; Pretreatment; Gasification; Pressure drop; Steel industry; Fuel switch; Energy
efficiency

iii
Acknowledgements
I would like to thank my supervisors, Docent Weihong Yang and Prof. Wlodzimierz Blasiak, for
giving me the opportunity to join the Energy and Furnace Technology research group and offering
me continuous guidance throughout my PhD studies. In addition, I would like to thank Dr. Jan
Chmielewski and all my colleagues for help with experimental work and for sharing enjoyable times.
I would also like to thank all the collaborators, including Prof. Thomas Kolb, Dr. Sabine Fleck and
Mr. Andreas Mueller from Karlsruhe Institute of Technology, Dr. Magnus Pettersson from
Höganäs AB, and Mr. Rolf Ljunggren and Mr. Marko Amovic from Cortus Energy AB. The
Swedish Steel Producers’ Association (Jernkontoret) is also acknowledged. All the biomass
providers: Boson Energy SA, Zilkha Biomass Energy, and AVA-CO2, are highly appreciated.
I am grateful to the European Commission for funding a scholarship for my PhD research under
the Erasmus Mundus AREAS Program. I am also thankful to Jernkontoret for an additional
scholarship through Prytziska fonden nr 2. The financial providers KIC InnoEnergy (under the
project xGaTe) and Swedish Energy Agency –Energimyndigheten- (under the project Probiostål)
are gratefully acknowledged.
I am grateful to all my Sri Lankan friends living in Sweden, who made me feel at home. Above all,
I am grateful to my family for their endless love and care, making me comfortable with my studies.
Duleeka Sandamali Gunarathne
2016-06-12 Stockholm, Sweden

iv
List of Papers in the Thesis
I. Gunarathne, D. S., Mueller, A., Fleck, S., Kolb, T., Chmielewski, J. K., Yang, W., and
Blasiak, W. (2014). Gasification characteristics of steam exploded biomass in an updraft
pilot scale gasifier. Energy, 71, 496-506.
II. Gunarathne, D. S., Mueller, A., Fleck, S., Kolb, T., Chmielewski, J. K., Yang, W., and
Blasiak, W. (2014). Gasification characteristics of hydrothermal carbonized biomass in an
updraft pilot-scale gasifier. Energy and Fuels, 28(3), 1992-2002.
III. Gunarathne, D. S., Chmielewski, J. K., Yang, W., and Blasiak, W. Performance of high
temperature air/steam gasification of hydrothermal carbonized biomass. 22nd European
Biomass Conference and Exhibition (EUBC&E 2014). Hamburg, Germany. June 23-26,
2014.
IV. Gunarathne, D. S., Chmielewski, J. K., and Yang, W. (2014). Pressure drop prediction of
a gasifier bed with cylindrical biomass pellets. Applied Energy, 113, 258-266.
V. Gunarathne, D. S., Mellin, P., Yang, W., Pettersson, M., and Ljunggren, R. (2016).
Performance of an effectively integrated biomass multi-stage gasification system and a steel
industry heat treatment furnace. Applied Energy, 170, 353-361.
Contribution Statement:
In papers I–III, I participated in the gasification experiments, analyzed all of the results, and wrote
the manuscripts;
In paper IV, I performed the theoretical studies and wrote the manuscript;
In paper V, I developed the models, performed the simulations, and wrote the manuscript.

v
List of Papers not in the Thesis
I. Gunarathne, D. S., Mellin, P., Yang, W., Pettersson, M., and Ljunggren, R. System
integration of the heat treatment furnace in steel plant with biomass gasification process.
Nordic Flame Days 2015. Copenhagen, Denmark. October 6-7, 2015.
II. Gunarathne, D. S., Cuvilas, C. A., Li, J., Yang, W., and Blasiak, W. Biomass pretreatment
for large percentage biomass co-firing. 12th International Conference on Boiler Technology
(ICBT 2014). Szczyrk, Poland. October 21-24, 2014.
III. Zhou, C., Stuermer, T., Gunarathne, R., Yang, W., and Blasiak, W. (2014). Effect of
calcium oxide on high-temperature steam gasification of municipal solid waste. Fuel, 122,
36-46.
IV. Gunarathne, D. S., Chmielewski, J. K., and Yang, W. High temperature air/steam
gasification of steam exploded biomass. Finnish-Swedish Flame Days 2013. Jyväskylä,
Finland. April 17-18, 2013.
vi
Contents 1 INTRODUCTION ............................................................................................................... 1
1.1 Introduction to the dissertation .................................................................................... 1
1.2 Objectives ......................................................................................................................... 3
1.3 Structure of the dissertation ........................................................................................... 4
2 BACKGROUND .................................................................................................................. 6
2.1 Biomass pretreatment ..................................................................................................... 8
2.2 Biomass gasification and gasifier types ....................................................................... 10
2.3 Advanced gasification technologies ............................................................................ 12
2.4 Gasification of pretreated biomass ............................................................................. 14
2.5 Integration of a steel industry furnace with biomass gasification ........................... 15
3 METHODOLOGY ............................................................................................................ 16
3.1 Experimental basis ........................................................................................................ 16
3.1.1 Feedstock materials............................................................................................... 16
3.1.2 TGA experiments ................................................................................................. 18
3.1.3 Gasification experiments ..................................................................................... 20
3.2 Application-oriented process simulations .................................................................. 24
3.2.1 System description ................................................................................................ 24
3.2.2 Scenario description.............................................................................................. 26
3.2.3 Process models ...................................................................................................... 26
3.2.4 Performance analysis ............................................................................................ 31
4 BIOMASS CHARACTERIZATION .............................................................................. 33
4.1 Mass loss behavior ........................................................................................................ 33
4.2 Pyrolysis behavior ......................................................................................................... 34
4.3 Char gasification behavior ............................................................................................ 36

vii
5 GASIFICATION PERFORMANCE IN UPDRAFT HTAG .................................... 38
5.1 Gasification of unpretreated and steam-exploded biomass .................................... 38
5.1.1 Temperature distribution ..................................................................................... 38
5.1.2 Syngas composition .............................................................................................. 39
5.1.3 LHV, gas yield, and efficiency ............................................................................. 40
5.1.4 Syngas purity .......................................................................................................... 42
5.2 Gasification of hydrothermal carbonized biomass ................................................... 43
5.2.1 Temperature distribution ..................................................................................... 43
5.2.2 Syngas composition .............................................................................................. 44
5.2.3 LHV, gas yield, and efficiency ............................................................................. 45
5.2.4 Syngas purity .......................................................................................................... 46
5.3 Gasification of hydrothermal carbonized biomass with controlling measures for
ash slagging ............................................................................................................................... 47
5.3.1 Temperature distribution ..................................................................................... 47
5.3.2 Syngas composition .............................................................................................. 49
5.3.3 LHV, gas yield, and efficiency ............................................................................. 50
5.3.4 Syngas purity .......................................................................................................... 51
6 PARAMETERS OF FIXED BED GASIFICATION .................................................. 54
6.1 Bed height, conversion, and conversion rate ............................................................ 54
6.2 Gasifier design parameters: Specific gasification rate and superficial velocity ...... 55
6.3 Bed pressure drop ......................................................................................................... 57
7 INTEGRATION OF BIOMASS GASIFICATION PROCESS WITH THE STEEL
INDUSTRY ................................................................................................................................. 60
7.1 Application of syngas in the furnace .......................................................................... 60
7.1.1 Comparison of experimental and modeling results .......................................... 60
7.1.2 Gasifier system performance ............................................................................... 61

viii
7.1.3 Heat integration performance ............................................................................. 63
7.1.4 Furnace performance ........................................................................................... 64
7.1.5 Energy balance and the overall system performance ....................................... 68
7.2 Co-production of bio-coke and bio-H2 ...................................................................... 69
8 CONCLUSIONS ................................................................................................................. 70
9 FUTURE WORK ................................................................................................................ 74
10 REFERENCES ................................................................................................................ 75

ix
Nomenclature
Abbreviations
ASTM American Society for Testing and Materials
BTEX Benzene, toluene, ethylbenzene, and xylenes
CGE Cold gas efficiency
DTG Derivative thermogravimetry
ER Equivalence ratio
GC Gas chromatography
GCC Grand composite curve
GHG Greenhouse gas
HGI Hardgrove grindability index
HHV Higher heating value
HiTAC High-temperature air combustion
HTAG High-temperature agent gasification
HTC Hydrothermal carbonization
LHV Lower heating value
LPG Liquefied petroleum gas
LPI Low-pressure impactor
NG Natural gas
PAH Polycyclic aromatic hydrocarbon
PSA Pressure swing adsorption
SEM Scanning electron microscope
SNG Synthetic natural gas
SPA Solid phase adsorption
TGA Thermogravimetric analysis

x
Symbols
𝐴 Cross sectional area m2
𝐴′ Modified Ergun constant for the viscous term -
𝐵′ Modified Ergun constant for the inertial term -
𝐶 Carbon content of biomass %
𝐶𝑡𝑎𝑟 Concentration of tar species g/Nm3
𝐶𝑝,𝑖 Constant pressure heat capacity of the ith component J/kg °C
𝑐 Length of a cylindrical particle at any time m
𝑐0 Initial length of a cylindrical particle m
𝐷𝑒 Equivalent diameter of a tortuous passage m
𝑑 Diameter of a cylindrical particle at any time m
𝑑0 Initial diameter of a cylindrical particle m
𝑑𝑝 Equivalent particle diameter m
𝐸𝐶ℎ Chemical energy MJ
𝐸𝑆 Sensible energy MJ
�̇� Fuel feed rate kg/min
�̇�𝑐 Fuel consumption rate kg/min
�̇� Gas flow rate m3/s
𝐺𝑚𝑖𝑥 Gibbs energy for a mixture of ideal gases J
�̅�𝑖,𝑇 Molar Gibbs energy of the ith component at T J/mol
�̅�𝑖,𝑇0 Molar Gibbs energy of the ith component at T and
standard pressure
J/mol
ℎ Shrinking length m
ℎ𝑓0 Standard enthalpy of formation J/mol
𝛥ℎ̅ Enthalpy change J/mol
𝐾1 Constant for the inertial term 1/m
𝐾2 Constant for the viscous term 1/m
𝐾3 Constant for Rep 1/m
𝐾𝑡 Constant depending on the roughness of the particle
and packing tortuosity
-
𝐿 Bed height m

xi
𝐿𝐻 Hearth load m3/cm2 h
𝐿𝐻2𝑂 Latent heat of vaporization J/kg
𝐿𝐻𝑉𝑓𝑢𝑒𝑙 LHV of fuel MJ/kg
𝐿𝐻𝑉𝐺 LHV of pyrolysis gas (excluding tar) MJ/kg
𝐿𝐻𝑉𝑖 LHV of the ith component in the gas mixture MJ/Nm3
𝑙 Equivalent length of a tortuous passage m
𝑀𝑖 Molecular weight of the ith component g/mol
𝑚 Mass g
𝑚0 Initial mass g
𝑚𝑓 Final mass g
�̇�𝑖 Mass flow rate of the ith component kg/s
𝑁𝑖 Number of moles of the ith component mol
�̇�𝑖 Inlet molar flow rate mol/s
�̇�𝑜 Outlet molar flow rate mol/s
𝑂2/𝐹 Oxygen to feed ratio mol/mol
𝑃0 Standard pressure Pa
𝑃𝑖 Pressure Pa
𝑃𝑠𝑣(𝑇) Saturation vapor pressure at T atm
∆𝑃 Pressure drop Pa
�̇�𝐿 Rate of heat loss J/s
𝑅 Universal gas constant J/mol °C
𝑅𝑒𝑝 Particle Reynolds number -
𝑟 Conversion rate 1/min
𝑟𝑏ℎ Rate of change of bed height m/min
𝑟𝑠𝑔 Specific gasification rate kg/m2 h
𝑆/𝐶 Steam to carbon ratio mol/mol
𝑆𝑝 Particle surface area m2
𝑇 Temperature °C
𝑡𝑟 Residence time min
𝑢 Superficial velocity m/s

xii
�̇� Volumetric gas flow rate Nm3/min
𝑉𝑝 Particle volume m3
𝑣 Velocity of flow through a tortuous passage m/s
𝑋 Fuel conversion -
𝑥 Char conversion -
𝑥𝑖 Volume fraction of the ith species in the gas mixture -
𝑌 Volumetric gas yield Nm3/kg
Greek letters
𝛼 Residual mass ratio -
𝛼𝑖 Stoichiometric coefficients i = 1–8 -
𝛽𝑖 Stoichiometric coefficients i = 1–5 -
𝛾𝑖 Stoichiometric coefficients i = 1–7 -
𝜀 Porosity -
𝜂𝐹 Efficiency of the furnace %
𝜂𝐺 Efficiency of the gasifier system %
𝜂𝐼 Efficiency of the integrated system %
𝜇 Viscosity Ns/m2
𝜌 Density kg/m3
𝜌𝑏 Bulk density kg/m3
𝛷 Sphericity -

1
CHAPTER I
1 INTRODUCTION
1.1 Introduction to the dissertation
The iron and steel industry is the largest industrial source of CO2 emissions in Sweden due
to its reliance on fossil fuels and reductants and the large volume of steel production. The
European Union has ambitious plans to reduce the CO2 emissions of today's best steel
processing routes by at least 50% by 2050 [1].
Improving the energy efficiency and reducing the dependency on fossil fuels are the main
strategies for reducing CO2 emissions. Replacing fossil sources with biomass is one area of
growing interest in the steel industry, with direct replacement of coal or coke with biomass
as the most common option [2, 3]. Substitution of the furnace fuel with biomass-derived
syngas is another option. The replacement of fossil fuels with renewable gaseous fuels
should address the following important issues:
Temperature: The fuel or combustion technology should provide a high enough
temperature.
Efficiency: The furnace should have the same or better efficiency.
Emissions: Under high-temperature operation, NOx emission should be minimized.
Impurities: If the heat transfer is direct, it should not affect the steel quality, and if
indirect firing is applied, the heat transfer surface should be tolerable.
Syngas produced by typical biomass gasification has a low heating value and hence requires
further processing to synthetic natural gas (SNG) for use in furnaces. An alternative
approach involves the improvement of biomass by means of pretreatment before
gasification, which enables the production of high calorific gas with a high adiabatic
temperature. As will be addressed in the thesis, this technology is advantageous in many
ways, for example:
Better performance in the gasification process.

2
Possibility of furnace flue gas heat recovery for pretreatment.
Co-production of valuable bio-based reduction agents to maximize the value chain.
In particular, for the iron and steel industry, pretreated biomass can be used for co-
production of coke, which makes the system more diverse. Further, as the production of
coke is an exothermic process, integration with the endothermic gasification process gives
a synergetic effect in terms of the energy balance.
As this thesis will show, the syngas produced from pretreated biomass results in lower flue
gas losses from the furnace, and hence improves the furnace efficiency. Moreover, steam
gasification results in a high content of H2 in the syngas, which makes the separation of
some H2 feasible, while maintaining the required adiabatic temperature. Coke gas with a
high content of H2 could also be combined with the H2 separation process. H2, which has
many end-use applications, could also be an alternative reduction agent for the iron and
steel making process.
By effective integration of biomass pretreatment, gasification, and the steel making process,
it would be possible to reduce CO2 emissions considerably. Figure 1-1 shows such a
concept of integration.
Figure 1-1. Conceptual integration of biomass pretreatment, gasification, and a
steel plant to maximize the biomass value chain
3
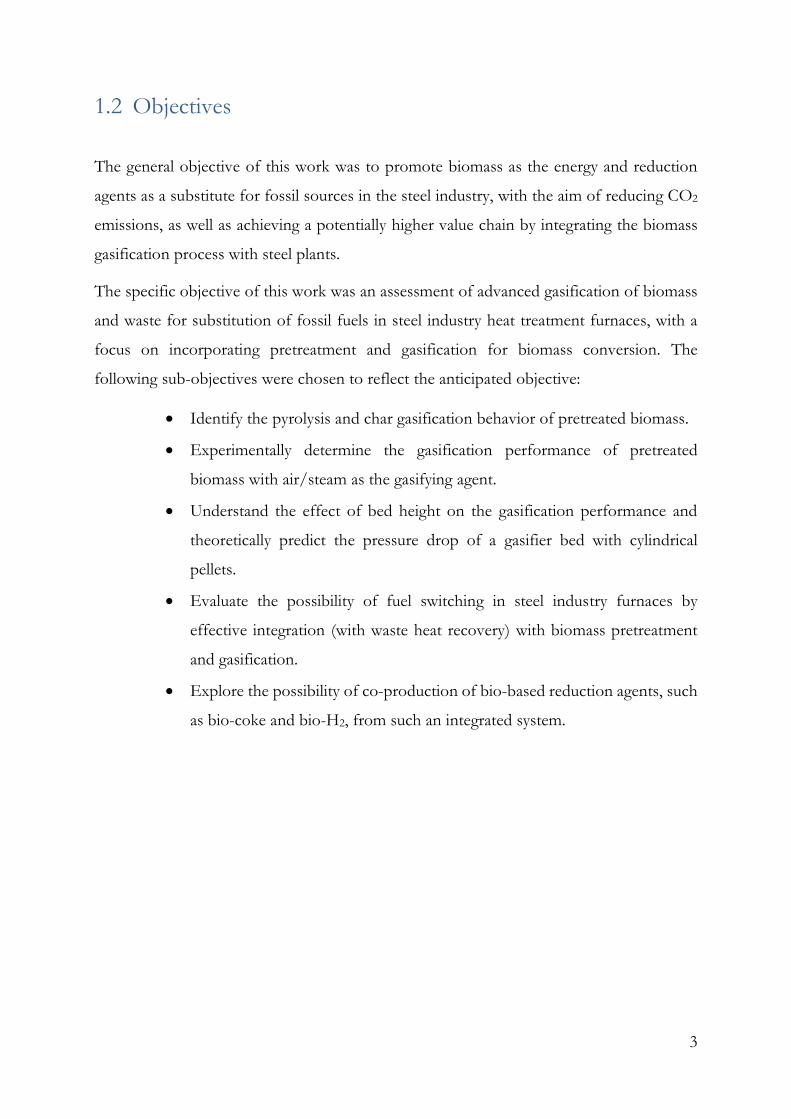
1.2 Objectives
The general objective of this work was to promote biomass as the energy and reduction
agents as a substitute for fossil sources in the steel industry, with the aim of reducing CO2
emissions, as well as achieving a potentially higher value chain by integrating the biomass
gasification process with steel plants.
The specific objective of this work was an assessment of advanced gasification of biomass
and waste for substitution of fossil fuels in steel industry heat treatment furnaces, with a
focus on incorporating pretreatment and gasification for biomass conversion. The
following sub-objectives were chosen to reflect the anticipated objective:
Identify the pyrolysis and char gasification behavior of pretreated biomass.
Experimentally determine the gasification performance of pretreated
biomass with air/steam as the gasifying agent.
Understand the effect of bed height on the gasification performance and
theoretically predict the pressure drop of a gasifier bed with cylindrical
pellets.
Evaluate the possibility of fuel switching in steel industry furnaces by
effective integration (with waste heat recovery) with biomass pretreatment
and gasification.
Explore the possibility of co-production of bio-based reduction agents, such
as bio-coke and bio-H2, from such an integrated system.

4
1.3 Structure of the dissertation
This thesis is organized into nine chapters. Chapter 1 provides a general overview, the
objectives, and the scope of the thesis. Chapter 2 provides a background review of the field
of study. The methodology used to achieve the objectives is discussed in Chapter 3.
Chapters 4–7 summarize and discuss the results, which are presented in detail in the
supplements. The overall conclusions are presented in Chapter 8, with recommendations
for future work in Chapter 9.
The content of this thesis can be divided into four main categories: thermogravimetric
analysis (TGA) study, gasification study, theoretical study, and system study, as
demonstrated in Figure 1-2.
Figure 1-2. Scope of the thesis, including the study area of each supplement
In general, supplements I–III examine the gasification process performance of pretreated
biomass. Based on the identified effect of bed height on such performance, supplement IV
develops methods to predict the bed induced pressure drop. Supplement V investigates the
application of the produced syngas in a heat treatment furnace.

5
Table 1-1 provides an overview of the supplements and their specific objectives.
Table 1-1. Overview of supplements
Supplement Title Objectives
I Gasification characteristics of
steam exploded biomass in an
updraft pilot scale gasifier
• Characterization of normal and steam-exploded biomass by
thermogravimetric analysis (TGA)
• Study of air/steam gasification behavior in terms of the
temperature profile, syngas composition, lower heating value
(LHV), gas yield, cold gas efficiency (CGE), and tar content
II Gasification characteristics of
hydrothermal carbonized
biomass in an updraft pilot-
scale gasifier
• Characterization of hydrothermal carbonized biomass by
TGA
• Study of air gasification behavior in terms of temperature
profile, syngas composition, LHV, gas yield, and CGE
• Identification of the effect of bed height on conversion and
conversion rate
• Study of main design parameters: specific gasification rate
and superficial gas velocity
III Performance of high
temperature air/steam
gasification of hydrothermal
carbonized biomass
• Study of air/steam gasification behavior of two types of
hydrothermal carbonized biomass in terms of temperature
profile, syngas composition, LHV, gas yield, CGE, tar, and
particle content
IV Pressure drop prediction of a
gasifier bed with cylindrical
biomass pellets
• Development of a correlation to predict bed pressure drop
for gasification of cylindrical pellets
• Introduction of a simplified graphical method to reduce the
calculation effort for pressure drop predictions
V Performance of an effectively
integrated biomass multi-stage
gasification system and a steel
industry heat treatment
furnace
• Study of an integrated system based on multi-stage biomass
gasification and the steel process
• Determination of the system-level energy and material
balances
• Assessment of different possibilities for waste heat
recovery based on individual and integrated efficiencies

6
CHAPTER II
2 BACKGROUND
Figure 2-1 shows the greenhouse gas (GHG) emissions from industrial processes and
energy use from the iron and steel industry in Sweden [4, 5]. The highest GHG emissions
related to process industries are recorded for metal production. Further, coal processing
has the highest emissions and is the source for more than 90% of CO2 emissions. Electricity
in Sweden mainly comes from renewable sources, and hence the next highest emissions are
from gaseous fuels such as natural gas (NG) and liquefied petroleum gas (LPG), which are
now extensively used to replace oil.
Figure 2-1. (left) GHG emissions from industrial processes; (right) energy use
in the iron and steel industry
Considering the above facts, biomass can be used in the steel industry through either
biomass-derived reduction agents or biomass-derived furnace fuels.
Biomass can be used as a reducing agent mainly in three forms: bio-char, bio-oil, and
syngas/SNG, which can be obtained by slow pyrolysis, fast pyrolysis, and gasification,
respectively [6]. Most studies have focused on bio-char injection, which is claimed to be
more feasible in terms of economy and operability. However, due to the insufficient
strength of bio-char compared with coke, it is limited to use as an injection fuel rather than
a coke substitute. It is reported that there is no technical restriction on the use of charcoal
up to 200 kg/ton of hot metal, resulting in very low coke consumption of around 260
kg/ton of hot metal in the blast furnace [7]. Alternatively, a limited content of biomass or

7
bio-char (up to 5%) can also be used as a raw material for coke production along with
coking coal without affecting the coke quality [8].
When bio-oil is considered as a blast furnace injectant, the high water and oxygen content
make it less suitable as a reducing agent. The reported coke replacement ratio is low (around
0.25), whereas that of char is high (around 1) [6]. However, the utilization of charcoal
byproducts from fast pyrolysis as a reducing agent would make this process interesting.
The CO- and H2-rich reducing gas (above 90% of the total volume) obtained from the
biomass oxygen/steam gasification process (after conditioning) can be used as a reducing
agent. A pellet reduction rate of 99% is reported at a reduction temperature of 1323 K after
30 min of reaction [9]. The limited capacity of commercial biomass gasifiers hinders the
effective use of such technology if not co-gasified with coal [6], although high-pressure
fluidized bed gasification with O2 followed by hot desulfurization has also been proposed
in the literature [10].
The use of biomass-derived fuels in steel heating furnaces is not yet common, although
coal-derived syngas is occasionally used for this purpose. The production of bio-syngas by
biomass gasification and substitution for LPG as the fuel in reheating furnaces has been
found to be technically feasible if used with an improved combustion technology, such as
high temperature air combustion (HiTAC) or oxy-fuel combustion [11]. If upgraded to
SNG, although not economically attractive, fuel substitution would reduce global CO2
emissions if the marginal biomass were used to produce transportation fuel, but not if it
were used to co-fire a coal power plant [12]. Replacing NG in iron ore pelletizing processes
with syngas derived from circulating fluidized bed gasification of biomass (air, oxygen, or
steam as the gasifying medium) reportedly increases the specific energy consumption, and
hence results in low efficiency. However, upgrading to SNG makes the process more
expensive [13].
In summary, bio-char and bio-coke will continue to be the main bio-based reduction agents
in the near future. To replace furnace fuels with syngas, more economical and efficient
methods that still comply with the process requirements are required.

8
2.1 Biomass pretreatment
Four main objectives are identified for biomass pretreatment:
Extend the use of waste/wet biomass sources
Make transportation, storage, and preprocessing economical
Extend the applications
Increase the gasification performance
Pretreatment plays a vital role when balanced against the associated costs and the gains.
The commonly used pretreatment technologies are mechanical pretreatment, steam
explosion, hydrothermal carbonization, torrefaction, and slow pyrolysis.
Mechanical pretreatment is the simplest and hence commonly applied method, which
incorporates size reduction and subsequent densification. This process improves both the
homogeneity and energy density, without any change of the structure of biomass.
A somewhat more extensive pretreatment, called hydrothermal carbonization (HTC), is
carried out in the presence of water at temperatures of 160–240 °C and pressures of 1–3.5
MPa, with residence times of up to several hours [14]. The reaction path of this process is
hydrolysis followed by dehydration, decarboxylation, condensation polymerization, and
aromatization. HTC has been applied to various feedstocks; however, it is most commonly
used for wet and waste biomass due to the water-based reaction atmosphere.
When the pretreatment process is carried out with high-pressure saturated steam at
temperatures of 160–240 °C and pressures of 0.7–4.8 MPa, followed by a sudden release
of the pressure, it is called steam explosion [14]. The main structural changes associated
with rupture of the cell walls are release of hemicellulose and altered lignin structures [15].
In addition to the improved homogeneity and energy density, hydrophobicity and
grindability are improved. Further, due to the improved hydrophobicity, mechanical
dewatering is possible, which reduces the energy requirement for thermal drying. For
example, a fivefold reduction in drying energy demand is reported after steam explosion
pretreatment [16]. The grinding energy demand is also reportedly reduced by 5–17% due
to steam explosion pretreatment [17]. Further, the high durability minimizes dusting,

9
reduces material losses during, handling and transportation, and reduce safety issues related
to dust explosions.
Torrefaction, slow pyrolysis, and carbonization can be categorized as thermal
pretreatment methods that are similar in principle, differing only in the operating
temperature ranges. During torrefaction, raw biomass is heated in an inert atmosphere at
temperatures of 200–300 °C for several minutes to several hours to produce improved solid
fuel. The slow pyrolysis process produces solid char at temperatures ranging from 300–700
°C [18], which can be termed as carbonization at higher temperatures due to the prioritized
production of solid carbon.
The temperature ranges of each pretreatment process are shown in Figure 2-2.
Figure 2-2. The temperature ranges of various pretreatment processes
As pretreatment improves the energy density of biomass, which is important for
transportation, pretreatment at the source rather than at the point of use (ex situ) can be
economical in some cases, especially for pretreatment at lower temperatures (HTC, steam
explosion, and mild torrefaction combined with mechanical pretreatment). However, for
moderate to high pretreatment temperature ranges, a considerable amount of energy is

10
available in the exhaust gas, which can be recovered if in situ pretreatment is applied (severe
torrefaction, pyrolysis, and carbonization).
For example, autothermal operation is reported at torrefaction temperatures of 270–280
°C (5–20 min residence time) for biomass with 50% moisture [19]. Thus, if this temperature
is exceeded, some energy will be wasted through extra torrefaction gases; hence, integrated
torrefaction becomes more feasible. A comparative study based on integrated and external
torrefaction at 300 °C reported that biomass to syngas efficiency can be increased from
63% to 86% by utilizing the volatiles in an integrated torrefaction process [20].
2.2 Biomass gasification and gasifier types
Biomass gasification is the conversion of carbonaceous material into a gaseous product,
which mainly consists of H2 and CO with lower amounts of CO2, H2O, N2, CH4, and higher
hydrocarbons. The process is carried out with the aid of a gasifying agent (air, O2, steam,
or a mixture of these) at an elevated temperature between 500 and 1400 °C at atmospheric
or elevated pressure. The produced gas can be either combusted for heat and power
generation or further processed to produce synthetic gas, SNG, or value-added chemicals.
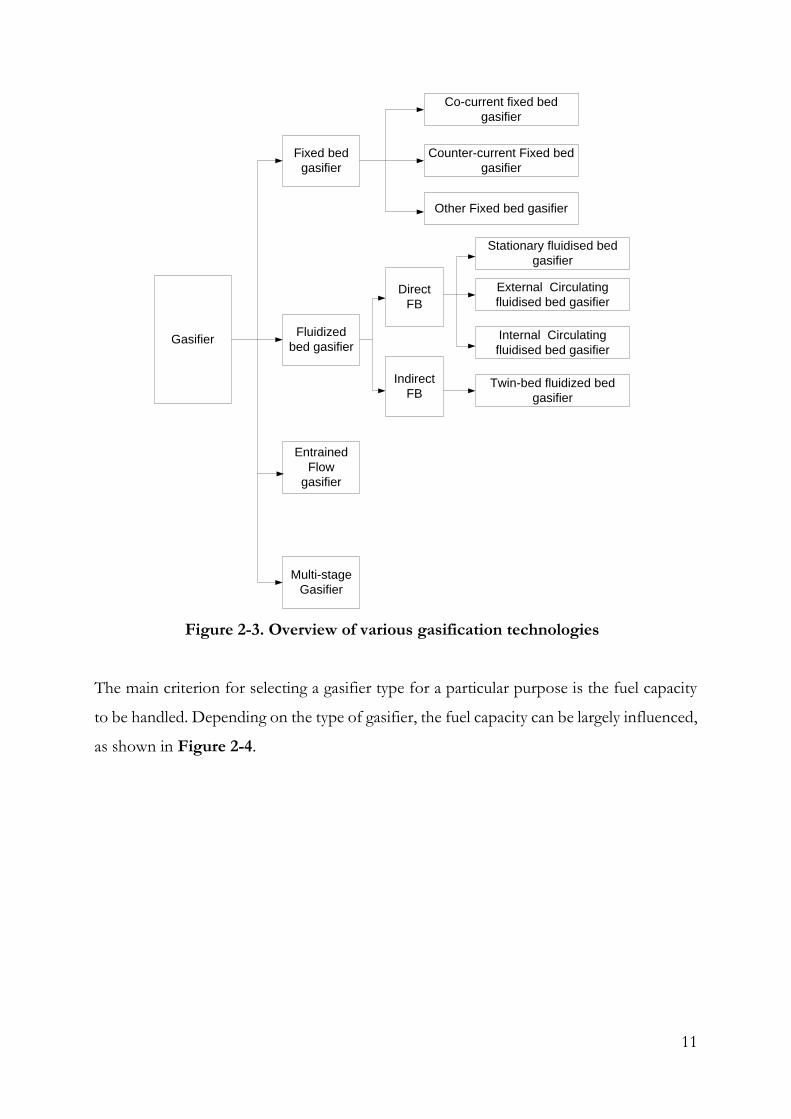
Various gasification technologies are shown in Figure 2-3.
11
Gasifier
Multi-stage
Gasifier
Entrained
Flow
gasifier
Fluidized
bed gasifier
Fixed bed
gasifier
Other Fixed bed gasifier
Co-current fixed bed
gasifier
Counter-current Fixed bed
gasifier
Stationary fluidised bed
gasifier
External Circulating
fluidised bed gasifier
Internal Circulating
fluidised bed gasifier
Twin-bed fluidized bed
gasifier
Direct
FB
Indirect
FB
Figure 2-3. Overview of various gasification technologies
The main criterion for selecting a gasifier type for a particular purpose is the fuel capacity
to be handled. Depending on the type of gasifier, the fuel capacity can be largely influenced,
as shown in Figure 2-4.

12
100
kW
1000
kW
10 000
kW
100 000
kW
Downdraft-Fixed
bed
Updraft-Fixed bed
Atm. BFB
Atm. Indirect
CFB
Pressuried BFB, CFD
and Indirect CFB
Entrained Flow Gasifier
Fuel
Capacites
Multi-Stage Gasifier
Figure 2-4. Capacity ranges of common gasification technologies
Fixed bed gasifiers are limited to small-scale applications, while fluidized bed and entrained
flow gasifiers can be used for large-scale applications.
2.3 Advanced gasification technologies
Based on the typical gasifier types, several advanced gasification processes have been
developed recently to improve the performance of gasification, thus increasing the
gasification efficiency and reducing the tar content in the syngas.
High-temperature agent gasification (HTAG)
In conventional direct gasification, the required heat for the endothermic gasification
process is mainly supplied by heat release from oxidization of a part of the feedstock. This
process produces non-combustible CO2, which dilutes the produced syngas and lowers its
calorific value. In addition, the presence of a high CO2 content results in reduction of the
partial pressures of the other gas species, which reduces the intensity of important reactions,
such as the water-gas shift reaction to produce H2. In contrast, indirect gasification uses the
heat released from an outside source, for example, hot char recirculation and/or sensible
heat from a preheated gasifying agent.

13
The HTAG process lies between these two extremes, i.e., part of the energy is supplied by
a highly preheated gasifying agent (~1000 °C), while the rest is supplied by oxidation inside
the reactor. Preheating of the agent is achieved using a high-cycle regenerative preheater.
Preheating the gasifying agent to high temperatures has many positive effects, such as
increased gas yield, heating value, and gasification efficiency, and decreased tar content [21].
Multi-stage gasification
In a one-stage gasifier, the overlap of the process steps, such as heating, drying, pyrolysis,
oxidation, and gasification, makes it impossible to independently control and optimize the
different steps. As interaction between volatiles and char can have a negative impact on the
char reactivity, a higher gasification efficiency is expected if char gasification is performed
in the absence of volatiles. Multi-stage gasification, which was developed based on this
concept, results in high gas purity with low levels of tar and high process efficiencies with
high char conversion rates. The complexity of the gasification process is compensated by a
simpler subsequent gas cleaning process. Table 2-1 provides an overview of the
performance of multi-stage gasification processes [22].
Table 2-1. Overview of multi-stage gasification processes
Gasification
technology
Number of stages CGE
(%)
Tar content
(Mg/Nm3)
HHV
(MJ/Nm3)
Viking gasifier 2 93 <15 6.6
FLETGAS process 3 81 10 6.4
LT-CFB process 2 87–93 >4800 5.2–7
Carbo-V process 3 82 Tar free High
In addition to the above-listed processes, the Wood-Roll® multi-stage gasification process
has a unique feature, in which the pyrolysis gas is used only as the heat carrier for the
endothermic steam gasification process, thus enabling indirect gasification. This process
claims to have several advantages, such as raw material flexibility, less tar, high calorific
value gas, and an efficient gasification process [23].
14
2.4 Gasification of pretreated biomass
The main focus of gasification studies of pretreated biomass has been mechanically
pretreated (pelletized) biomass. A few studies can be found on physicochemically or
thermochemically pretreated biomass gasification.
Comparative simulation studies based on entrained flow gasification of hydrothermal
carbonized biomass and fluidized bed gasification of raw wood reported that biocoal
gasification is more efficient. However, the conversion losses in the HTC process were
revealed to outweigh this efficiency gain [24]. Entrained flow gasification of hydrothermal
carbonized biomass was reported to have high carbon and overall conversion at low
residence times (1 s) and high temperatures (1000–1400 °C). Moreover, a slightly lower
conversion of lignite was observed, indicating the high reactivity of biocoal [25].
Recently, HTC pretreatment of rice residues to produce biocoal as a transportable value-
added product has been studied with the purpose of gasifying in remote villages to generate
electricity for rural communities [26].
Steam gasification of torrefied wood at 1400 °C produced 7% more H2 and 20% more CO
compared with the parent wood [27]. However, while the kinetics of gas phase reactions
were comparable at a lower gasification temperature (1200 °C), a lower char gasification
reactivity was reported. Compared with raw biomass, air gasification of torrefied switch
grass gave lower CO and H2 yields, while the CH4 yield was higher. However, the
significantly higher CO and H2 yields reported for densified torrefied material were claimed
to result from the binder and the moisture added during densification [28]. Air gasification
of torrefied pellets was reported to result in a higher calorific value of syngas compared
with that obtained from unpretreated pellets, with a cold gas efficiency (CGE) of around
75%. In addition, less tar was obtained with torrefied pellets. However, due to stability
effects, this type of fuel is much more suitable for co-gasification [29]. Large-scale co-
gasification tests of torrefied biomass and steam-exploded biomass with hard coal have
been carried out by Vattenfall [30].

15
2.5 Integration of a steel industry furnace with biomass gasification
On the system level, the integration of a steel industry furnace with biomass gasification
should also consider
how to use the waste heat from the furnace in the gasification process to achieve a
higher integrated energy efficiency, and
how to increase the value chain of the whole system, for example, extraction of
metallurgical coke/carbon and H2.
There is a large amount of waste heat in steel plants. Waste heat in steel plants is separated
as
High-temperature waste heat: T > 650 °C
Medium-temperature waste heat: 230 °C < T < 650 °C
Low-temperature waste heat: T < 230 °C
To achieve higher integrated energy efficiency by using the waste heat, the high- and
medium-temperature waste heat can be used in the biomass pretreatment; drying process,
and pyrolysis stages. Finally, a waste heat to gas concept can be established, which is one
of the main objectives of this thesis.

16
CHAPTER III
3 METHODOLOGY
3.1 Experimental basis
In this section, the experimental basis of the methodology used in thesis is described, which
includes feedstock materials, TGA experiments, and gasification experiments.
3.1.1 Feedstock materials
Four biomass types, namely gray pellets, black pellets, spent grain biocoal, and horse
manure biocoal, were used in the gasification experiments, as shown in Figure 3-1.
Figure 3-1. Biomass types used in the experiments: (top-left) gray pellets, (top-
right) black pellets, (bottom-left) spent grain biocoal, and (bottom-right) horse
manure biocoal
17
Gray pellets consist of woody-based roadside scrub cuts that were produced and supplied
by Boson Energy SA, Luxembourg [31]. These pellets represent unpretreated biomass in
this study, in the sense of no thermochemical or physicochemical pretreatment was applied.
The only treatment that these pellets have undergone is milling, drying, and pelletizing
(physical pretreatment).
Black pellets, which consist of 75% softwood and 25% hardwood, were produced by steam
explosion pretreatment and were supplied by Zilkha Biomass Energy, Texas, USA [32]. The
main process steps that these pellets have undergone are milling, steam pretreatment,
drying, and pelletizing.
The two types of biocoal pellets types consist of spent grain and horse manure produced
by AVA-CO2 Forschung Gmbh in Karlsruhe, Germany, at their HTC demonstration plant
[33]. The process conditions used for the HTC pretreatment were: temperature around
210–215 °C and residence time around 4 h. The solid product yield was around 67% of the
dry input.
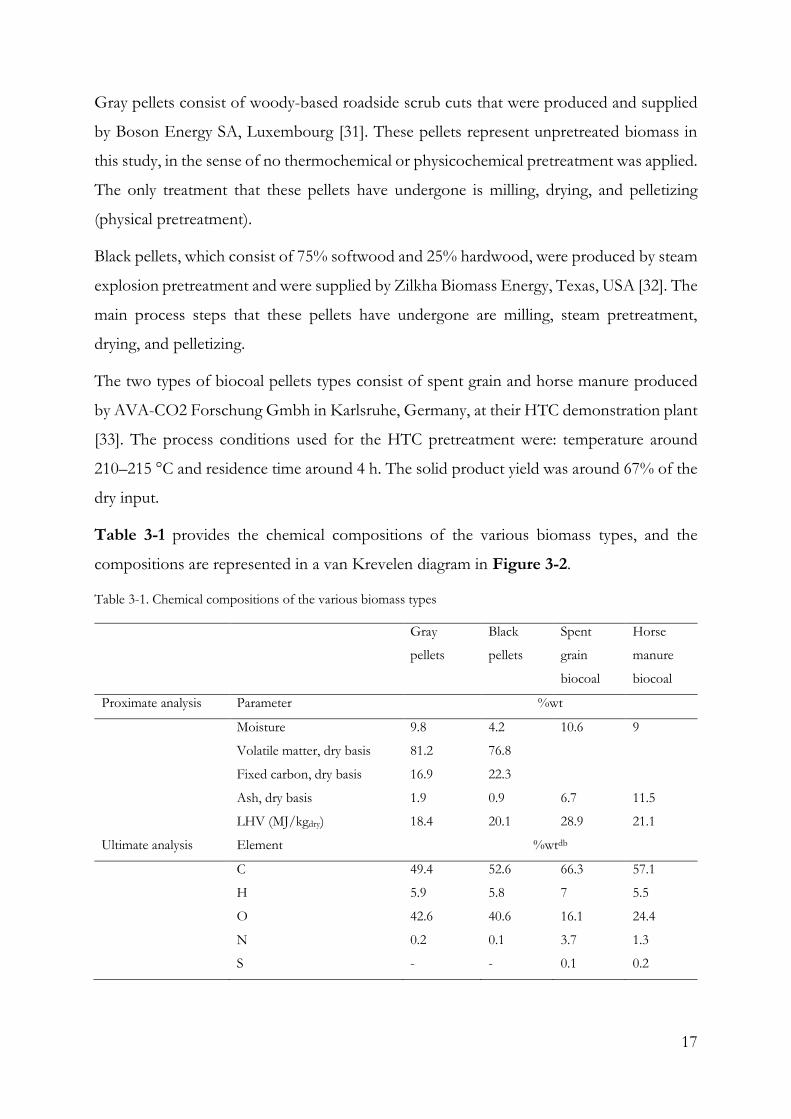
Table 3-1 provides the chemical compositions of the various biomass types, and the
compositions are represented in a van Krevelen diagram in Figure 3-2.
Table 3-1. Chemical compositions of the various biomass types
Gray
pellets
Black
pellets
Spent
grain
biocoal
Horse
manure
biocoal
Proximate analysis Parameter %wt
Moisture 9.8 4.2 10.6 9
Volatile matter, dry basis 81.2 76.8
Fixed carbon, dry basis 16.9 22.3
Ash, dry basis 1.9 0.9 6.7 11.5
LHV (MJ/kgdry) 18.4 20.1 28.9 21.1
Ultimate analysis Element %wtdb
C 49.4 52.6 66.3 57.1
H 5.9 5.8 7 5.5
O 42.6 40.6 16.1 24.4
N 0.2 0.1 3.7 1.3
S - - 0.1 0.2

18
Figure 3-2. Van Krevelen diagram
The significant features observed in the proximate analysis are the high ash content of both
biocoal types and the exceptionally high carbon content (and lower oxygen content) and
LHV of spent grain biocoal. Moreover, the van Krevelen diagram shows that the black
pellets have a significantly reduced H/C ratio, while both biocoal types have significantly
reduced O/C ratios.
3.1.2 TGA experiments
The decomposition characteristics of biomass were analyzed using a laboratory-scale
thermogravimetric analyzer (TG 209 F1 Iris, Netsch, Germany) at Karlsruhe Institute of
Technology, Germany. The system can be operated with both inert and oxidizing
atmospheres with variable CO2 concentrations. Figure 3-3 shows a schematic of the
system.
0
0.2
0.4
0.6
0.8
1
1.2
1.4
1.6
0 0.1 0.2 0.3 0.4 0.5 0.6 0.7
H/C
O/C
Hard wood
Soft wood
Gray pellets
Peat
Black pellets
Biocoal from horse manure
Biocoal from spent grain
Lignite
Sub-bituminous coal
Bituminous coal
Anthracite

19
Figure 3-3. Schematic of TGA
The sample holder is a ceramic crucible that is connected to a balance system (with 0.1 µg
resolution), and surrounded by a high-temperature oven (temperatures up to 1000 °C). In
order to avoid transfer limitations, a sample mass of 2 mg is typically used.
The experimental procedure was as follows. The ground and homogenized biomass sample
was first pyrolyzed under a N2 atmosphere with a constant heating rate of 30 °C/min from
30 °C to 1000 °C, followed by a 15 min holding time to remove all the volatile matter. The
sample remaining after the pyrolysis step was then cooled to 900 °C at a rate of 30 °C/min,
followed by a 15 min holding time. The sample was then gasified in a N2/CO2 atmosphere
(10 vol% CO2) at 900 °C until a constant final weight was observed. The sample
temperature and mass were measured and recorded with respect to time.
The following definitions were adopted in the data analysis.
For the pyrolysis period, the first derivative of the residual mass (with respect to
temperature) is defined as
𝐷𝑇𝐺 = −𝑑𝛼
𝑑𝑇 (Eq. 3-1)
where the residual mass is given by,
𝛼 =𝑀𝑎𝑠𝑠
𝐼𝑛𝑖𝑡𝑖𝑎𝑙 𝑚𝑎𝑠𝑠 (Eq. 3-2)
For the gasification period, the char conversion is defined as
𝑥 =𝑚0−𝑚
𝑚0−𝑚𝑓 (Eq. 3-3)

20
3.1.3 Gasification experiments
The gasification experiments were performed in a pilot-scale updraft HTAG unit that uses
preheated air/steam as the gasifying medium. The system consists of a fuel feeding system,
a feed gas preheater, an updraft gasifier, and a syngas post-combustion unit, as shown in
Figure 3-4. The gasifier is approximately 3 m high with an internal diameter of 0.4 m.
Figure 3-4. Experimental setup of the HTAG system: (top) schematic view,
(bottom-left) actual view, and (bottom-right) temperature measuring points

21
A screw conveyor transports the biomass pellets stored in the feed tank to the gasifier. The
preheater supplies hot gasifying agent (air/steam) to the gasifier at the side of the bottom
section, below the grate. The 6 mm thick grate is perforated, with 40% open area, and made
from Kanthal steel, which allows high-temperature operation up to 1425 °C. A boiler
supplies steam, if steam is the gasifying agent. The biomass and produced hot gases flow
countercurrently. The syngas leaves the gasifier at the side of the top section. The remaining
unconverted fuel particles (mainly ash) pass through the grate and are collected in the ash
box. The produced syngas is burned in the post-combustion chamber.
The experimental procedure was as follows. First, the feeder was calibrated for each type
of biomass pellet before the experiments. The feeder works at a specific frequency, which
is correlated with the feeding rate. To calculate and examine the relation between the
frequency of the feeder and the feeding rate, a number of trials were conducted with each
biomass type, in which the frequency was varied at a certain time interval and the final
weight of the biomass feed was determined. Then, the relation between the frequency of
the feeder and the biomass feed rate was established, as shown in Figure 3-5.
Figure 3-5. Relation between feed rate and frequency of the feeder
y = 2.1158x
y = 2.4006xy = 2.7558x
y = 1.0064x
0
20
40
60
80
100
120
10 15 20 25 30 35 40 45 50
Fee
d (
kg/
h)
Frequency (Hz)
Gray pellets Black pelletsSpent grain biocoal Horse manure biocoal

22
For each pellet type, experiments were conducted with air/steam as the gasifying medium.
The gasifying agent was preheated by burning NG in a regenerative preheater. Once the
preheated gasifying agent reached the desired temperature, the frequency of the biomass
feeder was adjusted to achieve the required feed rate. The vertical temperature distribution
of the gasifier was measured with eight type-S thermocouples located along the reactor
height (see Figure 3-4) and recorded every minute by a data acquisition system connected
to a computer. The horizontal temperature gradient inside the gasifier was assumed to be
less significant. To calculate the pressure drop over the fuel bed and ensure a negative
pressure at the gasifier top (for safety reasons), four digital manometers were located along
the gasifier height. The values were manually recorded every five minutes.
After cooling and condensing by passing through the water traps, the dry syngas
composition was measured every three minutes by an online gas chromatograph (GC). Tar
sampling was carried out using a solid phase adsorption (SPA) method, in which 100 mL
of gas was collected in a syringe at a constant flow rate for off-line analysis. The particle
size distribution was analyzed using a low-pressure impactor (LPI).
The syngas flow rate was calculated by applying overall N balance. The slightly negative
pressure maintained at the top of the gasifier can cause air infiltration into the gasifier
through the biomass feeding line, and when applying N balance, a correction method was
applied to compensate this. First, the volumetric flow rate of the N-free gas stream was
calculated by applying C balance (negligible C content was assumed in the outgoing ash).
To obtain the total syngas flow rate, the input N2 flow rate was then directly added to the
volumetric flow rate of N-free gas.
The following method and definitions were adopted in the data analysis. A time period of
steady-state operation was selected for each run (20–60 min) based on the temperature and
gas composition recordings, and the measurements were averaged within the selected time
period.
The equivalence ratio (ER) is defined as
𝐸𝑅 =(𝑂2/𝐹)𝑎𝑐𝑡𝑢𝑎𝑙
(𝑂2/𝐹)𝑠𝑡𝑜𝑖𝑐ℎ𝑖𝑜𝑚𝑒𝑡𝑟𝑖𝑐 (Eq. 3-4)

23
Table 3-2 summarizes the stoichiometric O2 requirements calculated for combustion of
the various biomass types.
Table 3-2. Stoichiometric O2 requirement of each biomass type
Biomass type Composition (O2/F)stoichiometric
(mol/mol)
Gray pellets CH1.43O0.65 1.03
Black pellets CH1.32O0.58 1.04
Spent grain biocoal CH1.27O0.18 1.23
Horse manure biocoal CH1.16O0.32 1.13
The performance parameters can be defined as
𝐿𝐻𝑉𝑠𝑦𝑛𝑔𝑎𝑠 = ∑(𝐿𝐻𝑉𝑖 𝑥𝑖) (Eq. 3-5)
𝑌𝑠𝑦𝑛𝑔𝑎𝑠 =�̇�𝑠𝑦𝑛𝑔𝑎𝑠
�̇�𝑐 (Eq. 3-6)
𝐶𝐺𝐸 =𝐿𝐻𝑉𝑠𝑦𝑛𝑔𝑎𝑠
𝐿𝐻𝑉𝑓𝑢𝑒𝑙 𝑌𝑠𝑦𝑛𝑔𝑎𝑠 × 100% (Eq. 3-7)
For a single tar compound, the tar dew point is given by [34]
22400𝐶𝑡𝑎𝑟
𝑀𝑡𝑎𝑟
(273+𝑇)
273
1
𝑃𝑠𝑣(𝑇)= 1 (Eq. 3-8)
For a mixture of tar compounds, the dew point can be calculated in a similar manner from
the sum of each contribution. Based on this, the complete dew point model developed by
Energy Research Centre of the Netherlands [35] was used to calculate the tar dew points in
this study.

24
3.2 Application-oriented process simulations
3.2.1 System description
A multi-stage biomass gasification plant and a steel industry heat treatment furnace were
studied for integration. The example gasifier system is the Cortus WoodRoll® process [36],
whereas the example furnace is a heat treatment belt furnace in the Höganäs steel powder
plant [37]. The details of each process step are described in the next section.
NG firing followed by five different syngas firing cases with different heat recovery options
(as given below) was assessed.
Case 1: No heat recovery
Case 2: Low-temperature heat recovery for steam superheating
Case 3: Low-temperature heat recovery for biomass predrying
Case 4: Low-temperature heat recovery for steam superheating and biomass predrying
Case 5: High-temperature heat recovery for steam superheating and biomass drying
As high-temperature heat recovery from furnace flue gases could be costly and complex,
more focus was given to low-temperature heat recovery. The temperature limits for the
low-temperature and high-temperature heat recovery options (400 °C and 700 °C,
respectively) were chosen by considering the conventional heat exchanger operating range
[38] and the flue gas temperature, respectively.
Figure 3-6 shows the basic integration system without heat recovery (Case 1).

25
Fig
ure
3-6
. B
asi
c i
nte
gra
tio
n o
f th
e g
asi
fier
syst
em
an
d t
he f
urn
ace

26
3.2.2 Scenario description
In addition to the use of syngas in the furnace, the co-production of limited quantities of
coke and H2 (⅓ of the feedstock for coke production and ¼ of the feedstock for H2
separation) was considered as the initial step.
The following four production scenarios were analyzed for energy efficiency.
Scenario 1: Only syngas
Scenario 2: Syngas and coke
Scenario 3: Syngas and H2
Scenario 4: Syngas, coke, and H2
3.2.3 Process models
A steady-state model was developed for the integrated system using Aspen Plus. Details of
such solids modeling with Aspen Plus can be found elsewhere [39]. Only the main sub-
processes and boundary conditions are discussed here.
Predrying
Predrying is incorporated for cases 3 and 4. Raw biomass with approximately 40% moisture
is dried to a lower moisture content of around 20–25% in a predryer prior to the drying
process. This process allows furnace flue gas heat recovery, while enabling smooth
functioning of the gasifier system. To avoid any acid condensation, the flue gas exhaust
temperature is kept above 170 °C.
Drying
The moisture content of the biomass is reduced to approximately 5% in a dryer by using
the hot flue gas from the pyrolyzer exit. In case 5, the furnace flue gas is used instead. The
temperature of both the predryer and dryer is maintained at 105 °C. To remove the evolved
moisture, hot vent air at 100 °C is used with a flow rate of 2 Nm3/kg moisture removed.

27
The mass balance of the drying process is expressed as
�̇�𝑏𝑖𝑜𝑚𝑎𝑠𝑠_𝑤𝑒𝑡 + �̇�𝑣𝑒𝑛𝑡 𝑎𝑖𝑟 = �̇�𝑏𝑖𝑜𝑚𝑎𝑠𝑠_𝑑𝑟𝑦 + �̇�𝑚𝑜𝑖𝑠𝑡 𝑣𝑒𝑛𝑡 𝑎𝑖𝑟 (Eq. 3-9)
The energy balance of the drying process is given by
∑ �̇�𝑖𝑖 ∫ 𝐶𝑝,𝑖𝑑𝑇𝑇𝑓𝑙𝑢𝑒𝑔𝑎𝑠_𝑖𝑛
𝑇𝑓𝑙𝑢𝑒𝑔𝑎𝑠_𝑜𝑢𝑡= �̇�𝑏𝑖𝑜𝑚𝑎𝑠𝑠_𝑑𝑟𝑦 ∫ 𝐶𝑝,𝑏𝑖𝑜𝑚𝑎𝑠𝑠_𝑑𝑟𝑦𝑑𝑇
𝑇𝑏𝑖𝑜𝑚𝑎𝑠𝑠_𝑜𝑢𝑡
𝑇𝑏𝑖𝑜𝑚𝑎𝑠𝑠_𝑖𝑛+
�̇�𝐻2𝑂 [∫ 𝐶𝑝,𝐻2𝑂𝑑𝑇𝑇𝑏𝑖𝑜𝑚𝑎𝑠𝑠_𝑜𝑢𝑡
𝑇𝑏𝑖𝑜𝑚𝑎𝑠𝑠_𝑖𝑛+ 𝐿𝐻2𝑂] + �̇�𝑣𝑒𝑛𝑡 𝑎𝑖𝑟 ∫ 𝐶𝑝,𝑣𝑒𝑛𝑡 𝑎𝑖𝑟𝑑𝑇 + �̇�𝐿
𝑇𝑣𝑒𝑛𝑡 𝑎𝑖𝑟_𝑜𝑢𝑡
𝑇𝑣𝑒𝑛𝑡 𝑎𝑖𝑟_𝑖𝑛
(Eq. 3-10)
in which 10% heat loss is assumed.
Pyrolysis
Pyrolysis of dry biomass is carried out at a temperature that generates just enough pyrolysis
gas and char for the process by using hot flue gas from the gasifier exit. This temperature
depends on the heat recovery option considered. When calculating the yields of the
pyrolysis products, it was assumed that C2H4 is the only significant higher hydrocarbon
present in the pyrolysis gas, and tar is considered as a single component.
𝐵𝑖𝑜𝑚𝑎𝑠𝑠(𝑑𝑎𝑓) → 𝛼1𝐶ℎ𝑎𝑟 + 𝛼2𝐶𝑂 + 𝛼3𝐶𝑂2 + 𝛼4𝐻2 + 𝛼5𝐻2𝑂 + 𝛼6𝐶𝐻4 + 𝛼7𝐶2𝐻4 +
𝛼8𝑇𝑎𝑟 (R. 3-1)
To calculate the stoichiometric coefficients, some available empirical correlations were
coupled with elemental balances and energy balance. The ash content (0.4%wtdb) and
moisture content of dried biomass are then directly added to the output.
The empirical relations are as follows [40]:
𝑀𝐻2 𝛼4/𝑀𝐵𝑖𝑜𝑚𝑎𝑠𝑠
𝑀𝐶𝑂 𝛼2/𝑀𝐵𝑖𝑜𝑚𝑎𝑠𝑠= 3 × 10⁻⁴ +
0.0429
1+(𝑇
632)
−7.23 (Eq. 3-11)
𝑀𝐶𝐻4 𝛼6
𝑀𝐵𝑖𝑜𝑚𝑎𝑠𝑠= −2.18 × 10⁻⁴ + 0.146
𝑀𝐶𝑂 𝛼2
𝑀𝐵𝑖𝑜𝑚𝑎𝑠𝑠 (Eq. 3-12)
𝑀𝐻2 𝛼4
𝑀𝐵𝑖𝑜𝑚𝑎𝑠𝑠= 1.145 [1 − 𝑒𝑥𝑝 (−0.11 × 10⁻² 𝑇)]9.384 (Eq. 3-13)
𝐿𝐻𝑉𝐺 = −6.23 + 2.47 × 10⁻² 𝑇 (Eq. 3-14)
where
𝐿𝐻𝑉𝐺(𝑀𝐵𝑖𝑜𝑚𝑎𝑠𝑠 − 𝑀𝐶ℎ𝑎𝑟𝛼1 − 𝑀𝐻2𝑂𝛼5 − 𝑀𝑇𝑎𝑟𝛼8) = 𝑀𝐶2𝐻4𝛼7 𝐿𝐻𝑉𝐶2𝐻4
+
𝑀𝐶𝐻4𝛼6 𝐿𝐻𝑉𝐶𝐻4
+ 𝑀𝐻2𝛼4 𝐿𝐻𝑉𝐻2
+ 𝑀𝐶𝑂𝛼2 𝐿𝐻𝑉𝐶𝑂 (Eq. 3-15)
28
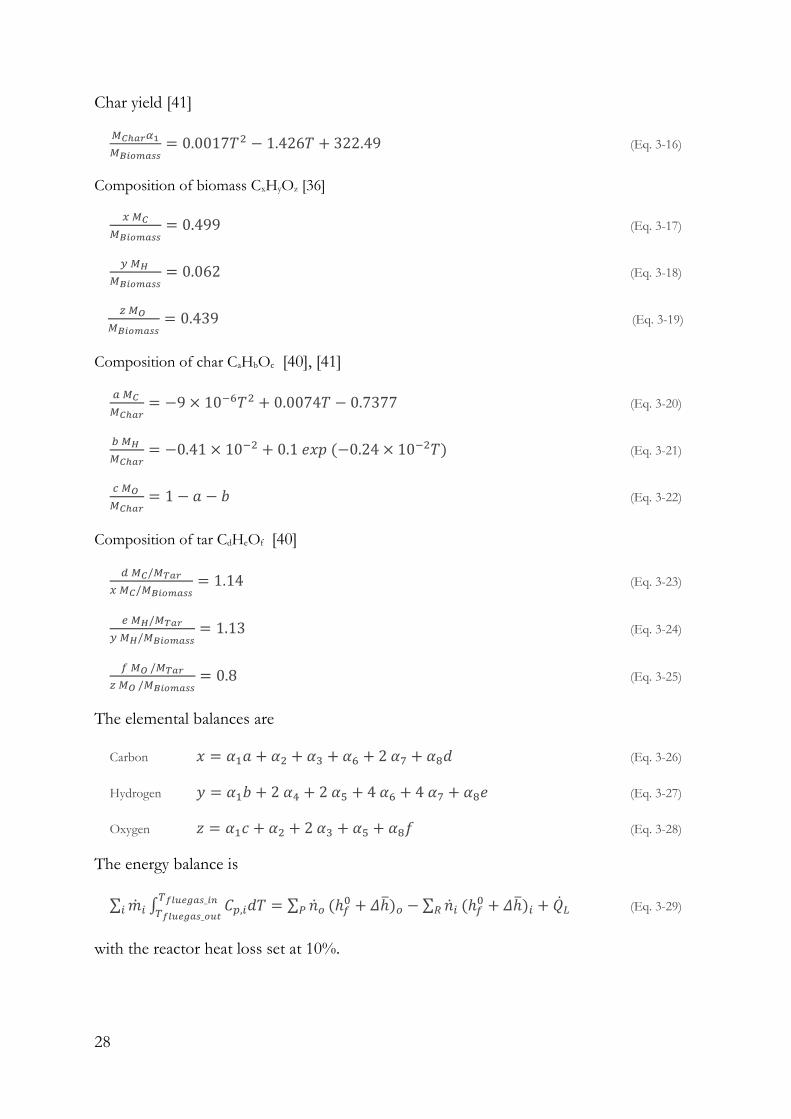
Char yield [41]
𝑀𝐶ℎ𝑎𝑟𝛼1
𝑀𝐵𝑖𝑜𝑚𝑎𝑠𝑠= 0.0017𝑇2 − 1.426𝑇 + 322.49 (Eq. 3-16)
Composition of biomass CxHyOz [36]
𝑥 𝑀𝐶
𝑀𝐵𝑖𝑜𝑚𝑎𝑠𝑠= 0.499 (Eq. 3-17)
𝑦 𝑀𝐻
𝑀𝐵𝑖𝑜𝑚𝑎𝑠𝑠= 0.062 (Eq. 3-18)
𝑧 𝑀𝑂
𝑀𝐵𝑖𝑜𝑚𝑎𝑠𝑠= 0.439 (Eq. 3-19)
Composition of char CaHbOc [40], [41]
𝑎 𝑀𝐶
𝑀𝐶ℎ𝑎𝑟= −9 × 10⁻⁶𝑇2 + 0.0074𝑇 − 0.7377 (Eq. 3-20)
𝑏 𝑀𝐻
𝑀𝐶ℎ𝑎𝑟= −0.41 × 10⁻² + 0.1 𝑒𝑥𝑝 (−0.24 × 10⁻²𝑇) (Eq. 3-21)
𝑐 𝑀𝑂
𝑀𝐶ℎ𝑎𝑟= 1 − 𝑎 − 𝑏 (Eq. 3-22)
Composition of tar CdHeOf [40]
𝑑 𝑀𝐶/𝑀𝑇𝑎𝑟
𝑥 𝑀𝐶/𝑀𝐵𝑖𝑜𝑚𝑎𝑠𝑠= 1.14 (Eq. 3-23)
𝑒 𝑀𝐻/𝑀𝑇𝑎𝑟
𝑦 𝑀𝐻/𝑀𝐵𝑖𝑜𝑚𝑎𝑠𝑠= 1.13 (Eq. 3-24)
𝑓 𝑀𝑂 /𝑀𝑇𝑎𝑟
𝑧 𝑀𝑂 /𝑀𝐵𝑖𝑜𝑚𝑎𝑠𝑠= 0.8 (Eq. 3-25)
The elemental balances are
Carbon 𝑥 = 𝛼1𝑎 + 𝛼2 + 𝛼3 + 𝛼6 + 2 𝛼7 + 𝛼8𝑑 (Eq. 3-26)
Hydrogen 𝑦 = 𝛼1𝑏 + 2 𝛼4 + 2 𝛼5 + 4 𝛼6 + 4 𝛼7 + 𝛼8𝑒 (Eq. 3-27)
Oxygen 𝑧 = 𝛼1𝑐 + 𝛼2 + 2 𝛼3 + 𝛼5 + 𝛼8𝑓 (Eq. 3-28)
The energy balance is
∑ �̇�𝑖𝑖 ∫ 𝐶𝑝,𝑖𝑑𝑇𝑇𝑓𝑙𝑢𝑒𝑔𝑎𝑠_𝑖𝑛
𝑇𝑓𝑙𝑢𝑒𝑔𝑎𝑠_𝑜𝑢𝑡= ∑ �̇�𝑜𝑃 (ℎ𝑓
0 + 𝛥ℎ̅)𝑜 − ∑ �̇�𝑖𝑅 (ℎ𝑓0 + 𝛥ℎ̅)𝑖 + �̇�𝐿 (Eq. 3-29)
with the reactor heat loss set at 10%.

29
Gasification
Prior to gasification, the char is cooled to ambient temperature and crushed to
approximately 100 µm.
The Hardgrove grindability index (HGI) is given as [42]
𝐻𝐺𝐼 = 2.65 𝑒𝑥𝑝 (𝐶
20) (Eq. 3-30)
Gasification is carried out at 1100 °C by indirect heat supplied by burning the pyrolysis gas.
The gasifying agent is saturated or superheated steam at a pressure of 6 bar. Steam is
generated by recovering waste heat from the hot syngas and superheated by recovering
waste heat from the furnace flue gases. An S/C molar ratio of 1.3 is maintained by
considering the transfer limitations.
𝐶ℎ𝑎𝑟 + 1.3𝑎 𝐻2𝑂 → 𝛽1𝐶𝑂 + 𝛽2𝐶𝑂2 + 𝛽3𝐻2 + 𝛽4𝐻2𝑂 + 𝛽5𝐶𝐻4 (R. 3-2)
For a fixed temperature and pressure, the equilibrium gives
𝑑𝐺𝑚𝑖𝑥 = 0 (Eq. 3-31)
where the Gibbs energy for a mixture of ideal gases is
𝐺𝑚𝑖𝑥 = ∑ 𝑁𝑖�̅�𝑖,𝑇 = ∑ 𝑁𝑖 [�̅�𝑖,𝑇0 + 𝑅𝑇 𝑙𝑛 (
𝑃𝑖
𝑃0)] (Eq. 3-32)
To account for possible deviations from equilibrium, a restricted equilibrium method was
applied by defining an approach temperature for the following reactions.
Water gas shift reaction: 𝐶𝑂 + 𝐻2𝑂 ⇌ 𝐶𝑂2 + 𝐻2 (R. 3-3)
Methane steam reforming: 𝐶𝐻4 + 𝐻2𝑂 ⇌ 𝐶𝑂 + 3 𝐻2 (R. 3-4)
With the restricted equilibrium, the equilibrium is evaluated at a temperature lower than the
operating temperature, such that the model results are comparable with the experimental
case. This well-established method has been used for both fluidized bed gasifiers [43, 44]
and entrained flow gasifiers [45].
The energy balance is
∑ �̇�𝑖𝑖 ∫ 𝐶𝑝,𝑖𝑑𝑇𝑇𝑓𝑙𝑢𝑒𝑔𝑎𝑠_𝑖𝑛
𝑇𝑓𝑙𝑢𝑒𝑔𝑎𝑠_𝑜𝑢𝑡= ∑ �̇�𝑜𝑃 (ℎ𝑓
0 + 𝛥ℎ̅)𝑜
− ∑ �̇�𝑖𝑅 (ℎ𝑓0 + 𝛥ℎ̅)
𝑖+ �̇�𝐿 (Eq. 3-33)
The gasifier heat losses are obtained from the experimental conditions.

30
Gas cleaning and cooling
To separate the coarse ash particles from the syngas, a cyclone is used, which is modeled
as a high-efficiency-type cyclone in the design mode.
Gas cooling is carried out by means of a waste heat recovery boiler that generates steam.
The boiler is modeled by two heat exchangers in series for sensible and latent heat,
respectively. The energy balance is as follows.
∑ �̇�𝑖𝑖 ∫ 𝐶𝑝,𝑖𝑑𝑇𝑇𝑠𝑦𝑛𝑔𝑎𝑠_𝑖𝑛
𝑇𝑠𝑦𝑛𝑔𝑎𝑠_𝑜𝑢𝑡= �̇�𝐻2𝑂 [∫ 𝐶𝑝,𝐻2𝑂𝑑𝑇
𝑇𝐻2𝑂_𝑜𝑢𝑡
𝑇𝐻2𝑂_𝑖𝑛+ 𝐿𝐻2𝑂] + �̇�𝐿 (Eq. 3-34)
with the heat losses from these heat exchangers set at 10%.
To separates the fine particles from the syngas, a fabric filter is used, which is modeled in
design mode. Then, a water-cooled condenser operating at 35 °C condenses the extra steam
available in the syngas. Clean dry syngas is stored in a gas storage tank at a pressure slightly
above atmospheric pressure.
Combustion and heat transfer inside the furnace
When the syngas is burned in the heat treatment furnace, complete combustion is assumed.
The stoichiometric reactions occurring in the furnace are
𝐶𝑂 + 0.5 𝑂2 → 𝐶𝑂2 (R. 3-5)
𝐻2 + 0.5 𝑂2 → 𝐻2𝑂 (R. 3-6)
𝐶𝐻4 + 2 𝑂2 → 𝐶𝑂2 + 2 𝐻2𝑂 (R. 3-7)
The combustion is carried out with 10% excess air.
The adiabatic combustion process is expressed as
∑ �̇�𝑖𝑅 (ℎ𝑓0 + 𝛥ℎ̅)𝑖 = ∑ �̇�𝑜𝑃 (ℎ𝑓
0 + 𝛥ℎ̅)𝑜 (Eq. 3-35)
where
𝛥ℎ̅𝑖 = ∫ 𝑐𝑝,𝑖𝑇𝑖𝑛
𝑇𝑟𝑒𝑓𝑑𝑇 (Eq. 3-36)
𝛥ℎ̅𝑜 = ∫ 𝑐𝑝,𝑖𝑇𝑎𝑑
𝑇𝑟𝑒𝑓𝑑𝑇 (Eq. 3-37)
The heat generated by the combustion of syngas is used to supply heat for the iron powder
and process gas.

31
The energy balance of the furnace is given by
∑ �̇�𝑖𝑖 ∫ 𝐶𝑝,𝑖𝑑𝑇𝑇𝑎𝑑
𝑇𝑓𝑙𝑢𝑒𝑔𝑎𝑠_𝑜𝑢𝑡= �̇�𝑖𝑟𝑜𝑛 ∫ 𝐶𝑝,𝑖𝑟𝑜𝑛𝑑𝑇
𝑇𝑖𝑟𝑜𝑛_𝑜𝑢𝑡
𝑇𝑖𝑟𝑜𝑛_𝑖𝑛+
�̇�𝑝𝑟𝑜𝑐𝑒𝑠𝑠𝑔𝑎𝑠 ∫ 𝐶𝑝,𝑝𝑟𝑜𝑐𝑒𝑠𝑠𝑔𝑎𝑠𝑑𝑇𝑇𝑝𝑟𝑜𝑐𝑒𝑠𝑠𝑔𝑎𝑠_𝑜𝑢𝑡
𝑇𝑝𝑟𝑜𝑐𝑒𝑠𝑠𝑔𝑎𝑠_𝑖𝑛+ �̇�𝐿 (Eq. 3-38)
The heat loss from the furnace is assumed to be similar to the NG firing case in the real
furnace.
Coke making process
A separate stream of char (equivalent to ⅓ of the feed) is used for the coke making process.
The process is carried out at 1100 °C.
𝐶ℎ𝑎𝑟 → 𝛾1𝐶 + 𝛾2𝐶𝑂 + 𝛾3𝐶𝑂2 + 𝛾4𝐻2 + 𝛾5𝐻2𝑂 + 𝛾6𝐶𝐻4 + 𝛾7𝐶2𝐻4 (R. 3-8)
For preliminary calculations, the yields of the coking process were obtained from the
experimental data. At this stage, the coke gas is recycled back to the gasifier burners to
recover heat.
H2 separation process
Pressure swing adsorption (PSA) is used to separate H2 from part of the syngas (equivalent
to ¼ of the feed). A H2 recovery rate of around 80% is expected for a typical industrial
PSA process, and this value is used as a preliminary value for the calculation of the H2 yield.
3.2.4 Performance analysis
Efficiency
The gasifier system efficiency is defined by
𝜂𝐺 =𝐸𝐶ℎ,𝑠𝑦𝑛𝑔𝑎𝑠
𝐸𝐶ℎ,𝑏𝑖𝑜𝑚𝑎𝑠𝑠× 100% (Eq. 3-39)
The furnace system efficiency is defined by
𝜂𝐹 =𝐸𝑆,𝐹𝑒
𝐸𝐶ℎ,𝑠𝑦𝑛𝑔𝑎𝑠× 100% (Eq. 3-40)

32
The integrated system efficiency is defined by
𝜂𝐼 =𝐸𝑆,𝐹𝑒+𝐸𝐶ℎ,𝑐𝑜𝑘𝑒+𝐸𝐶ℎ,𝐻2
𝐸𝐶ℎ,𝑏𝑖𝑜𝑚𝑎𝑠𝑠× 100% (Eq. 3-41)
All the calculations are performed based on an ambient temperature of 10 °C. The chemical
energy values are based on the LHV.
Pinch analysis
The performance of the heat integration was analyzed by means of pinch analysis using the
IChemE pinch analysis spreadsheet [46] as a tool to develop the graphical representation
of the heat cascade (grand composite curve (GCC)). The minimum temperature difference
was taken as 20 °C.

33
CHAPTER IV
4 BIOMASS CHARACTERIZATION
4.1 Mass loss behavior
The decomposition behavior of both pellet types was studied based on the
thermogravimetric residual mass curve presented in Figure 4-1.
Figure 4-1. TGA mass loss curves
The proximate composition of each biomass obtained from above mass loss curves is
summarized in Table 4-1.
Table 4-1. Proximate analysis of each biomass type obtained with TGA
Biomass type Volatiles (% wt) Fixed carbon (% wt) Ash (% wt)
Gray pellets 87 10 3
Black pellets 87 12 1
Biocoal 81 15 4
0
100
200
300
400
500
600
700
800
900
1000
1100
0
10
20
30
40
50
60
70
80
90
100
0 10 20 30 40 50 60 70 80 90 100 110
Tem
pe
ratu
re [
°C]
Mas
s [%
]
Time [min]
Gray pellets Black pellets Biocoal Temperature
N2 N2/CO2

34
It can be noted that the proximate composition values obtained from this TGA method
are different from those obtained from the ASTM method in Table 3-1. This difference
could be due to two factors: the different heating rates applied and the different oxidizing
atmospheres. The typical oxidizer used in the ASTM method is O2, while CO2 was used in
the TGA method.
4.2 Pyrolysis behavior
The constant heating rate period in the pyrolysis stage was further studied using the
derivative thermogravimetry (DTG) plots given in Figure 4-2, which is the first derivative
of the residual mass curve. The peak temperatures and intensities are summarized in Table
4-2.
Figure 4-2. Derivative thermogravimetric plots for each biomass type

35
Table 4-2. DTG peak temperatures and intensities for each biomass type
Biomass type Peak 1 Peak 2 Peak 3
Temperature
(°C)
Intensity
(Wt%/°C)
Temperature
(°C)
Intensity
(Wt%/°C)
Temperature
(°C)
Intensity
(Wt%/°C)
Gray pellets - 372 0.79 -
Black pellets 241 0.13 367 0.83 -
Biocoal 207 0.26 374 0.35 419 0.19
One of the major differences seen in the DTG plots of pretreated biomass (black pellets
and biocoal) is the early stage peak attached to the main peak compared with the
asymmetrical peak of unpretreated biomass (Gray pellets). Pretreatment has been reported
to release some hemicellulose into the solution, while depolymerizing the remaining
hemicellulose. Due to the depolymerized hemicellulose components, the peak shifts to a
lower temperature, which is otherwise merged with the cellulose peak. This phenomenon
is more prominent (low peak temperature and high peak intensity) with hydrothermal
carbonized biomass, which has undergone severe pretreatment.
Another difference is the peak temperature and peak intensity of cellulose decomposition.
Compared with gray pellets, black pellets show a slightly lower peak temperature and
slightly higher peak intensity, whereas biocoal shows a slightly higher peak temperature and
considerably lower peak intensity. The low thermal stability and high decomposition rate
of cellulose in black pellets could be due to the separation of the hemicellulose peak from
the cellulose peak, which otherwise suppresses cellulose decomposition due to melted
hemicellulose on the cellulose surface. Another reason could be the depolymerization of
cellulose during pretreatment [47]. Such low thermal stability of cellulose due to the steam
explosion pretreatment has been previously reported [47-50]. Black pellets are
predominantly softwood, whereas gray pellets are produced from hardwood. Hardwood
decomposes at a lower temperature than softwood due to a high content of hemicellulose.
Therefore, a more prominent peak shift would be observed if the black pellets and gray
pellets are from the same origin.
The DTG plot for biocoal decomposition shows a unique feature, with a shoulder at 419
°C attached to the cellulose peak. HTC reportedly results in the release of lignin into the
solution, followed by redeposition on the surface, as validated in several studies using

36
scanning electron microscope (SEM) images [51-54]. It was hypothesized in another study
that lignin may undergo a phase transition during aqueous high-temperature pretreatment
[55]. The shoulder observed beyond the cellulose peak in the DTG plot of biocoal may be
due to the presence of redeposited lignin globules on the surface, as observed by other
researchers for biocoal based on wheat straw and dried digestate. The thermal
decomposition of the separated globules has been reported to result in a peak near 400 °C
[52]. The presence of lignin globules on the surface may suppress cellulose decomposition
(high thermal stability and low intensity) by covering the cellulose surface with melted
lignin. A decrease in the peak cellulose decomposition rate and increase in the cellulose
thermal stability due to HTC pretreatment has been reported [52, 53, 56]. The high intensity
of lignin decomposition for biocoal may be due to an enhancement of the lignin content as
a result of the loss of hemicellulose. A slightly higher intensity above 400 °C is also seen
for black pellets compared with gray pellets. The breakdown of β-O-4 linkages and the C
α-Cβ bonds of lignin have also been reported due to HTC pretreatment, which can result
in the early thermal degradation of lignin [53]. Such low lignin decomposition temperatures
have also been reported for steam-exploded biomass [48, 50].
4.3 Char gasification behavior
The char conversion behavior of each biomass obtained from the above mass loss curves
is shown in Figure 4-3.

37
Figure 4-3. Char conversion progress with time
If the period of the char gasification process is considered, black pellets show a slightly
higher conversion rate than gray pellets. This could be due to the high fixed C content that
effectively moves the Boudouard reaction towards CO production. Biocoal shows a
considerably lower conversion rate compared with both black pellets and gray pellets. This
is possibly due to a lower char surface area because of the lower volatile content of biocoal.
0
0.2
0.4
0.6
0.8
1
0 5 10 15 20 25 30
Ch
ar c
on
vers
ion
Time (min)
Gray pellets Black pellets Biocoal

38
CHAPTER V
5 GASIFICATION PERFORMANCE IN UPDRAFT HTAG
5.1 Gasification of unpretreated and steam-exploded biomass
This section summarizes the results from air gasification and steam gasification of
unpretreated gray pellets and steam-exploded black pellets. The ER of air gasification was
maintained at around 0.2 and the steam/biomass ratio for steam gasification was fixed at
1.2. The preheating temperature of the gasifying agent was around 1000 °C.
5.1.1 Temperature distribution
Figure 5-1. Temperature profiles along the gasifier height
According to Figure 5-1, the temperature profiles feature two regions: the bed zone with
a significant temperature drop and the gas phase with an almost flat temperature profile.
The typical peak temperature expected in the combustion zone is not observed, possibly
because the combustion zone is thin, making it difficult to identify with the limited
temperature measuring points.
-20
0
20
40
60
80
100
120
500 700 900 1100 1300
Dis
tan
ce f
rom
th
e g
rate
(cm
)
Temperature (°C)
Black pellets with air
Black pellets with steam
Gray pellets with air
Gray pellets with steam

39
The high C content of black pellets results in a high temperature drop in the bed area,
mainly due to the endothermic Boudouard reaction. In contrast, better temperature
uniformity within the gasifier is seen for gray pellet gasification due to the lower C and
higher volatile content of gray pellets.
5.1.2 Syngas composition
Figure 5-2. Gas compositions and ratios for (left) air gasification and
(right) steam gasification
According to Figure 5-2, both air and steam gasification of black pellets result in a high
CO content in the syngas, whereas a high content of H2 and CO2 is obtained with gray
pellet gasification. The high CO/CO2 ratio and low H2/CO ratio reveal that the Boudouard
reaction is more effective, while the water gas shift reaction is suppressed during gasification
0
10
20
30
40
50
CO H2 CO2 CH4 CxHy*10
Co
mp
osi
tio
n (
%) Black pellets
Gray pellets
CO H2 CO2 CH4 CxHy*10
0
10
20
30
40
50
CO H2 CO2 CH4 CxHy*10
Co
mp
osi
tio
n (
%) Black pellets
Gray pellets
CO H2 CO2 CH4 CxHy*10
0
1
2
3
4
CO/CO2 H2/CO CH4/H2
Ch
arac
teri
stic
rat
io (
mo
l/m
ol)
Black pellets
Gray pellets
CO/CO2 H2/CO CH4/H2
0
1
2
3
4
CO/CO2 H2/CO CH4/H2
Ch
arac
teri
stic
rat
io (
mo
l/m
ol)
Black pellets
Gray pellets
CO/CO2 H2/CO CH4/H2
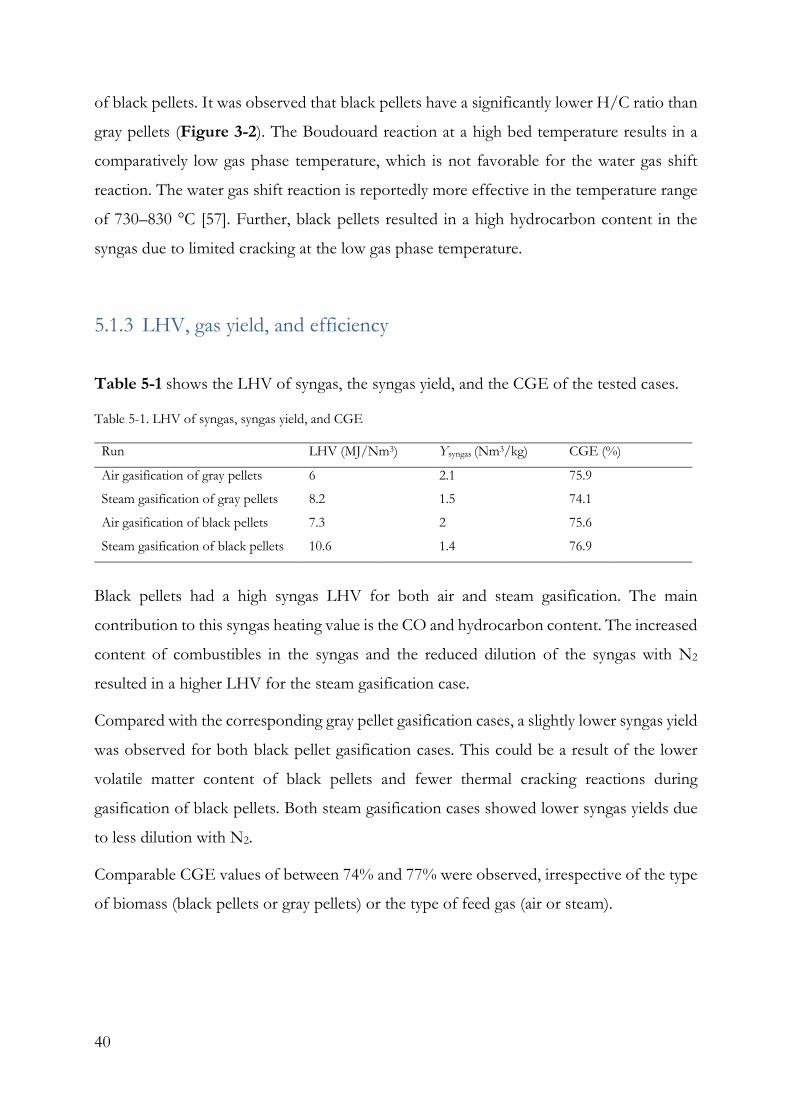
40
of black pellets. It was observed that black pellets have a significantly lower H/C ratio than
gray pellets (Figure 3-2). The Boudouard reaction at a high bed temperature results in a
comparatively low gas phase temperature, which is not favorable for the water gas shift
reaction. The water gas shift reaction is reportedly more effective in the temperature range
of 730–830 °C [57]. Further, black pellets resulted in a high hydrocarbon content in the
syngas due to limited cracking at the low gas phase temperature.
5.1.3 LHV, gas yield, and efficiency
Table 5-1 shows the LHV of syngas, the syngas yield, and the CGE of the tested cases.
Table 5-1. LHV of syngas, syngas yield, and CGE
Run LHV (MJ/Nm3) Ysyngas (Nm3/kg) CGE (%)
Air gasification of gray pellets 6 2.1 75.9
Steam gasification of gray pellets 8.2 1.5 74.1
Air gasification of black pellets 7.3 2 75.6
Steam gasification of black pellets 10.6 1.4 76.9
Black pellets had a high syngas LHV for both air and steam gasification. The main
contribution to this syngas heating value is the CO and hydrocarbon content. The increased
content of combustibles in the syngas and the reduced dilution of the syngas with N2
resulted in a higher LHV for the steam gasification case.
Compared with the corresponding gray pellet gasification cases, a slightly lower syngas yield
was observed for both black pellet gasification cases. This could be a result of the lower
volatile matter content of black pellets and fewer thermal cracking reactions during
gasification of black pellets. Both steam gasification cases showed lower syngas yields due
to less dilution with N2.
Comparable CGE values of between 74% and 77% were observed, irrespective of the type
of biomass (black pellets or gray pellets) or the type of feed gas (air or steam).

41
Figure 5-3. Tar composition based on identified tar species: (top) by category,
(middle) BTEX, phenols, and cresols, and (bottom) PAH
0
2
4
6
8
10
12
Air gasification ofBlack pellets
Air gasification ofGray pellets
Steam gasificationof Black pellets
Co
mp
osi
tio
n (
g/N
m3 )
BTEX PAH Phenol and Cresols
0
0.5
1
1.5
2
2.5
3
Air gasification ofBlack pellets
Air gasification ofGray pellets
Steam gasificationof Black pellets
Co
mp
osi
tio
n (
g/N
m3 )
Benzene Toluene Xylene Phenol Cresol
0
0.5
1
1.5
2
2.5
Co
mp
osi
tio
n (
g/N
m3) Air gasification of Black pellets
Air gasification of Gray pellets
Steam gasification of Blackpellets

42
5.1.4 Syngas purity
The syngas purity was examined using the tar content, composition, and dew point. The
identified tar species of syngas are grouped into three categories:
benzene/toluene/ethylbenzene/xylenes (BTEX), phenols and cresols, and polycyclic
aromatic hydrocarbons (PAH). Figure 5-3 shows the distribution of these three categories
in the obtained tar and the composition of each category by compound.
The tar obtained with air gasification was dominated by PAHs (mainly lighter compounds),
while phenols and cresols were the least abundant. Compared with gray pellets, black pellets
had a lower PAH and higher phenol and cresol content in the obtained tar.
The high phenol and cresol content of black pellet-derived tar could be due to the low gas
phase temperature. The content was further increased with steam gasification. At high
temperatures, secondary phenolic tars are converted to tertiary tars, including benzene and
naphthalene. As a result, the benzene and naphthalene content was nearly doubled during
gray pellet gasification. This type of aromatization at high temperatures and favorable
production of phenolic compounds with high steam content and low temperature has been
reported in the literature [58, 59]. Table 5-2 shows the total tar content1 and tar dew point
for each experimental case.
Table 5-2. Total tar content and tar dew point
Run Tar content (g/Nm3) Tar dew point (°C)
Air gasification of black pellets 15.4 108
Air gasification of gray pellets 13.4 105.4
Steam gasification of black pellets 11.4 93.3
The low syngas temperature observed for black pellet gasification had a limited effect on
the total tar content. This could be due to the low volatile (or hemicellulose) content and
high fixed carbon (or lignin) content of black pellets. Crosslinking reactions between
cellulose and lignin cause the formation of less tar during pyrolysis [60]. Further, steam
gasification produces less tar due to steam reforming reactions. The dew points were
around 100 °C in all cases, giving more freedom to downstream processing. Generally,
1 Total tar content including unidentified tar species

43
PAHs contribute to a high dew point of tar. However, irrespective of a high PAH content,
gray pellet gasification resulted in a slightly lower tar dew point due to a high content of
low boiling point benzene and naphthalene.
5.2 Gasification of hydrothermal carbonized biomass
This section summarizes the results for air gasification of HTC biocoal pellets. Three runs
with ER values varying from 0.2 to 0.22 were considered. The preheating temperature of
the gasifying agent was around 900 °C.
5.2.1 Temperature distribution
The temperature profiles for three gasification cases with different ER values are depicted
in Figure 5-4. Because the average temperature of the steady-state operating period was
used for the analysis, the standard deviation is plotted as the error bars.
Figure 5-4. Temperature profiles along the gasifier height
500
600
700
800
900
1000
1100
1200
1300
1400
1500
0 0.2 0.4 0.6 0.8 1 1.2
Tem
pe
ratu
re (
0 C)
Distance from the grate (m)
ER=0.2 ER=0.21 ER=0.22

44
Similar to the previous experiments, the temperature profiles show a bed zone with a
significant temperature drop and a gas phase with an almost flat temperature profile. A high
ER value resulted in a higher temperature, which facilitated the endothermic Boudouard
reaction and ultimately reduced the temperature in the bed zone. This effect was more
pronounced in the highest ER case, which could be due to the comparatively high bed
observed (0.5 m compared with 0.4–0.42 m). The slight temperature increase immediately
after the bed zone in the lower ER cases could be due to the slightly exothermic water gas
shift reaction. The highest ER case seems less effective for the water gas shift reaction
because the gas phase temperature is too low. The gas exit temperature showed a decreasing
trend with ER.
5.2.2 Syngas composition
Figure 5-5 shows the composition of the syngas and various important gas ratios. Because
the average composition of the steady-state operating period was used, the standard
deviation is plotted as the error bars. The sum of the higher hydrocarbons is represented
by CxHy, where x ranges from 2 to 6.
Figure 5-5. Gas composition and ratios
Increasing the ER value had a positive effect on the CO content and negative effects on
the H2 and hydrocarbon contents of the syngas. As discussed for the temperature profile,
the extraordinary performance of the Boudouard reaction (indicated by the CO/CO2 ratio)
for the highest ER case could be due to the effect of a higher bed. The high H2/CO ratio
observed for low ER cases is an indication of the water gas shift reaction, which was also
0
5
10
15
20
25
30
35
H2 CO CO2 CH4 CxHy
Co
mp
osi
tio
n (
%)
ER=0.2 ER=0.21 ER=0.22
H2 CO CO2 CH4 CxHy
0
1
2
3
4
5
6
CO/CO2 H2/CO CH4/H2
Ch
arac
teri
stic
rat
io
(mo
l/m
ol)
ER=0.2 ER=0.21 ER=0.22
CO/CO2 H2/CO CH4/H2

45
evidenced by the temperature profiles. The high temperature in the gas phase enhances tar
cracking and hence increasing the hydrocarbon content.
5.2.3 LHV, gas yield, and efficiency
Figure 5-6 shows the LHV and CGE of the tested cases.
Figure 5-6. LHV and CGE
Irrespective of the high content of CO, the LHV and CGE were negatively correlated with
the ER as a result of the low hydrocarbon and H2 contents. The gas yield was around 2.9-
3 Nm3/kg. The most promising case has an LHV of 7.9 MJ/Nm3 and CGE of 80%, which
are considerably higher than the values obtained for previously studied gray pellets and
black pellets (with similar gasification conditions). The main reason for this could be a
significantly higher hydrocarbon content. Considering the reported efficiency of the biocoal
production process (greater than 90% [33]), the total system efficiency is not considerably
affected compared with that of unpretreated biomass, still giving a high LHV gas.
70
75
80
85
6
6.5
7
7.5
8
0.19 0.2 0.21 0.22 0.23
CG
E (%
)
LHV
(M
J/N
m3 )
ER
LHV Efficiency

46
5.2.4 Syngas purity
At high temperatures, C2H6 decomposes into C2H4 and C2H2. The severity of this C-2
hydrocarbon cracking has been qualitatively correlated with tar thermal cracking [61-63].
Similarly, the syngas purity in this study was analyzed by comparing the C2H6/(C2H4 +
C2H2) ratio using online GC measurements (Figure 5-7).
Figure 5-7. Syngas purity based on severity of hydrocarbon cracking
The C2H6/(C2H4 + C2H2) ratio increased from run 1 to run 3 with decreasing gas phase
temperature, and hence the tar content is expected to increase. Most of the thermal cracking
reactions (hydrocarbons and tar) are expected to occur in the gas phase, and hence a
temperature drop at the top of the reactor significantly affects the tar content of gas. The
measured tar content of case 3 is 6.36 g/Nm3, which is lower than the values obtained for
previously studied gray pellets and black pellets. This could be due to the low volatile (or
hemicellulose) content and high fixed carbon (or lignin) content of biocoal.
However, although experiments were carried out at low ER values, the combustion zone
temperature increased with ER to reach 1400 °C, as observed in Figure 5-4. This high
temperature caused ash slagging, which resulted in discontinuous operation. Controlling
the temperature inside the gasifier to completely avoid ash slagging was difficult due to the
high carbon content in biocoal.
0
150
300
450
600
750
900
0
0.05
0.1
0.15
0.2
1 2 3
Tem
per
atu
re (
0 C)
C2H
6/(
C2H
4+C
2H
2)
Run
C2H6/(C2H4+C2H2) TexitTexitC2H6/(C2H4+C2H2)

47
5.3 Gasification of hydrothermal carbonized biomass with controlling measures for ash slagging
Two methods of biocoal gasification were tested to achieve temperature control, and hence
smooth operation in non-slagging mode.
• Gasification with a lower O2 content in the gasifying agent (use of a
considerable amount of CO2 and/or H2O in the gasifying agent)
• Gasification with a lower preheating temperature of the gasifying agent
To evaluate these methods, gasification was carried out using two types of biocoal pellets
in a fixed bed updraft HTAG system using the experimental conditions shown in Table 5-3.
Table 5-3. Experimental conditions
Run Biomass
type
Control
method for
ash slagging
Preheating
temperature
of the agent
(°C)
O2 content
in the
agent
(%)
H2O
content in
the agent
(%)
CO2
content in
the agent
(%)
ER Steam/
biomass
1 Spent grain
biocoal
Lower O2
content in
the agent
1000 10 10 5 0.28 0.38
2 12 8 4 0.29 0.27
3 1.5
1.5
75 2 0.03 2.2
4 80 1.5 0.04 2.6
5 Horse
manure
biocoal
Lower
preheating
temperature
of the agent
850 21
21
-
-
-
-
-
-
0.29 -
- 6 0.31
7 -
-
100
100
-
-
2.6
82
5.3.1 Temperature distribution
Figure 5-8 depicts the axial temperature distribution along the reactor height for each
gasification case.
2 Due to bed accumulation, the biocoal feed rate had to be reduced in the 8th run, which made the calculation of actual steam/biomass ratio infeasible.

48
Figure 5-8. Axial temperature profiles for (top) gasification of spent grain
biocoal and (bottom) gasification of horse manure biocoal
Similar to the previous experiments, the temperature profiles show a bed zone with a
significant temperature drop and a gas phase with an almost flat temperature profile. The
temperature profiles of horse manure biocoal gasification are relatively low compared with
those of spent grain biocoal gasification, which could be due to the lower preheating
temperature and low carbon content of the fuel. The temperature inside the gasifier was
kept below 1200 °C with both control measures. However, it should be noted that for
gasification of spent grain biocoal with the agent temperature around 1000 °C, an O2
0
200
400
600
800
1000
1200
-0.2 0 0.2 0.4 0.6 0.8 1 1.2 1.4 1.6
Tem
per
atu
re (
0C
)
Distance from the grate along the vertical axis (m)
1
2
3
4
0
200
400
600
800
1000
1200
-0.2 0 0.2 0.4 0.6 0.8 1 1.2 1.4 1.6
Tem
per
atu
re (
0 C)
Distance from the grate along the vertical axis (m)
5
6
7
8

49
content above 10% resulted in operational instability with high temperatures throughout
the reactor.
Increasing the steam content in the gasifying agent resulted in a low gas phase temperature
for spent grain biocoal gasification. In contrast, very similar gas phase temperatures were
seen for each run of horse manure biocoal gasification, irrespective of the steam content.
5.3.2 Syngas composition
Figure 5-9 shows the syngas composition and important gas ratios obtained for gasification
of the two biocoal types.
Figure 5-9. Gas composition and gas ratios of (left) spent grain biocoal and
(right) horse manure biocoal
A comparatively low amount of combustibles was observed in the syngas obtained by spent
grain biocoal gasification due to the high agent flow rate applied. The amounts of all the
0
10
20
30
40
50
1 2 3 4
Syn
gas
com
po
siti
on
(%
)
H2 CO CO2 CH4 CxHyH2 CO2 CH4 CxHy
0
10
20
30
40
50
5 6 7 8
Syn
gas
com
po
siti
on
(%
)
H2 CO CO2 CH4 CxHyH2 CO2 CH4 CxHy
0
1
2
3
4
5
6
1 2 3 4
Ch
arac
teri
stic
rat
io (
mo
l/m
ol)
CO/CO2 H2/CO CH4/H2CO/CO2 H2/CO CH4/H2
0
1
2
3
4
5
6
5 6 7 8
Ch
arac
teri
stic
rat
io (
mo
l/m
ol)
CO/CO2 H2/CO CH4/H2CO/CO2 H2/CO CH4/H2

50
combustibles (H2, CO, and hydrocarbons) were higher with steam gasification of both
biocoal types due to less dilution with N2. The comparatively low amounts of hydrocarbons
obtained for high ER and high steam cases could be due to thermal cracking and steam
reforming reactions, respectively. This explanation is further validated by the CH4/H2
ratios.
The extraordinary performance of the Boudouard reaction (high CO/CO2 ratio) in run 4
and run 6 was due to the high temperature observed in the bed. The increasing H2/CO
ratio with steam gasification of horse manure biocoal was due to the dominance of the
water gas shift reaction. However, the H2/CO ratio did not improve with steam gasification
of spent grain biocoal because, even if the H2 content increased, the CO content was also
high.
5.3.3 LHV, gas yield, and efficiency
Table 5-4 shows the LHV of syngas, the syngas yield, and the CGE of the tested cases.
Table 5-4. LHV of syngas, syngas yield, and CGE
Run Biomass type LHV (MJ/Nm3) Ysyngas (Nm3/kg) CGE (%)
1 Spent grain
biocoal
4.6 5.36 85.5
2 3.8 5.1 67.2
3 10.2 2.37 83.3
4 10.1 2.33 81.7
5 Horse manure
biocoal
7.1 1.1 38
6 8.6 1.4 56
7 11.1 0.65 34
83 10.4
In general, steam gasification gave a high LHV and low gas yield for both biocoal types.
Gasification of spent grain biocoal resulted in a lower LHV and higher syngas yield due to
the high agent flow rate applied. Overall, gasification of spent grain biocoal with a CGE
greater than 80% (with the exception of run 2) seems to be more feasible. The poor fuel
3 Due to bed accumulation, the biocoal feed rate had to be reduced in the 8th run, which made the calculation of syngas yield and CGE infeasible.
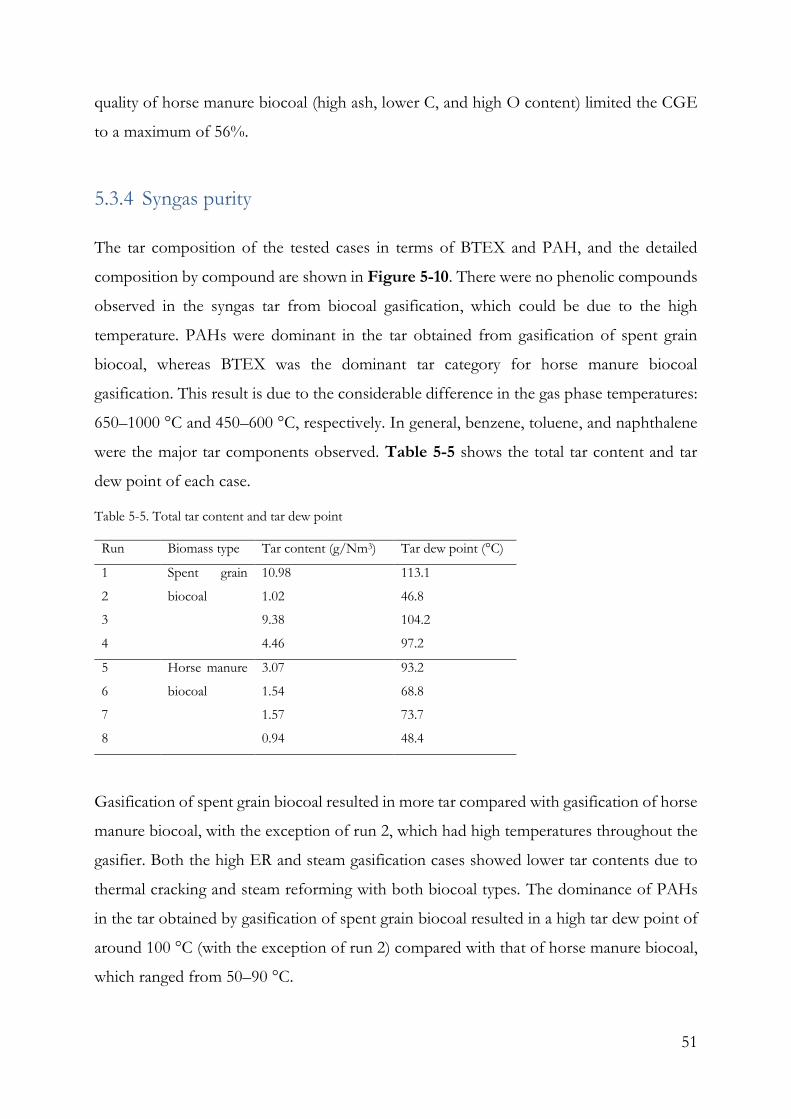
51
quality of horse manure biocoal (high ash, lower C, and high O content) limited the CGE
to a maximum of 56%.
5.3.4 Syngas purity
The tar composition of the tested cases in terms of BTEX and PAH, and the detailed
composition by compound are shown in Figure 5-10. There were no phenolic compounds
observed in the syngas tar from biocoal gasification, which could be due to the high
temperature. PAHs were dominant in the tar obtained from gasification of spent grain
biocoal, whereas BTEX was the dominant tar category for horse manure biocoal
gasification. This result is due to the considerable difference in the gas phase temperatures:
650–1000 °C and 450–600 °C, respectively. In general, benzene, toluene, and naphthalene
were the major tar components observed. Table 5-5 shows the total tar content and tar
dew point of each case.
Table 5-5. Total tar content and tar dew point
Run Biomass type Tar content (g/Nm3) Tar dew point (°C)
1 Spent grain
biocoal
10.98 113.1
2 1.02 46.8
3 9.38 104.2
4 4.46 97.2
5 Horse manure
biocoal
3.07 93.2
6 1.54 68.8
7 1.57 73.7
8 0.94 48.4
Gasification of spent grain biocoal resulted in more tar compared with gasification of horse
manure biocoal, with the exception of run 2, which had high temperatures throughout the
gasifier. Both the high ER and steam gasification cases showed lower tar contents due to
thermal cracking and steam reforming with both biocoal types. The dominance of PAHs
in the tar obtained by gasification of spent grain biocoal resulted in a high tar dew point of
around 100 °C (with the exception of run 2) compared with that of horse manure biocoal,
which ranged from 50–90 °C.

52
Figure 5-10. Tar composition (top) by category and (bottom) by compound
0
4
8
12
1 2 3 4
Tar
con
ten
t (g
/Nm
3)
PAH BTEX
0
4
8
12
5 6 7 8
Tar
con
ten
t (g
/Nm
3)
PAH BTEX
0
1
2
3
4
5
6
Co
mp
osi
tio
n (
g/N
m3)
1
2
3
4
0.0
0.2
0.4
0.6
0.8
1.0
1.2
Co
mp
osi
tio
n (
g/N
m3 )
5
6
7
8

53
Figure 5-11 demonstrates the particle content in the syngas and the particle size distribution
for each case of biocoal gasification.
Figure 5-11. Particle content and size distribution for gasification of (left) spent
grain biocoal and (right) horse manure biocoal
Similar to the tar content, the gasification of spent grain biocoal resulted in more particles
in general compared with the gasification of horse manure biocoal and was dominated by
the fine fraction (<1 µm). It has been reported that nucleation and condensation of tar
components result in the formation of fine particulates [64]. The comparatively high
content of coarse particles (>1 µm) observed with the gasification of horse manure biocoal
could be due to entrainment of ash, the content of which is comparatively high in horse
manure biocoal.
The high temperature of run 2 resulted in a high gas velocity inside the gasifier and,
ultimately, entrainment of ash and unburnt char in the gas stream, leading to the formation
of some coarse particles. Further, steam gasification of both biocoal types resulted in a
comparatively high content of coarse particles, which may also be due to entrainment of
ash and unburnt char.
0
500
1000
1500
2000
2500
1 2 3 4
Par
ticl
e co
nte
nt
(mg/
Nm
3 )
<0.1 0.1-1 1-10 >10Particle size µm
0
500
1000
1500
2000
2500
5 6 7 8
Par
ticl
e co
nte
nt
(mg/
Nm
3 )
<0.1 0.1-1 1-10 >10Particle size µm
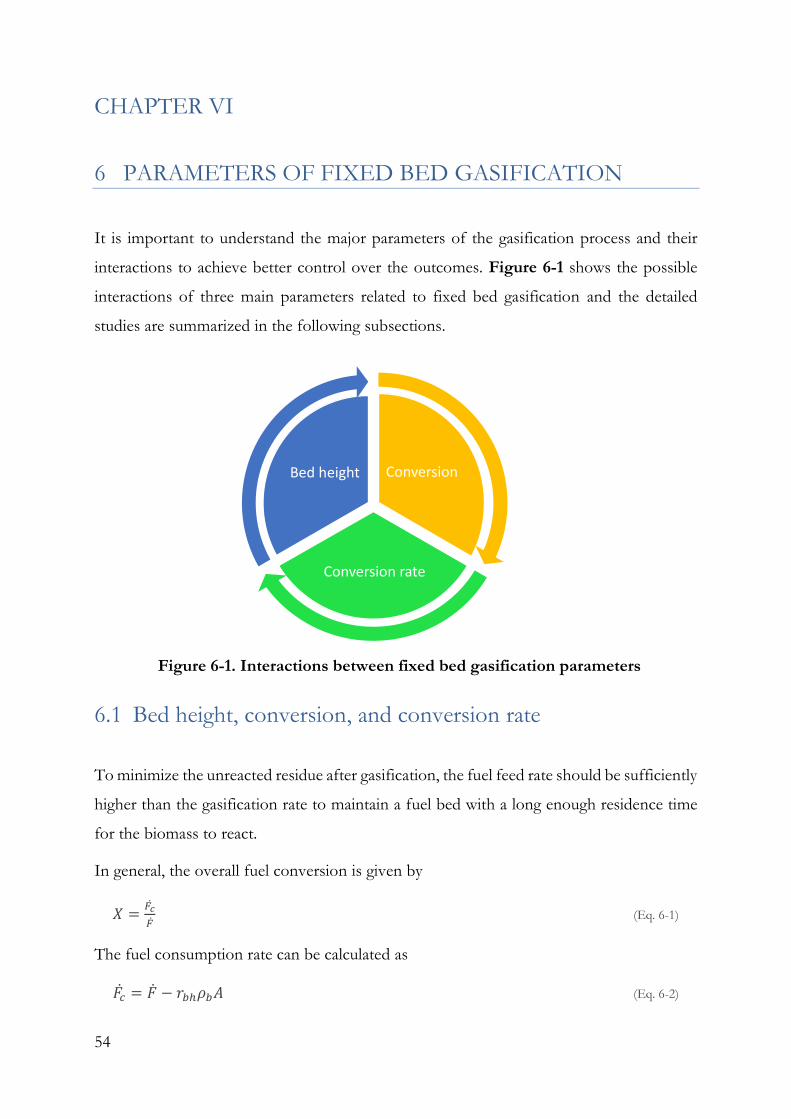
54
CHAPTER VI
6 PARAMETERS OF FIXED BED GASIFICATION
It is important to understand the major parameters of the gasification process and their
interactions to achieve better control over the outcomes. Figure 6-1 shows the possible
interactions of three main parameters related to fixed bed gasification and the detailed
studies are summarized in the following subsections.
Figure 6-1. Interactions between fixed bed gasification parameters
6.1 Bed height, conversion, and conversion rate
To minimize the unreacted residue after gasification, the fuel feed rate should be sufficiently
higher than the gasification rate to maintain a fuel bed with a long enough residence time
for the biomass to react.
In general, the overall fuel conversion is given by
𝑋 =𝐹�̇�
�̇� (Eq. 6-1)
The fuel consumption rate can be calculated as
𝐹�̇� = �̇� − 𝑟𝑏ℎ𝜌𝑏𝐴 (Eq. 6-2)
Conversion
Conversion rate
Bed height

55
Furthermore, the residence time of the fuel in the gasifier bed is given by
𝑡𝑟 =𝐴𝐿
𝐹�̇�/𝜌𝑏 (Eq. 6-3)
The fuel conversion rate can be calculated as
𝑟 =𝑋
𝑡𝑟 (Eq. 6-4)
Figure 6-2 graphically represents the relation between these parameters.
Figure 6-2. Relations between residence time, conversion, and conversion rate
Figure 6-2 (left) shows that the overall fuel conversion is positively correlated with the
residence time of fuel in the bed (bed height), irrespective of the ER (the difference in ER
was too low to have a considerable effect). Fuel conversion of 90–99% was observed with
a residence time varying from 1 to 2 h. A conversion of around 90% has been reported for
biocoal gasification in a lab-scale entrained flow reactor at a temperature of 1000 °C [25].
Figure 6-2 (right) shows that the conversion rate decreases as the conversion progresses.
These behaviors are consistent with the results obtained with TGA.
6.2 Gasifier design parameters: Specific gasification rate and superficial velocity
To normalize the fuel consumption rate over the reactor dimensions, a general parameter
called the specific gasification rate is commonly used. This parameter is defined as a
measure of the fuel consumption rate per unit cross sectional area of the gasifier:
𝑟𝑠𝑔 =60 𝐹�̇�
𝐴 (Eq. 6-5)
0.85
0.9
0.95
1
0 50 100 150
Ove
rall
fue
l co
nve
rsio
n X
Fuel residence time in the bed tr (min)
0
0.004
0.008
0.012
0.016
0.02
0.85 0.9 0.95 1Fue
l co
nve
rsio
n r
ate
r(1
/min
)
Overall fuel conversion X

56
A similar normalized parameter for the gas production rate is the superficial gas velocity,
which is considered to be an important parameter that affects heat transfer, as well as the
char and tar production rates. The superficial gas velocity is defined as the gas generation
rate per unit cross sectional area of the gasifier, resulting in units similar to that of velocity
(m/s).
𝑢 =�̇�
𝐴 (Eq. 6-6)
A more commonly used variation of the superficial gas velocity is the hearth load, which is
defined using the practical units of the cross sectional area (cm2) and gas flow (m3/h). The
unit conversion shows the relationship between these two parameters:
𝐿𝐻 = 0.36 𝑢 (Eq. 6-7)
Table 6-1 shows these three design parameters for each run, along with the fuel conversion
rate.
Table 6-1. Design parameters
Run 𝑟
(min-1)
𝑟𝑠𝑔
(kg/m2 h)
𝑢
(m/s)
𝐿𝐻
(m3/cm2 h)
1 0.015 275.5 0.23 0.08
2 0.017 319.8 0.3 0.11
3 0.009 259.4 0.22 0.08
The specific gasification rate follows the trend of the conversion rate, which is inversely
related to the conversion and hence the residence time (or bed height). Further, the specific
gasification rate is positively correlated with the superficial gas velocity or hearth load.
Wood gasification in an updraft gasifier has been reported to have a specific gasification
rate and superficial velocity in the range of 170–190 kg/m2 h and 0.16–0.2 m/s, respectively
[65]. The observation of higher values in the present study could be due to two reasons:
the high-temperature operation and specific fuel type used. High-temperature operation
results in more gas with enhanced tar cracking. Furthermore, the high bulk density of
biocoal (around 800 kg/m3) accommodates a high fuel load. Combined with the high
energy value of biocoal, a considerable power output is expected, even in a compact reactor.
This means that coupling biomass pretreatment with HTAG can extend the capacity range
of fixed bed gasifiers, which is otherwise a limitation of this technology.

57
6.3 Bed pressure drop
Considering the effect of bed height on the performance of the gasification process, an
attempt was made to predict the bed pressure drop accurately. The total pressure drop
through a gasifier bed is the sum of the pressure drops through the particle bed and the
grate. Considering the high grate opening area of around 40% and low grate thickness of
around 6 mm, the grate resistance was found to be negligible in the present study.
A correlation has been proposed for pressure drop prediction for a bed with cylindrical
particles in turbulent flow conditions based on the equivalent tortuous passage method
[66].
∆𝑃 = 𝐿𝐾𝑡𝜌𝑢2 (1−𝜀)5
4⁄
𝜀3 (1
2𝑐+
1
𝑑)
54⁄
(𝜇
𝜌𝑢)
14⁄
(Eq. 6-8)
where
𝐾𝑡 = 112𝜀3.2 (Eq. 6-9)
The correlation can be extended to laminar and transitional flow conditions by
incorporating a viscous term.
The Hagen-Poiseuille equation for pressure drop in a laminar flow is
∆𝑃 =32𝜇𝑣𝑙
𝐷𝑒2 (Eq. 6-10)
Assuming an equivalent inclined passage with an angle to the direction of the mean flow,
the Hagen-Poiseuille equation can be rearranged as
∆𝑃 = 32𝜇𝑢𝐿(1−𝜀)2
𝜀3 (1
2𝑐+
1
𝑑)
2
(Eq. 6-11)
Combining and rearranging these equations gives the modified correlation as
(∆𝑃
𝐿) (
1
𝜌𝑢2) =
𝐾1
𝑅𝑒𝑝1/4 +
𝐾2
𝑅𝑒𝑝 (Eq. 6-12)
where 𝑅𝑒𝑝 =(
𝜌𝑢
𝜇)
𝐾3 (Eq. 6-13)
𝐾1 = 112 𝜀0.2(1 − 𝜀) (1
2𝑐+
1
𝑑) (Eq. 6-14)
𝐾2 = 32(1−𝜀)
𝜀3 (1
2𝑐+
1
𝑑) (Eq. 6-15)
𝐾3 = (1 − 𝜀) (1
2𝑐+
1
𝑑) (Eq. 6-16)

58
The porosity of a cylindrical particle bed is given by [67]
𝑙𝑛 𝜀 = 𝛷5.58 𝑒𝑥𝑝[5.89(1 − 𝛷)] 𝑙𝑛0.4 (Eq. 6-17)
where the sphericity is defined as
𝛷 =(36𝜋𝑉𝑝
2)1/3
𝑆𝑝= [
2.25×(𝑐
𝑑)
2
0.5+(𝑐
𝑑)3
]
1/3
(Eq. 6-18)
The particle size changes along the bed due to the reaction occurring in the gasifier.
Neglecting the wall effect and the thickness effects on porosity variation due to the scale
of the reactor, the particle size of the reacting bed can be calculated by applying mass
balance for one particle.
𝑚𝑐ℎ𝑎𝑟 = (1 − 𝑋)𝑚𝑏𝑖𝑜𝑚𝑎𝑠𝑠 (Eq. 6-19)
Neglecting fragmentation due to the high density of pellets and taking the surface
conversion into account by assuming the density of biomass particle is constant throughout
the conversion period, the volume of a char particle is given by
𝑐𝑑2 = (1 − 𝑋)𝑐0𝑑02 (Eq. 6-20)
Further, assuming all the dimensions of the particle are reduced by a uniform thickness h
for a certain time period [68], the new dimensions are given by
𝑐 = 𝑐0 − 2ℎ (Eq. 6-21)
𝑑 = 𝑑0 − 2ℎ (Eq. 6-22)
Resulting in
𝑐 − 𝑑 = 𝑐0 − 𝑑0 (Eq. 6-23)
By knowing the initial particle size distribution and the expected conversion, it is possible
to calculate the size distribution of the converted particles, which is then used to calculate
the distribution of the sphericity, and ultimately the bed porosity. These values, along with
the flow properties such as velocity, density, and viscosity, can be used in in the developed
correlation to calculate the pressure drop along the gasifier bed. The calculation procedure
is discussed in detail in supplement IV.
For cylindrical particles, some researchers [69] have obtained a relationship with the
sphericity and Ergun constants as given below.

59
∆𝑃 = 𝐿 [𝐴′(1−𝜀)2𝜇
𝜀3𝛷2𝑑𝑝2 𝑢 + 𝐵′
(1−𝜀)𝜌
𝜀3𝛷𝑑𝑝𝑢2] (Eq. 6-24)
where
𝐴′ = 150
𝛷3/2 (Eq. 6-25)
𝐵′ = 1.75
𝛷4/3 (Eq. 6-26)
By incorporating the shrinking effect, as discussed above, this equation can be improved
for a reacting bed by using modified Ergun constants.
The pressure drop results calculated with the developed correlation and the above empirical
correlation were compared with experimental data, as shown in Figure 6-3.
Figure 6-3. Comparison of pressure drop results
The method formulated in the present study gives a better approximation, with a maximum
error of only 7% with respect to the two performed runs. The available empirical equation
was able to predict the pressure drop within a 20% interval after the shrinking effect was
taken into account. Graphical representations of the correlation constants of the modified
equation for typical biomass pellet sizes are available in supplement IV.
0
300
600
900
1200
1500
Run 1 Run 2
Bed
pre
ssu
re d
rop
(P
a)
Experimental
Modified equation
Empirical correlation
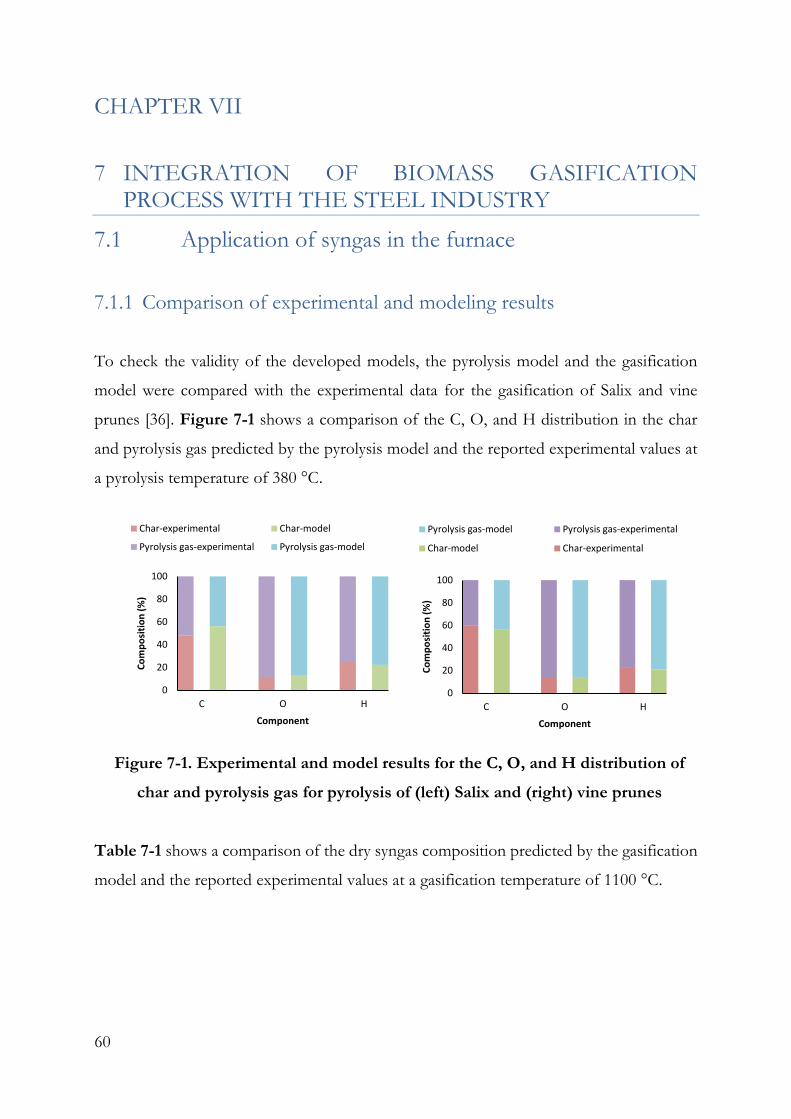
60
CHAPTER VII
7 INTEGRATION OF BIOMASS GASIFICATION PROCESS WITH THE STEEL INDUSTRY
7.1 Application of syngas in the furnace
7.1.1 Comparison of experimental and modeling results
To check the validity of the developed models, the pyrolysis model and the gasification
model were compared with the experimental data for the gasification of Salix and vine
prunes [36]. Figure 7-1 shows a comparison of the C, O, and H distribution in the char
and pyrolysis gas predicted by the pyrolysis model and the reported experimental values at
a pyrolysis temperature of 380 °C.
Figure 7-1. Experimental and model results for the C, O, and H distribution of
char and pyrolysis gas for pyrolysis of (left) Salix and (right) vine prunes
Table 7-1 shows a comparison of the dry syngas composition predicted by the gasification
model and the reported experimental values at a gasification temperature of 1100 °C.
0
20
40
60
80
100
C O H
Co
mp
osi
tio
n (
%)
Component
Char-experimental Char-model
Pyrolysis gas-experimental Pyrolysis gas-model
0
20
40
60
80
100
C O H
Co
mp
osi
tio
n (
%)
Component
Pyrolysis gas-model Pyrolysis gas-experimental
Char-model Char-experimental

61
Table 7-1. Experimental and modeling results of dry syngas composition
Component Biomass type: Salix
S/C molar ratio: 1.35
Biomass type: Vine prunes
S/C molar ratio: 1.5
Experimental Model Experimental Model
CO (%) 30 30.3 27.6 27.9
CO2 (%) 11.4 11.9 12.4 13.3
H2 (%) 56.3 55.4 57 57
CH4 (%) 2.3 2.4 3 1.8
As shown in Figure 7-1 and Table 7-1, the model predicts the composition of the pyrolysis
products and dry syngas fairly well. Therefore, the model is considered suitable for
evaluating the integration cases.
7.1.2 Gasifier system performance
Table 7-2 summarizes the pyrolysis temperatures required for sustaining the process in
each integration case.
Table 7-2. Pretreatment condition for each case
Case
number
Integration option Pyrolysis
temperature
(°C)
1 Integration with no heat recovery 375
2 Integration with low-temperature heat recovery for steam superheating
up to 400 °C
370
3 Integration with low-temperature heat recovery for biomass predrying 360
4 Integration with low-temperature heat recovery for steam superheating
up to 400 °C and biomass predrying
355
5 Integration with high-temperature heat recovery for steam superheating
up to 700 °C and biomass drying
345
According to the results summarized in Table 7-2, any form of flue gas heat recovery (high
temperature or low temperature) reduces the required pyrolysis temperature. By

62
incorporating high-temperature heat recovery (for steam superheating and biomass drying),
a 30 °C reduction of the pyrolysis temperature was achieved. The reduced pyrolysis
temperature resulted in a maximum 20% higher char yield and syngas yield. Due to the
narrow range of pyrolysis temperatures applied and the fixed S/C molar ratio used in the
gasification process, the changes of the syngas compositions were not that significant.
Approximately 55% H2, 31% CO, 11% CO2, and 3% CH4 is observed, which accounts for
almost 90% combustibles, giving an LHV of 10.8 MJ/Nm3. The specific biomass input
requirement was reduced by 16% at maximum heat recovery. Figure 7-2 shows the
efficiency and heat demand of the gasifier system.
Figure 7-2. (left) Gasifier system efficiency and (right) heat demand of gasifier
system
The gasifier system efficiency increased with the flue gas heat recovery. Low-temperature
flue gas heat recovery for biomass predrying is more feasible than steam superheating due
to high efficiency. Simultaneous low-temperature heat recovery for predrying and steam
superheating gives higher efficiency. However, high-temperature heat recovery, which is
13% more efficient than the case with no heat recovery, is the most energy efficient option.
The gasifier system energy requirement is reduced by 5% from case 1 to case 5 due to the
lower pyrolysis temperature. The endothermic steam gasification process consumes
approximately 50% of the total heat. Further, the gasifier heat demand is balanced by the
69.9 71.7 75.978.2
83.3
0
20
40
60
80
100
1 2 3 4 5
Gas
ifie
r sy
ste
m e
ffic
ien
cy (
%)
Case number
174 171 161 157 148
57 54 47 44 37
385 365 386 366 338
133 156 132 155 185
0
100
200
300
400
500
600
700
800
1 2 3 4 5He
at d
em
and
pe
r u
nit
th
erm
al e
ne
rgy
ou
tpu
t (k
J/M
J)
Case number
Predrying and drying Pyrolysis
Gasification Steam generation

63
degree of steam superheating applied. The predrying, drying, and pyrolysis heat demands
follow the trend of the specific biomass feed requirement.
7.1.3 Heat integration performance
To determine how well the proposed heat integration options fit with the theoretically
achievable limit, a pinch analysis was performed, which is exemplified by the GCCs for
cases 1 and 5 (per MJ output) in Figure 7-3.
Figure 7-3. GCCs for cases 1 and 5
The pinch analysis showed few features. No external heat requirements for either case,
whereas case 1 possessed a considerable amount of waste heat (cooling load of 292 kJ/MJ),
and two thirds of the waste heat was already recovered in case 5, accounting for the lower
amount of waste heat (cooling load of 95 kJ/MJ). Theoretically, the system is capable of
handling biomass with a higher moisture content.
The critical moisture content of biomass for the two extreme pyrolysis conditions
considered in this study is plotted in Figure 7-4 at a range of flue gas temperatures.
0
400
800
1200
1600
2000
0 1 0 0 2 0 0 3 0 0 4 0 0 5 0 0 6 0 0 7 0 0
Shif
ted
tem
per
atu
re (
oC
)
Net heat flow (kJ/MJ)
Case 1 Case 5

64
Figure 7-4. Critical moisture content
The system can handle biomass with up to 55% moisture content if the pyrolysis
temperature is low (around 345 °C). For fairly dry biomass (e.g., wood pellets), low-
temperature heat recovery is adequate under this pyrolysis condition. The critical moisture
content can be increased to 65% if the pyrolysis temperature is increased to 375 °C. Under
this condition, low-temperature flue gas heat recovery is sufficient for processing typical
woody biomass.
7.1.4 Furnace performance
The adiabatic temperature is a critical parameter that can affect the steel quality. Because
the adiabatic temperature of syngas combustion (~2035 °C) is higher than that of NG
combustion (1914 °C), a small portion of the flue gas was recycled back to the furnace to
maintain a similar adiabatic flame temperature. Further, the heat input to the furnace was
fixed, so that the flue gas temperature was similar to that of the NG firing case.
Because the syngas compositions do not differ significantly, cases 1–5 were considered as
one case for evaluating the furnace performance.
5
15
25
35
45
55
65
75
200 250 300 350 400 450 500 550 600 650 700 750
Cri
tica
l mo
istu
re c
on
ten
t (%
)
Flue gas temperature (oC)
Pyrolysis at 345°C Pyrolysis at 375°C

65
Figure 7-5. (left) Input flow rates to the furnace and (right) energy distribution
of the furnace
Figure 7-5 (left) shows the fuel, air, and recycle stream flow rates for the furnace. The low
energy density of the syngas results in more than three times the gas flow rate compared
with the NG case. However, the air flow rate is reduced by more than 20% as a result of
the stoichiometric difference in the combustion of the two fuels. The increase of the total
input flow rate to the furnace is only 9%. However, the higher composition of H2 in the
syngas may affect the burning velocity, which would ultimately require a dedicated burner
design.
Figure 7-5 (right) shows the energy distribution of the furnace. It should be noted that the
example furnace is fairly old, and the design is not optimized for energy efficiency, resulting
in high furnace heat losses. Irrespective of the similar flue gas temperature, the flue gas loss
for syngas firing is decreased by 10% compared with that for NG firing due to the low flue
gas flow rate, as shown in Table 7-3. As a result, the furnace efficiency can be improved
from 37.3% to 38.7% by the fuel switch. The flue gas compositions are shown in Table
7-3.
33116
379294
0 38
0
100
200
300
400
500
Natural gas SyngasFue
l, ai
r, a
nd
re
cycl
e f
lue
gas
fl
ow
rat
e(N
m3 /
ton
of
ste
el)
Furnace fuel
Fuel flow Air flow Recycle flow
485.1 485.1
354.9 354.9
461.4 414.1
0
300
600
900
1200
1500
Natural gas Syngas
Ene
rgy
dis
trib
uti
on
of
furn
ace
(M
J/to
n o
f st
ee
l)
Furnace fuel
Flue gas losses Furnace losses Sensible heat to iron powder

66
Table 7-3. Flue gas composition and flow rate
Component NG case Syngas case
H2O (%) 16.9 19.4
CO2 (%) 9.1 14.6
O2 (%) 1.7 1.6
N2 (%) 72.3 64.4
Total flow
(Nm3/ton of steel)
415 398
Syngas firing gives more CO2 and H2O (and less O2 and N2) in the flue gas compared with
NG firing. This is due to the principal compositional difference and the combustion
stoichiometry of the two fuels. The total flue gas flow rate is also reduced by 4%, and hence
the fuel switch will not affect the size of the flue gas handling system. Higher CO2 and H2O
contents in the flue gas may be advantageous in heat transfer due to increased radiation
effects with high flame emissivity, which may lead to increased capacity of the furnace after
fuel switching. Considering biomass as CO2 neutral, the on-site CO2 emission reduction by
avoiding the burning of fossil fuel NG is 74 kg/ton of steel produced.

67
Fig
ure
7-6
. E
nerg
y b
ala
nce p
er
ton
of
steel
pro
cess
ed
(case
5)
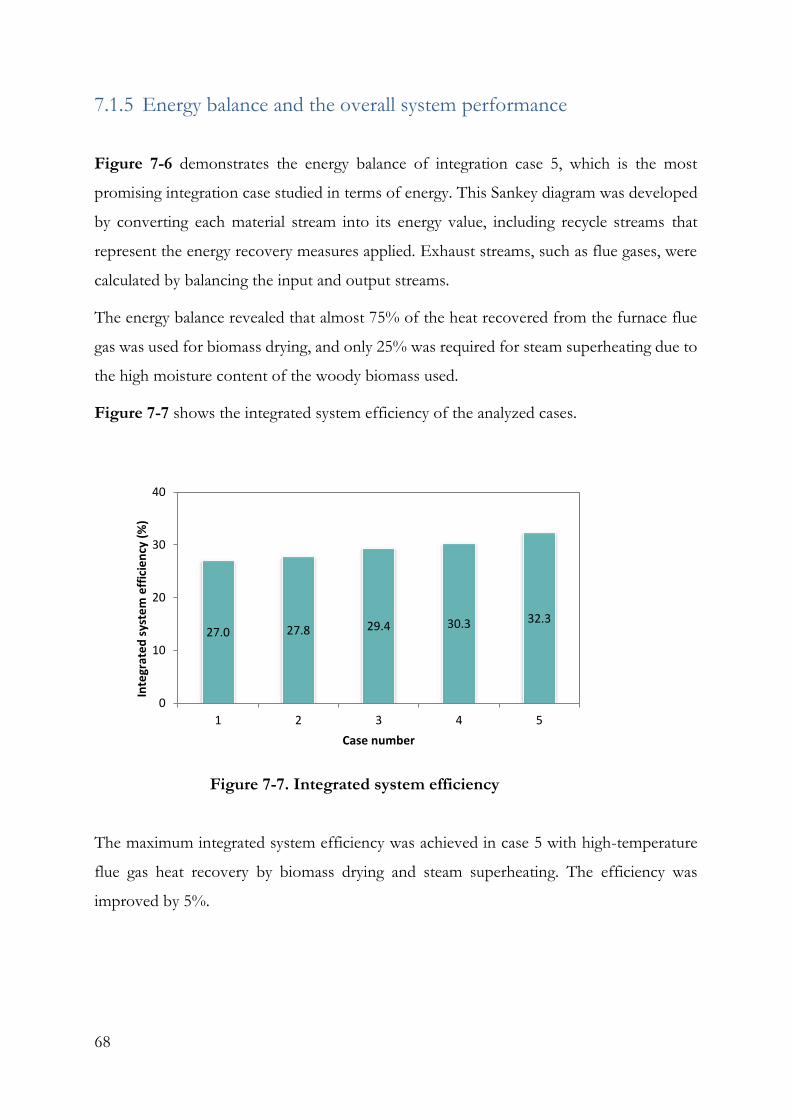
68
7.1.5 Energy balance and the overall system performance
Figure 7-6 demonstrates the energy balance of integration case 5, which is the most
promising integration case studied in terms of energy. This Sankey diagram was developed
by converting each material stream into its energy value, including recycle streams that
represent the energy recovery measures applied. Exhaust streams, such as flue gases, were
calculated by balancing the input and output streams.
The energy balance revealed that almost 75% of the heat recovered from the furnace flue
gas was used for biomass drying, and only 25% was required for steam superheating due to
the high moisture content of the woody biomass used.
Figure 7-7 shows the integrated system efficiency of the analyzed cases.
Figure 7-7. Integrated system efficiency
The maximum integrated system efficiency was achieved in case 5 with high-temperature
flue gas heat recovery by biomass drying and steam superheating. The efficiency was
improved by 5%.
27.0 27.8 29.4 30.3 32.3
0
10
20
30
40
1 2 3 4 5
Inte
grat
ed
sys
tem
eff
icie
ncy
(%
)
Case number

69
7.2 Co-production of bio-coke and bio-H2
Figure 7-8 shows the integrated system efficiency of the analyzed production scenarios.
Figure 7-8. Efficiency comparison for various scenarios
The maximum integrated system efficiency was achieved in scenario 4, which considered
full integration, including coke and H2 production. The efficiency was improved by 10%.
A considerable efficiency improvement was also achieved if only coke or H2 was produced
along with syngas (scenarios 2 and 3, respectively). H2 production, which is a physical
separation process, was more efficient than coke making, which had some losses due to
burning of the produced coke gas. If the coke gas were instead used in the H2 separation
process, an even higher efficiency could be expected.
3238 40 42
0
10
20
30
40
50
1 2 3 4
Inte
grat
ed
sys
tem
eff
icie
ncy
(%
)
Scenario number
70
CHAPTER VIII
8 CONCLUSIONS
In this thesis, advanced gasification of biomass and waste for substitution of fossil fuels in
steel industry heat treatment furnaces was performed. The conclusions from the
experimental investigation of advanced biomass gasification and the assessment of the
integration of the advanced gasification system with steel heat treatment furnaces are
summarized here.
Conclusions from experimental investigation of advanced biomass gasification
TGA of pretreated biomass:
The decomposition characteristics of unpretreated biomass (gray pellets), steam-exploded
biomass (black pellets), and hydrothermal carbonized biomass (biocoal) were analyzed with
TGA at a constant heating rate in a N2 atmosphere, followed by a constant temperature in
a N2/CO2 atmosphere. The TGA experiments provided a necessary preliminary
understanding for real thermal applications.
Both types of pretreated biomass feature early thermal decomposition of
hemicellulose due to depolymerization during pretreatment.
Steam explosion pretreatment results in a lower thermal stability of the cellulose
fraction, possibly due to early decomposition of the hemicellulose fraction and
depolymerization of the cellulose fraction during pretreatment. The opposite trend
was observed for biocoal.
The shoulder attached to the cellulose peak was attributed to the decomposition of
lignin globules redeposited on the surface after hydrothermal pretreatment. This
overlapping and high intensity lignin decomposition can affect the cellulose
decomposition adversely.
Steam-exploded biomass showed a comparatively high char gasification rate,
whereas hydrothermal carbonized biomass showed a low rate.

71
Gasification of pretreated biomass:
Gasification experiments of typical unpretreated biomass pellets (gray pellets), steam-
exploded biomass pellets (black pellets), and hydrothermal carbonized biomass pellets
(biocoal) were performed with air and steam in an updraft HTAG unit.
Gasification of pretreated biomass resulted in a more divergent temperature profile
in the gasifier due to the high fixed carbon and lower volatile content.
An effective Boudouard reaction and suppressed water-gas shift reaction,
hydrocarbon reforming, and cracking reactions are features of the gasification of
black pellets, which results in more CO and hydrocarbons, but less H2 in the syngas.
Steam gasification of black pellets is more feasible if a syngas with a high energy
value is desired, whereas if a higher H2 yield is preferred, gasification of gray pellets
is more attractive.
As the carbon content of biocoal is too high (e.g., 66% in spent grain biocoal), air
gasification (even with a low ER of around 0.2) resulted in a too high temperature,
which created ash slagging problems (coupled with the high ash content of biocoal)
and hence operational instability. Dilution of the gasifying agent (with CO2 and/or
H2O) or reducing the agent temperature showed better stability at a high ER.
However, dilution of the gasifying agent resulted in a low LHV of the syngas and a
high gas yield.
Overall, air gasification of pretreated biomass produced syngas with an LHV of
around 7–9 MJ/Nm3 (with the exception of the diluted cases, which gave an LHV
of around 4–5 MJ/Nm3), whereas steam gasification of pretreated biomass
produced better syngas with an LHV of around 10–11 MJ/Nm3. Spent grain biocoal
gasification was the most efficient (CGE of 80–85%), whereas horse manure biocoal
gasification was the least efficient.
Depending on the temperature, the tar composition of the syngas obtained with
gasification of steam-exploded biomass and horse manure biocoal was dominated
by BTEX compounds, whereas that obtained from spent grain biocoal was
dominated by PAHs (similar to unpretreated biomass). Phenols were less abundant
in the tar obtained from HTAG, which was readily converted to benzene and
naphthalene. A low tar dew point of around 100 °C was observed in all cases, except

72
for the gasification of horse manure biocoal, which showed an even lower tar dew
point of around 50–90 °C.
The syngas obtained by gasifying horse manure biocoal resulted in significant
amounts of coarse particles, whereas that for spent grain biocoal predominately
contained fine particles.
Important parameters for fixed bed gasification and prediction of bed pressure
drop:
The interaction between bed height, conversion, conversion rate/specific gasification rate
and superficial velocity was identified. A correlation for pressure drop prediction in a
gasifier bed with cylindrical particles was proposed and verified with experimental data.
Graphical representations for commonly available pellet sizes were developed based on the
correlation to simplify the calculations.
The fuel conversion is positively correlated with the fuel residence time in the bed
and hence with the bed height. The conversion rate (and specific gasification rate)
drops as the conversion progresses. The superficial velocity (or hearth load) is
positively correlated with the specific gasification rate.
The superficial velocity (or hearth load) and specific gasification rate of biocoal
gasification are higher than the reported values of updraft gasifiers due to the high-
temperature operation and high bulk density of biocoal. Coupled with the high
energy value of biocoal, it should be possible to extend the capacity range of fixed
bed gasifiers.
The developed correlation predicts the bed pressure drop fairly well. The
correlation/plots can be used as an initial guide for selecting a suitable pellet size
and designing a grate.
Conclusions from integration of gasification with the steel industry
An integrated system based on a multi-stage gasification process and a steel heat treatment
furnace was proposed, and a model for the proposed integrated system was developed using
Aspen Plus and validated with experimental data. Five heat recovery cases were evaluated

73
in terms of energy efficiency, and a pinch analysis was used to evaluate the heat integration
performance. The operational limits of the system were identified in terms of the critical
moisture content of the feedstock. A preliminary study on the co-production of bio-coke
and bio-H2 was also performed.
The process conditions of the furnace can be achieved with syngas firing without
any major changes to the furnace, combustion technology, or flue gas handling
system. The high H2 content of the syngas may require revamping of the burner
system. Further, a flue gas heat recovery network for predrying and/or steam
superheating should be introduced.
Both the furnace and gasifier system efficiencies were increased by integration, with
a maximum 13% increase of the gasifier system energy efficiency and 10% decrease
of flue gas loss from the furnace. Moreover, the flue gas possessed more radiative
gases.
The most energy-efficient integrated system gave an overall efficiency of
approximately 32%, and 74 kg CO2/ton of steel could be eliminated by the fuel
switch.
Although the studied biomass feedstock had around 40% moisture, the system can
sustain up to 65% feedstock moisture content.
Co-production of bio-coke and bio-H2 increase the overall efficiency significantly.

74
CHAPTER IX
9 FUTURE WORK
This study revealed some important information about biomass pretreatment, gasification,
and industrial applications. However, future work is encouraged regarding the following
aspects.
An ash melting problem was observed with air gasification of high-carbon biocoal.
Although dilution of the gasifying agent and lowering the agent temperature are
possible solutions for this problem, the application of a leaching method coupled
with HTC pretreatment would lower the ash content of the produced biocoal and
may facilitate air gasification.
Syngas combustion is expected to be significantly different from NG combustion
due to the high content of H2 in the syngas, high content of radiative gases in the
flue gas, etc. Further analysis of the effects on burning velocity, flame emissivity,
etc. are required to design a suitable burner and understand the heat transfer
properties. The emissions from syngas combustion, particularly NOx emissions,
also need to be studied. Further, experimental trials are required to evaluate any
effects on the quality of the produced iron.
Preliminary studies on coke making and H2 separation revealed that the overall
efficiency of the system could be significantly improved with these value-added
products. A detailed study of these processes is required, including experimental
trials to determine the suitability of the produced coke for metallurgical purposes.
A detailed environmental and economic analysis is necessary before potential
industrial application of this system.

75
BIBLIOGRAPHY
10 REFERENCES
[1] "ulcos," [Online]. Available: http://www.ulcos.org/en/index.php. [Accessed 25 April
2016].
[2] C. Wang, . P. Mellin, . J. Lövgren, L. Nilsson, W. Yang, H. Salman, A. Hultgren and .
M. Larsson, "Biomass as blast furnace injectant – Considering availability,
pretreatment and deployment in the Swedish steel industry," Energy Conversion and
Management, vol. 102, pp. 217-226, 2015.
[3] H. Suopajärvi, E. Pongrácz and T. Fabritius, "Bioreducer use in Finnish blast furnace
ironmaking – Analysis of CO2 emission reduction potential and mitigation cost,"
Applied Energy, vol. 124, pp. 82-93, 2014.
[4] S. E. P. Agency, "National Inventory Report Sweden 2014," Naturvårdsverket,
Stockholm, 2014.
[5] "Jernkontoret: The Swedish Steel Producers' Association," [Online]. Available:
http://www.jernkontoret.se/en/the-steel-industry/industry-facts-and-
statistics/energy-use/. [Accessed 05 May 2016].
[6] H. Suopajärvi, E. Pongrácz and T. Fabritius, "The potential of using biomass-based
reducing agents in the blast furnace: A review of thermochemical conversion
technologies and assessments related to sustainability," Renewable and Sustainable Energy
Reviews, vol. 25, pp. 511-528, 2013.
[7] A. Babich, D. Senk and M. Fernandez, "Charcoal Behaviour by Its Injection into the
Modern Blast Furnace," ISIJ International, vol. 50, no. 1, pp. 81-88, 2010.
[8] K. Ng, J. MacPhee, L. Giroux and T. Todoschuk, "Reactivity of bio-coke with CO2,"
Fuel Processing Technology, vol. 92, pp. 801-804, 2011.

76
[9] D. Guo, L. Zhu, S. Guo, B. Cui, S. Luo, M. Laghari, Z. Chen, C. Ma, Y. Zhou, J.
Chen, B. Xiao, M. Hu and S. Luo, "Direct reduction of oxidized iron ore pellets using
biomass syngas as," Fuel Processing Technology, vol. 148, p. 276–281, 2016.
[10] T. Buergler and A. D. Donato, "Biomass gasification for DRI production," in
Proceedings of the 4th Ulcos seminar, 2008.
[11] M. Johansson and M. Söderström , "Bio-syngas as fuel in the steel industry’s heating
furnaces – a case study on feasibility and CO2 mitigation effects," in Proceedings of the
International Conference on Efficiency, Cost, Optimization, Simulation and Environmental Impact
of Energy System (ECOS), Novi Sad, 2011.
[12] M. T. Johansson, "Bio-synthetic natural gas as fuel in steel industry reheating furnaces
– A case study of economic performance and effects on global CO2 emissions,"
Energy, vol. 57, pp. 699-708, 2013.
[13] M. M. Carvalho, M. Cardoso and E. K. Vakkilainen, "Biomass gasification for natural
gas substitution in iron ore pelletizing plants," Renewable Energy, vol. 81, pp. 566-577,
2015.
[14] R. Singh, B. B. Krishna, J. Kumar and T. Bhaskar, "Opportunities for utilization of
non-conventional energy sources for biomass pretreatment," Bioresource Technology, vol.
199, pp. 398-407, 2016.
[15] N. Mosier, C. Wyman, . B. Dale, R. Elander, . Y. Lee, M. Holtzapple and . M. Ladisch,
"Features of promising technologies for pretreatment of lignocellulosic biomass,"
Bioresource Technology, vol. 96, no. 6, pp. 673-686, 2005.
[16] P. Zhao, S. Ge and K. Yoshikawa, "An orthogonal experimental study on solid fuel
production from sewage sludge by employing steam explosion," Applied Energy, vol.
112, pp. 1213-1221, 2013.
[17] P. S. Lam, "Steam explosion of biomass to produce durable wood pellets. PhD
Thesis," The University of British Columbia, Voncouver, 2011.

77
[18] T. Kan, V. Strezov and T. J. Evans, "Lignocellulosic biomass pyrolysis: A review of
product properties and effects of pyrolysis parameters," Renewable and Sustainable
Energy Reviews, vol. 57, pp. 1126-1140, 2016.
[19] P. Bergman, A. R. Boersma , R. Zwart and J. Kiel, "Torrefaction for biomass co-firing
in existing coal-fired power stations," ECN, Utrecht, 2005.
[20] L. R. Clausen, "Integrated torrefaction vs. external torrefaction e A thermodynamic
analysis for the case of a thermochemical biorefinery," Energy, vol. 77, pp. 597-607,
2014.
[21] C. Lucas, D. Szewczyk, W. Blasiak and S. Mochida, "High-temperature air and steam
gasification of densified biofuels," Biomass and Bioenergy, vol. 27, p. 563–575, 2004.
[22] S. Heidenreich and P. U. Foscolo, "New concepts in biomass gasification," Progress in
Energy and Combustion Science, vol. 46, pp. 72-95, 2015.
[23] "CORTUS ENERGY," [Online]. Available: http://www.cortus.se/about.html.
[Accessed 11 May 2016].
[24] B. Erlach, B. Harder and G. Tsatsaronis, "Combined hydrothermal carbonization and
gasification of biomass with carbon capture," Energy, vol. 45, pp. 329-338, 2012.
[25] A. Tremel, J. Stemann, M. Herrmann, B. Erlach and H. Spliethoff, "Entrained flow
gasification of biocoal from hydrothermal carbonization," Fuel, vol. 102, pp. 396-403,
2012.
[26] E. Steurer and G. Ardissone, "Hydrothermal Carbonization and Gasification
Technology for Electricity Production using Biomass," in 2015 International Conference
on Alternative Energy in Developing Countries and Emerging Economies, Bangkok, 2015.
[27] C. Couhert, S. Salvador and J.-M. Commandré, "Impact of torrefaction on syngas
production from wood," Fuel, vol. 88, p. 2286–2290, 2009.
[28] M. Sarkar, A. Kumar, J. S. Tumuluru, K. N. Patil and D. D. Bellmer, "Gasification
performance of switchgrass pretreated with torrefaction and densification," Applied
Energy, vol. 127, pp. 194-201, 2014.

78
[29] M. Dudyński, J. C. van Dyk, . K. Kwiatkowski and M. Sosnowska, "Biomass
gasification: Influence of torrefaction on syngas production and tar formation," Fuel
Processing Technology, vol. 131, pp. 203-212, 2015.
[30] N. Padban, "First experiences from large scale co- gasification tests with refined
biomass fuels," in Presentation at Central European Biomass Conference International workshop:
Torrefaction of biomass, Austria, 2014.
[31] "Boson Energy," [Online]. Available: http://www.bosonenergy.com/. [Accessed 12
April 2016].
[32] "Zilkha Biomass Energy," [Online]. Available: http://zilkha.com/. [Accessed 12 April
2016].
[33] "AVA-CO2," [Online]. Available: http://www.ava-
co2.com/web/pages/de/home.php. [Accessed 12 April 2016].
[34] L. P. L. M. Rabou, R. W. R. Zwart, B. J. Vreugdenhil and L. Bos, "Tar in Biomass
Producer Gas, the Energy research Centre of The Netherlands (ECN) Experience:
An Enduring Challenge," Energy Fuels, vol. 23, no. 12, p. 6189–6198, 2009.
[35] "Thersites: website for tar dew point calculations," Energy research Centre of the
Netherlands (ECN) , [Online]. Available:
http://www.thersites.nl/completemodel.aspx. [Accessed 05 May 2016].
[36] M. Amovic, P. Donaj, B. Moner, R. Alzuheri and R. Ljunggren, "Fuel testing
procedure for pyrolysis and gasification of biomass using TGA and WoodRoll test
plant," SGC, Malmö, 2014.
[37] Höganäs, Material and powder properties: Höganäs handbook for sintered
components, Höganäs AB, 2013.
[38] B. Kilkovsky, P. Stehlik, Z. Jegla, L. L. Tovazhnyansky, O. Arsenyeva and P. O.
Kapustenko, "Heat exchangers for energy recovery in waste and biomass to energy
technologies – I. Energy recovery from flue gas," Applied Thermal Engineering, vol. 64,
no. 1-2, p. 213–223, 2014.

79
[39] "Aspen Plus. Getting Started Modeling Processes with Solids," Aspen Tech, 2013.
[40] D. Neves, H. Thunman, A. Matos, L. Tarelho and A. Gómez-Barea, "Characterization
and prediction of biomass pyrolysis products," Progress in Energy and Combustion Science,
vol. 37, pp. 611-630, 2011.
[41] R. Mari, "Torrefied and carbonized wood, fuel properties and turn of exothermic
reaction," University of Helsinki, Helsinki , 2014.
[42] J. Li, X. Zhang, H. Pawlak-Kruczek, W. Yang, P. Kruczek and W. Blasiak, "Process
simulation of co-firing torrefied biomass in a 220 MWe coal-fired power plant," Energy
Conversion and Management, vol. 84, pp. 503-511, 2014.
[43] M. Niu, Y. Huang, B. Jin and X. Wang, "Simulation of Syngas Production from
Municipal Solid Waste Gasification in a Bubbling Fluidized Bed Using Aspen Plus,"
Industrial and Engineering Chemical Research, vol. 52, p. 14768−14775, 2013.
[44] W. Doherty, . A. Reynolds and D. Kennedy, "The effect of air preheating in a biomass
CFB gasifier using ASPEN Plus simulation," Biomass and Bioenergy, vol. 33, no. 9, p.
1158–1167, 2009.
[45] C. Kunze and H. Spliethoff, "Modelling, comparison and operation experiences of
entrained flow gasifier," Energy Conversion and Management, vol. 52, no. 5, p. 2135–2141,
2011.
[46] I. C. Kemp, Pinch analysis and process integration: A user guide on process
integration for the efficient use of energy, Oxford: Elsevier, 2007.
[47] N. Jacquet, N. Quiévy, C. Vanderghem, S. Janas, C. Blecker, B. Wathelet, J. Devaux
and M. Paquot, "Influence of steam explosion on the thermal stability of
cellulosefibres," Polymer Degradation and Stability, vol. 96, pp. 1582-1588, 2011.
[48] A. K. Biswas, K. Umeki, W. Yang and W. Blasiak, "Change of pyrolysis characteristics
and structure of woody biomass due to steam explosion pretreatment," Fuel Processing
Technology, vol. 92, no. 10, p. 1849–1854, 2011.

80
[49] Z. Sebestyén, . E. Jakab, . Z. May, B. Sipos and . K. Réczey, "Thermal behavior of
native, washed and steam exploded lignocellulosic biomass samples," Journal of
Analytical and Applied Pyrolysis, vol. 101, p. 61–71, 2013.
[50] M. Negro, . P. Manzanares, J. Oliva, I. Ballesteros and M. Ballesteros, "Changes in
various physical/chemical parameters of Pinus pinaster wood after steam explosion
pretreatment," Biomass and Bioenergy, vol. 25, no. 3, pp. 301-308, 2003.
[51] S. Román, J. Nabais, C. Laginhas, B. Ledesma and J. González, "Hydrothermal
carbonization as an effective way of densifying the energy content of biomass," Fuel
Processing Technology, vol. 103, p. 78–83, 2012.
[52] A. Funke, F. Reebs and A. Kruse, "Experimental comparison of hydrothermal and
vapothermal carbonization," Fuel Processing Technology, vol. 115, p. 261–269, 2013.
[53] L.-P. Xiao, Z.-J. Sun, Z.-J. Shi, F. Xu and R.-C. Sun, "Impact of Hot Compressed
Water Pretreatment on the Structural Changes of Woody Biomass for Bioethanol
Production," BioResources, vol. 6, no. 2, pp. 1576-1598, 2011.
[54] J. B. Kristensen, L. G. Thygesen, C. Felby, H. Jørgensen and T. Elder, "Cell-wall
structural changes in wheat straw pretreated for bioethanol production," Biotechnology
for Biofuels, vol. 1, no. 5, 2008.
[55] M. Selig , S. Viamajala , S. Decker , M. Tucker , M. Himmel and T. Vinzant ,
"Deposition of lignin droplets produced during dilute acid pretreatment of maize
stems retards enzymatic hydrolysis of cellulose," Biotechnol Prog, vol. 23, no. 6, pp.
1333-1339, 2007.
[56] V. Yadav , B. Baruah and P. Khare , "Comparative study of thermal properties of bio-
coal from aromatic spent with low rank sub-bituminous coals," Bioresour. Technol., vol.
137, pp. 376-385, 2013.
[57] C. Franco, F. Pinto, I. Gulyurtlu and I. Cabrita, "The study of reactions influencing
the biomass steam gasification process," Fuel, vol. 82, no. 7, pp. 835-842, 2003.
81
[58] T. Hosoya, H. Kawamoto and S. Saka, "Secondary reactions of lignin-derived primary
tar components," Journal of Analytical and Applied Pyrolysis, vol. 83, no. 1, p. 78–87, 2008.
[59] J. Hernández, R. Ballesteros and G. Aranda, "Characterisation of tars from biomass
gasification: Effect of the operating conditions," Energy, vol. 50, p. 333–342, 2013.
[60] N. Worasuwannarak, T. Sonobe and W. Tanthapanichakoon, "Pyrolysis behaviors of
rice straw, rice husk, and corncob by TG-MS technique," Journal of Analytical and
Applied Pyrolysis, vol. 78, no. 2, pp. 265-271, 2007.
[61] C. Brage, Q. Yu and K. Sjöström, "Characteristics of evolution of tar from wood
pyrolysis in a fixed-bed reactor," Fuel, vol. 75, no. 2, p. 213–219, 1996.
[62] A. Ponzio, S. Kalisz and W. Blasiak, "Effect of operating conditions on tar and gas
composition in high temperature air/steam gasification (HTAG) of plastic containing
waste," Fuel processing technology, vol. 87, no. 3, pp. 223-233, 2006.
[63] P. J. Donaj , W. Yang and B. Wlodzimierz, "Conversion of Industrially Processed
Biomass Waste into Value-added Products Using High Temperature Agents," in
Proceedings of the International Conference on Thermal Treatment Technologies and Hazardous
Waste Combustors (ITC/HWC), Jacksonville, 2011.
[64] E. Gustafsson, L. Lin and M. Strand, "Characterization of particulate matter in the
hot product gas from atmospheric fluidized bed biomass gasifiers," Biomass and
Bioenergy, vol. 35, no. Supplement 1, pp. S71-S78, 2011.
[65] A. Saravanakumar, T. Haridasan, T. B. Reed and R. K. Bai, "Experimental
investigation and modelling study of long stick wood gasification in a top lit updraft
fixed bed gasifier," Fuel, vol. 86, no. 17-18, p. 2846–2856, 2007.
[66] N. Rangel, A. Santos and C. Pinho, "Pressure Drop in Packed Shallow Beds of
Cylindrical Cork Stoppers," Trans IChemE, vol. 79, no. Part A, pp. 547-552, 2001.
[67] R. Zou and . A. Yu, "Evaluation of the packing characteristics of mono-sized non-
spherical particles," Powder Technology, vol. 88, no. 1, pp. 71-79, 1996.

82
[68] C. Núñez, M. Cruells and L. García-Soto, "A general shrinking-particle model for the
chemical dissolution of all types of cylinders and discs," Hydrometallurgy, vol. 36, no. 3,
pp. 285-294, 1994.
[69] D. Nemec and J. Levec, "Flow through packed bed reactors: 1. Single-phase flow,"
Chemical Engineering Science, vol. 60, no. 24, p. 6947–6957, 2005.