Embed Size (px)
Citation preview
SOA Predictive Analytics Seminar – Hong Kong 29 Aug. 2018 | Hong Kong
Session 3
Advanced Analytics Applications in Life Insurance
Marc Sofer, FFA FIAA, MBA
1
Advanced Analytics Applications in Life Insurance
MARC SOFER BSc MBA FFA FIAA
Head of Data and Strategic Analytics
Asian Markets
2
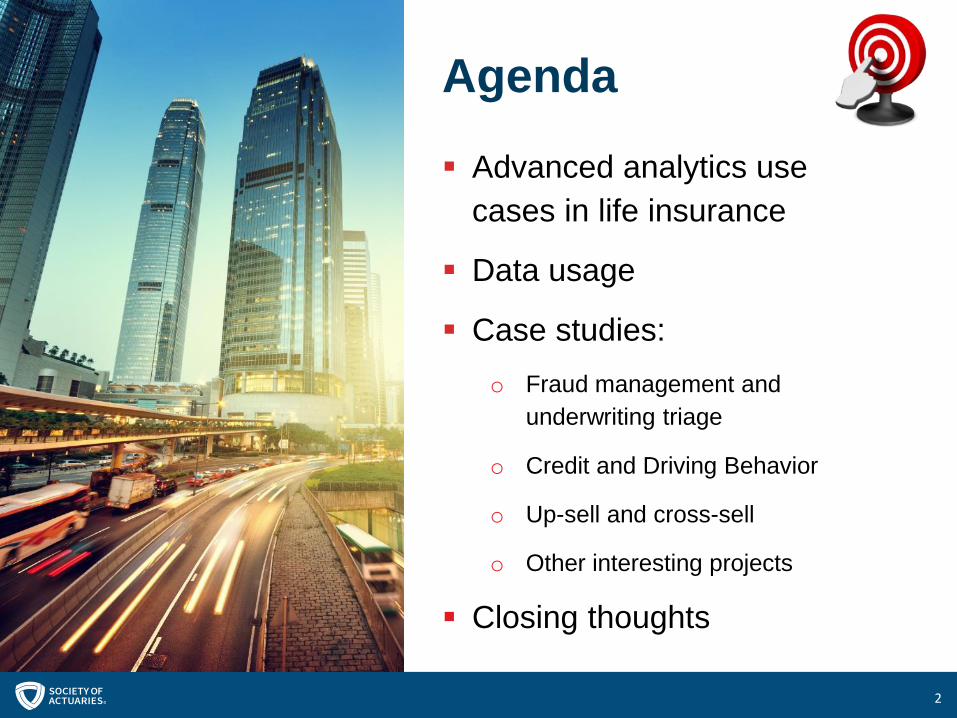
Agenda Advanced analytics use
cases in life insurance
Data usage
Case studies:o Fraud management and
underwriting triage
o Credit and Driving Behavior
o Up-sell and cross-sell
o Other interesting projects
Closing thoughts
3
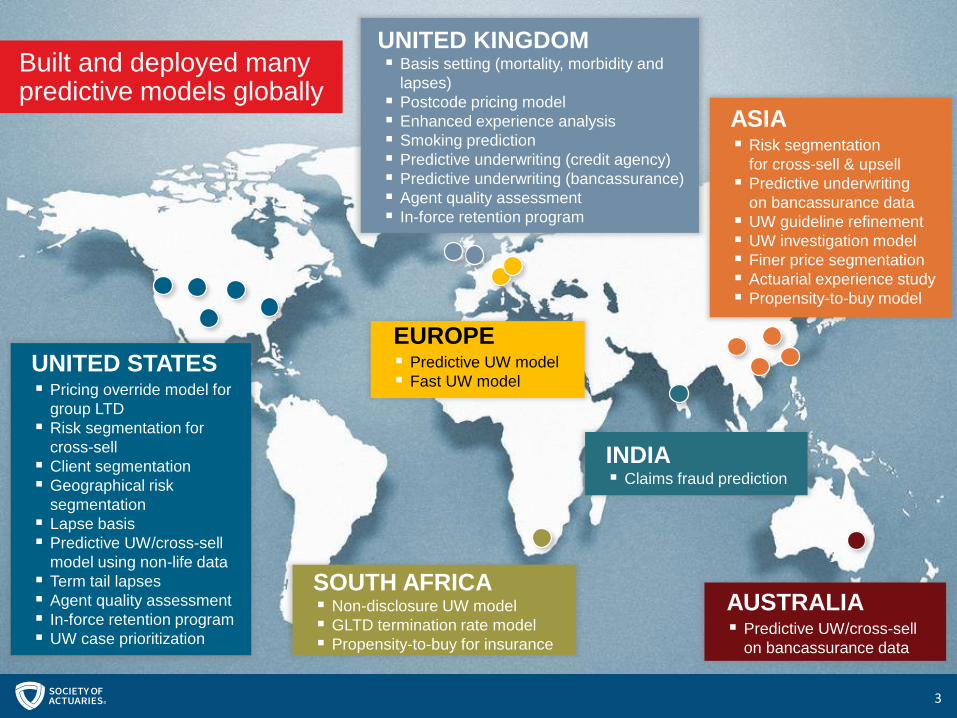
EUROPE Predictive UW model Fast UW model
SOUTH AFRICA Non-disclosure UW model GLTD termination rate model Propensity-to-buy for insurance
AUSTRALIA Predictive UW/cross-sell
on bancassurance data
INDIA Claims fraud prediction
UNITED STATES Pricing override model for
group LTD Risk segmentation for
cross-sell Client segmentation Geographical risk
segmentation Lapse basis Predictive UW/cross-sell
model using non-life data Term tail lapses Agent quality assessment In-force retention program UW case prioritization
UNITED KINGDOM Basis setting (mortality, morbidity and
lapses) Postcode pricing model Enhanced experience analysis Smoking prediction Predictive underwriting (credit agency) Predictive underwriting (bancassurance) Agent quality assessment In-force retention program
ASIA Risk segmentation
for cross-sell & upsell Predictive underwriting
on bancassurance data UW guideline refinement UW investigation model Finer price segmentation Actuarial experience study Propensity-to-buy model
Built and deployed manypredictive models globally
4
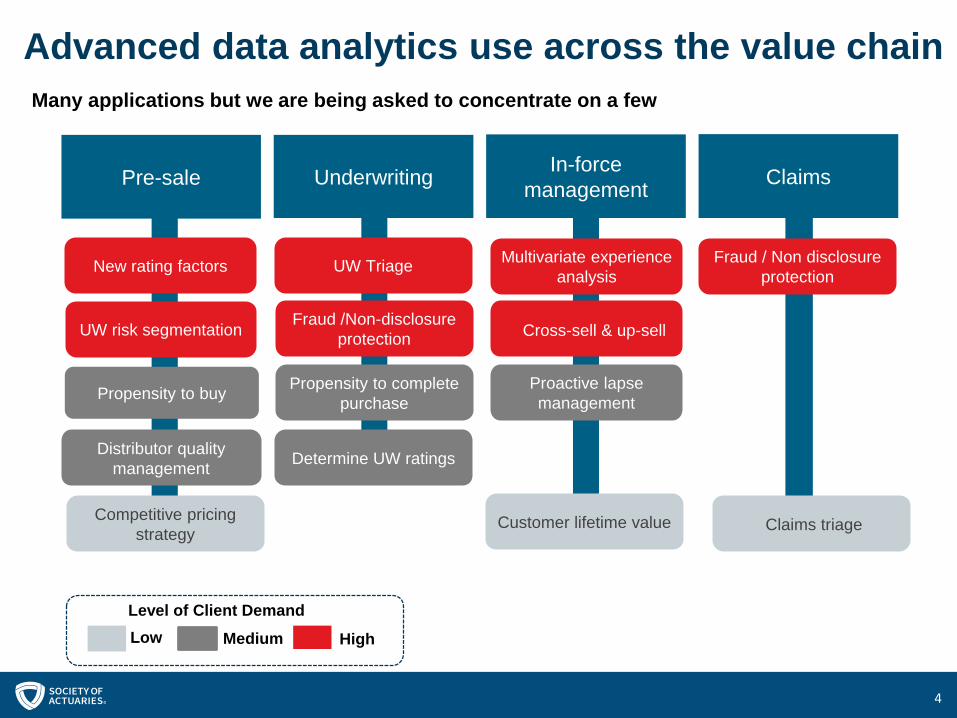
Advanced data analytics use across the value chainMany applications but we are being asked to concentrate on a few
New rating factors
Competitive pricing strategy
Propensity to buy
UW Triage
Propensity to complete purchase
Multivariate experience analysis
Proactive lapse management
Customer lifetime value
Fraud / Non disclosure protection
Claims triage
Pre-sale Underwriting In-force management Claims
Level of Client DemandLow Medium High
UW risk segmentation
Distributor quality management
Fraud /Non-disclosure protection
Determine UW ratings
Cross-sell & up-sell
5
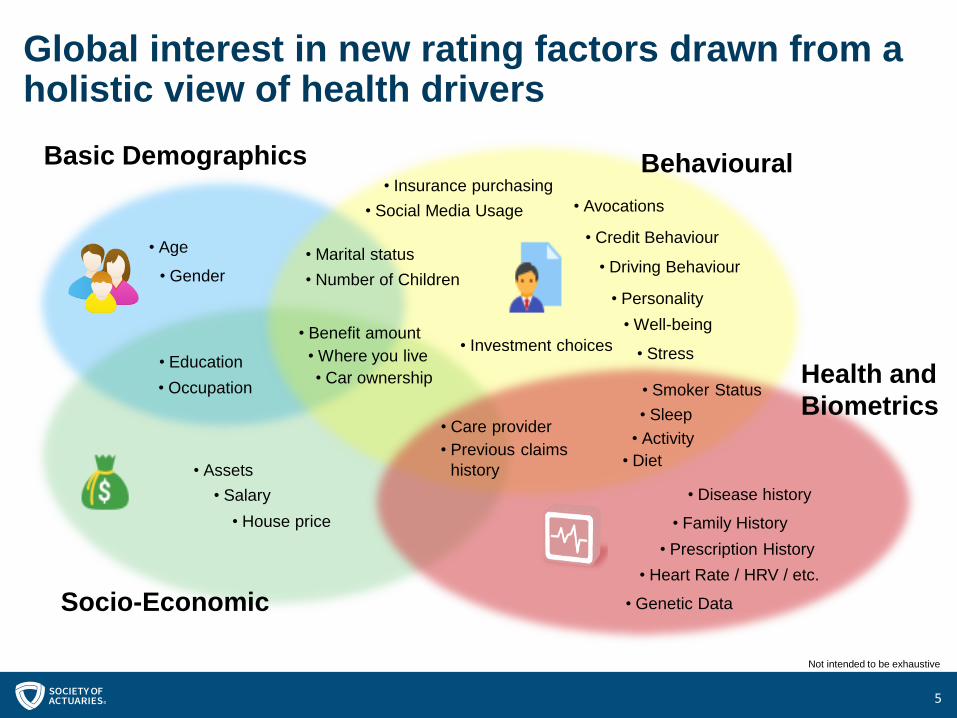
Global interest in new rating factors drawn from a holistic view of health drivers
Socio-Economic
Health and Biometrics
BehaviouralBasic Demographics
• Age • Marital status• Number of Children• Gender
• Smoker Status• Occupation
• Salary• House price
• Disease history
• Family History• Prescription History
• Heart Rate / HRV / etc.
• Genetic Data
• Education
• Benefit amount• Where you live• Car ownership
• Assets
• Social Media Usage• Insurance purchasing
• Investment choices
• Care provider• Sleep
• Activity• Diet• Previous claims
history
• Credit Behaviour
• Driving Behaviour
• Avocations
• Well-being
• Stress
• Personality
Not intended to be exhaustive
6
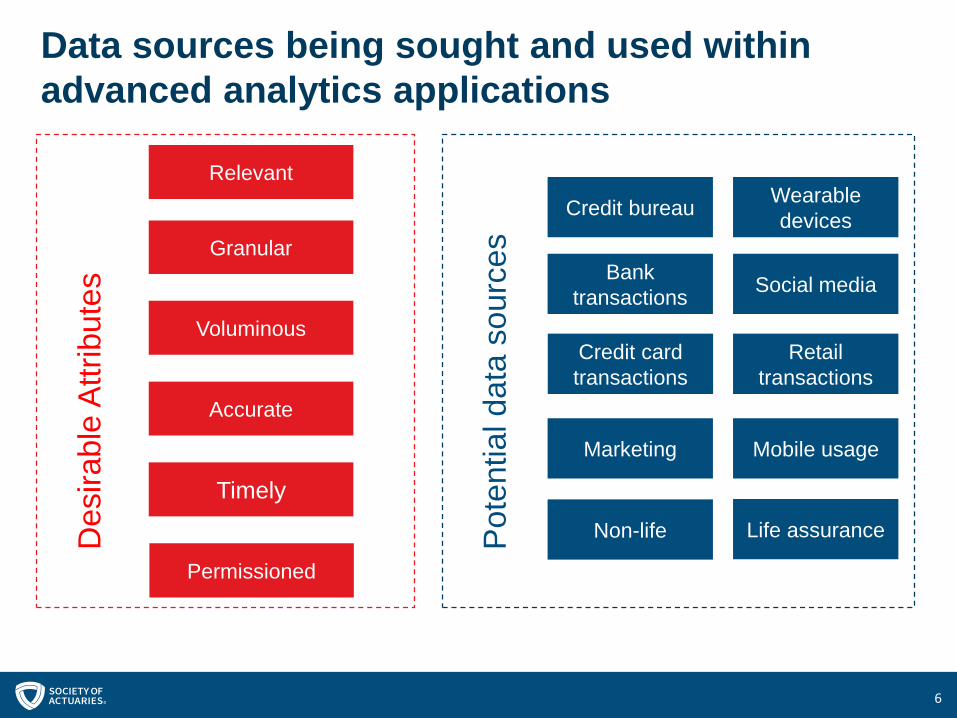
Data sources being sought and used within advanced analytics applications
Granular
Relevant
Timely
Voluminous
Accurate
Permissioned
Des
irabl
e At
tribu
tes
Pote
ntia
l dat
a so
urce
sLife assuranceNon-life
Marketing
Credit card transactions
Bank transactions
Credit bureau
Retail transactions
Social media
Mobile usage
Wearable devices
77
Case Studies:
Fraud Management and Underwriting Triage
8
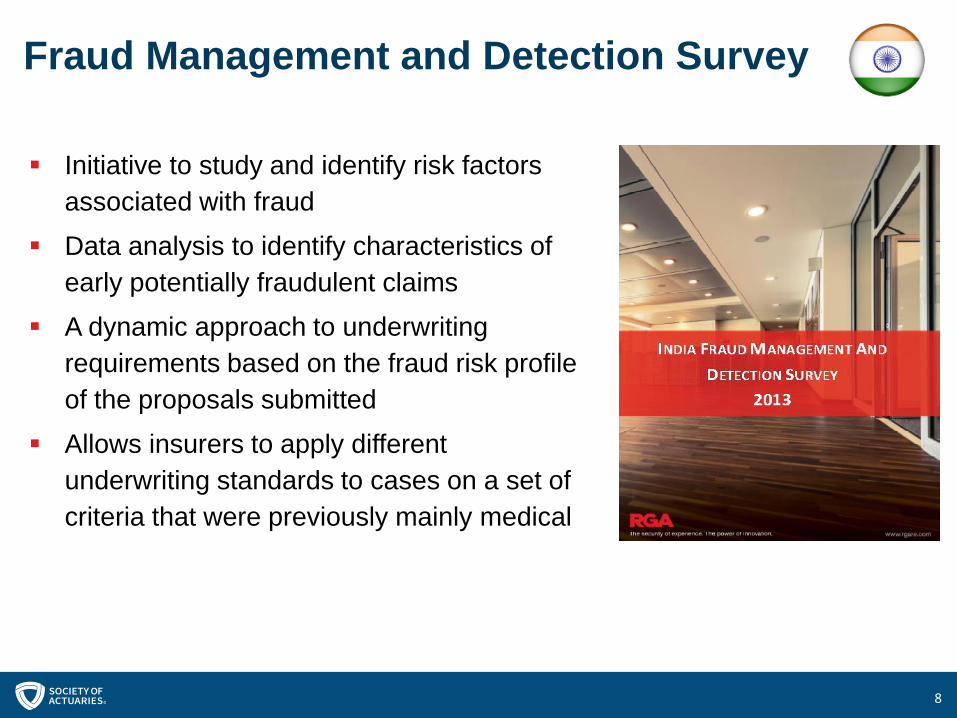
Fraud Management and Detection Survey
Initiative to study and identify risk factors associated with fraud
Data analysis to identify characteristics of early potentially fraudulent claims
A dynamic approach to underwriting requirements based on the fraud risk profile of the proposals submitted
Allows insurers to apply different underwriting standards to cases on a set of criteria that were previously mainly medical
9
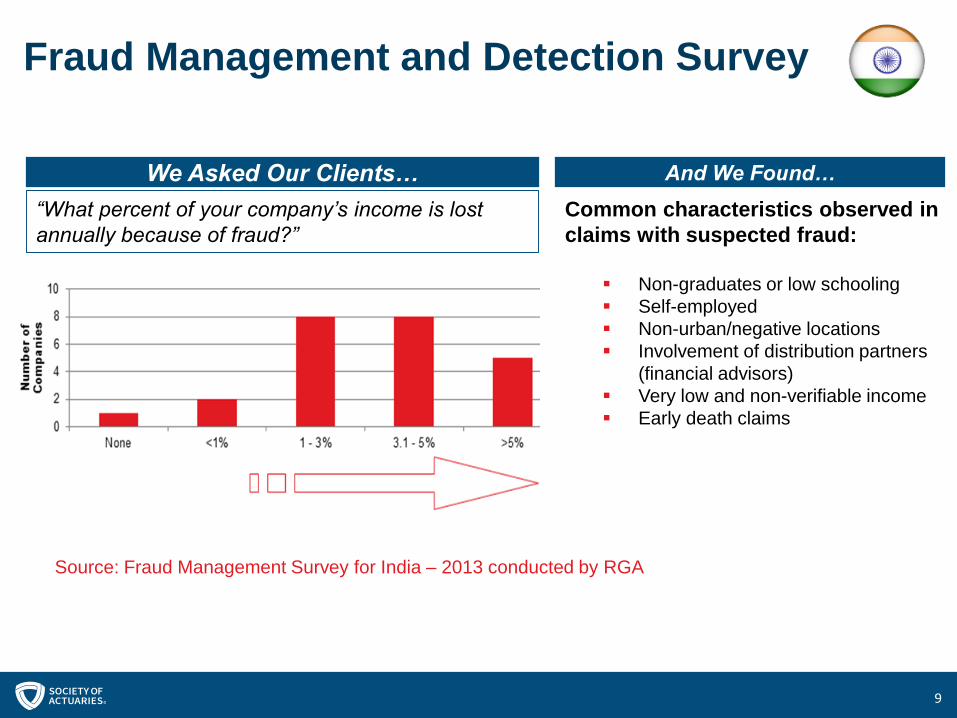
Source: Fraud Management Survey for India – 2013 conducted by RGA
“What percent of your company’s income is lost
annually because of fraud?”
Common characteristics observed in claims with suspected fraud:
Non-graduates or low schooling Self-employed Non-urban/negative locations Involvement of distribution partners
(financial advisors) Very low and non-verifiable income Early death claims
We Asked Our Clients… And We Found…
Fraud Management and Detection Survey
10
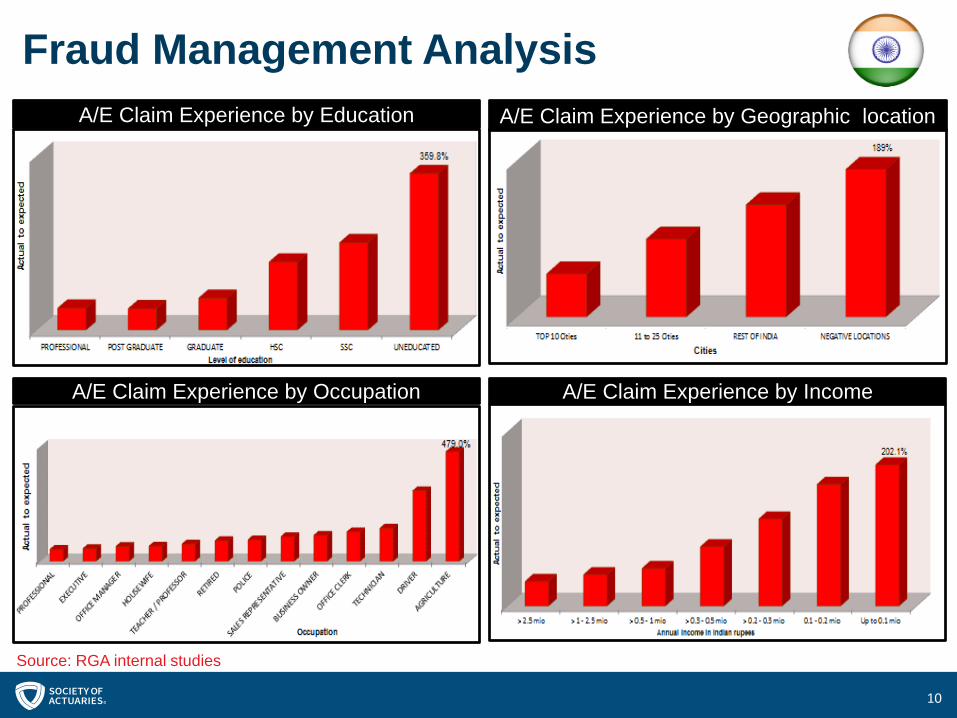
Fraud Management Analysis
A/E Claim Experience by IncomeA/E Claim Experience by Occupation
A/E Claim Experience by Education A/E Claim Experience by Geographic location
Source: RGA internal studies

1111
Case Studies:
Credit and Driving Behaviour
12
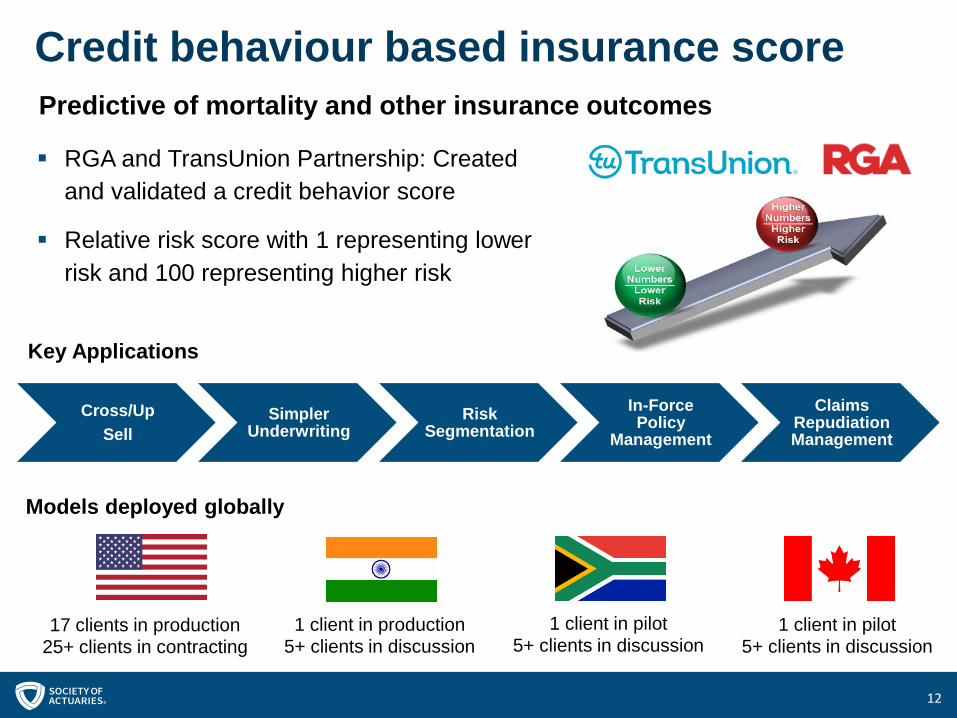
Credit behaviour based insurance scorePredictive of mortality and other insurance outcomes
RGA and TransUnion Partnership: Created and validated a credit behavior score
Relative risk score with 1 representing lower risk and 100 representing higher risk
Cross/UpSell
Simpler Underwriting
Risk Segmentation
In-Force Policy
Management
Claims Repudiation Management
Models deployed globally
Key Applications
17 clients in production25+ clients in contracting
1 client in production5+ clients in discussion
1 client in pilot5+ clients in discussion
1 client in pilot5+ clients in discussion
13
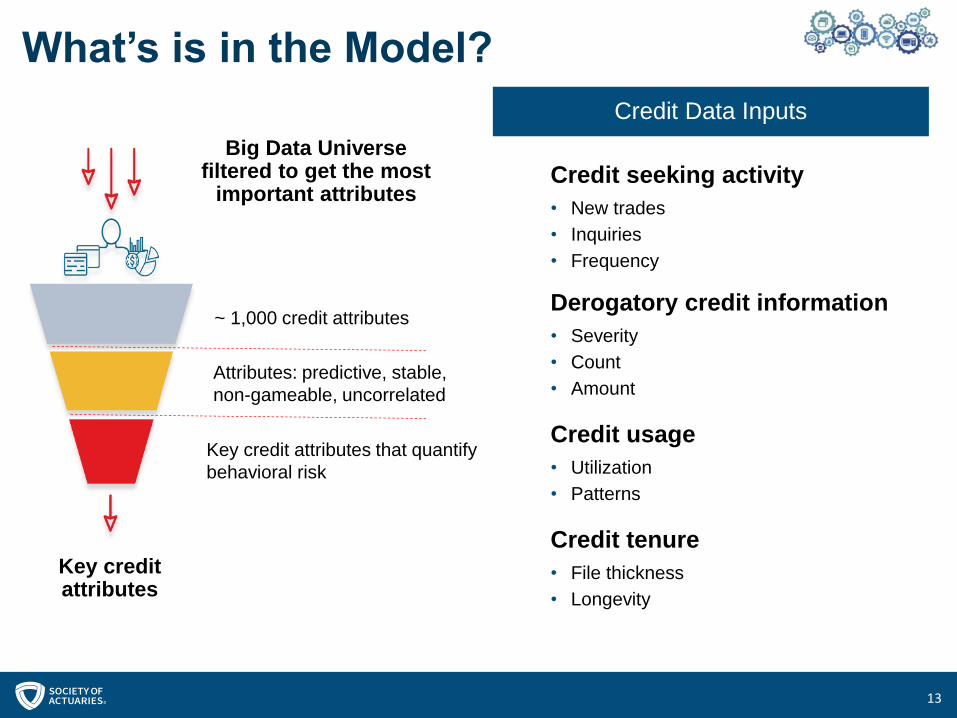
What’s is in the Model?
Big Data Universe filtered to get the most
important attributes
Key credit attributes
Attributes: predictive, stable, non-gameable, uncorrelated
Key credit attributes that quantify behavioral risk
~ 1,000 credit attributes
Credit seeking activity• New trades• Inquiries• Frequency
Derogatory credit information• Severity• Count• Amount
Credit usage• Utilization• Patterns
Credit tenure• File thickness• Longevity
Credit Data Inputs
14
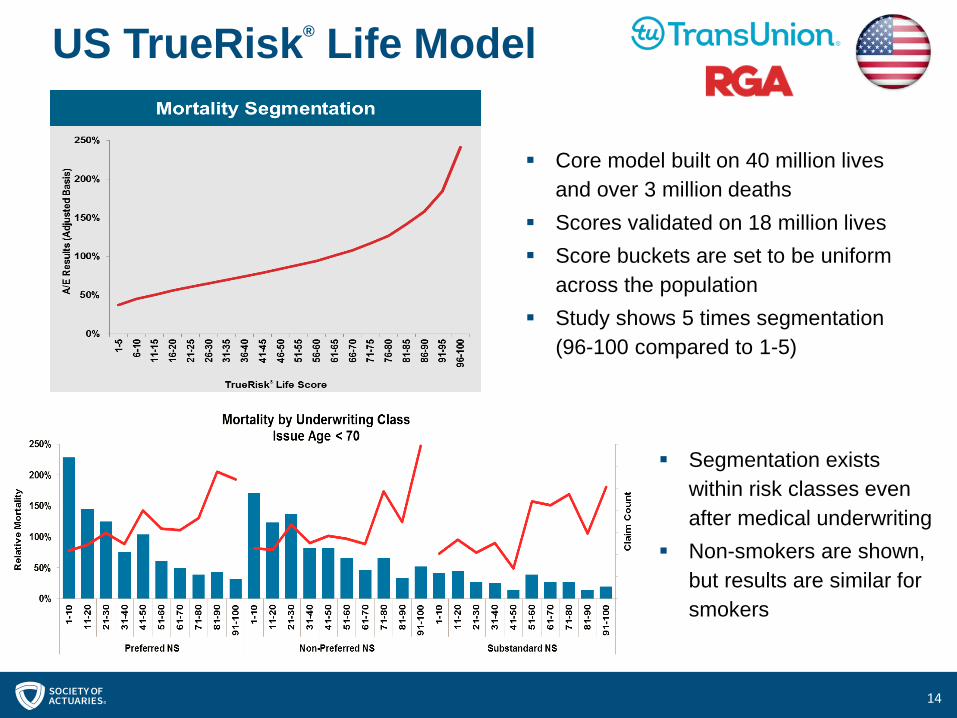
US TrueRisk® Life Model
Segmentation exists within risk classes even after medical underwriting
Non-smokers are shown, but results are similar for smokers
Core model built on 40 million lives and over 3 million deaths
Scores validated on 18 million lives Score buckets are set to be uniform
across the population Study shows 5 times segmentation
(96-100 compared to 1-5)
15
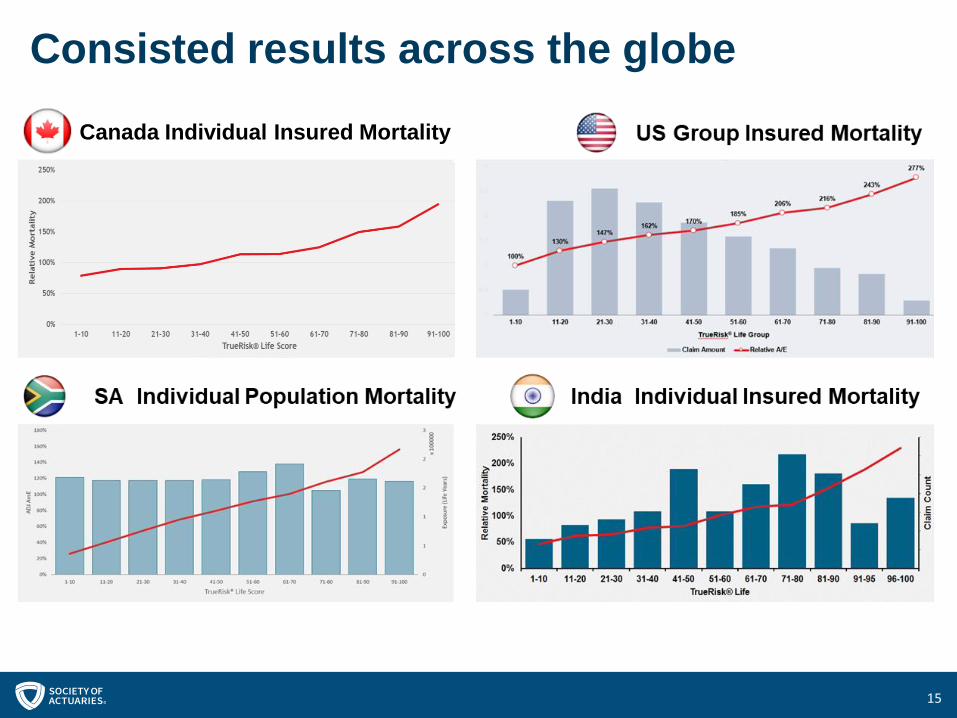
Consisted results across the globeCanada Individual Insured Mortality
16
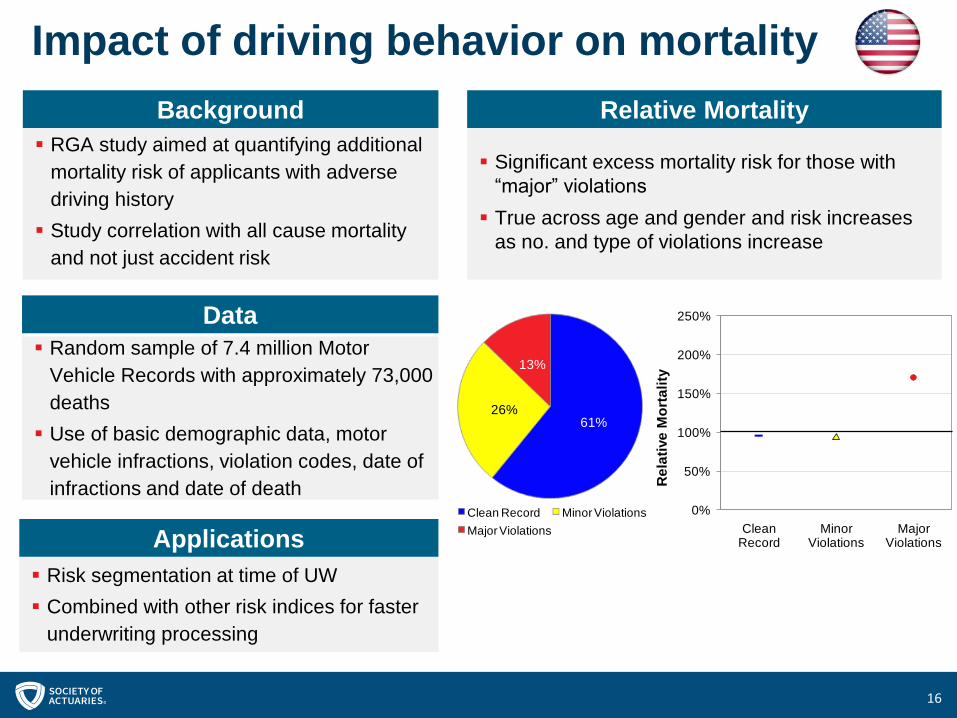
Impact of driving behavior on mortality
RGA study aimed at quantifying additional mortality risk of applicants with adverse driving history
Study correlation with all cause mortality and not just accident risk
Background
Random sample of 7.4 million Motor Vehicle Records with approximately 73,000 deaths
Use of basic demographic data, motor vehicle infractions, violation codes, date of infractions and date of death
Data
Significant excess mortality risk for those with “major” violations
True across age and gender and risk increases as no. and type of violations increase
Relative Mortality
Risk segmentation at time of UW Combined with other risk indices for faster
underwriting processing
Applications
0%
50%
100%
150%
200%
250%
CleanRecord
MinorViolations
MajorViolations
Rela
tive
Mor
talit
y
61%26%
13%
Clean Record Minor ViolationsMajor Violations
0%
50%
100%
150%
200%
250%
CleanRecord
MinorViolations
MajorViolations
Rela
tive
Mor
talit
y
61%26%
13%
Clean Record Minor ViolationsMajor Violations
1717
Case Studies:
Up-sell and cross-sell
18
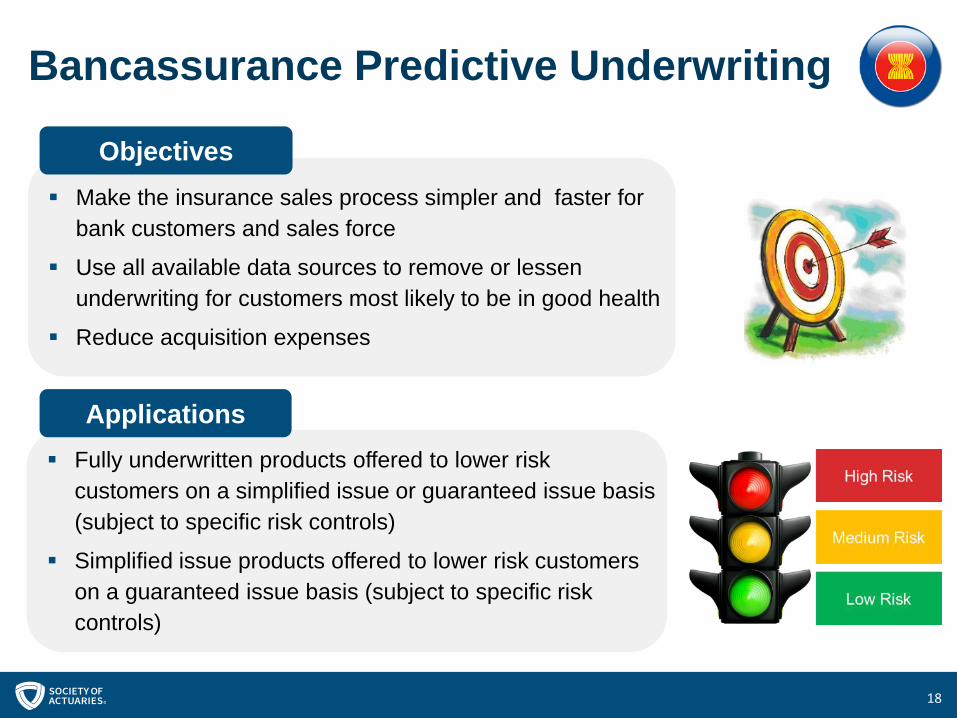
Bancassurance Predictive Underwriting
Make the insurance sales process simpler and faster for bank customers and sales force
Use all available data sources to remove or lessen underwriting for customers most likely to be in good health
Reduce acquisition expenses
Fully underwritten products offered to lower risk customers on a simplified issue or guaranteed issue basis (subject to specific risk controls)
Simplified issue products offered to lower risk customers on a guaranteed issue basis (subject to specific risk controls)
Objectives
Applications
19
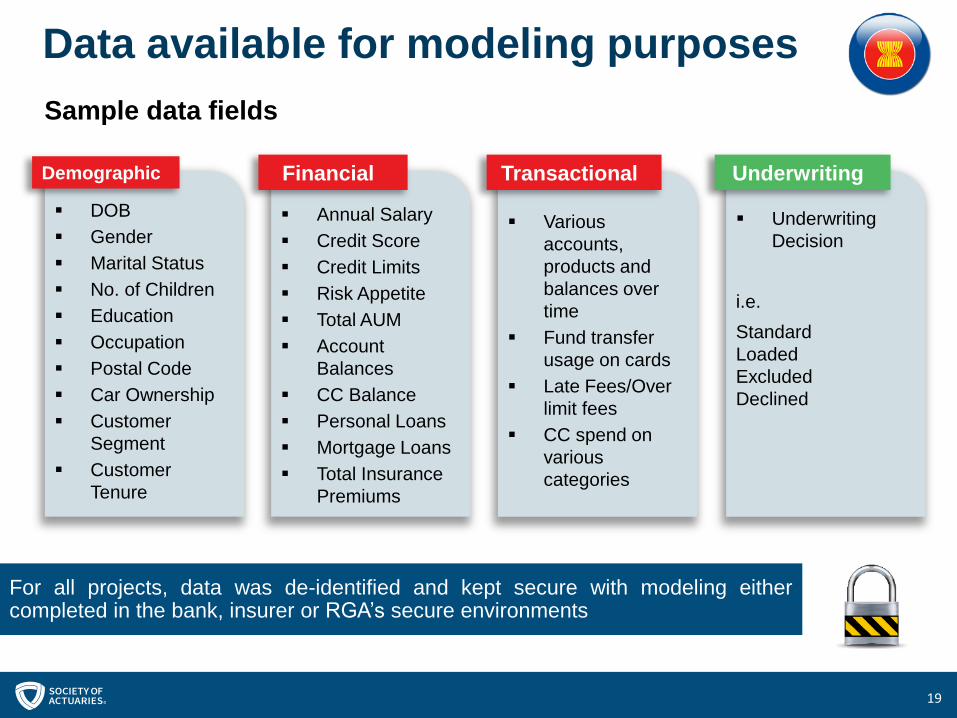
Data available for modeling purposes
DOB Gender Marital Status No. of Children Education Occupation Postal Code Car Ownership Customer
Segment Customer
Tenure
Demographic
Annual Salary Credit Score Credit Limits Risk Appetite Total AUM Account
Balances CC Balance Personal Loans Mortgage Loans Total Insurance
Premiums
Financial
Various accounts, products and balances over time
Fund transfer usage on cards
Late Fees/Over limit fees
CC spend on various categories
Transactional
Underwriting Decision
i.e. Standard LoadedExcludedDeclined
Underwriting
For all projects, data was de-identified and kept secure with modeling eithercompleted in the bank, insurer or RGA’s secure environments
Sample data fields
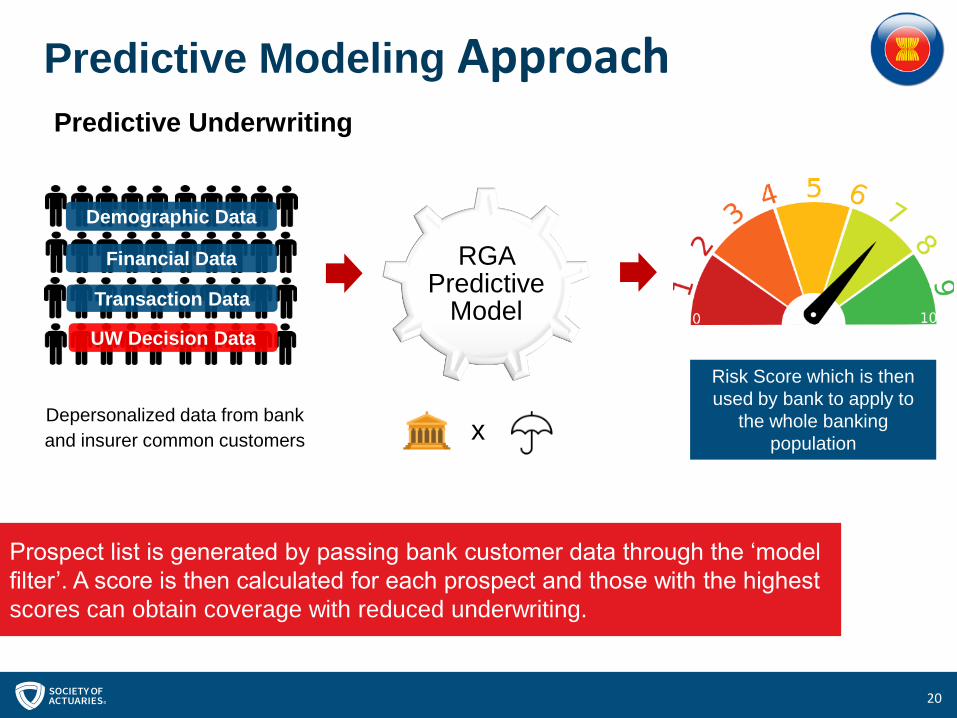
20
RGA Predictive
Model
Risk Score which is then used by bank to apply to
the whole banking population
Predictive Underwriting
Demographic Data
Financial Data
Transaction Data
UW Decision Data
Depersonalized data from bank and insurer common customers x
Prospect list is generated by passing bank customer data through the ‘model
filter’. A score is then calculated for each prospect and those with the highest
scores can obtain coverage with reduced underwriting.
Predictive Modeling Approach
21
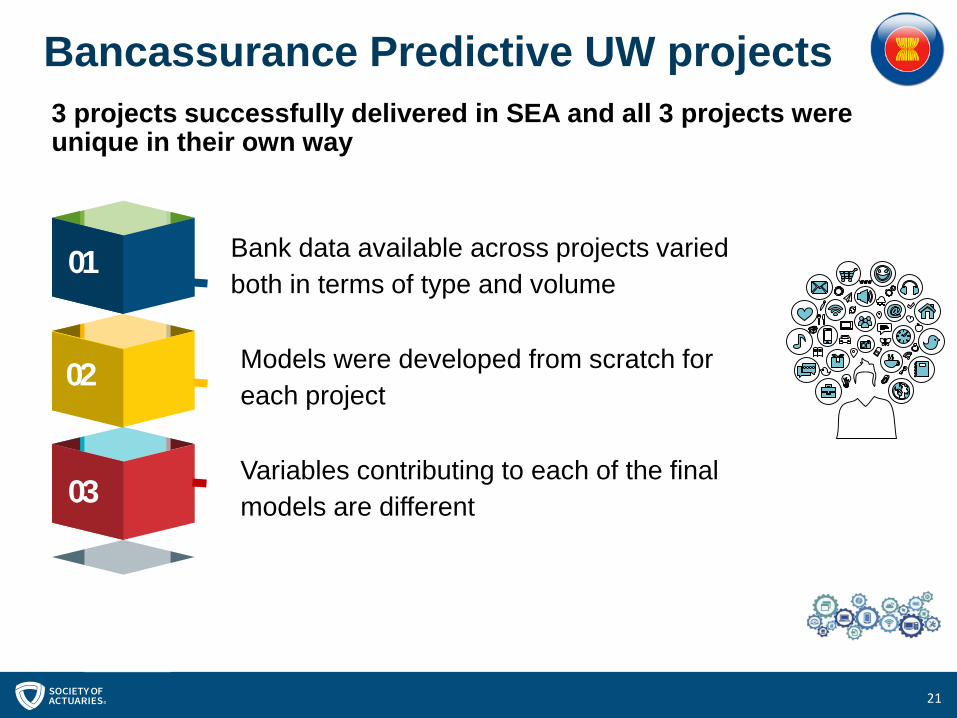
Bancassurance Predictive UW projects3 projects successfully delivered in SEA and all 3 projects were unique in their own way
01
03
02
Bank data available across projects varied both in terms of type and volume
Models were developed from scratch for each project
Variables contributing to each of the final models are different
22
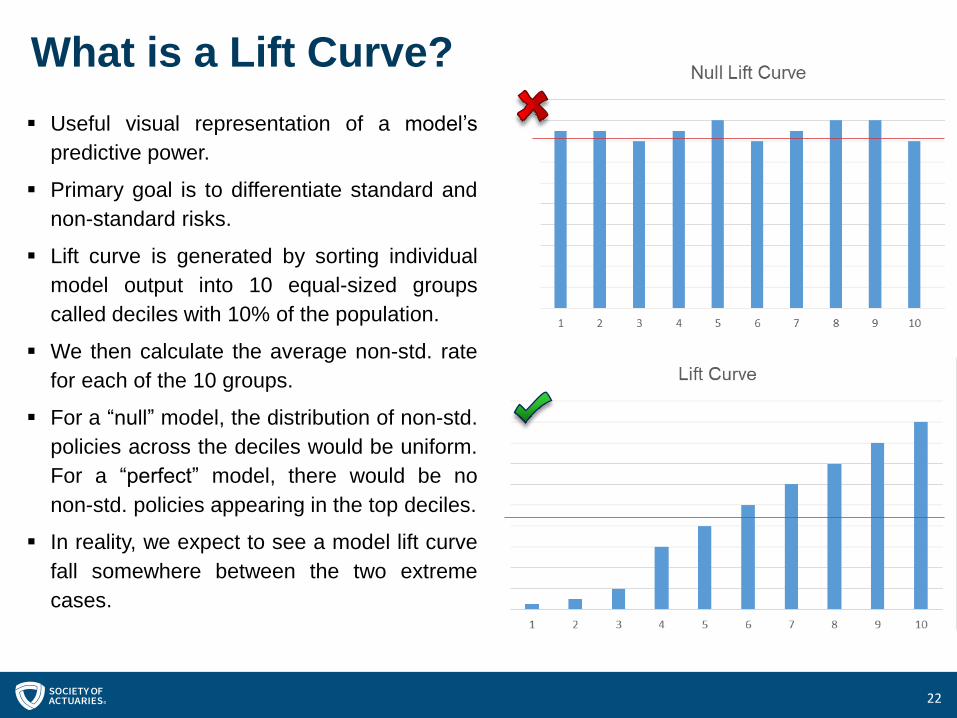
What is a Lift Curve? Useful visual representation of a model’s
predictive power.
Primary goal is to differentiate standard andnon-standard risks.
Lift curve is generated by sorting individualmodel output into 10 equal-sized groupscalled deciles with 10% of the population.
We then calculate the average non-std. ratefor each of the 10 groups.
For a “null” model, the distribution of non-std.policies across the deciles would be uniform.For a “perfect” model, there would be nonon-std. policies appearing in the top deciles.
In reality, we expect to see a model lift curvefall somewhere between the two extremecases.
23
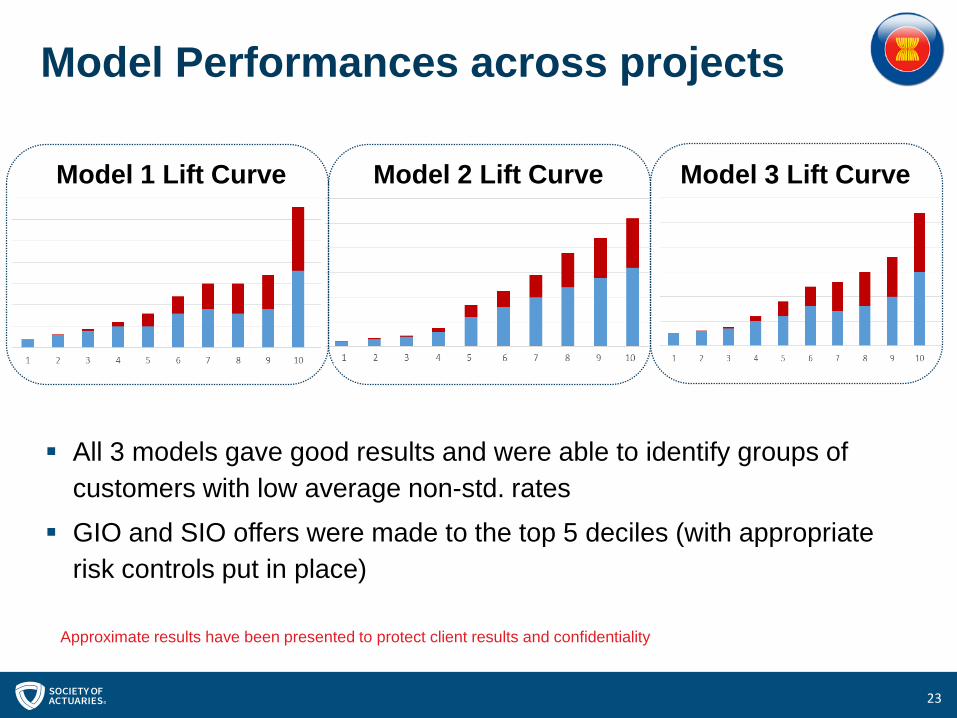
Model Performances across projects
All 3 models gave good results and were able to identify groups of customers with low average non-std. rates
GIO and SIO offers were made to the top 5 deciles (with appropriate risk controls put in place)
Model 1 Lift Curve Model 2 Lift Curve Model 3 Lift Curve
Approximate results have been presented to protect client results and confidentiality
24
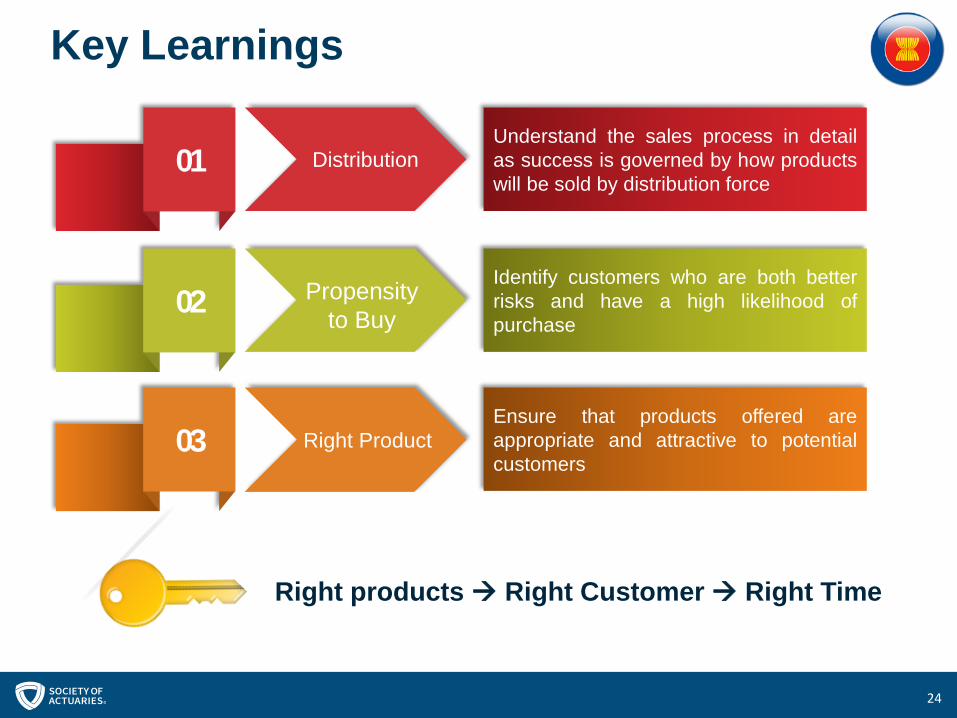
Key Learnings
Understand the sales process in detailas success is governed by how productswill be sold by distribution force
01 Distribution
Identify customers who are both betterrisks and have a high likelihood ofpurchase
02 Propensity to Buy
Ensure that products offered areappropriate and attractive to potentialcustomers
03 Right Product
Right products Right Customer Right Time
25
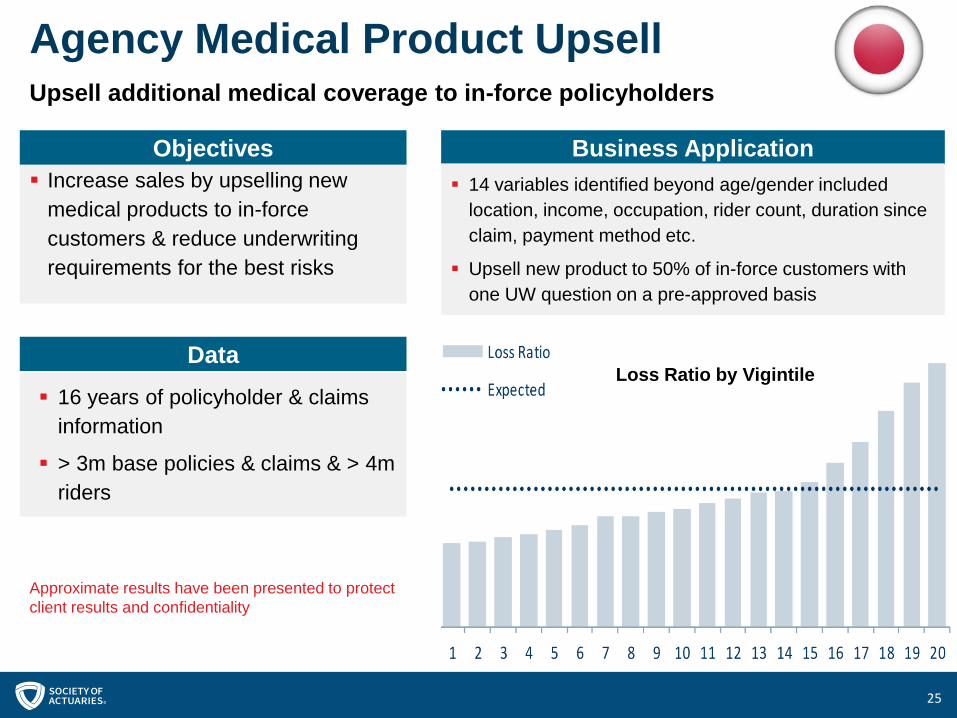
Agency Medical Product UpsellUpsell additional medical coverage to in-force policyholders
Increase sales by upselling new medical products to in-force customers & reduce underwriting requirements for the best risks
Objectives
16 years of policyholder & claims information
> 3m base policies & claims & > 4m riders
Data
Business Application 14 variables identified beyond age/gender included
location, income, occupation, rider count, duration since claim, payment method etc.
Upsell new product to 50% of in-force customers with one UW question on a pre-approved basis
Loss Ratio by Vigintile
Approximate results have been presented to protect client results and confidentiality
26
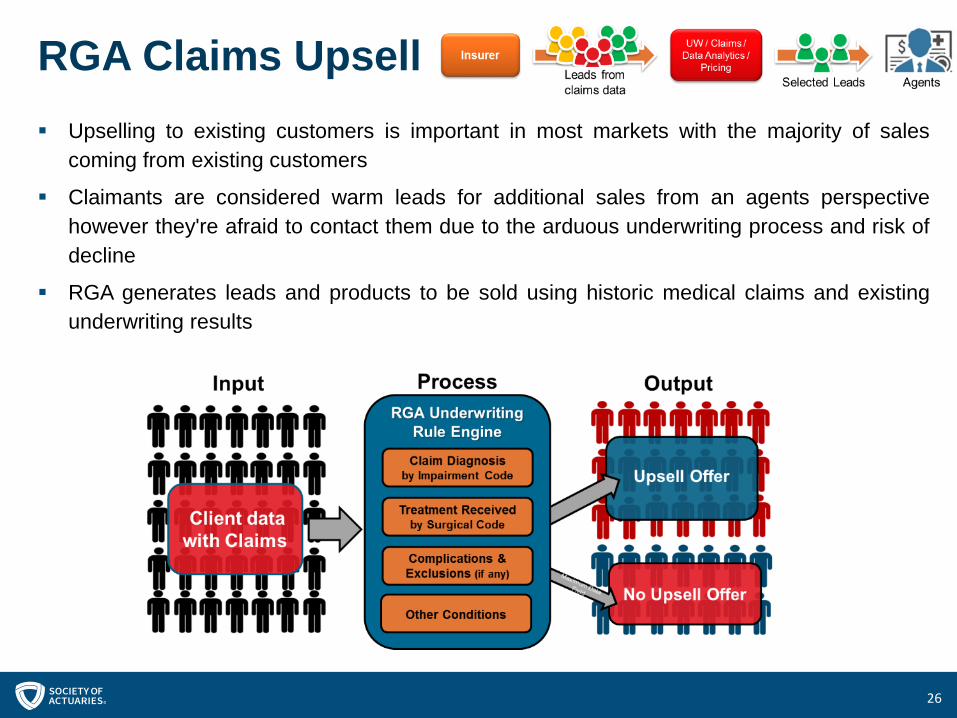
RGA Claims Upsell Upselling to existing customers is important in most markets with the majority of sales
coming from existing customers
Claimants are considered warm leads for additional sales from an agents perspectivehowever they're afraid to contact them due to the arduous underwriting process and risk ofdecline
RGA generates leads and products to be sold using historic medical claims and existingunderwriting results
27
Case Studies:
Other interesting projects
28
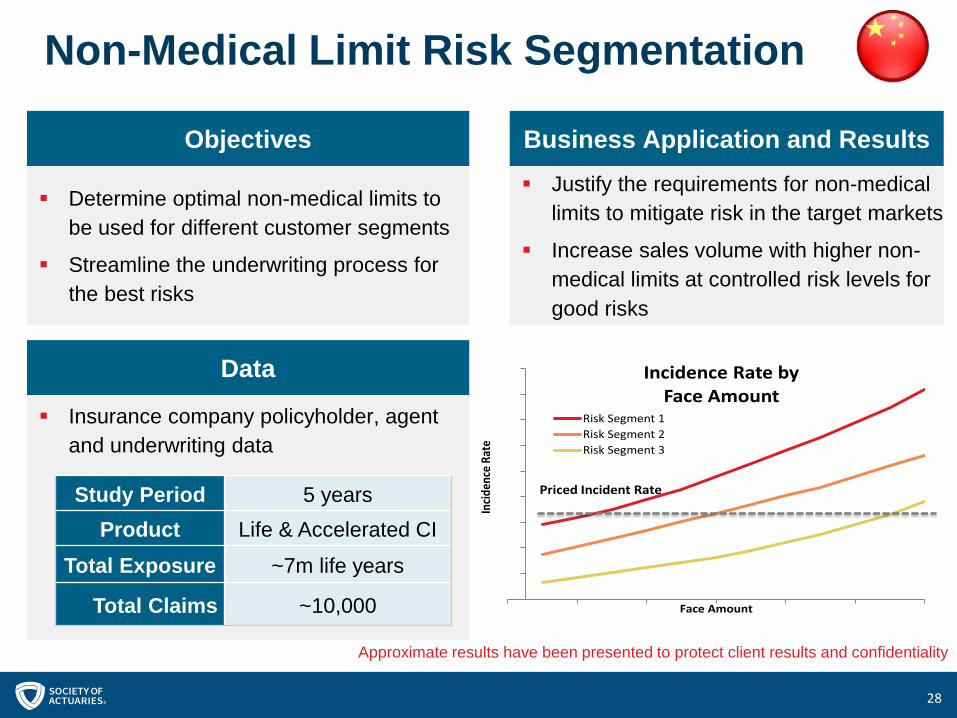
Non-Medical Limit Risk Segmentation
Determine optimal non-medical limits to be used for different customer segments
Streamline the underwriting process for the best risks
Insurance company policyholder, agent and underwriting data
Justify the requirements for non-medical limits to mitigate risk in the target markets
Increase sales volume with higher non-medical limits at controlled risk levels for good risks
Study Period 5 yearsProduct Life & Accelerated CI
Total Exposure ~7m life years
Total Claims ~10,000
Inci
denc
e R
ate
Face Amount
Incidence Rate by Face Amount
Risk Segment 1
Risk Segment 2
Risk Segment 3
Priced Incident Rate
Data
Objectives Business Application and Results
Approximate results have been presented to protect client results and confidentiality
29
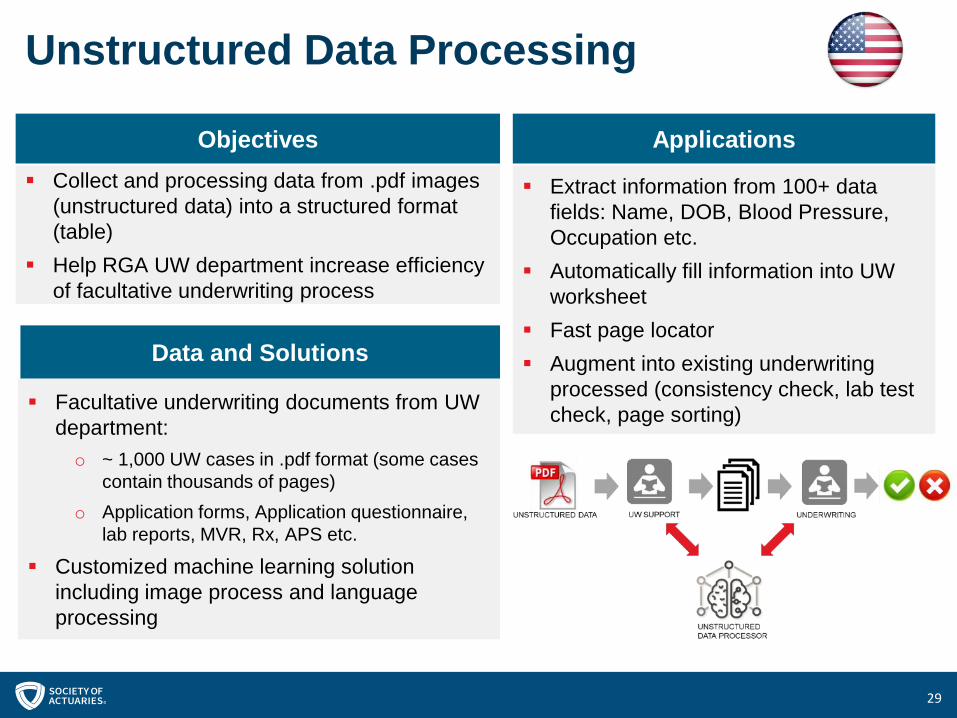
Unstructured Data Processing
Collect and processing data from .pdf images (unstructured data) into a structured format (table)
Help RGA UW department increase efficiency of facultative underwriting process
Objectives
Facultative underwriting documents from UW department:o ~ 1,000 UW cases in .pdf format (some cases
contain thousands of pages)o Application forms, Application questionnaire,
lab reports, MVR, Rx, APS etc.
Customized machine learning solution including image process and language processing
Data and Solutions
Extract information from 100+ data fields: Name, DOB, Blood Pressure, Occupation etc.
Automatically fill information into UW worksheet
Fast page locator Augment into existing underwriting
processed (consistency check, lab test check, page sorting)
Applications

3030
Final Thoughts
31
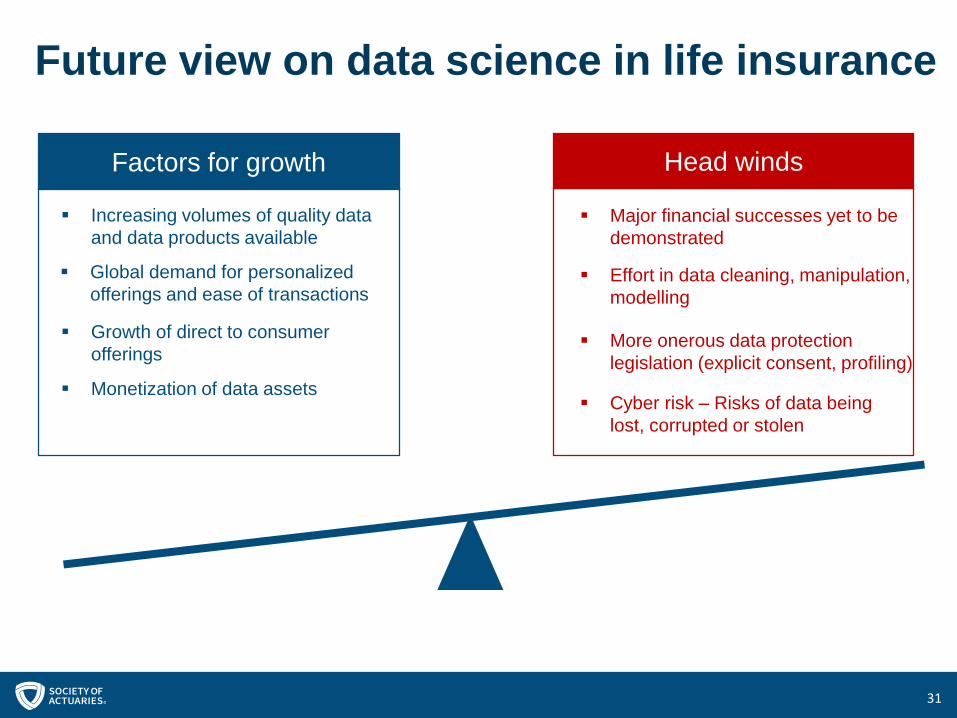
Future view on data science in life insurance
Monetization of data assets
Increasing volumes of quality data and data products available
Growth of direct to consumer offerings
Global demand for personalized offerings and ease of transactions
Major financial successes yet to be demonstrated
Effort in data cleaning, manipulation, modelling
More onerous data protection legislation (explicit consent, profiling)
Cyber risk – Risks of data being lost, corrupted or stolen
Factors for growth Head winds

32
Questions?

33